Article

Research on Blank Optimization Design Based on Low-Carbon and Low-Cost Blank Process Route Optimization Model

1
School of Computer and Information, Qiannan Normal University for Nationalities, Duyun 558000, China
2
Key Laboratory of Automotive Power Train and Electronics, Hubei University of Automotive Technology, Shiyan 442002, China
3
Academy of Green Manufacturing Engineering, Wuhan University of Science and Technology, Wuhan 430081, China
4
School of Management, China West Normal University, Nanchong 637002, China
5
Institute of Mechanical and Manufacturing Engineering, School of Engineering, Cardiff University, Cardiff CF24 3AA, UK
*
Authors to whom correspondence should be addressed.
Sustainability 2021, 13(4), 1929; https://0-doi-org.brum.beds.ac.uk/10.3390/su13041929
Submission received: 14 December 2020 / Revised: 2 February 2021 / Accepted: 5 February 2021 / Published: 11 February 2021

Abstract

:
The optimization of blank design is the key to the implementation of a green innovation strategy. The process of blank design determines more than 80% of resource consumption and environmental emissions during the blank processing. Unfortunately, the traditional blank design method based on function and quality is not suitable for today’s sustainable development concept. In order to solve this problem, a research method of blank design optimization based on a low-carbon and low-cost process route optimization is proposed. Aiming at the processing characteristics of complex box type blank parts, the concept of the workstep element is proposed to represent the characteristics of machining parts, a low-carbon and low-cost multi-objective optimization model is established, and relevant constraints are set up. In addition, an intelligent generation algorithm of a working step chain is proposed, and combined with a particle swarm optimization algorithm to solve the optimization model. Finally, the feasibility and practicability of the method are verified by taking the processing of the blank of an emulsion box as an example. The data comparison shows that the comprehensive performance of the low-carbon and low-cost multi-objective optimization is the best, which meets the requirements of low-carbon processing, low-cost, and sustainable production.

1. Introduction

With the rapid development of the national economy, the manufacturing industry consumes a lot of resources and causes serious pollution to the environment [1,2]. Blanks are the basis of machining in the manufacturing industry, which is mainly composed of two parts, one part refers to the raw materials that have not been processed, the other refers to the part before the finished product is completed. In the manufacturing industry, the traditional blank production process consumes a lot of energy and causes serious environmental pollution [3]. Therefore, the traditional blank design method does not conform to the concept of sustainable development. The design process of the blank determines more than 80% of the resource consumption and environmental emissions during the blank processing [4,5]. Therefore, the optimization of the blank design should be based on the optimization of the process route of the blank processing [6]. At present, the Chinese manufacturing industry mainly depends on the high input of energy and resources at the expense of the environment. With the further development of the economy and society, the above-mentioned development mode leads to the increasingly serious contradiction between humans and thel environment, which significantly affects the sustainable development of the Chinese economy. There is an urgent need to reduce environmental pollution. Low-carbon manufacturing emphasizes the reduction and control of carbon emissions from the whole process of raw materials and energy acquisition, product design, use, dismantling, and recycling [7], which is one of the main ways to solve environmental problems. In the blank machining process, implementing low-carbon manufacturing is one of the essential ways to optimize the low-carbon manufacturing process. The process route dominates the whole process from blank to parts and has a significant impact on environmental and economic indicators [8].
CNC machine tools are the basic processing equipment in the manufacturing process. CNC machine tools require a large amount of energy consumption and generate carbon dioxide emissions. It is of great significance to select reasonable processing parameters to ensure product quality, extend tool life, and reduce production costs [9]. However, in the actual machining process, the three goals of reducing production cost, reducing carbon emissions, and improving production efficiency are usually contradictory. Therefore, it is necessary to provide various optimal target combinations through reasonable optimization decision-making methods, so decision-makers can make choices according to their situations to achieve demand balance. The process route specifies the entire processing process of turning blanks into product parts, which significantly affects the enterprise’s processing efficiency, environmental impact, processing quality, and processing cost of product parts [10].

2. Literature Review

2.1. The Application of a Low-Carbon Emission Model

Research on the construction of a corresponding decision model based on low-carbon emissions has attracted wide attention all over the world. Stefano et al. [11] established a low-carbon urban and rural ecosystem planning optimization framework through the construction of a low-carbon model and used an example to verify the carbon emission factors in Italy. Avinash et al. [12] established the relationship model between energy consumption and low-carbon emissions and proposed a method of reducing energy carbon emissions. Nora et al. [13] aimed at the problem of carbon emissions in the cement industry and proposed a decision-making model to balance carbon emissions in the cement supply chain, which aimed to provide an effective trade-off strategy between economic indicators and carbon emissions. Gaurav et al. [14] aimed at the serious problem of the carbon emissions of traditional combustion energy and studied sustainable technology and fuel with a smaller carbon footprint, putting forward the life cycle assessment of the eco-friendly sintering method. Yoshiyuki et al. [15] proposed a process method based on life cycle carbon circulation and low-carbon consumption. The method is based on a low-carbon emission model and uses an intelligent algorithm. Song et al. [16] combined the whole life cycle to estimate greenhouse gas emissions, establishing a BOM structure to form a G-BOM estimated greenhouse gas emission product. Xiu et al. [17] proposed a new method for identifying high greenhouse gas emission link units. Through life cycle analysis, the greenhouse gas emission flow was studied. Xu et al. [18] proposed a new low-carbon innovation design strategy model. This method used the analysis network process to evaluate each design element.

2.2. The Solutions of Carbon Emission Reduction

Creating and seeking optimization algorithms with higher accuracy and faster solution speed is crucial to solving the optimal solutions of models. The earliest researchers in this field were scholars Rad-Tolouei et al. [19] and Eskicioglu et al. [20], who applied the graphic method, Lagrangian multiplication, and geometric programming method to analyze processing parameter optimization. However, due to the limitation of computing power, the implementation of these algorithms was mostly at the theoretical level, and the calculation results ended in failure. Since the 21st century, with the development of computer technology and the emergence and improvement of intelligent algorithms, the optimization calculation and solution of carbon emissions model has been well solved and developed. Zainal et al. [21] analyzed the firefly swarm optimization (GSO) algorithm and applied the GSO algorithm to solve the carbon emission optimization model for the first time. Zarei et al. [22] studied the optimization problem of milling parameters under multi-stroke, established an optimization model, and proposed a harmonious search algorithm to deal with the optimization problem. The milling parameters mainly included cutting depth, speed, feed, and the relevant constraints were quantified, such as allowable speed and feed, etc. Esmaeil et al. [23] proposed an improved particle swarm optimization algorithm, which changed the search space of parameters according to the parameter value of each particle. The method has proven to be a new intelligent algorithm, which can monitor carbon emission in real-time. Xiao et al. [24] firstly proposed a combinatorial optimization algorithm that combines an improved genetic algorithm (GA) with an intelligent generation algorithm. This method can effectively perform initial screening and re-screening of the optimal solution set to ensure that the solution set has high-precision and effectiveness.

2.3. Research Gaps

Based on the above-mentioned literature, from the perspective of blank process design, research on environmental indicators while considering economic indicators has not attracted widespread attention. Under the severe situation of resource shortage, it is of great significance to study environmental indicators and economic indicators in depth. However, in the machining process, balancing the two objectives is usually contradictory. Therefore, it is necessary to provide various process route combinations for decision-makers to choose according to their situation. In this paper, a process route optimization method with low-carbon and low-cost as the goal is proposed. Considering the actual performance of processing equipment and the constraints of related processing quality, a multi-objective optimization model with minimal carbon emissions and minimum processing cost is established. The combinatorial intelligent optimization algorithm is used to solve the model, and the optimal blank processing route is obtained.

3. Establishment of Multi-Objective Optimization Model

3.1. Low-Carbon Objective Function

The machining process of blanks includes turning, milling, planing, grinding, etc., as shown in Figure 1. In the machining process, the input flow includes the blank, cutting fluid, electric energy driving the machine tool, tools, and fixtures, and the output flow consists of the loss of chips, cutting fluid, and cutting tools [25,26,27,28,29,30,31,32].
The carbon emissions caused by the output stream are mainly carbon emissions of materials in the machining process and carbon emissions from energy consumption, which can be expressed by Equation (1);
G p = i = 1 n ( G M i + G E i )
where G M i and G E i  are the carbon emission of materials and carbon emissions from energy consumption of the working step i.

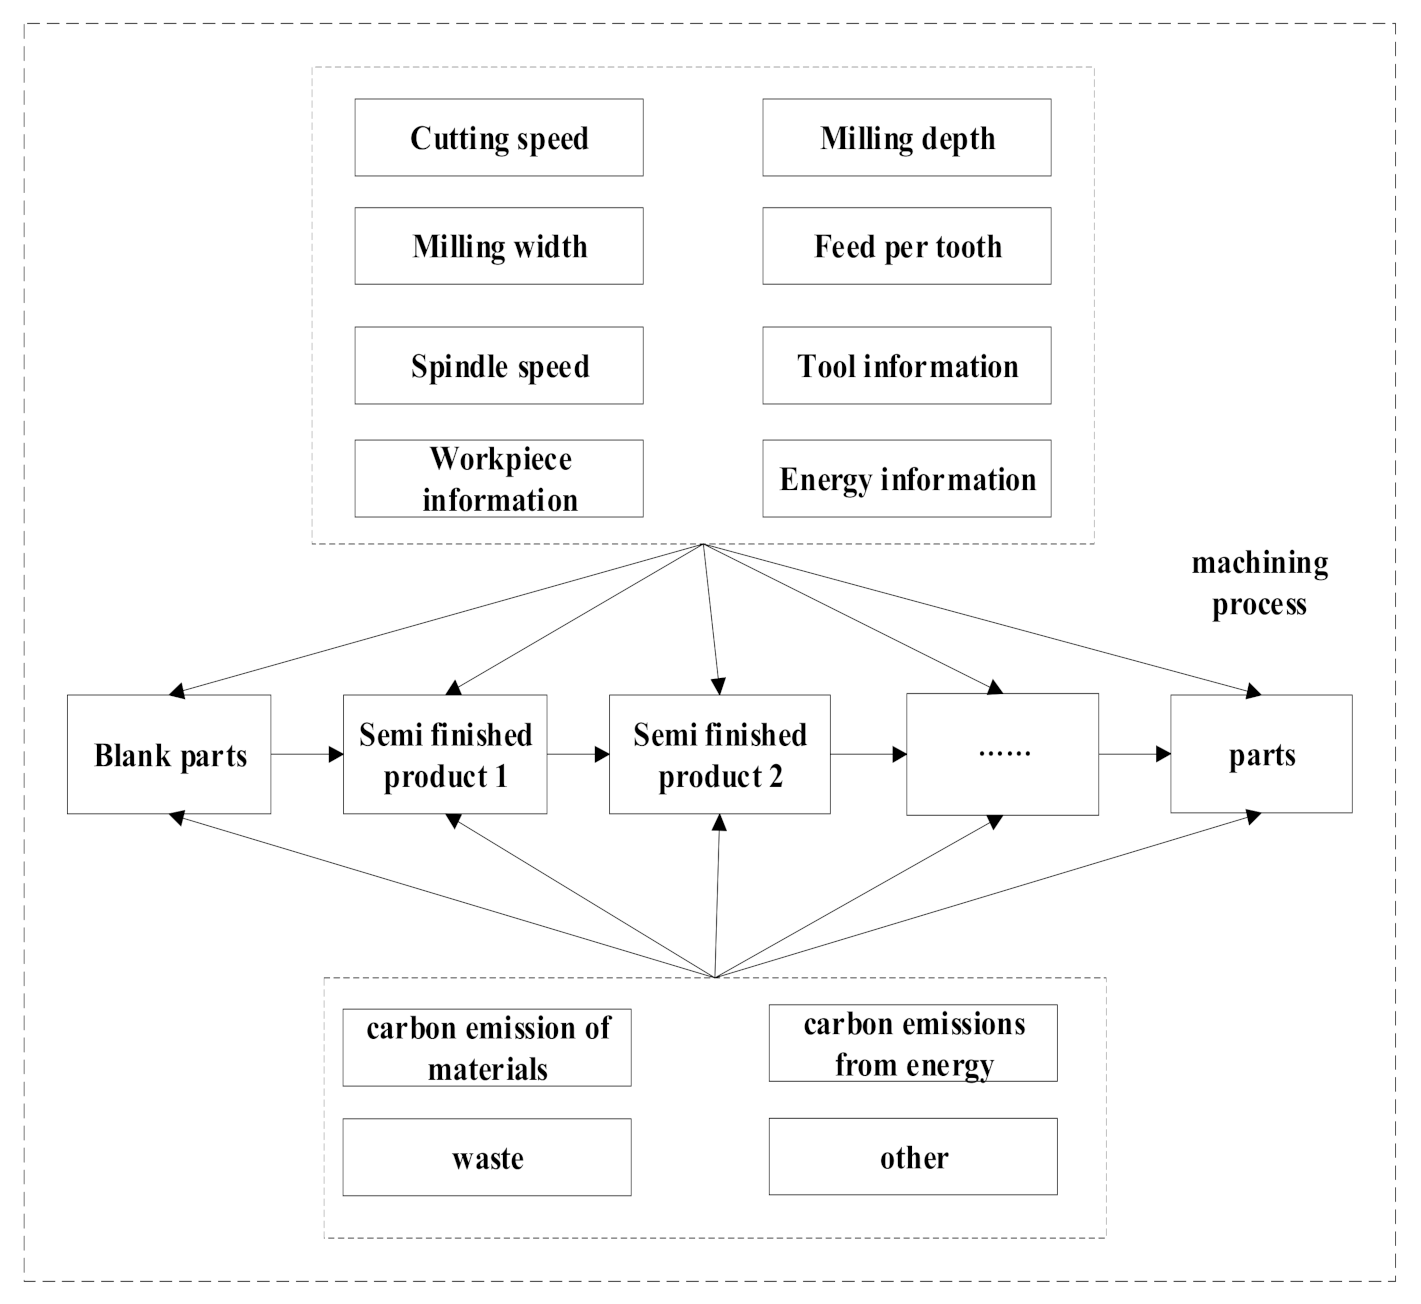
3.1.1. Carbon Emission of Materials in the Machining Process

For typical machining processes, the carbon emission of materials mainly includes chips, cutting fluid, and tool loss. Carbon emission of materials in the machining process can be expressed by Equation (2);
G M i = G M i c + G M i f + G M i t
where G M i c , G M i f , and G M i t are respectively carbon emission caused by chip treatment, cutting fluid consumption, and tool loss in the working step i.
(a) Cutting. In the process of machining, most of the metal chips can be recovered and reused. Since the materials’ performance will be reduced after recycling, carbon emission revenue generated by chip recovery is not considered. Thus, carbon emission caused by chip recovery can be expressed by Equation (3).
G M i c = ρ i V i μ F i c
where ρ i , V i and F i c are the density (Kg/m3), volume (m3), and carbon emission factor ( C O 2 E q , C O 2 equivalent) of the chip in the first processing step respectively; μ is the recovery rate of the chip, where F i c is taken as 1.0 (see Table 1).
(b) Cutting fluid. In the machining process, different cutting fluids are used in various machining processes, and the carbon emission factor and replacement period of varying cutting fluids are also different. For simple systems, carbon emissions caused by cutting fluid consumption can be expressed by Equation (4);
G M i f = ρ i f q v t i f F i f
where, ρ i f , t i f , and F i f are respectively the density (Kg/m3), processing time (s) and carbon emission factor ( C O 2 E q ) of the cutting fluid in the first machining step; q v is the flow rate of cutting fluid (mm3/s), where F i f is set at 0.4690 (see Table 1).
(c) Tool. The carbon emissions caused by tool loss refers to the carbon emission caused by the tool used in the cutting process during its manufacturing process in each workstep, the carbon emission caused by tool loss can be expressed by Equation (5).
G M i f = t i t T i t m i t F i t
where t i t , T i t , m i t and F i t are respectively the processing time, tool life, tool quality, and tool carbon emission factor in the i t h machining step. F i t is set at 30.1530 (see Table 1). The value of the carbon emission factor of materials in the above correlation function is shown in Table 1 [26,33].

3.1.2. Carbon Emission of Energy Consumption

The machining process of the machine tool can be divided into no-load state, load state, accessory state, and tool changing state.
(1)
The no-load state is when the machine tool runs without load, it is composed of the no-load power of the transmission system and the loss power of the motor;
(2)
The load state is when the machine tool is in load processing state;
(3)
The accessory state is when the machine tool is in a load processing state, so there will be additional load power. The power of the additional load is composed of the power increased by the total power loss of the machine drive system and motor on the original no-load loss;
(4)
The tool changing state is when the machine tool is in the tool replacement stage.
In the operation state of each functional part, the energy consumption of the machining process can be divided into no-load energy consumption, load energy consumption, accessory energy consumption, and tool changing energy consumption. The approximate equilibrium equation of the energy of the machine tool in dynamic operation can be expressed by Equation (6).
E e = 0 T P ( t ) d t = o t p P u ( t ) d t + 0 t e P e ( t ) d t + 0 t m ( P u ( t ) + P a ( t ) + P c ( t ) ) d t
where, P u , P c , P a and P e are respectively no-load power, load power, accessory power, and tool changing power. T is the total time, t p , t e , and t m are the empty stroke time, tool changing time, and processing time, respectively.
For the same machine tool, when running steady-state at a fixed speed, the rate fluctuations of its no-load power, load power, accessory power, and tool change power, are very small and can be considered as a constant value.
E e = t p P u + t e P e + t m ( P u + P c + P a )
Carbon emission of energy consumption can be expressed by Equation (8),
G E i = F e l e E e
where F e l e is the carbon emission factor. The value of the carbon emission factor of electric energy in the above correlation function is shown in Table 2 [26,33,34].
Based on the above analysis, the low-carbon objective function can be expressed by Equation (9)
G p = i = 1 n ( G M i + G E i ) = i = 1 n ( G M i c + G M i f + G M i t + G E i ) = i = 1 n ( ρ i V i μ F i c + ρ i f q v t i f F i f + t i t T i t m i t F i t + F e l e E e )

3.2. Cost Function

From the perspective of the negative impact in the manufacturing process, the environmental impact accounts for a large proportion, and the space for optimization is large. If we only consider environmental factors in the manufacturing process, this will inevitably increase the processing cost, so we should consider the environment, cost, and other factors in the process design. The machining cost of machine tools mainly includes the cutting tool replacement cost, processing cost, and other auxiliary costs [24,27,28].
C p = α ( T o + T m + T r T c T )
In Equation (10), T r , T c , n , T can be express as follows:
T r = T d + β α
T c = L n f z z
n = 1000 v c π D
T = C v D o v c f z k a e / D q a p u H B g 1 / m
In Equations (10)–(14), C p is the processing cost of blank; T o is the extra machining time; T m is the machining time; β is the cost of the tool; α is the labor processing cost; T c is the effective machining time; T d is the time required for tool replacement; L is the machining length required for the parts; v c is the machining speed. Based on the above, the cost objective function is as follows.
C p = α T o + π D L 1000 v c f z z 1 + T d + β α C v D o v c f z k ( a e / D ) q a p u H B g 1 / m

3.3. Constrains

The value of two objective functions is limited by the spindle speed, feed rate, maximum cutting power, and machining quality of the selected machine tool, which can only be taken within the range [29,30].
Spindle speed constraint.
A CNC machine tool has a specific spindle speed constraint. Cutting parameters should meet the selection of spindle speed constraint, as shown in Equation (16).
g 1 ( v c , f z ) = N min π D 1000 v c 0
Feed constraints.
The feed is restricted by the model and type of the machine tool, as shown in Equation (17).
g 2 ( v c , f z ) = v f min π D 1000 z v c f z 0
Power constraints.
The machine power shall be less than the maximum effective cutting power specified P max , as shown in Equation (18).
g 3 ( v c , f z ) = F c v c 60 × 1000 η P max 0
Torque constraint, as shown in Equation (19).
g 4 ( v c , f z ) = F c D 2 × 10 3 M max 0
where M max is the maximum torque.
Tool life constraint, as shown in Equation (20).
g 5 ( v c , f z ) = T min T 0

3.4. Conversion of Multiple Objective Functions

According to the objective function constructed above, each objective function restricts the other for the multi-objective optimization problem. To avoid the differences between the dimensions of the carbon emission function and the cost function, we can first find the maximum and minimum values of each independent objective function and then convert the actual objective function to a dimension between [0, 1]. The processing method is as follows:
G P = G P min ( G P ) max ( G P ) min ( G P )
C p = C p min ( C p ) max ( C p ) min ( C p )
where G P and G P are the objective function value of carbon emission and the dimension after transformation, and C p and C p are the objective function value of cost and the dimension after transformation, respectively. The simplified single objective function is as follows.
S = min ( μ 1 G P + μ 2 C p )
For solving multi-objective optimization problems, it is often difficult to obtain the optimal solutions of multiple objective functions simultaneously. In order to solve the problem conveniently, the multi-objective function is transformed into a single-objective function. At present, there are three main methods to transform multi-objective optimization problems into single-objective optimization problems, which are the linear weighting method, the principal component analysis method, and the comprehensive scoring method [35,36,37].
Among the three methods, the linear weighted method is the simplest to calculate, and the weight can be assigned by subjective evaluation of the importance of each objective. Therefore, the weighted summation method is introduced, the specific expression is as follows:
min S ( v c , f z ) = min ( μ 1 G P + μ 2 C P )
Among them, μ 1 + μ 2 = 1 ; μ 1 and μ 2 are carbon emission weighting coefficient, and processing cost weighting coefficient, respectively. In this study, for the two factors of carbon emission and processing cost, they are considered to be equally important in the optimization process. Therefore, the weight is set here as μ 1 = 0.5 and μ 2 = 0.5 [36]. Then the new objective function can be used as the evaluation function.

4. Combinatorial Optimization Algorithm

To obtain the high-precision optimal solution of the multi-objective combinatorial optimization problem, the local optimization problem which often occurs in the previous algorithm solving process is abandoned. This research proposes a combinatorial optimization algorithm [24,38,39]. First of all, we designed an intelligent generation algorithm, which can perform preliminary intelligent screening among all feasible workstep sequence chains that meet the constraints and then combine the Adaptive Particle Swarm Optimization (APSO) [40,41] algorithm to further optimize the feasible workstep sequence chains, which aims to achieve the purpose of the optimal solution.

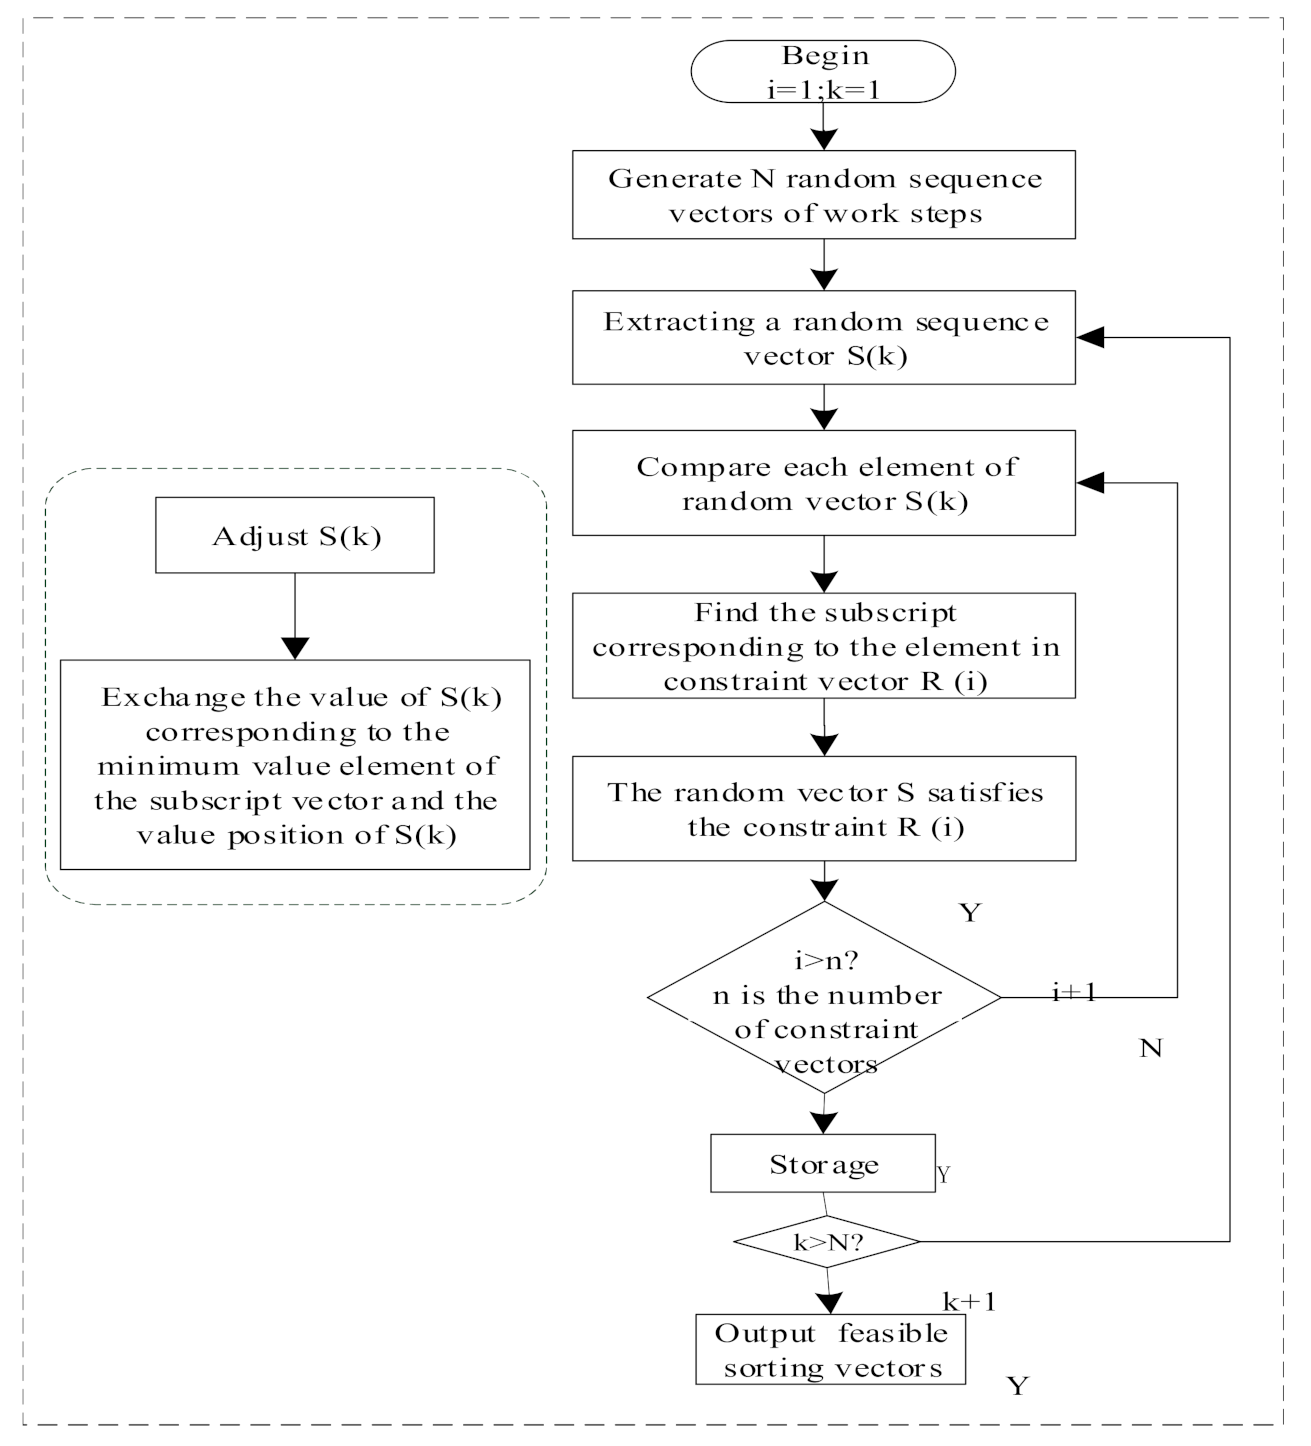
4.1. Intelligent Generation Algorithm of Workstep Chains

The intelligent generation algorithm of the working step chain can effectively perform preliminary screening among numerous feasible working step chainsets under constraints, and obtain the working step chain combinations that basically meet the optimization conditions, the flow chart of this algorithm is shown in Figure 2.

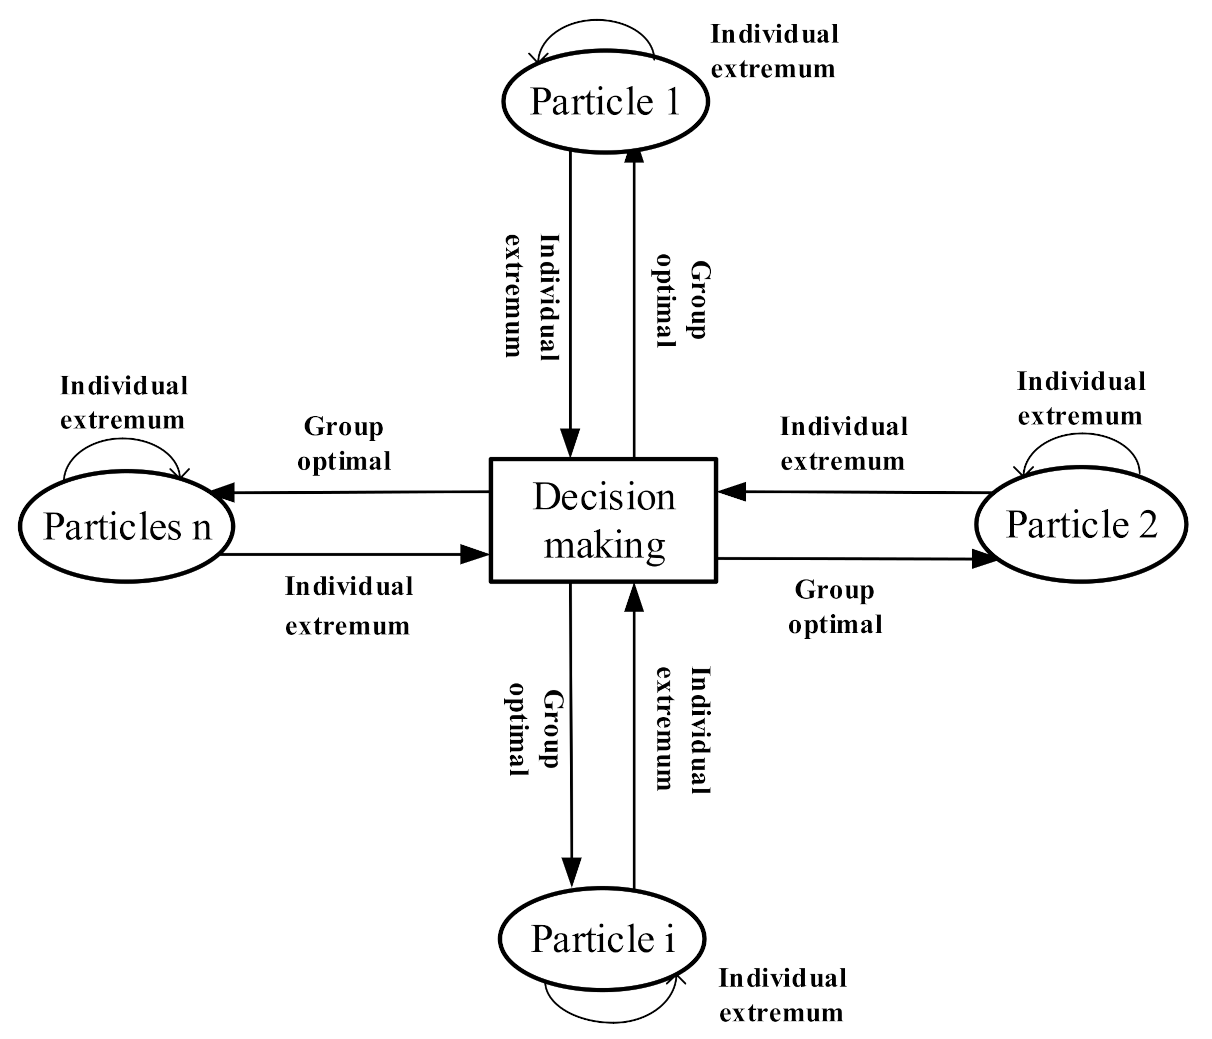
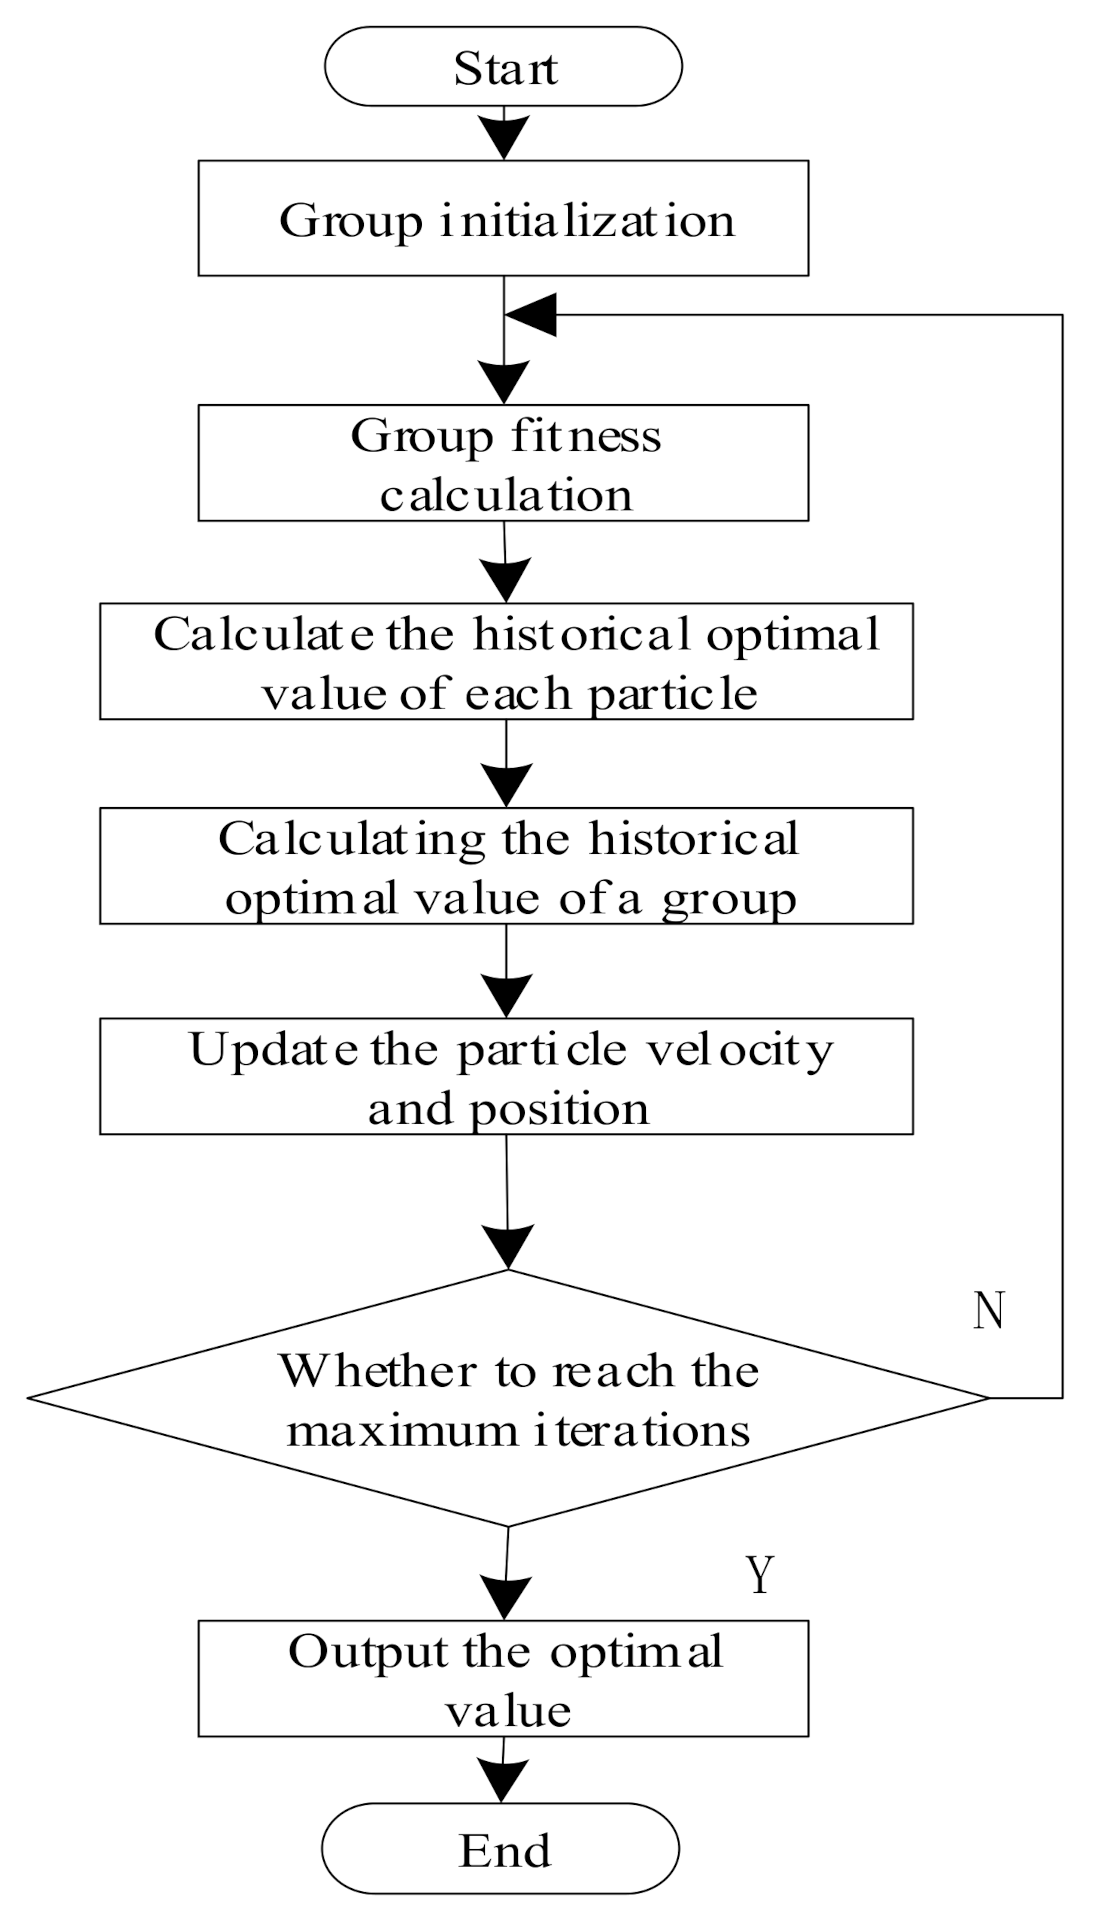
4.2. Adaptive Particle Swarm Optimization (APSO)

The PSO algorithm is a swarm intelligence algorithm, which thinks that particles are in dimensional space, passes information according to a specific rule, and changes the self-organization behavior generated by their state according to the change of information [41,42,43]. The schematic diagram of information transmission between particles in the particle swarm optimization algorithm is shown in Figure 3.
First, the particle swarm optimization algorithm with a certain scale is initialized artificially, when the particle swarm is initialized, each particle has three attributes: fitness P , speed V , and position X .
Second, the fitness value of the current position of each particle p i d is compared with its historical best fitness value. The best value obtained by comparison will be regarded as the current best position; otherwise, it will not change.
Third, the velocity and position of particles are updated according to Equations (25) and (26), until the set termination condition is reached.
v i d ( t + 1 ) = w v i d ( t ) + c 1 r 1 d [ p i d ( t ) x i d ( t ) ] + c 2 r 2 d [ p g d ( t ) x i d ( t ) ]
x i d ( t + 1 ) = x i d ( t ) + v i d ( t + 1 )
In the above Equations (25) and (26), w is the inertia weight factor, v i d is the velocity of the particle, v i d [ v max , v max ] , c 1 and c 2 are the learning factors. The larger the learning factor is, the better the convergence of the algorithm, and the local search ability will be increased. In addition, the smaller the learning factor is, the better the global search will be and the algorithm will not fall into the local optimum. To improve the efficiency of the optimization algorithm, it is necessary to improve the local search ability and global search ability of the algorithm. Therefore, it is taken as the synchronous learning factor c 1 = c 2 . Considering the learning factor such that c = c 1 + c 2 , c 4 , here we take c 1 = c 2 = 2 [40,41], r 1 d , r 2 d are mutually independent random numbers uniformly distributed on [ 0 , 1 ] , x i d is the current particle position [43].
(1) Mathematical representation and solution steps of APSO
In the standard PSO algorithm, because the flight time of each generation of particles is fixed, the oscillation phenomenon occurs, which makes the algorithm slow convergence speed, weaken heuristic search direction, and easily fall into the local extremum [44,45]. Therefore, the APSO algorithm is introduced. The inertia weight and the flight time of particles can be adjusted adaptively according to the global optimal value information. The adjustment formula has been defined in Equations (27) and (28).
w t = exp ( F b t F b t 1 )
x i d ( t + 1 ) = x i d ( t ) + v i d ( t + 1 ) × T s t × 1 k o t I max
where w t is the inertia weight of the particle of generation t , F b t , F b t 1 is the global optimal value of the particles of generation t and generation t 1 , T s t is the initial flight time, k o is the adjustment parameter, and I max is the largest evolutionary algebra. The optimization process of the APSO algorithm is shown in Figure 4.

5. Case Study

Taking the machining process of an emulsion pump box blank as an example, the validity of the low-carbon and low-cost optimization model of the machining process route is verified. The three-dimensional model and three views of the emulsion pump box blank are shown in Figure 5.

5.1. Analysis of Processing Characteristics

The structure of the emulsion pump box is composed of 12 machining features such as end face, hole, and thread. The feature information of each side corresponds to the corresponding position; the specific information of the emulsion pump box is shown in Table 3.
The processing equipment and tools available for processing the blank of the box body can be seen in Table 4 and Table 5 [17,46].
The carbon emission factor of the cutting tool is 30.153 kgCO2/kg, the carbon emission factor of the cutting fluid is 0.469 kgCO2/kg, and the cutting fluid replacement cycle is two months, the relevant parameters can be obtained by referring to the literature [47,48,49,50].
Based on the above Table 3, Table 4 and Table 5, the worksteps coding scheme of the emulsion pump blank box machining process can be obtained, as shown in Table 6. The coding scheme shows 12 typical machining features, which need 28 worksteps to complete. The process route is an ordered set of 28 worksteps. As shown in the corresponding table for machining an F1 end face feature, its machining steps are composed of machining step 01, rough turning, machining step 02, semi-finish turning, and machining step 03, finish turning. There are several processing options for each processing step.
For instance, there are five processing options for processing step 01, rough turning, each processing option corresponds to different processing equipment and processing time. Based on this, we can know all the processing schemes of 12 typical machining features. The purpose of this study is to select the optimal process route via using the combinatorial optimization algorithm based on all the workstep coding schemes.

5.2. Process Route Optimization Based on Combinatorial Optimization Algorithm

The Matlab program was used to realize the combinatorial optimization algorithm. The relevant parameters can be obtained according to the actual setting requirements and references [40,41]:
(1)
number of machines, w = 10 , number of jobs, i = 6
(2)
number of processes, j = 6 , particle length, i × j × 2 = 72 ,
(3)
the population size is 10, evolution times sets 50 times.
The results are compared with the single objective optimization results, as shown in Table 7.
The algorithm convergence diagram of low-carbon and low-cost process route is shown in Figure 6.
Based on the combinatorial optimization algorithm used in this study, the low-carbon and low-cost optimization model is solved, and the optimal process route is generated, as shown in Table 8.

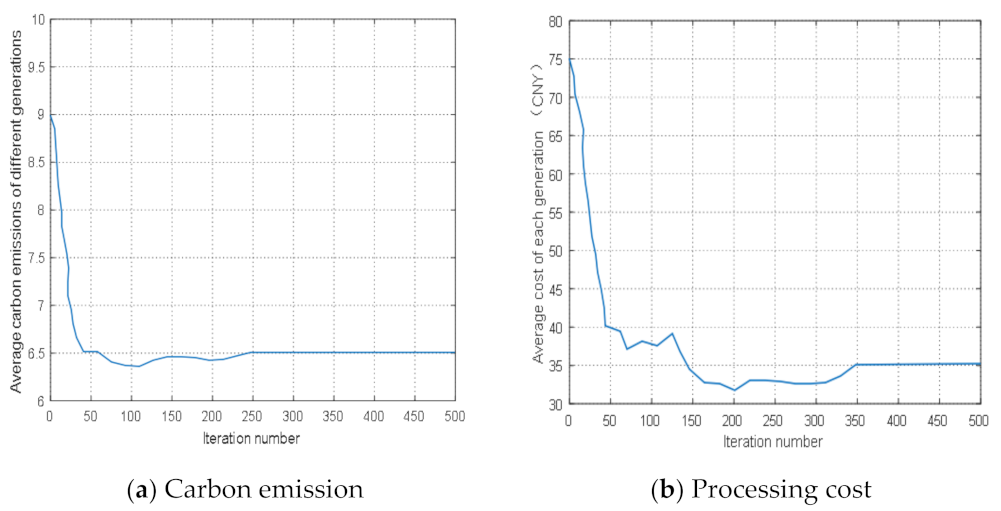
5.3. Analysis of Optimization Results and Discussion

5.3.1. Comparison of Optimization Results

Compared with the optimization results under the three conditions, it can be concluded that the carbon emission value reaches 5.68 and the processing cost is 35.84 when the process route is optimized with low-carbon as the goal. The selection of tools and equipment is more scattered, and the replacement is more frequent, which leads to a longer processing time and higher processing cost. When the process route is optimized with low-cost as the goal, the carbon emission value reaches 6.87, and the processing cost is 33.42. The obtained process route has a small number of tool and equipment replacement times, which leads to reduced processing time and lowered processing costs.
However, the selection of tools and equipment with a few kinds of concentration results in higher carbon emissions. When the two objectives of low-carbon and low-cost are optimized simultaneously, the carbon emission value reaches 6.15, the processing cost is 34.06, and the comprehensive performance is the best. The process route with acceptable carbon emission value and processing cost can be obtained, which is in accordance with the optimization effect of low-carbon and low-cost.

5.3.2. Discussion

In this case, the numerical control machining process of the emulsion pump box blank is taken as an example. The emulsion pump box blank is composed of 12 kinds of processing features. Based on the requirements of processing characteristics, the list of processing equipment and tools that can be used is provided. According to the selection and analysis of the processing equipment and tool list, the specific work steps corresponding to the technical characteristics of the emulsion pump box blank, the available equipment, and tools for each step, the corresponding steps are determined.
The combinatorial optimization algorithm based on the combination of APSO and workstep chain intelligent generation algorithm is applied. Considering that the box blank processing process includes 12 typical machining features, 28 machining processes are required to complete it. The Matlab algorithm is used to compile the program of combinatorial algorithm and set the relevant parameters. Firstly, the intelligent generation algorithm of the workstep chain is used to preliminarily optimize all the satisfied process chains under the feasibility constraints, and then the APSO algorithm is used for accurate optimization to ensure the generated optimal process route.
The combinatorial optimization algorithm is used for optimization iteration. Through the iterative convergence diagram, it can be found that the average carbon emission of each generation converges at 250 iterations, and the average processing cost of each generation converges at 350 iterations. By comparing the optimal solutions generated under the combined objective conditions with the optimal solutions generated under the single objective conditions, the carbon emission of each generation reaches the convergence. The results show that the process route optimization model with low-carbon and low-cost is effective, and the combinatorial optimization algorithm selected in this study can achieve high efficiency and high-precision.
Compared with the research results in the literature review, in the field of building low-carbon emission models, the current optimization objectives for low-carbon emissions are generally only considered from the environmental indicators, and rarely take into account the economic indicators simultaneously, which will lead to large costs while reducing carbon emissions and environmental pollution. This study starts from the perspective of blank process design under the severe situation of resource shortage, so the environmental indicators and economic indicators are deeply studied. In the process of building the model, the low-carbon objective function and low-cost objective function are created simultaneously. Finally, the optimal process route with both carbon emission and processing cost is obtained. Compared with the commonly used research results with low-carbon emission as a single objective, the processing cost is significantly reduced.
Compared with the research methods of seeking model solutions in the literature review, an intelligent optimization algorithm is generally used to find the optimal solution of the obtained model. In this study, an intelligent generation algorithm of the workstep chain is innovatively designed based on the actual processing constraints, and the algorithm is combined with the APSO algorithm to find the optimal solution. Firstly, the intelligent generation algorithm of the workstep chain is used to optimize all the workstep chains preliminarily, then the APSO algorithm is used to set the relevant parameters for accurate optimization. Compared with the solution methods used in the literature review, the traditional approach is easy to achieve local optimization because it is limited to one optimization algorithm, while the combinatorial algorithm used in this study is superior in the accuracy and efficiency, which can reduce the optimization time, ensure the accuracy of the model and reduce the error.

6. Conclusions

Blanks are the basis of manufacturing processing and the traditional blank production process consumes a lot of energy. The blank process design determines the blank machining process of resource consumption and more than 80% of environmental emissions, therefore, in order to achieve emission reduction, cost reduction, and sustainable development, a blank optimization design method of low-carbon and low-cost blank process route optimization model is proposed. The low-carbon objective function and low-cost objective function of the blank machining process are established.
Then, considering the actual performance of processing equipment and the constraints of related processing quality, a multi-objective optimization model with minimal carbon emissions and minimal processing costs is established. The concept of the workstep element is proposed, and an intelligent generation algorithm of the workstep chain is proposed based on the workstep element. The algorithm is combined with the APSO algorithm to solve the low-carbon and low-cost model.
A specific case is designed to verify the validity of the model. Taking the processing of an emulsion pump box blank as an example, 12 typical processing characteristics of the box body blank are analyzed. Matlab is used to compile the combinatorial algorithm related program, and the relevant parameters are set. The actual data show that when the two objectives of low-carbon and low-cost are optimized simultaneously, the carbon emission value reaches 6.15, the processing cost is 34.06, and the comprehensive performance is optimal. The process route with acceptable carbon emission value and processing cost can be obtained, which conforms to the optimization effect of low-carbon and low-cost.
There are also some limitations in this paper. For the blank processing process route optimization problem, due to the complexity of different processing equipment, the main purpose of this paper is to select a reasonable blank processing route. However, in the actual processing process, it is often necessary to consider the influence of multi-objective factors, and the production requirements of each project. Therefore, how to comprehensively consider the impact of multi-objective factors and achieve the goal of low-carbon emissions and other objectives of unified coordination and optimization will be the focus of the next step.

Author Contributions

Conceptualization, Y.X., W.Y., Z.J., and Y.L.; methodology, Y.X., Z.J.; software, W.Y.; validation, R.W.; formal analysis, Y.X.; visualization, R.W.; supervision, Z.J., Y.L.; project administration, W.Y., Y.X.; funding acquisition, W.Y., Y.X. All authors have read and agreed to the published version of the manuscript.

Funding

The authors are grateful for the financial support for this research from the National Science Foundation, China (No. 51975432), the Natural Science Foundation of Ministry of Education of Guizhou Province (No. [2019]204), the project of the Key Laboratory of Automotive Power Train and Electronics (Hubei University of Automotive Technology) (No. ZDK1201804), and the science and technology project of Nanchang Institute of Science & Technology (No. NGKJ-20-13).

Institutional Review Board Statement

Not applicable.

Informed Consent Statement

Not applicable.

Conflicts of Interest

The authors declare no conflict of interest.

References

  1. Zhai, X.Q.; An, Y.F. Analyzing influencing factors of green transformation in China’s manufacturing industry under environmental regulation: A structural equation model. J. Clean. Prod. 2020, 251, 119760. [Google Scholar] [CrossRef]
  2. Peng, B.H.; Zheng, C.Y.; Guo, W.; Ehsan, E. The Cultivation Mechanism of Green Technology Innovation in Manufacturing Industry: From the Perspective of Ecological Niche. J. Clean. Prod. 2019, 252, 119711. [Google Scholar] [CrossRef]
  3. Wang, Q.; Hu, Y.J.; Hao, J.; Lv, N.; Li, T.Y.; Tang, B.J. Exploring the influences of green industrial building on the energy consumption of industrial enterprises: A case study of Chinese cigarette manufactures. J. Clean. Prod. 2019, 231, 370–385. [Google Scholar] [CrossRef]
  4. Sun, Y.; Gong, Q.S.; Hu, M.M.; Yang, N. Multi-Objective Optimization of Workshop Scheduling with Multiprocess Route Considering Logistics Intensity. Processes 2020, 8, 838. [Google Scholar] [CrossRef]
  5. Ai, X.F.; Jiang, Z.G.; Zhang, H.; Wang, Y. Low-carbon product conceptual design from the perspectives of technical system and human use. J. Clean. Prod. 2020, 244, 118819. [Google Scholar] [CrossRef]
  6. Dowlatshahi, S. The role of logistics in concurrent engineering. Int. J. Prod. Econ. 1996, 44, 189–199. [Google Scholar] [CrossRef]
  7. Gutowski, T.; Dahmus, J.; Thiriez, A. Electrical energy requirements for manufacturing processes. In Proceedings of the 13th CIRP International Conference on Life Cycle Engineering, Leuven, Belgium, 31 May 2006–2 June 2006. [Google Scholar]
  8. Chirag, M.; Yuan, J.; Debangsu, B. Techno-economic optimization of shale gas to dimethyl ether production processes via direct and indirect synthesis routes. Appl. Energy 2019, 238, 119–134. [Google Scholar]
  9. Li, G.F.; Wang, S.X.; He, J.L.; Wu, K.; Zhou, C.Y. Compilation of load spectrum of machining center spindle and application in fatigue life prediction. J. Mech. Sci. Technol. 2019, 33, 1603–1613. [Google Scholar] [CrossRef]
  10. Jiang, Z.G.; Ding, Z.Y.; Zhang, H.; Cai, W.; Liu, Y. Data-driven ecological performance evaluation for remanufacturing process. Energy Convers. Manag. 2019, 198, 111844. [Google Scholar] [CrossRef]
  11. Stefano, P.; Riccardo, A.; Riccardo, M. Planning low carbon urban-rural ecosystems: An integrated transport land-use model. J. Clean. Prod. 2019, 235, 96–111. [Google Scholar]
  12. Avinash, V.; Adam, H. Demand side flexibility from residential heating to absorb surplus renewables in low carbon futures. Renew. Energy 2019, 138, 598–609. [Google Scholar]
  13. Cadavid-Giraldo, N.; Velez-Gallego, M.C.; Restrepo-Boland, A. Carbon emissions reduction and financial effects of a cap and tax system on an operating supply chain in the cement sector. J. Clean. Prod. 2020, 275, 122583. [Google Scholar] [CrossRef]
  14. Gaurav, J.; Soren, S.; Kapil, D.M. Life cycle assessment of sintering process for carbon footprint and cost reduction: A comparative study for coke and biomass-derived sintering process. J. Clean. Prod. 2020, 259, 120889. [Google Scholar]
  15. Yoshiyuki, M.; Keiichi, T.; Reijiro, T. Process Engineering Approach Towards Low Carbon Consumption in Carbon Cycle by Smart Iron Manufacture. ISIJ Int. 2015, 55, 365–372. [Google Scholar]
  16. Song, J.S.; Lee, K.M. Development of a low-carbon product design system based on embedded ghg emissions. Resour. Conserv. Recycl. 2010, 54, 547–556. [Google Scholar] [CrossRef]
  17. Xiu, F.Z.; Shu, Y.Z.; Zhi, Y.H.; Gang, Y.; Cheng, H.P.; Sa, R.N. Identification of connection units with high ghg emissions for low-carbon product structure design. J. Clean. Prod. 2012, 27, 118–125. [Google Scholar]
  18. Xu, F.; Gu, X.J.; Ji, Y.J.; Qi, G.N. The method of product conceptual design based on low-carbon constraint. J. Mech. Eng. 2013, 49, 58–65. [Google Scholar] [CrossRef]
  19. Rad-Tolouei, M.; Bidhendl, I.M. On the optimization of machining parameters for milling operations. Int. J. Mach. Tool. Manuf. 1997, 37, 1–16. [Google Scholar] [CrossRef]
  20. Eskicioglu, E.; Nisli, M. An application of geometric programming to single-pass turning operations. In Proceedings of the 25th International Machine Tool Design and Research, Birmingham, UK, 22–24 April 1985; Volume 21, pp. 428–435. [Google Scholar]
  21. Zainal, N.; Zain, A.M.; Radzi, N.H.; Othman, M.R. Glowworm swarm optimization (GSO) for optimization of machining parameters. J. Intell. Manuf. 2016, 27, 797–804. [Google Scholar] [CrossRef]
  22. Zarei, O.; Fesanghary, M.; Farshi, B.; Saffar, R.J.; Razfar, M.R. Optimization of multi-pass face-milling via harmony search algorithm. J. Mater. Process. Technol. 2009, 209, 2186–2192. [Google Scholar] [CrossRef]
  23. Esmaeil, S.; Milad, M.; Reza, G.; Saeed, K. Designing multi-layer quantum neural network controller for chaos control of rod-type plasma torch system using improved particle swarm optimization. Evol. Syst. 2019, 10, 317–331. [Google Scholar]
  24. Xiao, Y.M.; Zhang, H.; Jiang, Z.G.; Gu, Q.; Yan, W. Multiobjective optimization of machining center process route: Tradeoffs between energy and cost. J. Clean. Prod. 2021, 280, 1–15. [Google Scholar] [CrossRef]
  25. Yeh, F.H.; Li, C.L. Optimum blank design by the predictor-corrector scheme of SLM and FSQP in the deep drawing process of square cup with flange. Int. J. Adv. Manuf. Technol. 2007, 34, 277–286. [Google Scholar] [CrossRef]
  26. Wang, S.; Tao, F.; Shi, Y.; Wen, H. Optimization of vehicle routing problem with time windows for cold chain logistics based on carbon tax. Sustainability 2017, 9, 694. [Google Scholar] [CrossRef] [Green Version]
  27. Islam, M.Z.; Wahab, N.I.; Veerasamy, V.; Hizam, H.; Mailah, N.F.; Guerrero, J.M.; Mohd Nasir, M.N. A Harris Hawks optimization based single and multi-objective optimal power flow considering environmental emission. Sustainability 2020, 12, 5248. [Google Scholar] [CrossRef]
  28. Lin, Y.C.; Yeh, C.C.; Chen, W.H.; Liu, W.C.; Wang, J.J. The Use of Big Data for Sustainable Development in Motor Production Line Issues. Sustainability 2020, 12, 5323. [Google Scholar] [CrossRef]
  29. Wang, Q.; Liu, F.; Wang, X. Multi-objective optimization of machining parameters considering energy consumption. Int. J. Adv. Manuf. Technol. 2013, 71, 1133–1142. [Google Scholar] [CrossRef]
  30. Jiang, Z.G.; Jiang, Y.; Wang, Y.; Zhang, H.; Cao, H.J.; Tian, G.D. A hybrid approach of rough set and case-based reasoning to remanufacturing process planning. J. Intell. Manuf. 2016, 30, 19–32. [Google Scholar] [CrossRef]
  31. Cai, W.; Lai, K.H.; Liu, C.H.; Wei, F.F.; Ma, M.D.; Jia, S.; Jiang, Z.G.; Lv, L. Promoting sustainability of manufacturing industry through the lean energy-saving and emission-reduction strategy. Sci. Total Environ. 2019, 665, 23–32. [Google Scholar] [CrossRef]
  32. Zhang, C.; Huang, H.H.; Zhang, L.; Bao, H.; Liu, Z.F. Low-carbon design of structural components by integrating material and structural optimization. Int. J. Adv. Manuf. Technol. 2018, 95, 4547–4560. [Google Scholar] [CrossRef]
  33. Park, H.S.; Nguyen, T.T.; Dang, X.P. Multi-objective optimization of turning process of hardened material for energy effificiency. Int. J. Precis. Eng. Man. 2016, 17, 1623–1631. [Google Scholar] [CrossRef]
  34. Mustapa, S.I.; Ayodele, B.V.; Mohamad Ishak, W.W.; Ayodele, F.O. Evaluation of Cost Competitiveness of Electric Vehicles in Malaysia Using Life Cycle Cost Analysis Approach. Sustainability 2020, 12, 5303. [Google Scholar] [CrossRef]
  35. Albertelli, P.; Keshari, A.; Matta, A. Energy oriented multi cutting parameter optimization in face milling. J. Clean. Prod. 2016, 137, 1602–1618. [Google Scholar] [CrossRef]
  36. Hu, T.M.; Sung, S.Y.; Sun, J.; Ai, X.W. A linear transform scheme for building weighted scoring rules. Intell. Data Anal. 2012, 16, 383–407. [Google Scholar] [CrossRef]
  37. Nabavi-KeriziH, S.H.; Abadi, M.; Kabir, E. A PSO-based weighting method for linear combination of neural networks. Comput. Electr. Eng. 2008, 36, 886–894. [Google Scholar] [CrossRef]
  38. Liu, X.J.; Yi, H.; Ni, Z.H. Application of ant colony optimization algorithm in process planning optimization. J. Intell. Manuf. 2013, 24, 1–13. [Google Scholar] [CrossRef]
  39. He, B.; Tang, W.; Huang, S.; Hou, S.; Cai, H. Towards low-carbon product architecture using structural optimization for lightweight. Int. J. Adv. Manuf. Technol. 2016, 83, 1419–1429. [Google Scholar] [CrossRef]
  40. Gao, W.Y.; Su, C. Analysis of earnings forecast of blockchain financial products based on particle swarm optimization. J. Comput. Appl. Math. 2020, 372, 112724. [Google Scholar] [CrossRef]
  41. Ding, Y.M.; Zhang, W.L.; Yu, L.; Lu, K.H. The accuracy and efficiency of GA and PSO optimization schemes on estimating reaction kinetic parameters of biomass pyrolysis. Energy 2019, 176, 582–588. [Google Scholar] [CrossRef]
  42. Dovie, D.B.; Dzodzomenyo, M.; Dodor, D.E.; Amoah, A.B.; Twerefou, D.K.; Codjoe, S.N.; Kasei, R.A. Multi-Vector Approach to Cities’ Transition to Low-Carbon Emission Developments. Sustainability 2020, 12, 5382. [Google Scholar] [CrossRef]
  43. Jurić, Ž.; Ljubas, D. Comparative Assessment of Carbon Footprints of Selected Organizations: The Application of the Enhanced Bilan Carbone Model. Sustainability 2020, 12, 9618. [Google Scholar] [CrossRef]
  44. Mcbrien, M.; Serrenho, A.C.; Allwood, J.M. Potential for energy savings by heat recovery in an integrated steel supply chain. Appl. Therm. Eng. 2016, 103, 592–606. [Google Scholar] [CrossRef] [Green Version]
  45. Kitayama, S.; Natsume, S.; Yamazaki, K.; Han, J.; Uchida, H. Numerical optimization of blank shape considering flatness and variable blank holder force for cylindrical cup deep drawing. Int. J. Adv. Manuf. Technol. 2016, 85, 1–12. [Google Scholar] [CrossRef]
  46. Cheng, D.D.; Lu, X.; Sun, X.J. Multi-objective topology optimization of column structure for vertical machining center. CIRP Ann. Manuf. Technol. 2018, 78, 1021–1037. [Google Scholar] [CrossRef]
  47. Lu, Q.; Zhou, G.H.; Xiao, Z.D.; Chang, F.T.; Tian, C.L. A selection methodology of key parts based on the characteristic of carbon emissions for low-carbon design. Int. J. Adv. Manuf. Technol. 2018, 94, 3359–3373. [Google Scholar] [CrossRef]
  48. Jiang, Z.G.; Ding, Z.Y.; Liu, Y.; Wang, Y.; Hu, X.L.; Yang, Y.H. A data-driven based decomposition–integration method for remanufacturing cost prediction of end-of-life products. Robot Comput Integr Manuf. 2020, 61, 101838. [Google Scholar] [CrossRef] [Green Version]
  49. Zhang, M.; Wang, L.; Feng, H.; Zhang, L.; Zhang, X.; Li, J. Modeling Method for Cost and Carbon Emission of Sheep Transportation Based on Path Optimization. Sustainability 2020, 12, 835. [Google Scholar] [CrossRef] [Green Version]
  50. Xu, Z.Z.; Wang, Y.S.; Teng, Z.R.; Zhong, C.Q.; Teng, H.F. Low-carbon product multi-objective optimization design for meeting requirements of enterprise, user and government. J. Clean. Prod. 2015, 103, 747–758. [Google Scholar] [CrossRef]
Figure 1. Carbon footprint model of the blank machining process.
Sustainability 13 01929 g001
Figure 2. Algorithm flow chart.
Sustainability 13 01929 g002
Figure 3. Schematic diagram of particle information transfer.
Sustainability 13 01929 g003
Figure 4. Flow chart of Adaptive Particle Swarm Optimization (APSO) algorithm.
Sustainability 13 01929 g004
Figure 5. Features analysis of an emulsion pump box blank.
Sustainability 13 01929 g005
Figure 6. Iterative convergence graph of the algorithm.
Sustainability 13 01929 g006
Table 1. Values used for carbon emission factors.
Name k g C O 2 / k W h Name k g C O 2 / k W h
F i c 1.0000 F i f 0.4690
F i t 30.1530
Table 2. Carbon emission factor table of electric energy.
Regional/Name F ele / ( kgCO 2 / kWh ) Regional/Name F ele / ( kgCO 2 / kWh )
North China1.0580Central China0.9724
Northeast China1.1280Southern China0.9183
East China0.8095Northwest China0.9578
Table 3. Part feature information table.
Feature No.Feature DescriptionAzimuth PlaneFeature No.Feature DescriptionAzimuth Plane
F1End face1F7End face3
F2M16 × 1.5
Threaded hole
1F8M16 × 1.5
Threaded hole
3
F3End face2F9End face4
F4Φ45Through hole2F10Φ45Through hole4
F5Φ35Through hole2F11Φ35Through hole4
F6Φ45Through hole2F12Φ45Through hole4
Table 4. Equipment list.
Equipment Serial No.Equipment NameEquipment Power/kW
M01Ordinary lathe10
M02CNC lathe22
M03CNC vertical milling machine15
M04Vertical milling machine11
M05Radial drilling machine4
M06Radial drilling machine3
M07machining center18.5
Table 5. Tool list.
Table 5. Tool list.
Cutting Tools NumberTool NameLife/minQuality/gThe Main Purpose
T01Turning tool 1609.5Turning
T02Turning tool 210010.0Turning
T03Turning tool 3909.0Turning
T04Milling cutter 12407.5Milling
T05Milling cutter 218050.0Milling
T06Drill 160375.0Drilling
T07Drill 275475.0Drilling
T08Tap75275.0Tapping
Table 6. Available equipment tools and corresponding time for each process feature processing plan.
Feature No.Feature Info.Processing WorstepsWork Step EncodingMachine Tool EquipmentTime/min
F1End faceRough turning01M01T012.0
M01T022.1
M02T022.1
M02T032.1
M01T012.0
Semi-finish turning02M01T022.1
M02T022.2
M02T032.1
Finish turning03M01T022.1
M02T022.2
M02T032.1
F2M16 ThreadRough turning04M01T012.0
M01T022.0
M02T022.0
M02T032.1
M01T012.0
Semi-finish turning05M01T022.1
M02T022.0
M02T032.2
Finish turning06M01T022.1
M02T022.0
M02T032.1
F3End face Rough turning07M01T012.2
M01T022.2
M02T022.0
Semi-finish turning08M01T022.0
M02T022.1
M02T032.0
Finish turning09M01T022.2
M02T022.0
M02T032.1
F4Φ45 Through holeRough turning10M01T012.2
M01T022.2
M02T022.0
Finish turning11M01T012.3
M01T022.25
F5Φ35 Through holeRough turning12M01T011.2
M01T021.2
M02T021.1
Finish turning13M01T011.2
M01T021.3
M02T021.15
F6Φ45 Through holeRough turning14M01T011.0
M01T021.2
Rough turning15M02T021.1
M02T031.1
M01T011.3
Finish turning16M01T021.3
M02T021.2
M02T031.1
F7End faceRough milling17M03T041.0
M04T051.0
M07T041.1
M07T051.2
M03T041.2
Finish milling18M04T051.1
M07T041.2
M07T051.3
F8M16 ThreadRough milling19M03T042.5
M04T052.6
M07T042.4
Finish milling20M07T052.5
M03T042.6
M04T052.6
M07T042.4
M07T052.4
F9End faceFinish turning21M01T013.2
M01T023.3
M02T023.1
M02T033.2
F10Φ45 Through holeDrilling22M05T062.9
M06T072.8
M07T063.2
M07T073.0
23M05T061.7
M05T071.8
M06T071.6
M07T061.8
M07T071.7
F11Φ35 Through holeRough turning24M01T012.2
M01T022.2
Semi-finish turning25M02T022.0
M01T022.0
M02T022.1
M02T032.0
M01T022.2
M02T032.1
Finish turning26M01T022.2
M01T011.2
M01T011.0
M01T021.2
M02T021.1
F12Φ45 Through holeRough turning27M01T012.2
M01T022.2
M02T022.0
M01T022.0
Finish turning28M02T022.1
M02T032.0
M01T022.2
M02T022.0
Table 7. Comparison of optimization results.
Optimization Results Low-Carbon as the GoalLow-Cost as the GoalLow-Carbon and Low-Cost as the Goal
Carbon emissions/kg5.686.876.15
Cost/CNY35.8433.4234.06
Table 8. Optimal process route.
Processing WorstepsMachine Tool EquipmentFeature Info.ToolFeature Info.
MillingM07F8 M16 ThreadT05Rough milling F8
Rough milling F7
F7 End faceT04Rough milling F7
Rough milling F8
TurningM01F1 End faceT01Rough turning F1
F2 M16 Thread faceRough turning F2
F6 Φ45 Through hole faceRough turning F6
TurningM01F3 End faceT01Rough turning F3
F4 Φ45 Through holeRough turning F4
F5 Φ35 Through holeRough turning F5
Turning M01F3 End faceT02Semi-finish turning F3
F3 End faceFinish turning F3
F4 Φ45 Through holeFinish turning F4
F5 Φ35 Through holeFinish turning F5
TurningM01F1 End faceT03Semi-finish turning F1
F1 M16 ThreadSemi-finish turning F1
F1 End faceFinish turning F1
F2 M16 ThreadFinish turning F2
F9 End faceFinish turning F9
F6 Φ45 Through holeFinish turning F6
DrillingM06F10 Φ45 Through holeT07Drill F10
F11 Φ35 Through holeDrill F11
TappingM06F12 Φ45 Through holeT08Tapping F12
Publisher’s Note: MDPI stays neutral with regard to jurisdictional claims in published maps and institutional affiliations.

