
New Image Recognition Technique for Intuitive Understanding in Class of the Dynamic Response of High-Rise Buildings

 ,
,  , ,
, ,
Abstract
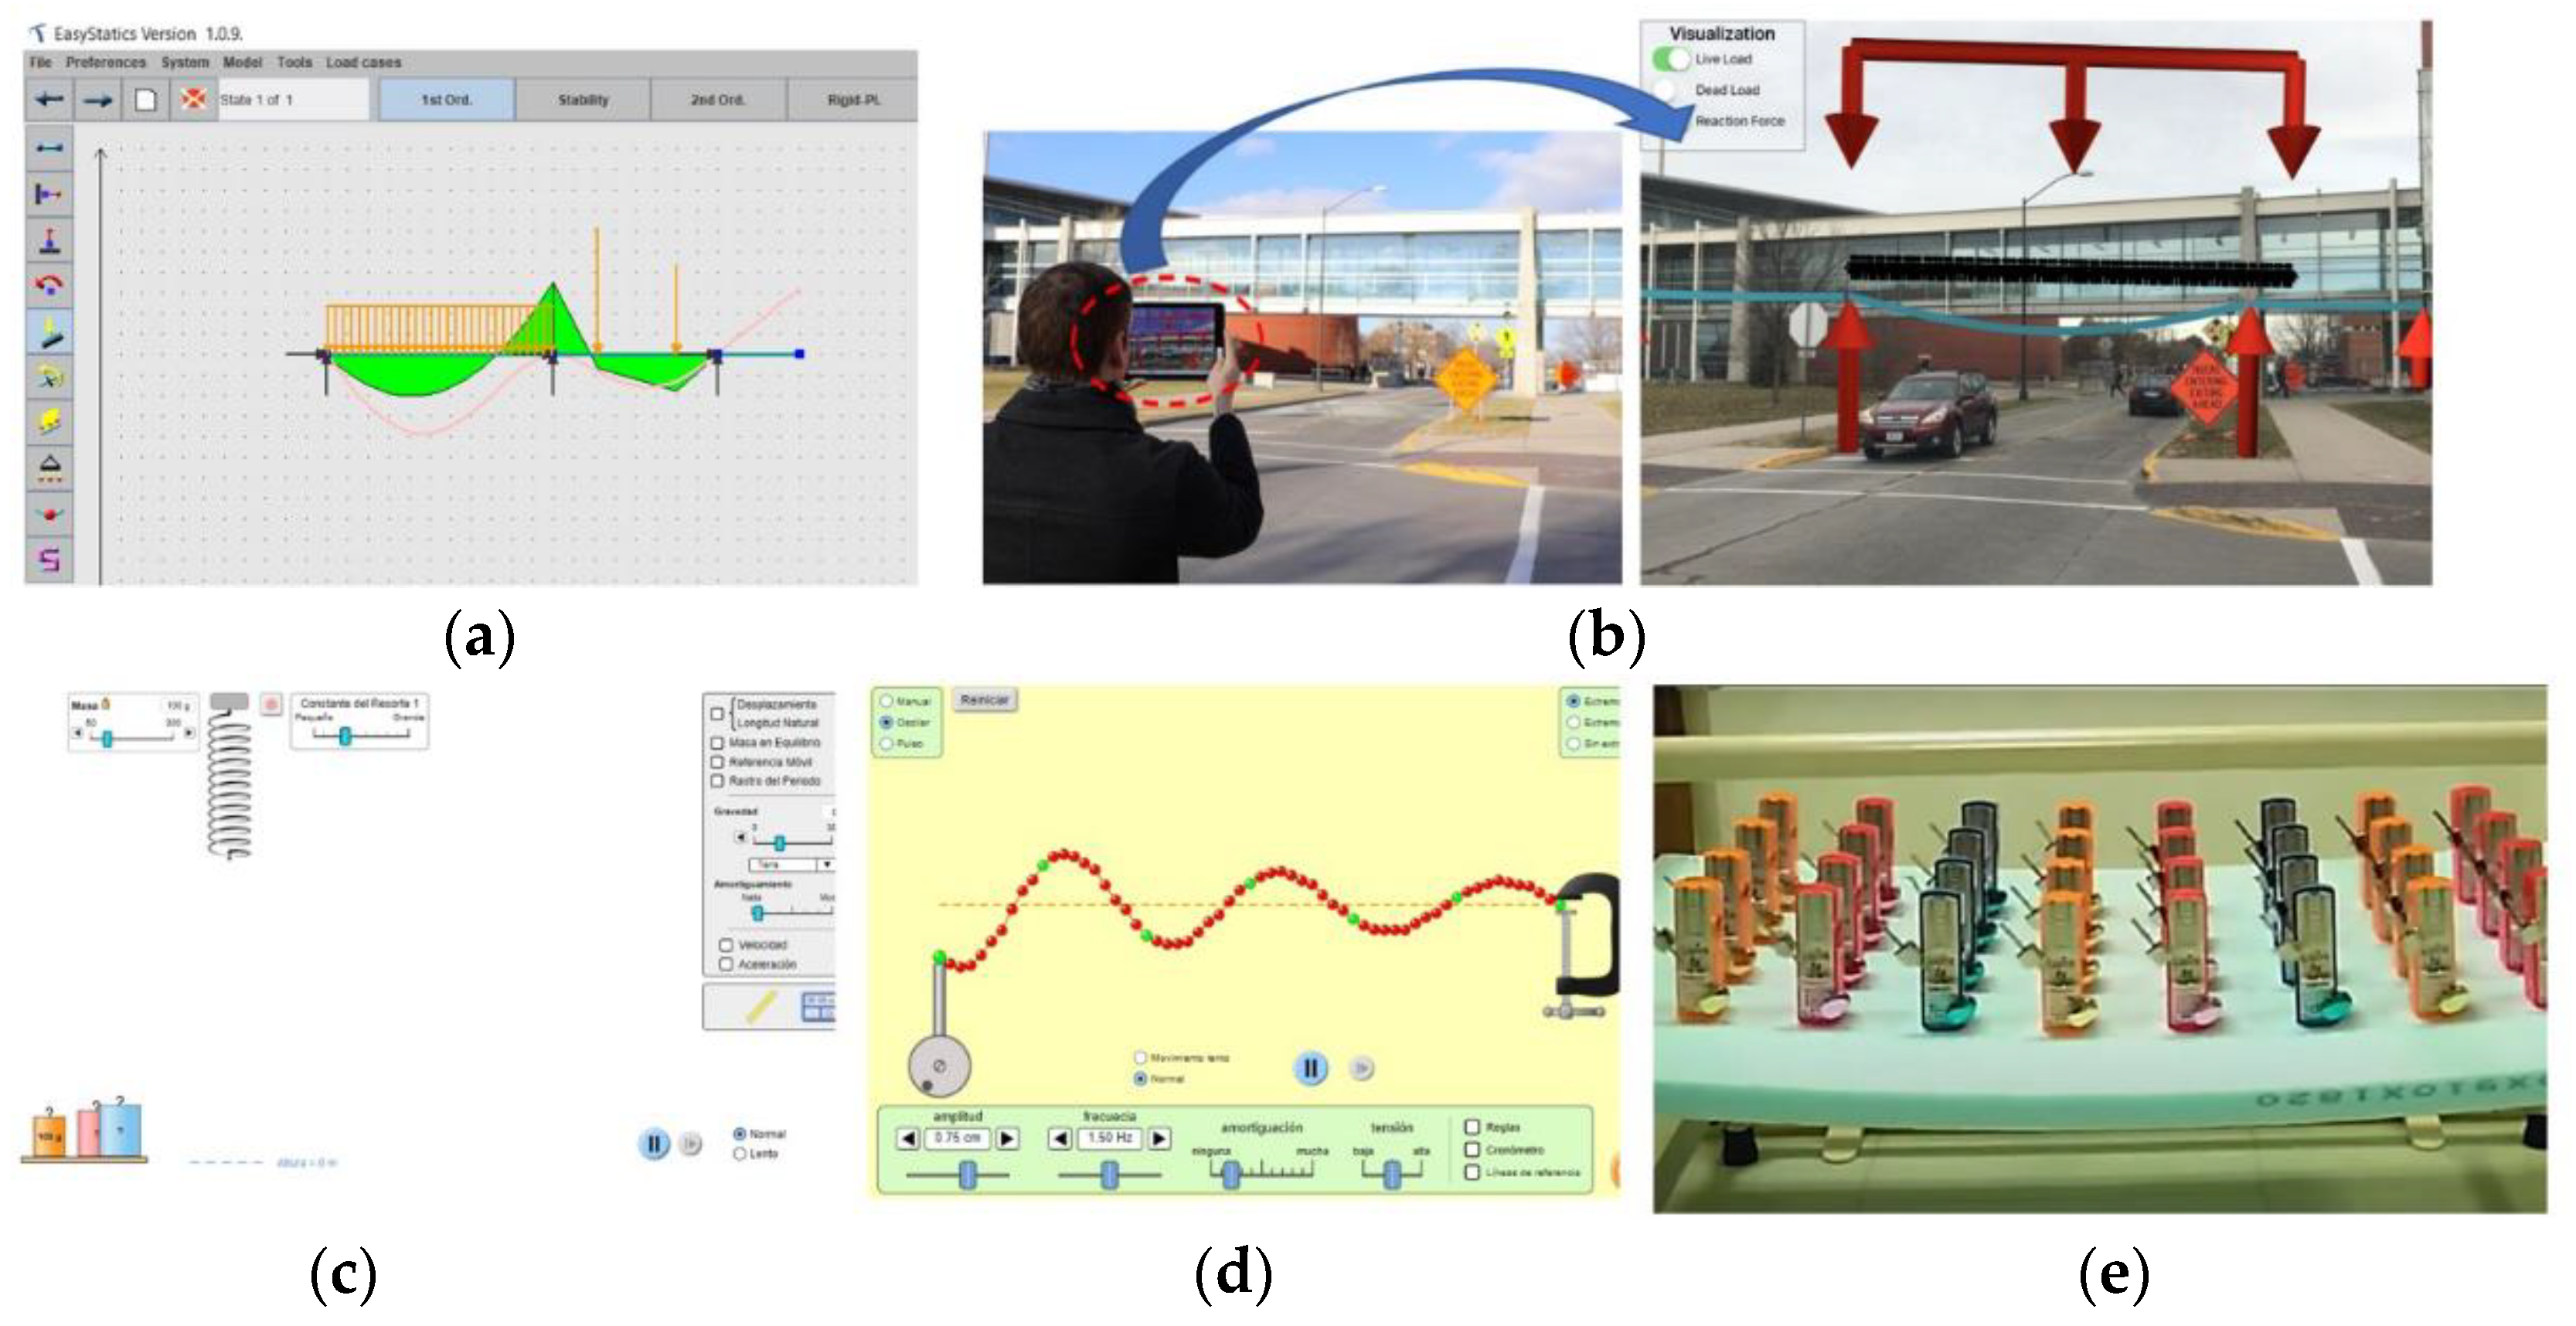
:1. Introduction
2. Simulation of the Dynamic Behavior of Scale Buildings
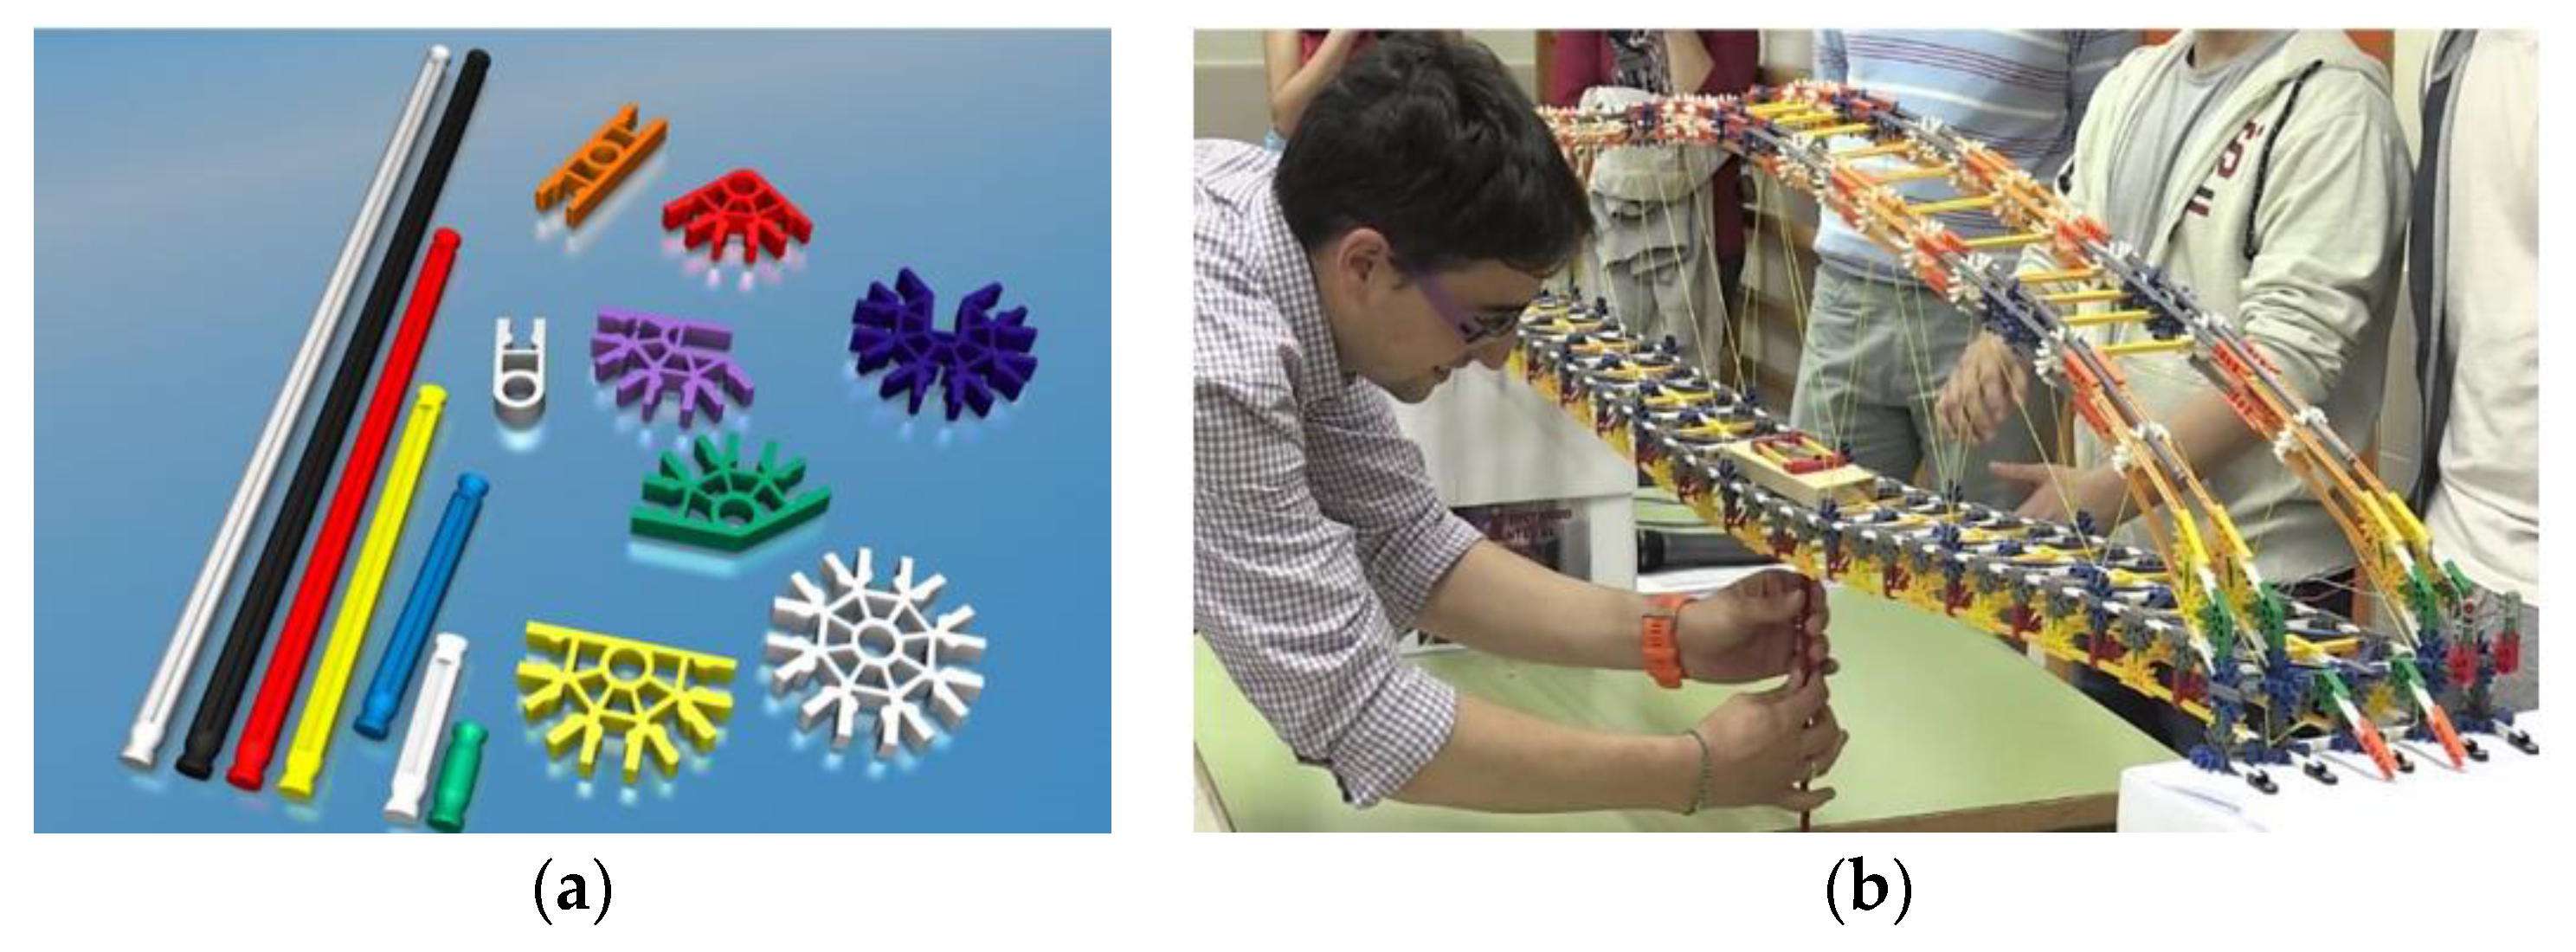
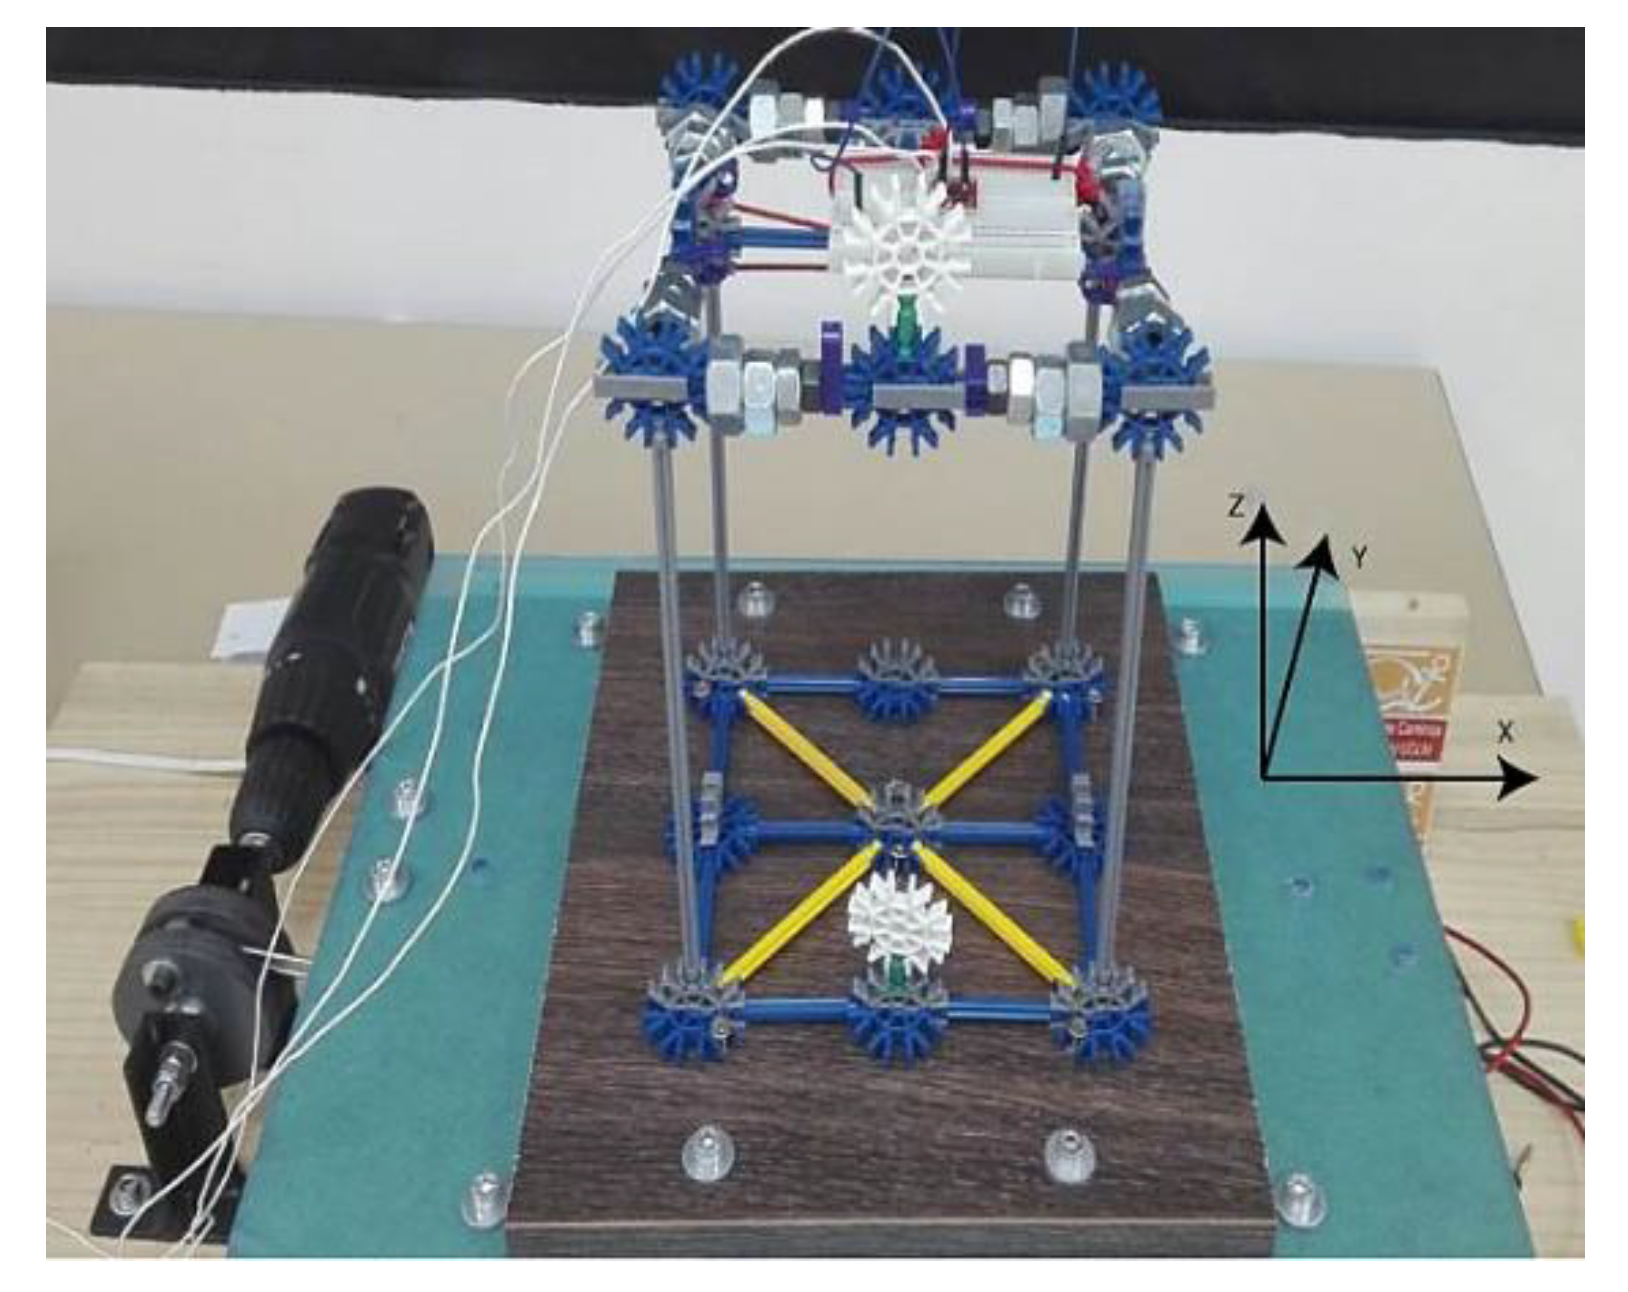
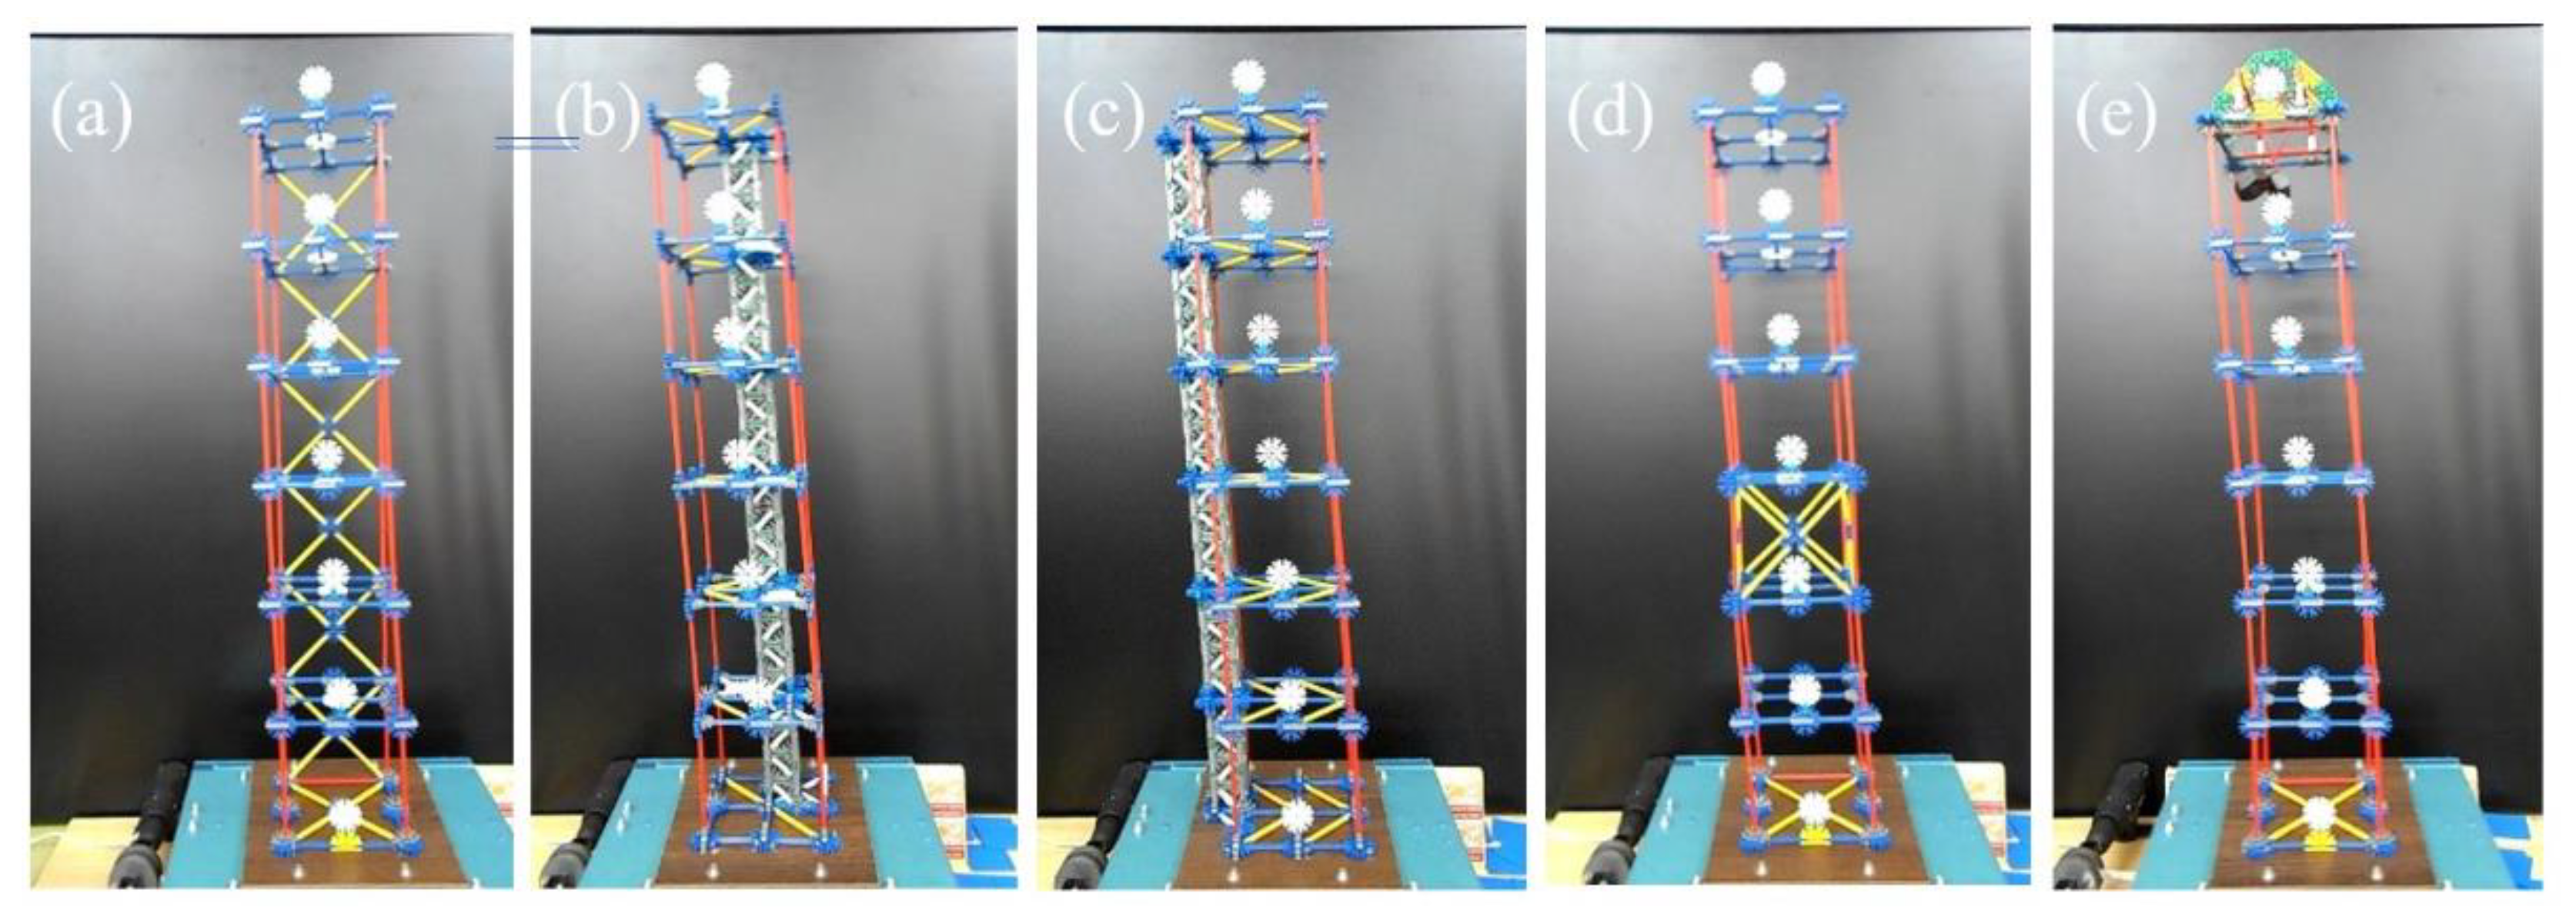
2.1. Structures Made of K’nex
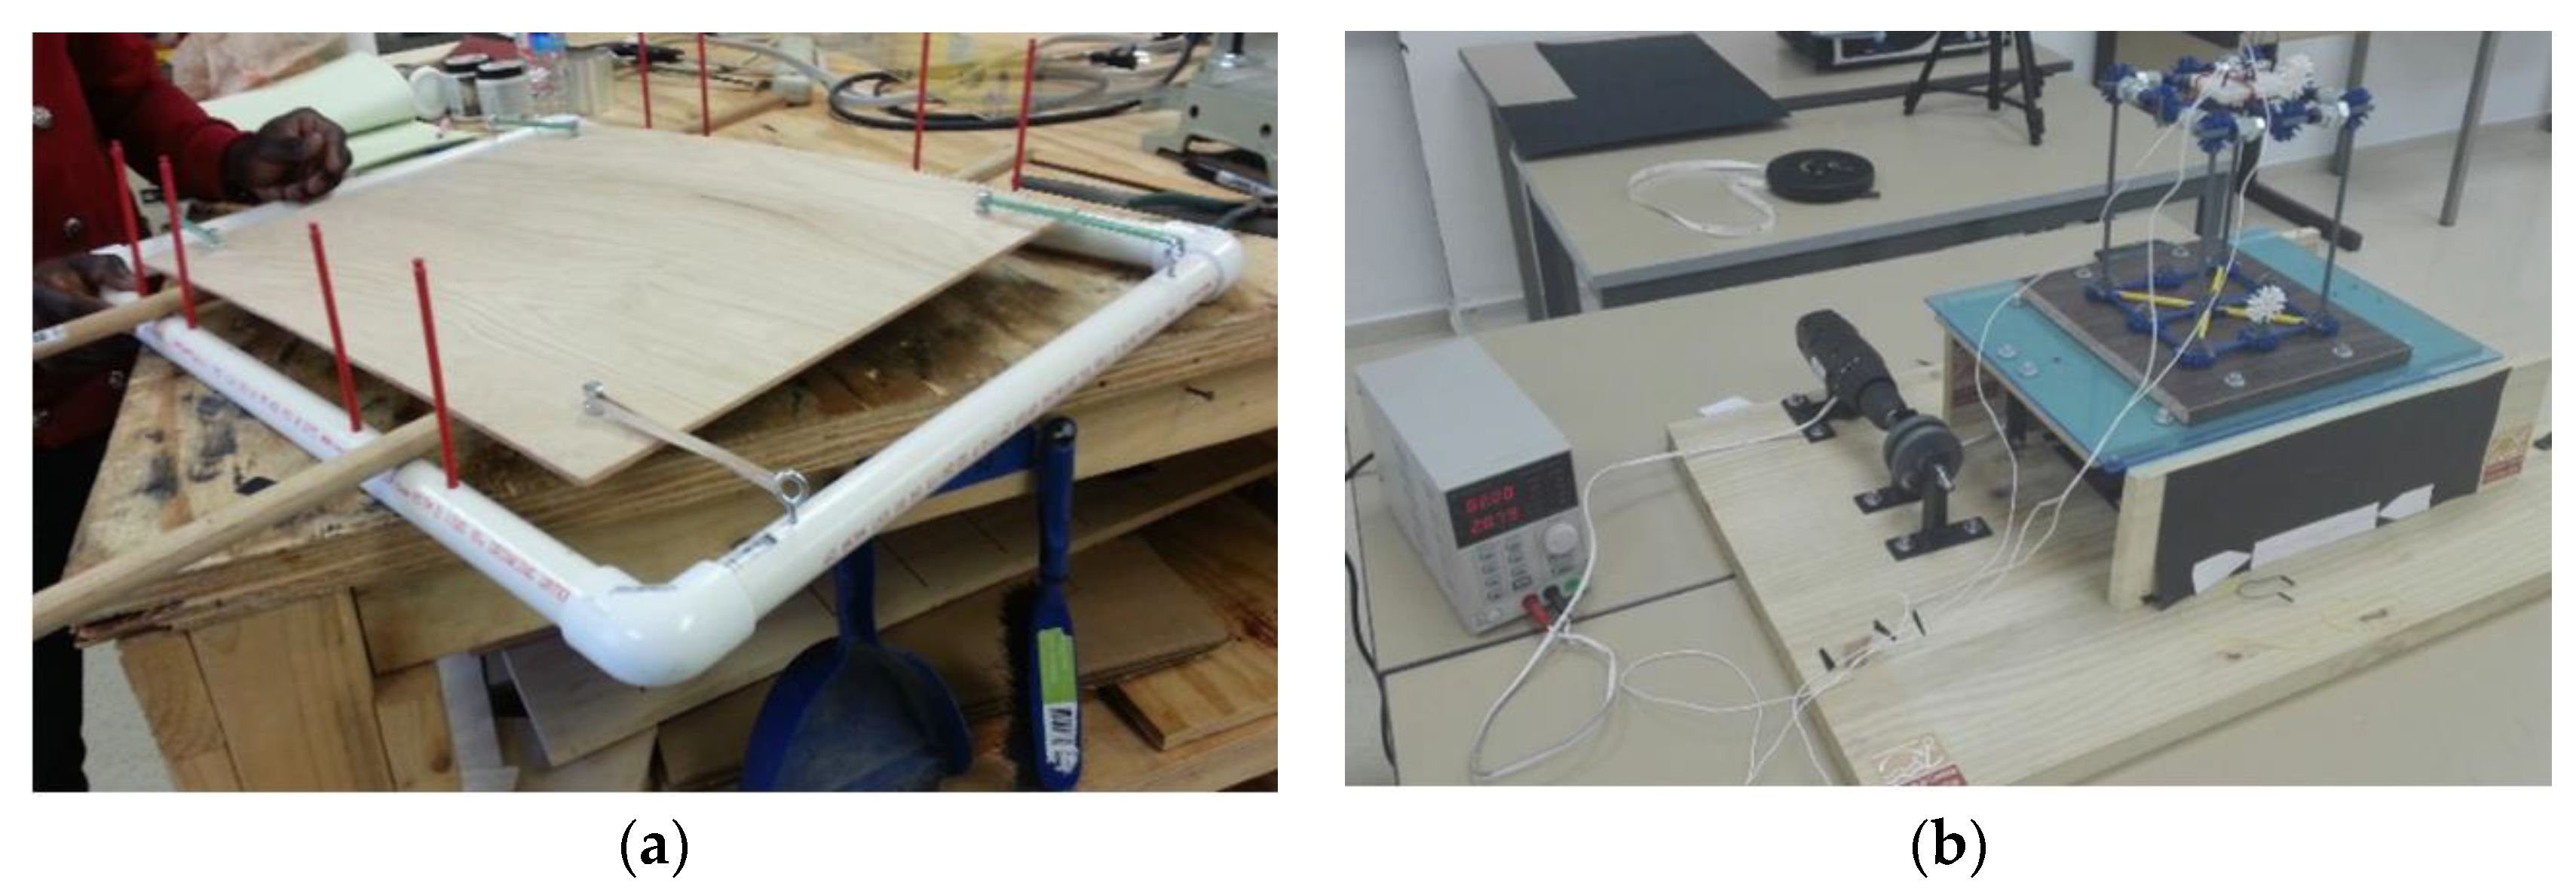
2.2. Shaking Table
3. Characterization of the Dynamic Behavior of Structures with Image-Recognition Techniques
Algorithm for Dynamic Analysis from Image-Recognition Techniques
- Input: A video of at least 10 s where the camera has recorded the movement of the building.
- Outputs: The time-dependent position, speed, and acceleration of each target point (i.e., of each story of the building) obtained from the analysis of each frame of the recorded video.
- Step 0: reading the video and setting the reference values. The recorded video must be read in order to get the number of frames per second (fps) that implies the time increment (∆t) that will be used to derive the speeds and acceleration of each story. For a better application of the image-recognition techniques, the RGB video must be converted to grayscale, eliminating the hue and saturation information while retaining the luminance. It is also necessary to set the number of seconds (n_sec) to analyze the building movement and the length (L) of the graphical scale so the transformation from pixels to centimeters can be carried out.
- Step 1: building characterization. Using the first frame of the video, some information of the building is collected to better perform each image analysis. In particular,
- Step 1.1: determining the color of the target spot. To obtain a good threshold value for Step 2, pick some samples of color (5–10) of one of the target spots located at the stories. This sample is stored in ref_color.
- Step 1.2: determining the radius of the target spot. Using the frame, measure (in pixels) the radius (rt) of the target spot.
- Step 1.3: determining the number and height of each building story. Using the frame, determine a preliminary (z_s^0) position, the height (h_s) of each story (s) from a total of number of stories(n_s).
- Step 1.4: determining scale factor. Using the frame, determine the length (L_p) in pixels of the graphical scale and obtain the scale factor to transform pixels into centimeters as sf = L/L_p. Set the number of analyzed frames equal to 1, i.e., f = 1. and go to Step 2.
- Step 2: image thresholding. Using the histogram of frame f and ref_color, threshold the image so that the colors in ref_color go to white and the rest go to black. Compute and fill connected components in order to better identify the target spots in white. Go to Step 3.
- Step 3: image binarizing. Binarize the image obtained in Step 2 so that pixels in white take a value of 1 and 0 otherwise. Set s = 1 and go to Step 4.
- Step 4: calculating the position of each target point. We assume that the position of the target point of the story, s, is the center point (x_s, z_s), of the circle of radius rt (defined in Step 1.2), which maximizes the number of ones inside of it. For that, the algorithm moves a dummy circle looking for this maximum in a searching band defined as showed in Figure 6. Since the obtained center point has its coordinates in pixels, the scale factor, sf, must be used to transform pixels into centimeters and stored them in the results matrix. If s < ns, do s = s + 1 and repeat Step 4. If s = ns another frame must be analyzed if possible. Then, if f < n_sec xfps, do f = f + 1 and go to Step 2. Otherwise go to Step 5.
- Step 5: getting the results. Once all the desired frames are analyzed the results matrix is used to derive the movement of the building target points, their maximum displacements, their velocities, and their accelerations.
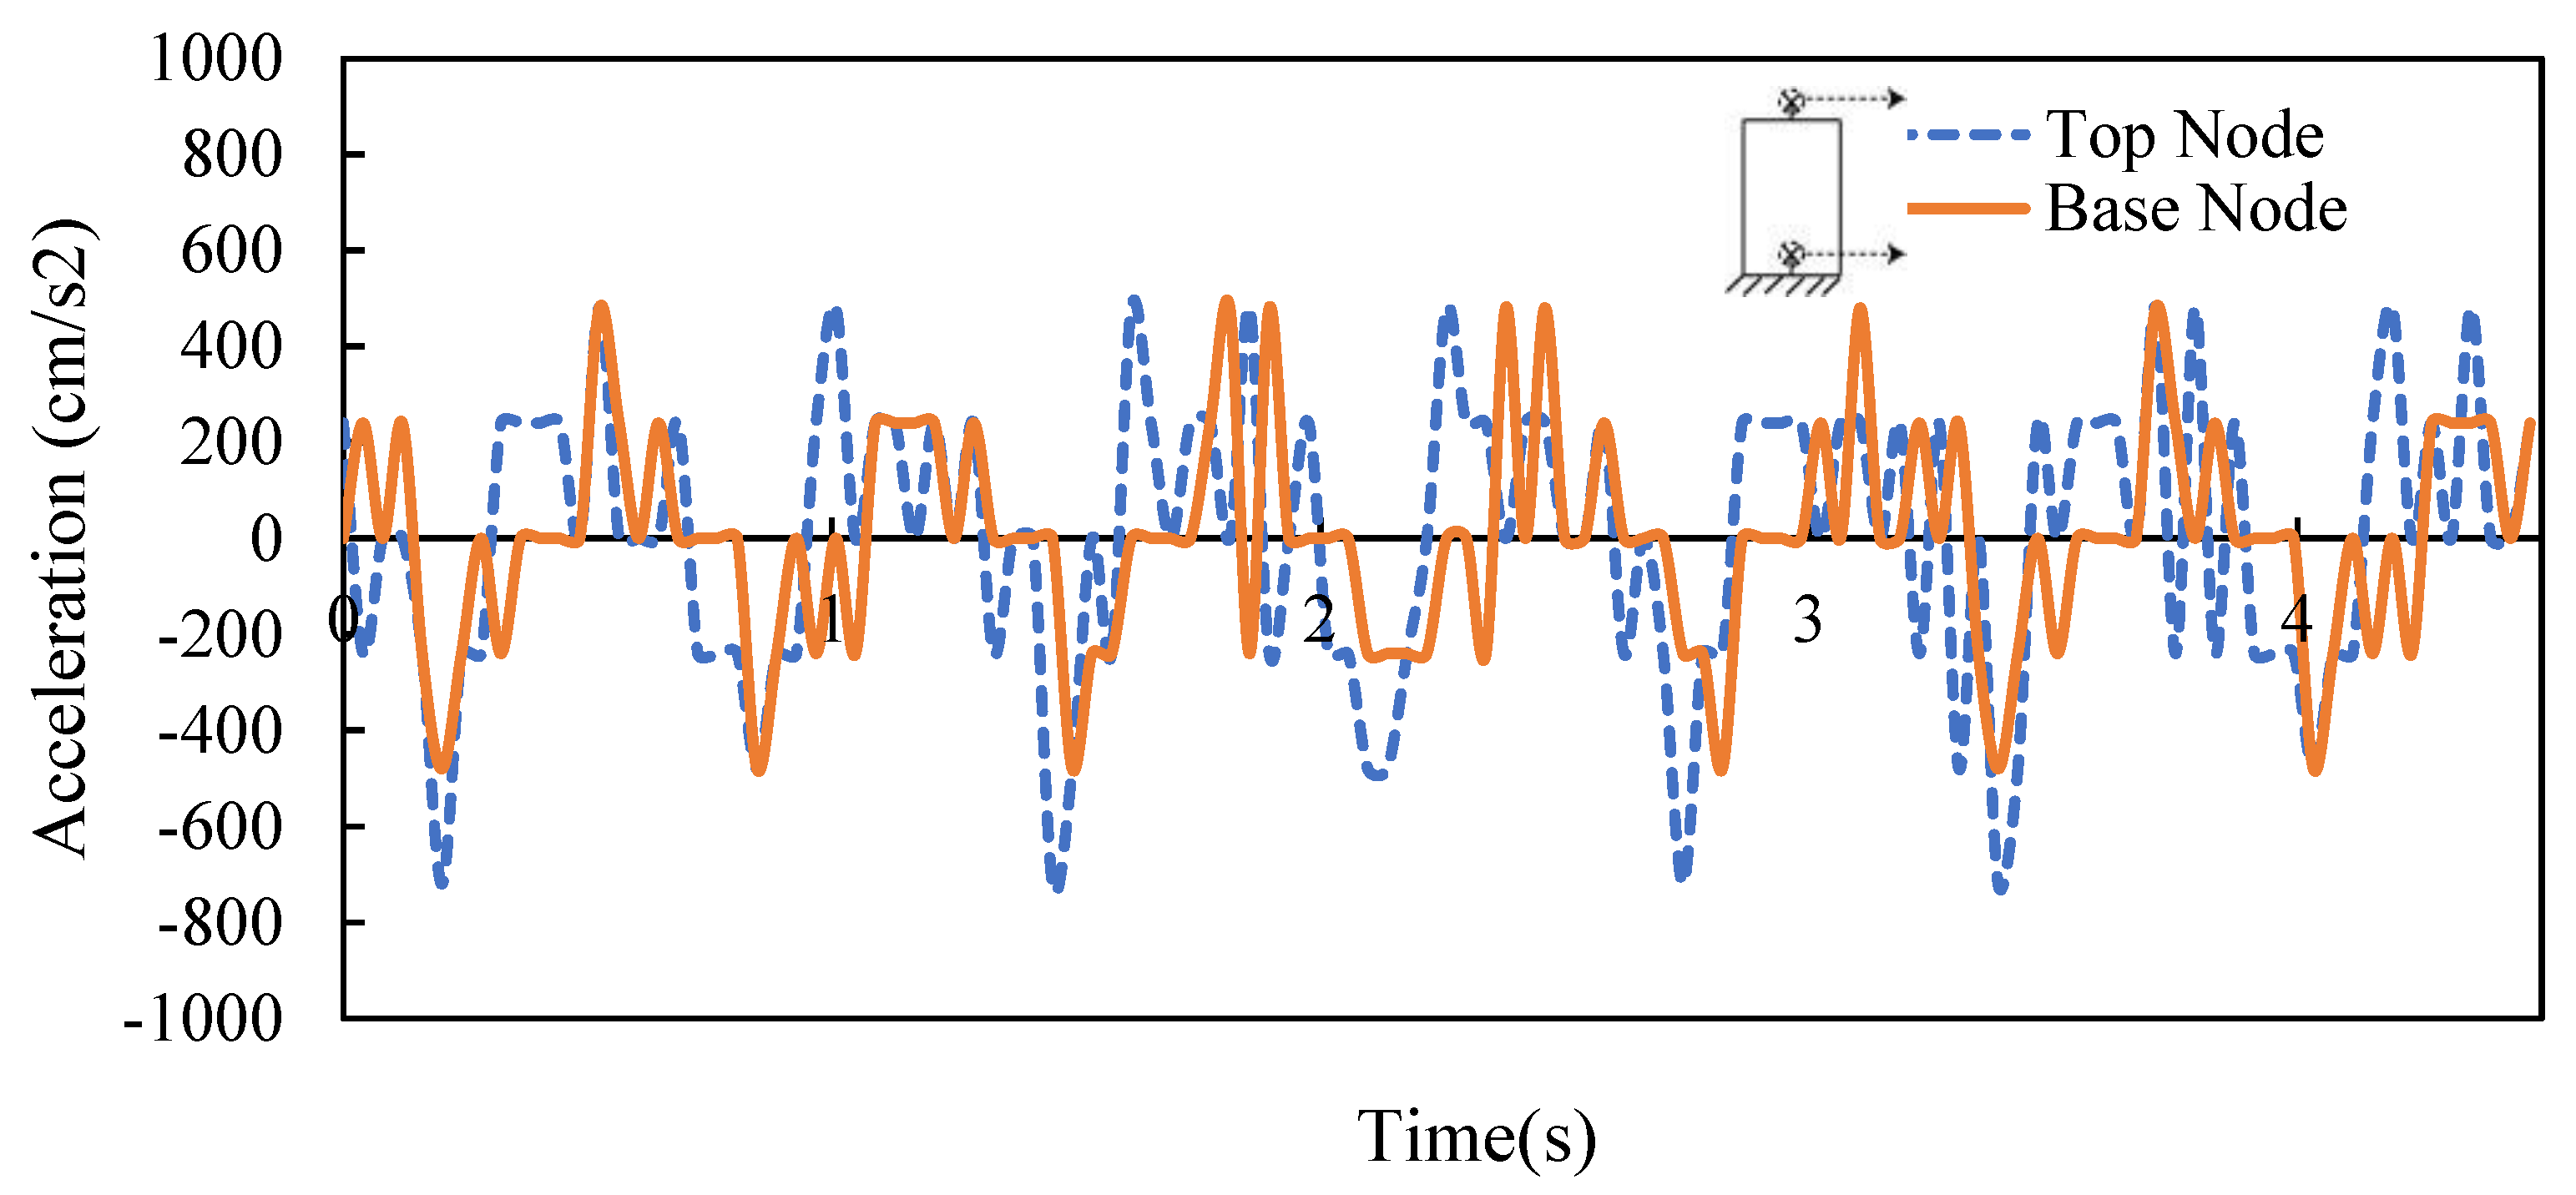
4. Validation of the Developed Algorithm
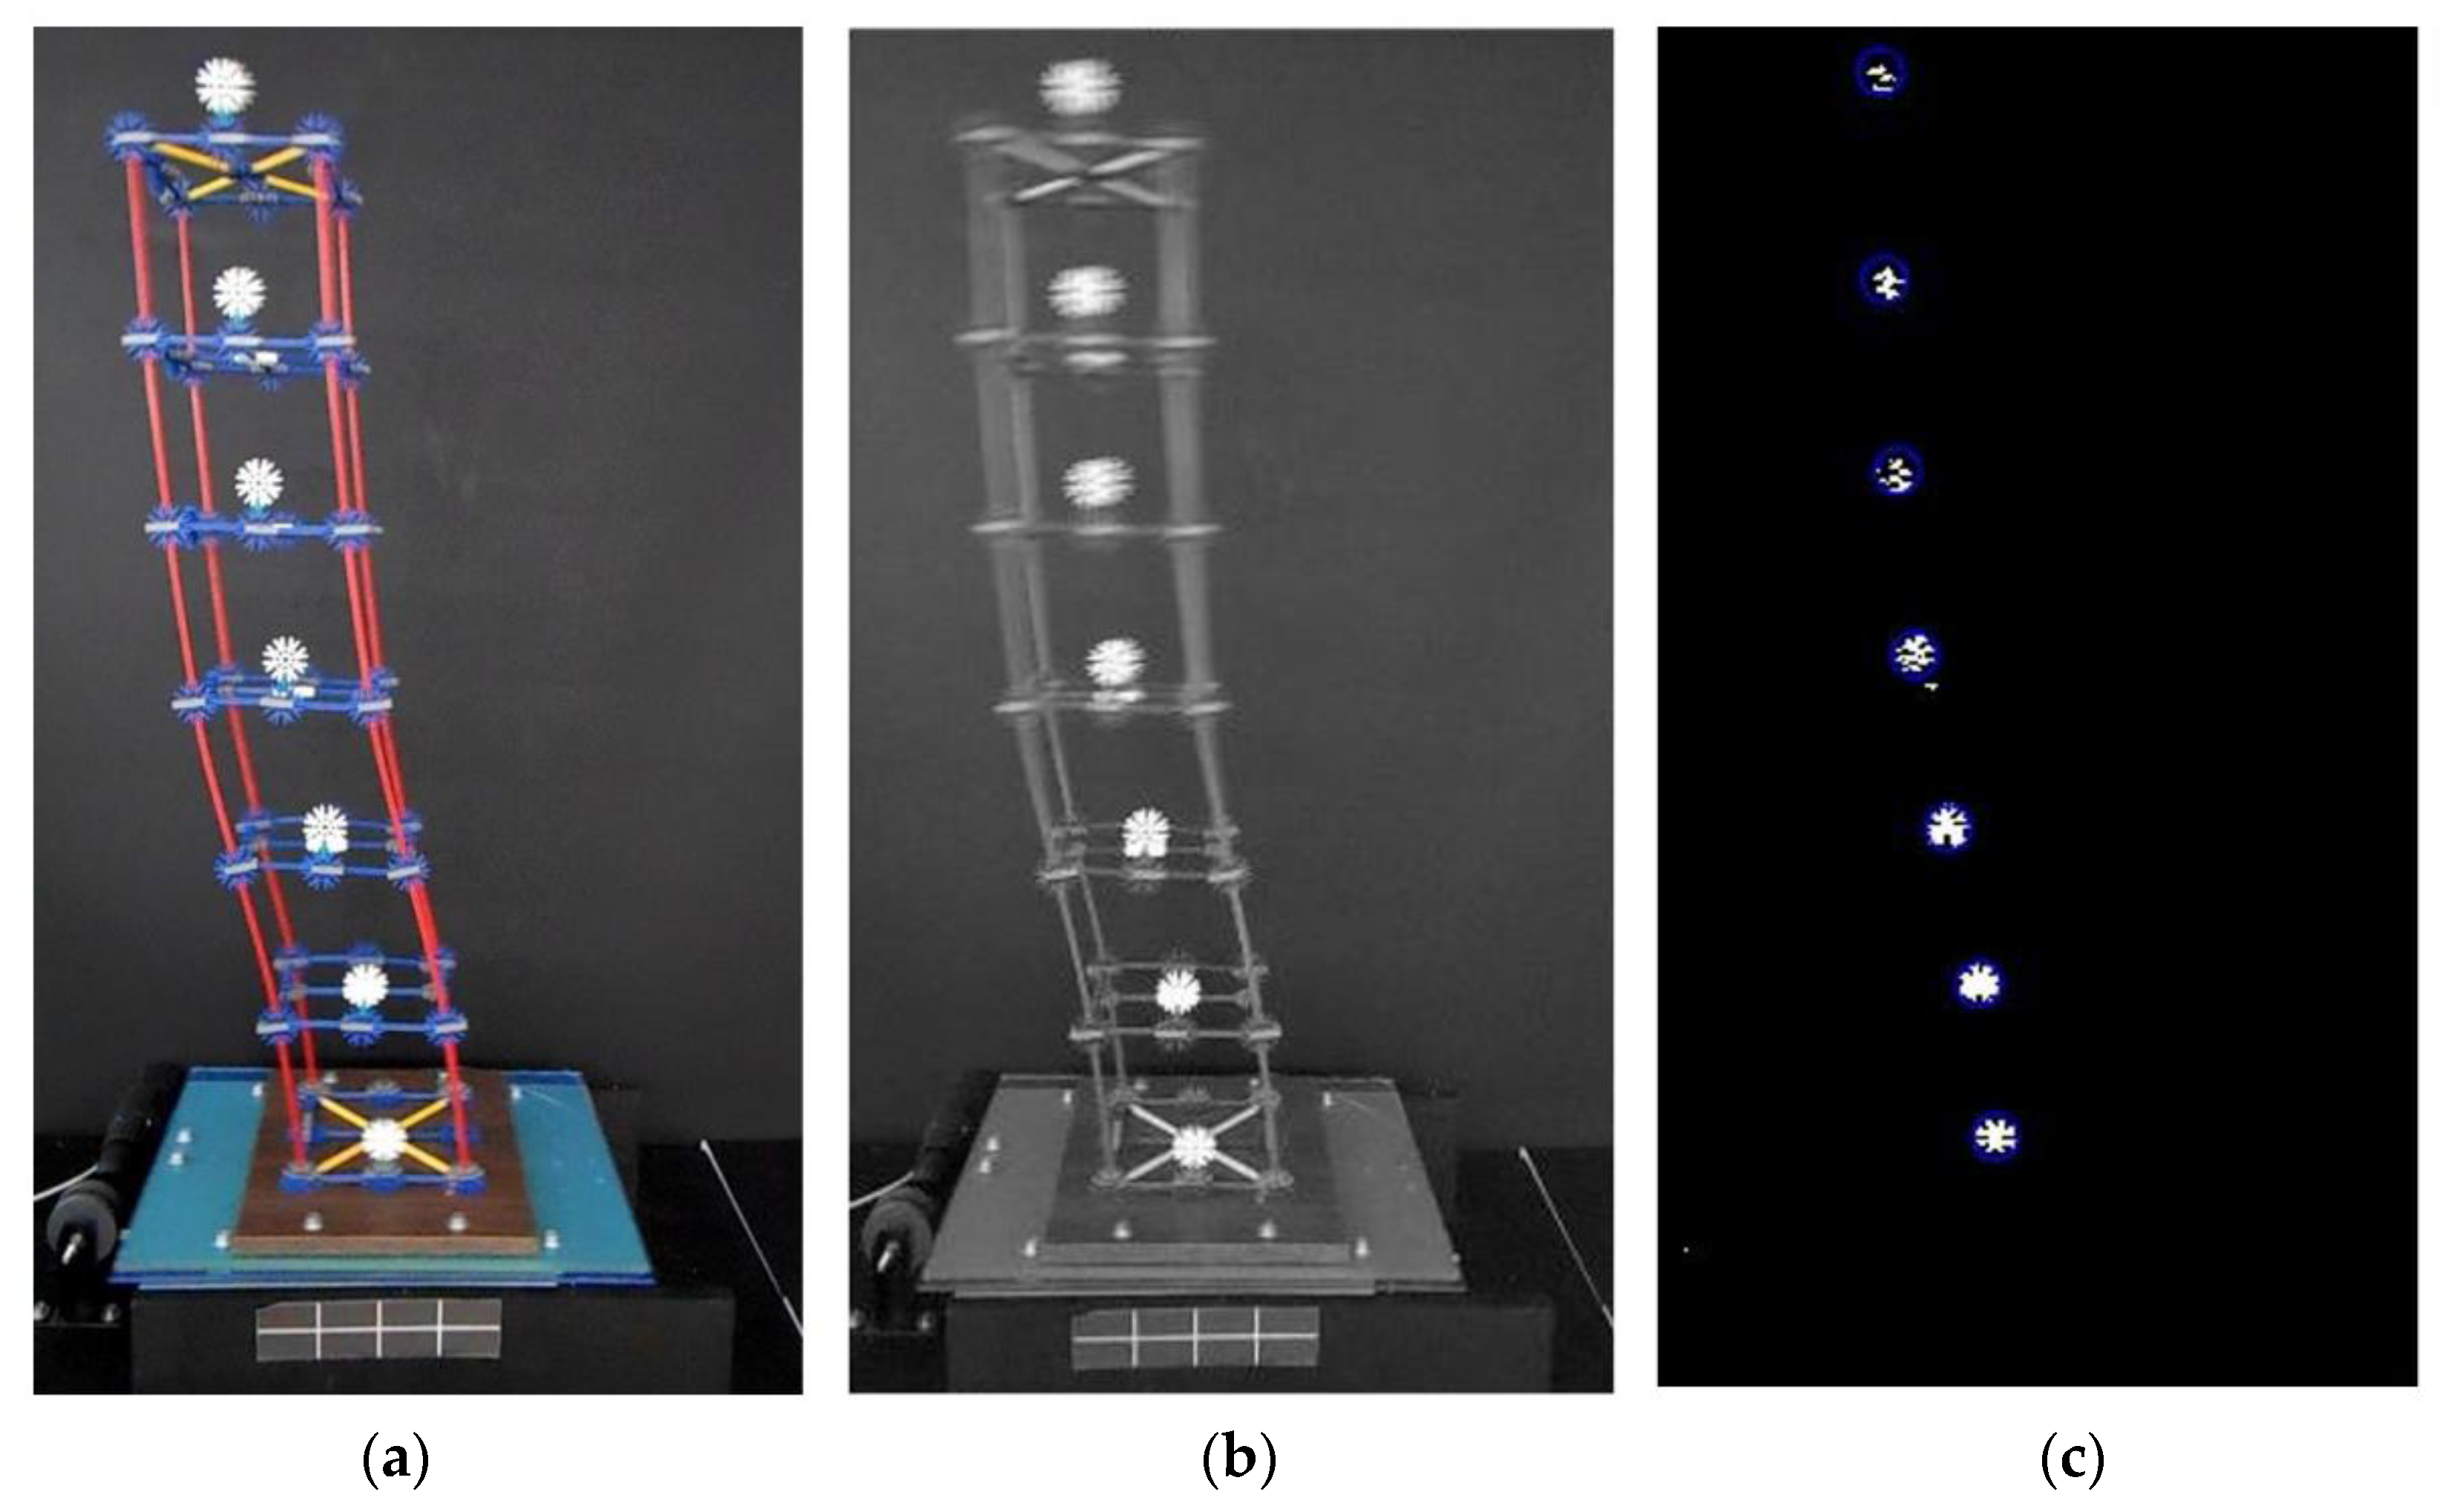
4.1. Application of the Image-Recognition Algorithm
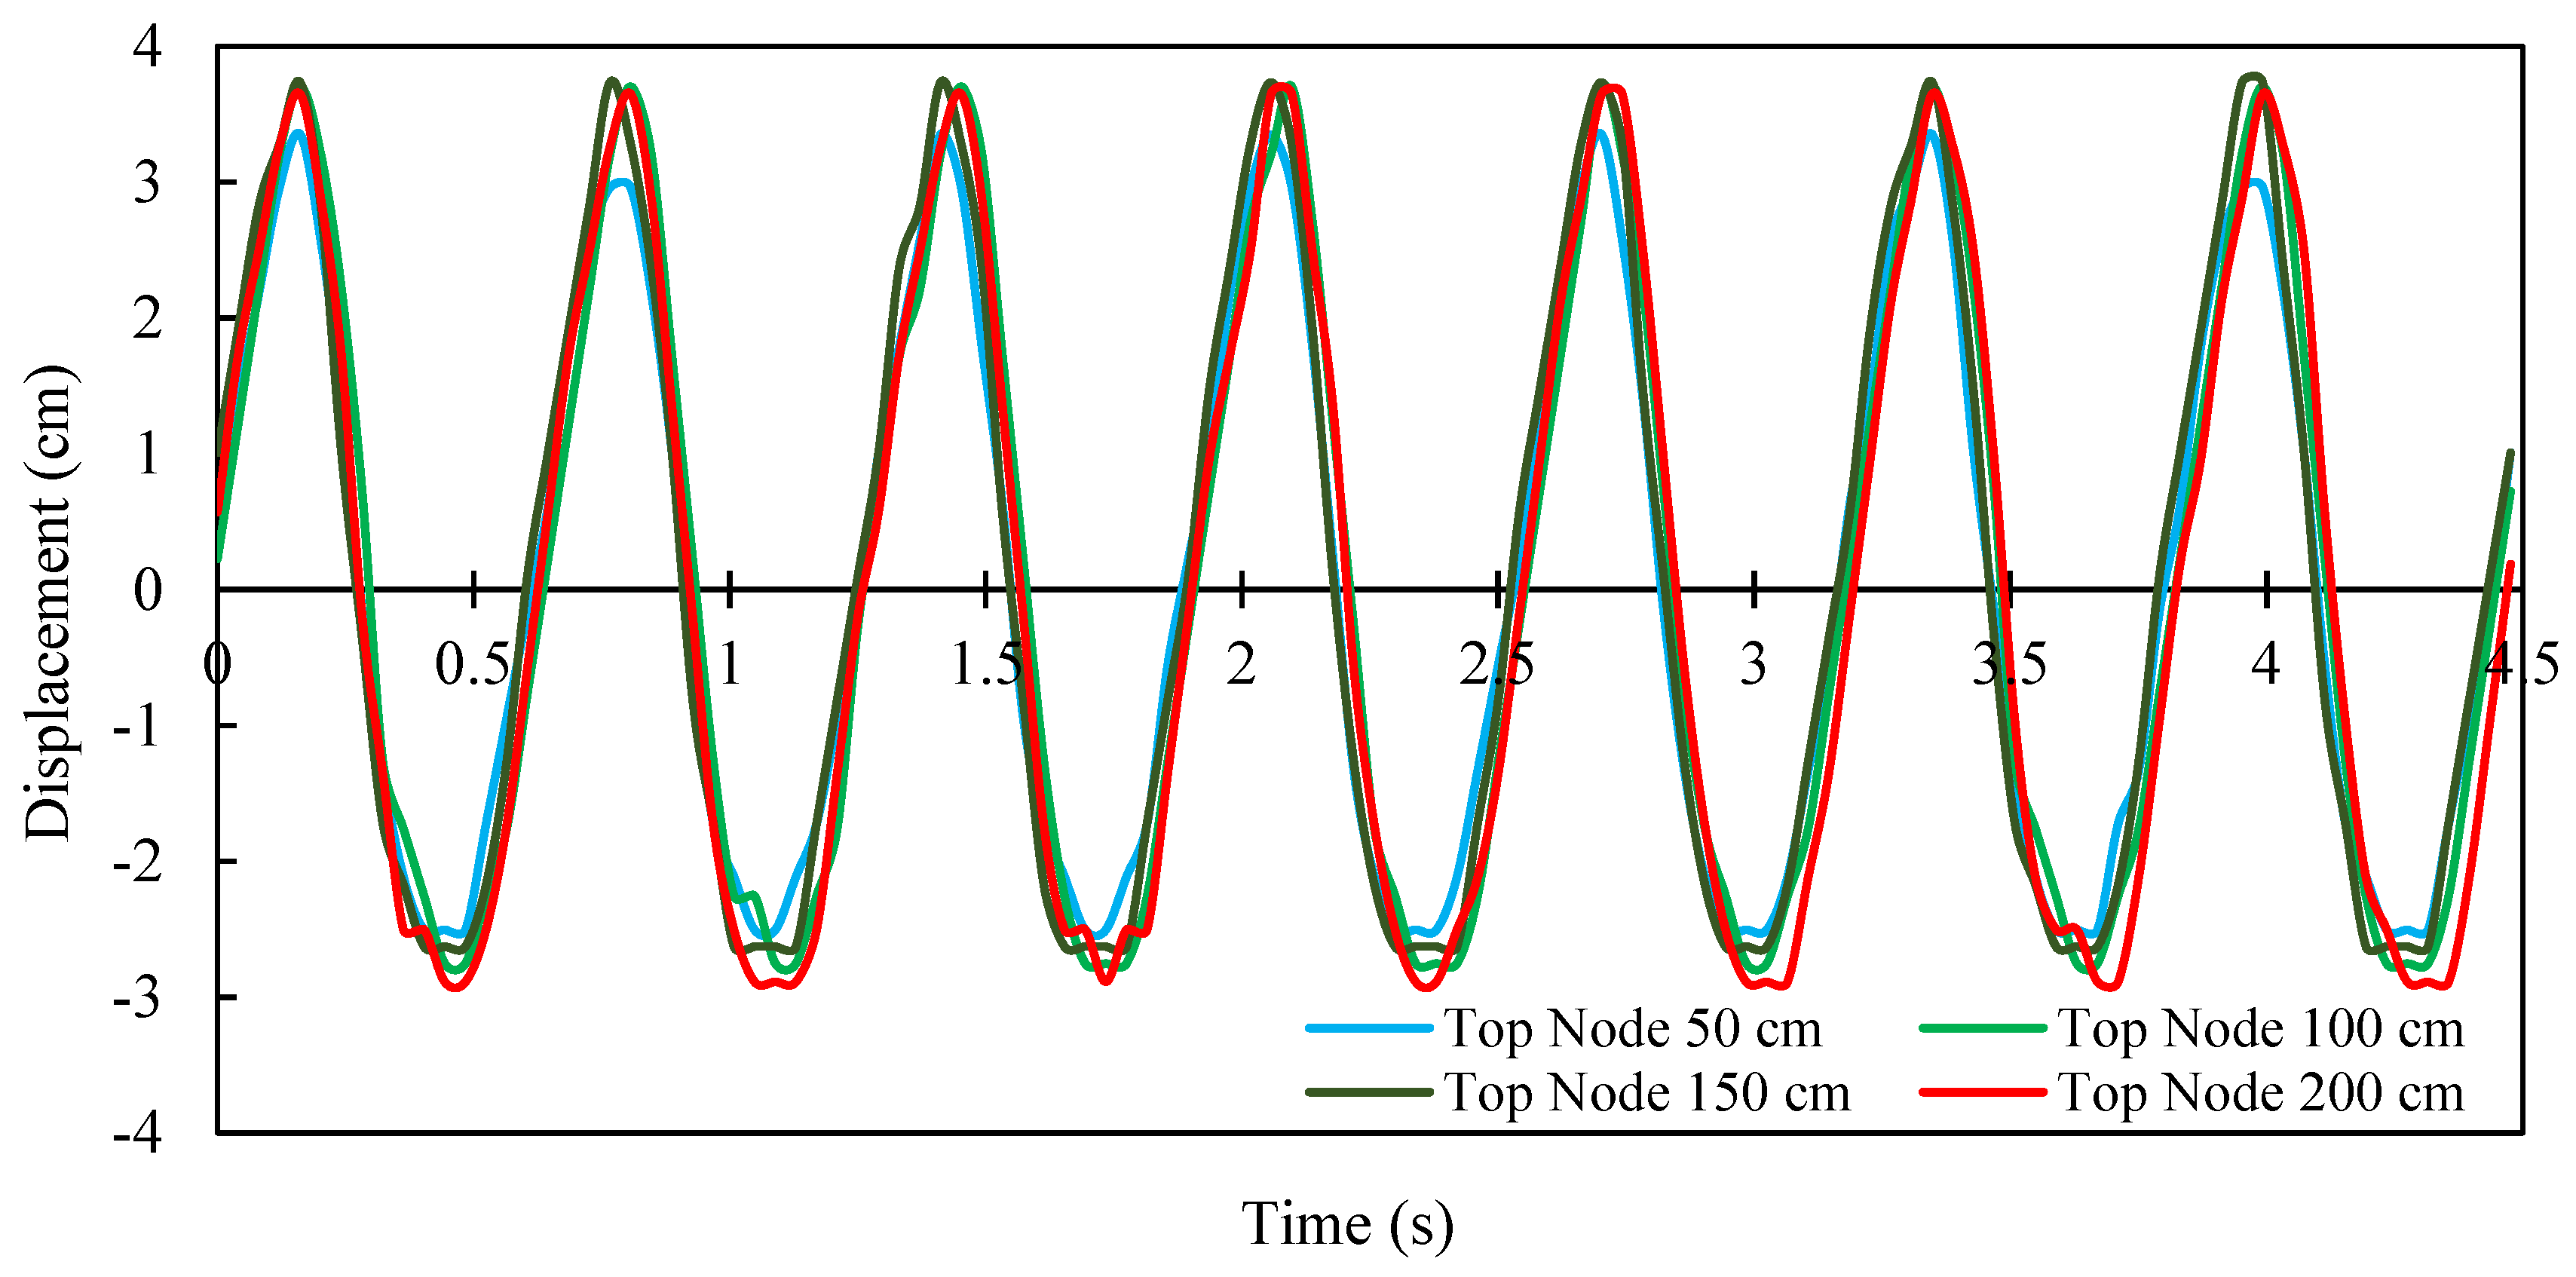
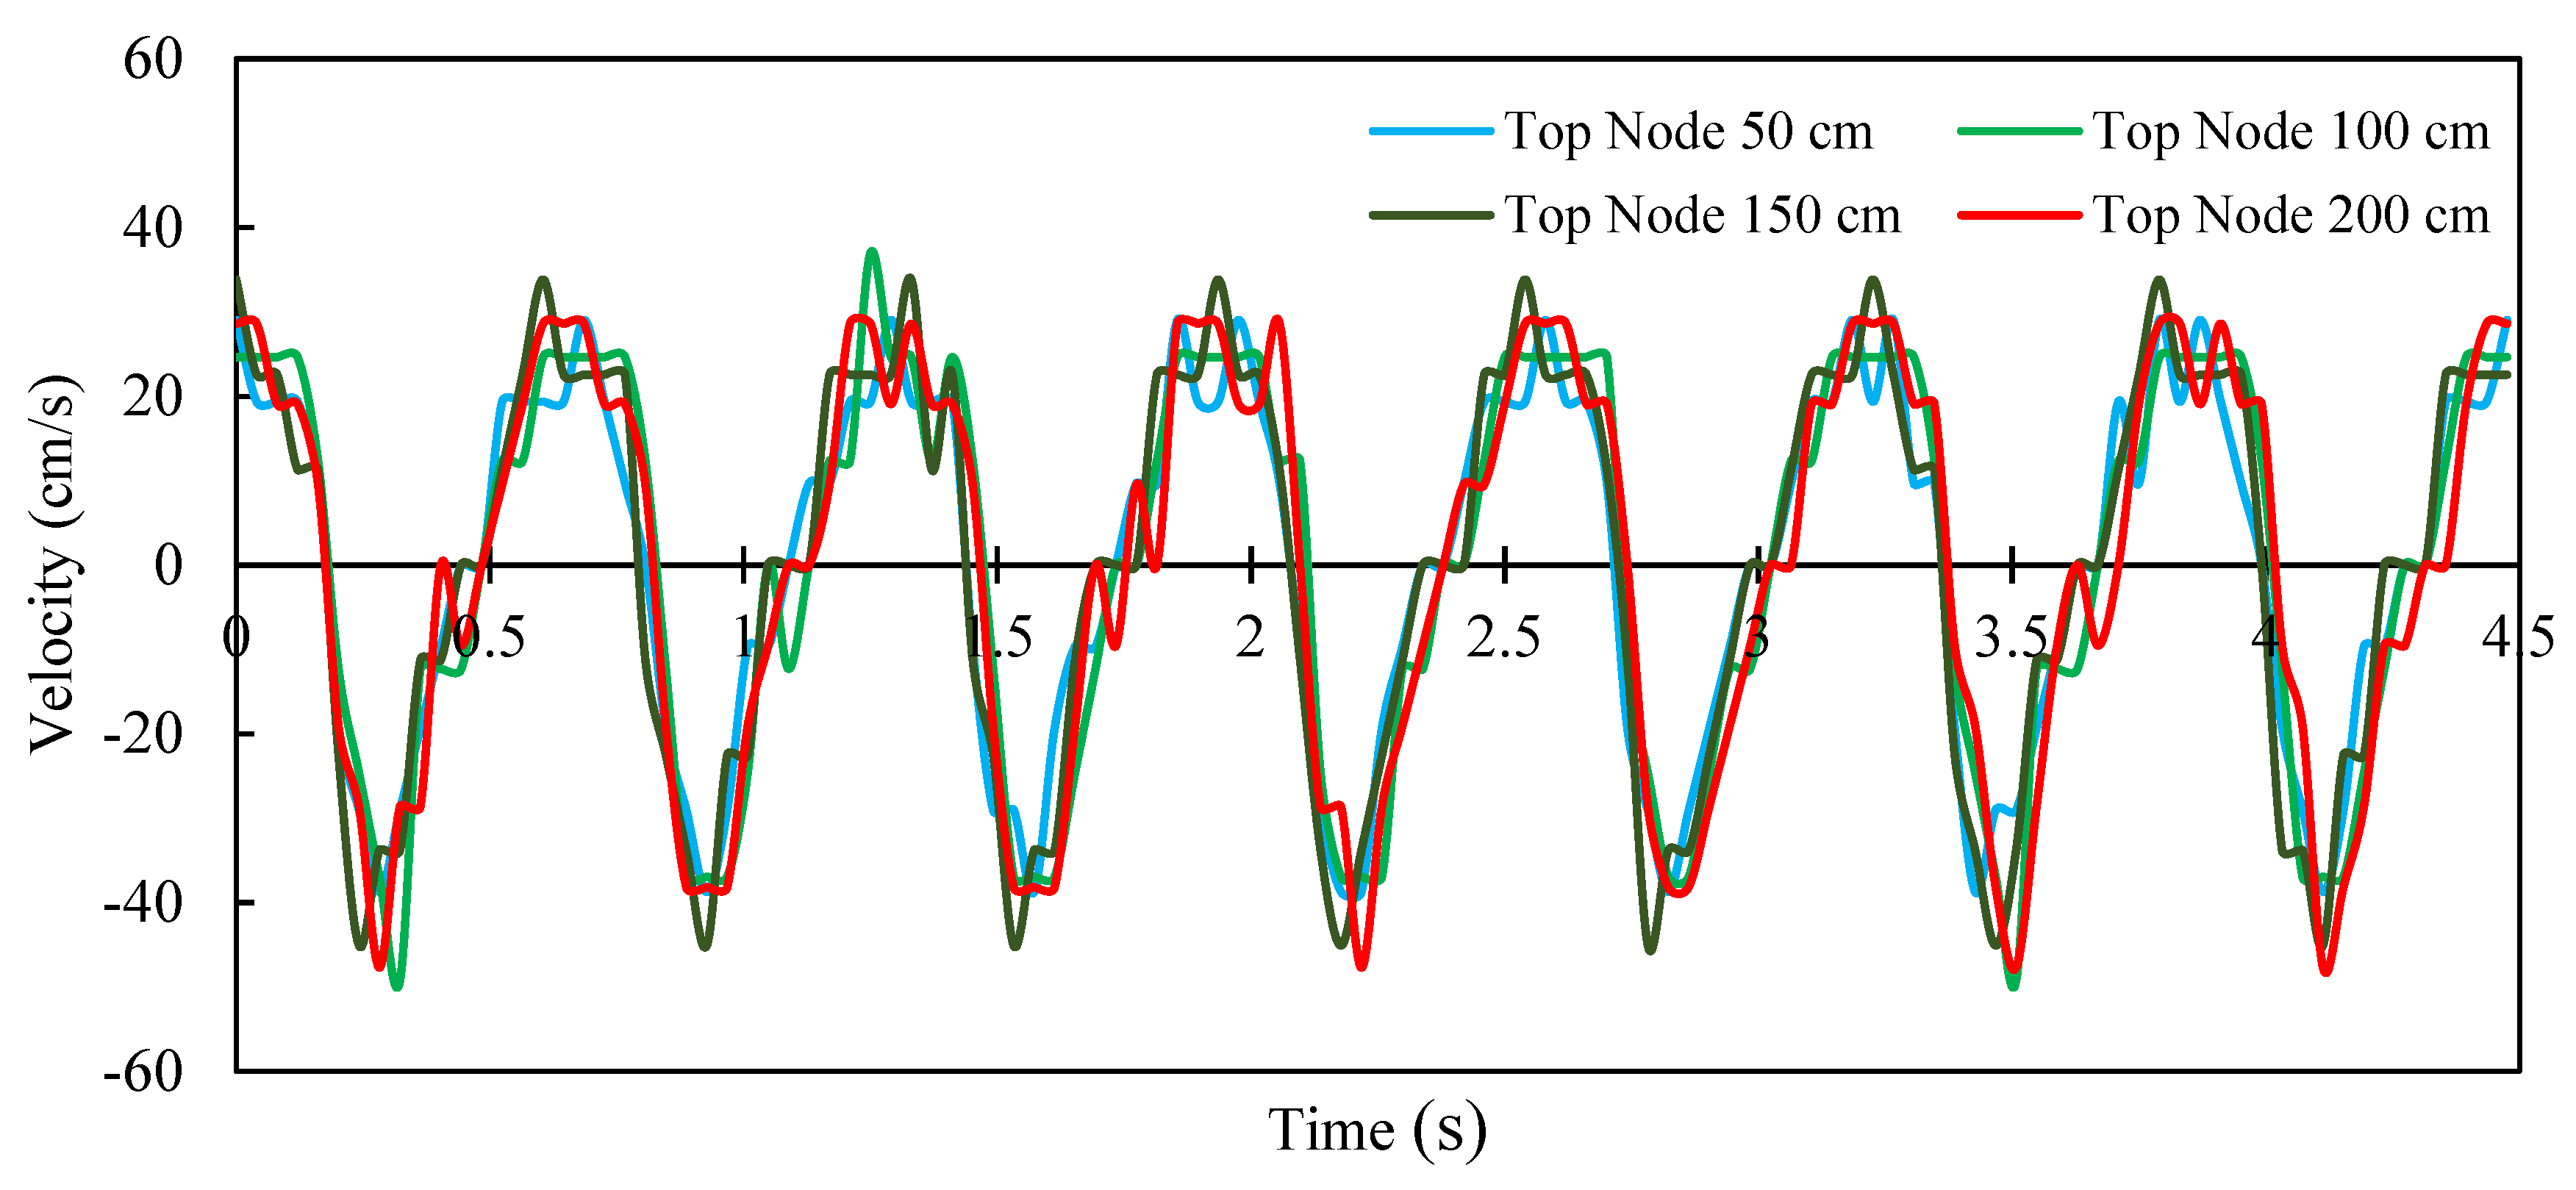
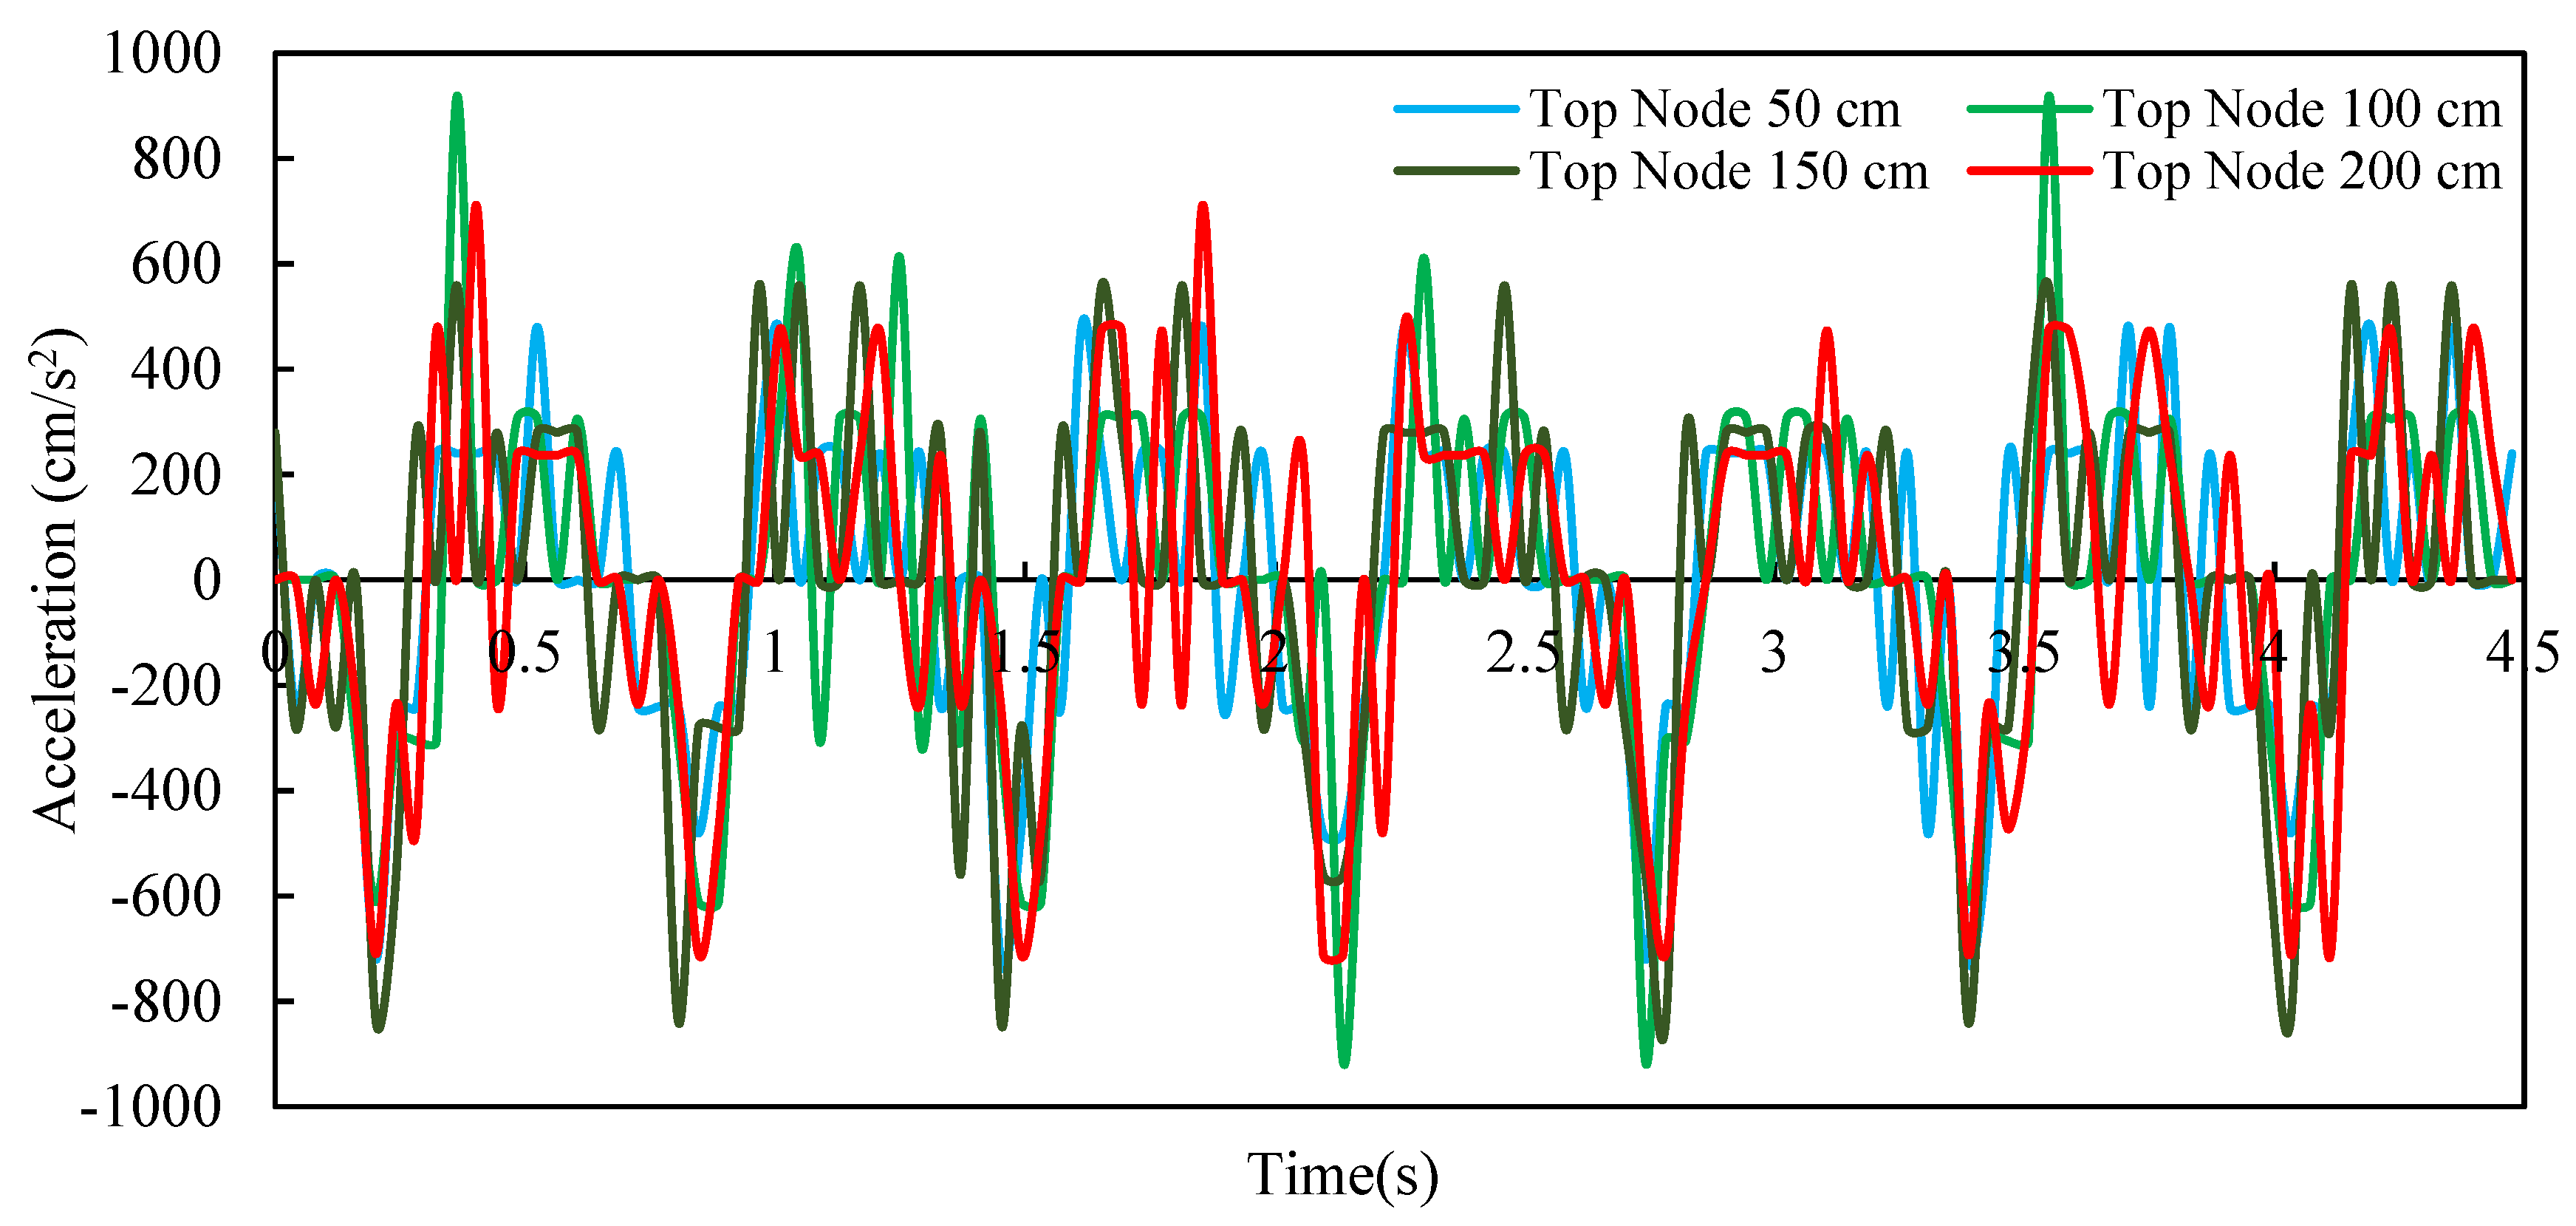
4.2. Parametric Analysis of the Camera Location
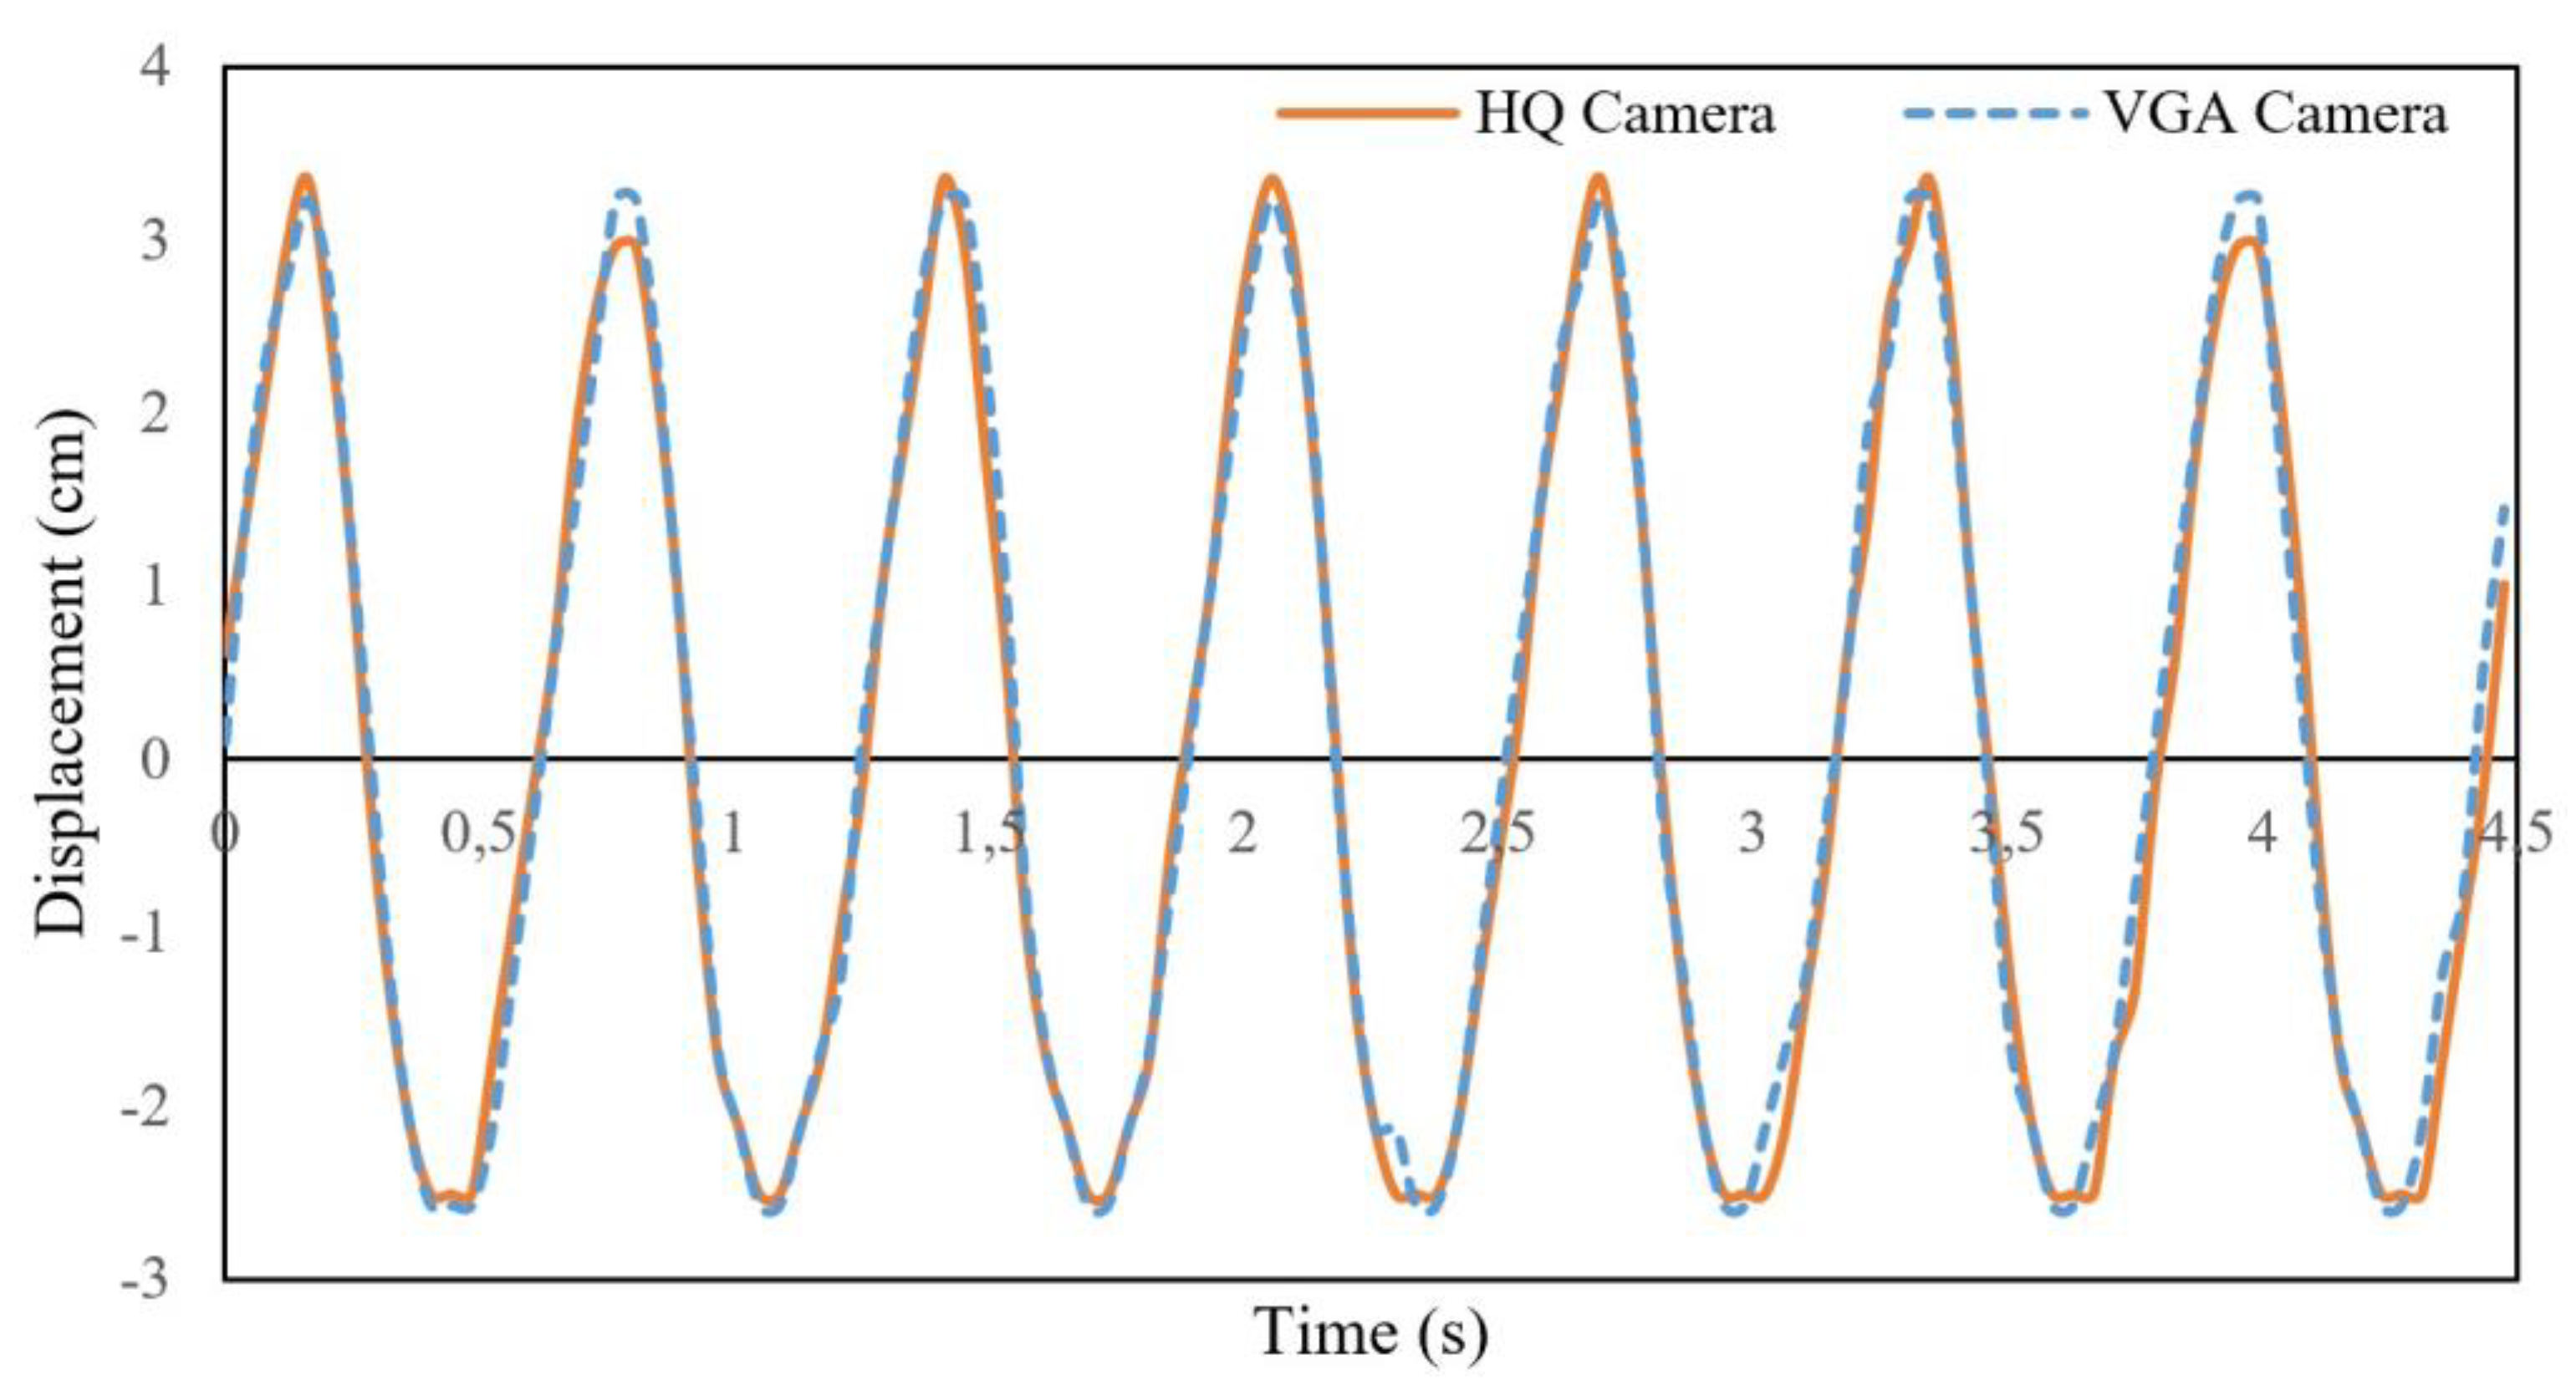
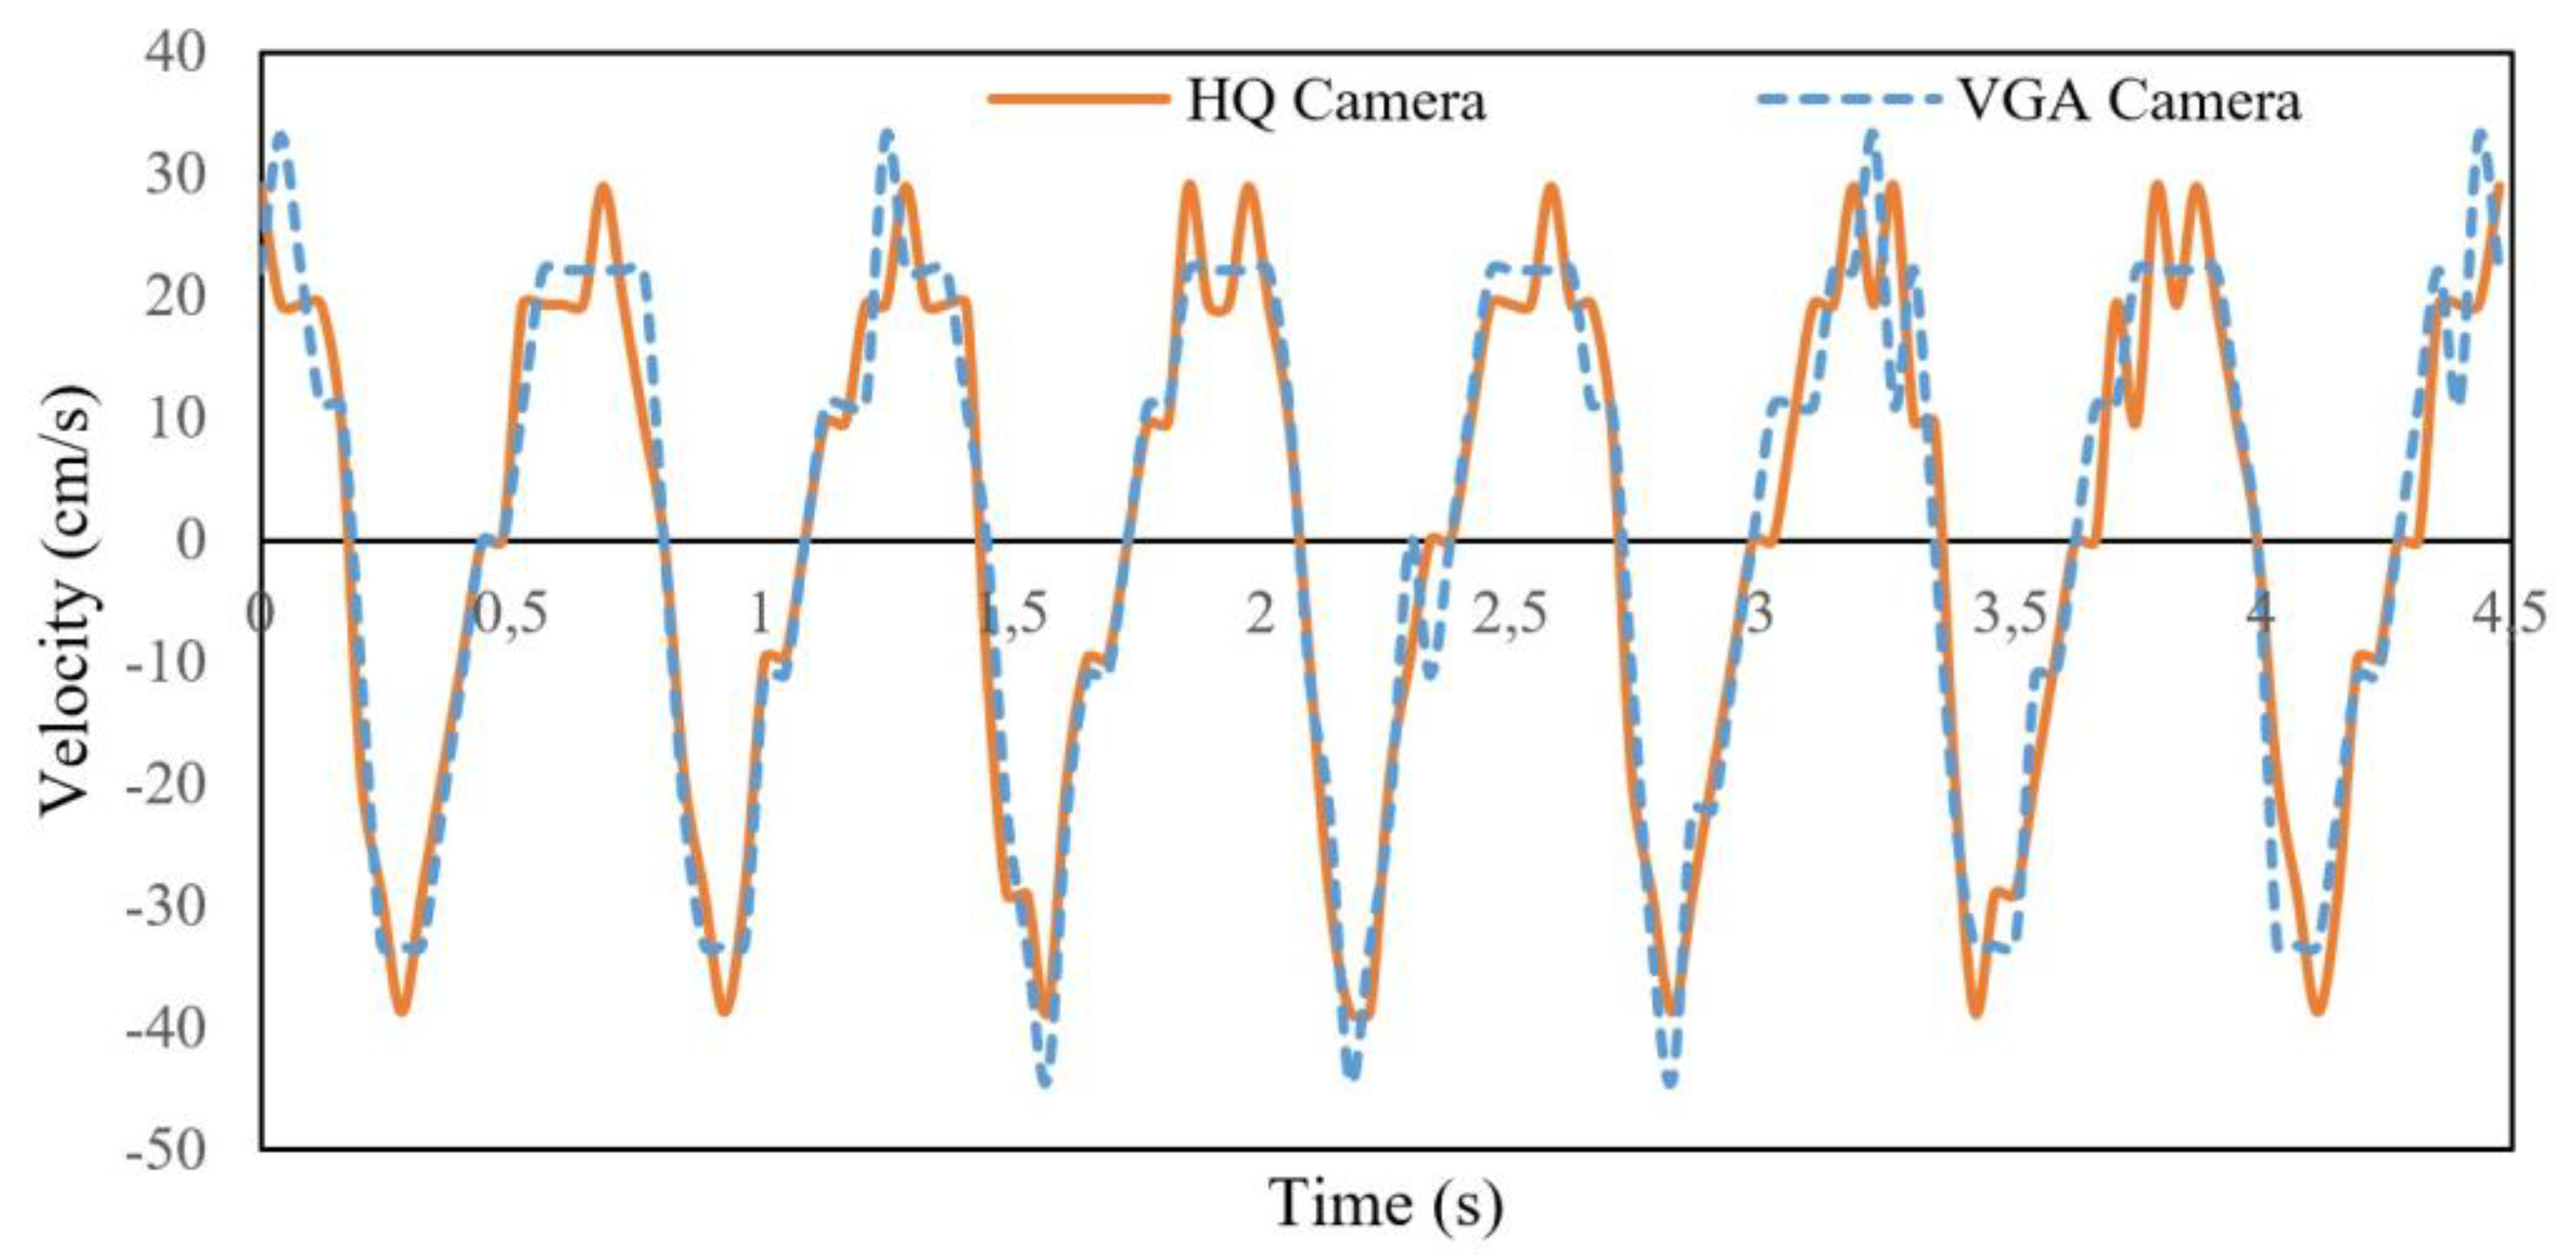
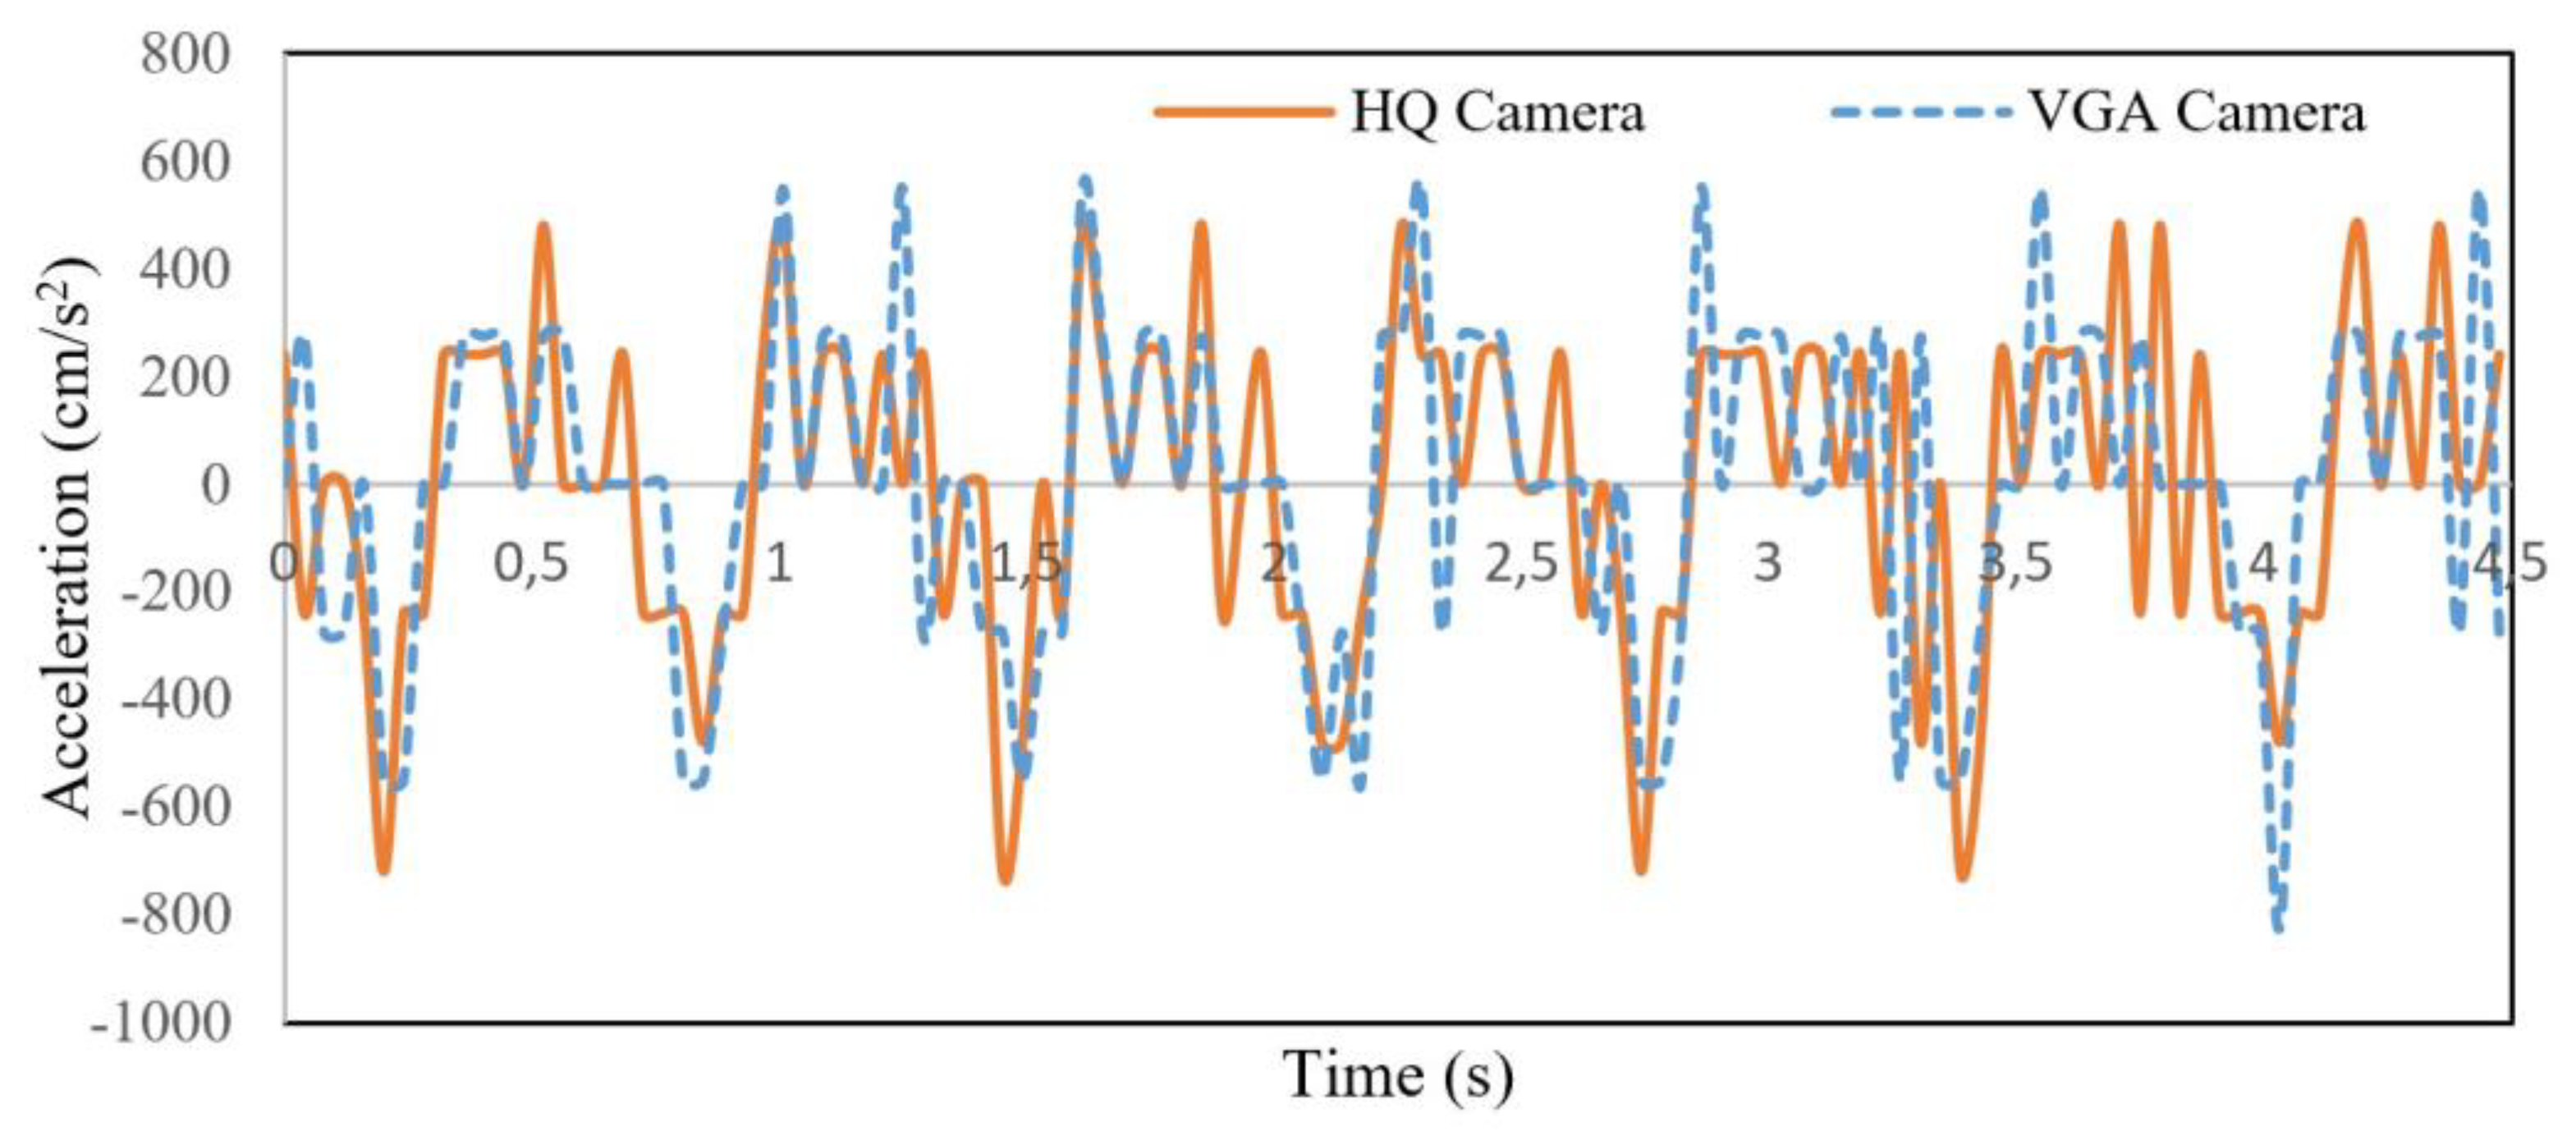
4.3. Parametric Analysis of the Camera Resolution
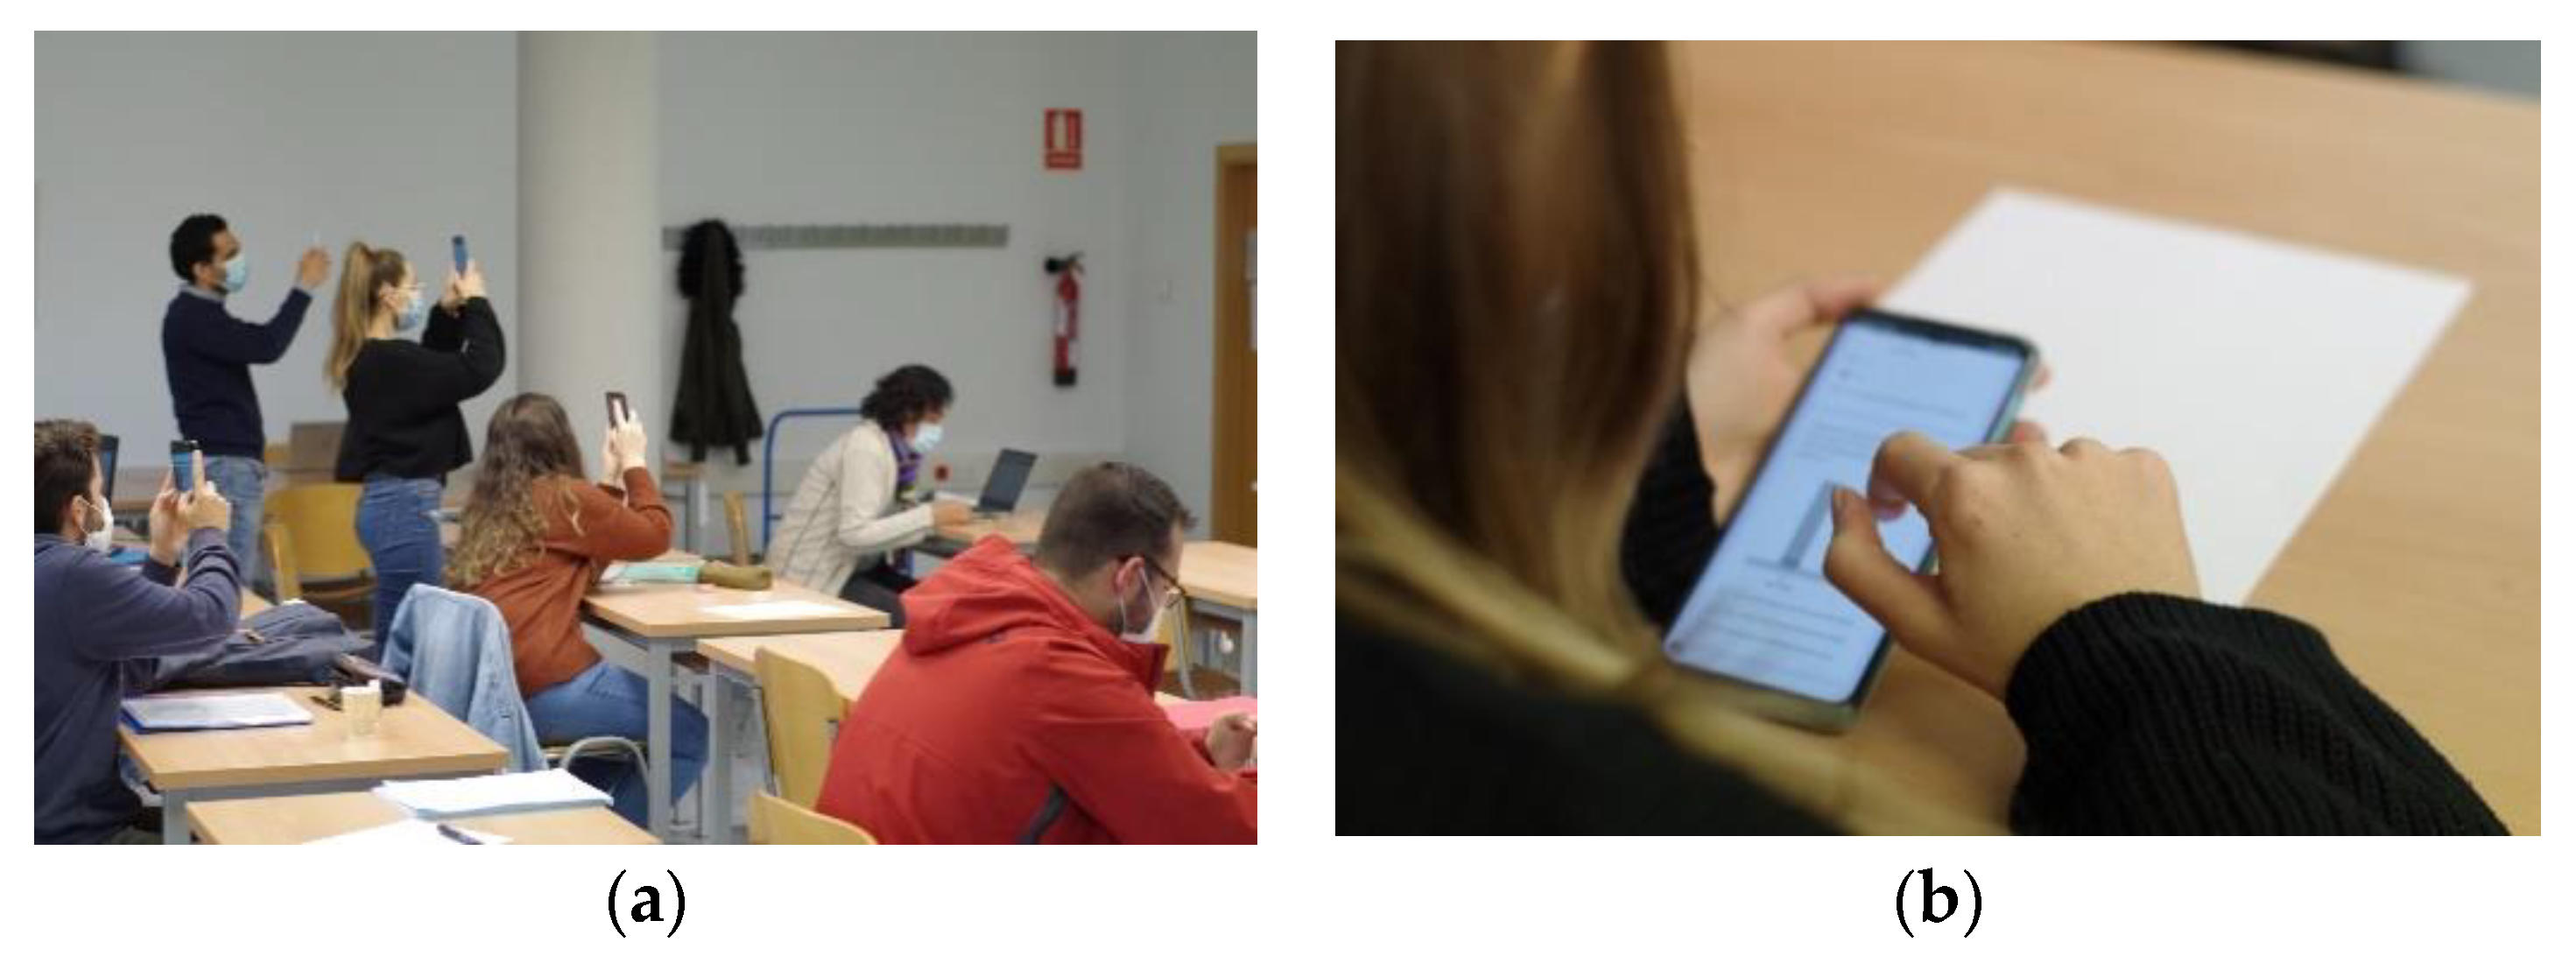
5. Application of the Proposed Tool for the Dynamic Analysis of High-Rise Building in a Workshop
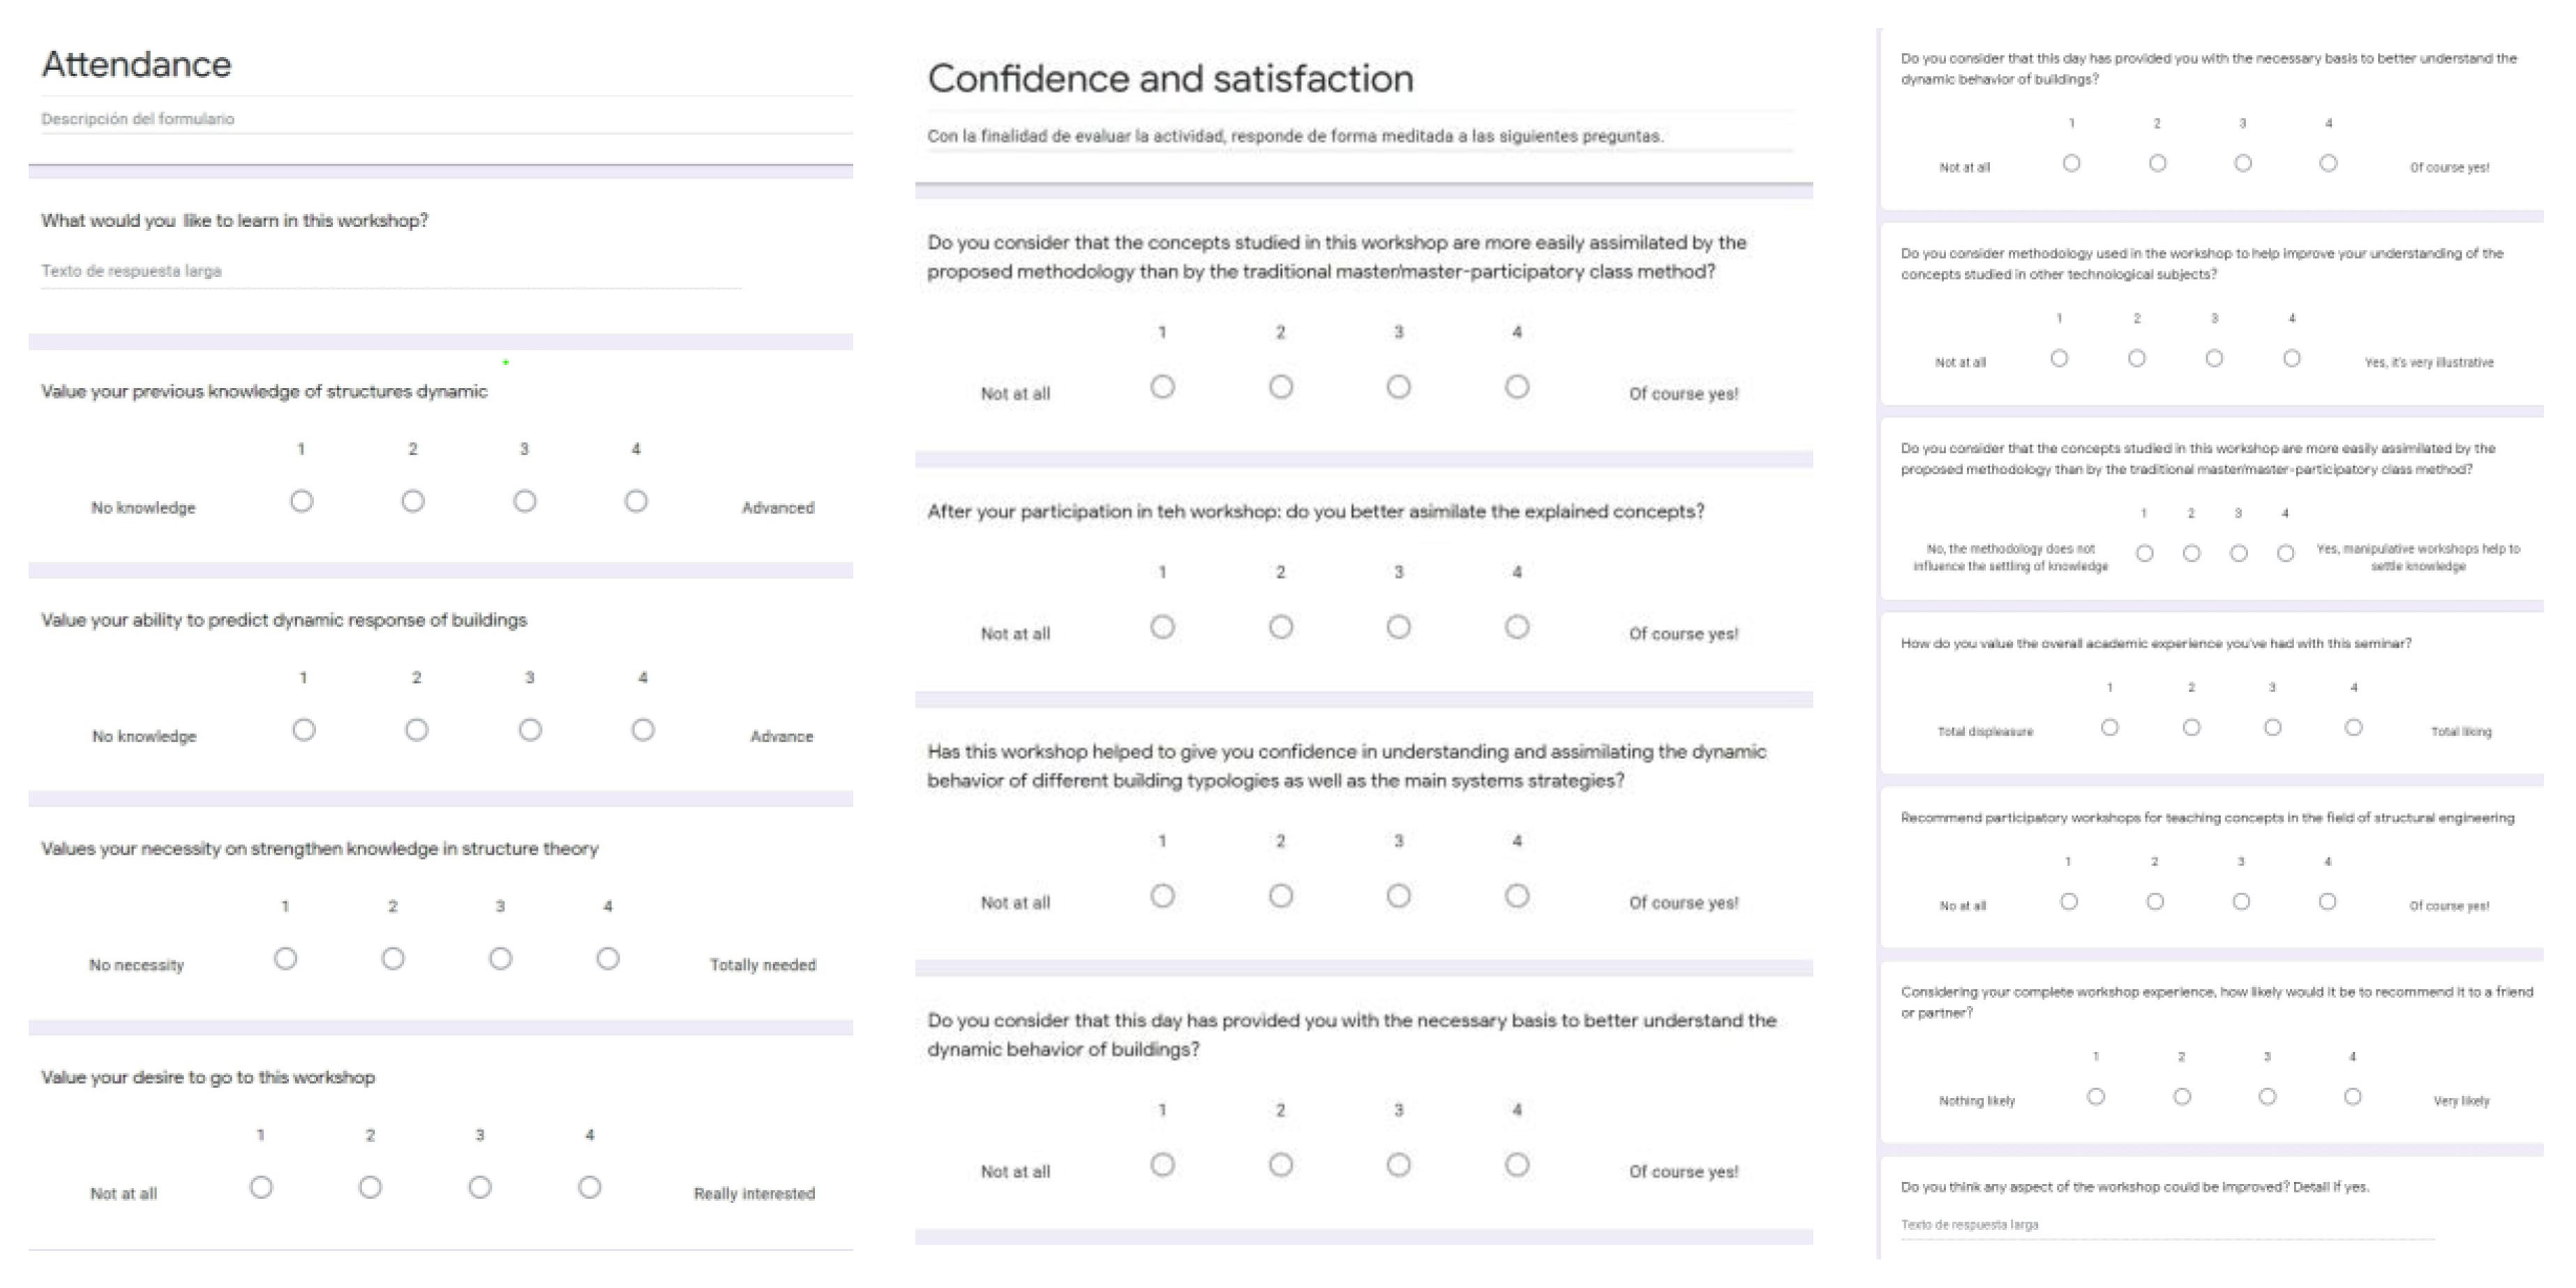
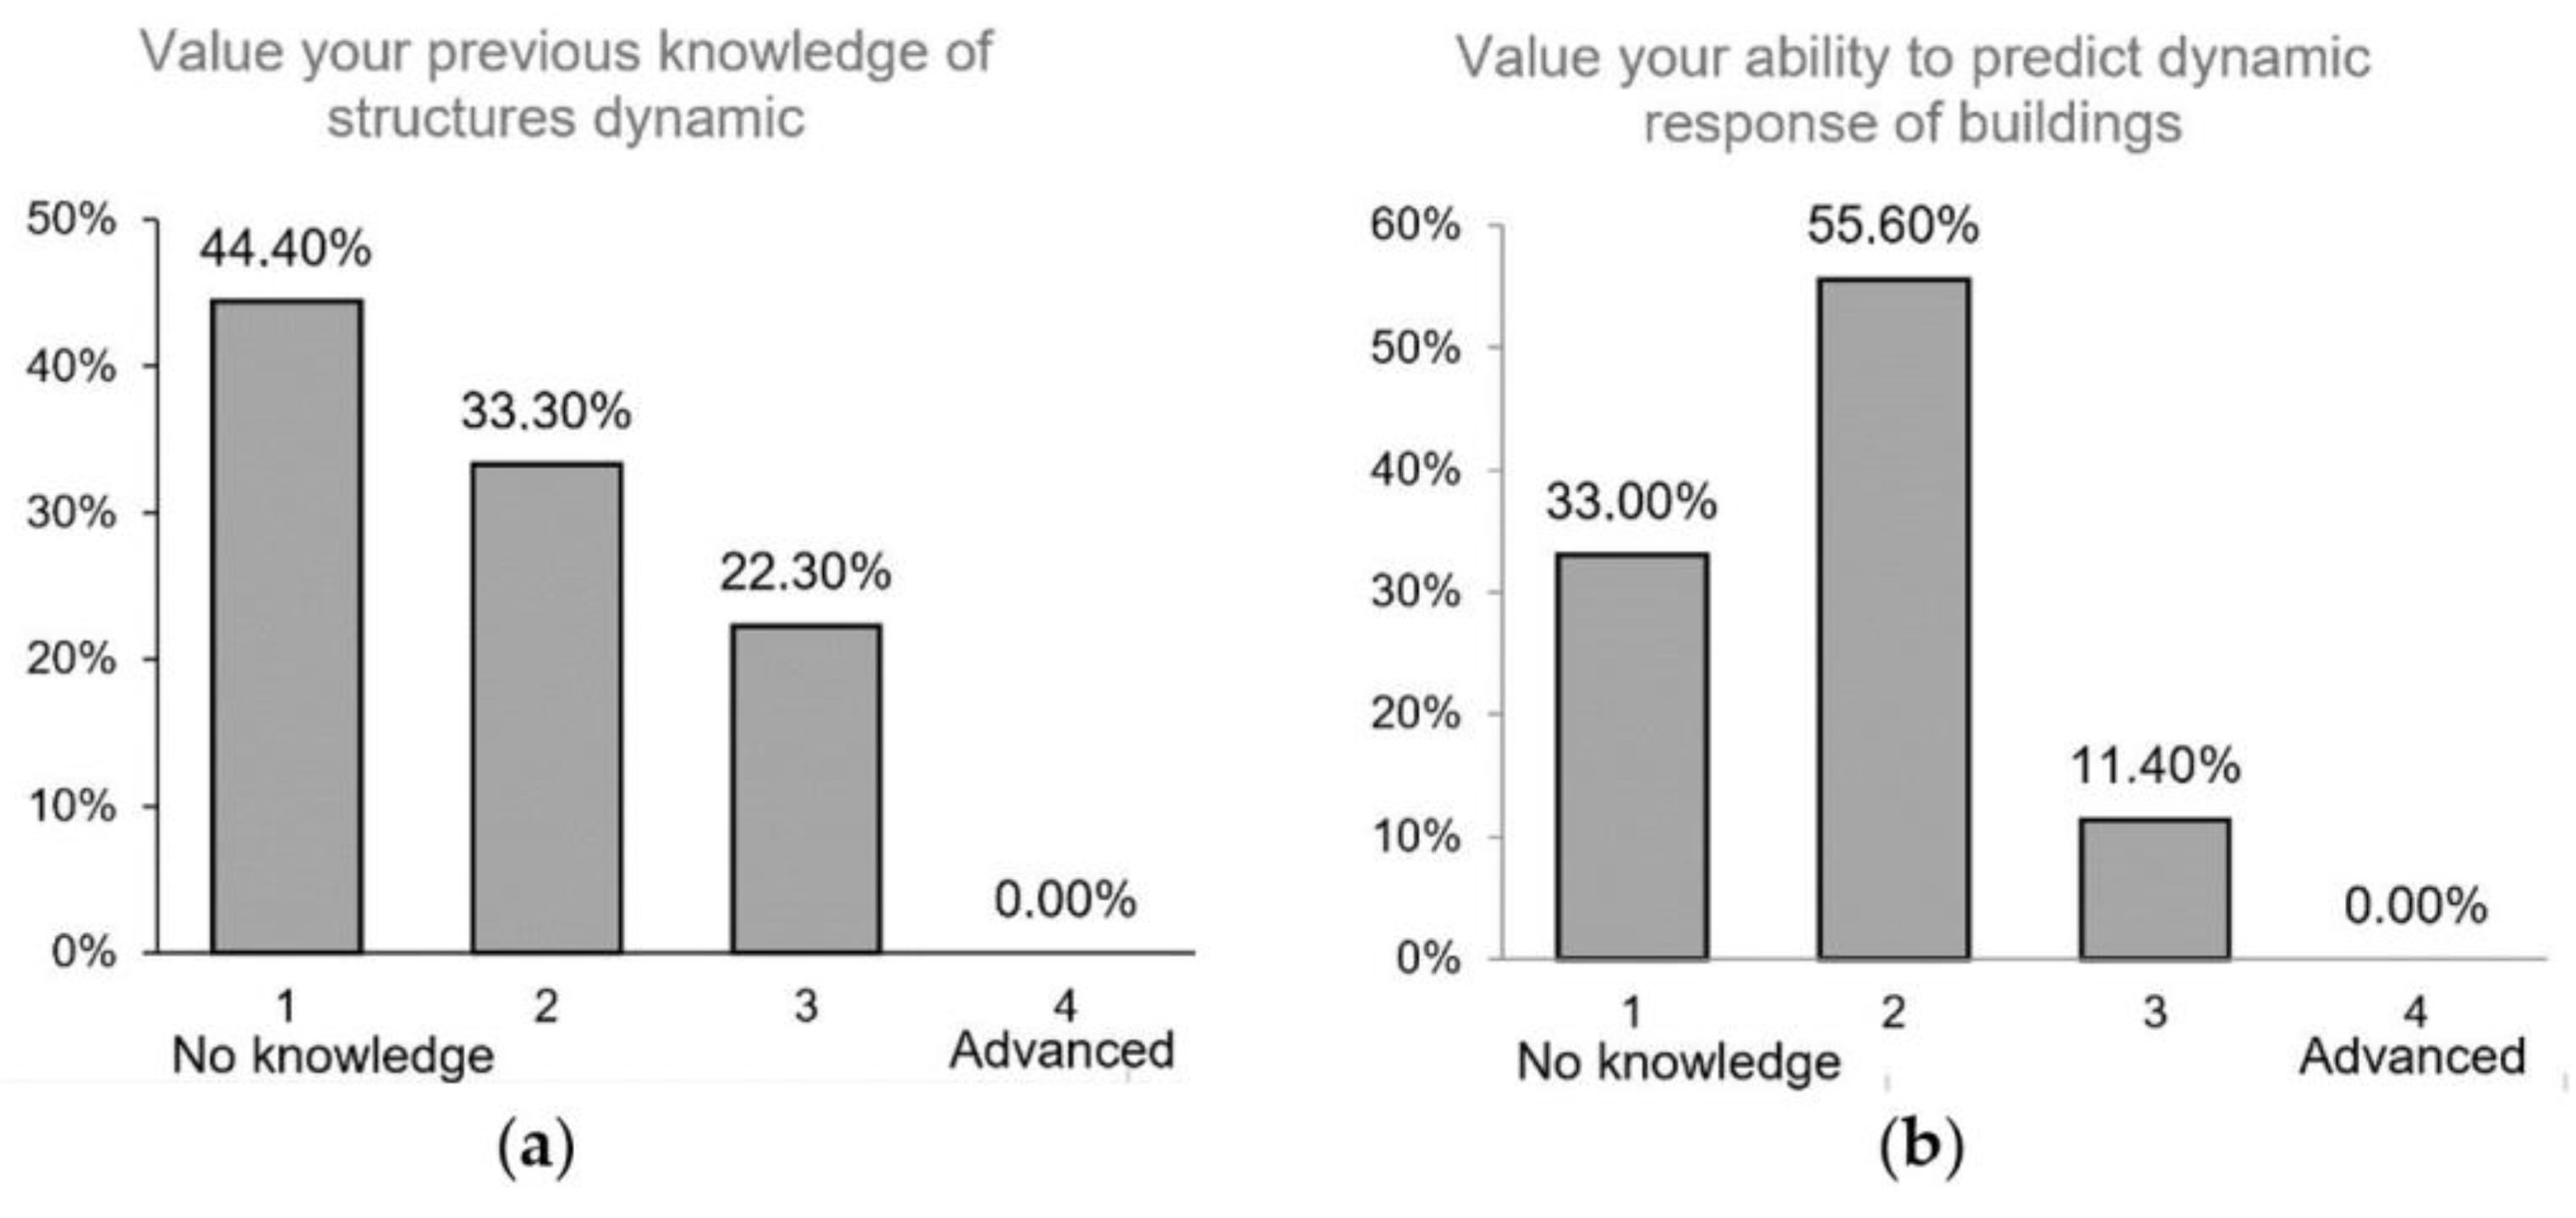
Attention, Relevance, Confidence, and Satisfaction (ARCS) Model
- Attention: five questions related to learning interests before the activity.
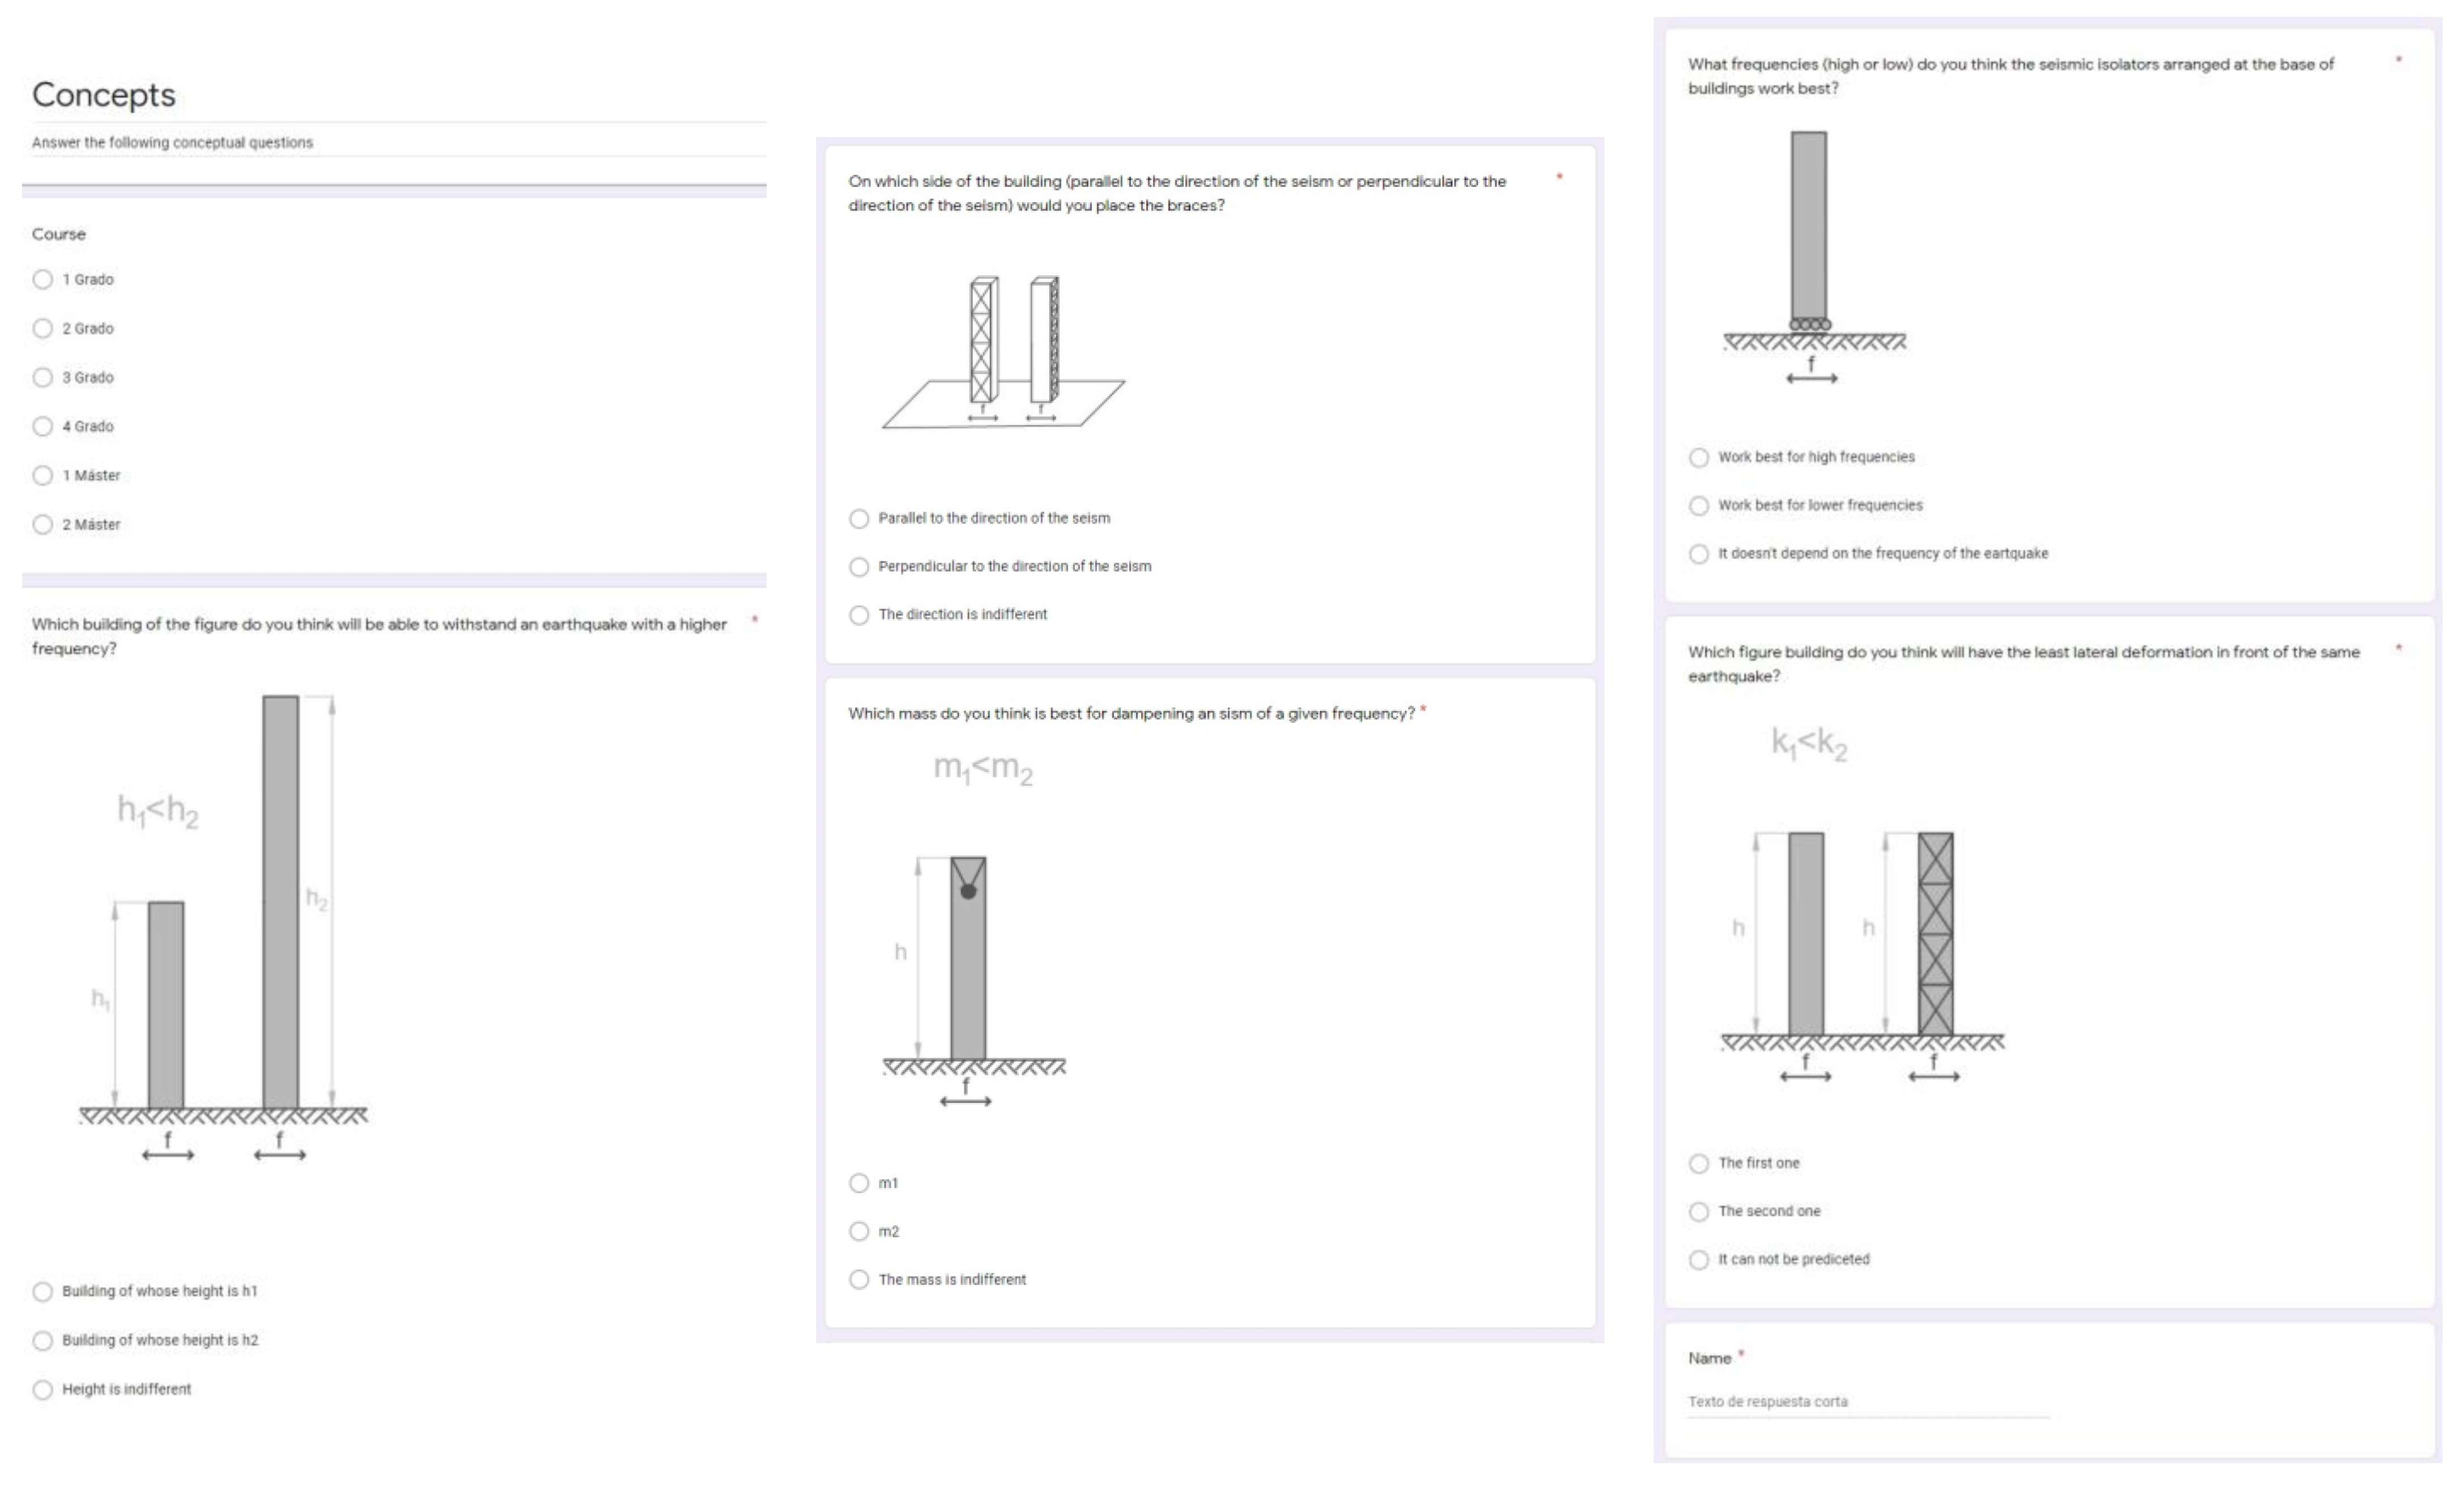
- Relevance: five technological questions related to the concepts explained during the activity, to check learning effectiveness.
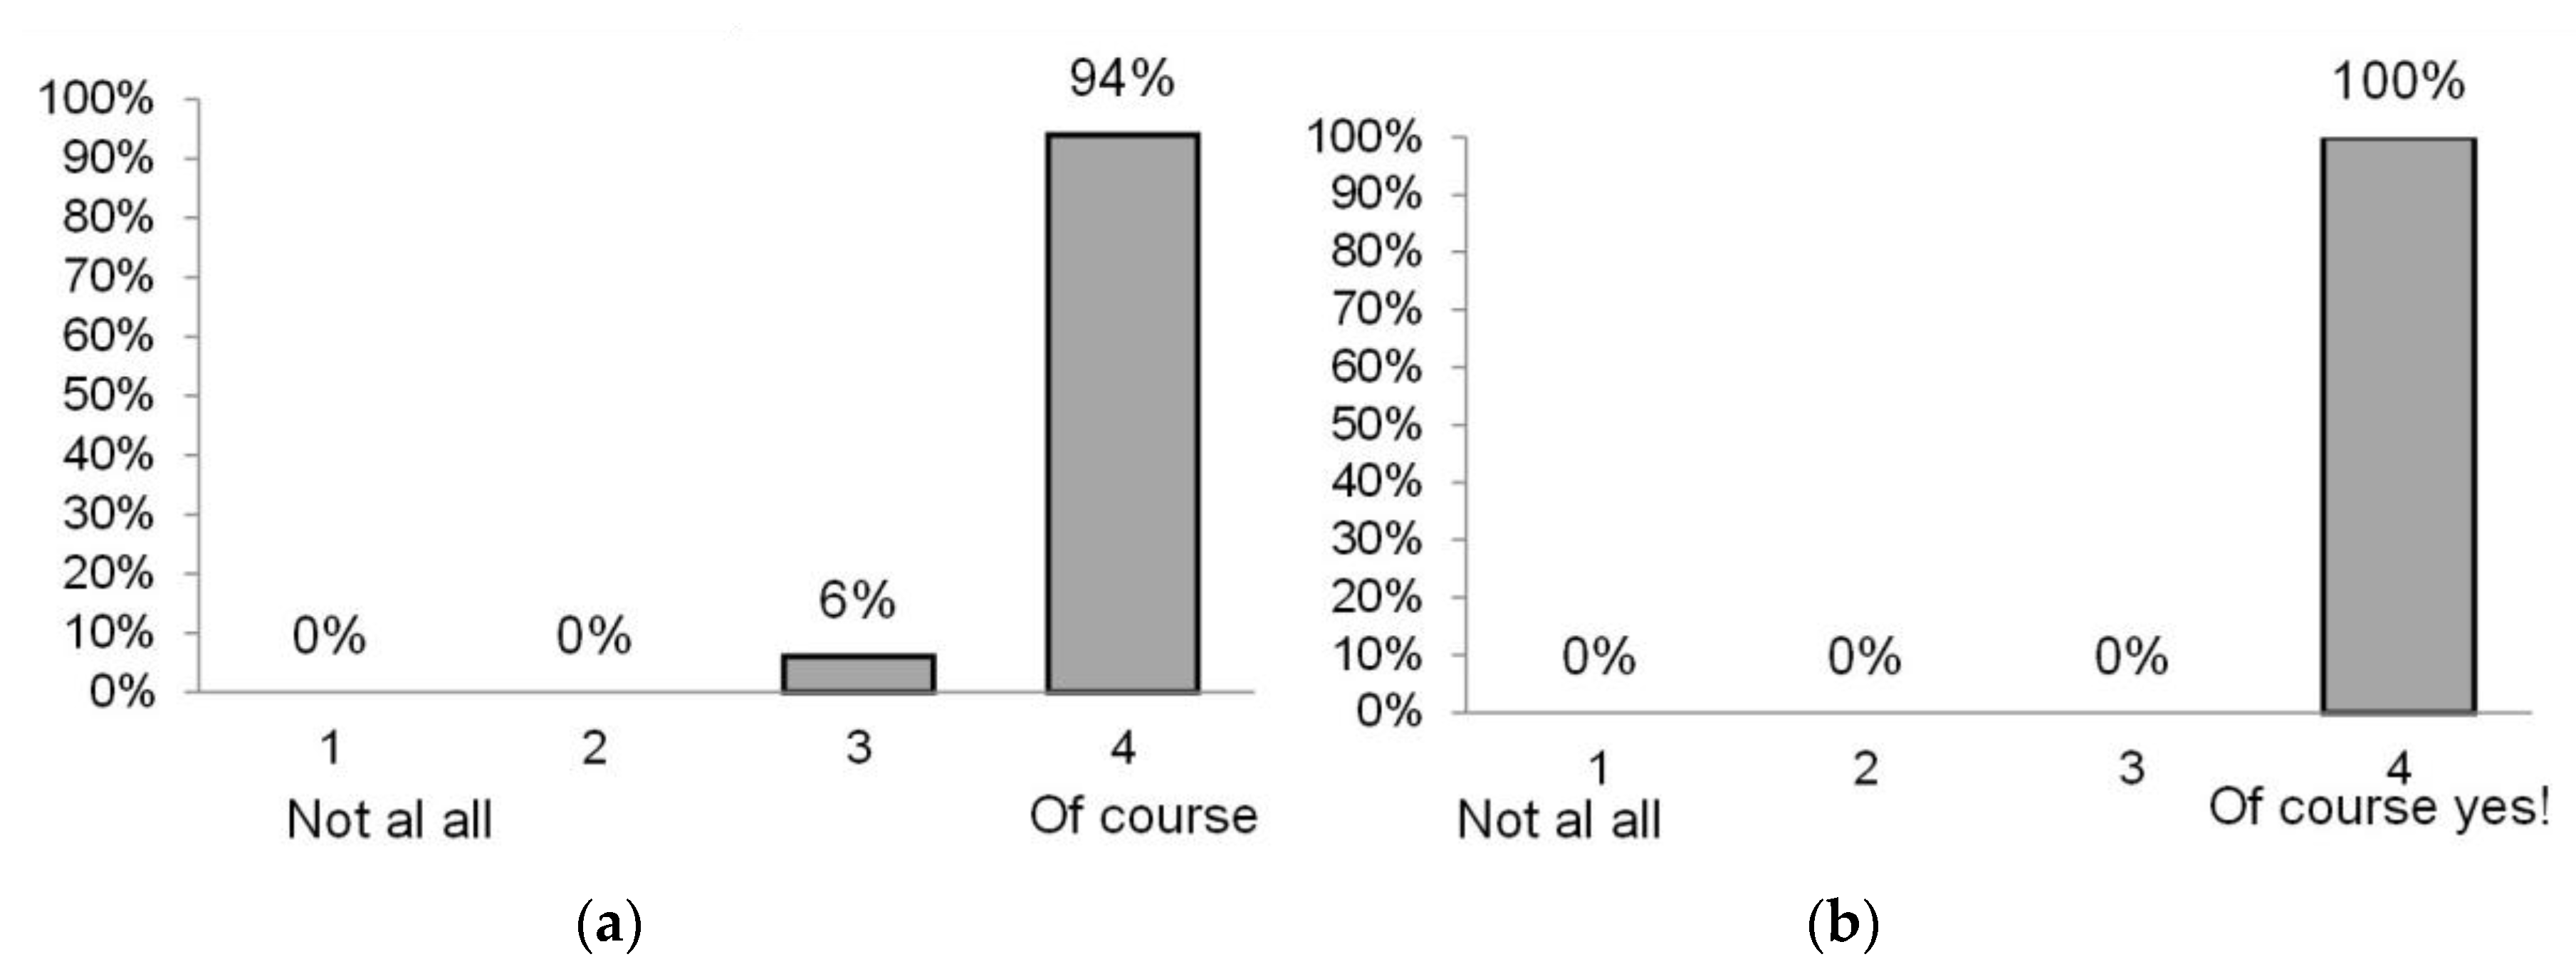
- Confidence: five questions to measure their self-perception of fulfilling a task.
- Satisfaction: five questions to learn about students’ opinions on the suitability of the methodology used.
6. Conclusions
Author Contributions
Funding
Institutional Review Board Statement
Informed Consent Statement
Data Availability Statement
Acknowledgments
Conflicts of Interest
References
- Fogarty, J.; McCormick, J.; El-Tawil, S. Improving Student Understanding of Complex Spatial Arrangements with Virtual Reality. J. Prof. Issues Eng. Educ. Pract. 2018, 144, 04017013. [Google Scholar] [CrossRef]
- Lozano-Galant, J.A.; Nogal, M.; Castillo, E.; Turmo, J. Application of observability techniques to structural system identification. Comput. Aid. Civil Infrastruct. Eng. 2013, 28, 434–450. [Google Scholar] [CrossRef]
- Peng, T.; Nogal, M.; Lozano-Galant, J.A.; Turmo, J. Constrained observability techniques for structural system identification using modal analysis Authors. J. Sound Vib. 2019, 4, 115368. [Google Scholar]
- Lei, J.; Lozano-Galant, J.A.; Xu, D.; Turmo, J. Structural system identification by measurement error - minimizing observability method. Struct. Control Health Monit. 2019, 26, 1–19. [Google Scholar] [CrossRef]
- Mobaraki, B.; Ma, H.; Lozano-Galanat, J.A.; Turmo, J. Structural health monitoring of 2D plane structures. Appl. Sci. 2021, 11, 2000. [Google Scholar] [CrossRef]
- Jian, X.; Xia, Y.; Lozano-Galant, J.A.; Sun, L. Traffic sensing methodology combining influence line theory and computer vision techniques for girder bridges. J. Sens. 2019, 2019, 3409525. [Google Scholar] [CrossRef] [Green Version]
- Ye, X.; Su, Y. Statistical Analysis of Stress Signals from Bridge Monitoring by FBG System. System 2018, 18, 1–14. [Google Scholar]
- Sanchez-Cambronero, S.; Jímenez, P.; Rivas, A.; Gallego, I. Plate scanning tool to obtain travel times in traffic networks. J. Intell. Trans. Syst. Technol. Plan. Operat. 2017, 21, 390–408. [Google Scholar] [CrossRef]
- EasyStatics. Available online: http://easystatics.ethz.ch/AboutEasyStatics/E/install.htm (accessed on 17 March 2021).
- iStructAR. Available online: https://lib.dr.iastate.edu/etd/16756/ (accessed on 17 March 2021).
- Masses and Springs. Available online: https://phet.colorado.edu/es/simulation/masses-and-springs (accessed on 17 March 2021).
- Wave on a String. Available online: https://phet.colorado.edu/en/simulation/wave-on-a-string (accessed on 17 March 2021).
- Resonance and Communications. Available online: https://www.youtube.com/watch?v=p4nzACkvET4 (accessed on 17 March 2021).
- Candelas, F.; Garcia, J.; Puente, S.; Pomares, J.; Jara, C.A.; Perez, J.; Mira, D.; Torres, F. Experiences on using Arduino for laboratory experiments of automatic control and robotics. IFAC 2015, 48, 105–110. [Google Scholar] [CrossRef] [Green Version]
- Ali, A.S.; Zachary, Z.; Deion, D.; Brent, S. Open-Source Building Science Sensors (OSBSS): A low-cost Arduino-based platform for long-term indoor environmental data collection. Build. Environ. 2016, 100, 114–126. [Google Scholar] [CrossRef] [Green Version]
- Feng, D.; Feng, M.Q. Computer vision for SHM of civil infrastructure: From dynamic response measurement to damage detection—A review. Eng. Struct. 2018, 156, 105–117. [Google Scholar] [CrossRef]
- Romero, M.; Museros, P. Structural Analysis Education through Model Experiments and Computer Simulation. J. Prof. Issues Eng. Educ. Pract. 2002, 128, 170–175. [Google Scholar] [CrossRef]
- Katsanos, E.I.; Taskari, O.N.; Sextos, A.G. A Matlab-Based Educational Tool for the Seismic Design of Flexibly Supported RC Buildings. Comput. Appl. Eng. Educ. 2011, 22, 442–451. [Google Scholar] [CrossRef]
- Ionescu, C.M.; Fabregas, E.; Cristescu, S.; Dormido, S.; Keyserm, R. A Remote Laboratory as an Innovative Educational Tool for Practicing Control Engineering Concepts. IEEE Trans. Educ. 2013, 56, 436–442. [Google Scholar] [CrossRef]
- Basso, M.; Innocenti, G. Lego-Bike: A Challenging Robotic Lab Project to Illustrate Rapid Prototyping in the Mindstorms/Simulink Integrated Platform. Comput. Appl. Eng. Educ. 2015, 23, 947–958. [Google Scholar] [CrossRef]
- Chacón, R.; Codony, D.; Toledo, Á. From physical to digital in structural engineering classrooms using digital fabrication. Comput. Appl. Eng. Educ. 2017, 25, 927–937. [Google Scholar] [CrossRef]
- Sanchez-Cambronero, S.; Lozano-Galant, J.A.; Castilla, F.J.; Poveda, E.; Porras, R.; Gallego, I.; López-Moya, R. Introducing High school students into the multidisciplinary world of bridge construction using project-based learning. J. Civ. Eng. Educ. 2020, 147, 05020006. [Google Scholar] [CrossRef]
- Gross, S.; Musselman, E. Implementation of an Inverted Classroom in Structural Design Courses. J. Prof. Issues Eng. Educ. Pract. 2018, 144, 05018003. [Google Scholar] [CrossRef]
- Chacón, R.; Oller, S. Designing Experiments Using Digital Fabrication in Structural Dynamics. J. Prof. Issues Eng. Educ. Pract. 2017, 143, 1–9. [Google Scholar] [CrossRef] [Green Version]
- Mahajan, S.K.; Sonparote, R. Implementation of comparative visualization pedagogy for structural dynamics. Comput. Appl. Eng. Educ. 2018, 26, 1894–1902. [Google Scholar] [CrossRef]
- Slocum, R.K.; Adams, R.; Buker, K.; Hurwitz, D.; Mason, H.B.; Parish, C.E.; Scott, M.H. Response spectrum devices for active learning in earthquake engineering education. HardwareX 2018, 4, e00032. [Google Scholar] [CrossRef]
- Li, B.; Zhang, M.; Jin, R.; Wanatowski, D. Incorporating Woodwork Fabrication into the Integrated Teaching and Learning of Civil Engineering Students. J. Prof. Issues Eng. Educ. Pract. 2018, 144, 05018007. [Google Scholar] [CrossRef]
- Coutinho, C.P.; Baptista, A.J.; Rodrigues, J.D. Reduced scale models based on similitude theory: A review up to 2015. Eng. Struct. 2016, 119, 81201394. [Google Scholar] [CrossRef]
- Zohuri, B. Similitude Theory and Applications. In Dimensional Analysis and Self-Similarity Methods for Engineers and Scientists; Springer: Berlin/Heidelberg, Germany, 2015; pp. 93–193. [Google Scholar]
- K’nex. Available online: https://www.basicfun.com/knex/ (accessed on 19 March 2021).
- UCLM. 2019. Available online: http://www.caminosciudadreal.uclm.es/?p=5877 (accessed on 19 March 2021).
- Estes, A.; Mcdaniel, C.C.; Zavala, A.R. Enhancing an Upper Division Structural Dynamics Course Using K’nex Toys Using K’nex Toys in Architectural Engineering Programs. In Proceedings of the 2016 ASEE Annual Conference & Exposition Proceedings, New Orleans, LA, USA, 26–29 June 2016. [Google Scholar]
- Bennewitz, M.; Hartogs, R.; Bester-field, M. Mimicking Bone Bioscaffolds with K’NEX: Developing Student Creativity and Problem-Solving Skills (P12 Resource Exchange). In Proceedings of the 2016 ASEE Annual Conference & Exposition Proceedings, New Orleans, LA, USA, 26–29 June 2016. [Google Scholar]
- Estes, A.; Baltimore, C. Using K’nex to Teach Large Scale Structures to Architects and Construction Students. In Proceedings of the 121st ASEE Conference, Indianapolis, IN, USA, 22 September 2014. [Google Scholar]
- Ko, D.W.; Lee, H.S. Shaking table tests on a high-rise RC building model having torsional eccentricity in soft lower stories. Earthquake Eng. Struct. Dyn. 2006, 35, 1425–1451. [Google Scholar] [CrossRef]
- Cho, S.; Park, S.; Cha, G.; Oh, T. An experimental investigation on the dynamic response of building frame with mass irregularity. Int. J. Adv. Res. Eng. Technol. (IJARET) 2020, 10, 152–160. [Google Scholar]
- Lee, H.S.; Ko, D.W. Shaking Table Tests of a High-Rise RC Bearing-Wall Structure with Bottom Piloti Stories. J. Asian Arch. Build. Eng. 2018, 1, 47–54. [Google Scholar] [CrossRef] [Green Version]
- Cimellaro, G.P.; Domaneschi, M. Development of Dynamic Labratory Platform for Earthquake Engineering Courses. J. Prof. Issues Eng. Educ. Pract. 2018, 144, 05018015. [Google Scholar] [CrossRef]
- Righettini, P.; Strada, R.; Valilou, S.; Khademolama, E. Nonlinear model of a servo-hydraulic shaking table with dynamic model of effective bulk modulus. Mech. Syst. Signal. Proc. 2018, 110, 248–259. [Google Scholar] [CrossRef]
- Chen, Z. Characteristics analysis of granular landslide using shaking table model test. Soil Dyn. Earthquake Eng. 2019, 126, 105761. [Google Scholar] [CrossRef]
- Jafarzadeh, F.; Farahi-jahromi, H.; Rajabigol, M. Applicability of rigid block based approaches in predicting sandy slope displacements by 1g shaking table tests. Soil Dyn. Earthq. Eng. 2019, 126, 105576. [Google Scholar] [CrossRef]
- El-abd, M. A Review of Embedded Systems Education in the Arduino Age: Lessons Learned and Future Directions. Int. J. Eng. Pedagog. 2017, 7, 79–93. [Google Scholar] [CrossRef] [Green Version]
- Berry, C.; Chang, D.; Miller, C. From LEGO to Arduino: Enhancement of ECE Freshman Design with Practical Applications. In Proceedings of the 2016 ASEE Annual Conference & Exposition Proceedings, New Orleans, LA, USA, 26–29 June 2016. [Google Scholar]
- Zhang, R.; Lauenstein, P.V.; Phillips, B.M. Real-time hybrid simulation of a shear building with a uniaxial shake table. Eng. Struct. 2016, 119, 217–229. [Google Scholar] [CrossRef]
- Damc, E.; Sekerci, C. Development of a Low-Cost Single-Axis Shake Table Based on Arduino. Exp. Tech. 2019, 43, 179–198. [Google Scholar] [CrossRef]
- Sanghvi, C.S.; Patil, H.S.; Shah, B.J. Development of low cost shake tables and instrumentation setup for earthquake engineering laboratory. Int. J. Adv. Eng. Technol. 2012, 1, 46–49. [Google Scholar]
- Matworks. Available online: https://www.mathworks.com/products/matlab.html (accessed on 17 March 2021).
- Hegazy, T.; Mostafa, K.; Esfahani, M.E. Hands-On Class Exercise for Efficient Planning and Execution of Modular Construction. J. Civ. Eng. Educ. 2020, 146, 05020002. [Google Scholar] [CrossRef]
- Pintrich, P.R. A motivational science perspective on the role of student motivation in learning and teaching contexts. J. Educ. Psychol. 2003, 95, 667. [Google Scholar] [CrossRef] [Green Version]
- Zheng, J.; Wu, G.; Li, H. Motivating Civil Engineering Students’ Creativity: Actor–Partner Interdependence Approach. J. Civ. Eng. Educ. 2020, 146, 04019002. [Google Scholar] [CrossRef]
- Keller, J.M. Development and use of the ARCS model of instructional design. J. Instr. Dev. 1987, 10, 45–52. [Google Scholar] [CrossRef]
- Li, K.; Keller, J.M. Use of the ARCS model in education: A literature review. Comput. Educ. 2018, 122, 54–62. [Google Scholar] [CrossRef]
- Chang, Y.S.; Hu, K.J.; Chiang, C.W.; Lugmayr, A. Applying Mobile Augmented Reality (AR) to Teach Interior Design Students in Layout Plans: Evaluation of Learning Effectiveness Based on the ARCS Model of Learning Motivation Theory. Sensors 2020, 20, 105. [Google Scholar] [CrossRef] [Green Version]


| Color | Length (cm) | Ix (cm4) | Iy = Iz (cm4) |
|---|---|---|---|
| Gray | 19.1 | 0.008 | 0.005 |
| Yellow | 8.5 | 0.008 | 0.005 |
| Blue | 5.5 | 0.008 | 0.005 |
| Nut Type | Diameter (cm) | Unitary Weight (g) |
|---|---|---|
| M9 | 0.9 | 4.66 |
| M10 | 1.0 | 10.0 |
| M13 | 1.3 | 14.9 |
Publisher’s Note: MDPI stays neutral with regard to jurisdictional claims in published maps and institutional affiliations. |
© 2021 by the authors. Licensee MDPI, Basel, Switzerland. This article is an open access article distributed under the terms and conditions of the Creative Commons Attribution (CC BY) license (http://creativecommons.org/licenses/by/4.0/).
Share and Cite
Porras Soriano, R.; Mobaraki, B.; Lozano-Galant, J.A.; Sanchez-Cambronero, S.; Prieto Muñoz, F.; Gutierrez, J.J. New Image Recognition Technique for Intuitive Understanding in Class of the Dynamic Response of High-Rise Buildings. Sustainability 2021, 13, 3695. https://0-doi-org.brum.beds.ac.uk/10.3390/su13073695
Porras Soriano R, Mobaraki B, Lozano-Galant JA, Sanchez-Cambronero S, Prieto Muñoz F, Gutierrez JJ. New Image Recognition Technique for Intuitive Understanding in Class of the Dynamic Response of High-Rise Buildings. Sustainability. 2021; 13(7):3695. https://0-doi-org.brum.beds.ac.uk/10.3390/su13073695
Chicago/Turabian StylePorras Soriano, Rocío, Behnam Mobaraki, José Antonio Lozano-Galant, Santos Sanchez-Cambronero, Federico Prieto Muñoz, and Juan José Gutierrez. 2021. "New Image Recognition Technique for Intuitive Understanding in Class of the Dynamic Response of High-Rise Buildings" Sustainability 13, no. 7: 3695. https://0-doi-org.brum.beds.ac.uk/10.3390/su13073695