
Steel-Concrete Composite Beams with Precast Hollow-Core Slabs: A Sustainable Solution

 ,
,  ,
,  and
and
Abstract
:1. Introduction
2. Background
3. Numerical Model: Validation Study
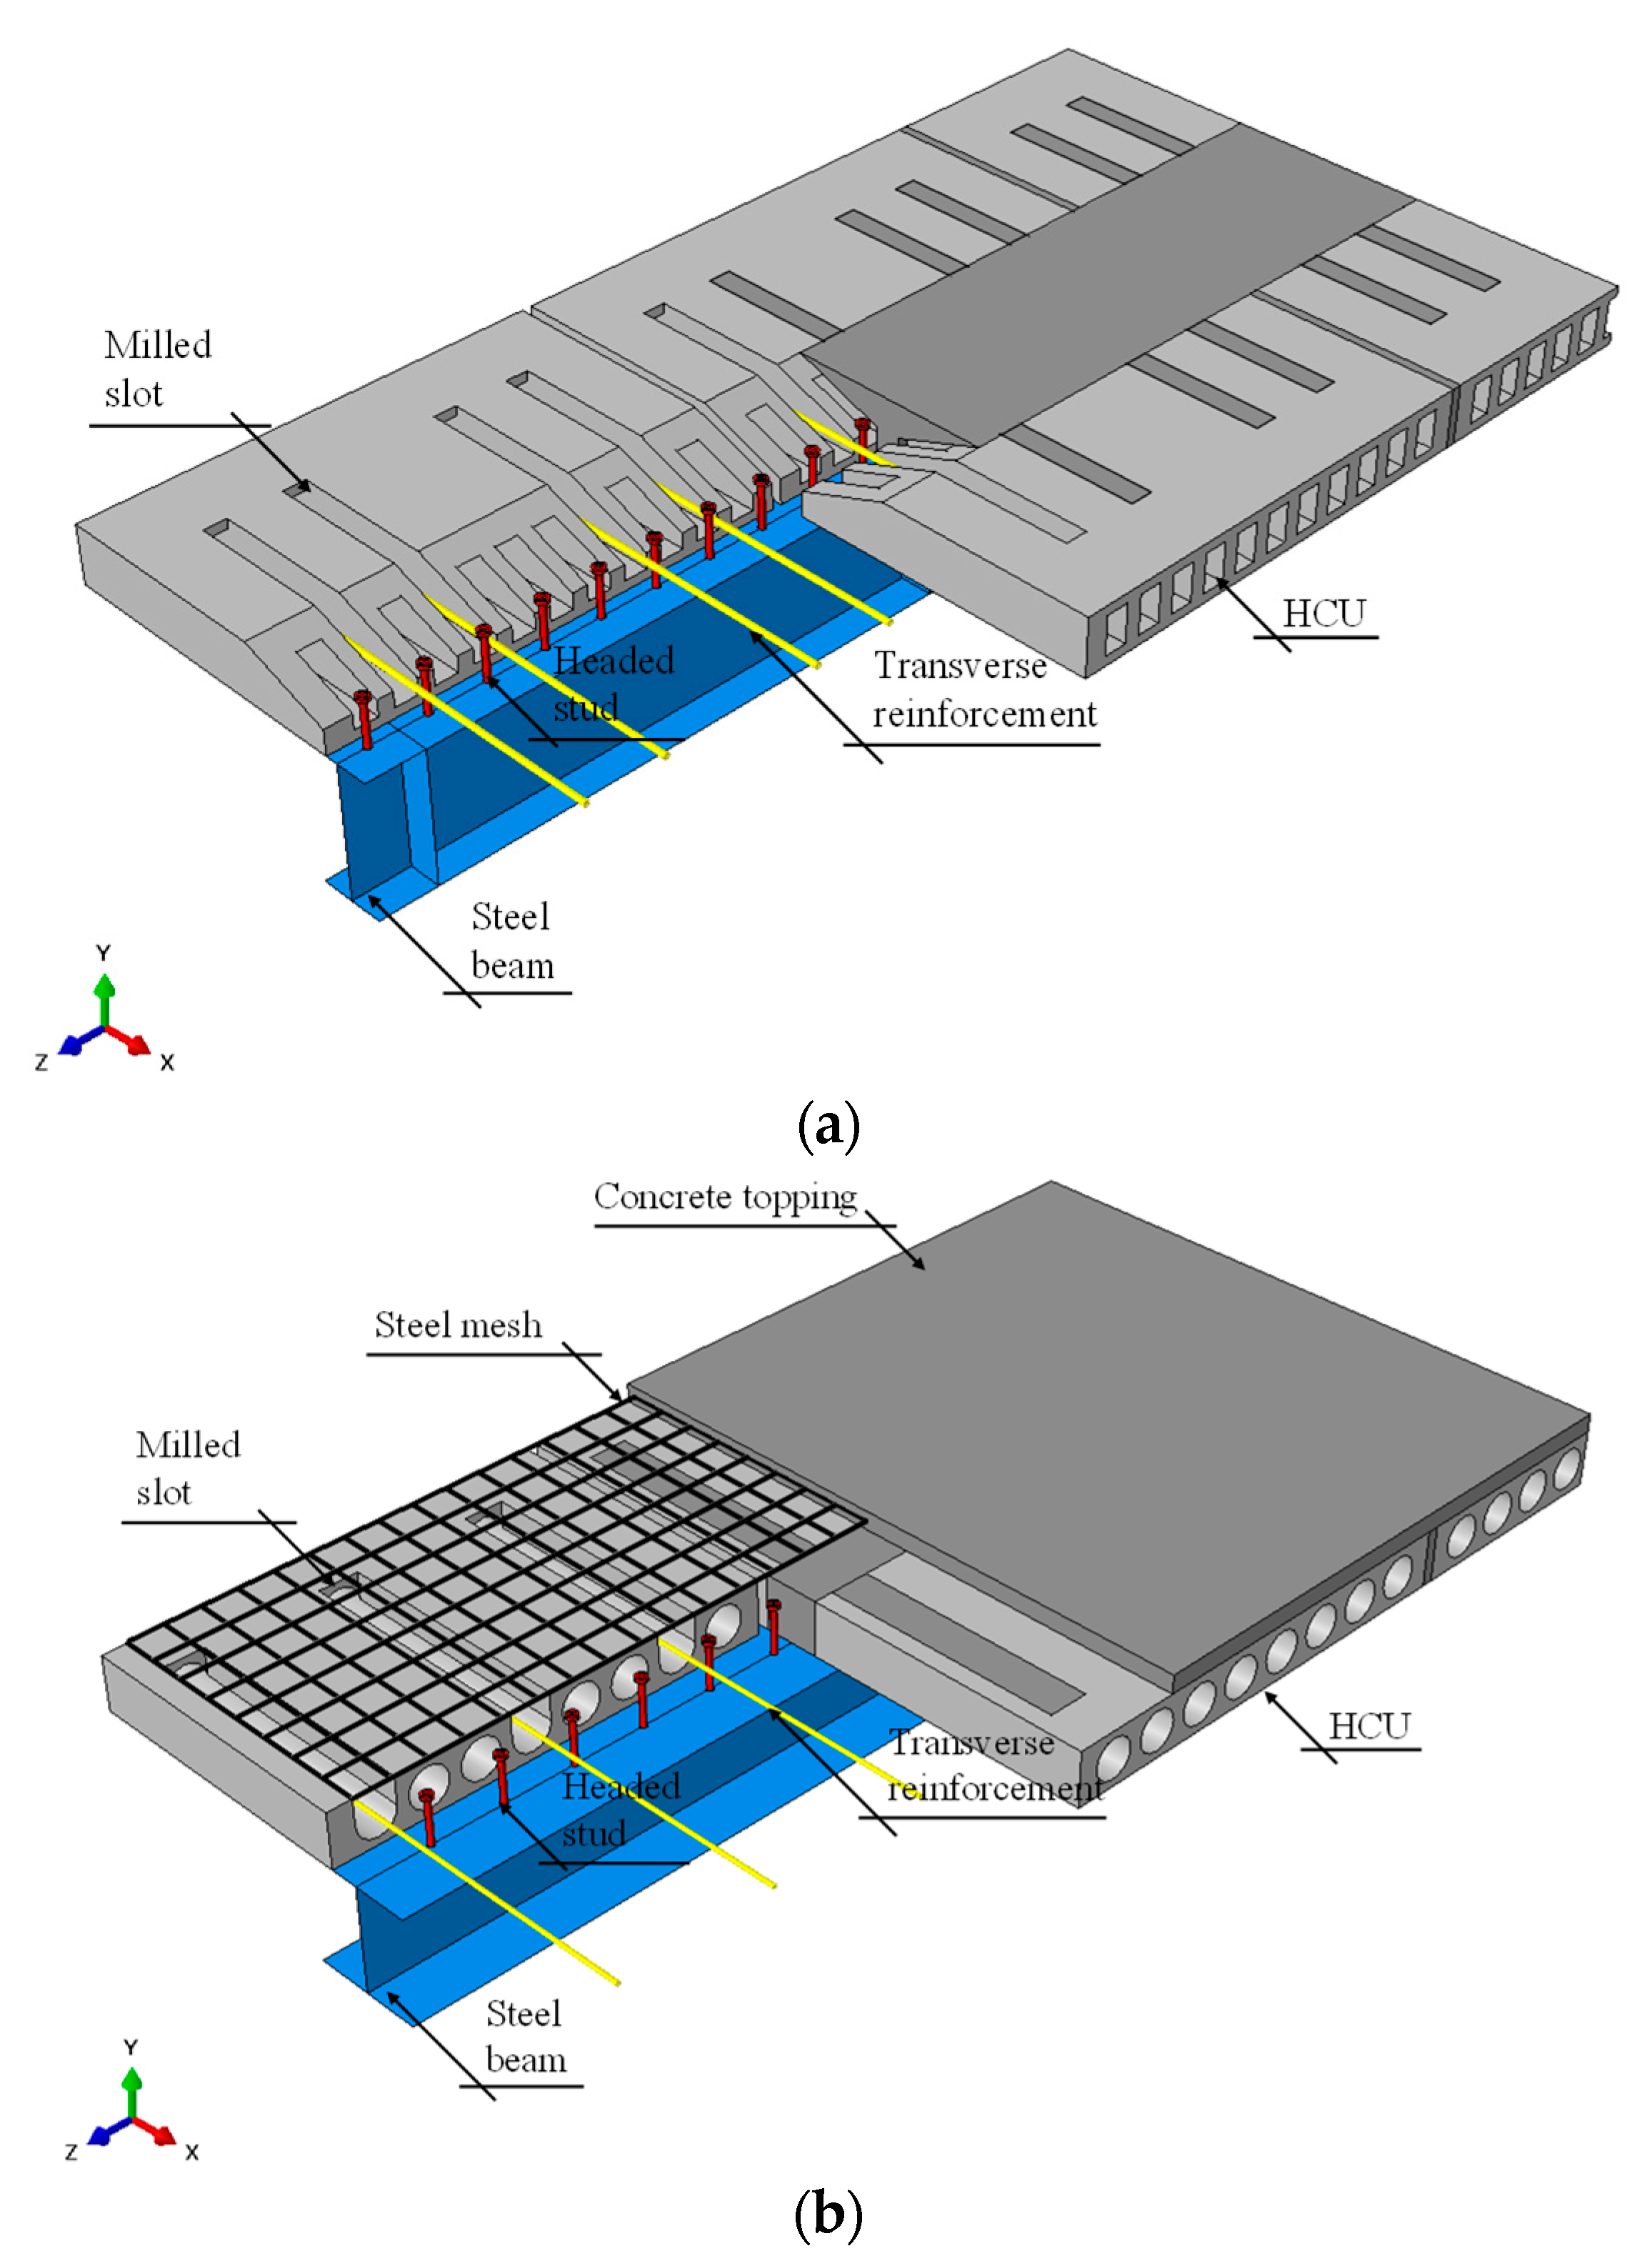
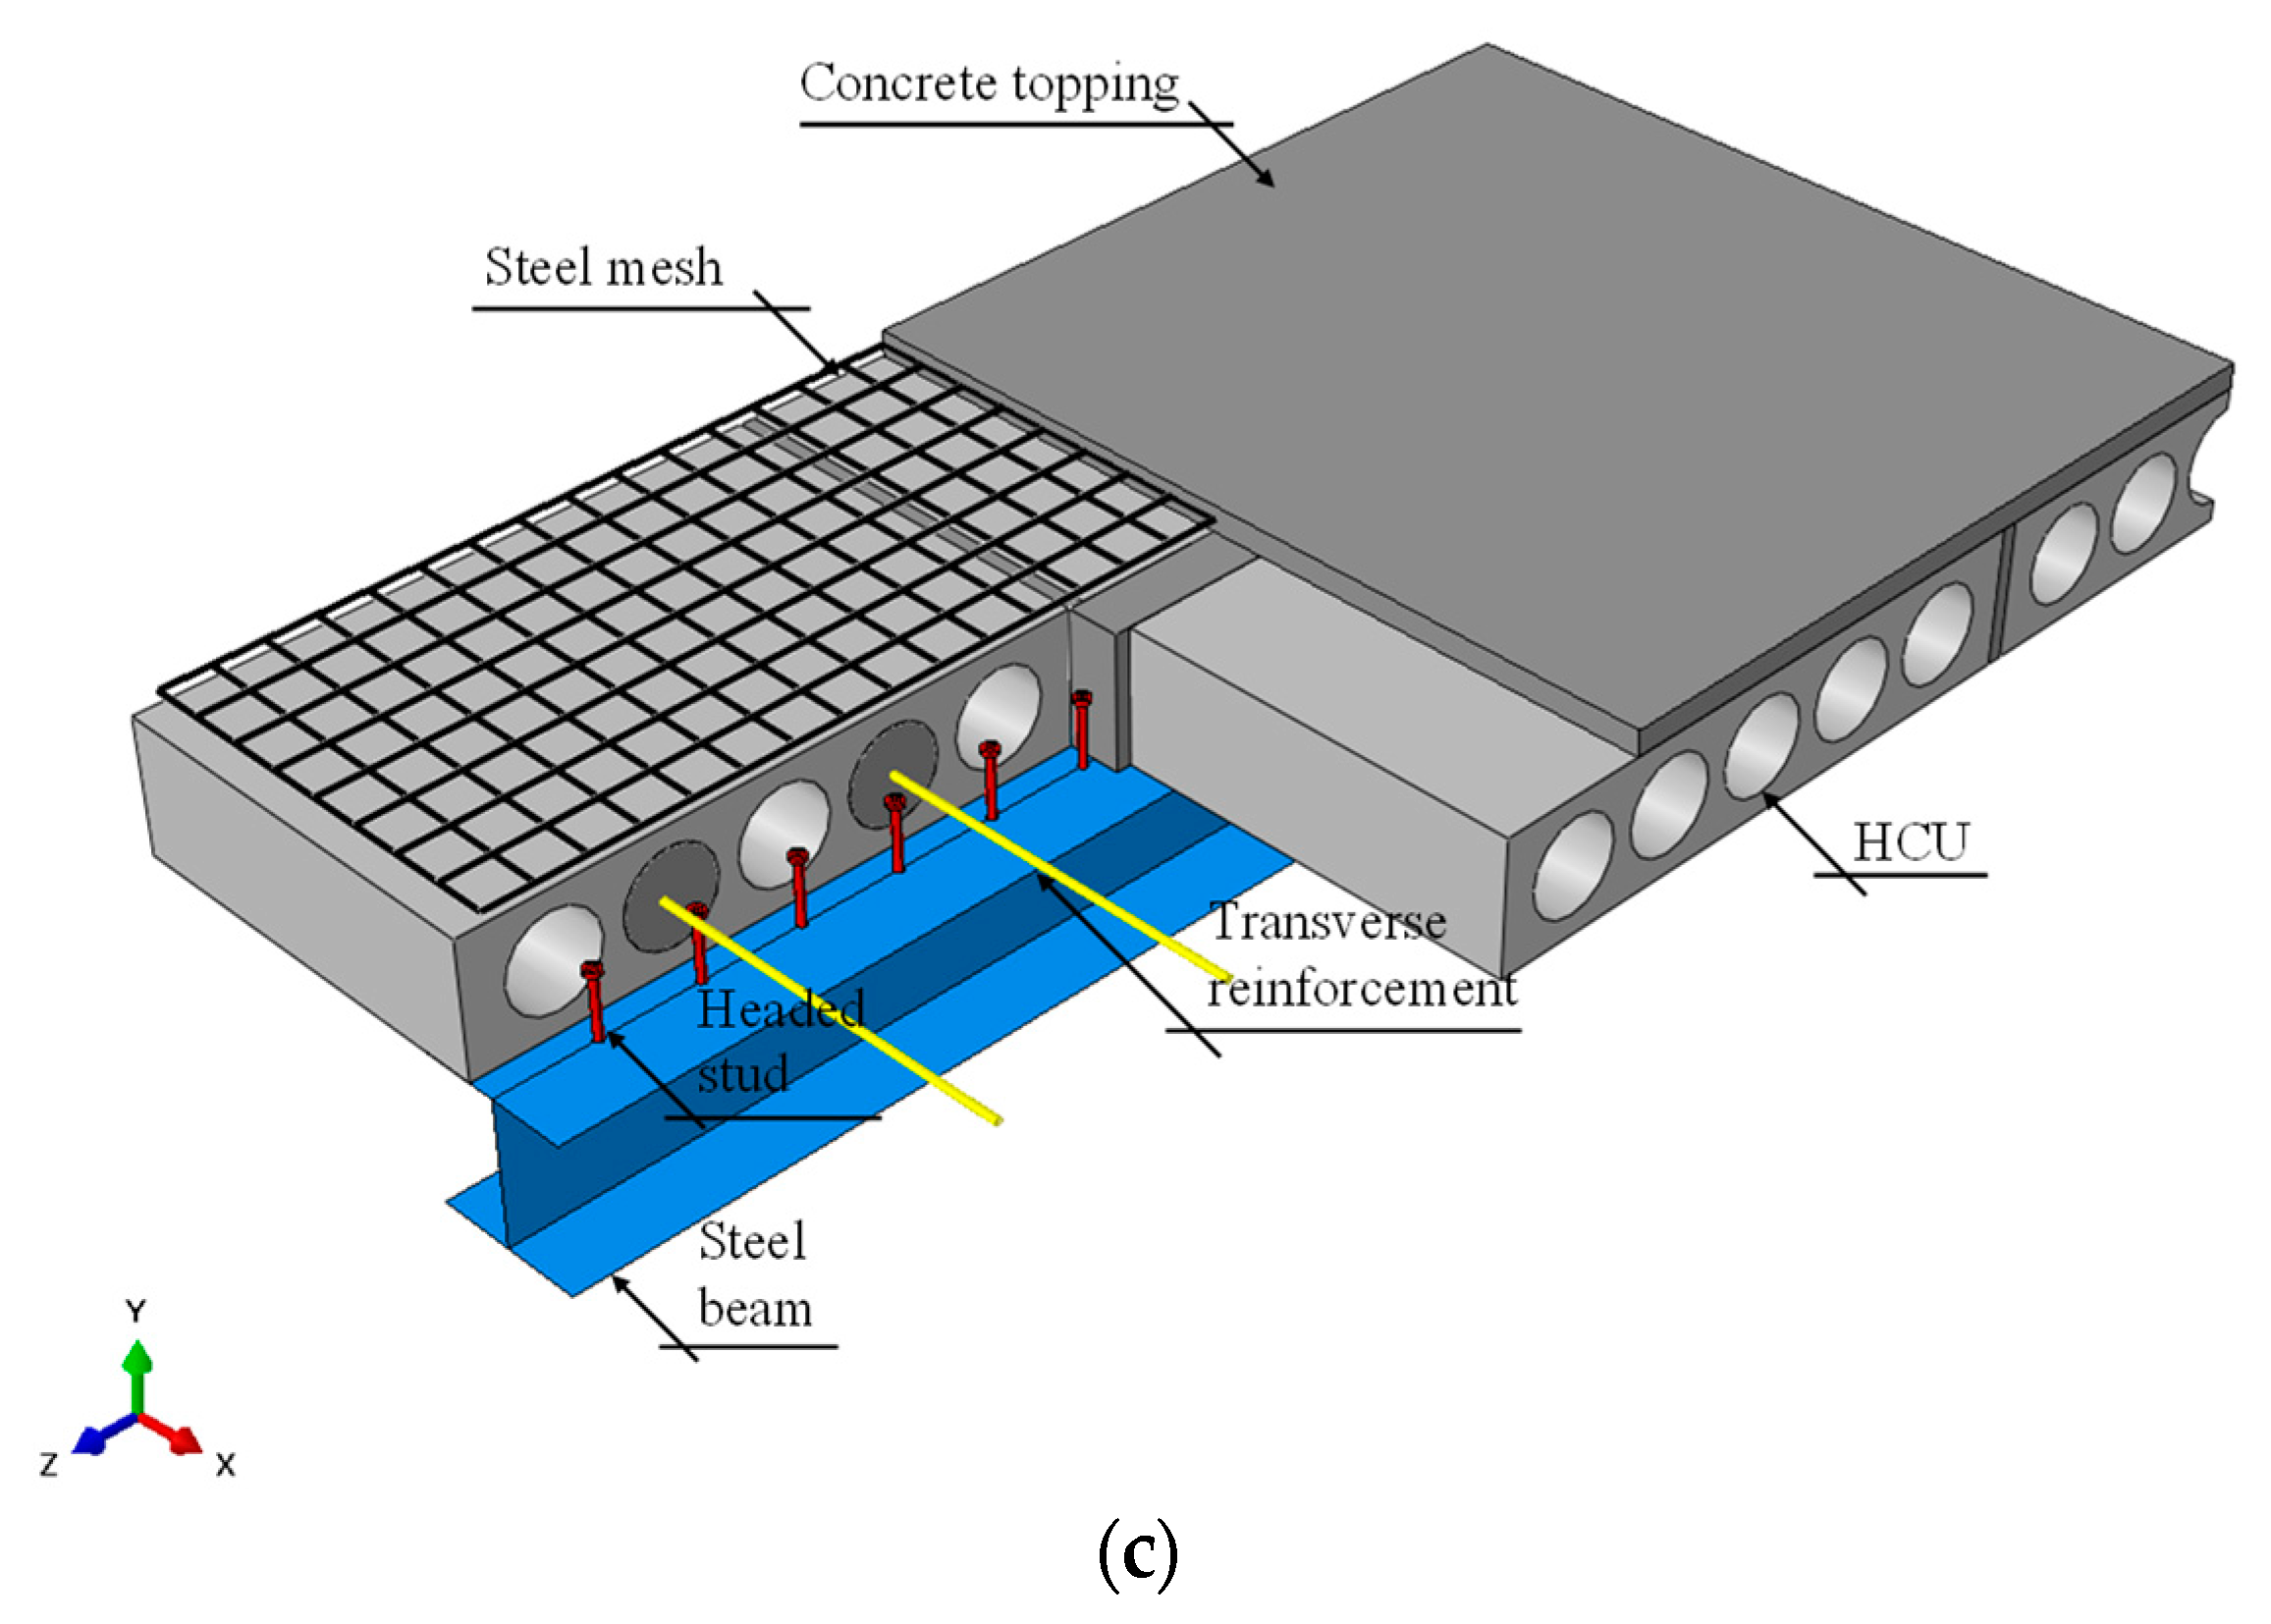
3.1. Tests
3.2. Materials
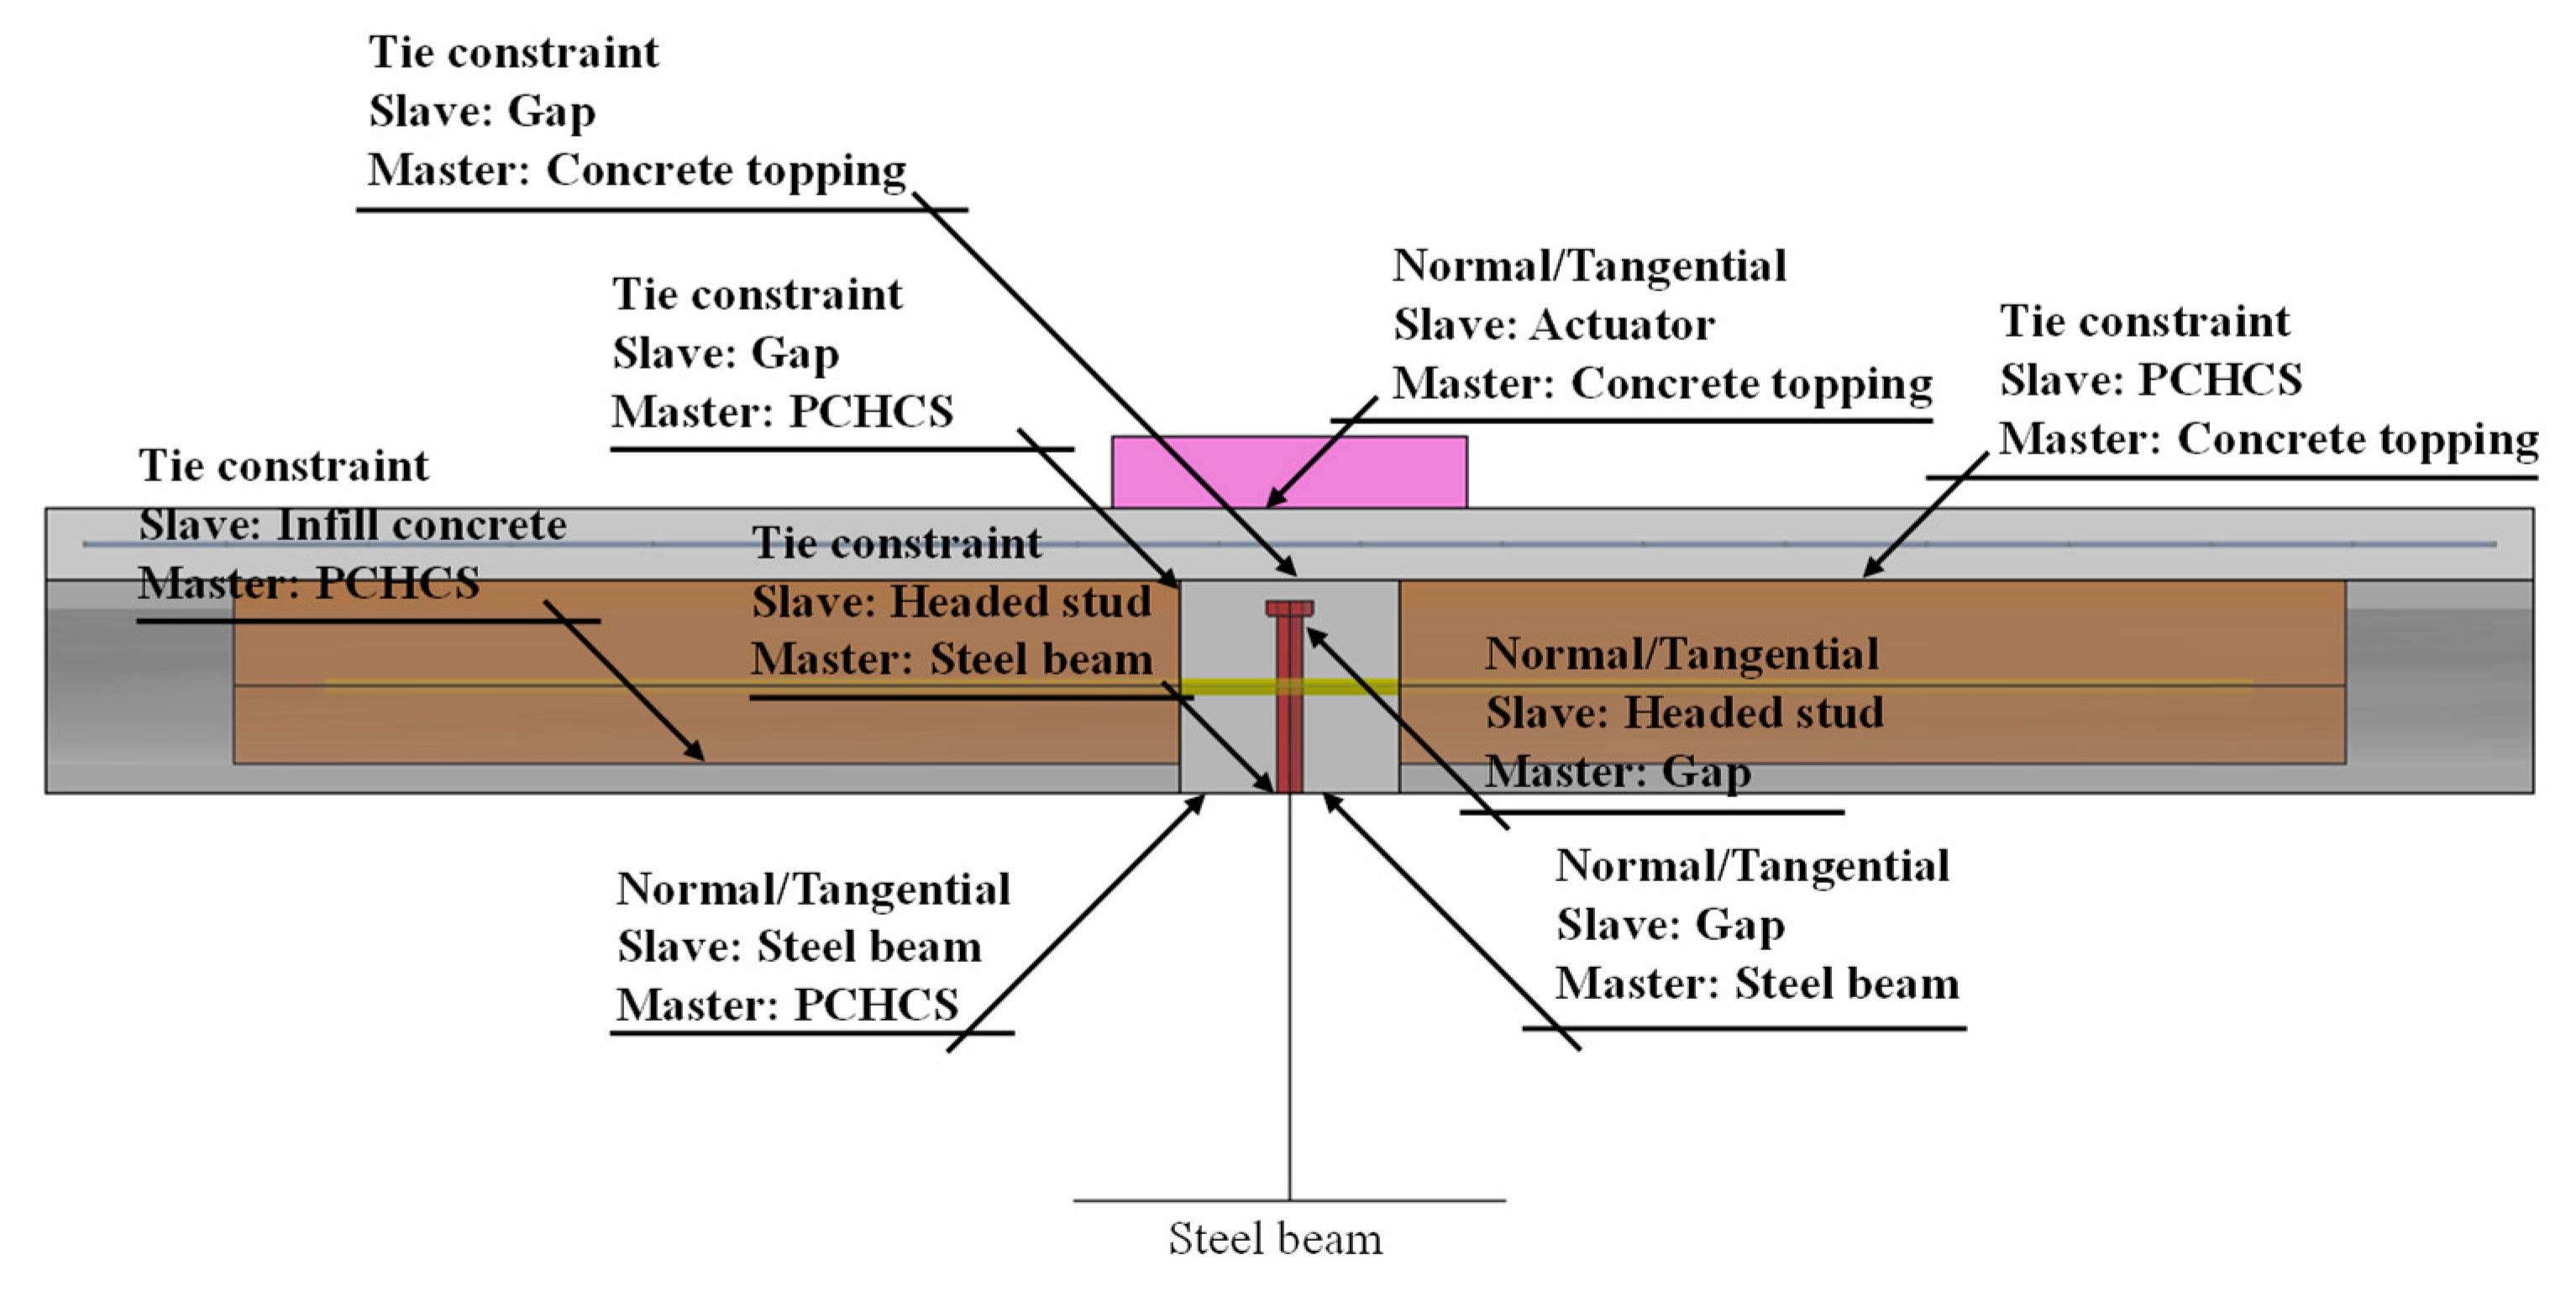
3.3. Interaction
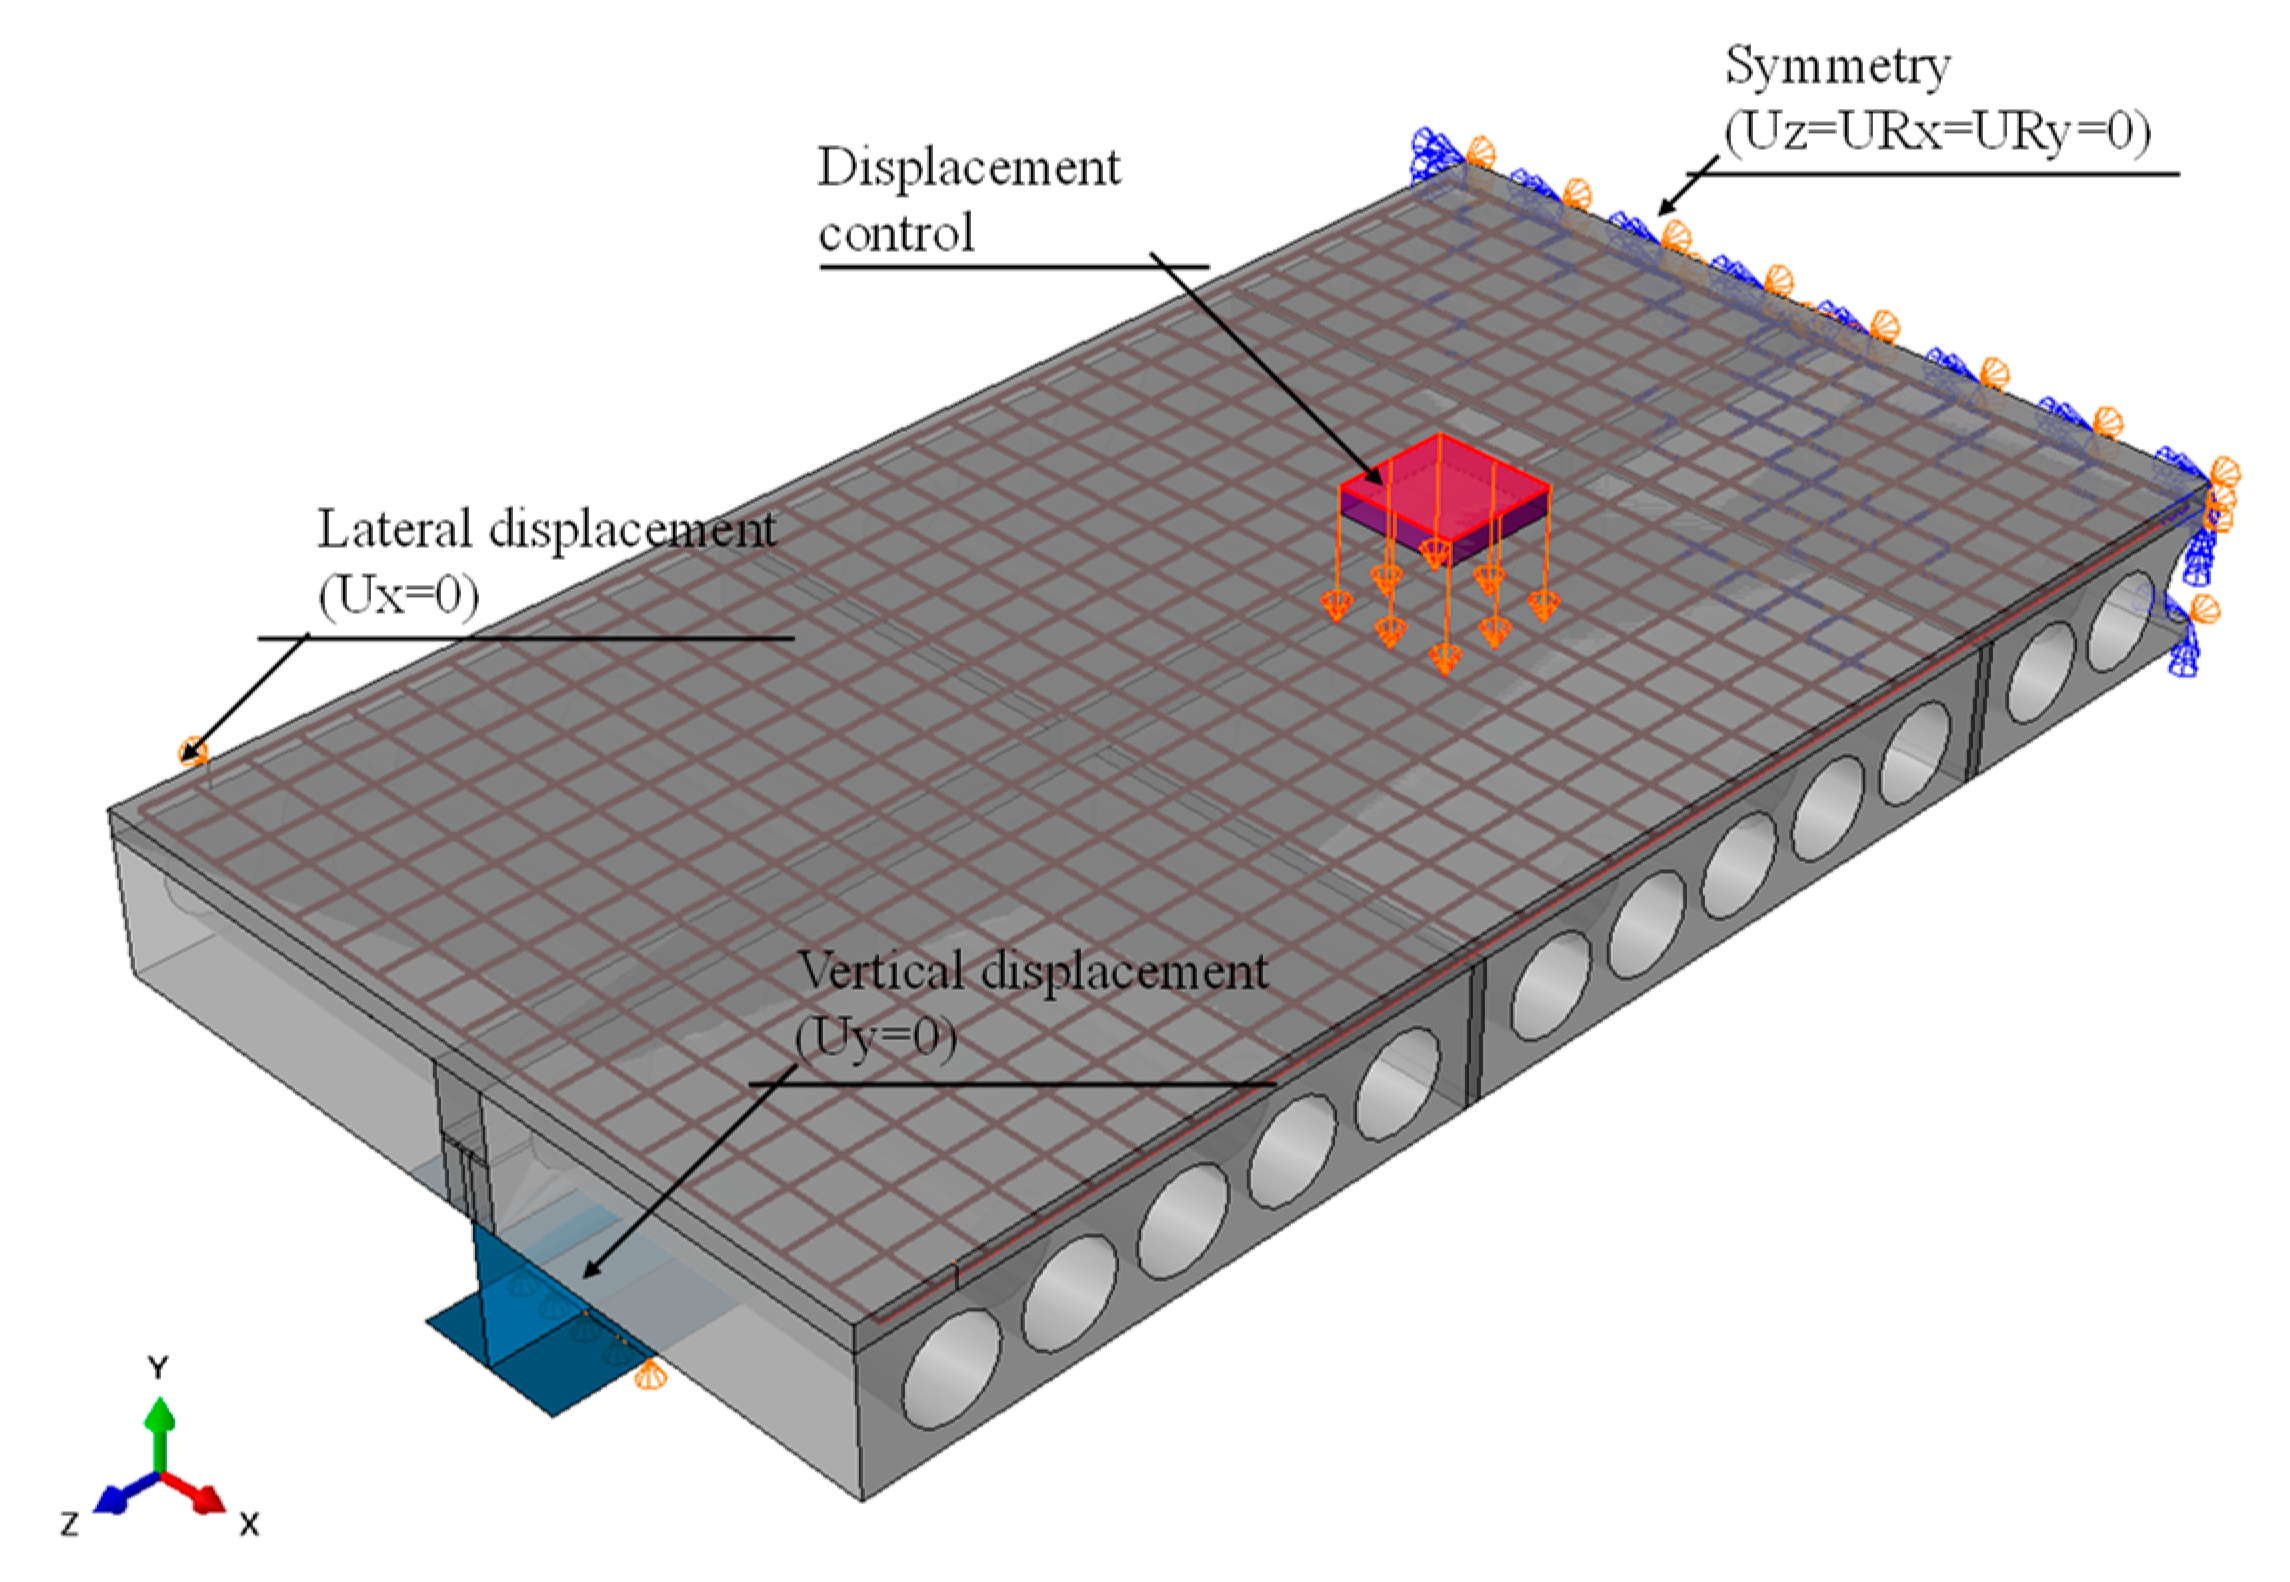
3.4. Boundary Conditions
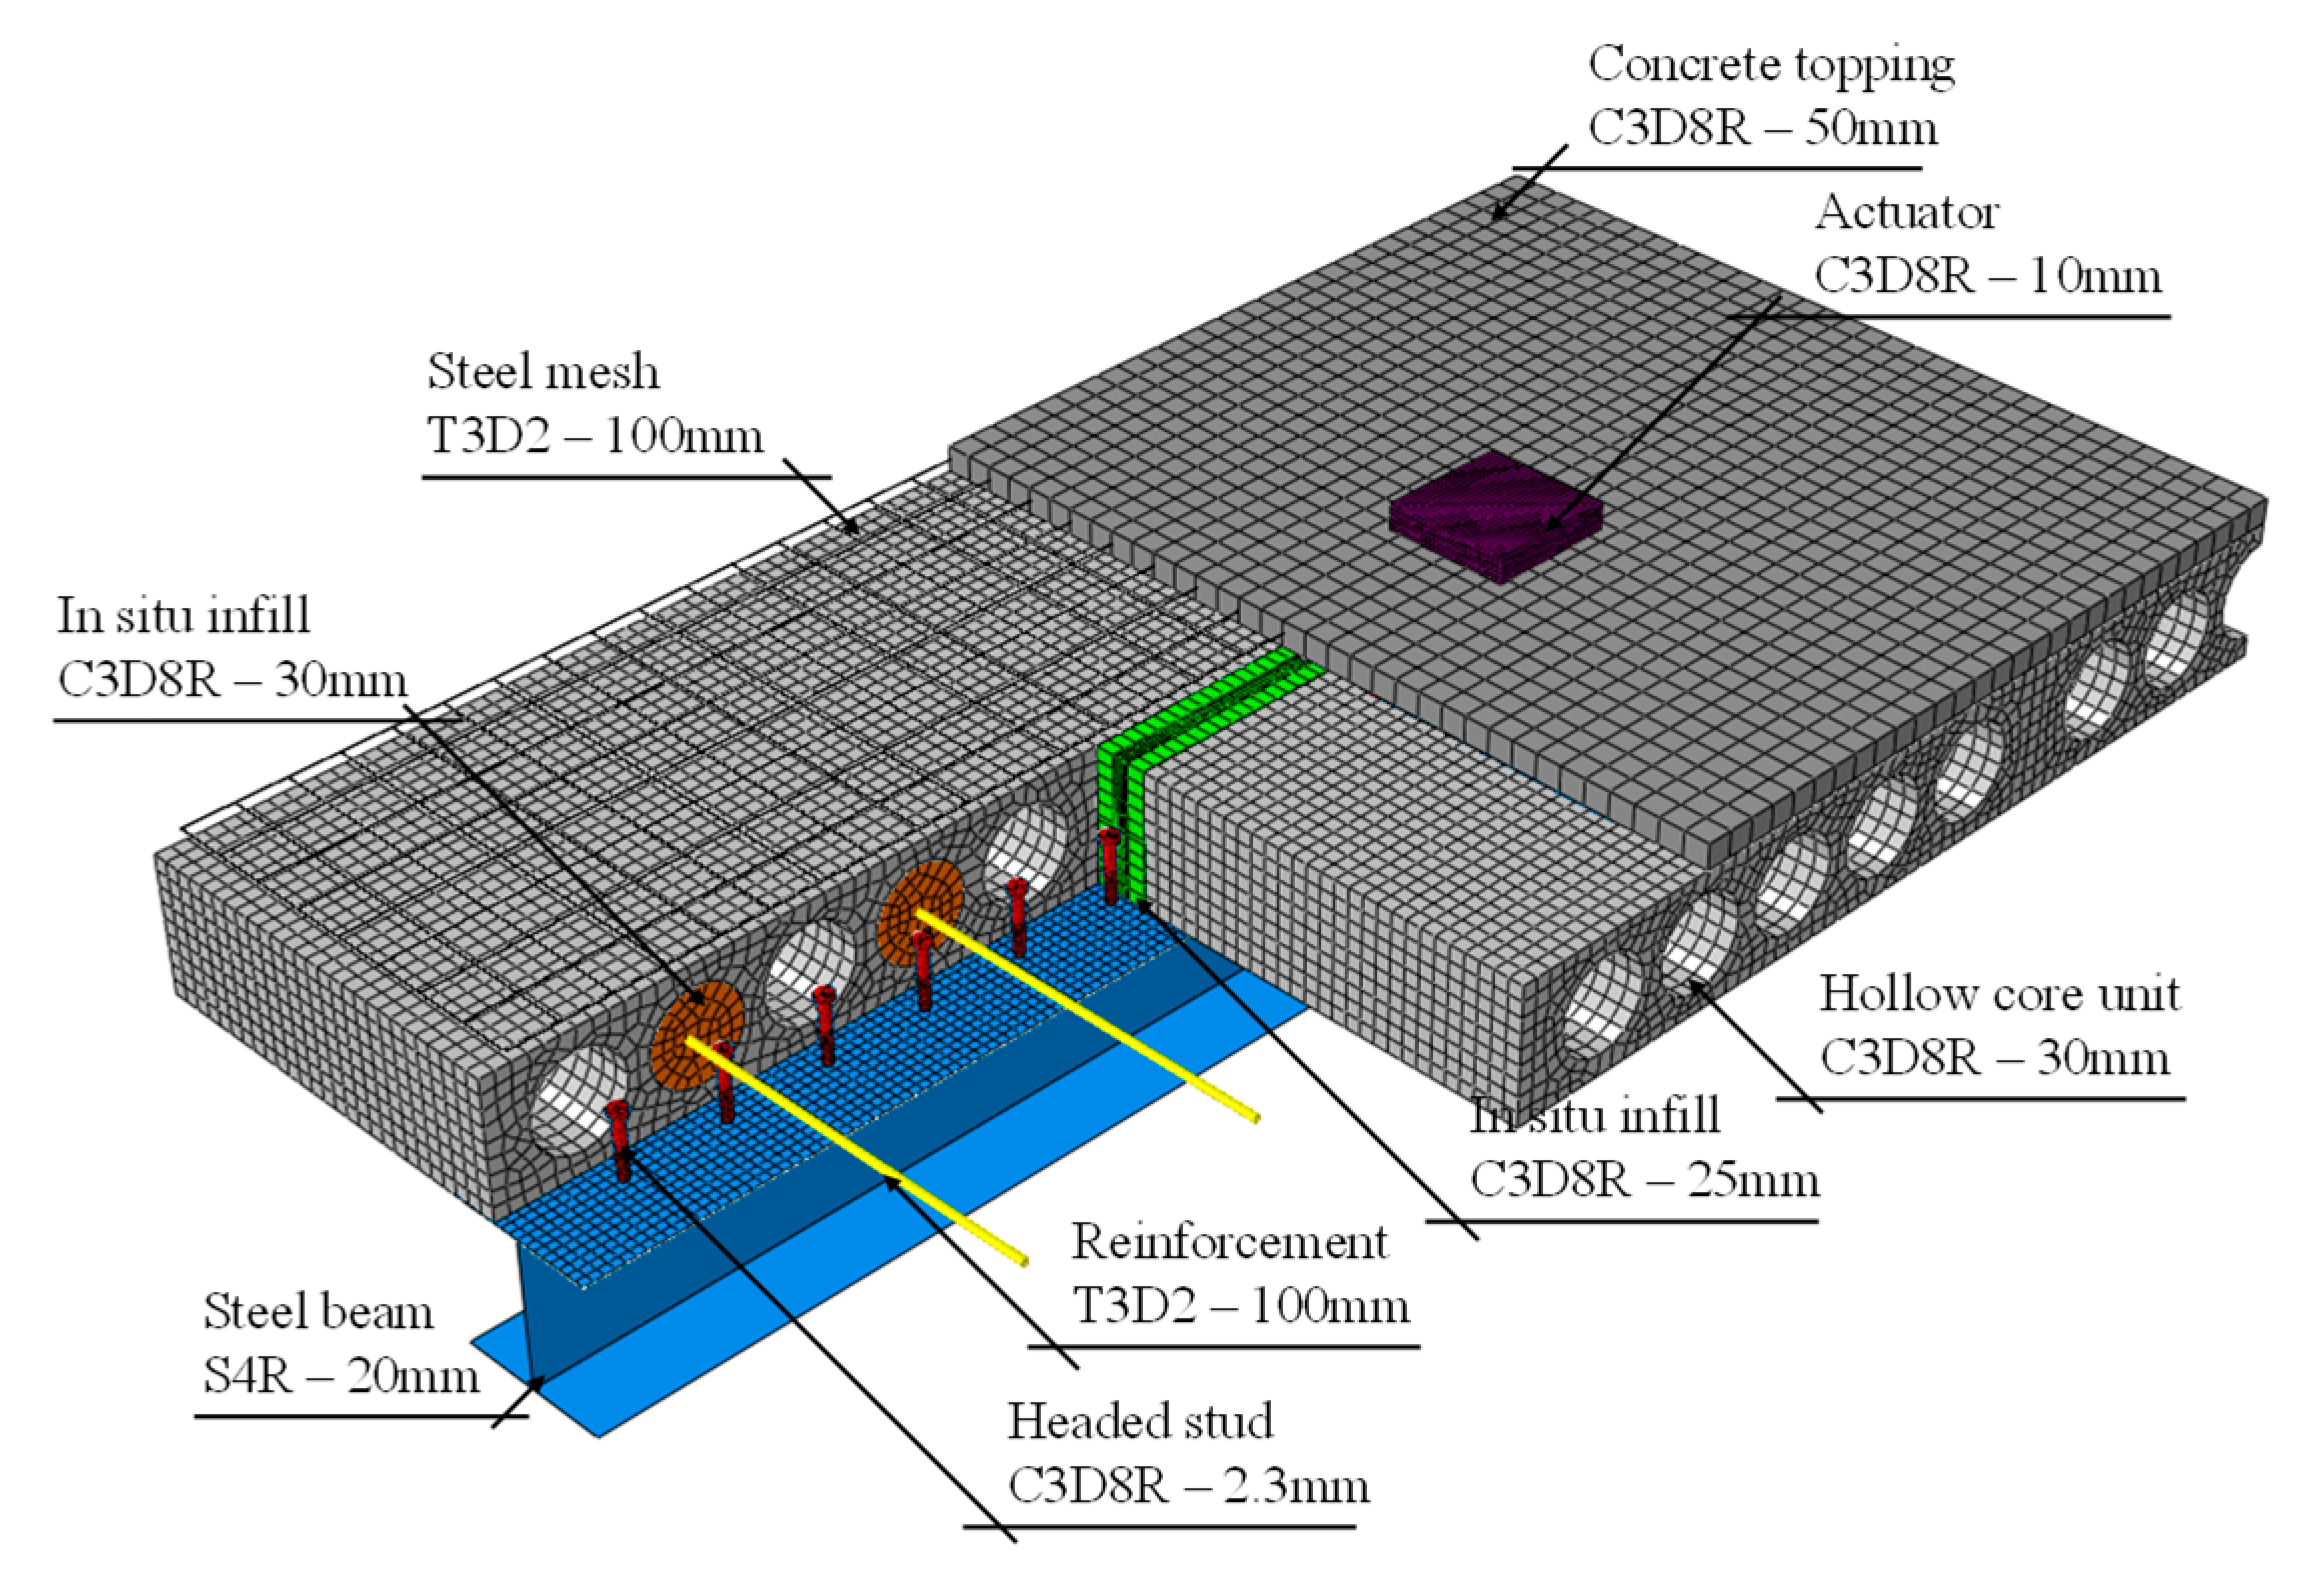
3.5. Discretization
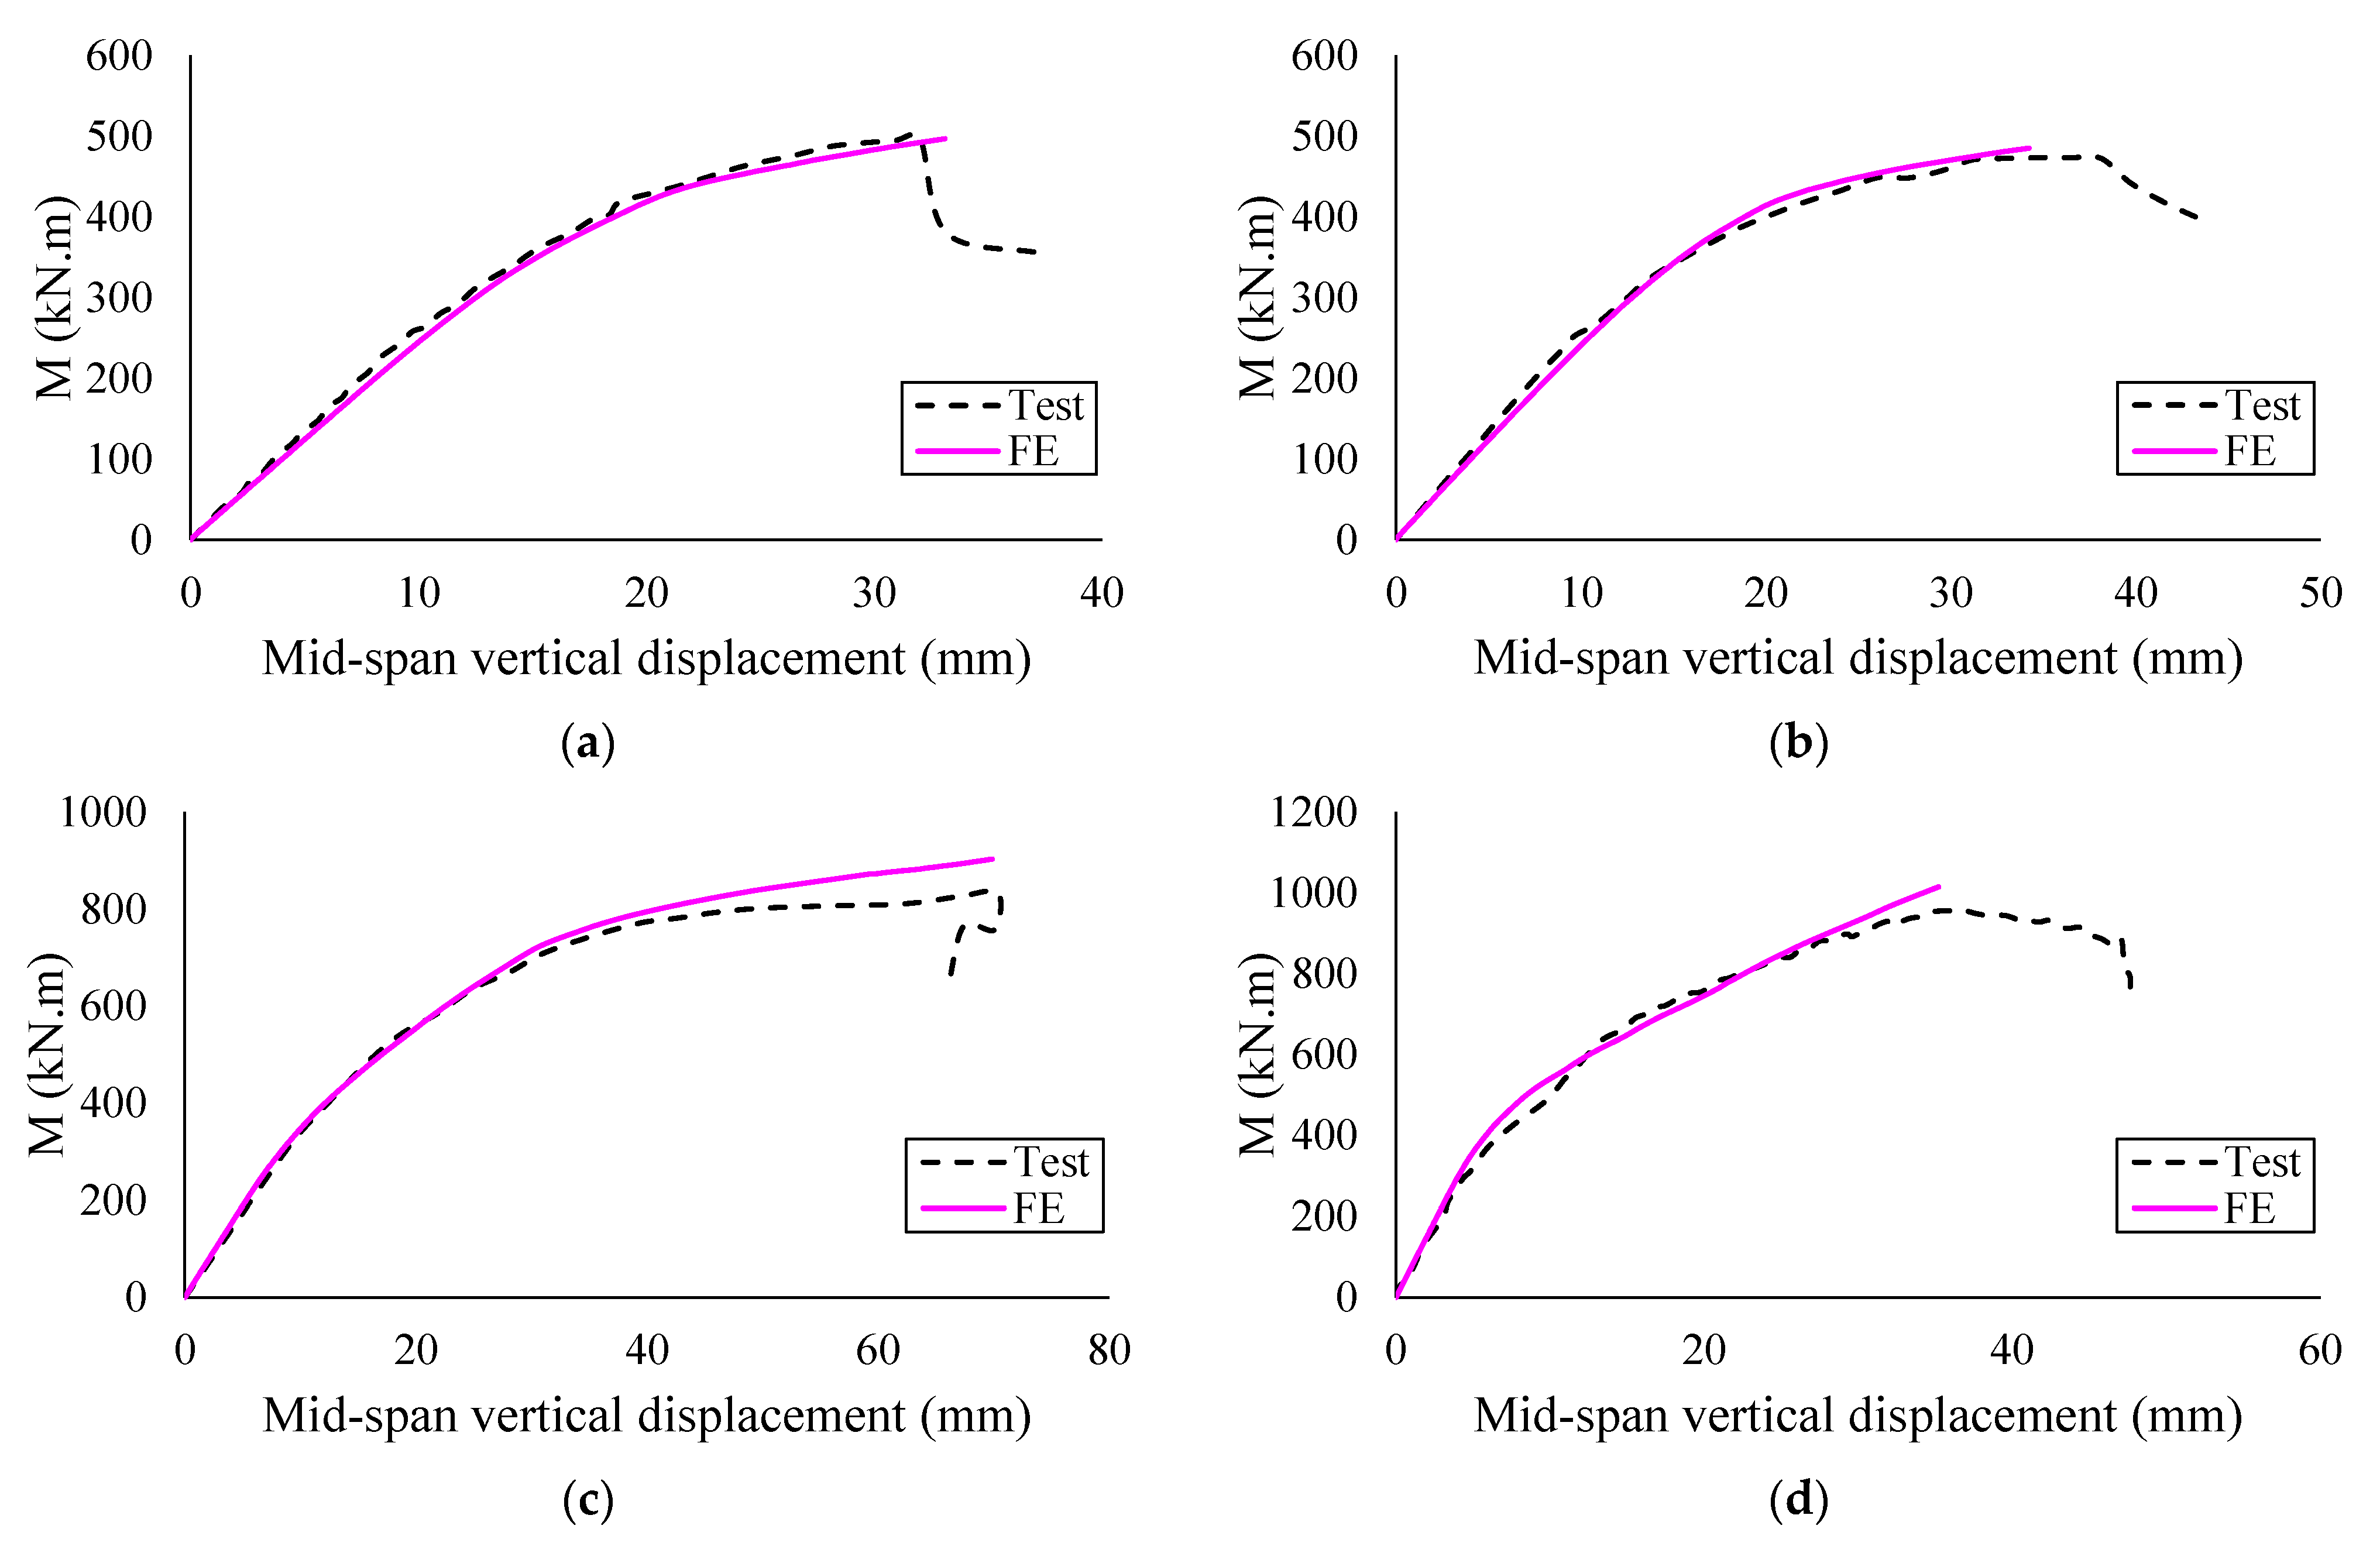
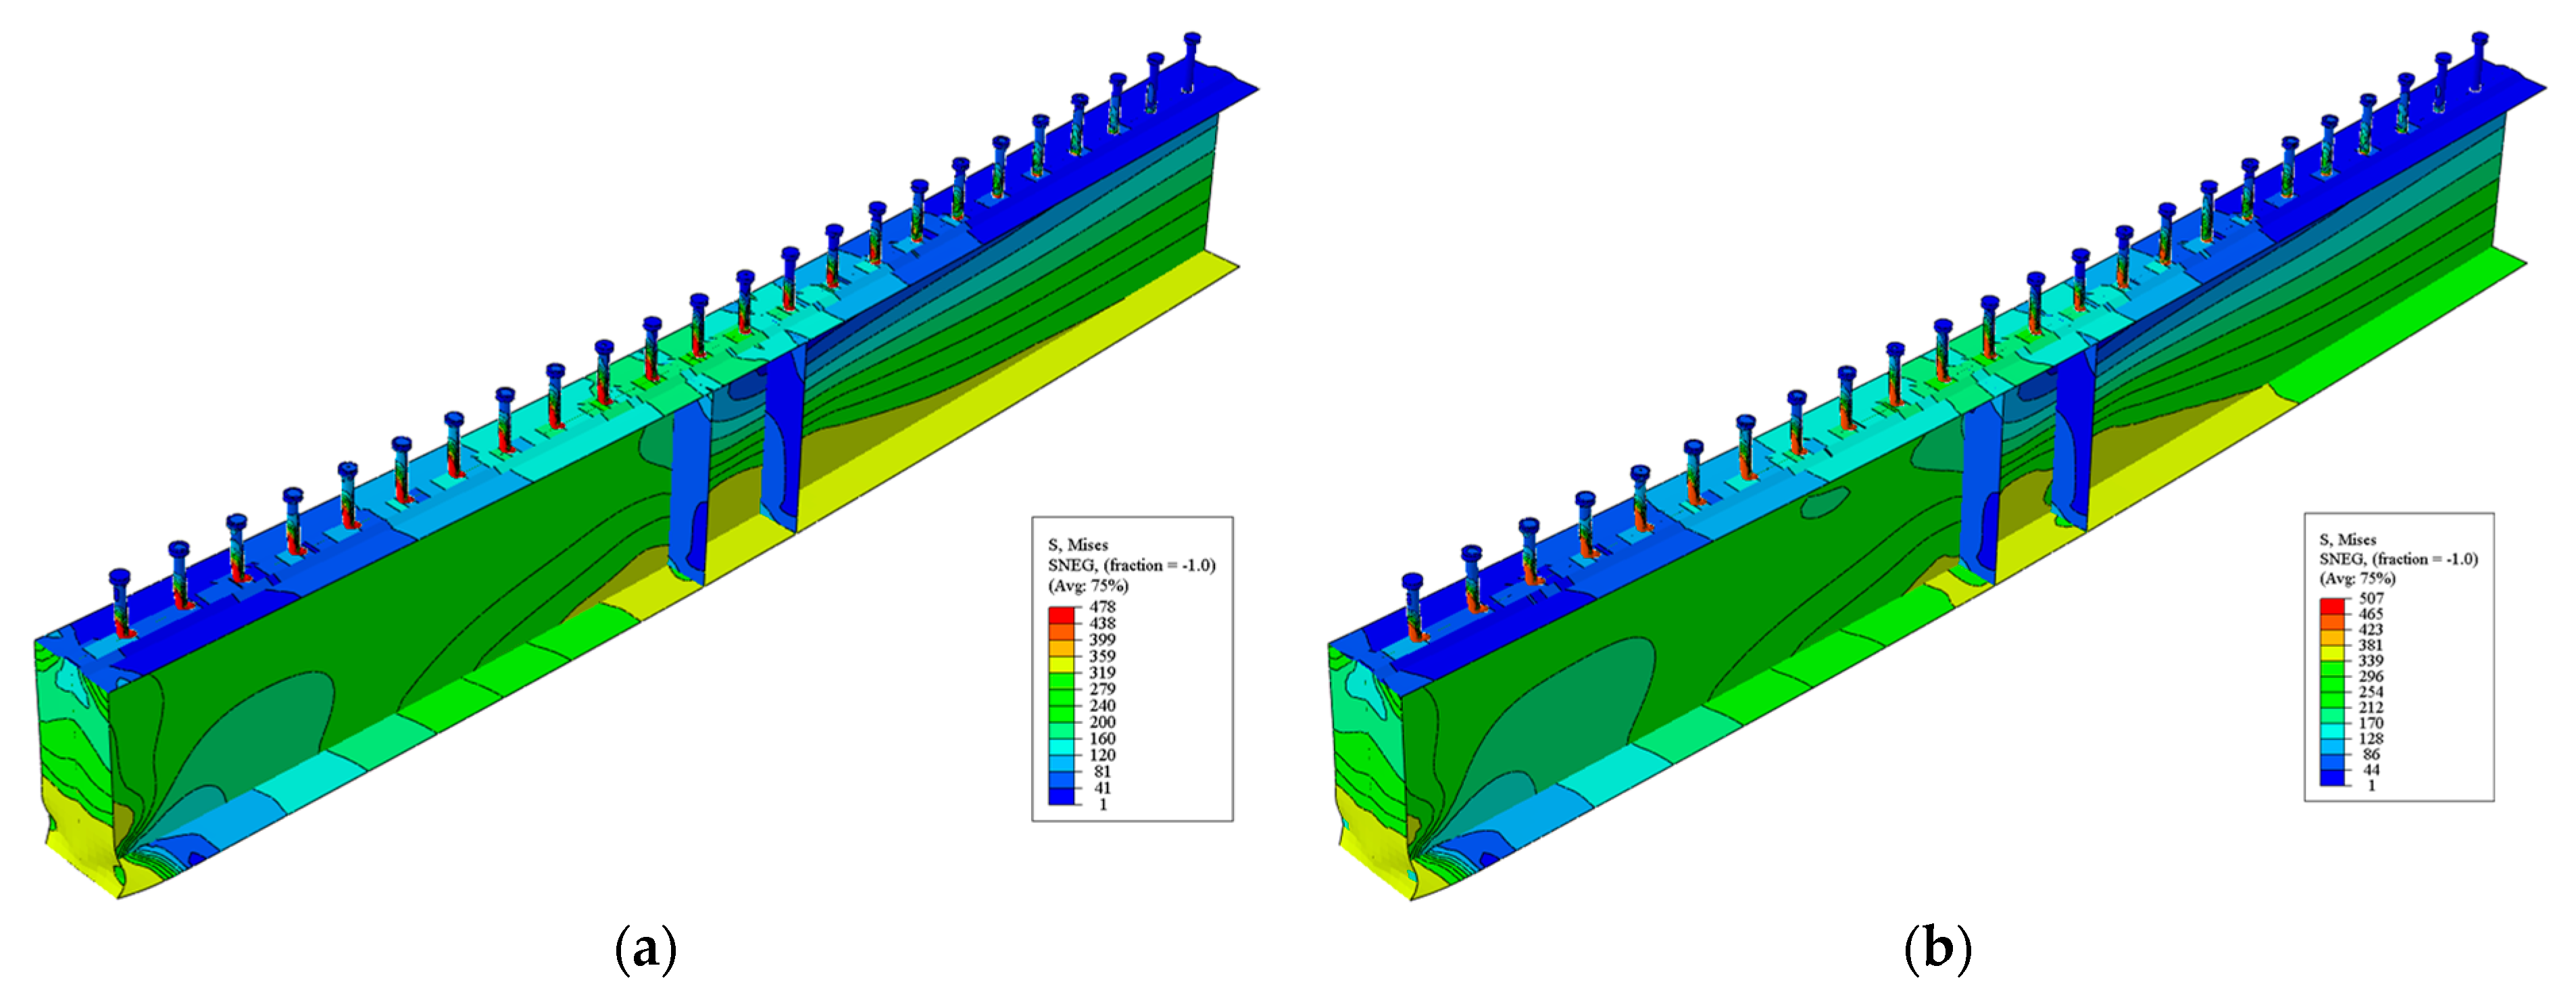
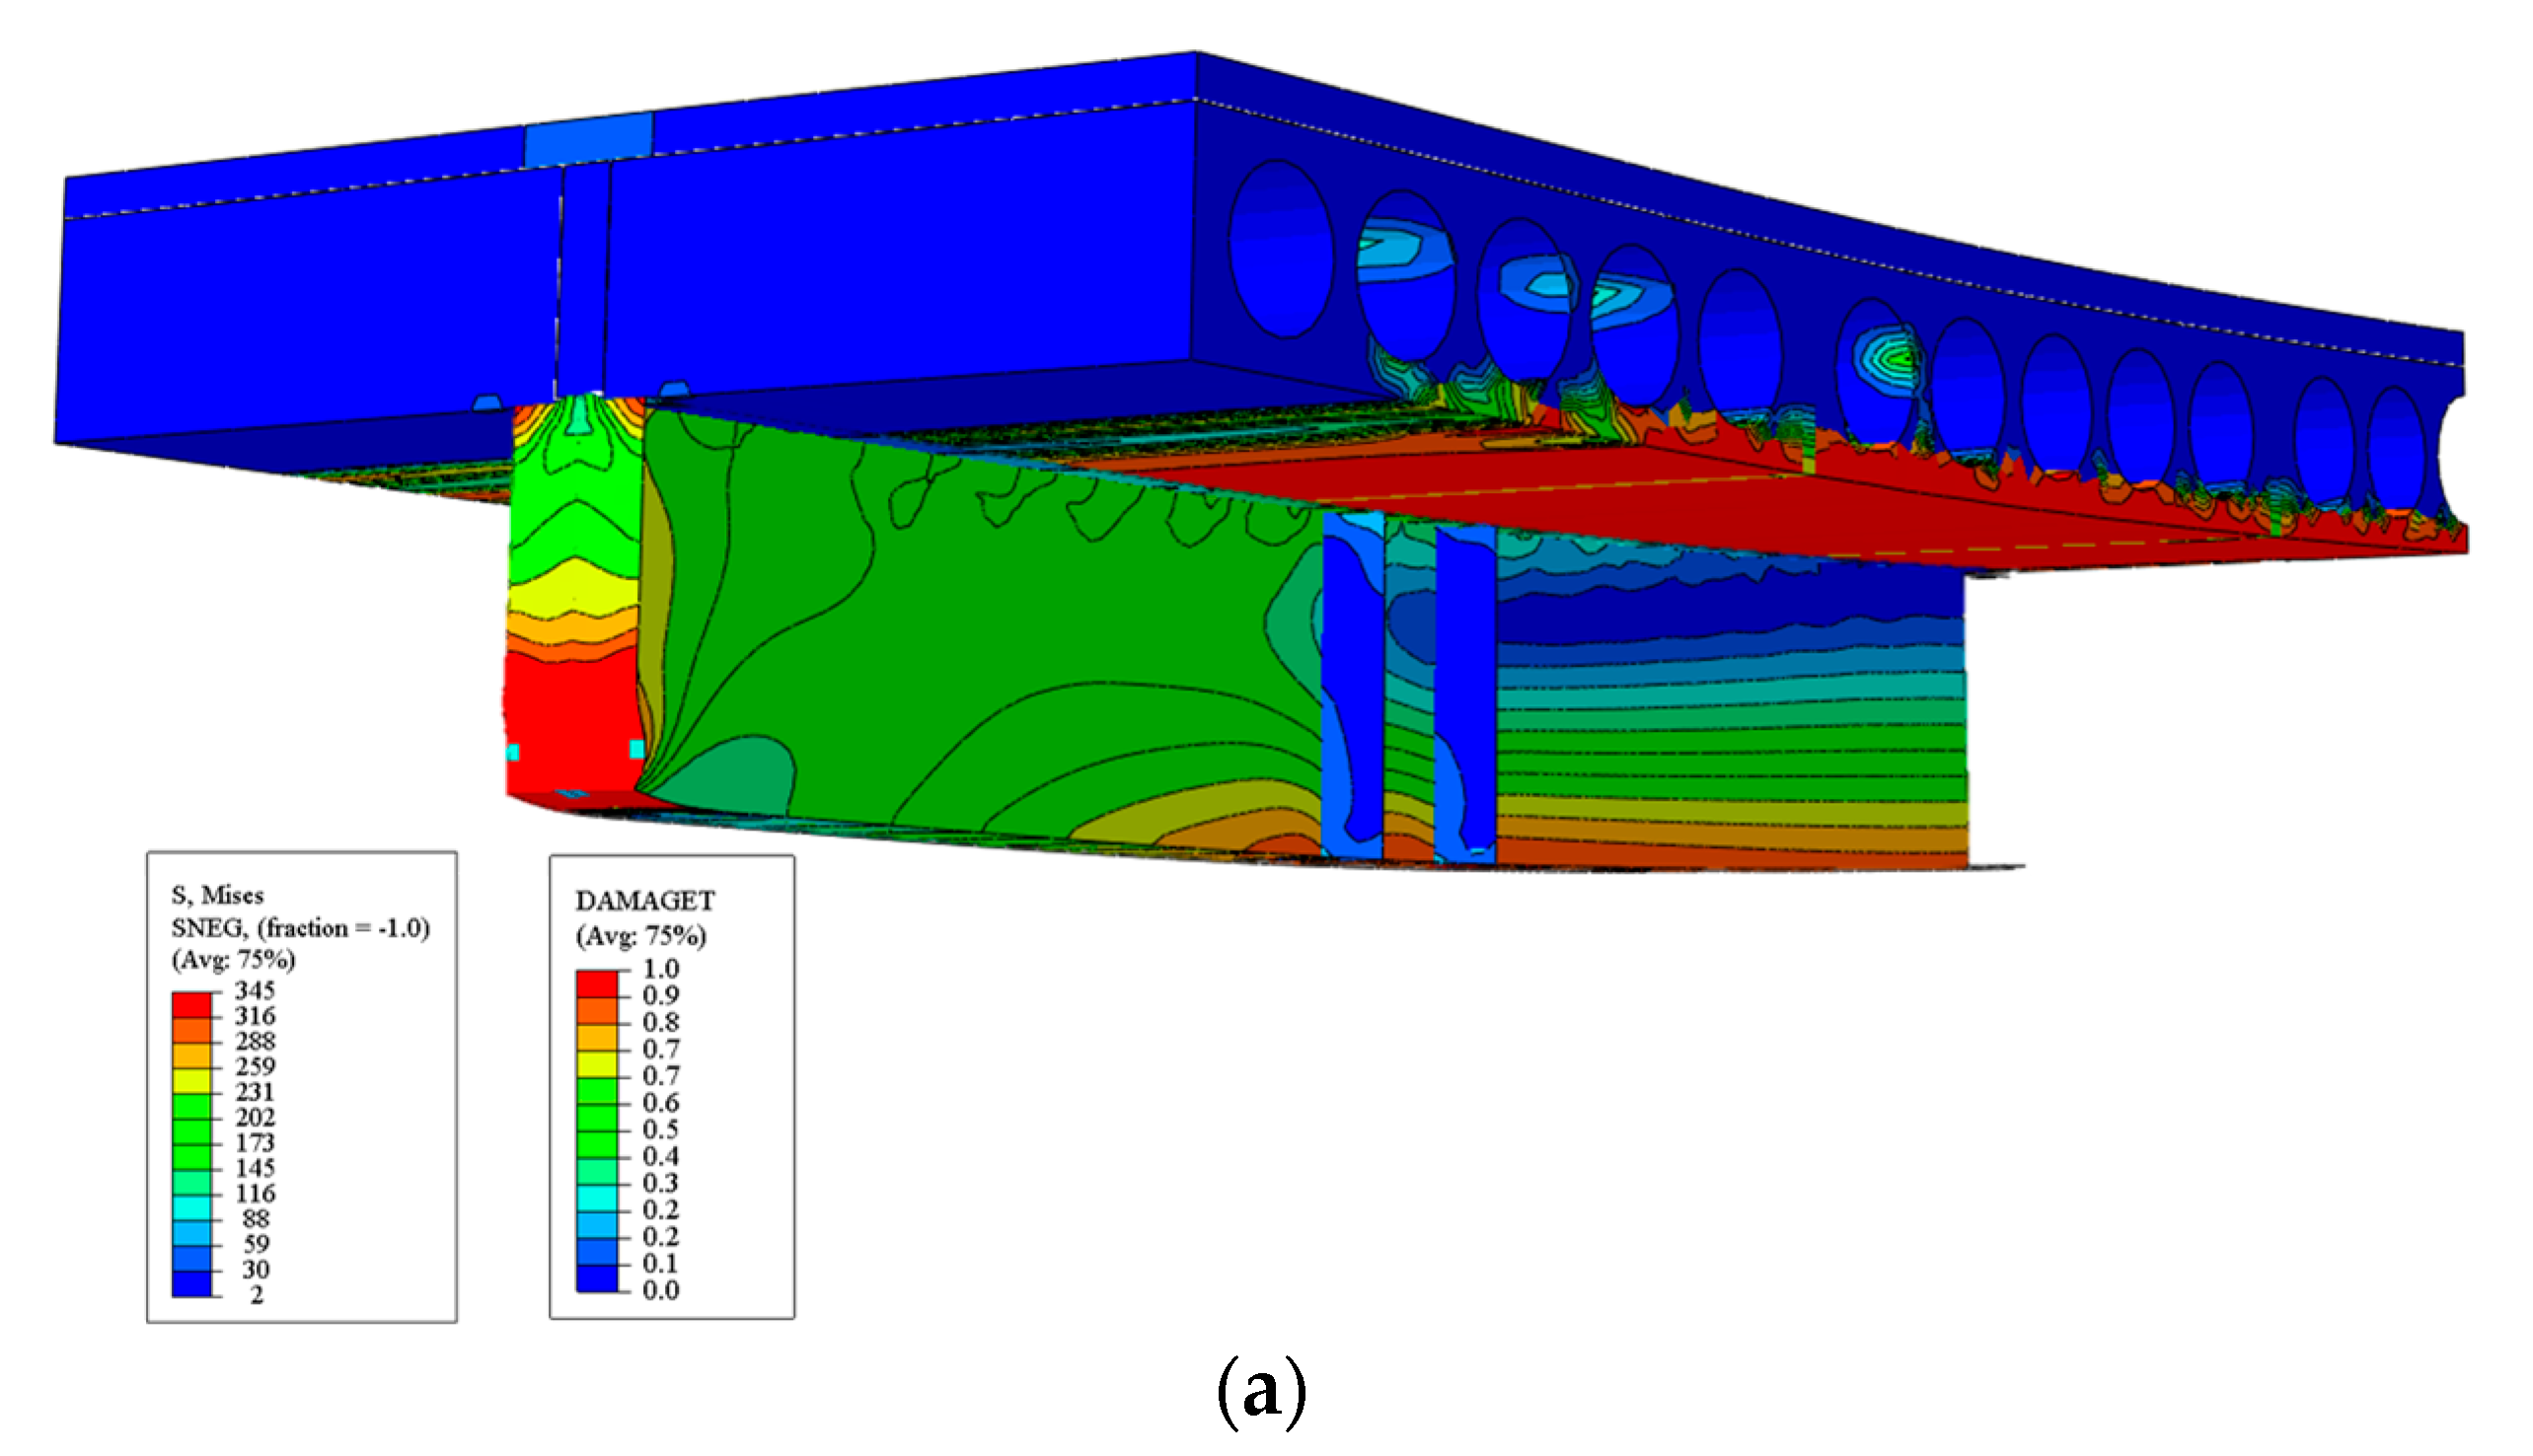
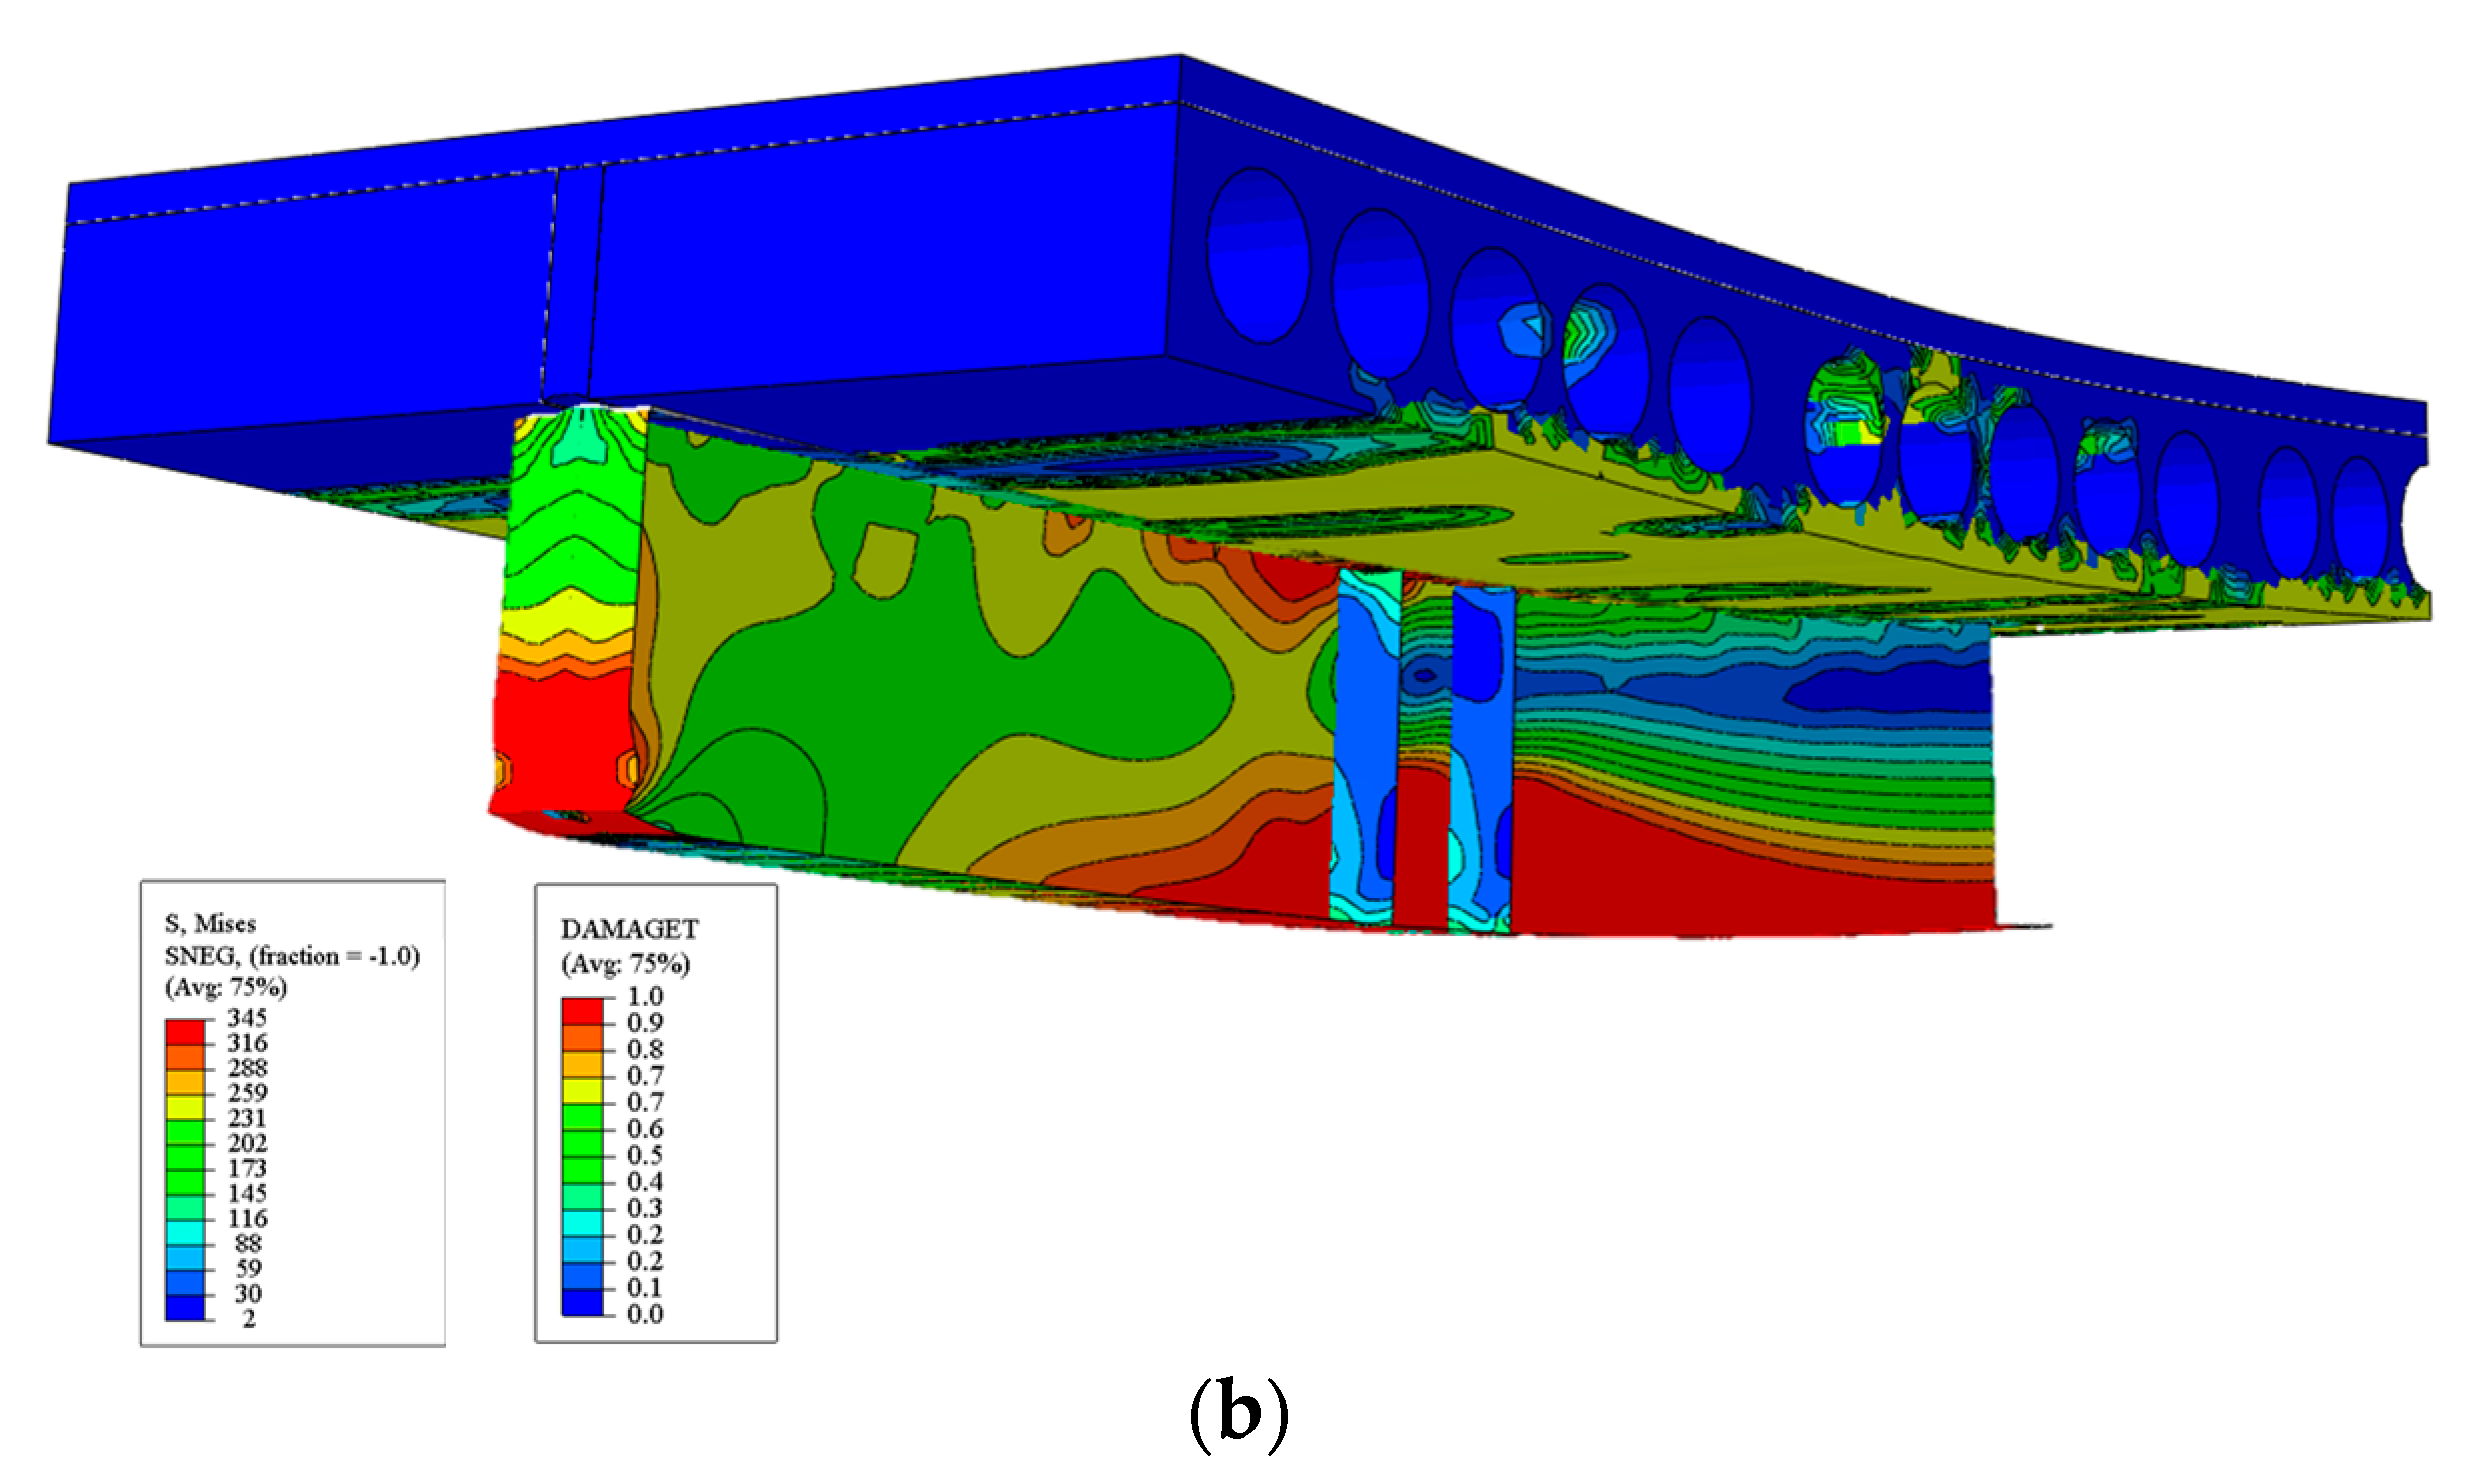
3.6. Results
4. Numerical Model: Parametric Study
- The thickness of the concrete topping was 50 mm;
- The total transverse reinforcement length was 1000 + g, in mm;
- For the steel beam, the ASTM A572 Gr.50 steel was adopted (fy = 345 MPa). The Young’s module and the Poisson’s ratio were 200 GPa and 0.3, respectively;
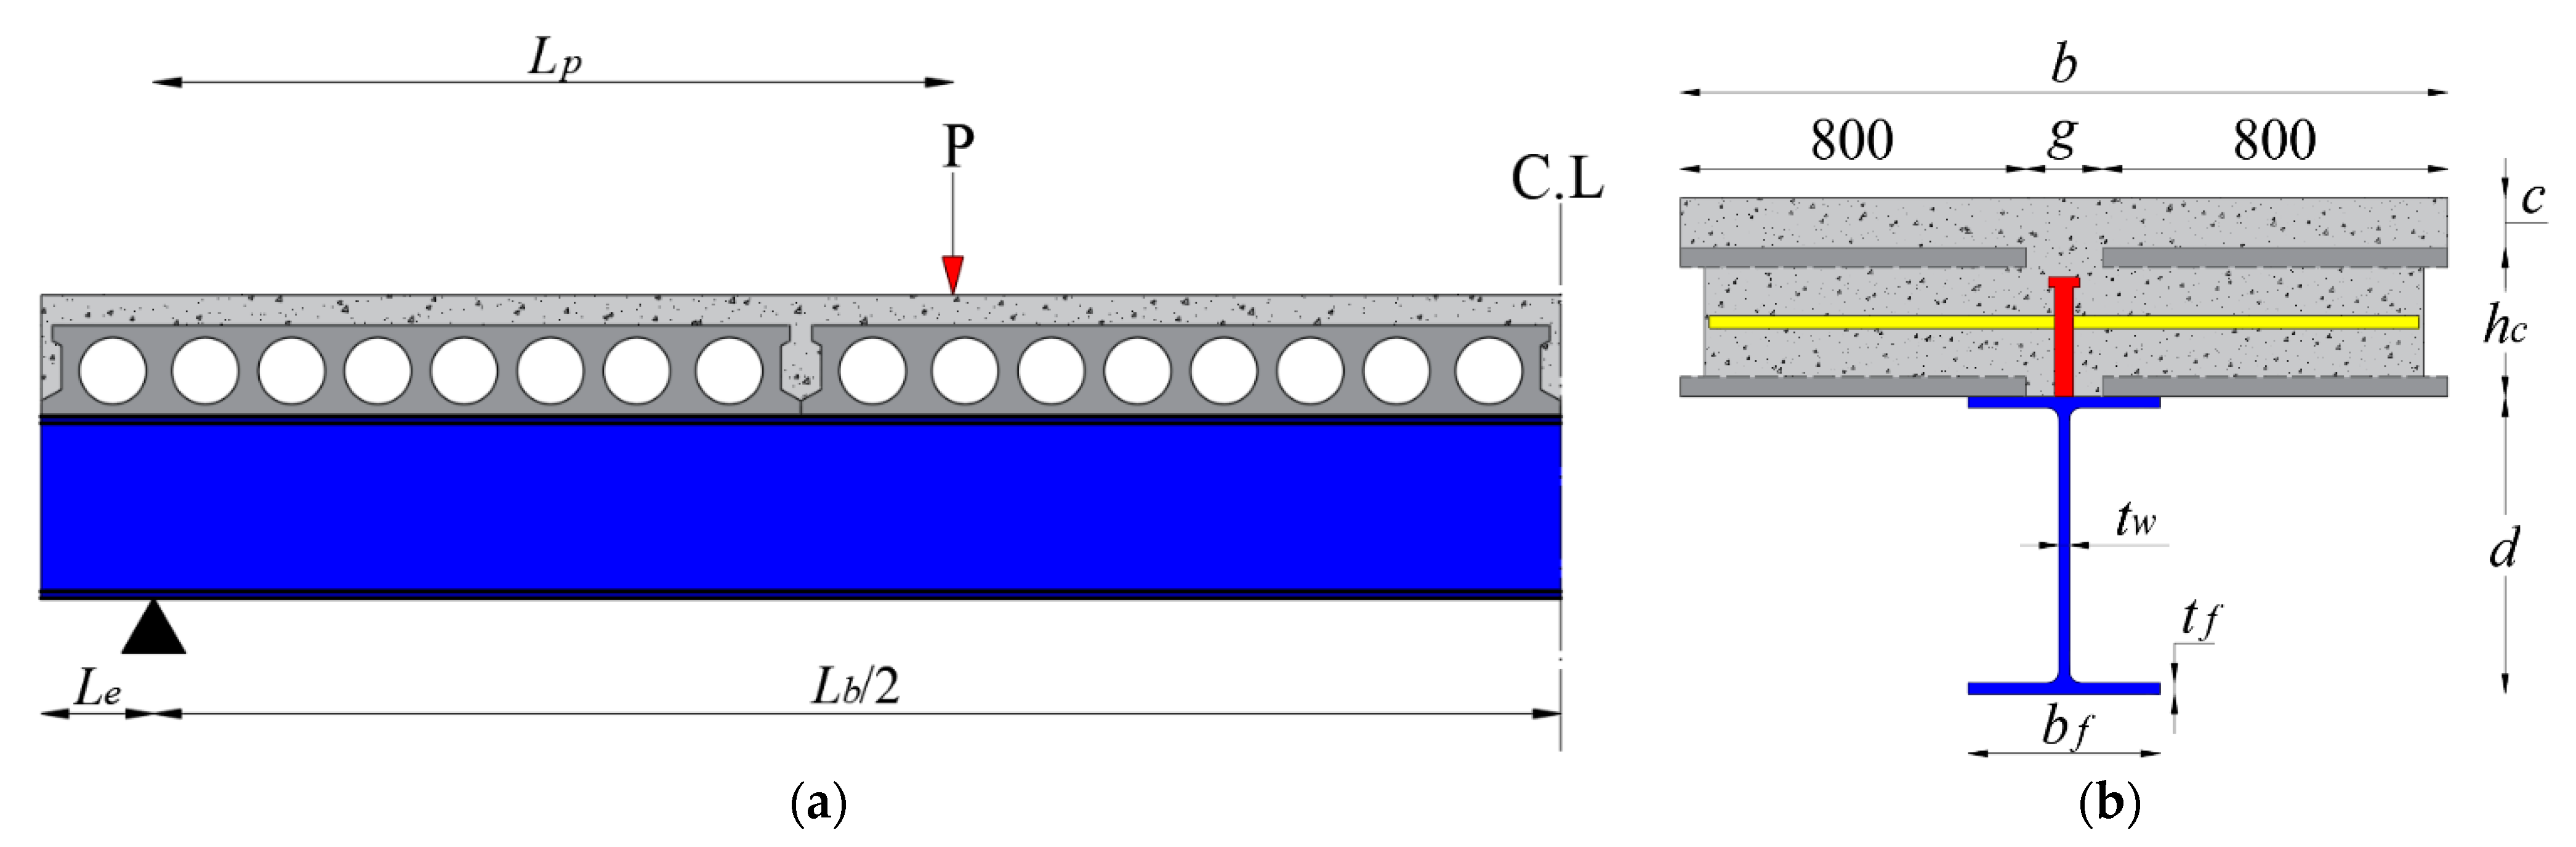
- The composite beams were simply supported, and subjected to four-point bending. The loads were spaced in L/4 from each support. Stiffeners were placed at the support and points of loads;
- The midspan vertical displacement of a maximum value equal to L/100 was adopted as a stopping criterion [25].
5. Results and Discussion
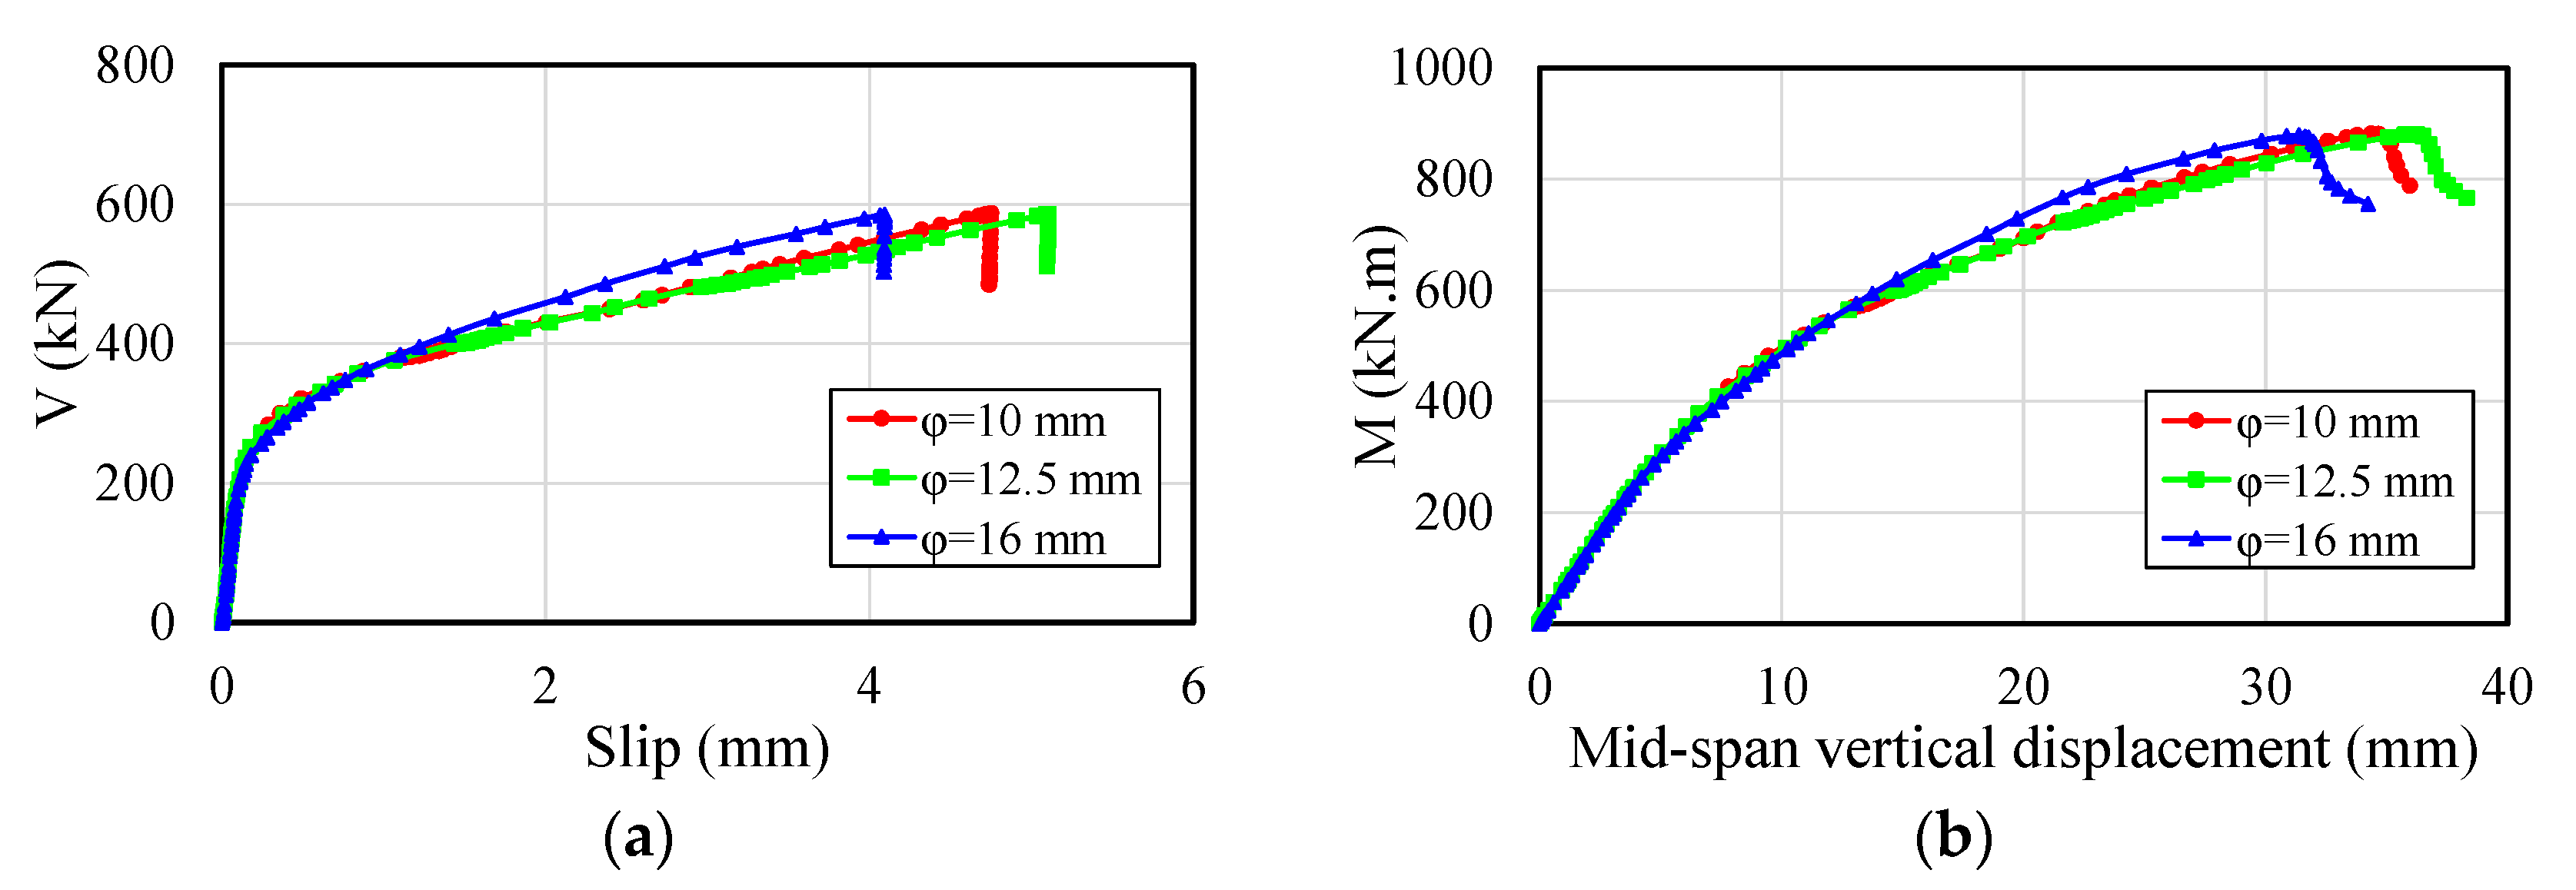
5.1. W360x51 Section
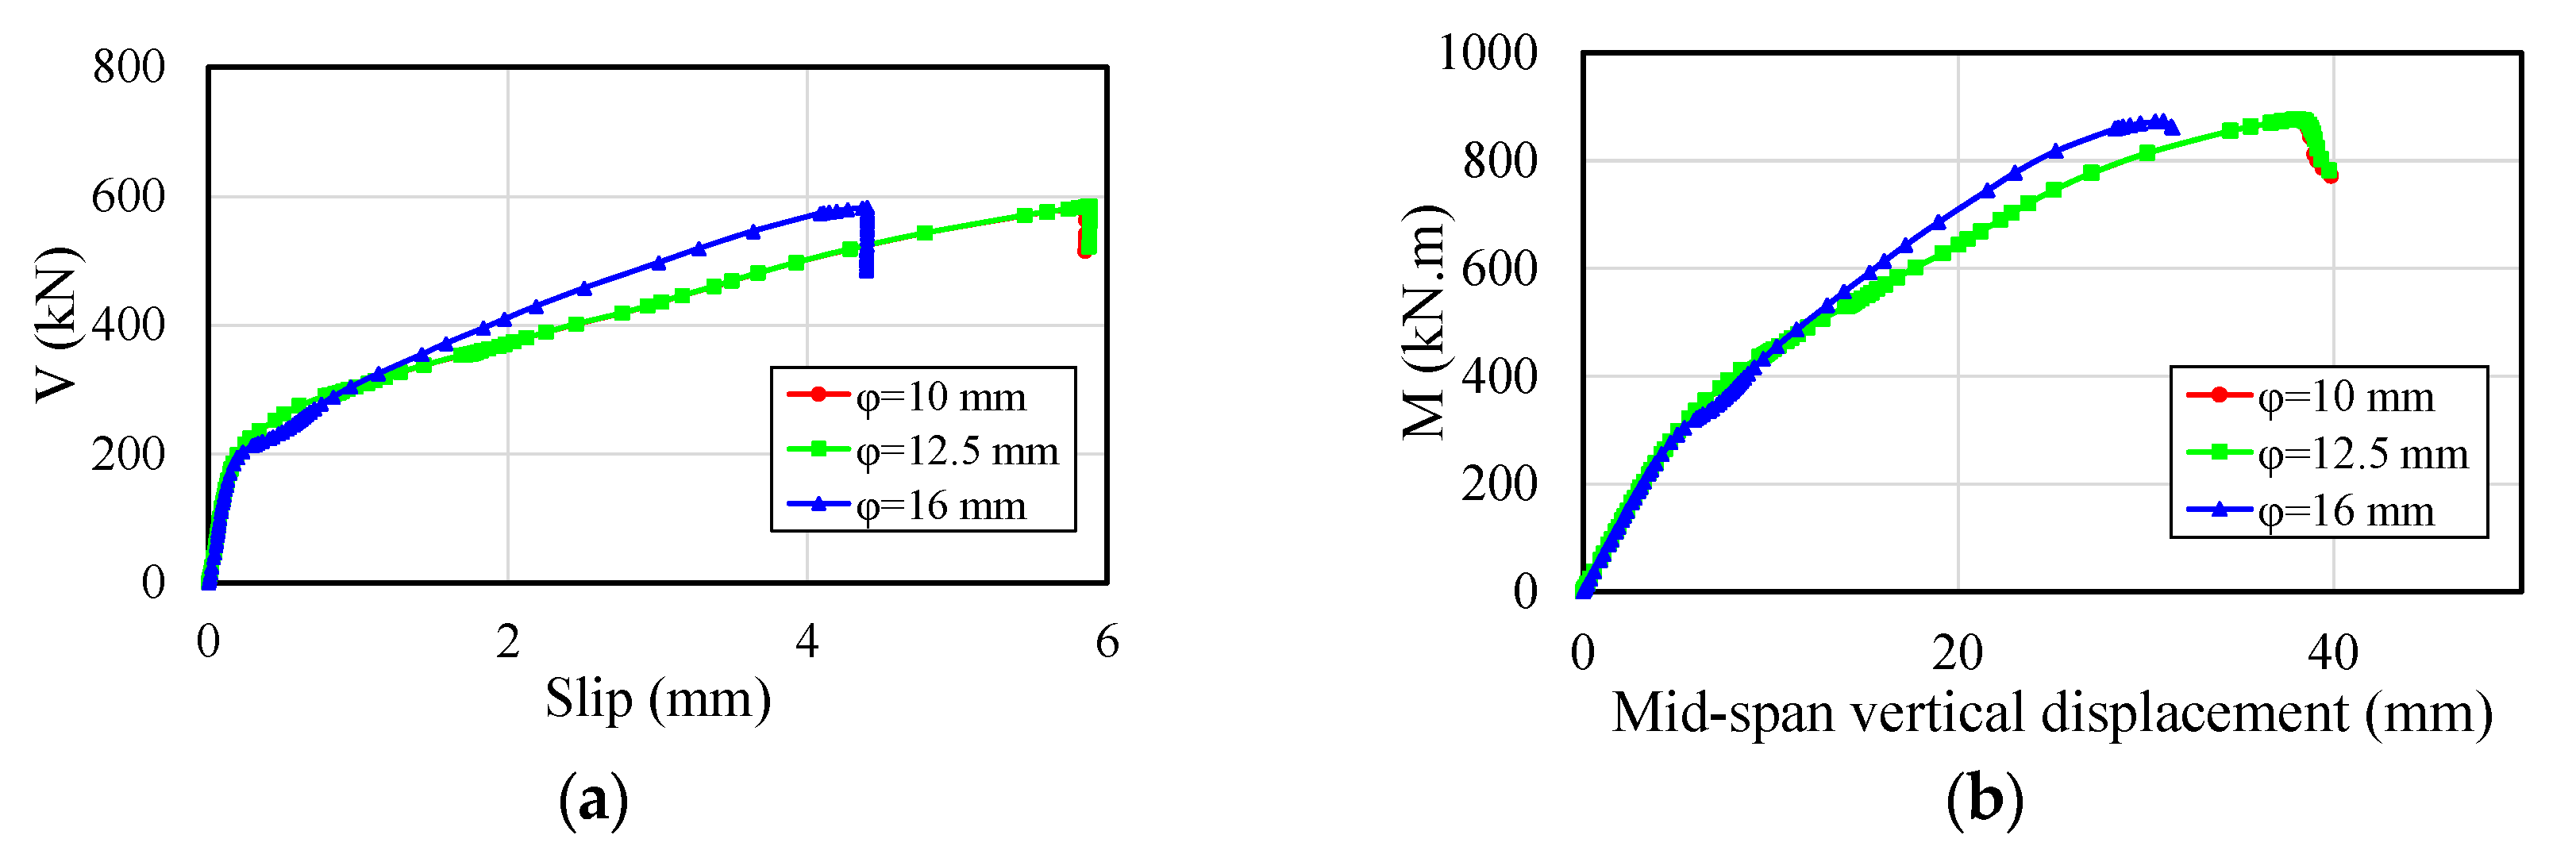
5.2. W460x74 Section
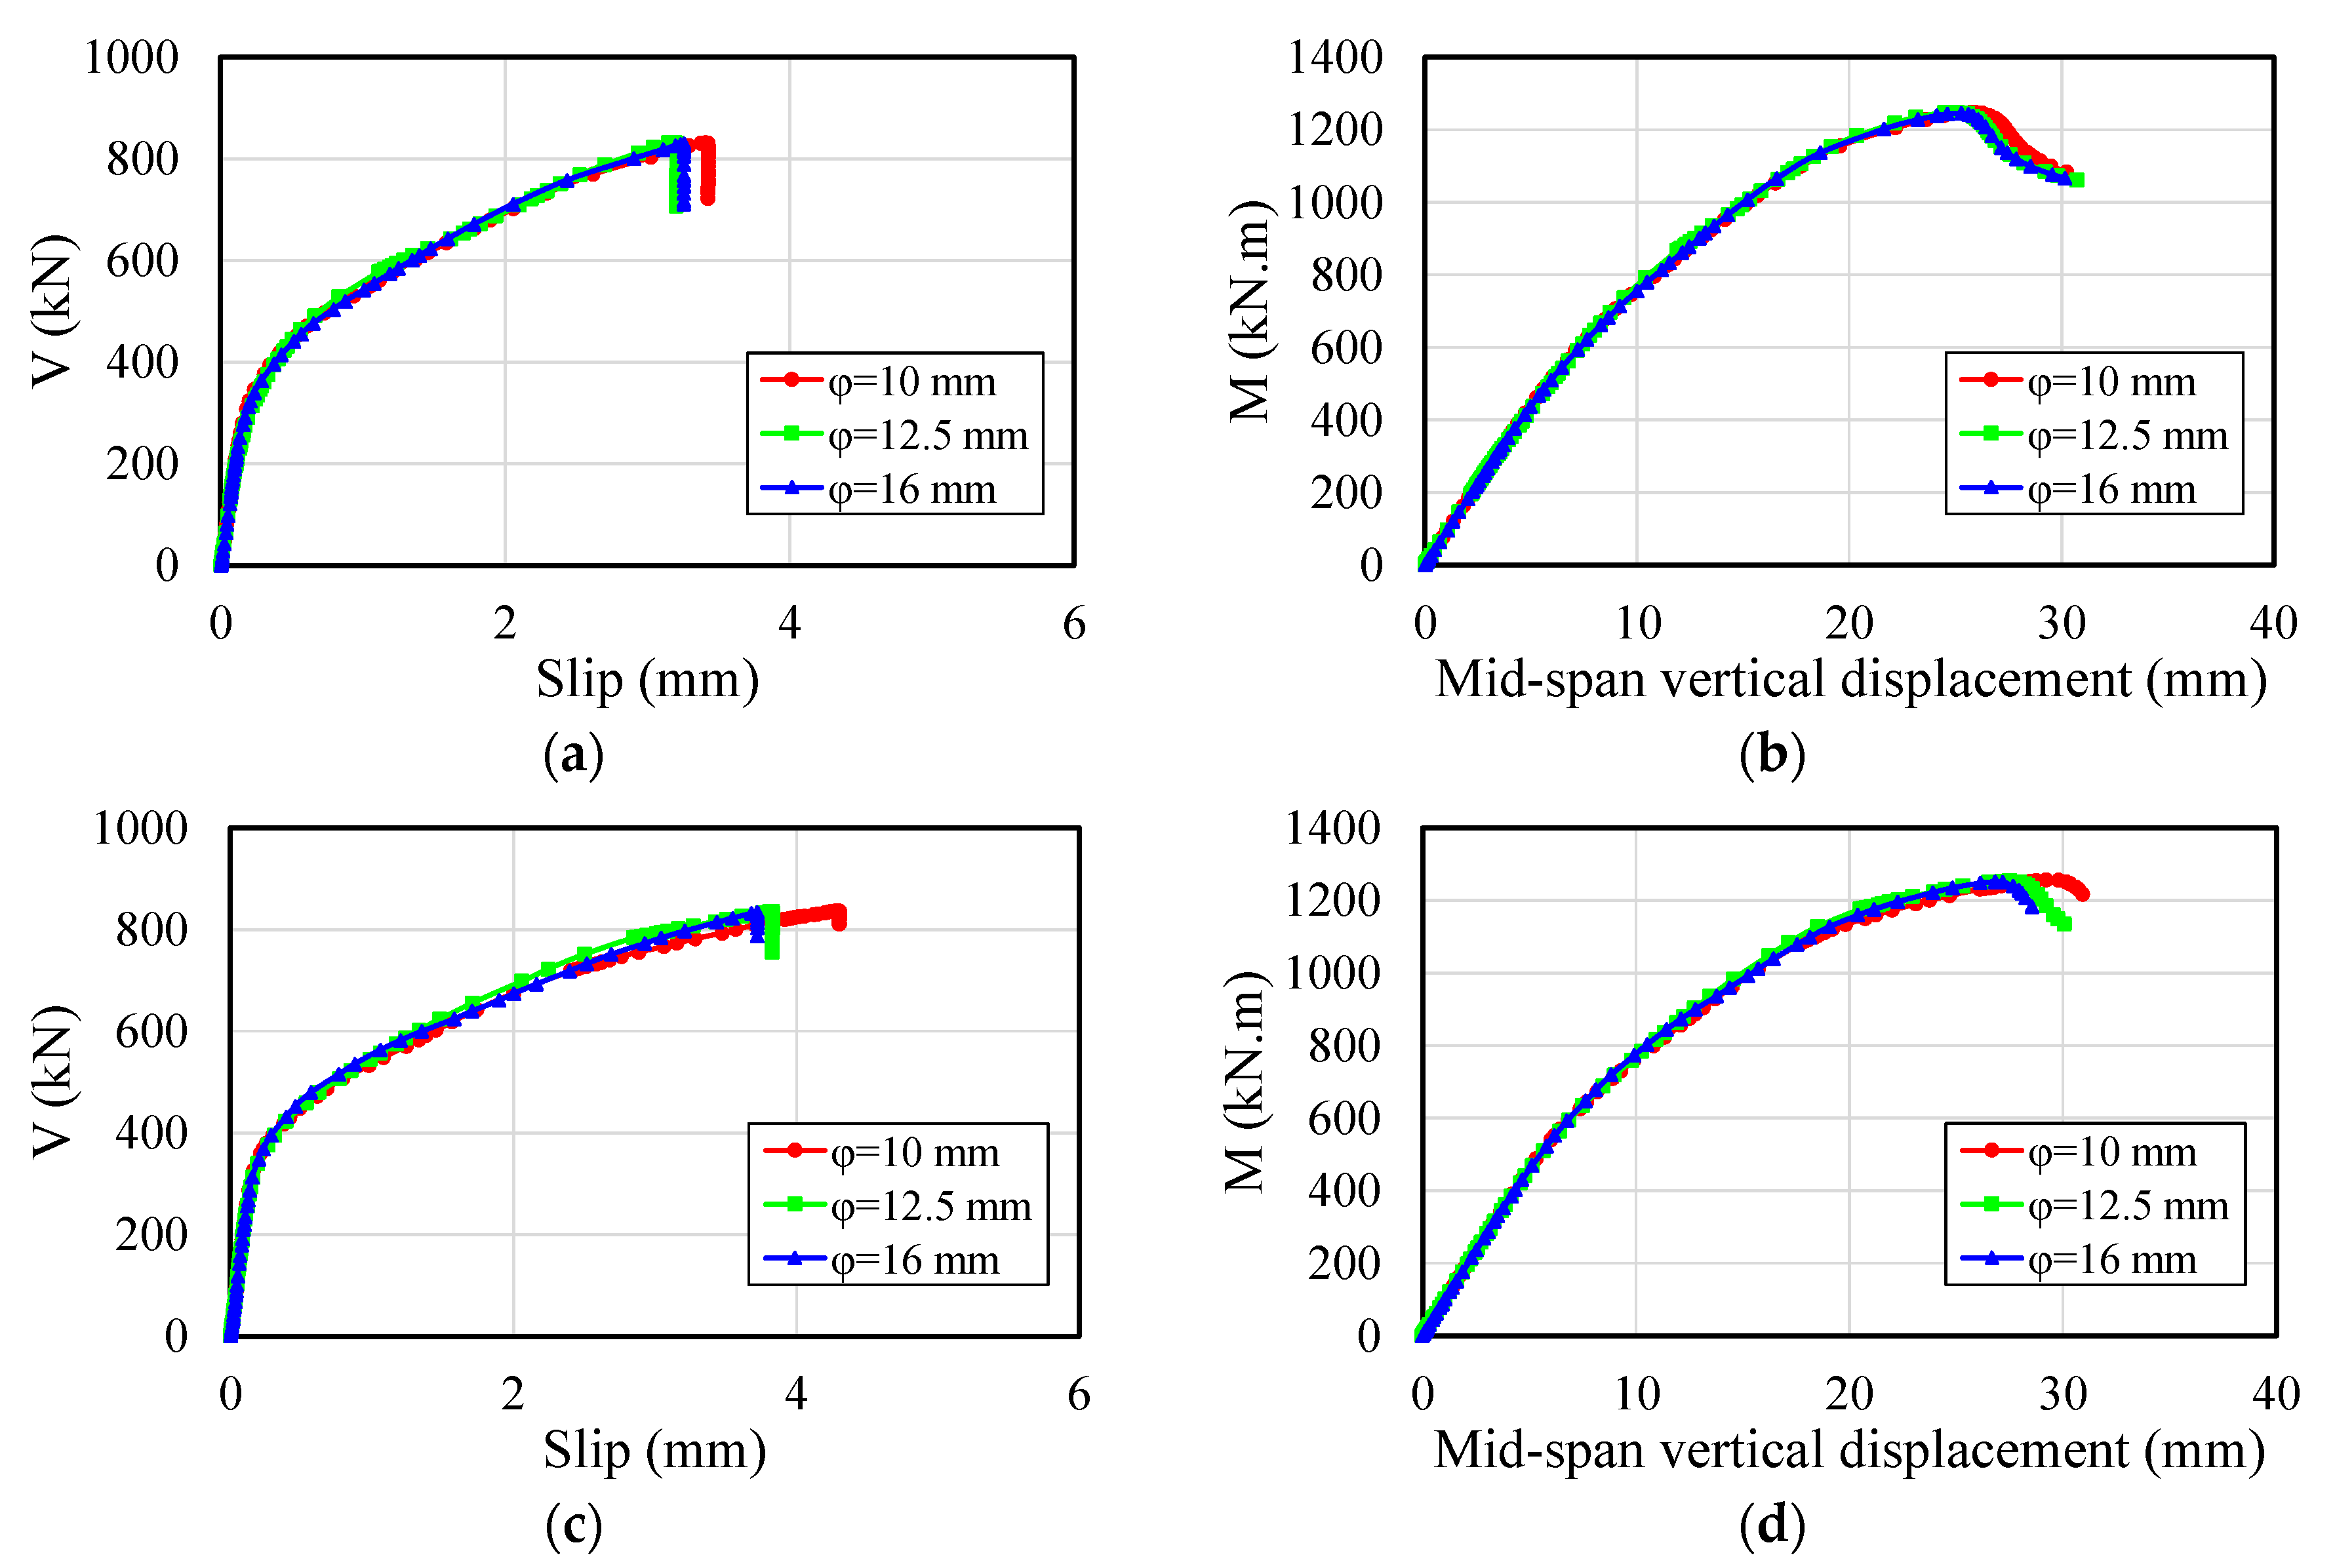
5.3. W530x72 Section
5.4. Design
5.5. Comparative Analyses
6. Conclusions
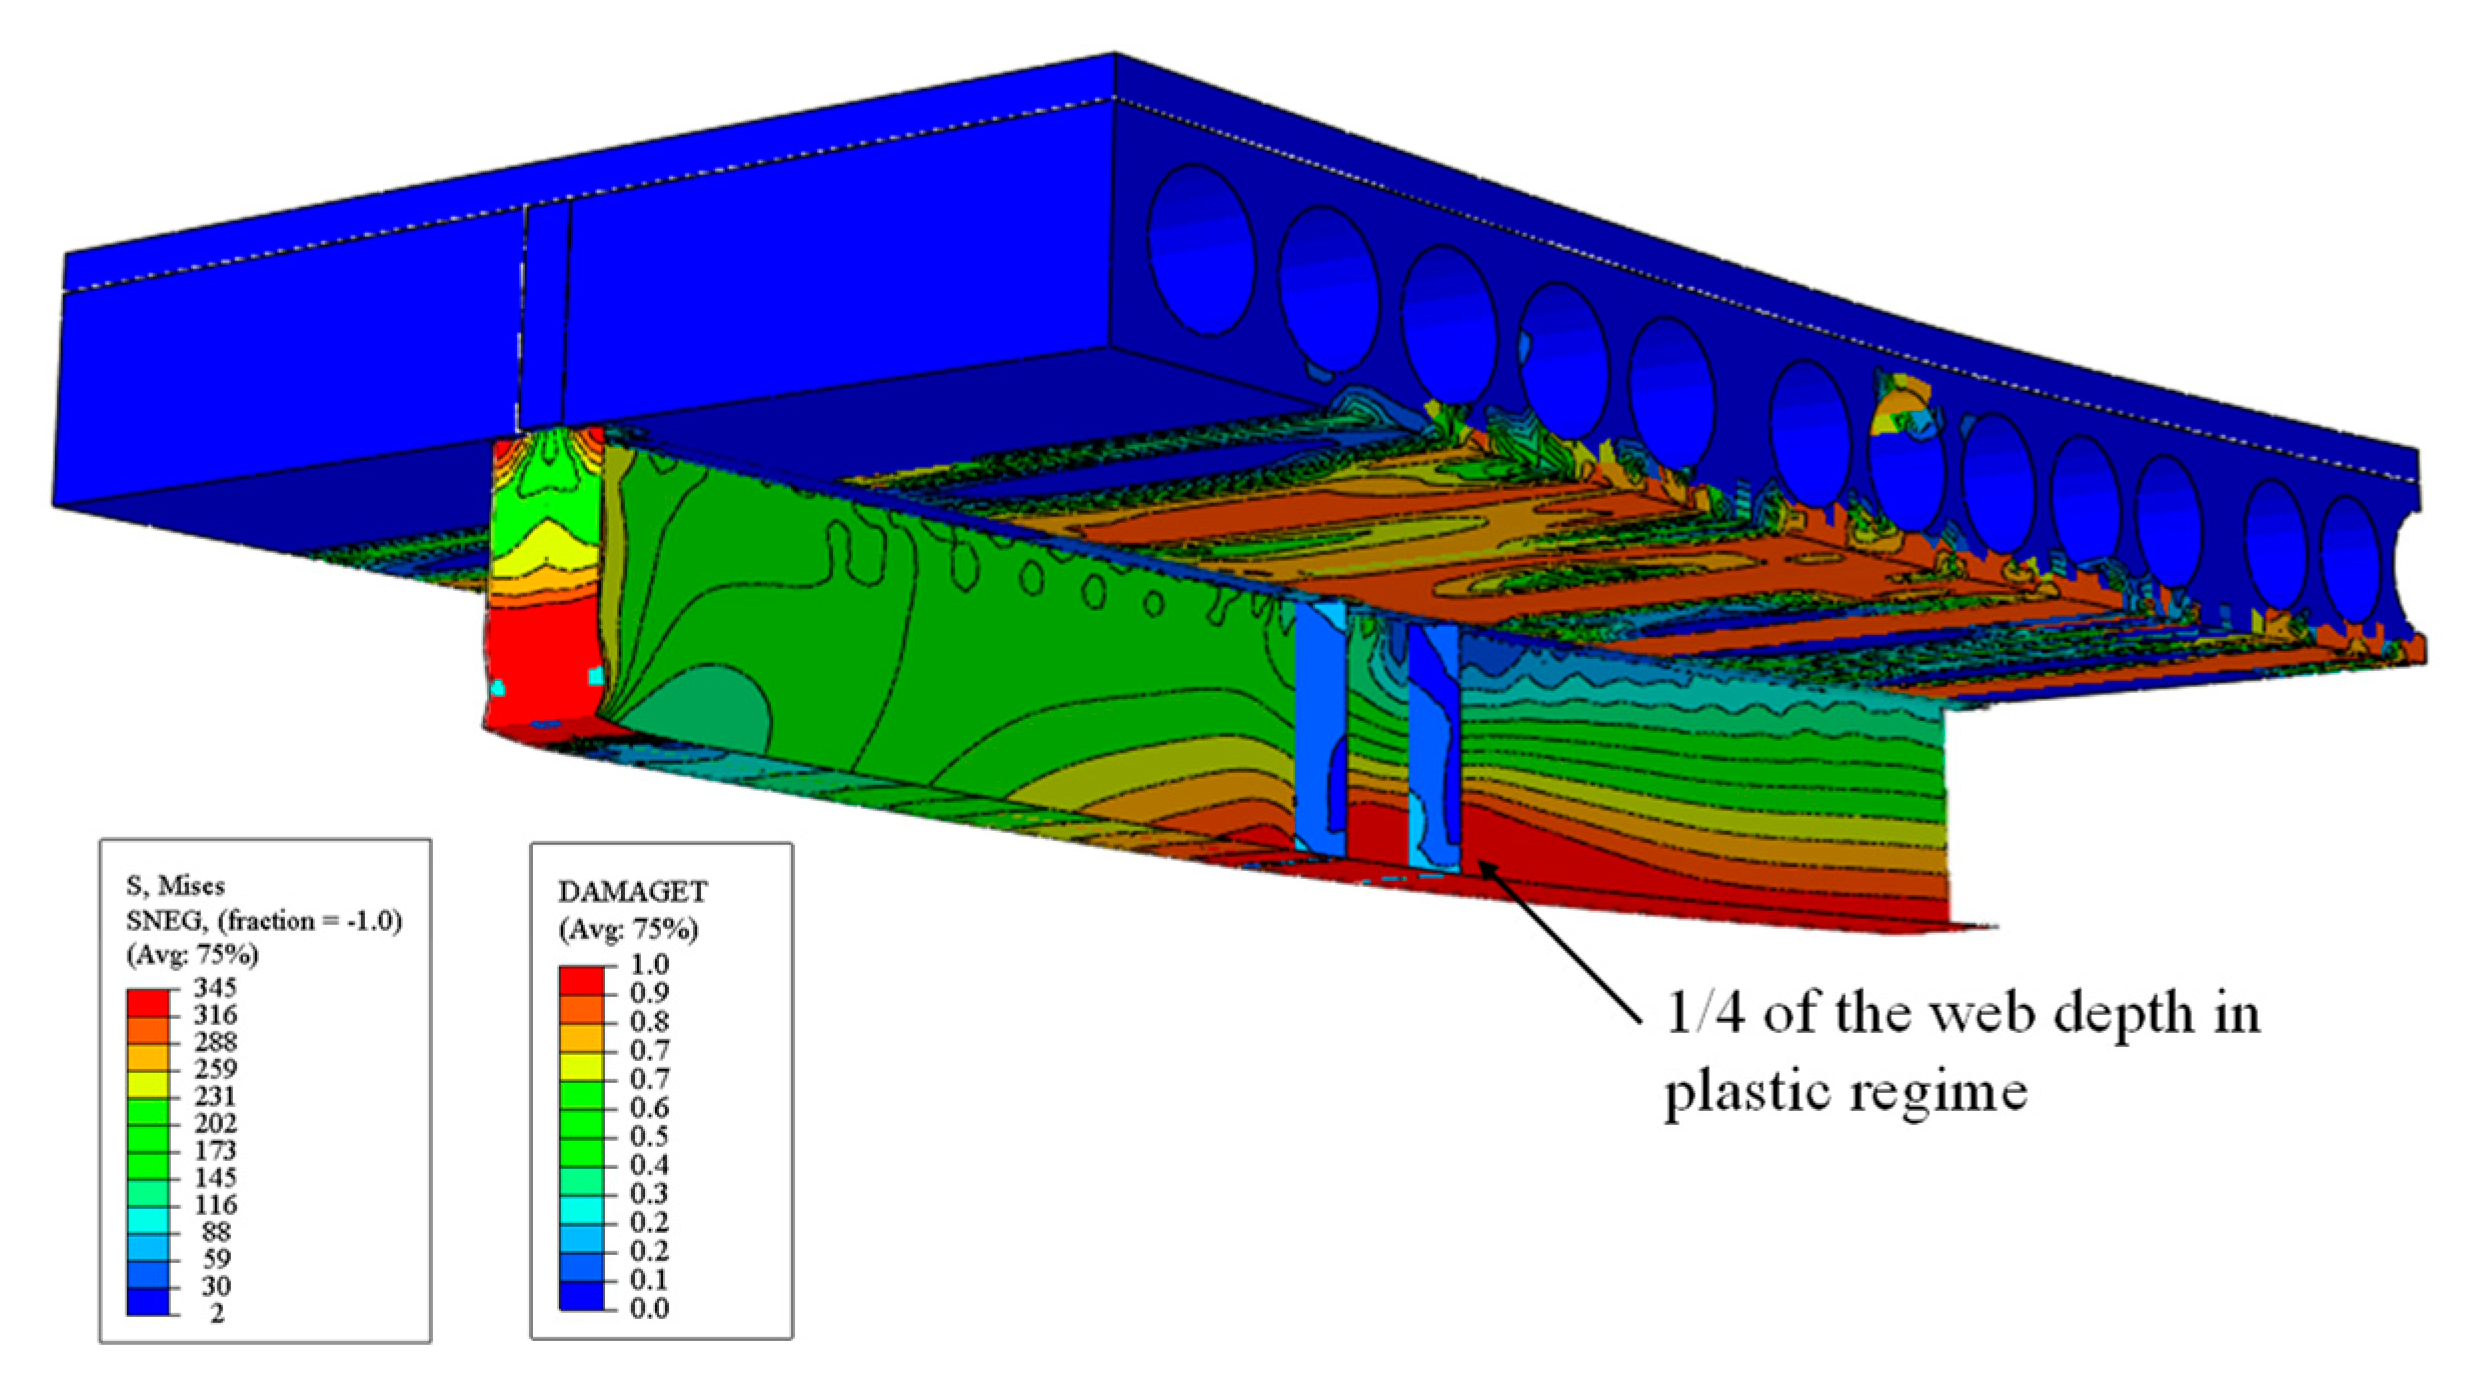
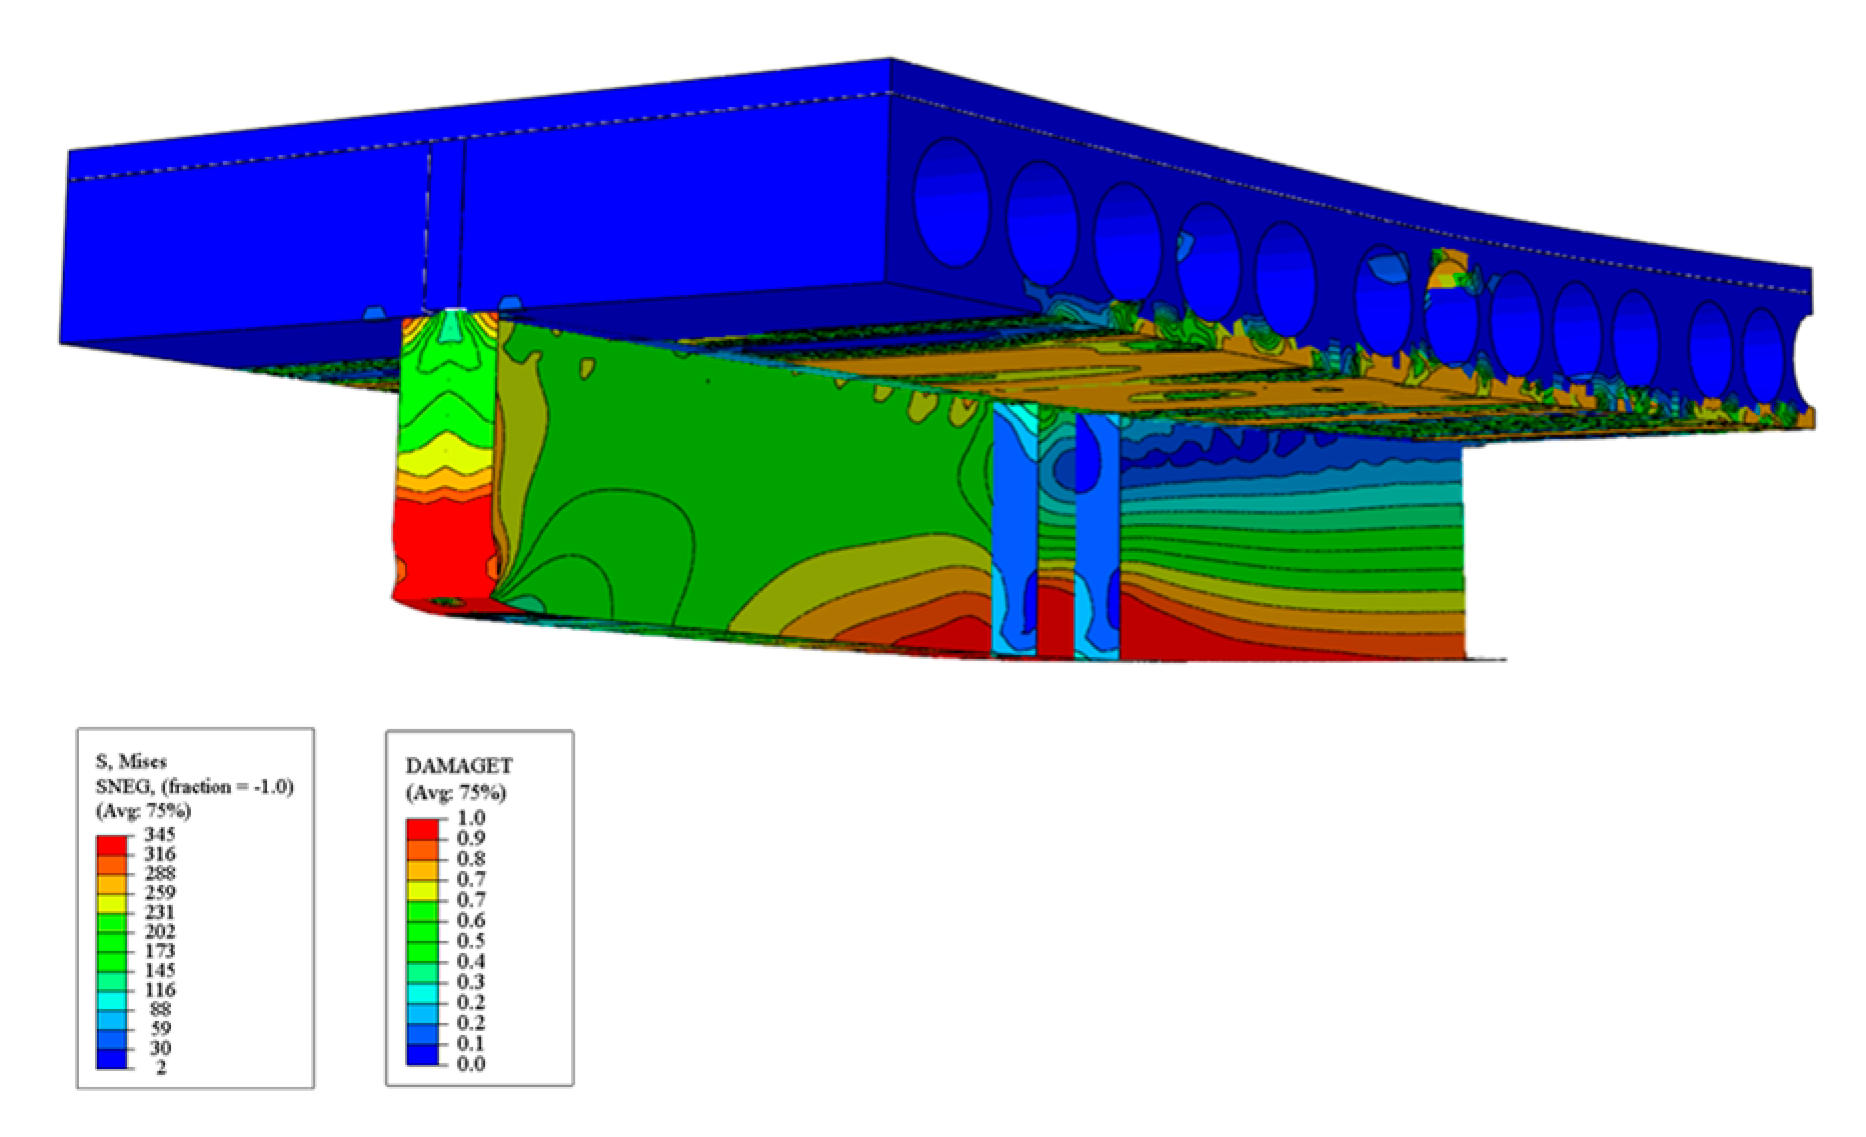
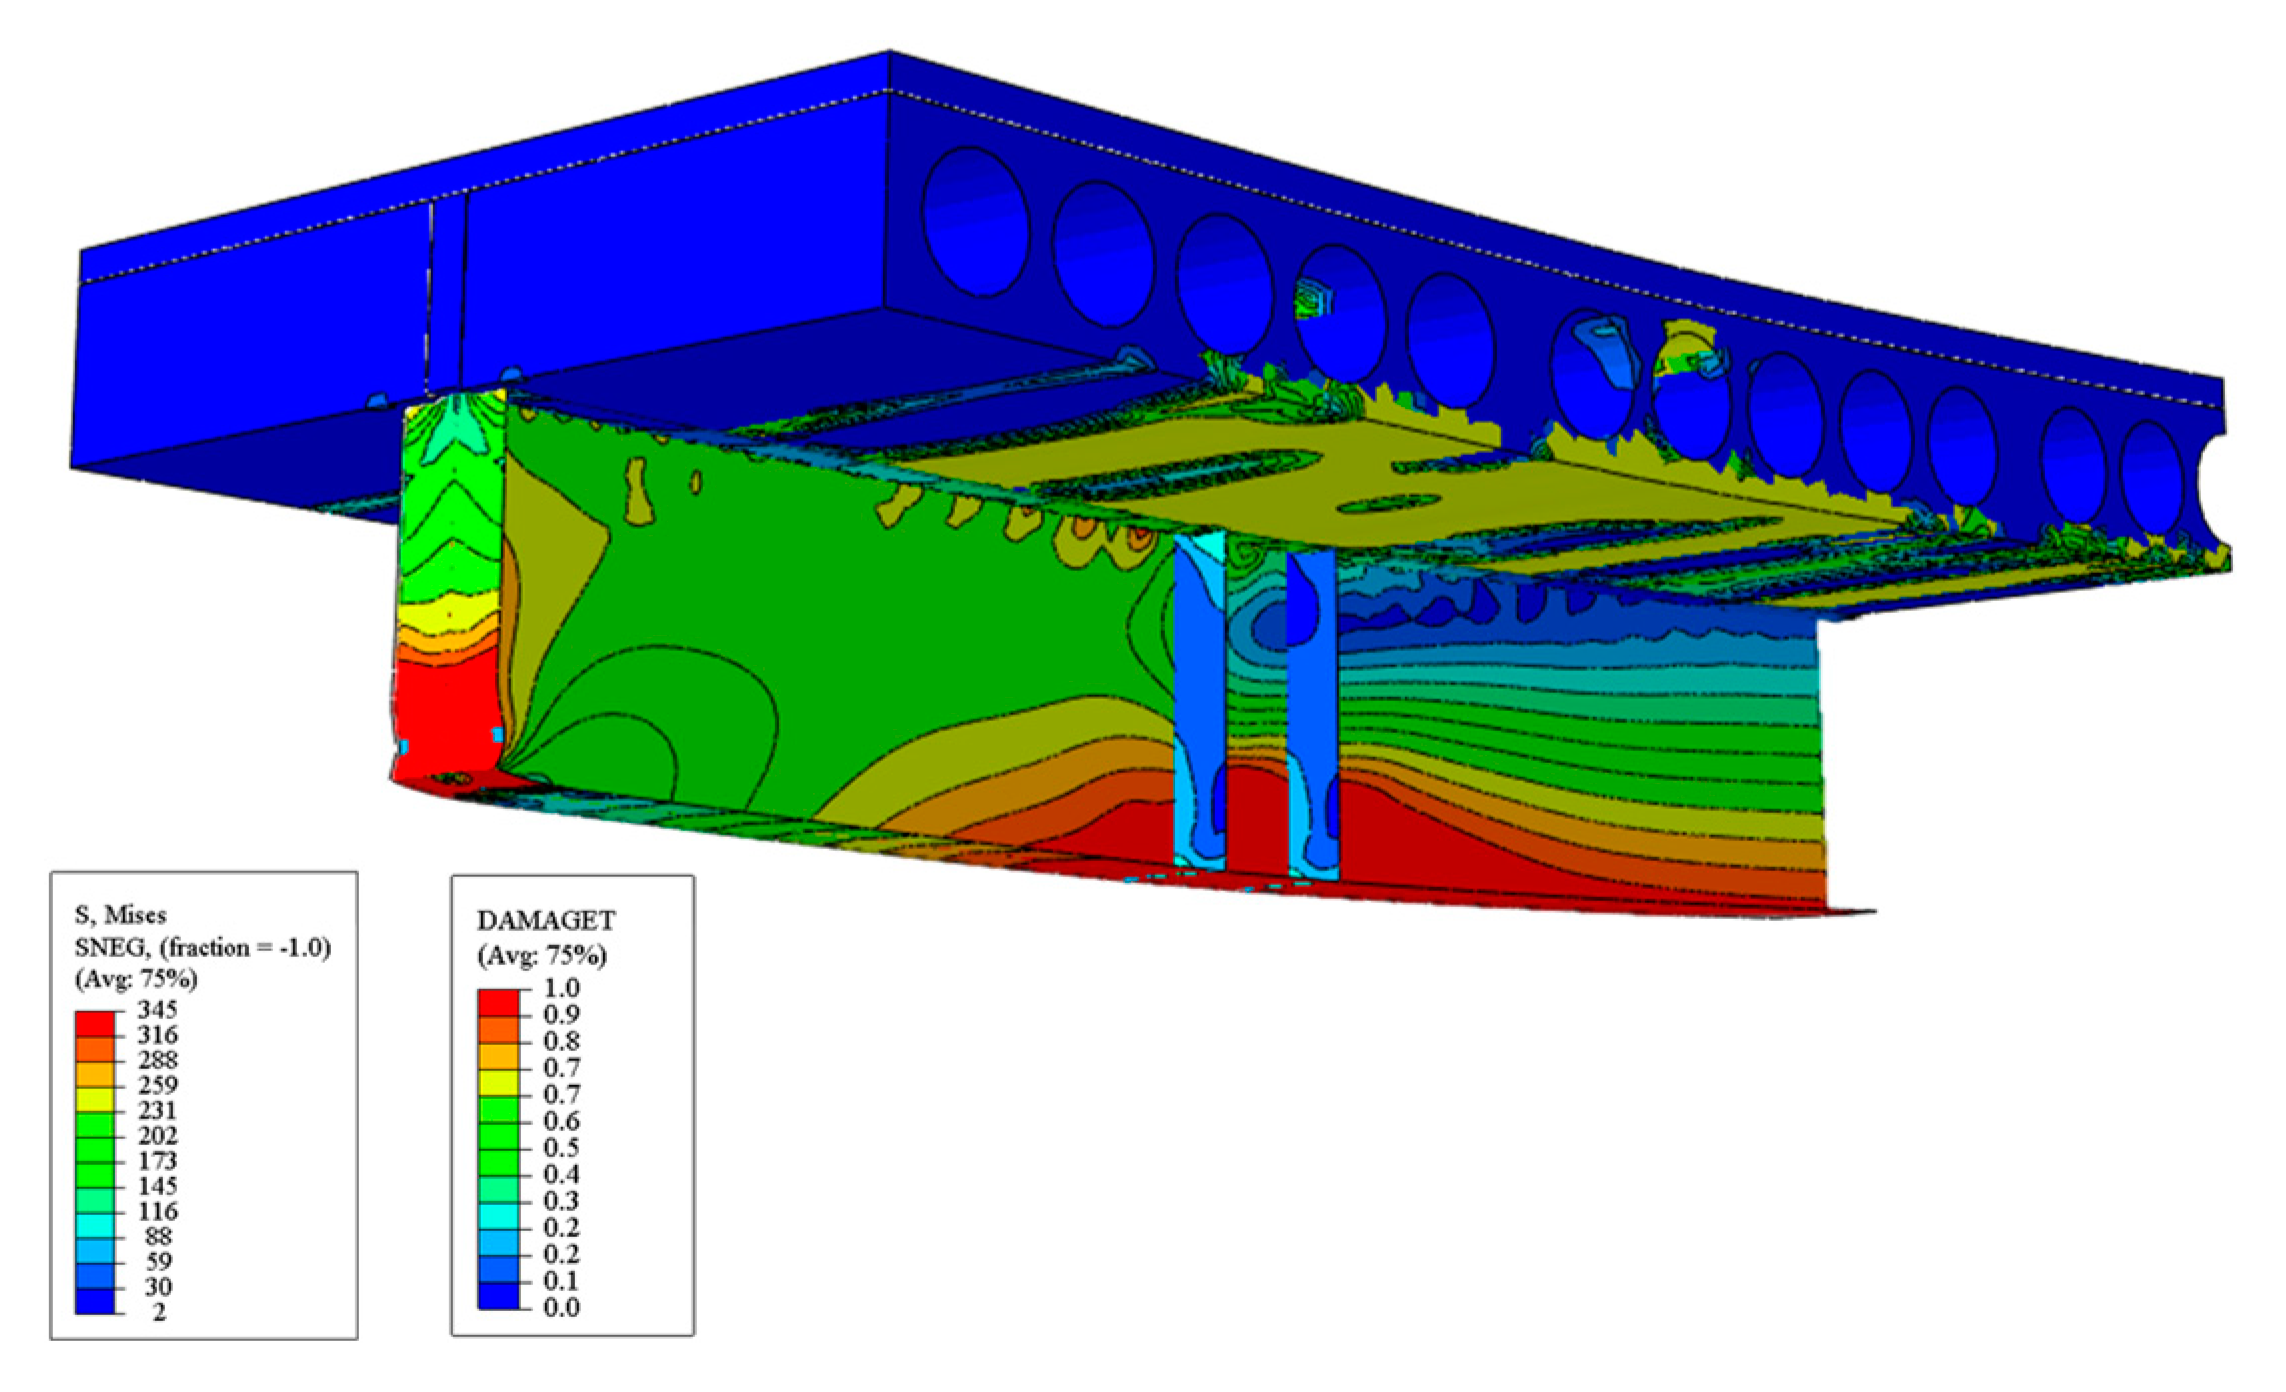
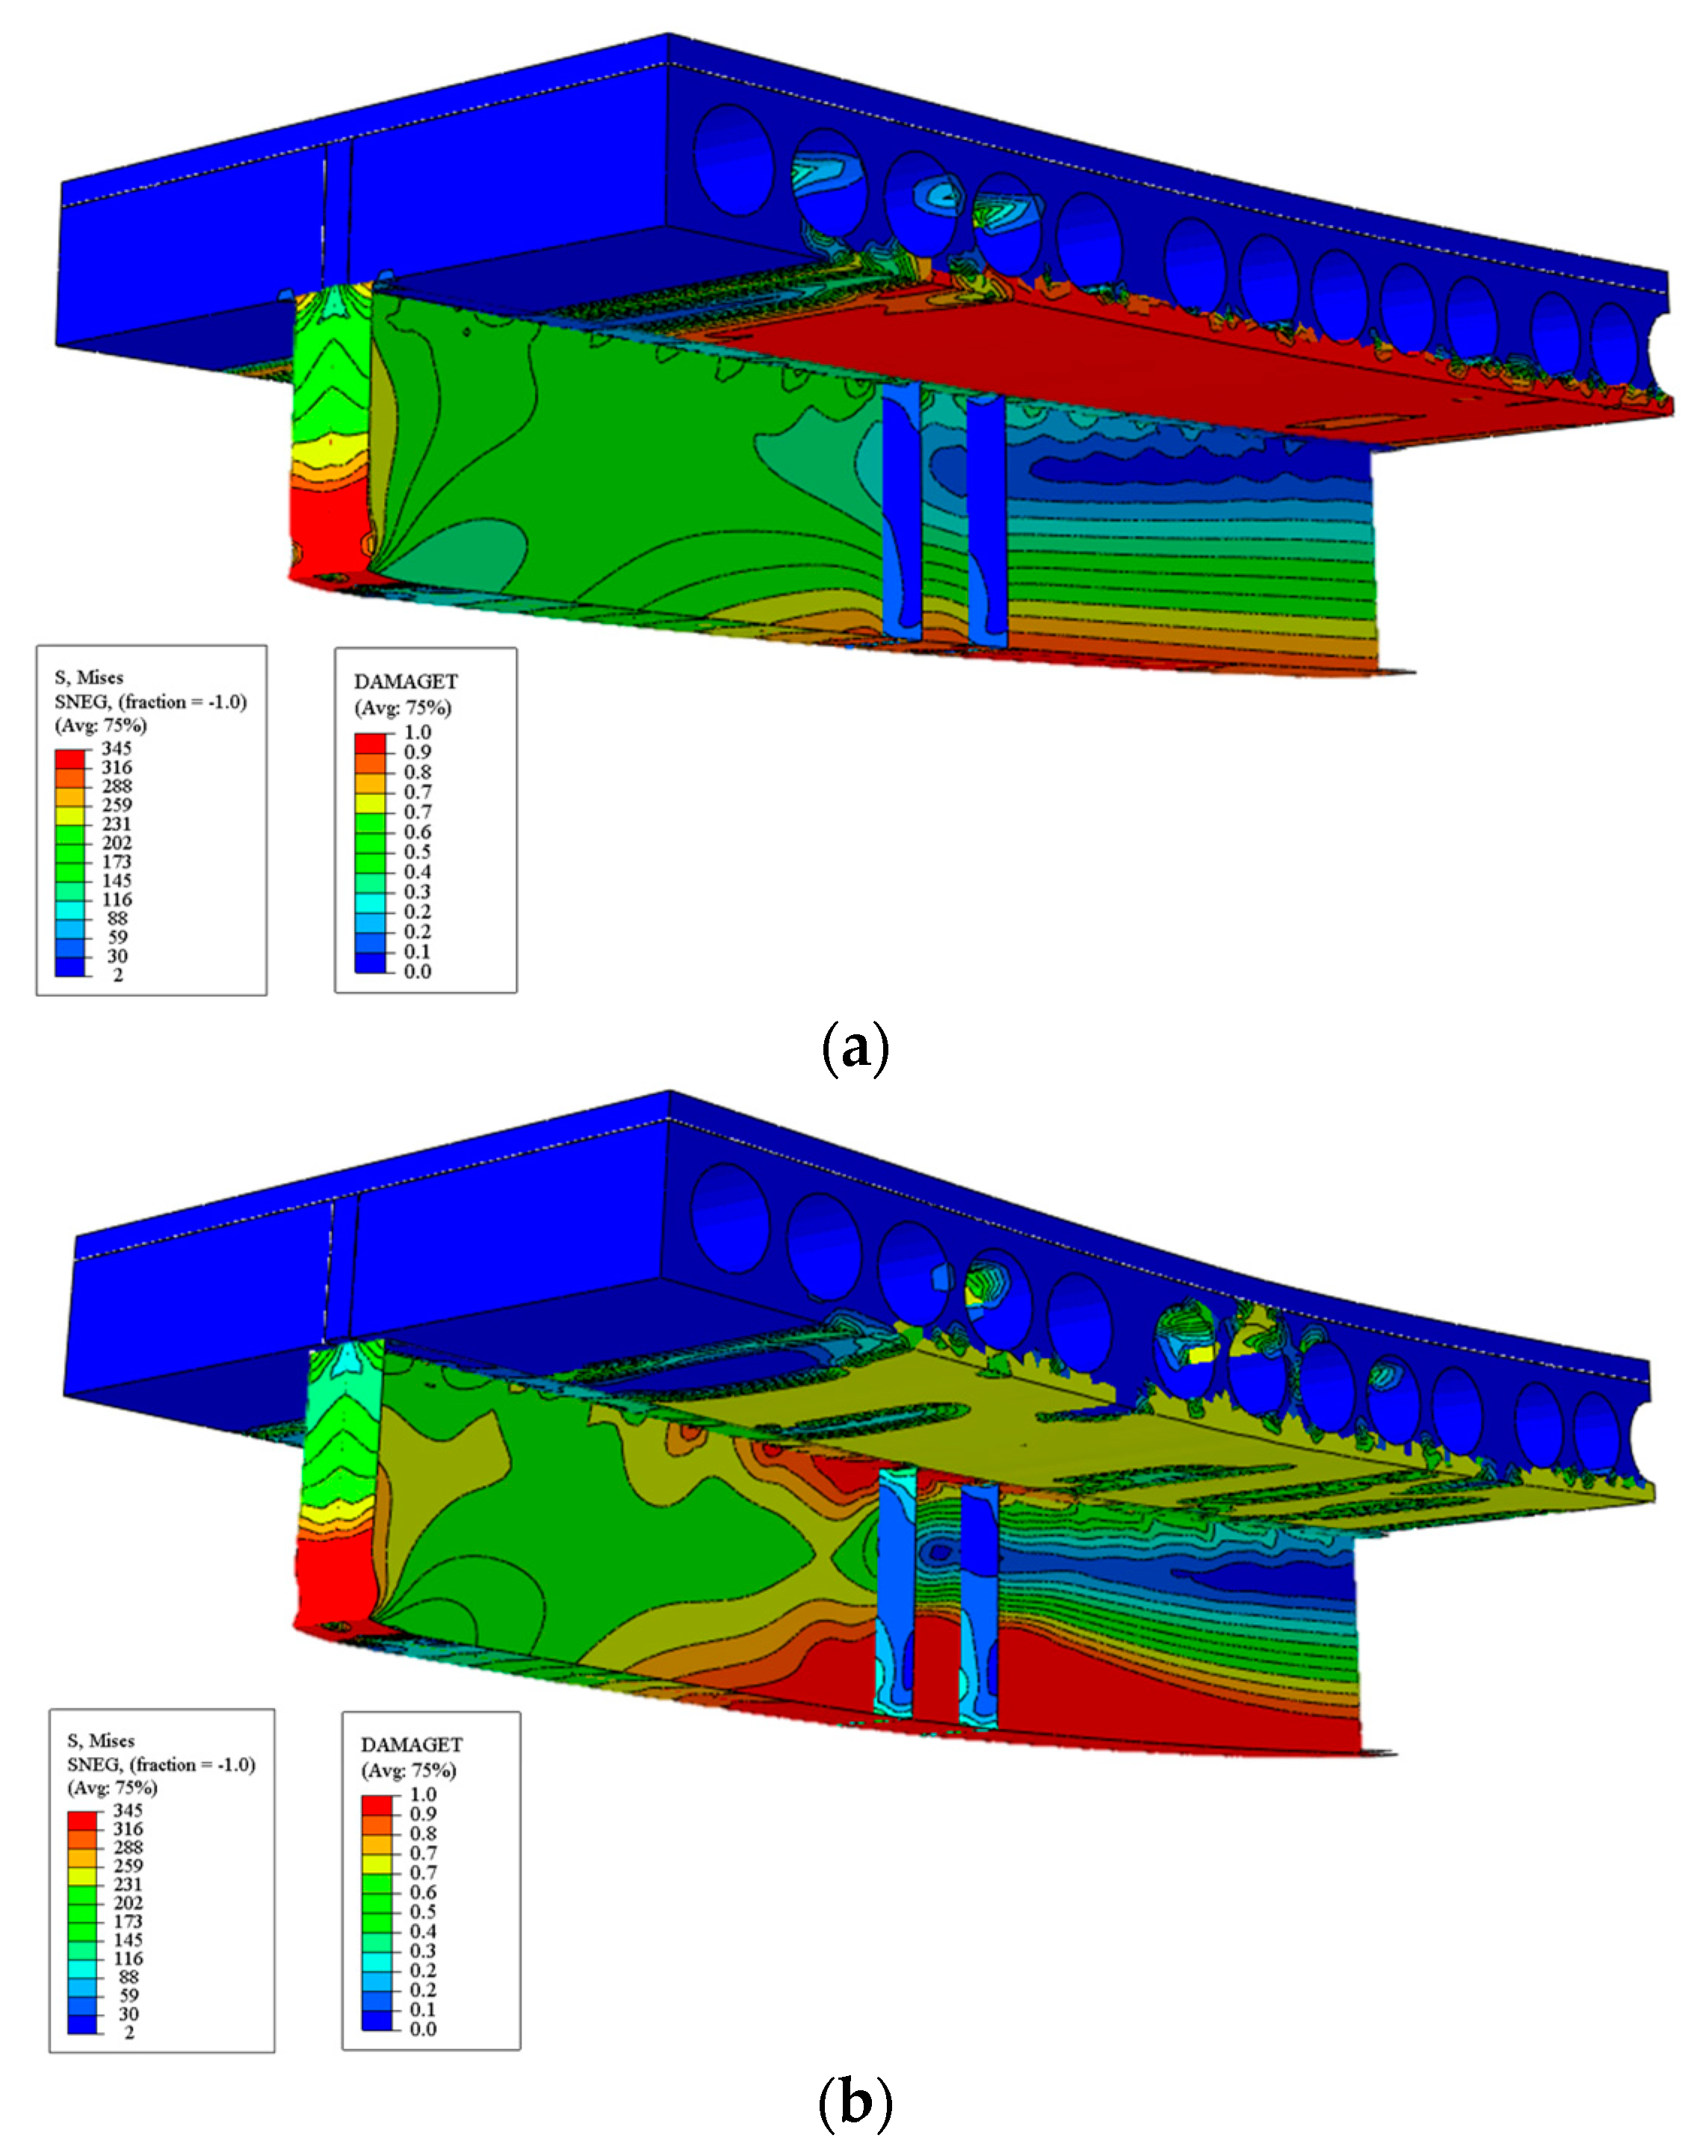
- In all models, the ultimate strength was reached by excessive cracking of the precast hollow-core slab. This occurred because the neutral plastic axis lay within the -core slab, a factor that generated tensile stresses. Thus, dimensioning Steel-Concrete composite beams with deeper hollow-core slabs is not advantageous. This is because the resistance is governed by the concrete slab, a factor that does not take advantage of the steel section. Therefore, in these analyzed models, there was a waste of material.
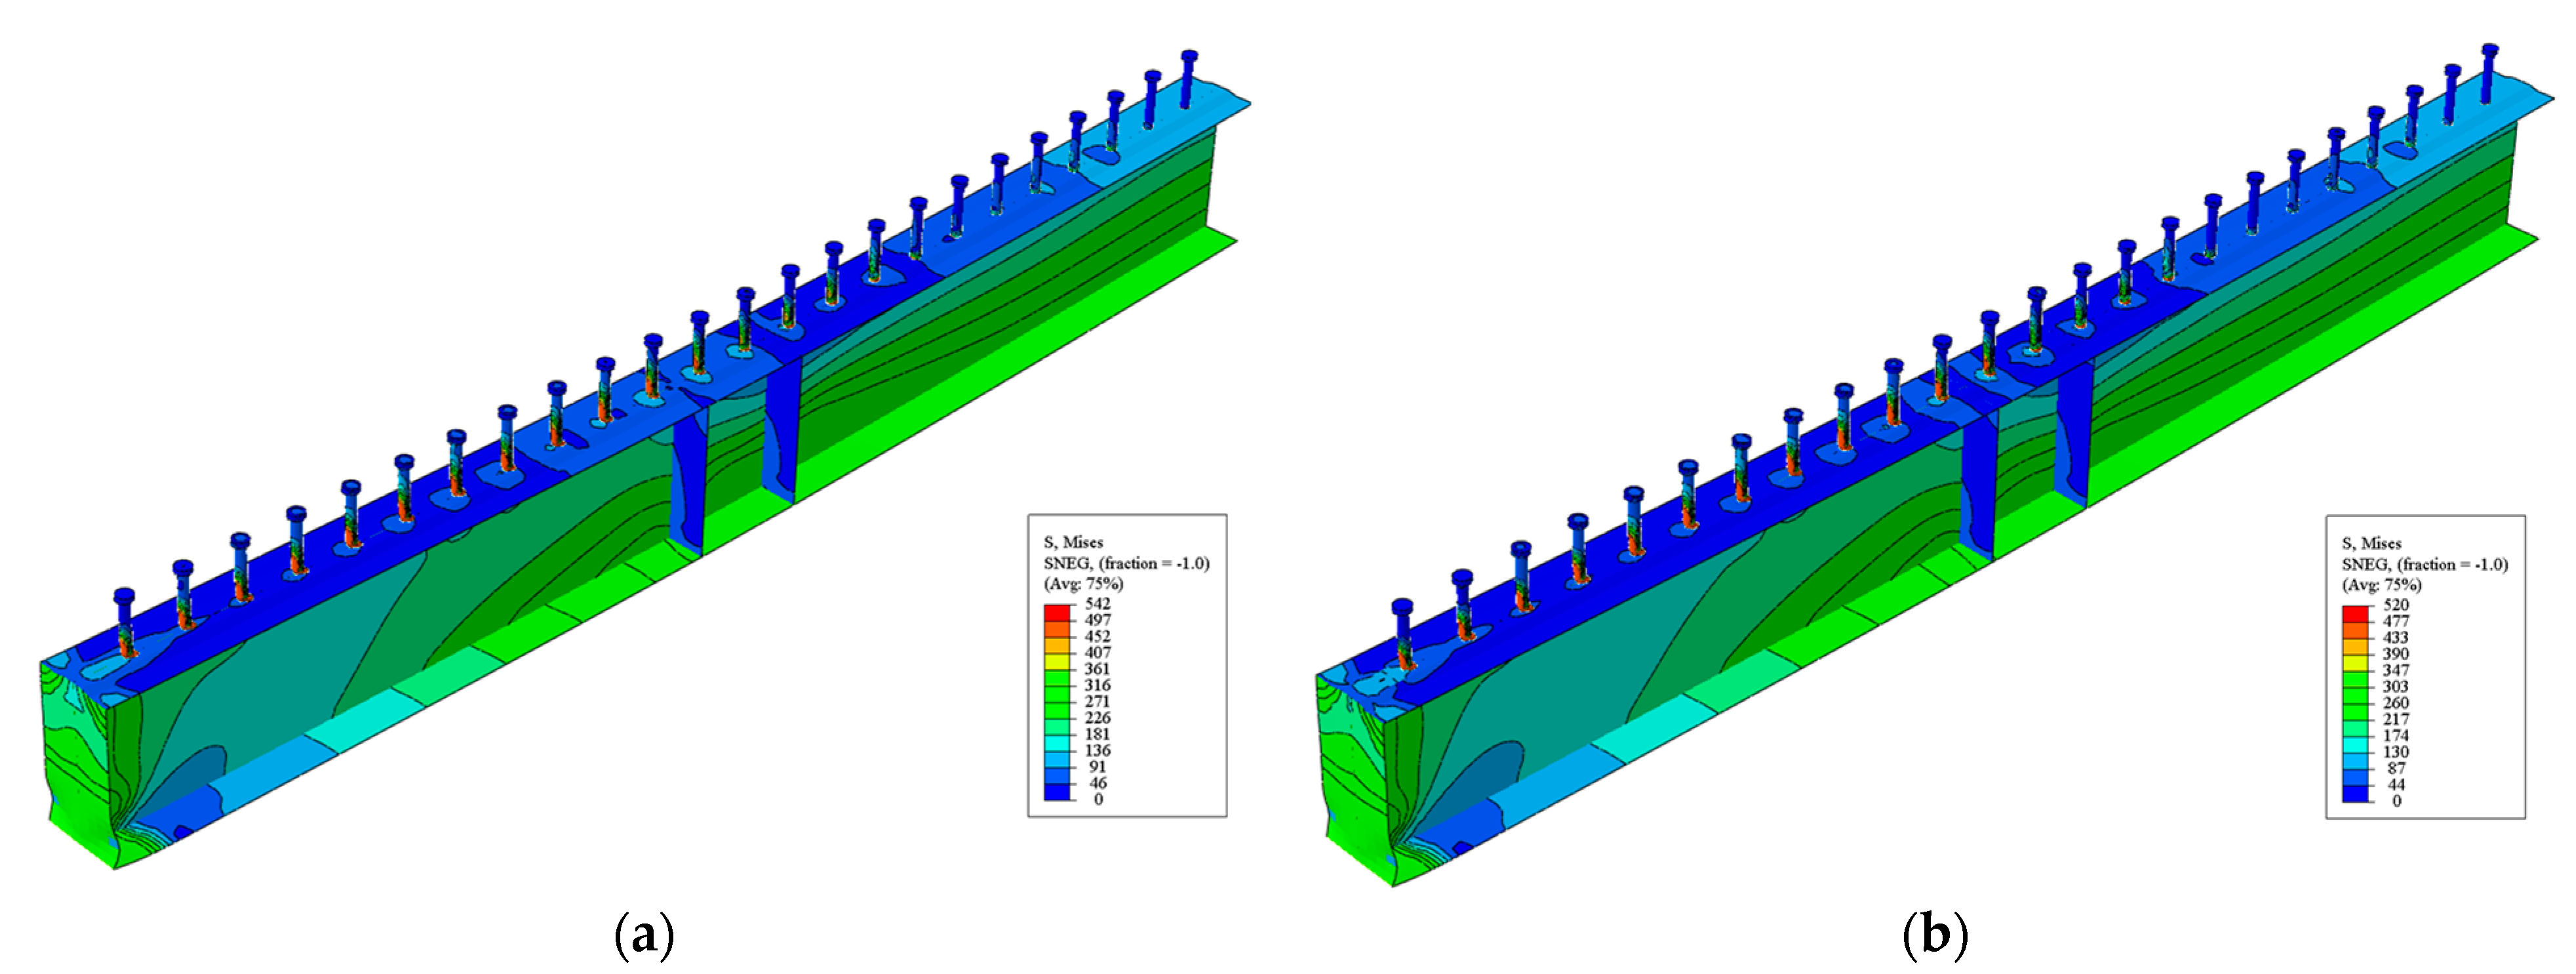
- The greater the area of the steel cross-section, the greater the use of the steel section. When there is a larger steel cross-section, there is an increase in the plastic axial strength of the steel profile. This increase causes the neutral plastic axis to descend toward the steel profile, causing only compression stresses in the hollow-core slab.
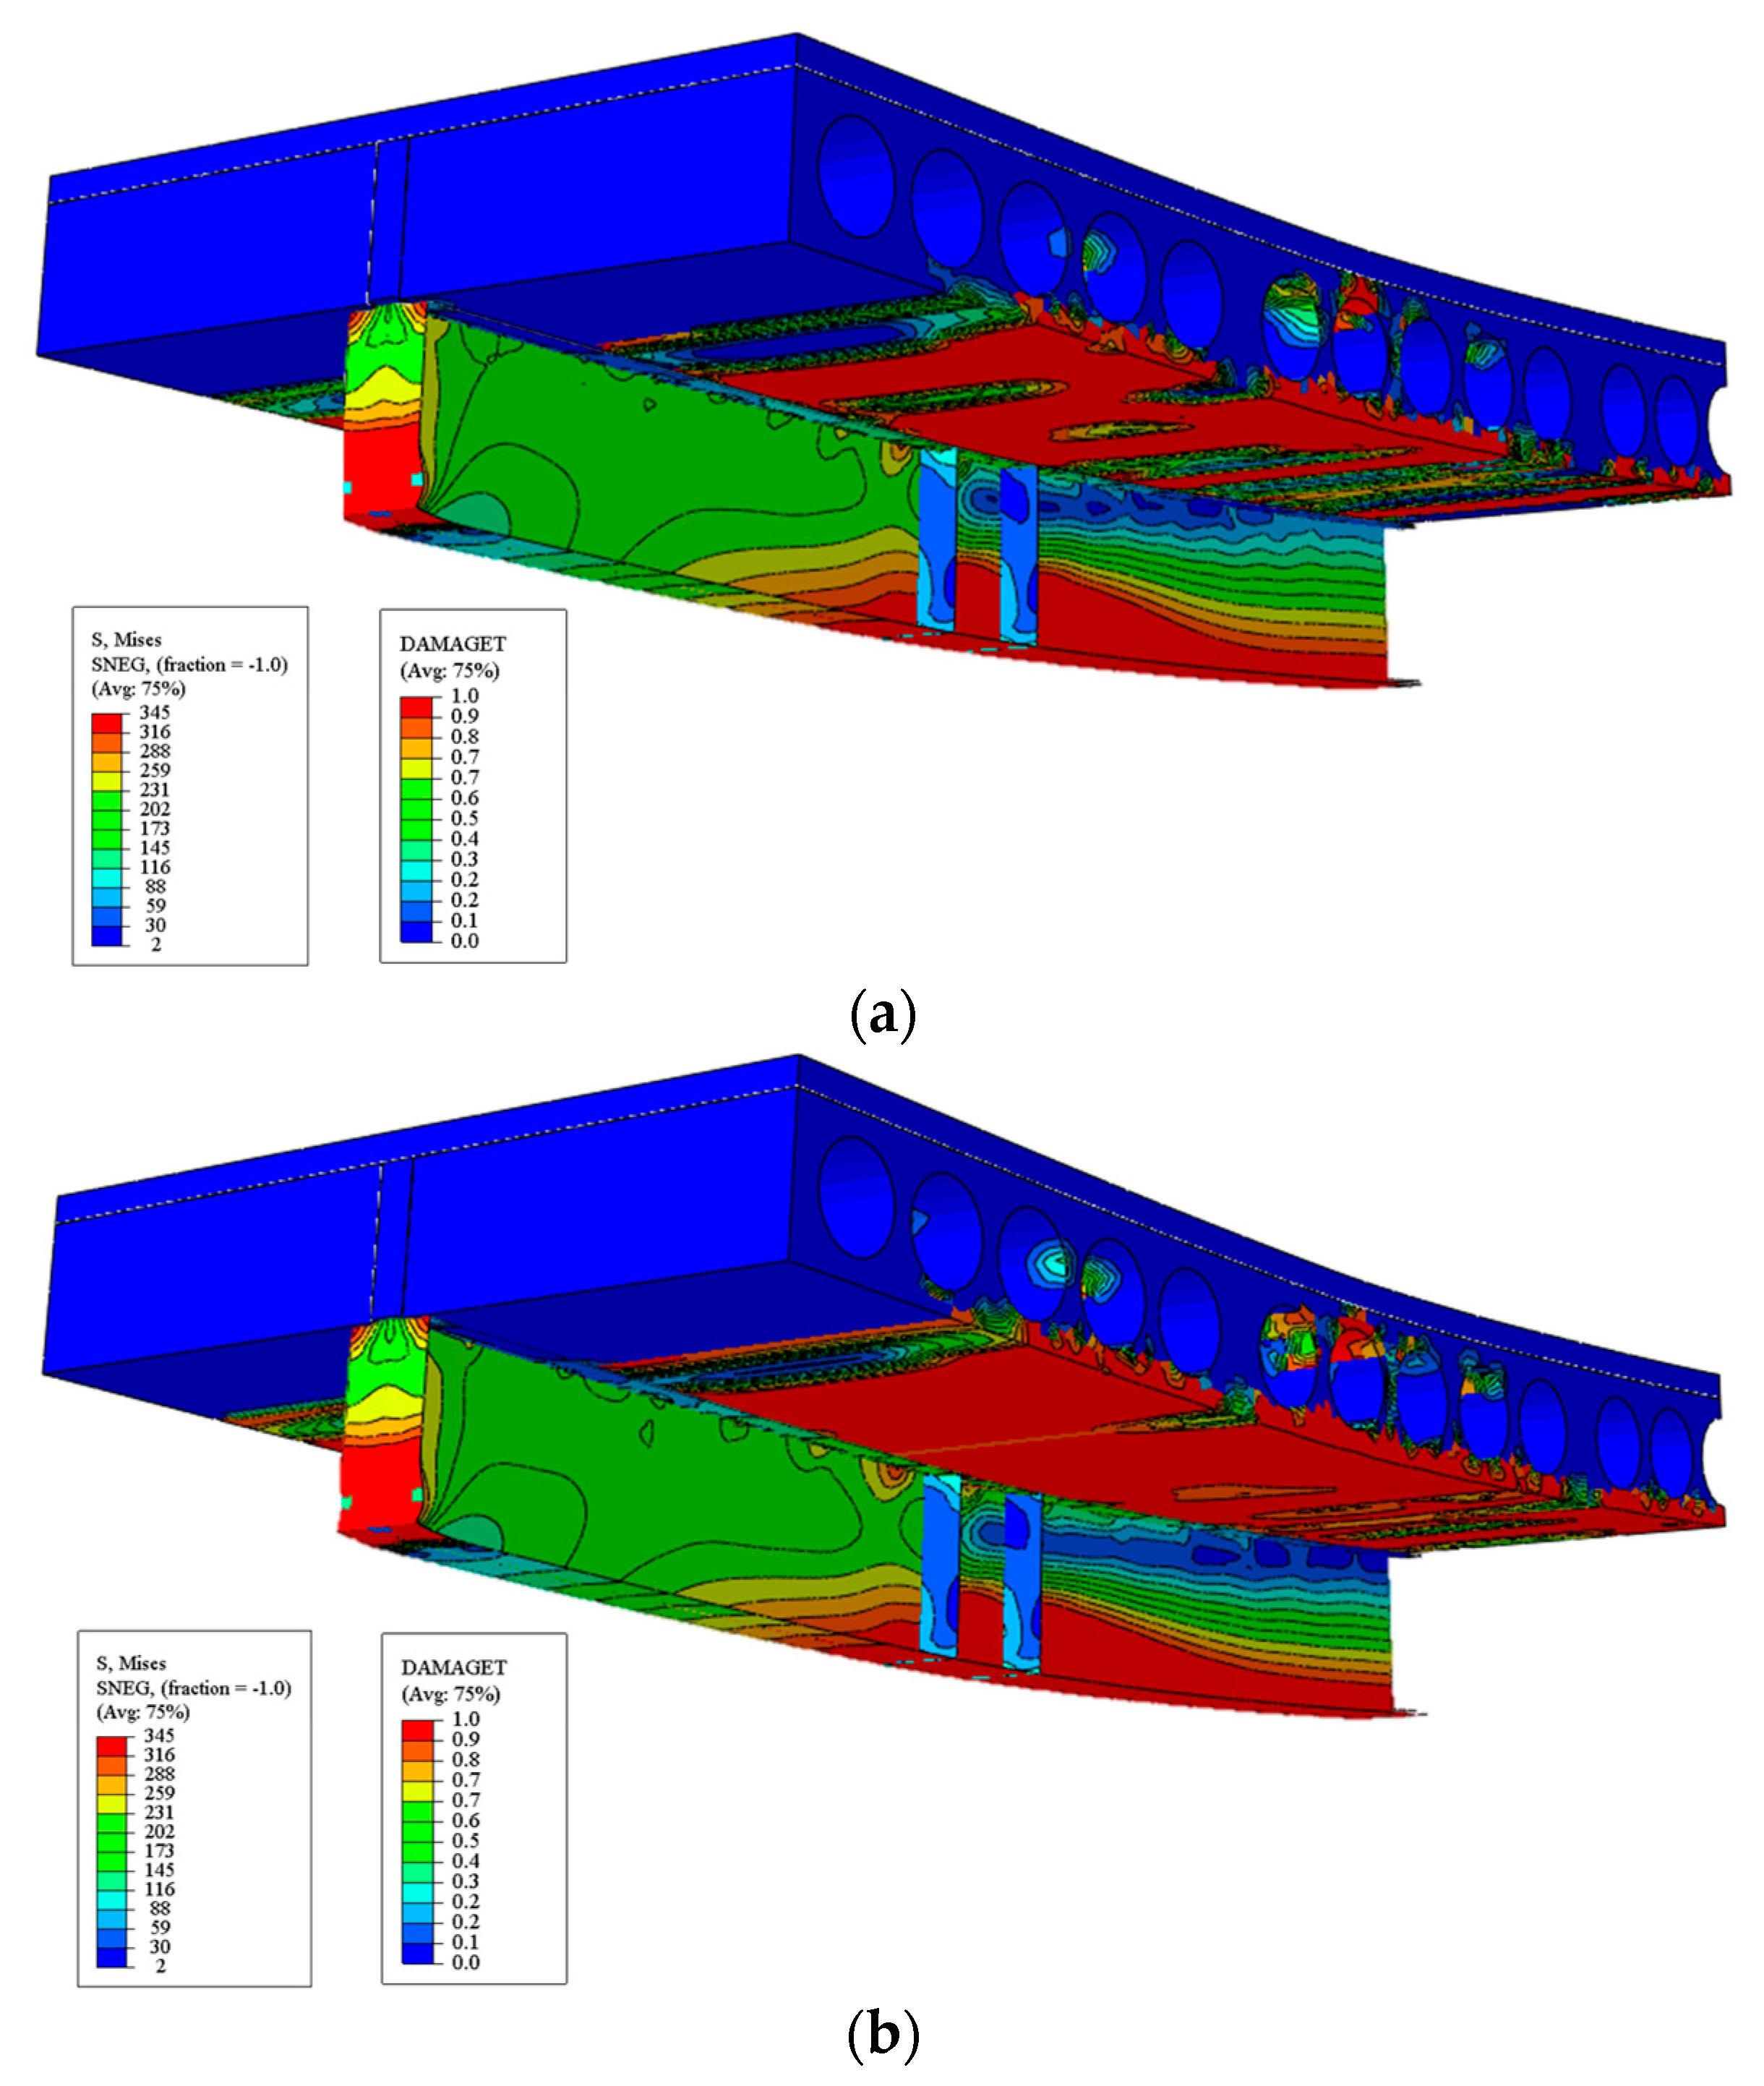
- The greater the spacing of the shear studs, the greater the use of the steel section. When considering the hypothesis of partial interaction, as presented for the models with 175 mm and 225 mm of spacing, the structural system can achieve ductile behavior, a factor that favors the ability of the structural elements to deform without reaching the ultimate strength. The use of a smaller number of shear connectors (175 mm and 225 mm models) provided resistance equivalent to the 120 mm models. Therefore, using a lower amount of material for the design of a structural system, as was the case with modeled Steel-Concrete composite beams, from the point of view of sustainability, there is a reduction in the embodied energy, since a smaller number of installed connectors will require a smaller amount of electricity consumption.
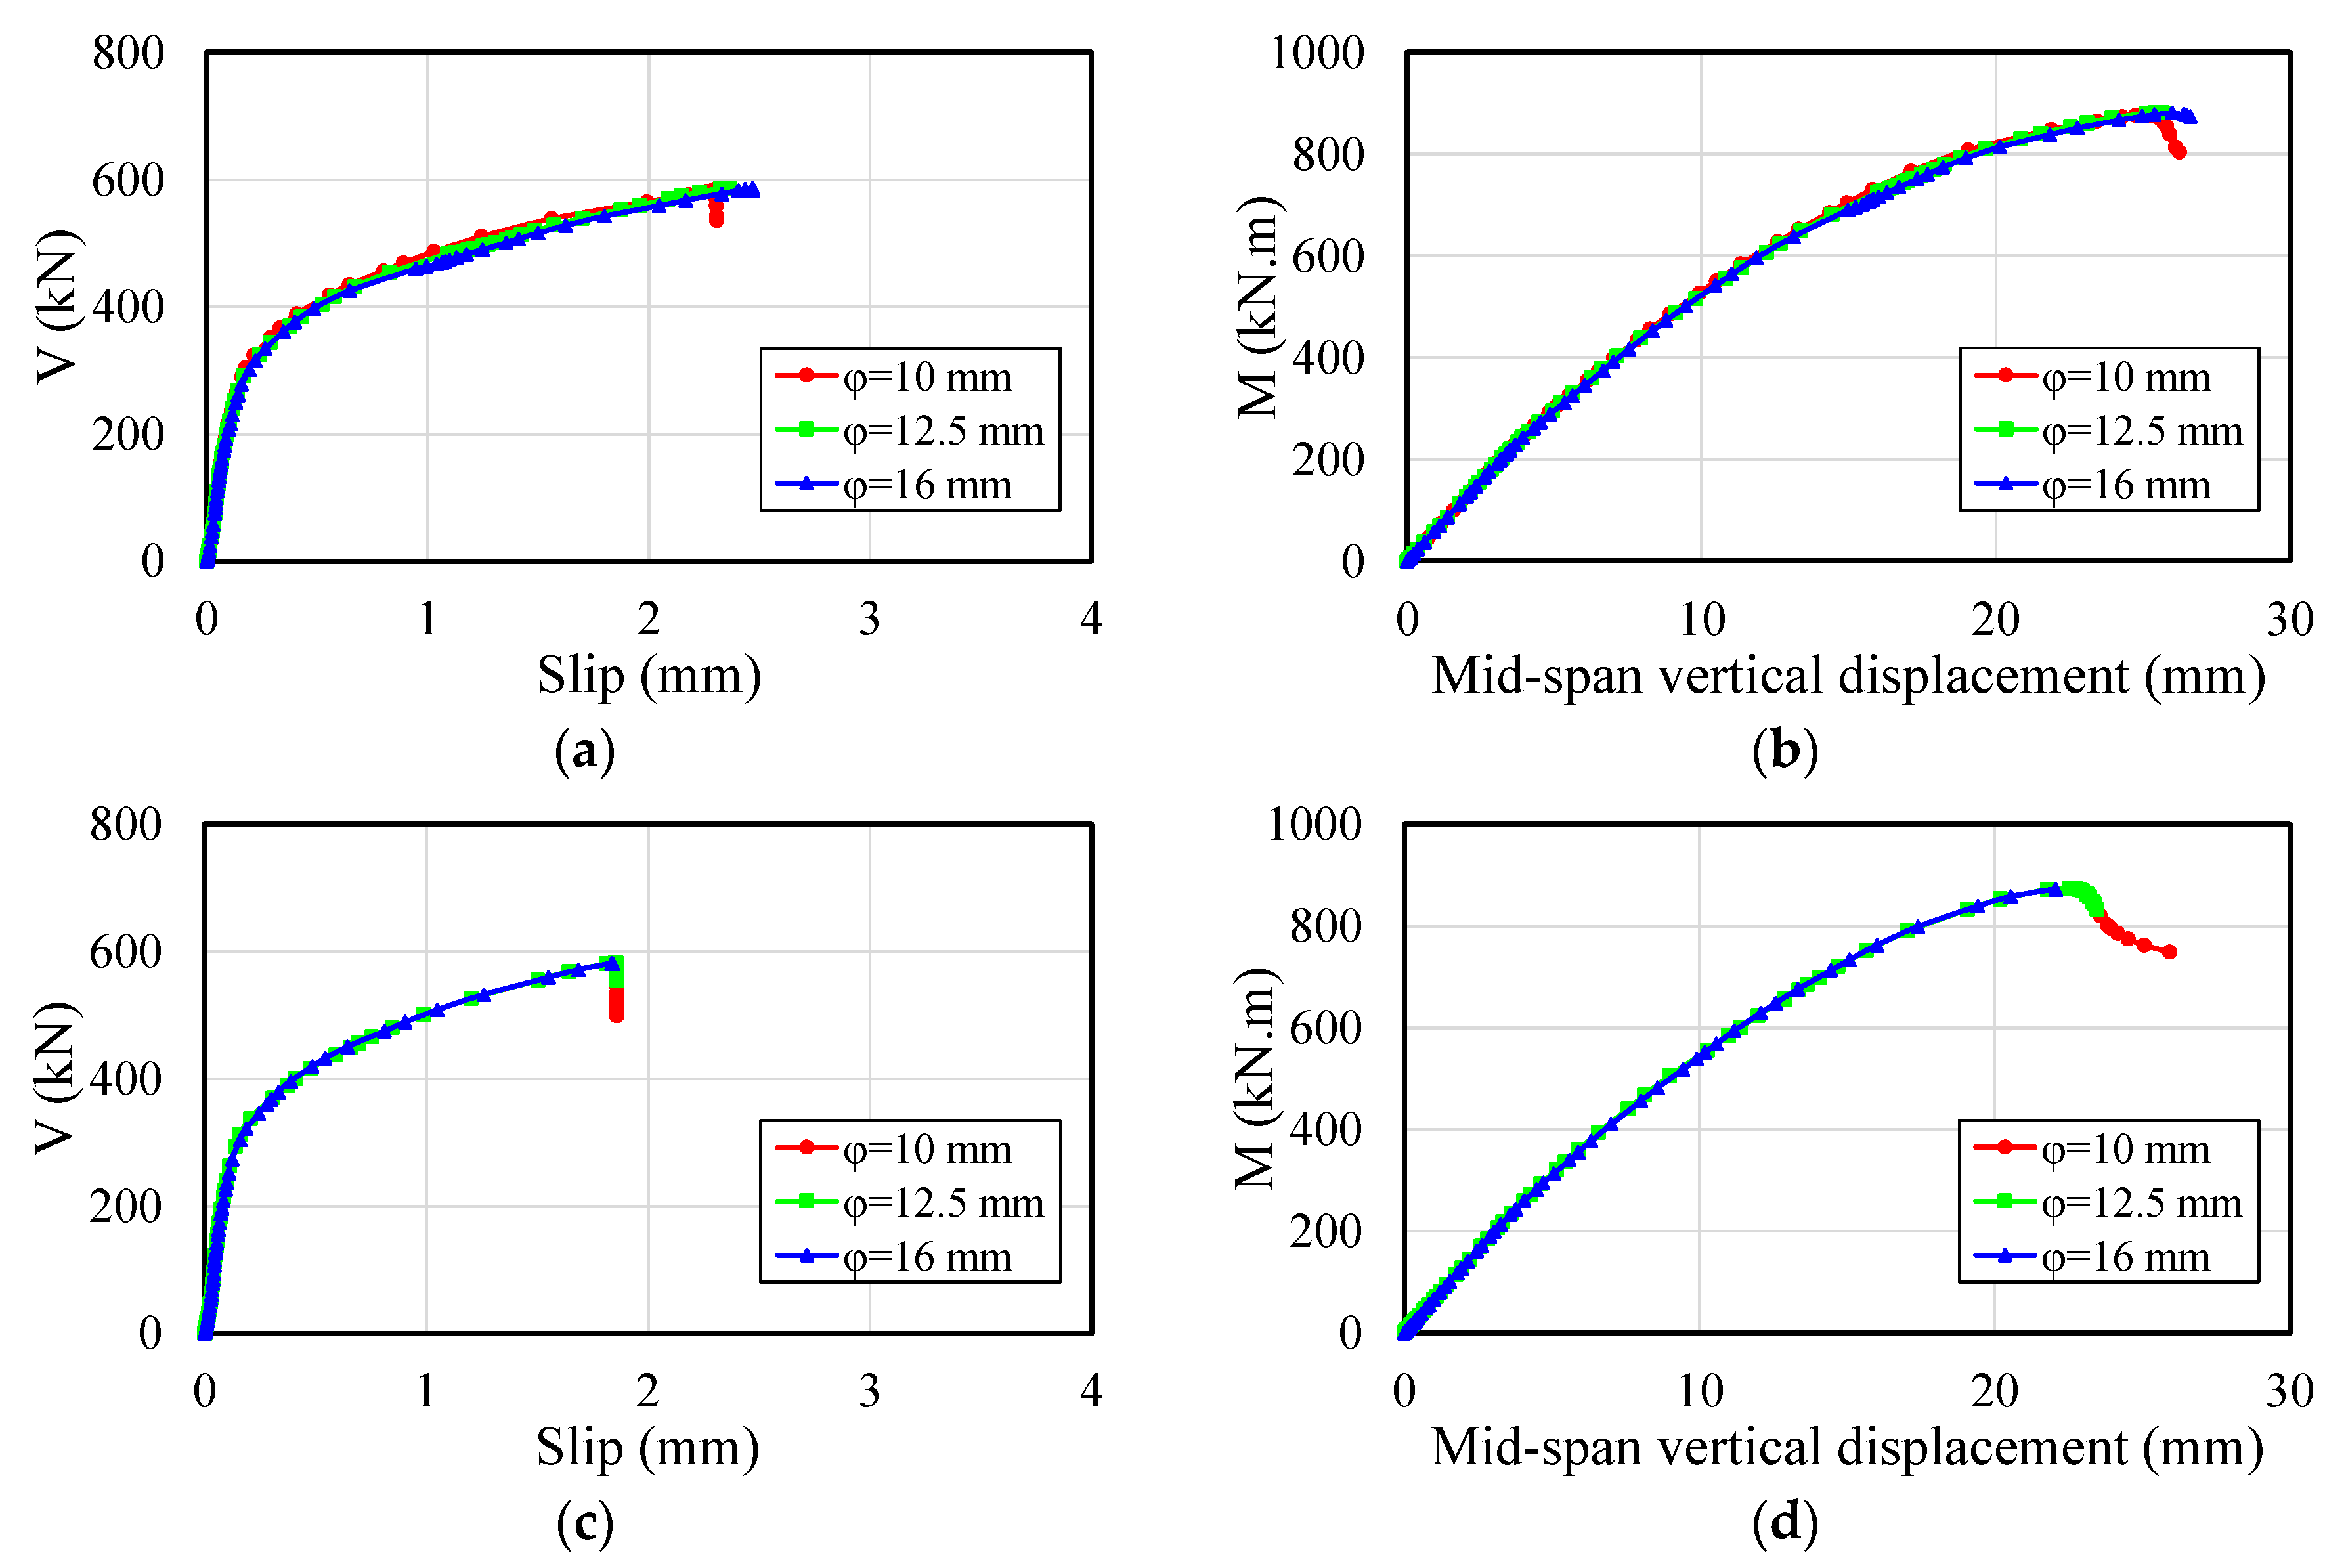
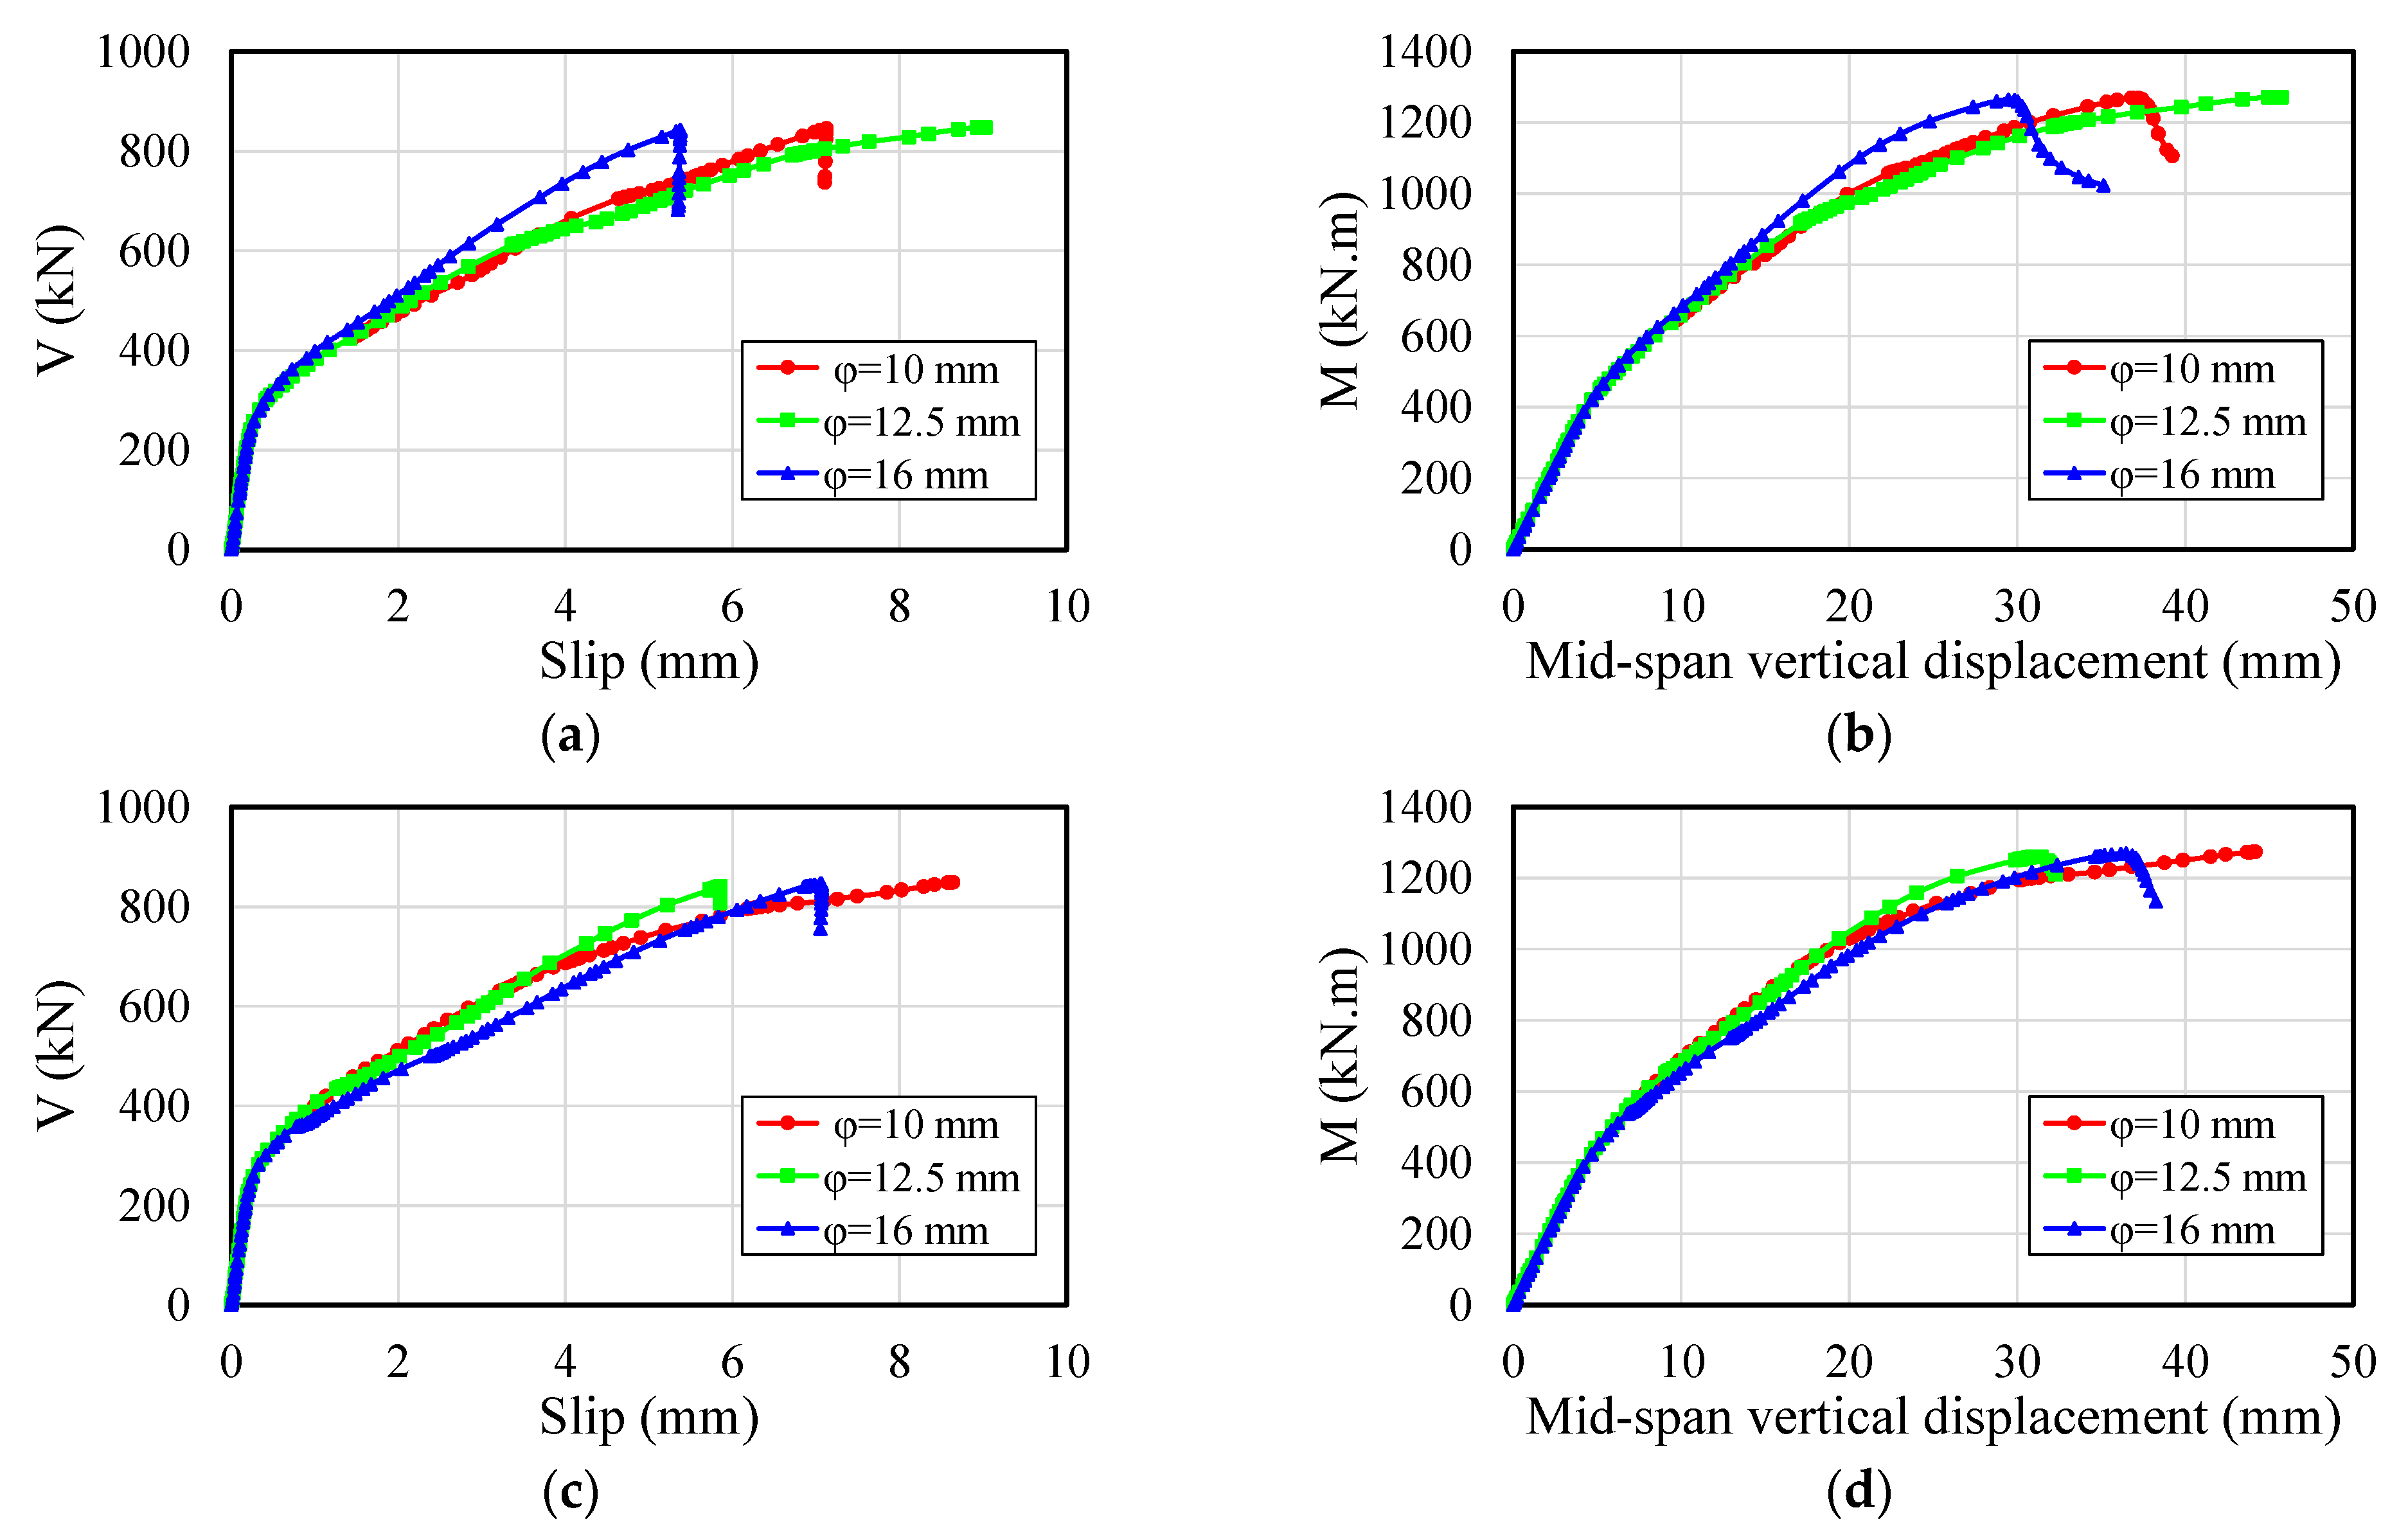
- The transverse reinforcement rate had little influence on the ultimate strength of the models analyzed. This was because in most models, the fragile behavior was verified.
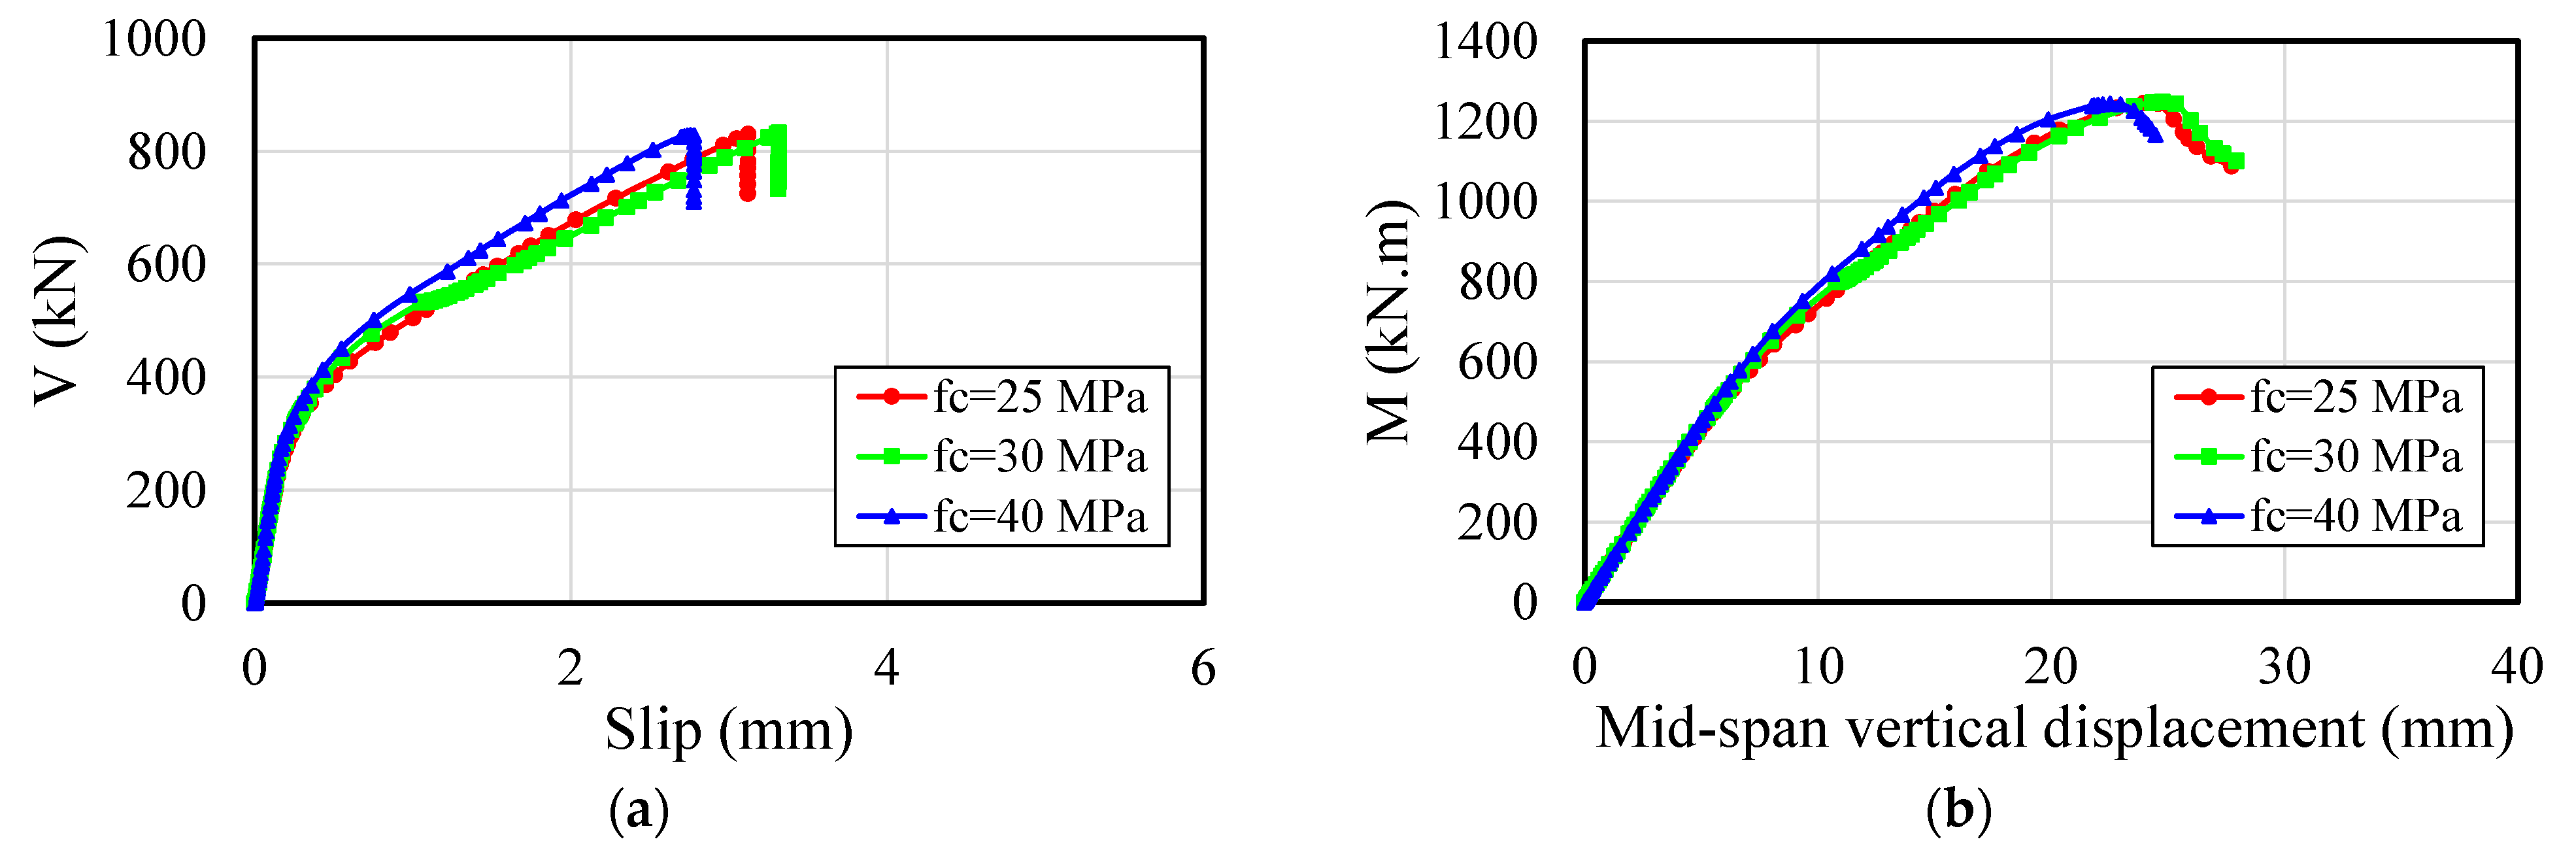
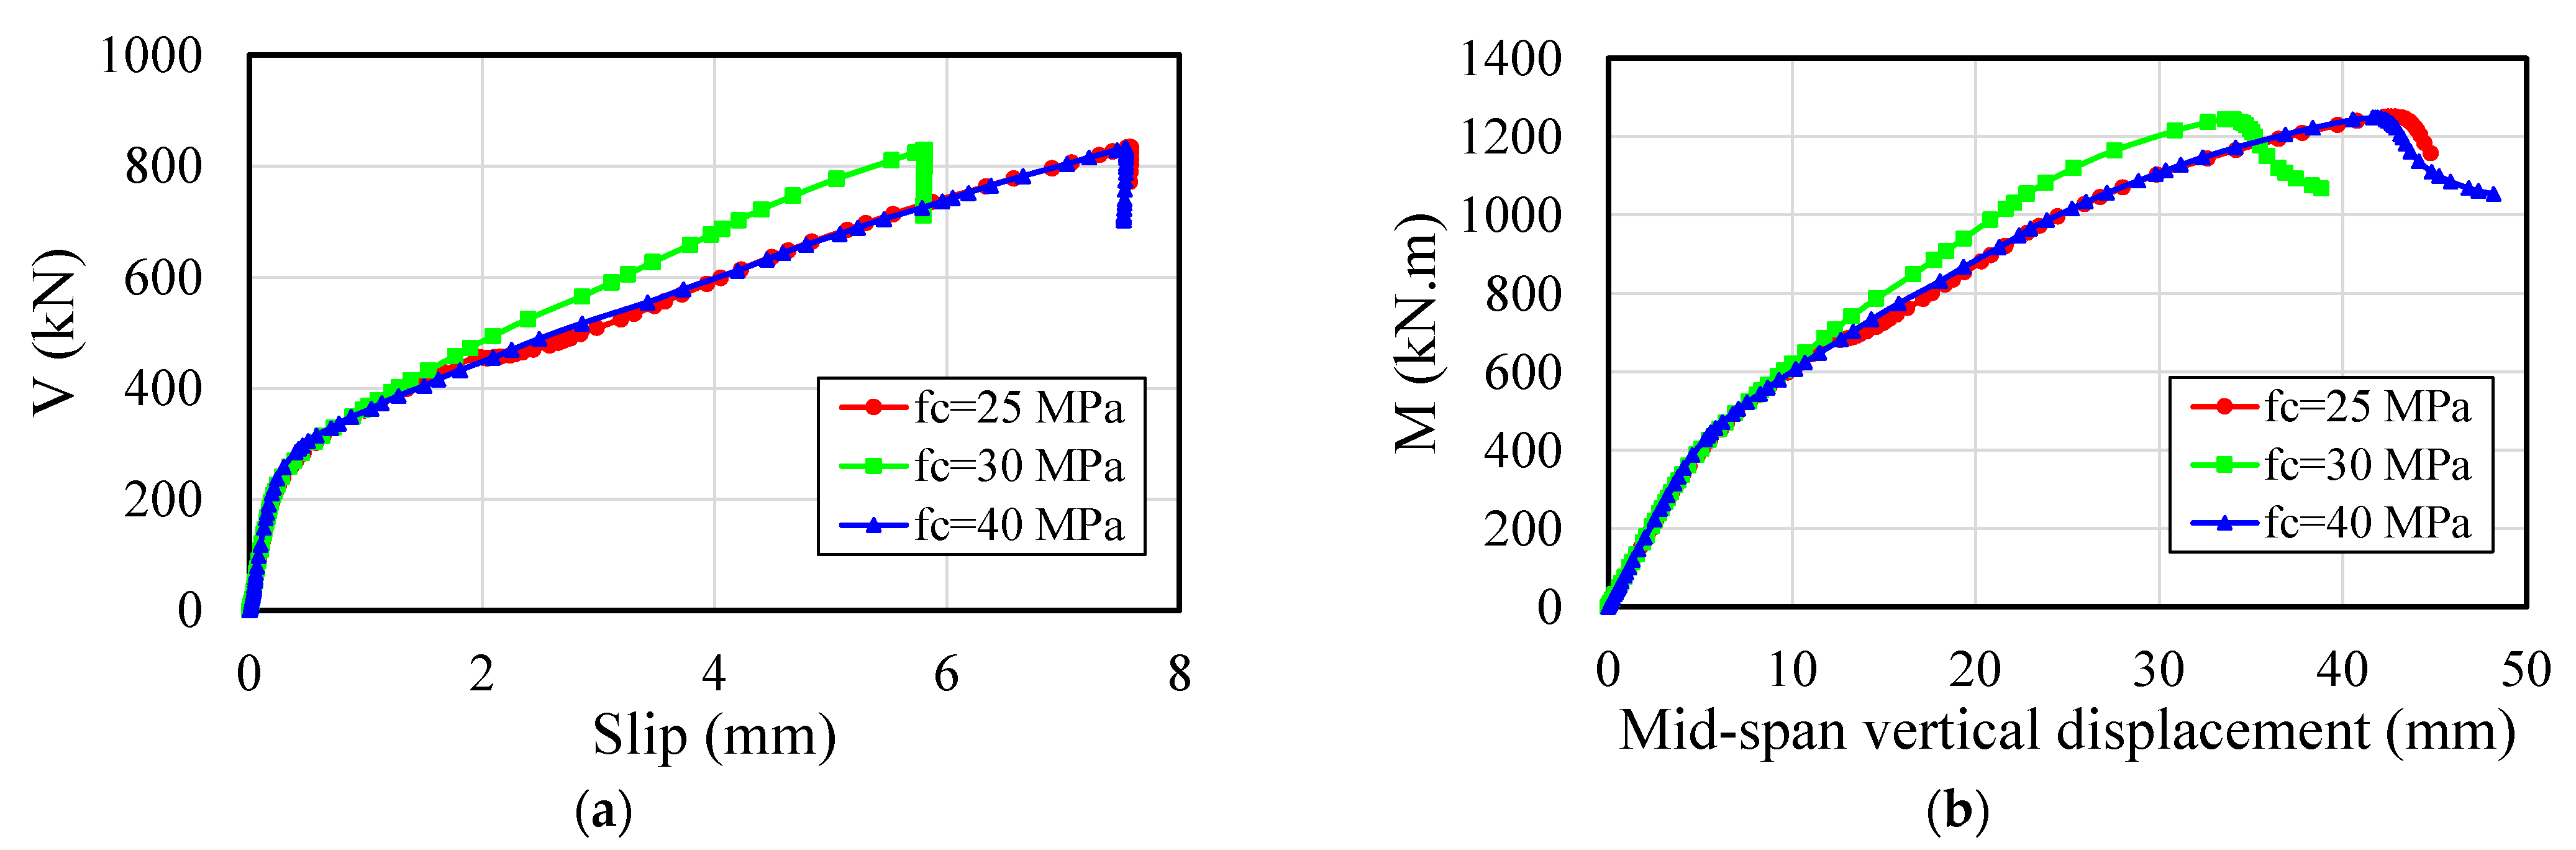
- With the variation of the in situ concrete strength, there were no significant differences in the ultimate strength. Therefore, the use of lower in situ concrete strength can be advantageous; that is, the lower the concrete resistance, the greater the possibility that the plastic neutral axis will lie within the steel section. However, it is worth mentioning that the strength of concrete is also related to durability, a factor that certainly influences the life cycle of the structural element. The greater the durability of the structural system, the less the need for excessive maintenance, thus contributing to the reduction of waste and embodied energy.
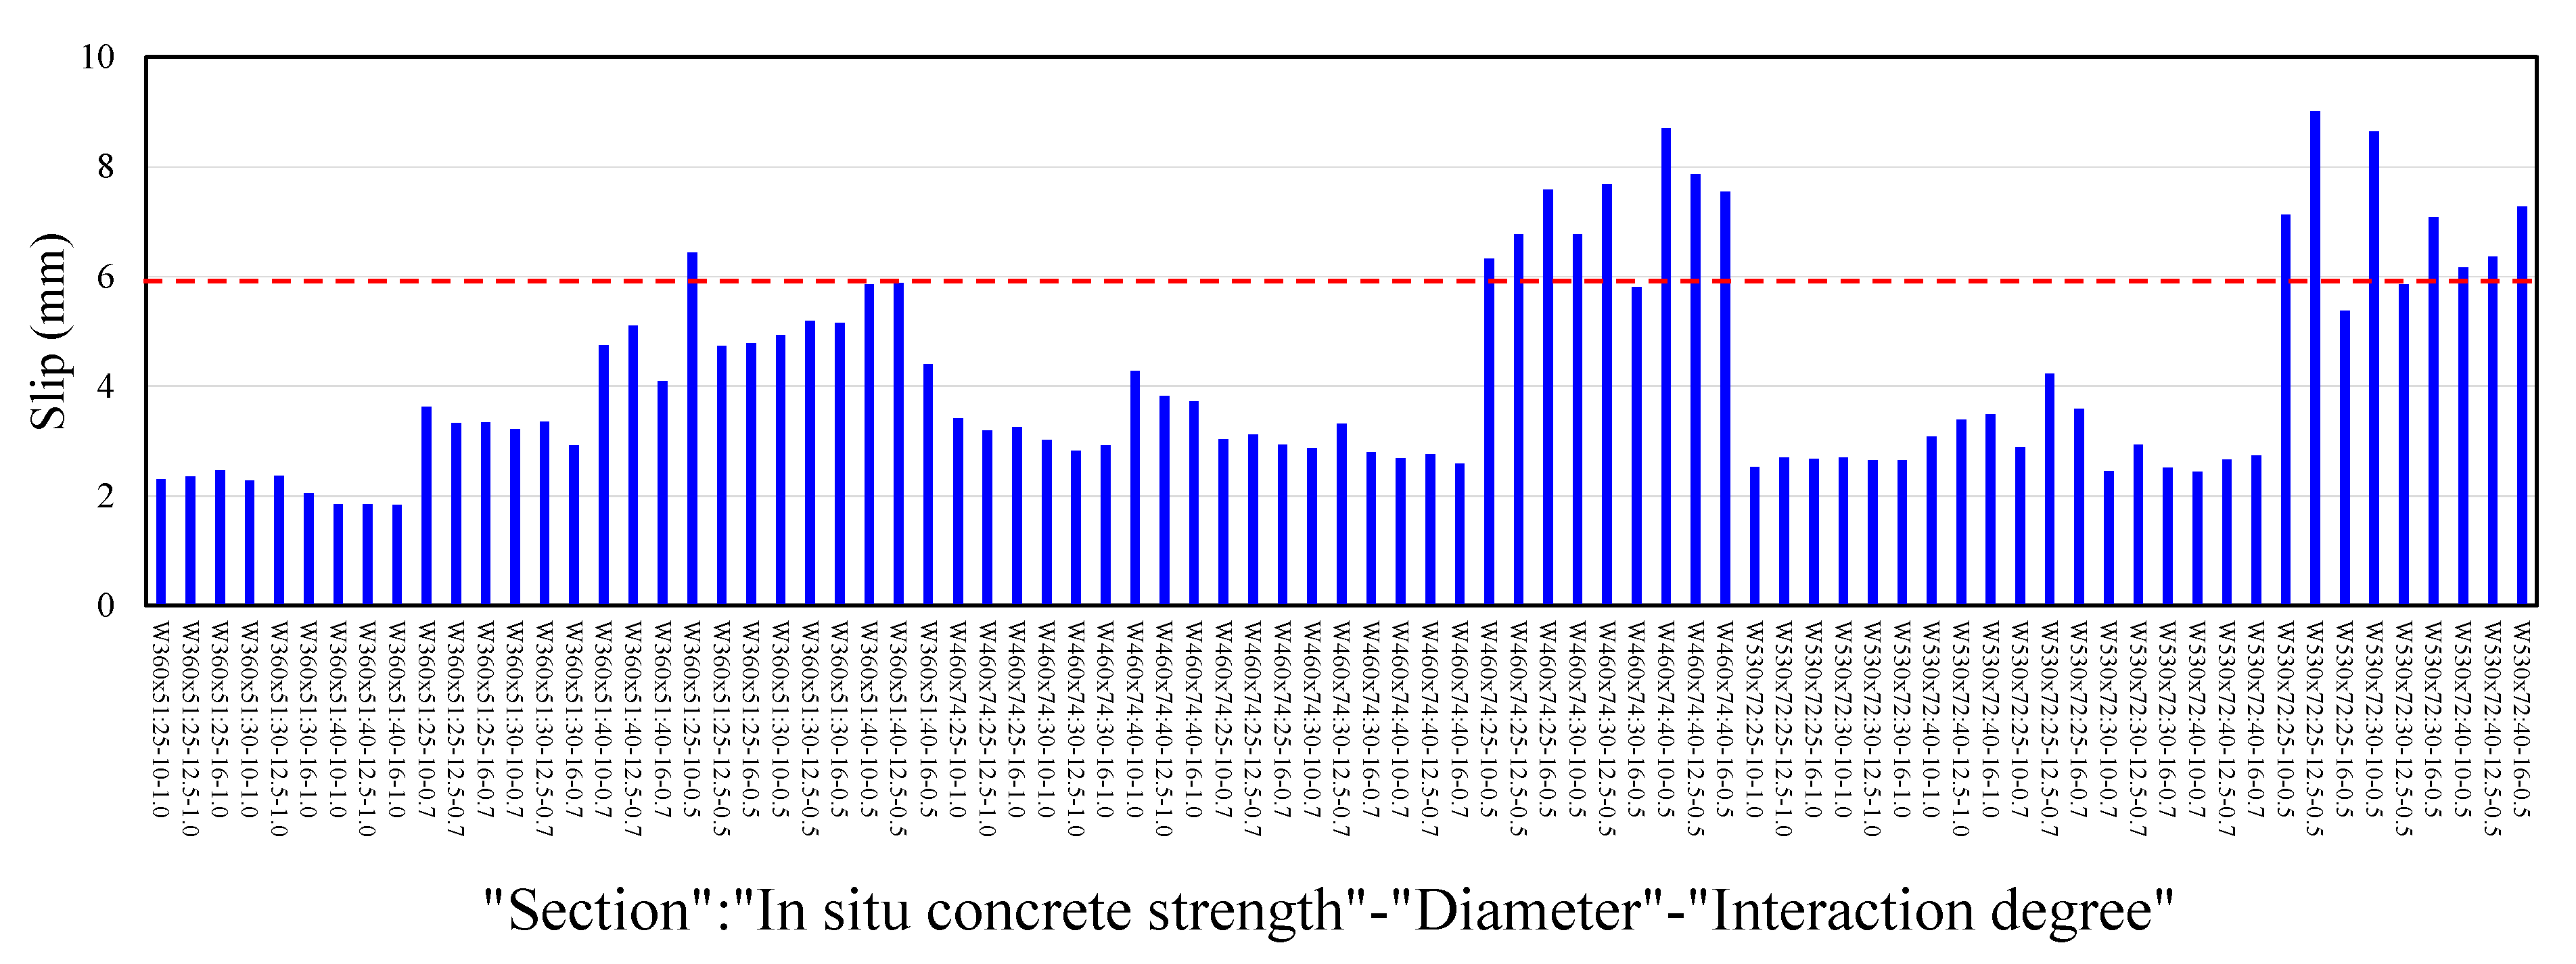
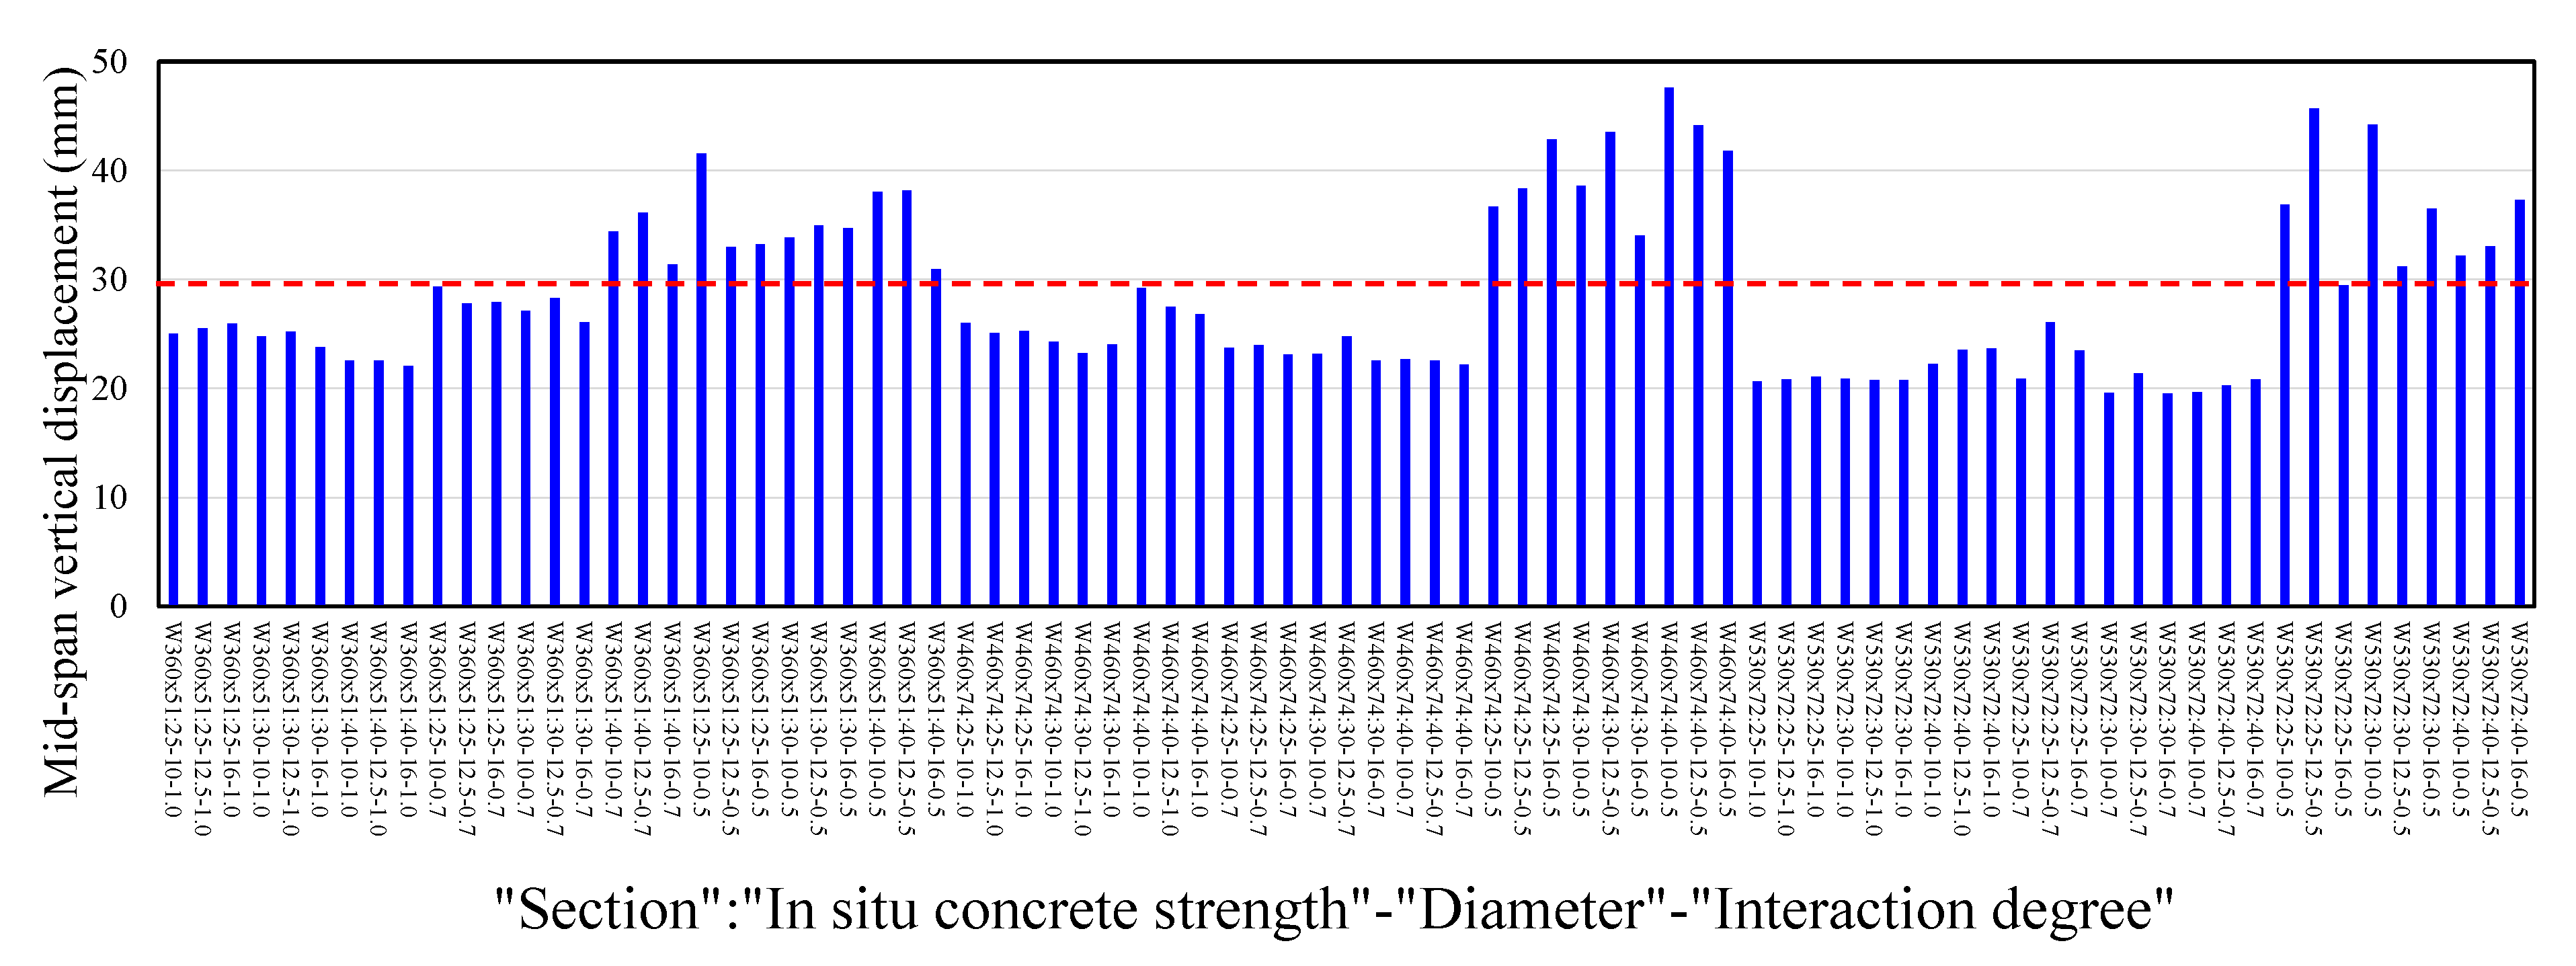
- Ductile behavior was observed for models with 225 mm of spacing, considering the W460x74 and W530x72 sections. It also was verified that the lower the interaction degree, the greater the midspan vertical displacement, which may exceed the limit of L/200.
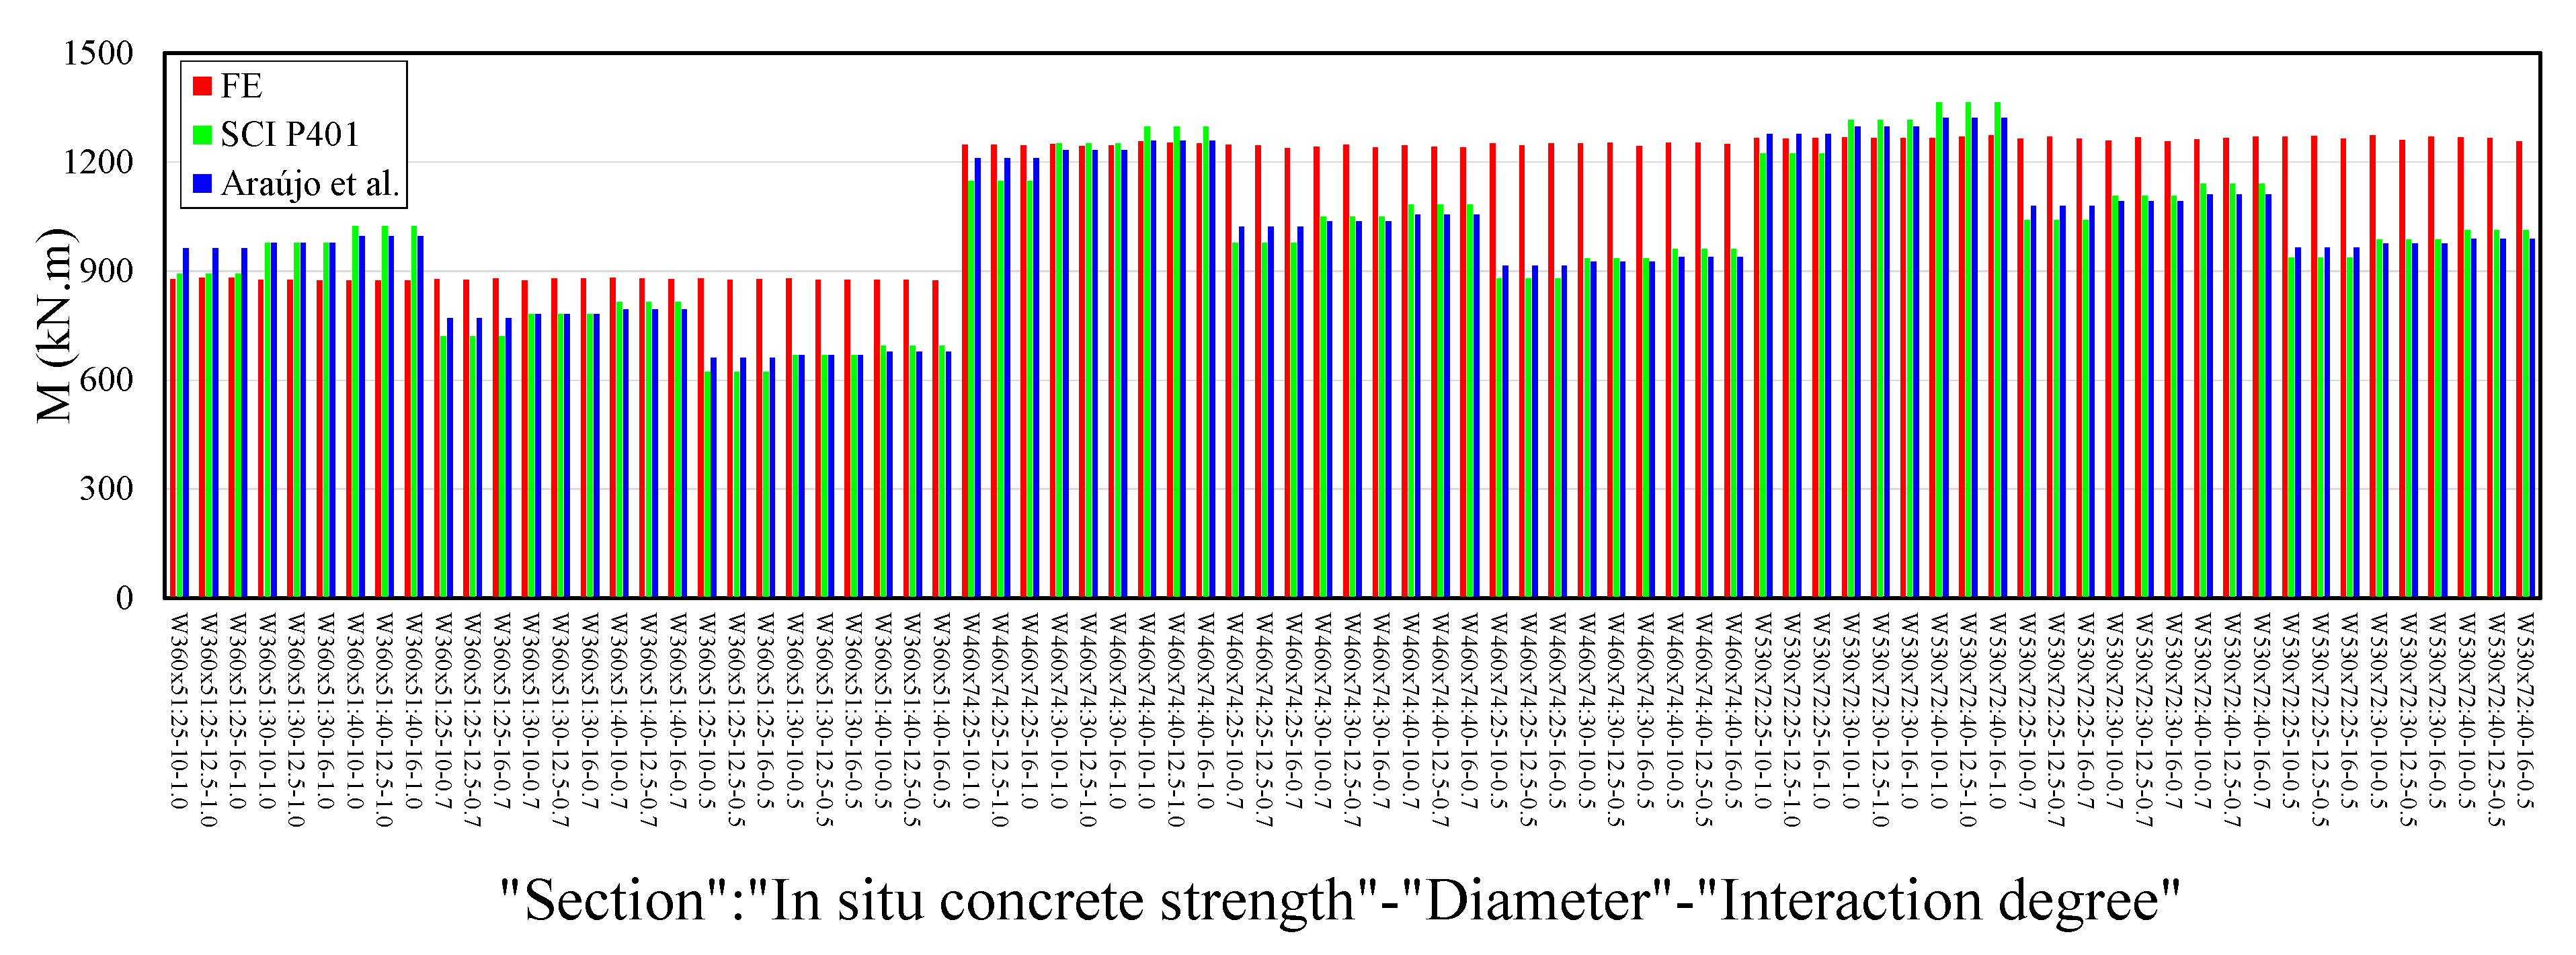
- Regarding the verification of strength with the calculation procedure, some models that considered full interaction proved to be unsafe (MFE ≤ MRk). On the other hand, all observations considering partial interaction proved to be safe (MFE > MRk).
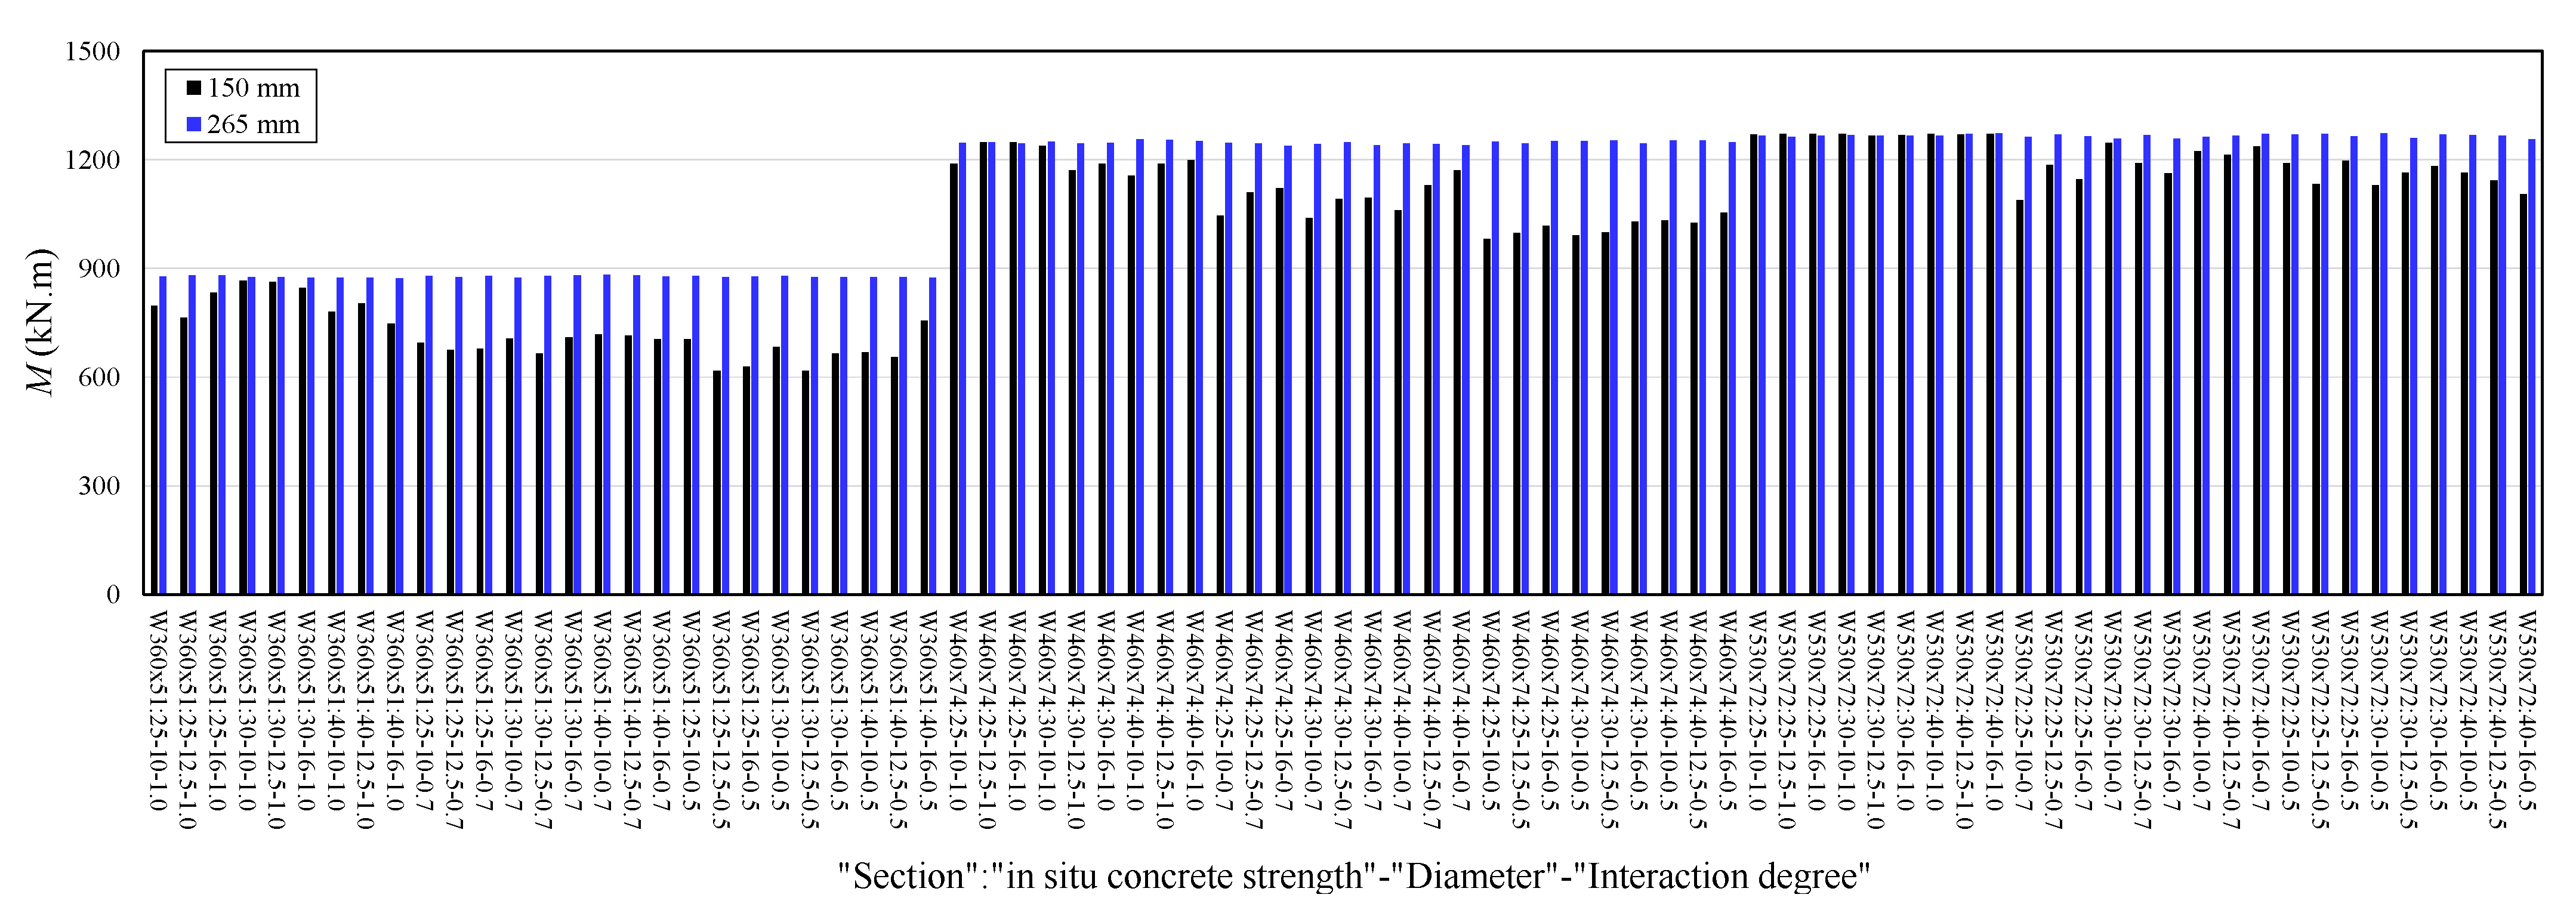
- The numerical models with a 265 mm hollow-core unit presented greater resistance than the models with a150 mm hollow-core unit, considering the W360x51 section. However, for the W460x74 and W530x72 sections, there were no significant differences. The basic difference between the models compared was 115 mm of precast concrete. Therefore, for the numerical models evaluated, using a smaller amount of precast concrete provided a better efficiency of the structural system. The use of a lower volume of concrete in a structural project provides a reduction in the structure’s own weight, and in terms of sustainability, a lower amount of CO2 emissions.
Author Contributions
Funding
Acknowledgments
Conflicts of Interest
References
- Cabeza, L.F.; Boquera, L.; Chàfer, M.; Vérez, D. Embodied energy and embodied carbon of structural building materials: Worldwide progress and barriers through literature map analysis. Energy Build. 2021, 231, 110612. [Google Scholar] [CrossRef]
- Whitworth, A.H.; Tsavdaridis, K.D. Genetic algorithm for embodied energy optimisation of steel-concrete composite beams. Sustainability 2020, 12, 3102. [Google Scholar] [CrossRef] [Green Version]
- Whitworth, A.; Tsavdaridis, K. Embodied energy optimization of steel-concrete composite beams using a genetic algorithm. Procedia Manuf. 2020, 44, 417–424. [Google Scholar] [CrossRef]
- European Committee for Standardization. EN 1994-1-1: Eurocode 4—Design of Composite Steel and Concrete Structures—Part 1-1: General Rules for Buildings; European Committee for Standardization: Brussels, Belgium, 2004. [Google Scholar]
- Ibrahim, I.; Elliott, K.; Abdullah, R.; Kueh, A.; Sarbini, N. Experimental study on the shear behaviour of precast concrete hollow core slabs with concrete topping. Eng. Struct. 2016, 125, 80–90. [Google Scholar] [CrossRef]
- Baran, E. Effects of cast-in-place concrete topping on flexural response of precast concrete hollow-core slabs. Eng. Struct. 2015, 98, 109–117. [Google Scholar] [CrossRef]
- Girhammar, U.A.; Pajari, M. Tests and analysis on shear strength of composite slabs of hollow core units and concrete topping. Constr. Build. Mater. 2008, 22, 1708–1722. [Google Scholar] [CrossRef]
- Araújo, D.D.L.; Sales, M.W.R.; Silva, R.P.M.; Antunes, C.D.F.M.; Ferreira, M.D.A. Shear strength of prestressed 160 mm deep hollow core slabs. Eng. Struct. 2020, 218, 110723. [Google Scholar] [CrossRef]
- Albero, V.; Saura, H.; Hospitaler, A.; Montalvà, J.; Romero, M.L. Optimal design of prestressed concrete hollow core slabs taking into account its fire resistance. Adv. Eng. Softw. 2018, 122, 81–92. [Google Scholar] [CrossRef]
- De Nardin, S.; El Debs, A.L. State of the art of Steel-Concrete composite structures in Brazil. Proc. Inst. Civ. Eng. Civ. Eng. 2013, 166, 20–27. [Google Scholar] [CrossRef]
- Lam, D. Capacities of headed stud shear connectors in composite steel beams with precast hollowcore slabs. J. Constr. Steel Res. 2007, 63, 1160–1174. [Google Scholar] [CrossRef]
- Tawadrous, R.; Morcous, G. Shear strength of deep hollow-core slabs. ACI Struct. J. 2018, 115, 699–709. [Google Scholar] [CrossRef]
- Ahmed, K.E.-S.; Abdulrahman, M.; Alhozaimy, A.M. Web shear resistance of prestressed precast deep hollow core slabs. Struct. J. 2016, 116, 139–150. [Google Scholar] [CrossRef]
- De Souza, P.T.; Kataoka, M.N.; El Debs, A.L.H. Experimental and numerical analysis of the push-out test on shear studs in hollow core slabs. Eng. Struct. 2017, 147, 398–409. [Google Scholar] [CrossRef]
- Ahmed, I.M.; Tsavdaridis, K.D. Life cycle assessment (LCA) and cost (LCC) studies of lightweight composite flooring systems. J. Build. Eng. 2018, 20, 624–633. [Google Scholar] [CrossRef]
- Dong, Y.H.; Jaillon, L.; Chu, P.; Poon, C. Comparing carbon emissions of precast and cast-in-situ construction methods—A case study of high-rise private building. Constr. Build. Mater. 2015, 99, 39–53. [Google Scholar] [CrossRef]
- Lam, D. Composite Steel Beams Using Precast Concrete Hollow Core Floor Slabs. 1998. Ph.D. Thesis, University of Nottingham, Nottingham, UK, 1998. [Google Scholar]
- Batista, E.M.; Landesmann, A. Análise experimental de vigas mistas de aço e concreto compostas por lajes alveolares e perfis laminados. COPPETEC, PEC-18541 2016. Unpublished.
- Gouchman, G.H. Design of Composite Beams Using Precast Concrete Slabs in Accordance with EUROCODE 4; The Steel Construction Institute: London, UK, 2014. [Google Scholar]
- Araújo, D.D.L.; Sales, M.W.R.; de Paulo, S.M.; de Cresce El, A.L. Headed steel stud connectors for composite steel beams with precast hollow-core slabs with structural topping. Eng. Struct. 2016, 107, 135–150. [Google Scholar] [CrossRef]
- Lam, D.; Elliott, K.S.; Nethercot, D.A. Experiments on composite steel beams with precast concrete hollow core floor slabs. Proc. Inst. Civ. Eng. Struct. Build. 2000, 140, 127–138. [Google Scholar] [CrossRef]
- Lam, D.; Elliott, K.; Nethercot, D. Parametric study on composite steel beams with precast concrete hollow core floor slabs. J. Constr. Steel Res. 2000, 54, 283–304. [Google Scholar] [CrossRef]
- El-Lobody, E.; Lam, D. Modelling of headed stud in steel-precast composite beams. Steel Compos. Struct. 2002, 2, 355–378. [Google Scholar] [CrossRef]
- Hicks, S.J.; Lawson, R.M. Design of Composite Beams Using Precast Concrete Slabs; The Steel Construction Institute: London, UK, 2003. [Google Scholar]
- Ferreira, F.P.V.; Martins, C.H.; De Nardin, S. A parametric study of steel-concrete composite beams with hollow core slabs and concrete topping. Structures 2020, 28, 276–296. [Google Scholar] [CrossRef]
- Ferreira, F.P.V.; Martins, C.H.; De Nardin, S. Advances in composite beams with web openings and composite cellular beams. J. Constr. Steel Res. 2020, 172, 106182. [Google Scholar] [CrossRef]
- Walraven, J.C.; Mercx, W.P.M. The bearing capacity of prestressed hollow core slabs. Heron 1983, 28, 1–46. [Google Scholar]
- Nguyen, T.H.; Tan, K.-H.; Kanda, T. Investigations on web-shear behavior of deep precast, prestressed concrete hollow core slabs. Eng. Struct. 2019, 183, 579–593. [Google Scholar] [CrossRef]
- Joo, H.-E.; Han, S.-J.; Park, M.-K.; Kim, K.S. Shear tests of deep hollow core slabs strengthened by core-filling. Appl. Sci. 2020, 10, 1709. [Google Scholar] [CrossRef] [Green Version]
- Michelini, E.; Bernardi, P.; Cerioni, R.; Belletti, B. Experimental and numerical assessment of flexural and shear behavior of precast prestressed deep hollow-core slabs. Int. J. Concr. Struct. Mater. 2020, 14, 1–17. [Google Scholar] [CrossRef]
- Brunesi, E.; Bolognini, D.; Nascimbene, R. Evaluation of the shear capacity of precast-prestressed hollow core slabs: Numerical and experimental comparisons. Mater. Struct. 2014, 48, 1503–1521. [Google Scholar] [CrossRef]
- Palmer, K.D.; Schultz, A.E. Experimental investigation of the web-shear strength of deep hollow-core units. PCI J. 2011, 56, 83–104. [Google Scholar] [CrossRef]
- ABAQUS 6.18 (2016) FEA computer software, Version 6.12, Product.
- Ferreira, F.P.V.; Rossi, A.; Martins, C.H. Lateral-torsional buckling of cellular beams according to the possible updating of EC3. J. Constr. Steel Res. 2019, 153, 222–242. [Google Scholar] [CrossRef]
- Ferreira, F.P.V.; Martins, C.H. LRFD for lateral-torsional buckling resistance of cellular beams. Int. J. Civ. Eng. 2019, 18, 303–323. [Google Scholar] [CrossRef]
- Rossi, A.; Ferreira, F.P.V.; Martins, C.H.; Júnior, E.C.M. Assessment of lateral distortional buckling resistance in welded I-beams. J. Constr. Steel Res. 2020, 166, 105924. [Google Scholar] [CrossRef]
- Ferreira, F.P.V.; Martins, C.H.; De Nardin, S. Assessment of web post buckling resistance in steel-concrete composite cellular beams. Thin-Walled Struct. 2021, 158, 106969. [Google Scholar] [CrossRef]
- Ferreira, F.P.V.; Martins, C.H.; De Nardin, S. Sensitivity analysis of composite cellular beams to constitutive material models and concrete fracture. Int. J. Struct. Stab. Dyn. 2021, 21, 2150008. [Google Scholar] [CrossRef]
- Ferreira, F.P.V.; Tsavdaridis, K.D.; Martins, C.H.; De Nardin, S. Buckling and post-buckling analyses of composite cellular beams. Compos. Struct. 2021, 262, 113616. [Google Scholar] [CrossRef]
- Ferreira, F.P.V.; Tsavdaridis, K.D.; Martins, C.H.; De Nardin, S. Ultimate strength prediction of Steel-Concrete composite cellular beams with PCHCS. Eng. Struct. 2021, 236, 112082. [Google Scholar] [CrossRef]
- Chen, S.; Jia, Y. Numerical investigation of inelastic buckling of Steel-Concrete composite beams prestressed with external tendons. Thin-Walled Struct. 2010, 48, 233–242. [Google Scholar] [CrossRef]
- Zhou, W.-B.; Yan, W.-J. Refined nonlinear finite element modelling towards ultimate bending moment calculation for concrete composite beams under negative moment. Thin-Walled Struct. 2017, 116, 201–211. [Google Scholar] [CrossRef]
- El-Lobody, E.; Lam, D. Finite element analysis of steel-concrete composite girders. Adv. Struct. Eng. 2003, 6, 267–281. [Google Scholar] [CrossRef]
- Hillerborg, A.; Modéer, M.; Petersson, P.-E. Analysis of crack formation and crack growth in concrete by means of fracture mechanics and finite elements. Cem. Concr. Res. 1976, 6, 773–781. [Google Scholar] [CrossRef]
- Lubliner, J.; Oliver, J.; Oller, S.; Oñate, E. A plastic-damage model for concrete. Int. J. Solids Struct. 1989, 25, 299–326. [Google Scholar] [CrossRef]
- Lee, J.; Fenves, G.L. Plastic-damage model for cyclic loading of concrete structures. J. Eng. Mech. 1998, 124, 892–900. [Google Scholar] [CrossRef]
- Genikomsou, A.S.; Polak, M.A. Finite element analysis of punching shear of concrete slabs using damaged plasticity model in ABAQUS. Eng. Struct. 2015, 98, 38–48. [Google Scholar] [CrossRef]
- Duvaut, G.; Lions, J.L. Inequalities in Mechanics and Physics; Springer: Berlin/Heidelberg, Germany, 1976; Volume 219. [Google Scholar]
- Behnam, H.; Kuang, J.; Samali, B. Parametric finite element analysis of RC wide beam-column connections. Comput. Struct. 2018, 205, 28–44. [Google Scholar] [CrossRef]
- Stress-strain relationship for plain concrete in compression. ACI J. Proc. 1985, 82, 797–804. [CrossRef]
- Carreira, D.J.; Chu, K.H. Stress-strain relatonship for reinforced concrete in tension. J. Am. Concr. Inst. 1986, 83, 21–28. [Google Scholar]
- Pathirana, S.W.; Uy, B.; Mirza, O.; Zhu, X. Flexural behaviour of composite steel–concrete beams utilising blind bolt shear connectors. Eng. Struct. 2016, 114, 181–194. [Google Scholar] [CrossRef]
- Liu, X.; Bradford, M.A.; Chen, Q.-J.; Ban, H. Finite element modelling of Steel-Concrete composite beams with high-strength friction-grip bolt shear connectors. Finite Elem. Anal. Des. 2016, 108, 54–65. [Google Scholar] [CrossRef]
- Sjaarda, M.; Porter, T.; West, J.S.; Walbridge, S. Fatigue behavior of welded shear studs in precast composite beams. J. Bridge Eng. 2017, 22, 04017089. [Google Scholar] [CrossRef]
- Guezouli, S.; Lachal, A. Numerical analysis of frictional contact effects in push-out tests. Eng. Struct. 2012, 40, 39–50. [Google Scholar] [CrossRef] [Green Version]
- Crisfield, M. A fast incremental/iterative solution procedure that handles “snap-through”. Comput. Struct. 1981, 13, 55–62. [Google Scholar] [CrossRef]
- Crisfield, M.A. Snap-through and snap-back response in concrete structures and the dangers of under-integration. Int. J. Numer. Methods Eng. 1986, 22, 751–767. [Google Scholar] [CrossRef]
- Maewal, A.; Nachbar, W. Stable postbuckling equilibria of axially compressed, elastic circular cylindrical shells: A finite-element analysis and comparison with experiments. J. Appl. Mech. 1977, 44, 475–481. [Google Scholar] [CrossRef]


| Model | d | bf | tf | tw | b | g | hc | c | Le | Lp | Lb | φ | fy,f | fy,w | fy,s | fc,HCU | fc,in |
|---|---|---|---|---|---|---|---|---|---|---|---|---|---|---|---|---|---|
| CB1 | 355 | 171.5 | 11.5 | 7.4 | 1665 | 65 | 150 | - | 150 | 1500 | 5700 | 16 | 310 | 355 | 585 | 50 a | 32 a |
| CB2 | 355 | 171.5 | 11.5 | 7.4 | 1665 | 65 | 150 | - | 150 | 1500 | 5700 | 8 | 310 | 355 | 473 | 50 a | 26 a |
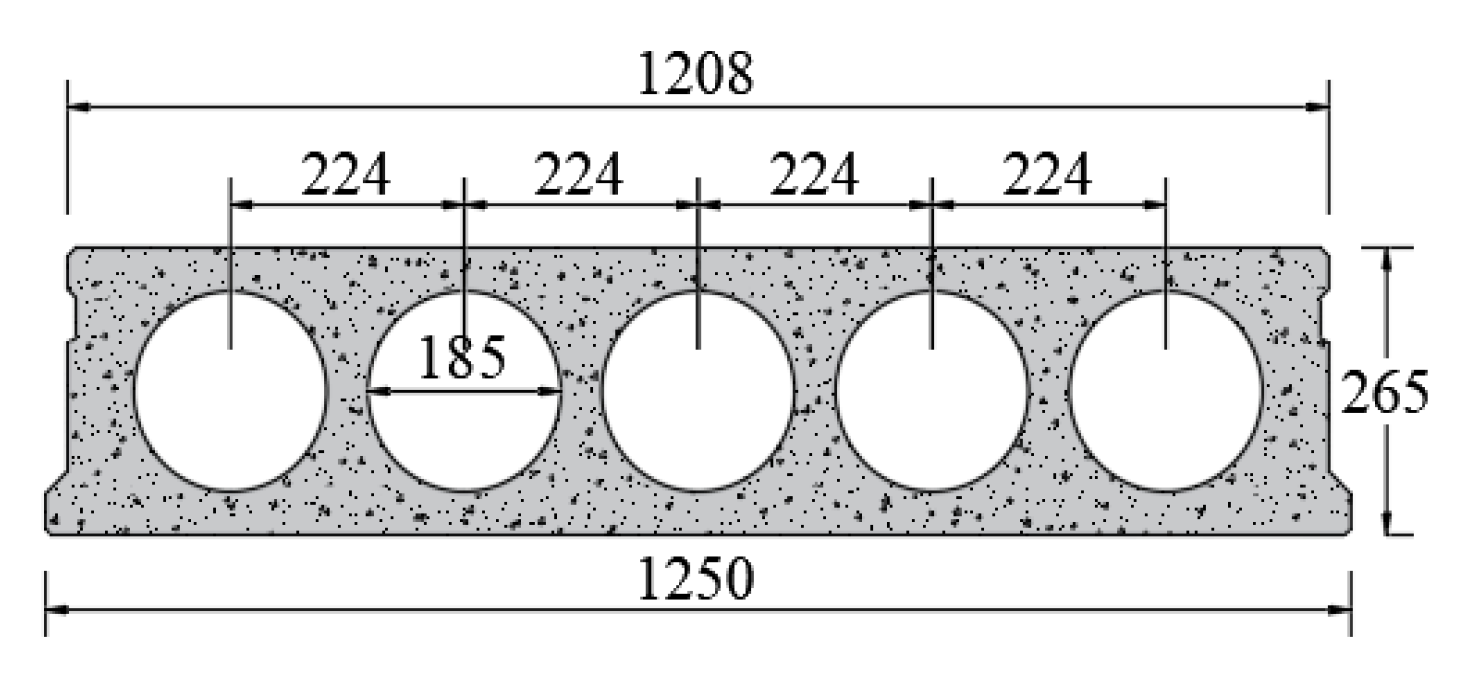
| CB3 | 299 | 306 | 11 | 11 | 1756 | 156 | 150 | 50 | 185 | 1915 | 5830 | 12.5 | 345 | 345 | 500 | 45 b | 30 b |
| CB4 | 299 | 306 | 11 | 11 | 1756 | 106 | 265 | 50 | 185 | 1915 | 5830 | 12.5 | 345 | 345 | 500 | 45 b | 30 b |
| Parameter | Value | Ref. |
|---|---|---|
| Ψ (°) (In situ concrete) | 40 | [47,49] |
| Ψ (°) (HCU concrete) | 28 | [28] |
| ξ | 0.1 (default) | [28,33,47,49] |
| σb0/σc0 | 1.16 (default) | [28,33,47,49] |
| Kc | 2/3 (default) | [28,33,47,49] |
| µ (s−1) | 0.001 | - |
| Model | MTest (kN.m) | δTest (mm) | MFE (kN.m) | δFE (mm) | MFE/Mtest | δFE/δtest |
|---|---|---|---|---|---|---|
| CB1 | 497 | 32 | 496 | 33 | 1.00 | 1.03 |
| CB2 | 474 | 35 | 485 | 34 | 0.95 | 0.97 |
| CB3 | 846 | 70 | 895 | 71 | 0.95 | 1.00 |
| CB4 | 985 | 37 | 1015 | 35 | 1.03 | 0.95 |
| Parameters | Variation |
|---|---|
| Section | W360x51, W460x74, and W530x72 |
| In situ concrete strength (MPa) | 25, 30, and 40 |
| Transverse reinforcement diameter (mm) | 10, 12.5, and 16 |
| Shear-stud spacing (mm) | 125, 175, and 275 |
Publisher’s Note: MDPI stays neutral with regard to jurisdictional claims in published maps and institutional affiliations. |
© 2021 by the authors. Licensee MDPI, Basel, Switzerland. This article is an open access article distributed under the terms and conditions of the Creative Commons Attribution (CC BY) license (https://creativecommons.org/licenses/by/4.0/).
Share and Cite
Ferreira, F.P.V.; Tsavdaridis, K.D.; Martins, C.H.; De Nardin, S. Steel-Concrete Composite Beams with Precast Hollow-Core Slabs: A Sustainable Solution. Sustainability 2021, 13, 4230. https://0-doi-org.brum.beds.ac.uk/10.3390/su13084230
Ferreira FPV, Tsavdaridis KD, Martins CH, De Nardin S. Steel-Concrete Composite Beams with Precast Hollow-Core Slabs: A Sustainable Solution. Sustainability. 2021; 13(8):4230. https://0-doi-org.brum.beds.ac.uk/10.3390/su13084230
Chicago/Turabian StyleFerreira, Felipe Piana Vendramell, Konstantinos Daniel Tsavdaridis, Carlos Humberto Martins, and Silvana De Nardin. 2021. "Steel-Concrete Composite Beams with Precast Hollow-Core Slabs: A Sustainable Solution" Sustainability 13, no. 8: 4230. https://0-doi-org.brum.beds.ac.uk/10.3390/su13084230