
A Comprehensive Emissions Model Combining Autonomous Vehicles with Park and Ride and Electric Vehicle Transportation Policies


Abstract
:1. Introduction
2. Literature Review
2.1. Autonomous Vehicles(AVs)
2.2. Electric Vehicles (EV)
2.3. Park and Ride (P&R)
2.4. COPERT Software
3. Method
3.1. Overview of the Study Area
3.2. Methodology for the Calculation of Emissions
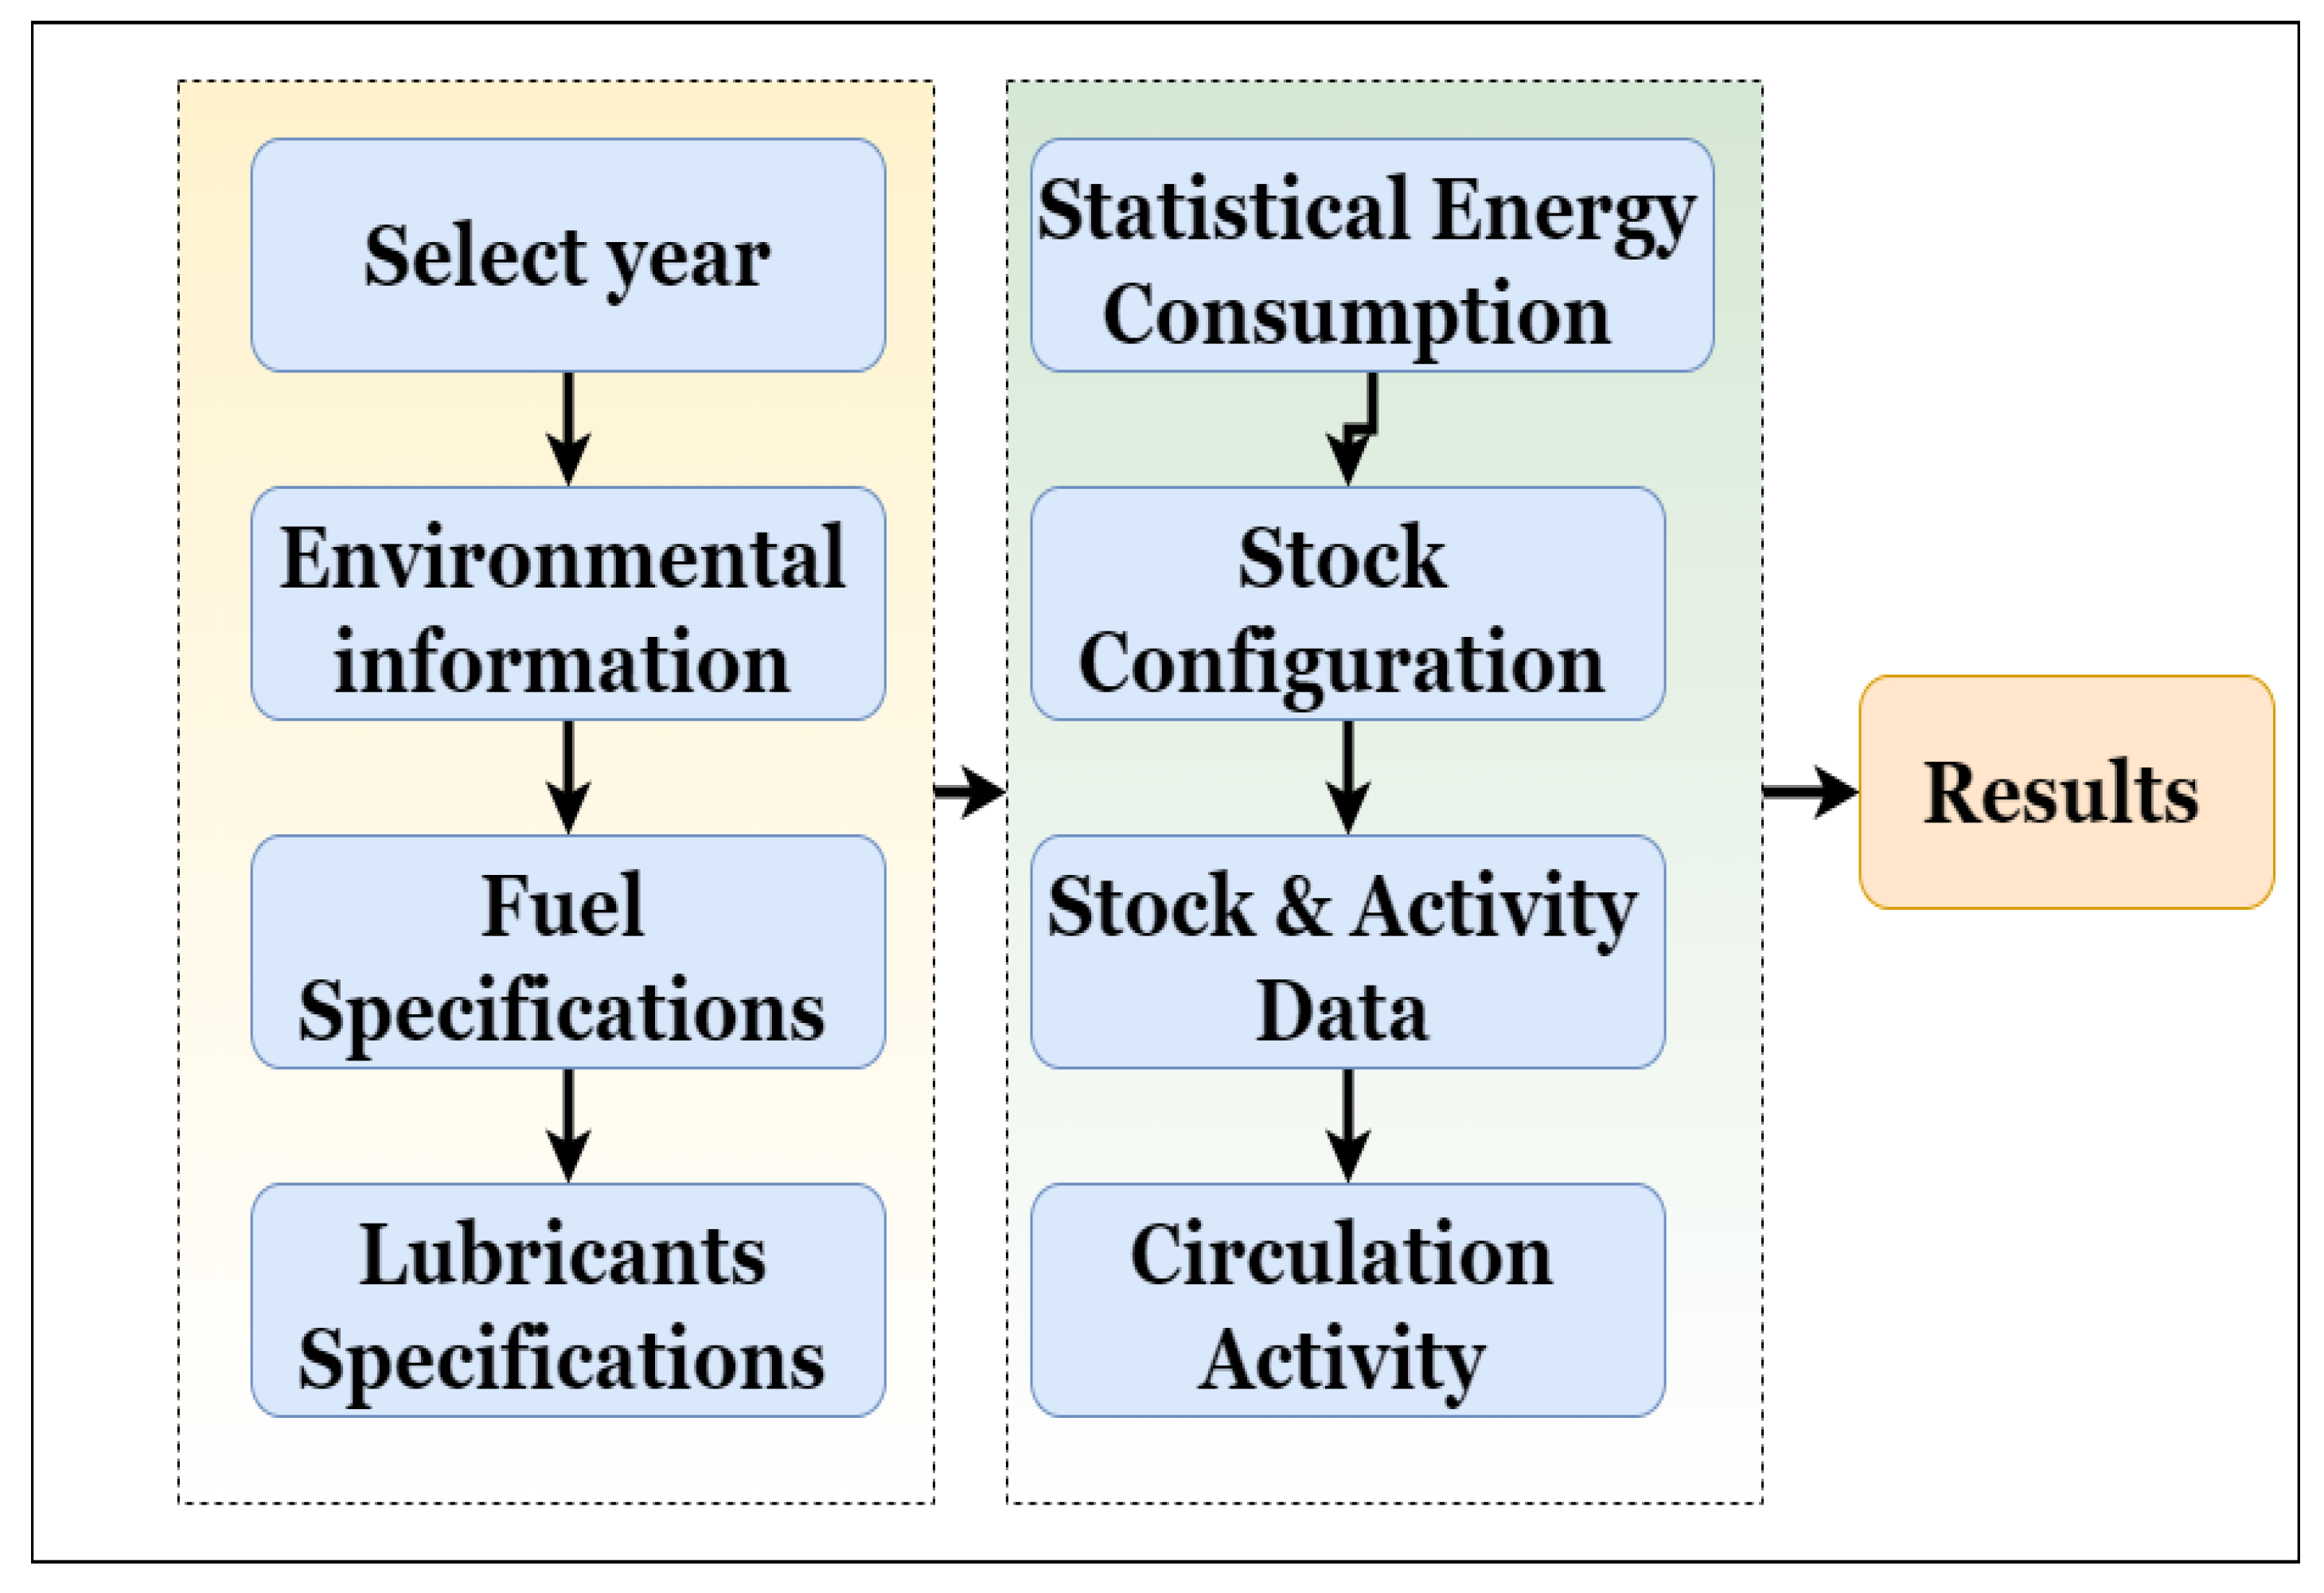
- Select the year: Select the year for which the study is intended to be carried out.
- Environmental information: The city’s meteorological information such as recorded temperature, the relative humidity for a year.
- Fuel specifications: Fuel values such as density (kg/m3), percentage of fuel aromatic components in PCA (% v/v), and NC cetane number can be entered.
- Lubricant specifications: information is pre-installed within the software.
- Statistical energy consumption: compares statistical and calculated energy consumption, modifies a number of input data (e.g., mileage, blend share), and recalculates emissions
- Stock configuration: The type of vehicles that make up the city’s vehicle fleet.
- Stock and activity data: The number of vehicles by category and kilometers travelled.
- Circulation activity: Urban trips are selected, which are the vehicles that are being investigated.
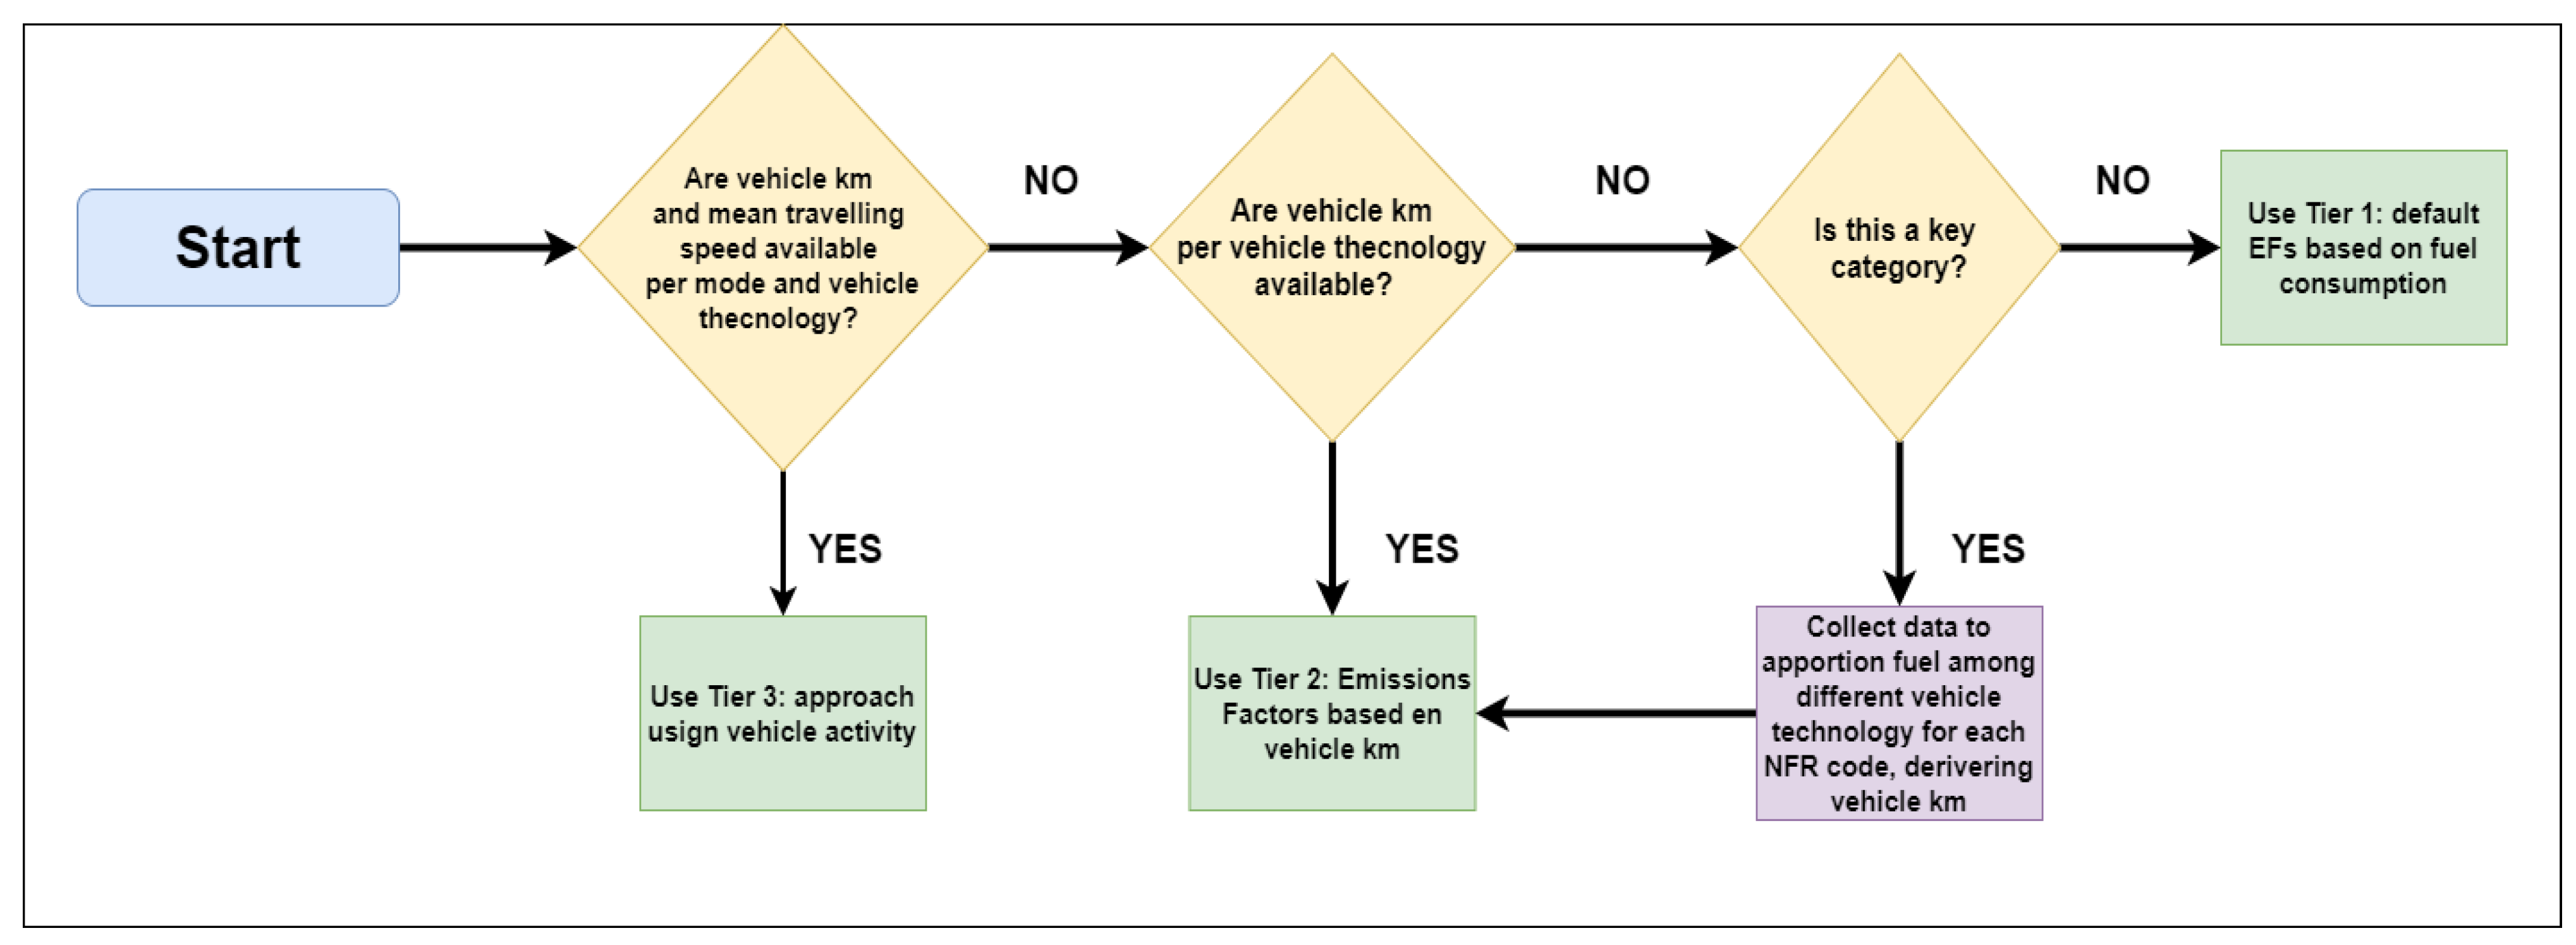
- Tier 1
- Tier 2
- Tier 3
3.3. Selected Scenarios
- Scenario I
- Scenario II
- Scenario III
- Scenario IV
4. Results and Discussion
5. Conclusions
Author Contributions
Funding
Institutional Review Board Statement
Informed Consent Statement
Data Availability Statement
Acknowledgments
Conflicts of Interest
References
- Maltese, I.; Gatta, V.; Marcucci, E. Active Travel in Sustainable Urban Mobility Plans. An Italian overview. Res. Transp. Bus. Manag. 2021. [Google Scholar] [CrossRef]
- Hu, X.; Chen, N.; Wu, N.; Yin, B. The potential impacts of electric vehicles on urban air quality in Shanghai city. Sustainability 2021, 13, 496. [Google Scholar] [CrossRef]
- Ortega, J.; Tóth, J.; Péter, T. A Comprehensive Model to Study the Dynamic Accessibility of the Park & Ride System. Sustainability 2021, 13, 4064. [Google Scholar] [CrossRef]
- Tettamanti, T.; Mohammadi, A.; Asadi, H.; Varga, I. A two-level urban traffic control for autonomous vehicles to improve network-wide performance. In Proceedings of the Transportation Research Procedia, Budapest, Hungary, 4–6 September 2017. [Google Scholar]
- Tomás, R.F.; Fernandes, P.; MacEdo, E.; Bandeira, J.M.; Coelho, M.C. Assessing the emission impacts of autonomous vehicles on metropolitan freeways. In Proceedings of the Transportation Research Procedia, Barcelona, Spain, 18–20 September 2020. [Google Scholar]
- Rövid, A.; Remeli, V.; Paufler, N.; Lengyel, H.; Zöldy, M.; Szalay, Z. Towards Reliable Multisensory Perception and Its Automotive Applications. Period. Polytech. Transp. Eng. 2020, 48, 334–340. [Google Scholar] [CrossRef]
- Pisoni, E.; Christidis, P.; Thunis, P.; Trombetti, M. Evaluating the impact of “Sustainable Urban Mobility Plans” on urban background air quality. J. Environ. Manag. 2019, 231, 249–255. [Google Scholar] [CrossRef]
- Wu, Y.; Zhang, L. Can the development of electric vehicles reduce the emission of air pollutants and greenhouse gases in developing countries? Transp. Res. Part D Transp. Environ. 2017. [Google Scholar] [CrossRef]
- Fontaras, G.; Zacharof, N.G.; Ciuffo, B. Fuel consumption and CO2 emissions from passenger cars in Europe–Laboratory versus real-world emissions. Prog. Energy Combust. Sci. 2017, 60, 97–131. [Google Scholar] [CrossRef]
- Kimpton, A.; Pojani, D.; Sipe, N.; Corcoran, J. Parking Behavior: Park ‘n’ Ride (PnR) to encourage multimodalism in Brisbane. Land Use Policy 2020. [Google Scholar] [CrossRef]
- Hou, B.; Zhao, S.; Liu, H. A Combined Modal Split and Traffic Assignment Model with Capacity Constraints for Siting Remote Park-and-Ride Facilities. IEEE Access 2020. [Google Scholar] [CrossRef]
- Adamczak, M.; Toboła, A.; Fijałkowska, J.; Cyplik, P.; Tórz, M. Analysis of incentives to eco-driving for car rental companies’ customers. Sustainability 2020, 12, 579. [Google Scholar] [CrossRef]
- Rong, B.; Zhao, H.; Cui, S.; Zhang, C. Continuum Dynamic Traffic Assignment Model for Autonomous Vehicles in a Polycentric Urban City with Environmental Consideration. Math. Probl. Eng. 2018. [Google Scholar] [CrossRef]
- Xu, L.; Yilmaz, H.Ü.; Wang, Z.; Poganietz, W.R.; Jochem, P. Greenhouse gas emissions of electric vehicles in Europe considering different charging strategies. Transp. Res. Part D Transp. Environ. 2020, 87, 102534. [Google Scholar] [CrossRef]
- Zöldy, M. Fuel properties of Butanol–Hydrogenated vegetable oil blends as a diesel extender option for internal combustion engines. Period. Polytech. Chem. Eng. 2020, 64, 205–212. [Google Scholar] [CrossRef]
- Olivier, J.G.J.; Schure, K.M.; Peters, J. Trends in Global CO2 and Total Greenhouse Gas 2019 Report; Netherlands Environmental Assessment Agency: The Hague, The Netherlands, 2020; Volume 2020. [Google Scholar]
- WEC. World Energy Resources 2016. World Energy Counc. 2016, 2016, 6–46. [Google Scholar]
- UNEP. Kick the Habit: A un Guide to Climate Nuatrality; UNEP: Nairobi, Kenya, 2008; ISBN 9789280729269. [Google Scholar]
- Zhen, X.; Wang, Y. An overview of methanol as an internal combustion engine fuel. Renew. Sustain. Energy Rev. 2015, 52, 477–493. [Google Scholar] [CrossRef]
- Huang, Y.; Hong, G.; Huang, R. Investigation to charge cooling effect and combustion characteristics of ethanol direct injection in a gasoline port injection engine. Appl. Energy 2015, 160, 244–254. [Google Scholar] [CrossRef]
- Alkharabsheh, A.; Moslem, S.; Oubahman, L.; Duleba, S. An integrated approach of multi-criteria decision-making and grey theory for evaluating urban public transportation systems. Sustainability 2021, 13, 2740. [Google Scholar] [CrossRef]
- European Parliament. Council of the European Union REGULATION (EC) No 715/2007 of the European Parliament and of the Council of 20 June 2007 on type approval of motor vehicles with respect to emissions from light passenger and commercial vehicles (Euro 5 and Euro 6) and on access to vehicle repair and mai. Off. J. Eur. Union 2007, L171, 1–16. [Google Scholar]
- Ortega, J.; Tóth, J.; Péter, T.; Moslem, S. An Integrated Model of Park-And-Ride Facilities for Sustainable Urban Mobility. Sustainability 2020, 12, 4631. [Google Scholar] [CrossRef]
- Ortega, J.; Tóth, J.; Péter, T. Mapping the Catchment Area of Park and Ride Facilities within Urban Environments. ISPRS Int. J. Geo-Inf. 2020, 9, 501. [Google Scholar] [CrossRef]
- Ortega, J.; Hamadneh, J.; Esztergár-Kiss, D.; Tóth, J. Simulation of the Daily Activity Plans of Travelers Using the Park-and-Ride System and Autonomous Vehicles: Work and Shopping Trip Purposes. Appl. Sci. 2020, 10, 2912. [Google Scholar] [CrossRef] [Green Version]
- Ortega, J.; Tóth, J.; Moslem, S.; Péter, T.; Duleba, S. An Integrated Approach of Analytic Hierarchy Process and Triangular Fuzzy Sets for Analyzing the Park-and-Ride Facility Location Problem. Symmetry 2020, 12, 1225. [Google Scholar] [CrossRef]
- Tilg, G.; Yang, K.; Menendez, M. Evaluating the effects of automated vehicle technology on the capacity of freeway weaving sections. Transp. Res. Part C Emerg. Technol. 2018, 96, 3–21. [Google Scholar] [CrossRef]
- Fagnant, D.J.; Kockelman, K. Preparing a nation for autonomous vehicles: Opportunities, barriers and policy recommendations. Transp. Res. Part A Policy Pract. 2015, 77, 167–181. [Google Scholar] [CrossRef]
- Iacobucci, R.; McLellan, B.; Tezuka, T. Modeling shared autonomous electric vehicles: Potential for transport and power grid integration. Energy 2018, 158, 148–163. [Google Scholar] [CrossRef] [Green Version]
- Barth, M.; Boriboonsomsin, K. Energy and emissions impacts of a freeway-based dynamic eco-driving system. Transp. Res. Part D Transp. Environ. 2009, 14, 400–410. [Google Scholar] [CrossRef]
- Vimmerstedt, L.; Brown, A.; Newes, E.; Markel, T.; Schroeder, A.; Zhang, Y.; Chipman, P.; Johnson, S. Transformative Reduction of Transportation Greenhouse Gas Emissions: Opportunities for Change in Technologies and Systems; U.S. Department of Transportation: Washington, DC, USA, 2015; p. 121.
- Igliński, H.; Babiak, M. Analysis of the Potential of Autonomous Vehicles in Reducing the Emissions of Greenhouse Gases in Road Transport. Procedia Eng. 2017, 192, 353–358. [Google Scholar] [CrossRef]
- Obaid, M.; Szalay, Z. A novel model representation framework for cooperative intelligent transport systems. Period. Polytech. Transp. Eng. 2019. [Google Scholar] [CrossRef] [Green Version]
- Huang, Y.; Ng, E.C.Y.; Zhou, J.L.; Surawski, N.C.; Chan, E.F.C.; Hong, G. Eco-driving technology for sustainable road transport: A review. Renew. Sustain. Energy Rev. 2018, 93, 596–609. [Google Scholar] [CrossRef]
- Sivak, M.; Schoettle, B. Eco-driving: Strategic, tactical, and operational decisions of the driver that influence vehicle fuel economy. Transp. Policy 2012, 22, 96–99. [Google Scholar] [CrossRef]
- El-Shawarby, I.; Ahn, K.; Rakha, H. Comparative field evaluation of vehicle cruise speed and acceleration level impacts on hot stabilized emissions. Transp. Res. Part D Transp. Environ. 2005, 10, 13–30. [Google Scholar] [CrossRef]
- MacKenzie, D.W. Fuel Economy Regulations and Efficiency Technology Improvements in U.S. Cars Since 1975. Ph.D. Dissertation, Massachusetts Institute of Technology, Cambridge, MA, USA, 2013. [Google Scholar]
- Tsugawa, S. An Overview on an Automated Truck Platoon within the Energy ITS Project; IFAC: Wien, Austria, 2013; Volume 7, ISBN 9783902823434. [Google Scholar]
- Obaid, M.; Szalay, Z.; Török, Á. Reconsidering the cybersecurity framework in the road transportation domain. Acta Polytech. Hung. 2020, 17, 57–83. [Google Scholar] [CrossRef]
- Boriboonsomsin, K.; Barth, M.J.; Zhu, W.; Vu, A. Eco-routing navigation system based on multisource historical and real-time traffic information. IEEE Trans. Intell. Transp. Syst. 2012, 13, 1694–1704. [Google Scholar] [CrossRef]
- Ericsson, E.; Larsson, H.; Brundell-Freij, K. Optimizing route choice for lowest fuel consumption–Potential effects of a new driver support tool. Transp. Res. Part C Emerg. Technol. 2006, 14, 369–383. [Google Scholar] [CrossRef]
- Sanguinetti, A.; Kurani, K.; Davies, J. The many reasons your mileage may vary: Toward a unifying typology of eco-driving behaviors. Transp. Res. Part D Transp. Environ. 2017, 52, 73–84. [Google Scholar] [CrossRef]
- Ecodriven org. ECODRIVEN Campaign Catalogue for European Ecodriving & Traffic Safety Campaigns. Available online: http://docplayer.net/9158908-Ecodriven-campaign-catalogue-for-european-ecodriving-traffic-safety-campaigns.html (accessed on 1 March 2021).
- Jochem, P.; Babrowski, S.; Fichtner, W. Assessing CO2 emissions of electric vehicles in Germany in 2030. Transp. Res. Part A Policy Pract. 2015, 78, 68–83. [Google Scholar] [CrossRef] [Green Version]
- Shen, W.; Han, W.; Wallington, T.J.; Winkler, S.L. China Electricity Generation Greenhouse Gas Emission Intensity in 2030: Implications for Electric Vehicles. Environ. Sci. Technol. 2019, 53, 6063–6072. [Google Scholar] [CrossRef]
- Ke, W.; Zhang, S.; He, X.; Wu, Y.; Hao, J. Well-to-wheels energy consumption and emissions of electric vehicles: Mid-term implications from real-world features and air pollution control progress. Appl. Energy 2017, 188, 367–377. [Google Scholar] [CrossRef]
- Orsi, F.; Muratori, M.; Rocco, M.; Colombo, E.; Rizzoni, G. A multi-dimensional well-to-wheels analysis of passenger vehicles in different regions: Primary energy consumption, CO2 emissions, and economic cost. Appl. Energy 2016, 169, 197–209. [Google Scholar] [CrossRef]
- Song, Z.; He, Y.; Zhang, L. Integrated planning of park-and-ride facilities and transit service. Transp. Res. Part C Emerg. Technol. 2017, 74, 182–195. [Google Scholar] [CrossRef]
- Pitsiava–Latinopoulou, M.; Basbas, S.; Papoutsis, K.; Sdoukopoulos, E. Parking Policies for Supporting Sustainable Mobility. Procedia Soc. Behav. Sci. 2012, 48, 897–906. [Google Scholar] [CrossRef] [Green Version]
- Mingardo, G. Transport and environmental effects of rail-based Park and Ride: Evidence from the Netherlands. J. Transp. Geogr. 2013. [Google Scholar] [CrossRef]
- Holguı´n-Veras, J.; Yushimito, W.F.; Aros-Vera, F.; Reilly, J.J. User rationality and optimal park-and-ride location under potential demand maximization. Transp. Res. Part B Methodol. 2012, 46, 949–970. [Google Scholar] [CrossRef]
- Duncan, M.; Christensen, R.K. An analysis of park-and-ride provision at light rail stations across the US. Transp. Policy 2013, 25, 148–157. [Google Scholar] [CrossRef]
- Farhan, B.; Murray, A.T. Distance decay and coverage in facility location planning. Ann. Reg. Sci. 2006, 40, 279–295. [Google Scholar] [CrossRef]
- Ortega, J.; Moslem, S.; Tóth, J.; Péter, T.; Palaguachi, J.; Paguay, M. Using Best Worst Method for Sustainable Park and Ride Facility Location. Sustainability 2020, 12, 83. [Google Scholar] [CrossRef]
- Kastori, G.E.; Papadimitriou, G.; Katsis, P.; Kouridis, C.; Saharidis, G.K.D. Development of a novel model for co-modal emission calculation and inventory methodology. Energy Syst. 2019. [Google Scholar] [CrossRef]
- Li, F.; Zhuang, J.; Cheng, X.; Li, M.; Wang, J.; Yan, Z. Investigation and prediction of heavy-duty diesel passenger bus emissions in Hainan using a COPERT model. Atmosphere 2019, 10, 106. [Google Scholar] [CrossRef] [Green Version]
- O’Driscoll, R.; ApSimon, H.M.; Oxley, T.; Molden, N.; Stettler, M.E.J.; Thiyagarajah, A. A Portable Emissions Measurement System (PEMS) study of NOx and primary NO2 emissions from Euro 6 diesel passenger cars and comparison with COPERT emission factors. Atmos. Environ. 2016. [Google Scholar] [CrossRef]
- Gkatzoflias, D.; Kouridis, C.; Mellios, G.; Saliakas, V.; Katsis, P. A Scenario Evaluation Model for the Application of CO2 and Air Pollutant Reduction Policies. Procedia Soc. Behav. Sci. 2012. [Google Scholar] [CrossRef] [Green Version]
- Alam, M.S.; Hyde, B.; Duffy, P.; McNabola, A. Assessment of pathways to reduce CO2 emissions from passenger car fleets: Case study in Ireland. Appl. Energy 2017, 189, 283–300. [Google Scholar] [CrossRef]
- Zachariadis, T.; Samaras, Z. An Integrated Modeling System for the Estimation of Motor Vehicle Emissions. J. Air Waste Manag. Assoc. 1999. [Google Scholar] [CrossRef] [PubMed] [Green Version]
- Smit, R.; Ntziachristos, L. COPERT Australia: A new software to estimate vehicle emissions in Australia. In Proceedings of the Australasian Transport Research Forum, ATRF 2013–Proceedings, Brisbane, Australia, 2–4 October 2013. [Google Scholar]
- Cuenca Municipality. Sustainable Urban Mobility Plan and Public Areas; Cuenca Municipality: Cuenca, Ecuador, 2014. [Google Scholar]
- Universidad del Azuay. Available online: http://gis.uazuay.edu.ec/ierse/sistemagrafico.php (accessed on 1 January 2021).
- Ntziachristos, L.; Gkatzoflias, D.; Kouridis, C.; Samaras, Z. COPERT: A European road transport emission inventory model. Environ. Sci. Eng. 2009. [Google Scholar] [CrossRef]
- Kousoulidou, M.; Fontaras, G.; Ntziachristos, L.; Bonnel, P.; Samaras, Z.; Dilara, P. Use of portable emissions measurement system (PEMS) for the development and validation of passenger car emission factors. Atmos. Environ. 2013. [Google Scholar] [CrossRef]
- Kousoulidou, M.; Ntziachristos, L.; Gkeivanidis, S.; Samaras, Z.; Franco, V.; Dilara, P. Validation of the COPERT road emission inventory model with real-use data. In Proceedings of the 19th Annual International Emission Inventory Conference, San Antonio, TX, USA, 27–30 September 2010. [Google Scholar]
- European Environment Agency. 1.A.3.b.i-iv Road Transport 2019 Report; European Environment Agency: København, Denmark, 2019; ISBN 9788578110796.
- Banister, D. Unsustainable Transport: City Transport in the New Century; Elsevier: Abingdon, UK; Routledge: Abingdon, UK, 2005; ISBN 0203003888. [Google Scholar]
- Cavadas, J.; Antunes, A.P. An optimization model for integrated transit-parking policy planning. Transportation 2019, 46, 1867–1891. [Google Scholar] [CrossRef]
- Cavadas, J.; Antunes, A.P. Optimization-based study of the location of park-and-ride facilities. Transp. Plan. Technol. 2019, 42, 201–226. [Google Scholar] [CrossRef]


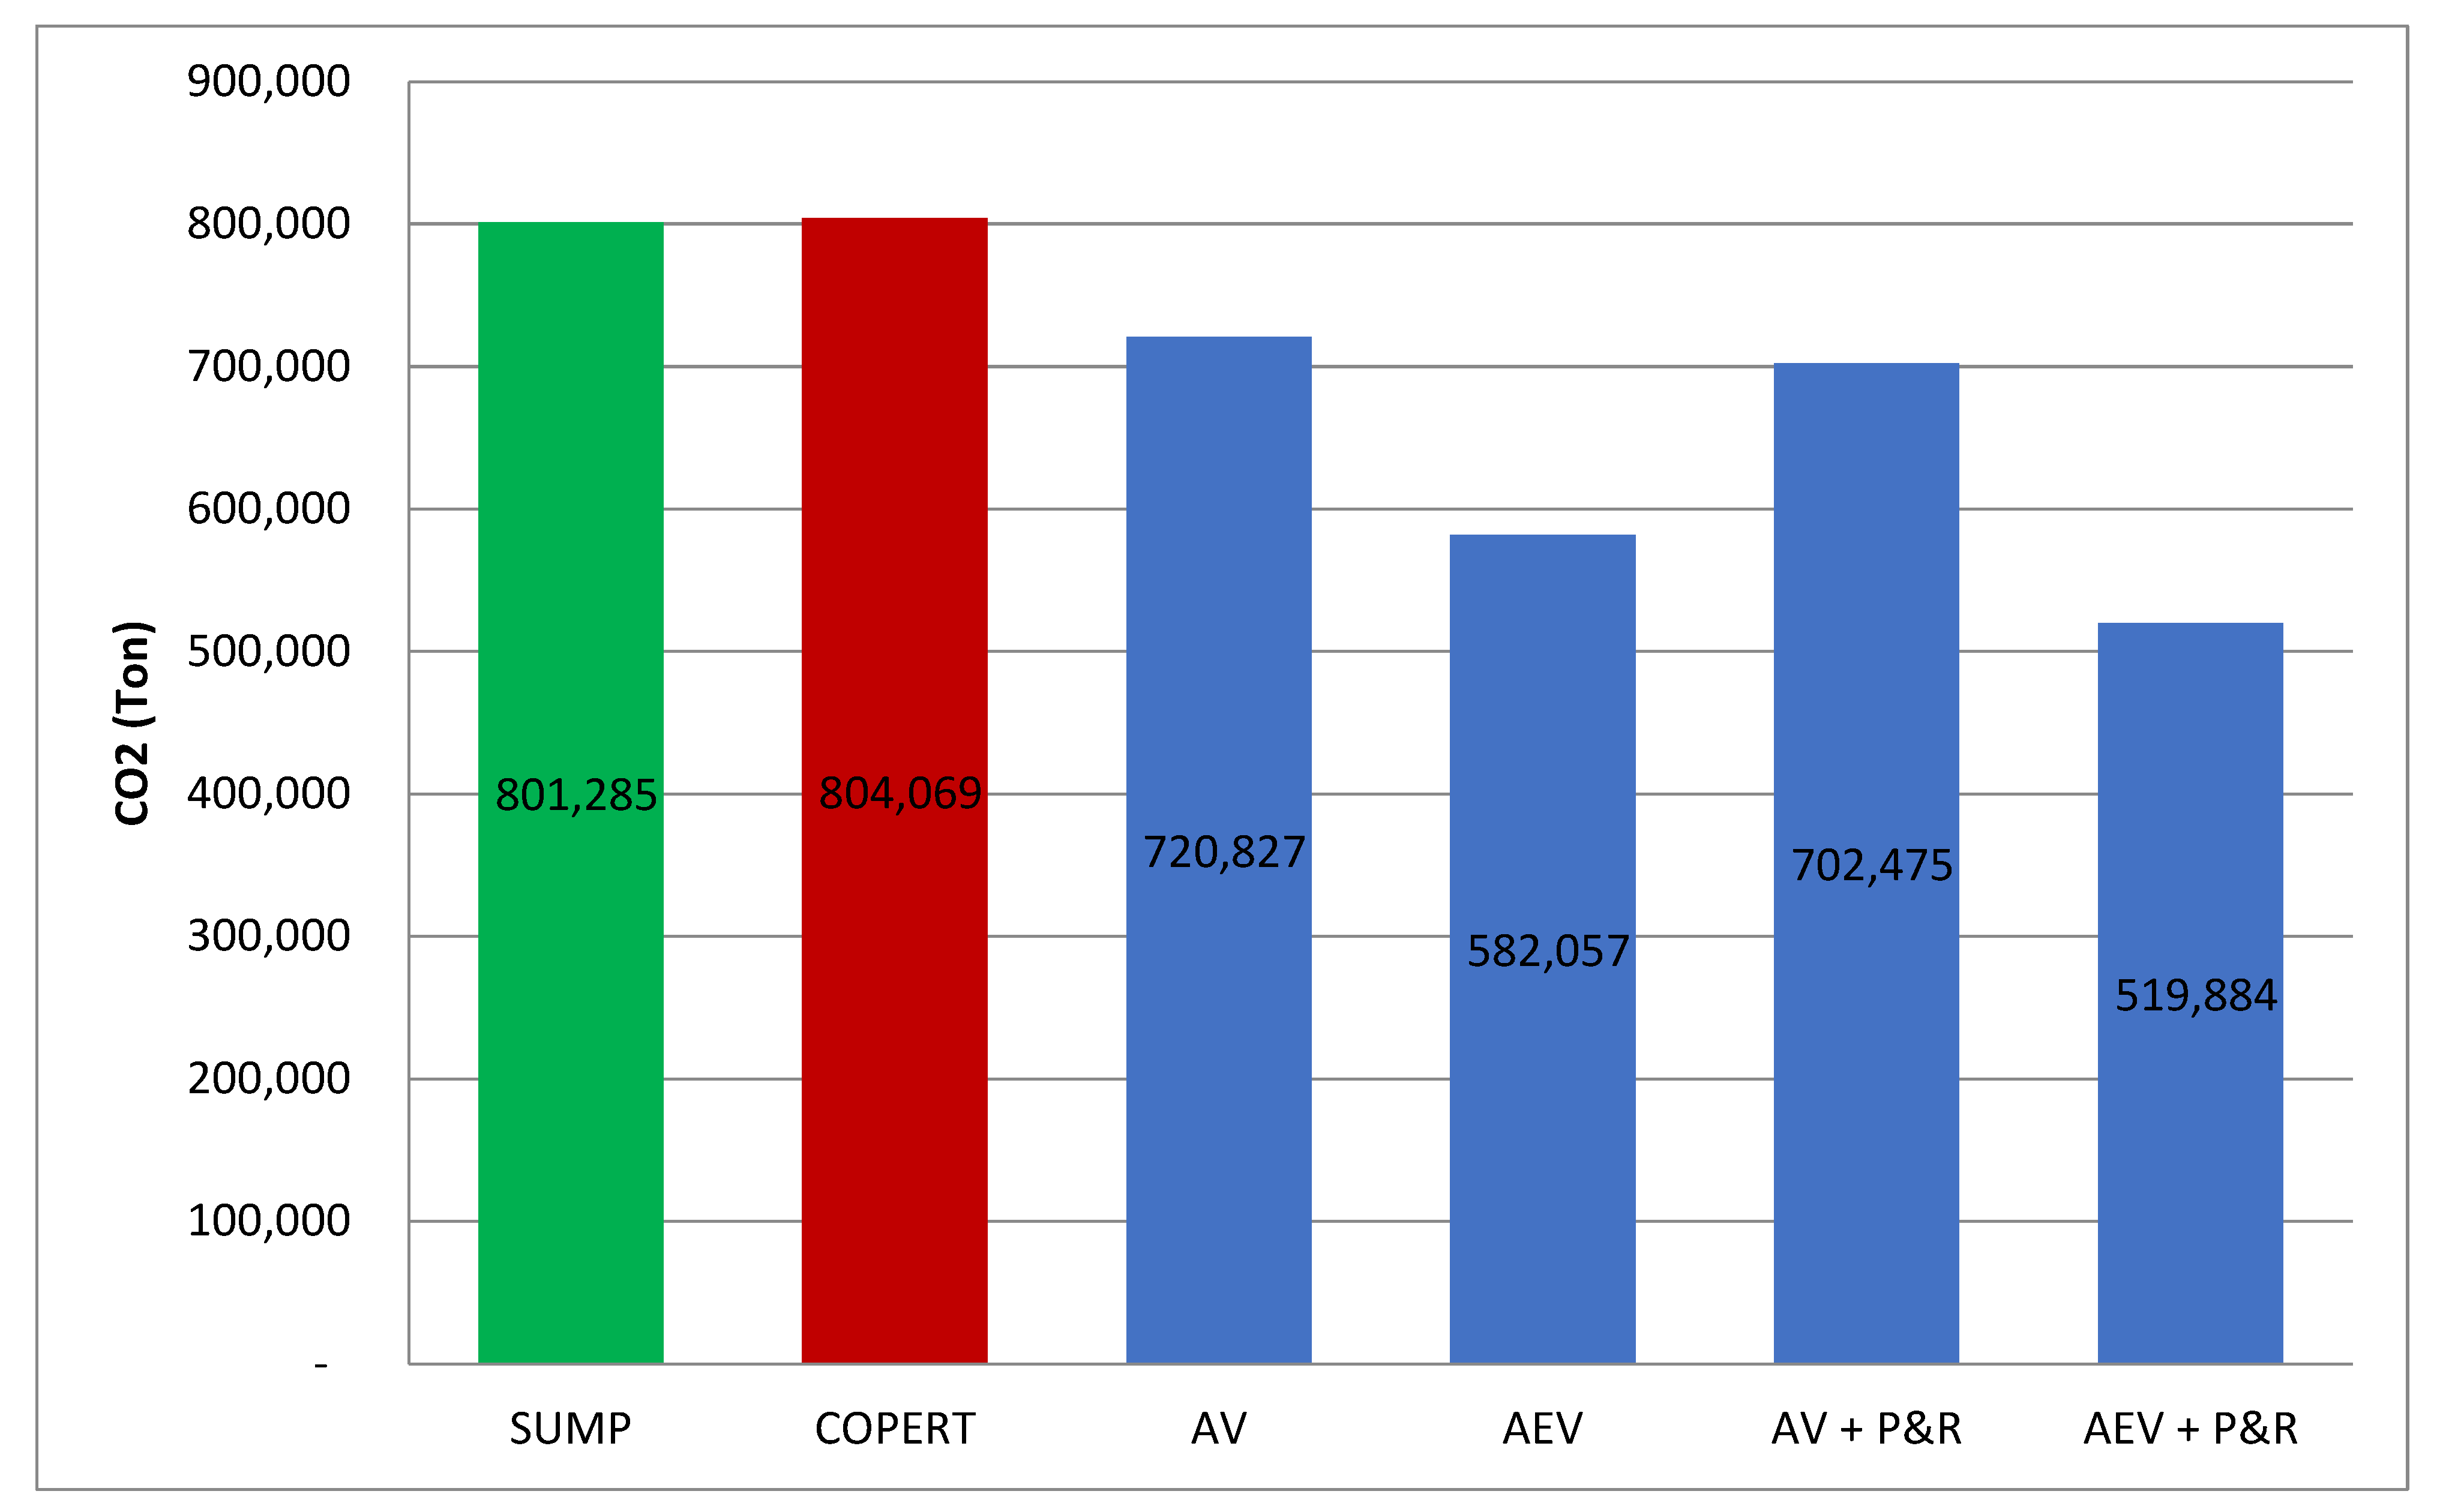
| Scenario | CO | NOx | CO2 | |
|---|---|---|---|---|
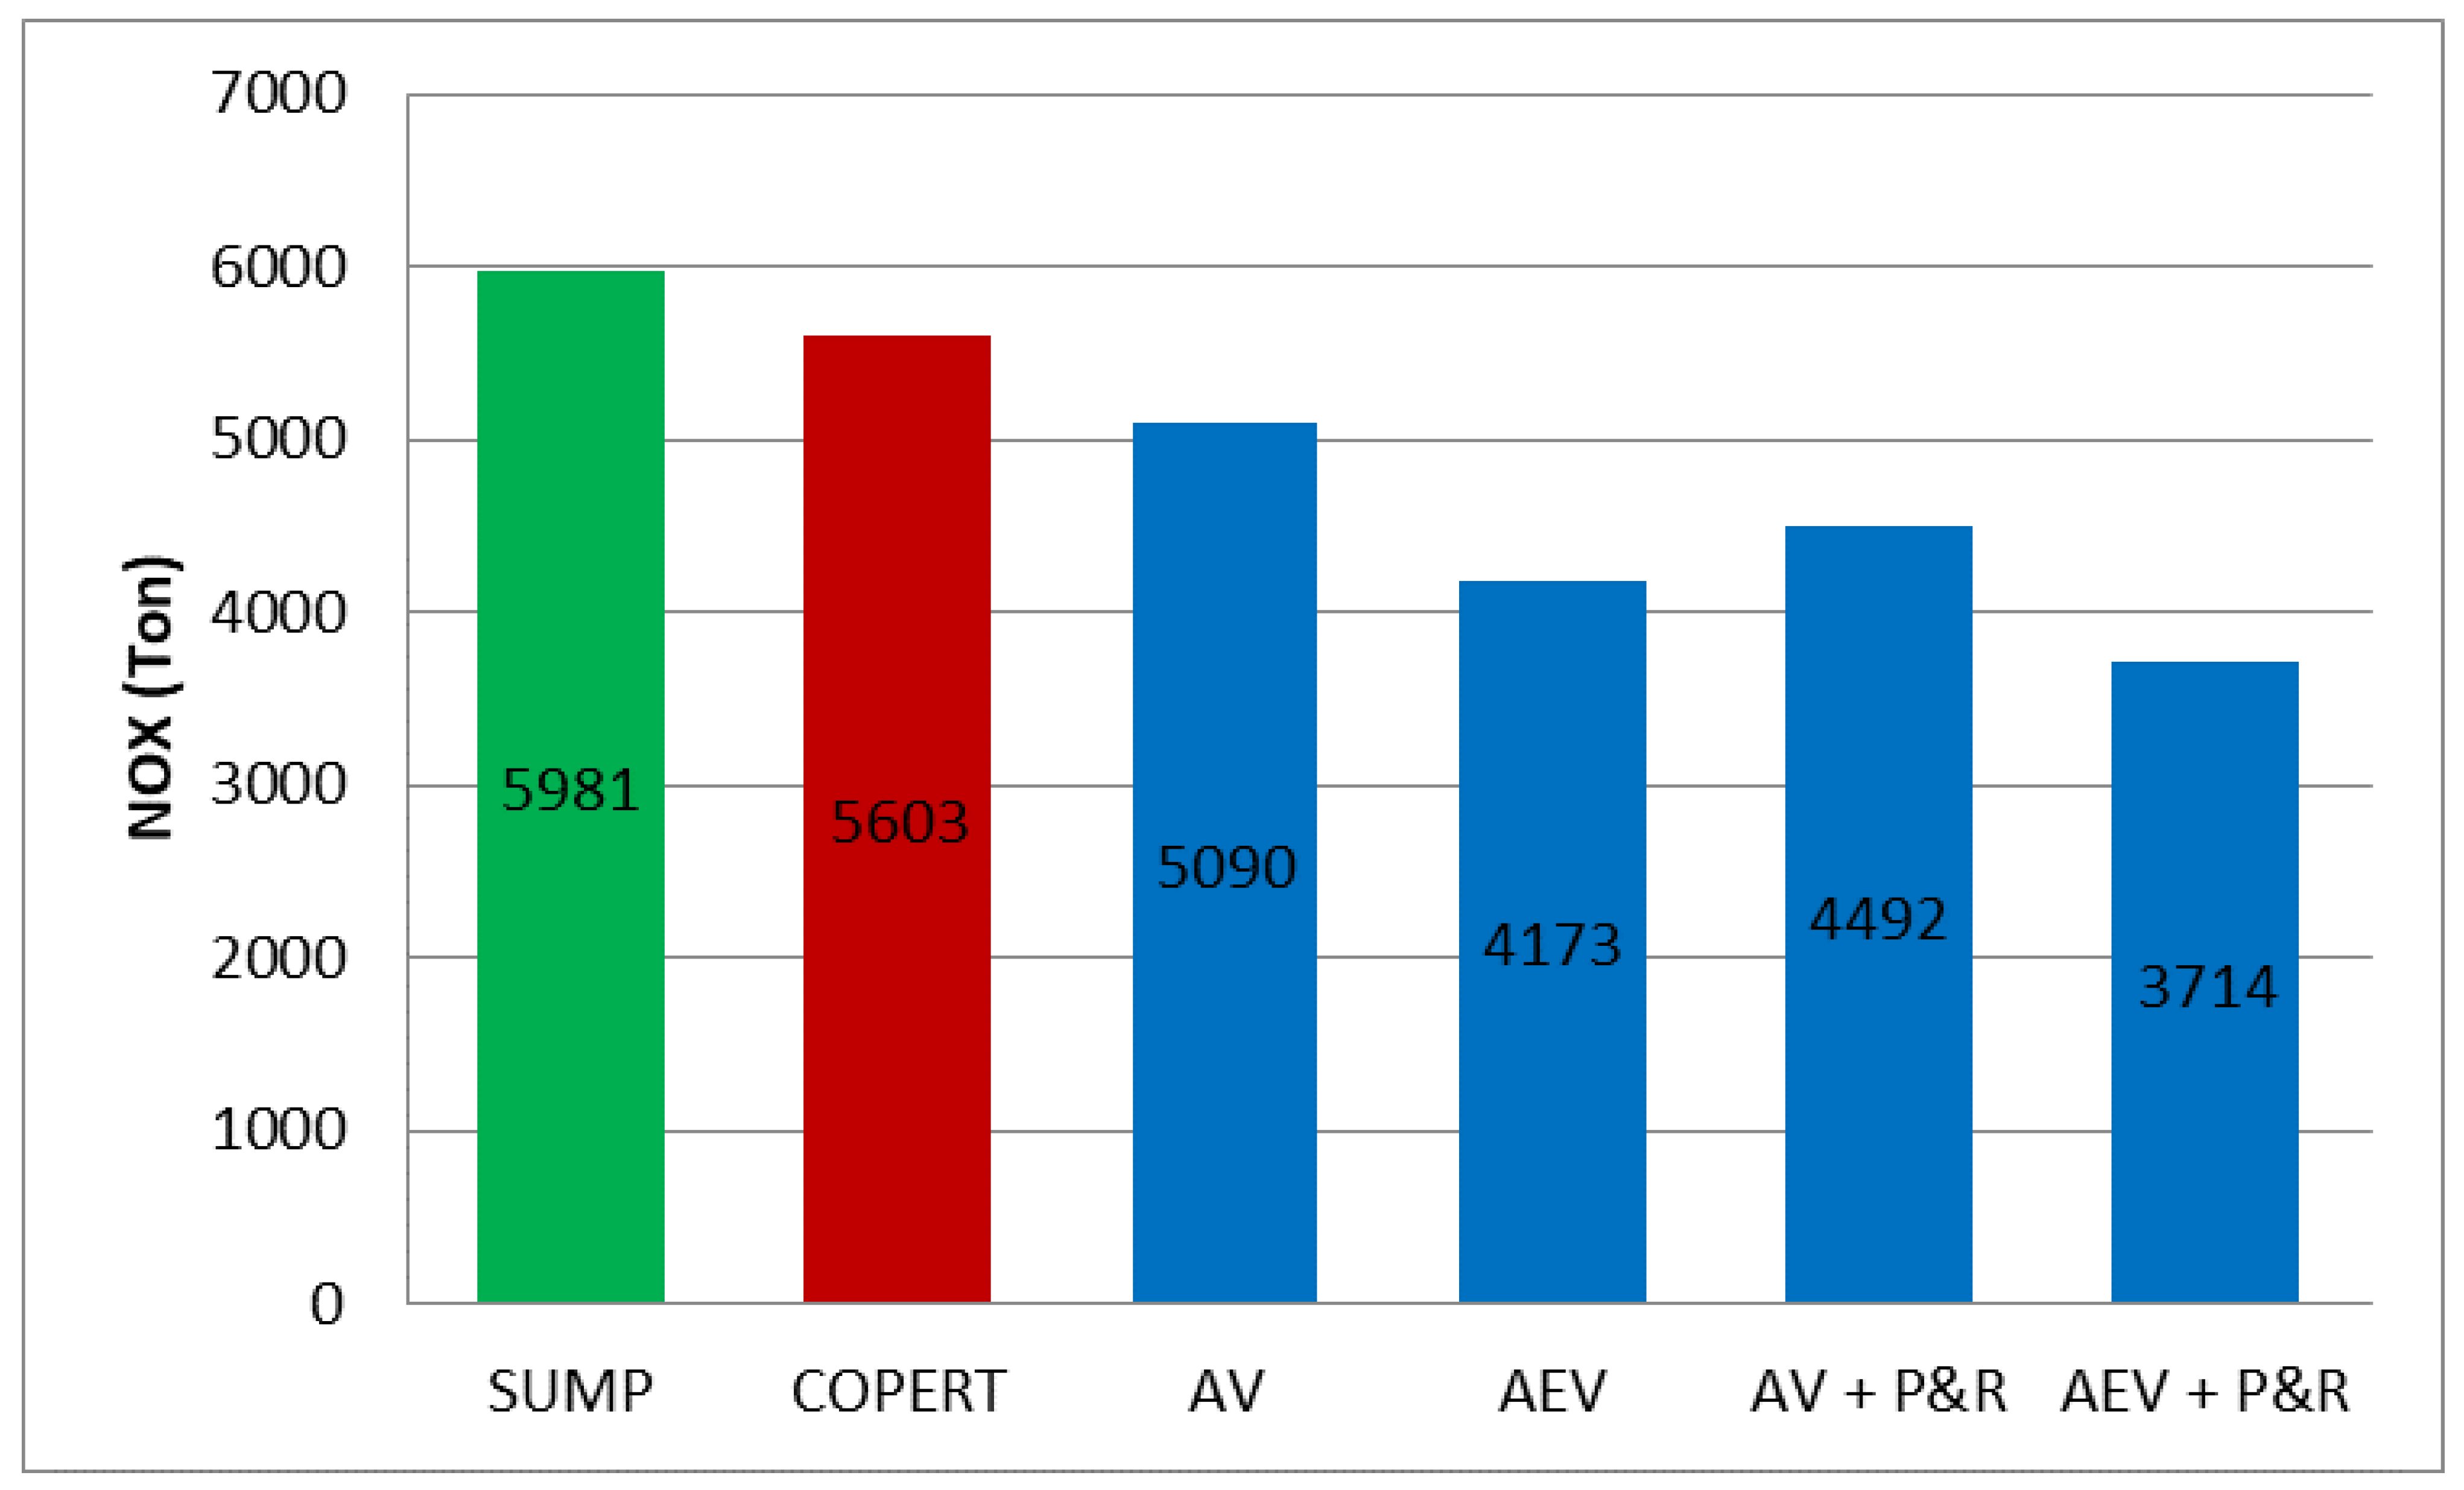
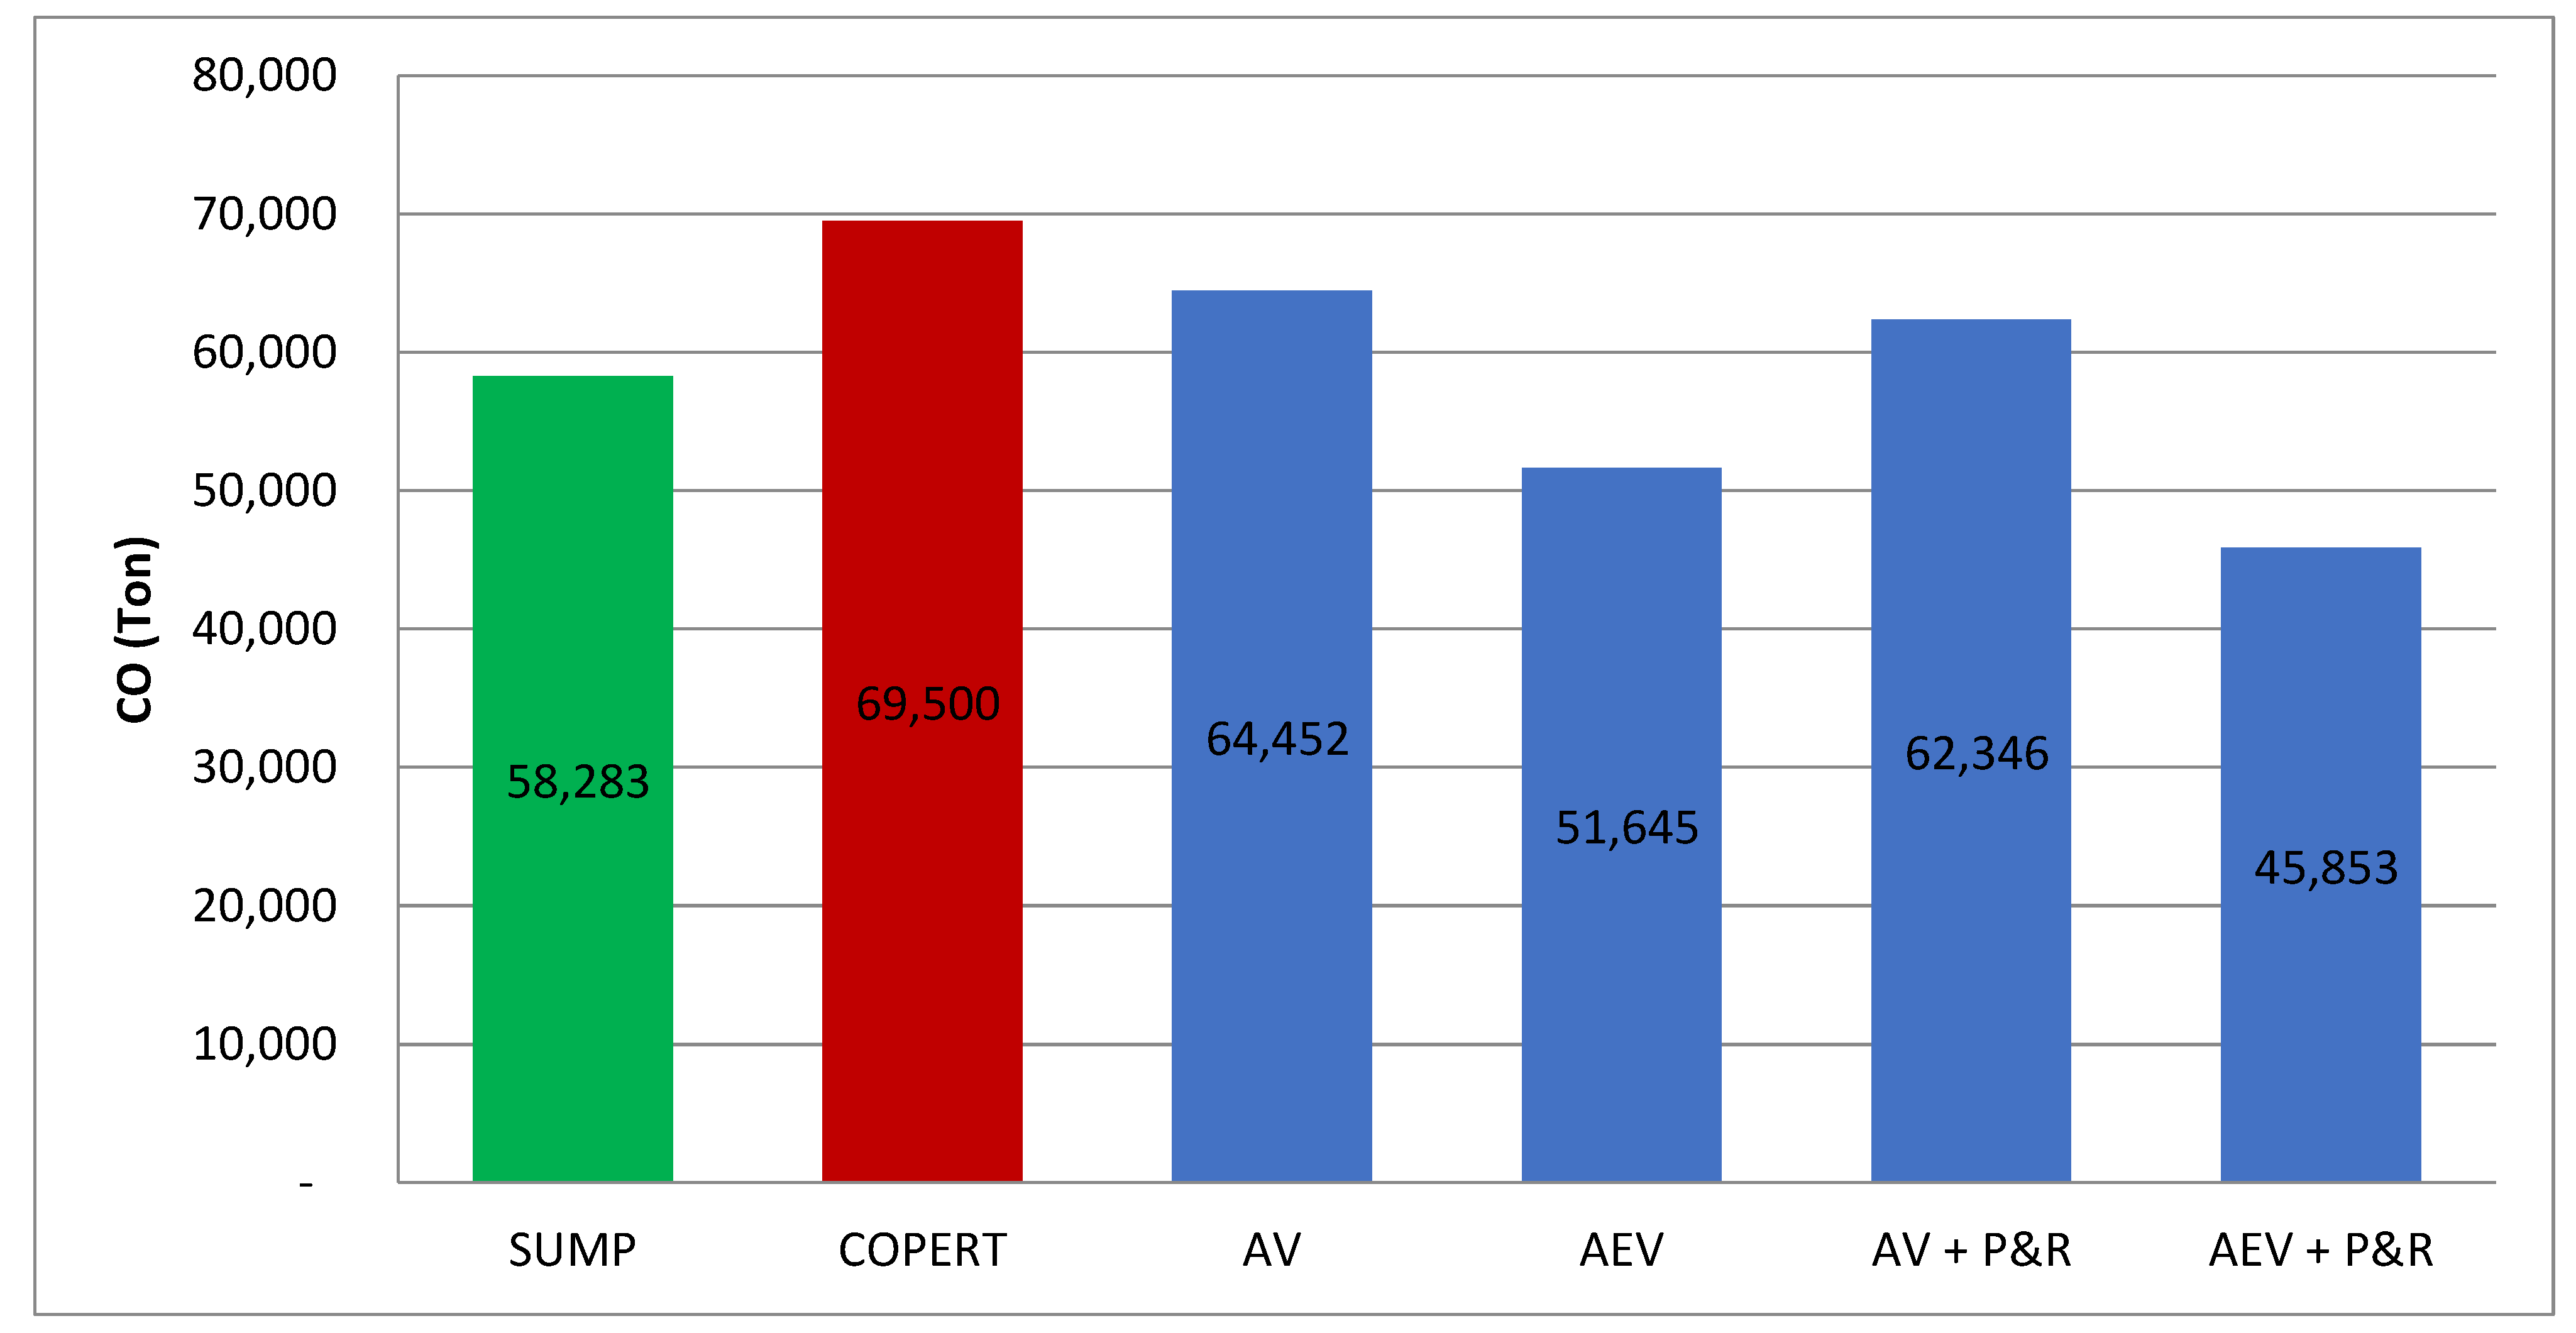
| Base | (Tons) | 69,500 | 5603 | 804,069 |
| I | AV | 7% | 9% | 10% |
| II | AEV | 26% | 26% | 28% |
| III | AV + P&R | 10% | 20% | 13% |
| IV | AEV + P&R | 34% | 34% | 35% |
Publisher’s Note: MDPI stays neutral with regard to jurisdictional claims in published maps and institutional affiliations. |
© 2021 by the authors. Licensee MDPI, Basel, Switzerland. This article is an open access article distributed under the terms and conditions of the Creative Commons Attribution (CC BY) license (https://creativecommons.org/licenses/by/4.0/).
Share and Cite
Obaid, M.; Torok, A.; Ortega, J. A Comprehensive Emissions Model Combining Autonomous Vehicles with Park and Ride and Electric Vehicle Transportation Policies. Sustainability 2021, 13, 4653. https://0-doi-org.brum.beds.ac.uk/10.3390/su13094653
Obaid M, Torok A, Ortega J. A Comprehensive Emissions Model Combining Autonomous Vehicles with Park and Ride and Electric Vehicle Transportation Policies. Sustainability. 2021; 13(9):4653. https://0-doi-org.brum.beds.ac.uk/10.3390/su13094653
Chicago/Turabian StyleObaid, Mohammed, Arpad Torok, and Jairo Ortega. 2021. "A Comprehensive Emissions Model Combining Autonomous Vehicles with Park and Ride and Electric Vehicle Transportation Policies" Sustainability 13, no. 9: 4653. https://0-doi-org.brum.beds.ac.uk/10.3390/su13094653