
The Nexus of Sophisticated Digital Assets with Economic Policy Uncertainty: A Survey of Empirical Findings and an Empirical Investigation


Department of Economics, University of Thessaly, 38333 Volos, Greece
Sustainability 2021, 13(10), 5383; https://0-doi-org.brum.beds.ac.uk/10.3390/su13105383
Submission received: 2 March 2021
/
Revised: 22 April 2021
/
Accepted: 28 April 2021
/
Published: 12 May 2021
(This article belongs to the Special Issue Sustainability in Interaction of Traditional and Mechanical Financial Systems)
Abstract
:This paper sets out to explore the nexus between economic policy uncertainty (EPU) and digital currencies. An integrated survey takes place based on eleven primary studies. Furthermore, an econometric analysis is conducted by the threshold ARCH, simple asymmetric ARCH and non-linear ARCH specifications covering the bull and the bear markets as well as the highly volatile period up to the present. Threshold ARCH is found to provide the best fit for estimations. Outcomes reveal that Bitcoin is strongly connected with EPU while Ethereum and Litecoin are not but are strongly linked with Bitcoin performance. Moreover, weak negative effects of the VIX on both cryptocurrencies are detected while oil exerts weak positive impacts on Ethereum. Overall, Ethereum and Litecoin could serve for diversifiers against Bitcoin or hedgers against traditional assets during highly stressed periods with the advantage of not being affected by economic policy uncertainty news.
JEL Classifications:
E6; G1; F31. Introduction
The Global Financial Crisis and the aftermath of the worst global recession since the 1930s have brought to the forefront a number of challenges for policymakers and investors. Downwards trends in financial markets and reduction of output in the real economy have made conventional assets present bearish phenomena in their markets and motivated portfolio managers to seek alternative investment solutions. Uncertainty in economic conditions has become a major determinant of GDP growth and profitability in financial markets. This has led to the introduction of innovative measures in order to detect and quantify the impact uncertainty exerts on economic activity and financial decisions.
Moreover, since the skyrocketing increase in Bitcoin market values during 2017, digital currencies have become an increasingly popular innovative asset. Thereby, cryptocurrencies have been employed by a proliferating number of investors in order to ameliorate their risk-return trade-off in these highly uncertain periods where conventional investment assets do not exhibit bullish behaviour. Cryptocurrencies differ from conventional assets in that they constitute synthetic commodity money [1]. Bitcoin is believed to form only a weak hybrid between fiat currency and commodity currency [2] that has to suffer no authority from a central bank or government. Its decentralized and pseudonymous character enables to conduct transactions at much lower costs than with conventional currencies. Reference [3] argues that Bitcoin constitutes a relatively safe asset and could be classified as being somewhere between gold and the US dollar concerning their medium of exchange until the pure store of value scale features. On the other hand, [4] supports that Bitcoin and gold are revealed to have almost completely different characteristics as financial assets and display significant differences concerning their connection with stock markets Moreover, Bitcoin is considered to have been created not for transactions but mainly to serve speculation purposes [5]. Related research has indicated that cryptocurrencies–especially Bitcoin-are highly volatile [6,7] and that their markets are inefficient–so provide speculation opportunities-but tend towards efficiency in the advent of time [8].
The phenomenon of digital currencies is expected to constitute a benchmark concerning the evolution of forms of money. This is the reason why cryptocurrencies have triggered a proliferating bulk of academic research and the production of scientific papers that investigate a wide range of their characteristics and impacts. A lot of papers have investigated the volatility patterns and spillover effects of digital currencies [3,9,10,11,12,13,14]. Moreover, emphasis has been given on the herding behaviour in cryptocurrency markets [15,16,17,18,19]. The linkages of cryptocurrencies with economic and geopolitical uncertainty have also been investigated [20,21,22,23,24]. Furthermore, liquidity in cryptocurrency markets has been the focus of a number of studies [25,26,27].
As concerns economic policy uncertainty, it should be noted that the innovative index developed by [28] has been the benchmark for investigating such uncertainty effects. The monthly Global Economic Policy Uncertainty (GEPU) index is a GDP-weighted average of national EPU indices for 21 countries: Australia, Brazil, Canada, Chile, China, Colombia, France, Germany, Greece, India, Ireland, Italy, Japan, Mexico, the Netherlands, Russia, South Korea, Spain, Sweden, the United Kingdom, and the United States. Each national EPU index represents the relative frequency of own-country newspaper articles that contain a trio of terms corresponding to the economy (E), policy (P) and uncertainty (U). Differently said, each monthly national EPU index value is proportional to the share of own-country newspaper articles that discuss economic policy uncertainty in that month (https://www.policyuncertainty.com (accessed on 25 September 2020)). Notably, an overwhelming number of academic studies has been generated based on this index. These papers have focused on the nexus between economic conditions and various aspects of the real economy as well as financial markets.
To the best of our knowledge, the present study is the first to provide a bird’s-eye view on the linkages between economic policy uncertainty and digital currencies, which constitute the most promising investment asset since 2016. Focus is placed on empirical papers that clearly investigate the linkages between Bitcoin and gold no matter whether other financial assets are included in relevant analysis. More specifically, this study enables the interest reader to get knowledge about previous econometric work concerning the nexus of cryptocurrencies with gold and acquire a broader perspective and the overall image of relevant research up to the present. Based on such findings, the task of conducting our own estimations is undertaken in order to attest whether new estimations corroborate previous evidence. Thereby, the contribution of this integrated survey is threefold. Firstly, we cast light on how uncertainty regarding economic conditions influences the most modern forms of liquidity and investments. Secondly, the impacts of economic policy uncertainty in alternative countries are better detected and comparisons of uncertainty effects can be conducted. Moreover, an empirical investigation takes place about how economic policy uncertainty, Bitcoin prices, oil market values and the volatility of the S&P500 index influence the market values of major cryptocurrencies. The survey part of this study has been prepared based on the standards of previous survey papers [6,29,30,31,32,33].
The remainder of this survey is structured as follows. Section 2 provides the empirical work on the nexus between EPU and cryptocurrencies and offers an analysis of the economic implications derived from findings in primary studies. Section 3 provides the data and methodology of the empirical investigations about the nexus of US EPU, Bitcoin, oil and the VIX index with major cryptocurrencies. Moreover, Section 4 displays and analyzes the econometric outcomes and their economic significance. Finally, Section 5 concludes and proposes avenues for further research. Additionally, Table 1 displays the main characteristics of the studies under scrutiny. Furthermore, graphs in the Appendix A lay out some metrics about the popularity of the papers investigated in interested readers and depict the EPU index in various regions.
2. Empirical Studies Focusing on the Nexus between Economic Policy Uncertainty and Cryptocurrencies
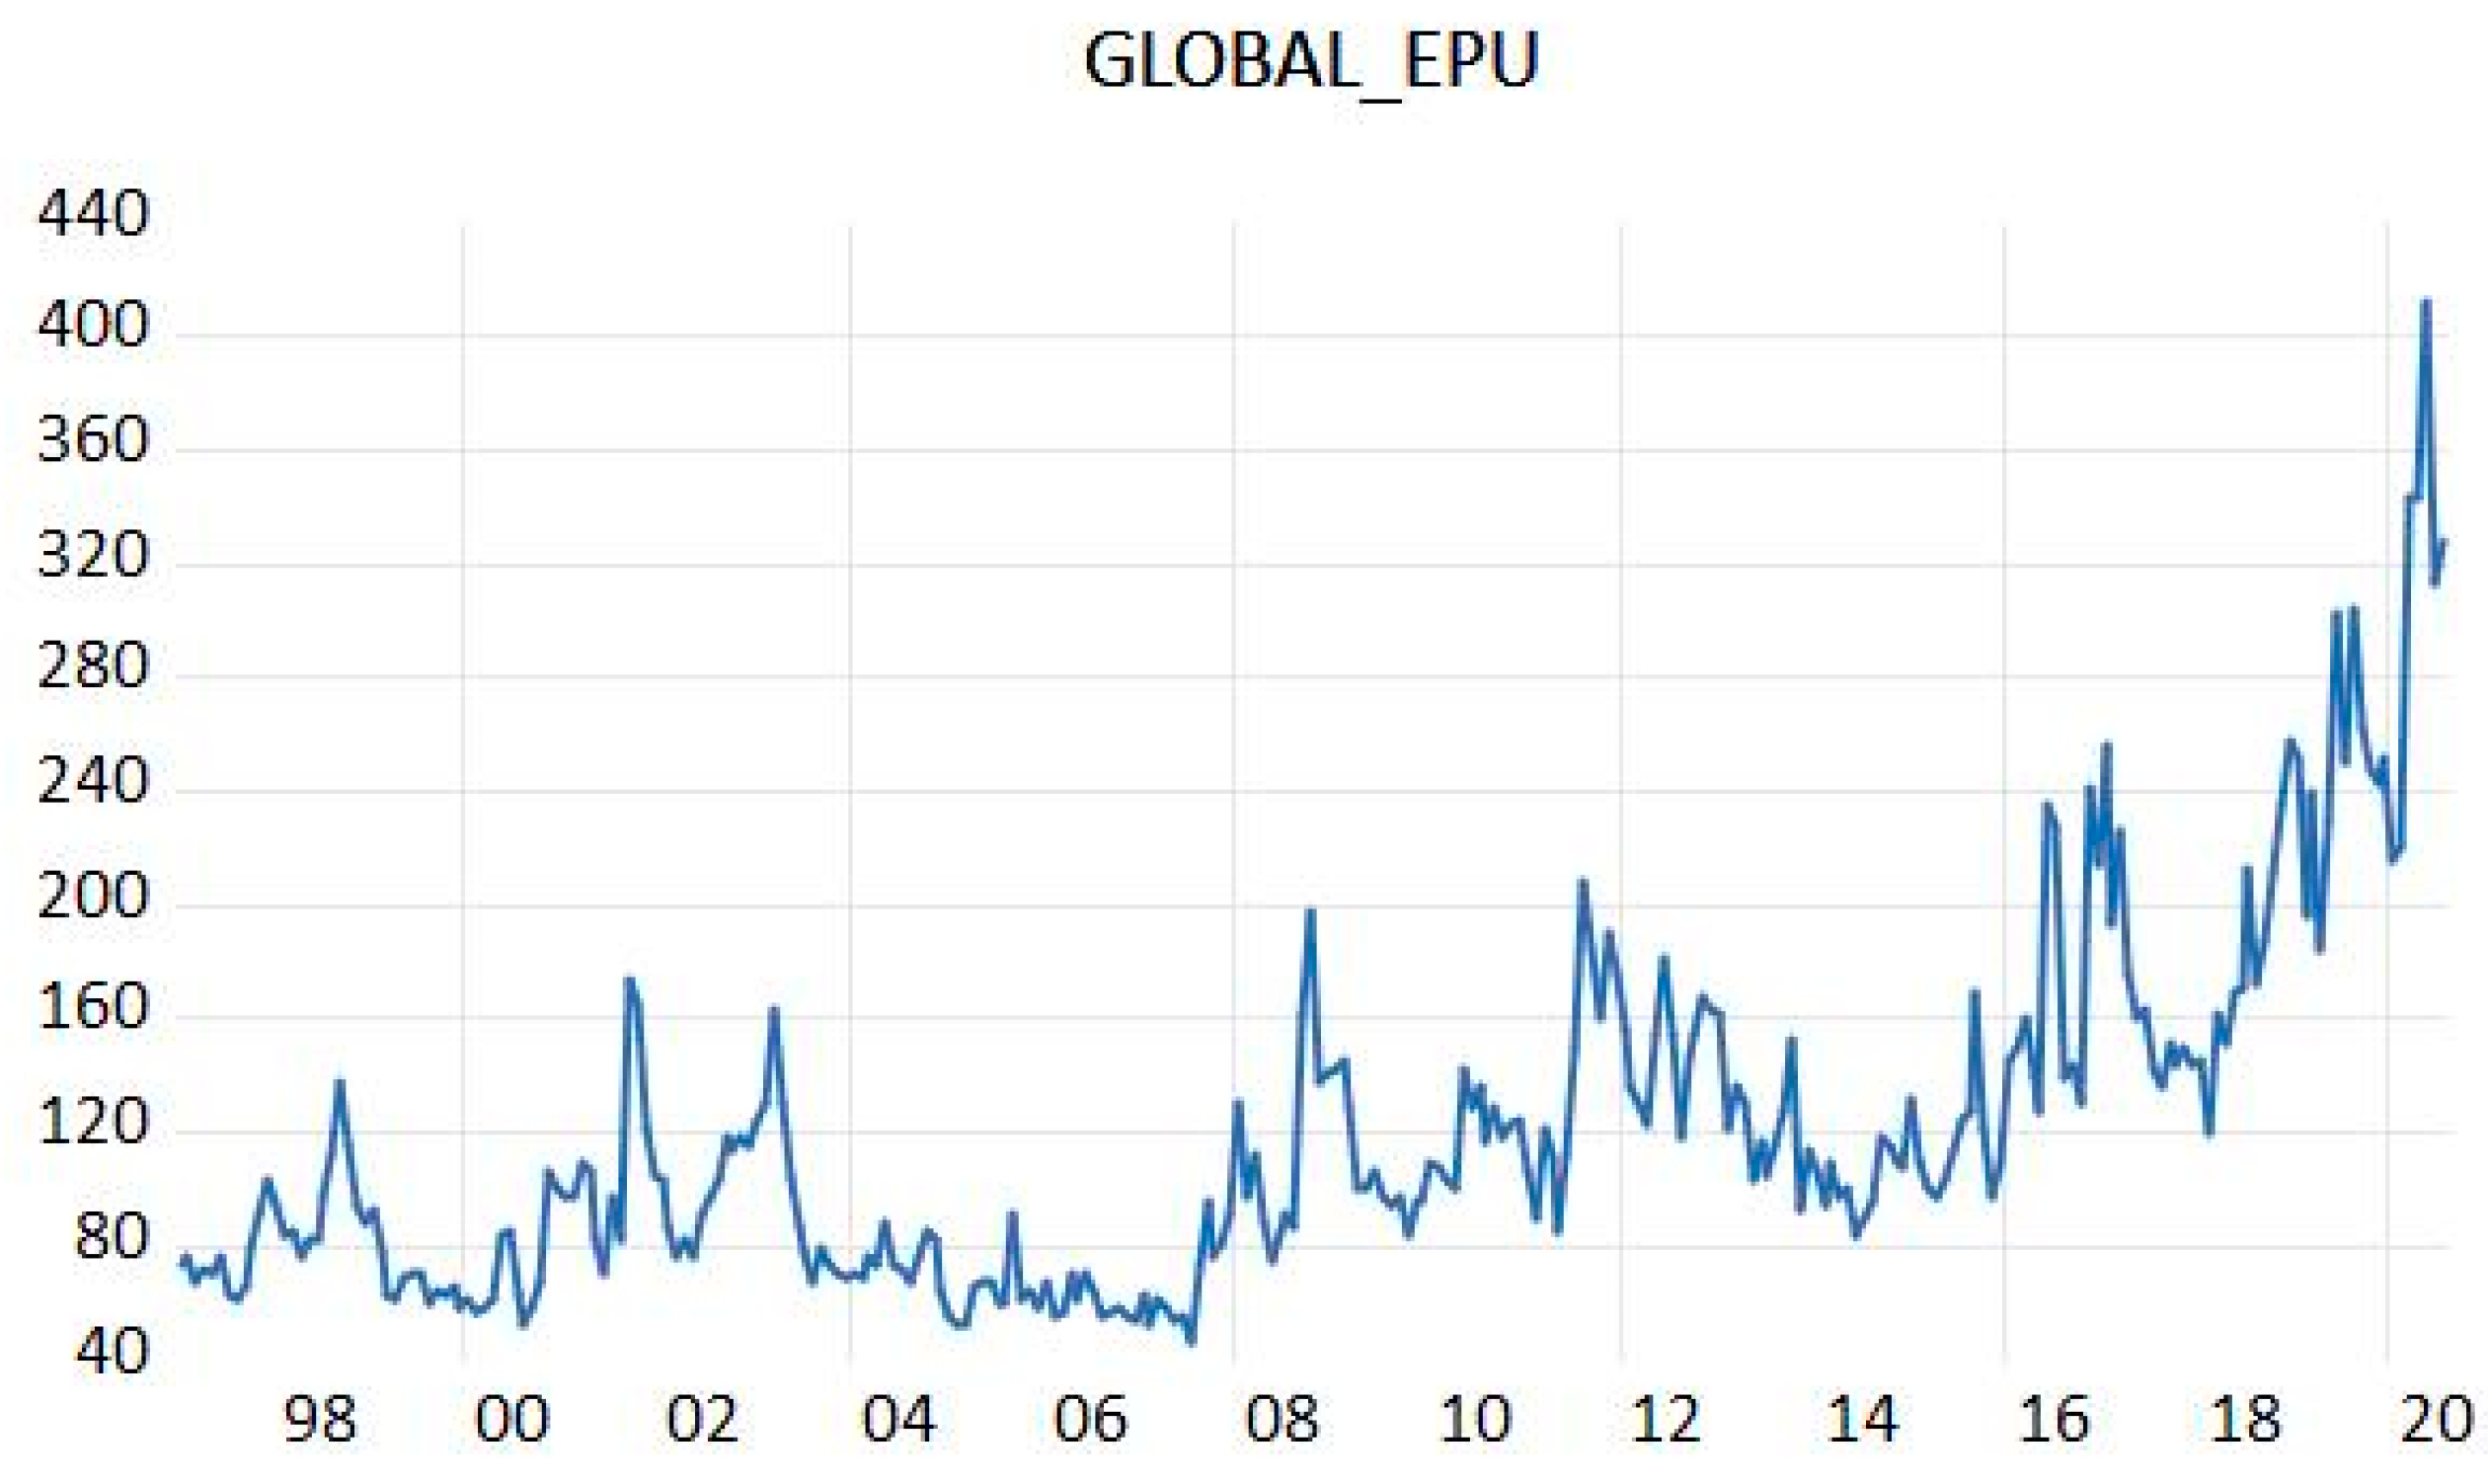
A spectrum of influential papers has investigated the nexus between economic policy uncertainty and cryptocurrencies and has provided empirical estimations about their linkages. In order to acquire the outcomes of the aforementioned strand of the literature, we concentrate on specific primary studies that are tightly connected with EPU effects on digital currencies. This enables us to account for and analyze the economic implications emanating from primary research. Measures such as the Global Economic Policy Uncertainty index (Figure 1) have provided the necessary measures for looking into specific and measurable impacts of economic policy uncertainty on financial markets.
It should be noted that [34] look into whether newspaper-based measures or internet search-based measures of uncertainty better predict Bitcoin returns. The exponential GARCH methodology is adopted in order to derive accurate estimations. Findings display that the intensity of individual measures on the internet for terms aiming to measure uncertainty constitutes a more appropriate measure compared to uncertainty based on newspaper articles.
2.1. Studies Indicating Weak or Modest Effects of EPU on Cryptocurrencies
Academic work on EPU linkages with cryptocurrencies has brought to the surface a number of studies that provide evidence of weak or modest connection. Refs. [20,35] belong in this strand of literature.
More specifically, [20] study the risk spillover impacts from EPU to Bitcoin by using the US EPU index, the equity market uncertainty index and the VIX as proxies for EPU. The methodologies employed are the multivariate quantile model (MVQM) based on [36] and the Granger causality risk test of [37]. Econometric findings present that downside as well as upside risk spillover impacts from uncertainty indices to Bitcoin are statistically non-significant during the period examined. This is found to be robust in different quantiles and time lags and provides guidance to interested investors.
Moreover, [35] examines how the leverage effect and economic policy uncertainty influence the volatility of Bitcoin. The realized volatility model by [38], the heterogeneous ARCH specifications (HAR-RV and HAR-GJ) by [39] are employed for estimations. So are the heteroskedasticity-adjusted mean absolute error (HMAE) and the heteroskedasticity-adjusted mean squared error (HMSE). Moreover, the Model Confidence Set (MCS) by [40] has been employed. Evidence reveals that the leverage impact significantly influences future Bitcoin volatility while the jumps and economic policy uncertainty do not affect the future volatility during in-sample period. The MCS test displays that the leverage effect has stronger predictive power than jump components as concerns Bitcoin volatility. Overall, it is argued that jumps and the EPU index are capable of ameliorating the model’s predictive ability.
2.2. Studies Arguing for the Existence of a Significant Nexus between EPU and Cryptocurrencies
There is a strand of literature concerning the EPU-cryptocurrency nexus that provides evidence of important linkages between these variables. [41] as well as [42] support that a significant negative connection is detected. On the other hand, [43] detects a positive and important nexus while [24] provide evidence of significant non-linear causality between EPU and a range of digital currencies.
To be more precise, [41] examine whether the Economic Policy Uncertainty index is capable of predicting Bitcoin returns. The period under scrutiny starts from 18 July 2010 and ends at 15 November 2017. The methodology adopted is the Bayesian Graphical Structural Vector Autoregression (BGSVAR) model. Furthermore, Ordinary Least Squares (OLS) as well as Quantile-on-Quantile (QQ) regressions are used for the purposes of estimations. Notably, findings support that EPU presents predictive powers as regards Bitcoin returns. The nexus between them is found to be negative. It should be noted though that the impact on Bitcoin returns turns to exhibiting a positive sign in extreme conditions, that is at lower or upper quantiles of both variables under scrutiny. This reinforces supporters of Bitcoin being able to serve as a hedging tool against uncertainty. In a somewhat similar vein, [42] study whether the EPU index can serve for predicting the volatility of digital currencies. The period under scrutiny covers from February 2014 to June 2019. The authors modify the stochastic volatility model of [44] and run regressions. Empirical evidence points towards the existence of a negative nexus between EPU and the future volatility of Bitcoin. Emphasis is put on that China EPU is crucial for determining cryptocurrency volatility in Bitcoin and Litecoin. Furthermore, government announcements are found not to be influential regarding the predictive power of the China EPU index. Moreover, it is emphasized that digital currencies could effectively act as hedgers against EPU risk.
At the opposite, [43] investigate how economic policy uncertainty influences cryptocurrency values in relation to national currencies during stressed eras. The D-vine pair-copula methodology is adopted and applied on data about Bitcoin, Ethereum and Ripple covering from 10 August 2016 until 23 February 2018. Econometric outcomes provide evidence that the digital currencies investigated exhibit a positive nexus with market sentiment and especially with the EPU index. This is the reason why they exhibit hedging abilities against uncertainty. It should be noted that Ethereum is found to be a better hedger than Bitcoin and Ethereum during extreme periods. Thereby, it is argued that this is the digital currency that should be preferable in portfolios for hedging against uncertainty.
An alternative perspective is provided by [24]. They investigate whether EPU is linked with the thirty highest-capitalization cryptocurrencies and gold in a non-linear manner during bull or bear markets. The non-parametric quantile causality test by [45] is adopted for estimations. Econometric outcomes reveal a strong nexus between EPU and half of these digital currencies during flourishing periods while connection with even more cryptocurrencies is found during downwards tendencies. Causality-in-variance is found to be significant in all but the higher quantiles concerning estimations in both bull and bear markets.
2.3. Studies with Mixed Results Concerning the Nexus between EPU and Cryptocurrencies
There are some significant relevant studies that provide mixed results regarding whether EPU influences or not cryptocurrencies in a worth-mentioning manner. Ref. [21] as well as [46] constitute relevant studies.
Ref. [21] by conducting regressions examine whether the EPU index can predict cryptocurrency returns. Results indicate that the EPU index of China exhibits predictive capabilities whereas the respective indices of the US, Japan and Korea cannot predict Bitcoin returns. Moreover, outcomes reveal that China’s alteration in cryptocurrency trading policy in September 2017 enables better predictions by the EPU concerning Bitcoin returns. These findings enable better regulation of digital currency transactions. In a somewhat similar mentality, [46] provide mixed results about the nexus between EPU and Bitcoin. They employ GARCH methodologies and quantile regression with dummy variables in order to examine the safe haven and hedging properties of Bitcoin in relation to EPU. It is argued that Bitcoin cannot be useful as a strong hedge or safe haven for EPU on average. Moreover, economic policy uncertainty is found to be influential towards Bitcoin as the latter responds to EPU shocks. Furthermore, evidence supports that during bull or bear markets Bitcoin can serve as a weak safe haven against EPU.
2.4. Studies Supporting That EPU Is Influential on the Linkages between Cryptocurrencies and Other Assets
It should also be mentioned that studies exist which focus interest on how influential economic policy uncertainty could prove on the linkages between modern and traditional financial assets. Studies focusing on the effects of EPU on the nexus between Bitcoin and alternative assets include [47] as well as [48].
More specifically, [47] uses an Exponential GARCH framework in order to look into the driving forces of the Bitcoin exchange rate dynamics. Econometric outcomes support the notion that news coverage constitutes an important driver of Bitcoin’s volatility. It is also emphasized that a non-linear linkage between Bitcoin volatility and global uncertainty is traced. Additionally, it is argued that during normal conditions Bitcoin acts as a hedge whereas during stressed periods it is positively related with stock markets. It is revealed that Bitcoin’s safe haven capabilities are for sure only when great economic uncertainty prevails. Moreover, [48] look into whether the long-run volatilities of Bitcoin, global stocks, commodities and bonds are receivers of effects from global economic policy uncertainty. The GARCH-MIDAS and the DCC-MIDAS specifications are adopted and daily as well as monthly data are used spanning from 21 September 2010 up to 26 January 2018. Moreover, the optimal hedge ratios and the hedging effectiveness index are employed in order to measure hedging performance. Empirical results reveal that global economic policy uncertainty exerts negative and significant effects on the correlation between Bitcoin and bonds while positively influences the correlations between Bitcoin and equities as well as between Bitcoin and commodities. Overall, it is argued that the EPU index presents a positive impact on the hedging capabilities of Bitcoin against global equities and global bonds.
Overall, it can be seen that findings are split as concerns the linkages between economic policy uncertainty and cryptocurrencies. Notably, the majority of papers indicate that EPU is influential towards Bitcoin and other digital currencies. Nevertheless, there are studies indicating a negative nexus between economic uncertainty and cryptocurrencies while other reveal a positive connection. Moreover, empirical evidence indicates that EPU indices also exert impacts on the linkages between cryptocurrencies and other (more conventional) financial assets. It should be emphasized that in an overall perspective, economic policy is important for the behaviour of returns and volatility in modern financial assets. This nexus is found to be more intense during extreme economic conditions. Thereby, primary studies reveal that the EPU index can be the determinant for hedging relations between a spectrum of well-established or newly-established assets. This could prove very useful for investors in order to improve their risk-return trade-off when forming portfolios and conventional assets suffer from shocks in economic policy.
3. Data and Methodology
Estimations are conducted that cover the period since the launch of the 2017 bull cryptocurrency markets up to the present. To be more precise, the period from 1 January 2017 until 23 September 2020 is investigated, which is characterized by high levels of fluctuations in the markets of digital currencies. This happens because the bull market (1 January 2017–18 December 2017), the bear market (19 December 2017–15 December 2018) and the highly volatile period afterwards are included in the time period of estimations. This allows us to examine the return and volatility characteristics of cryptocurrencies during the presence of highly speculative opportunities for investors in order to detect the special characteristics of such upwards and downwards tendencies in market values.
In order to perform econometric estimations, a series of variables have been extracted in daily frequencies and transformations into logarithmic differences have taken place. The highly innovative Economic Policy Uncertainty index based on [28] has been downloaded from the www.policyuncertainty.com (accessed on 25 September 2020) website. To be more precise, the US Daily News index has been employed for the purposes of our estimations. This index is based on newspaper archives from Access World New’s NewsBank service. The archives of thousands of newspapers and other news sources from across the globe are included in this index. The EPU measure has become overwhelmingly popular in the fields of economics and finance and constitutes a highly innovative measure adopted in high-quality empirical studies for measuring alterations in economic conditions.
Moreover, we collect daily data about major crypptocurrencies (Bitcoin, Ethereum, Litecoin) from the coinmarketcap.com (accessed on 25 September 2020) database. Furthermore, daily data about the market values of West Texas Intermediate (WTI) oil have been extracted by Datastream and used for the purposes of our investigation. Oil prices serve as a good measure of economic development as they are tightly connected with GDP growth. Additionally, oil is a traditional financial asset interconnected with a wide range of conventional and modern alternative assets [49,50]. Moreover, the CBOE Volatility Index (VIX), also known as the ‘’fear index’’ has been downloaded from the FRED database in daily frequencies. This constitutes a real-time market index that reflects the market’s expectation of 30-day forward-looking volatility. VIX is constructed from the price inputs of the S&P 500 index options and is representative of investors’ sentiments. It is considered to be a barometer of market expectations for short-term volatility exerted by U.S. stock index option prices and has been employed in relevant academic research [51,52].
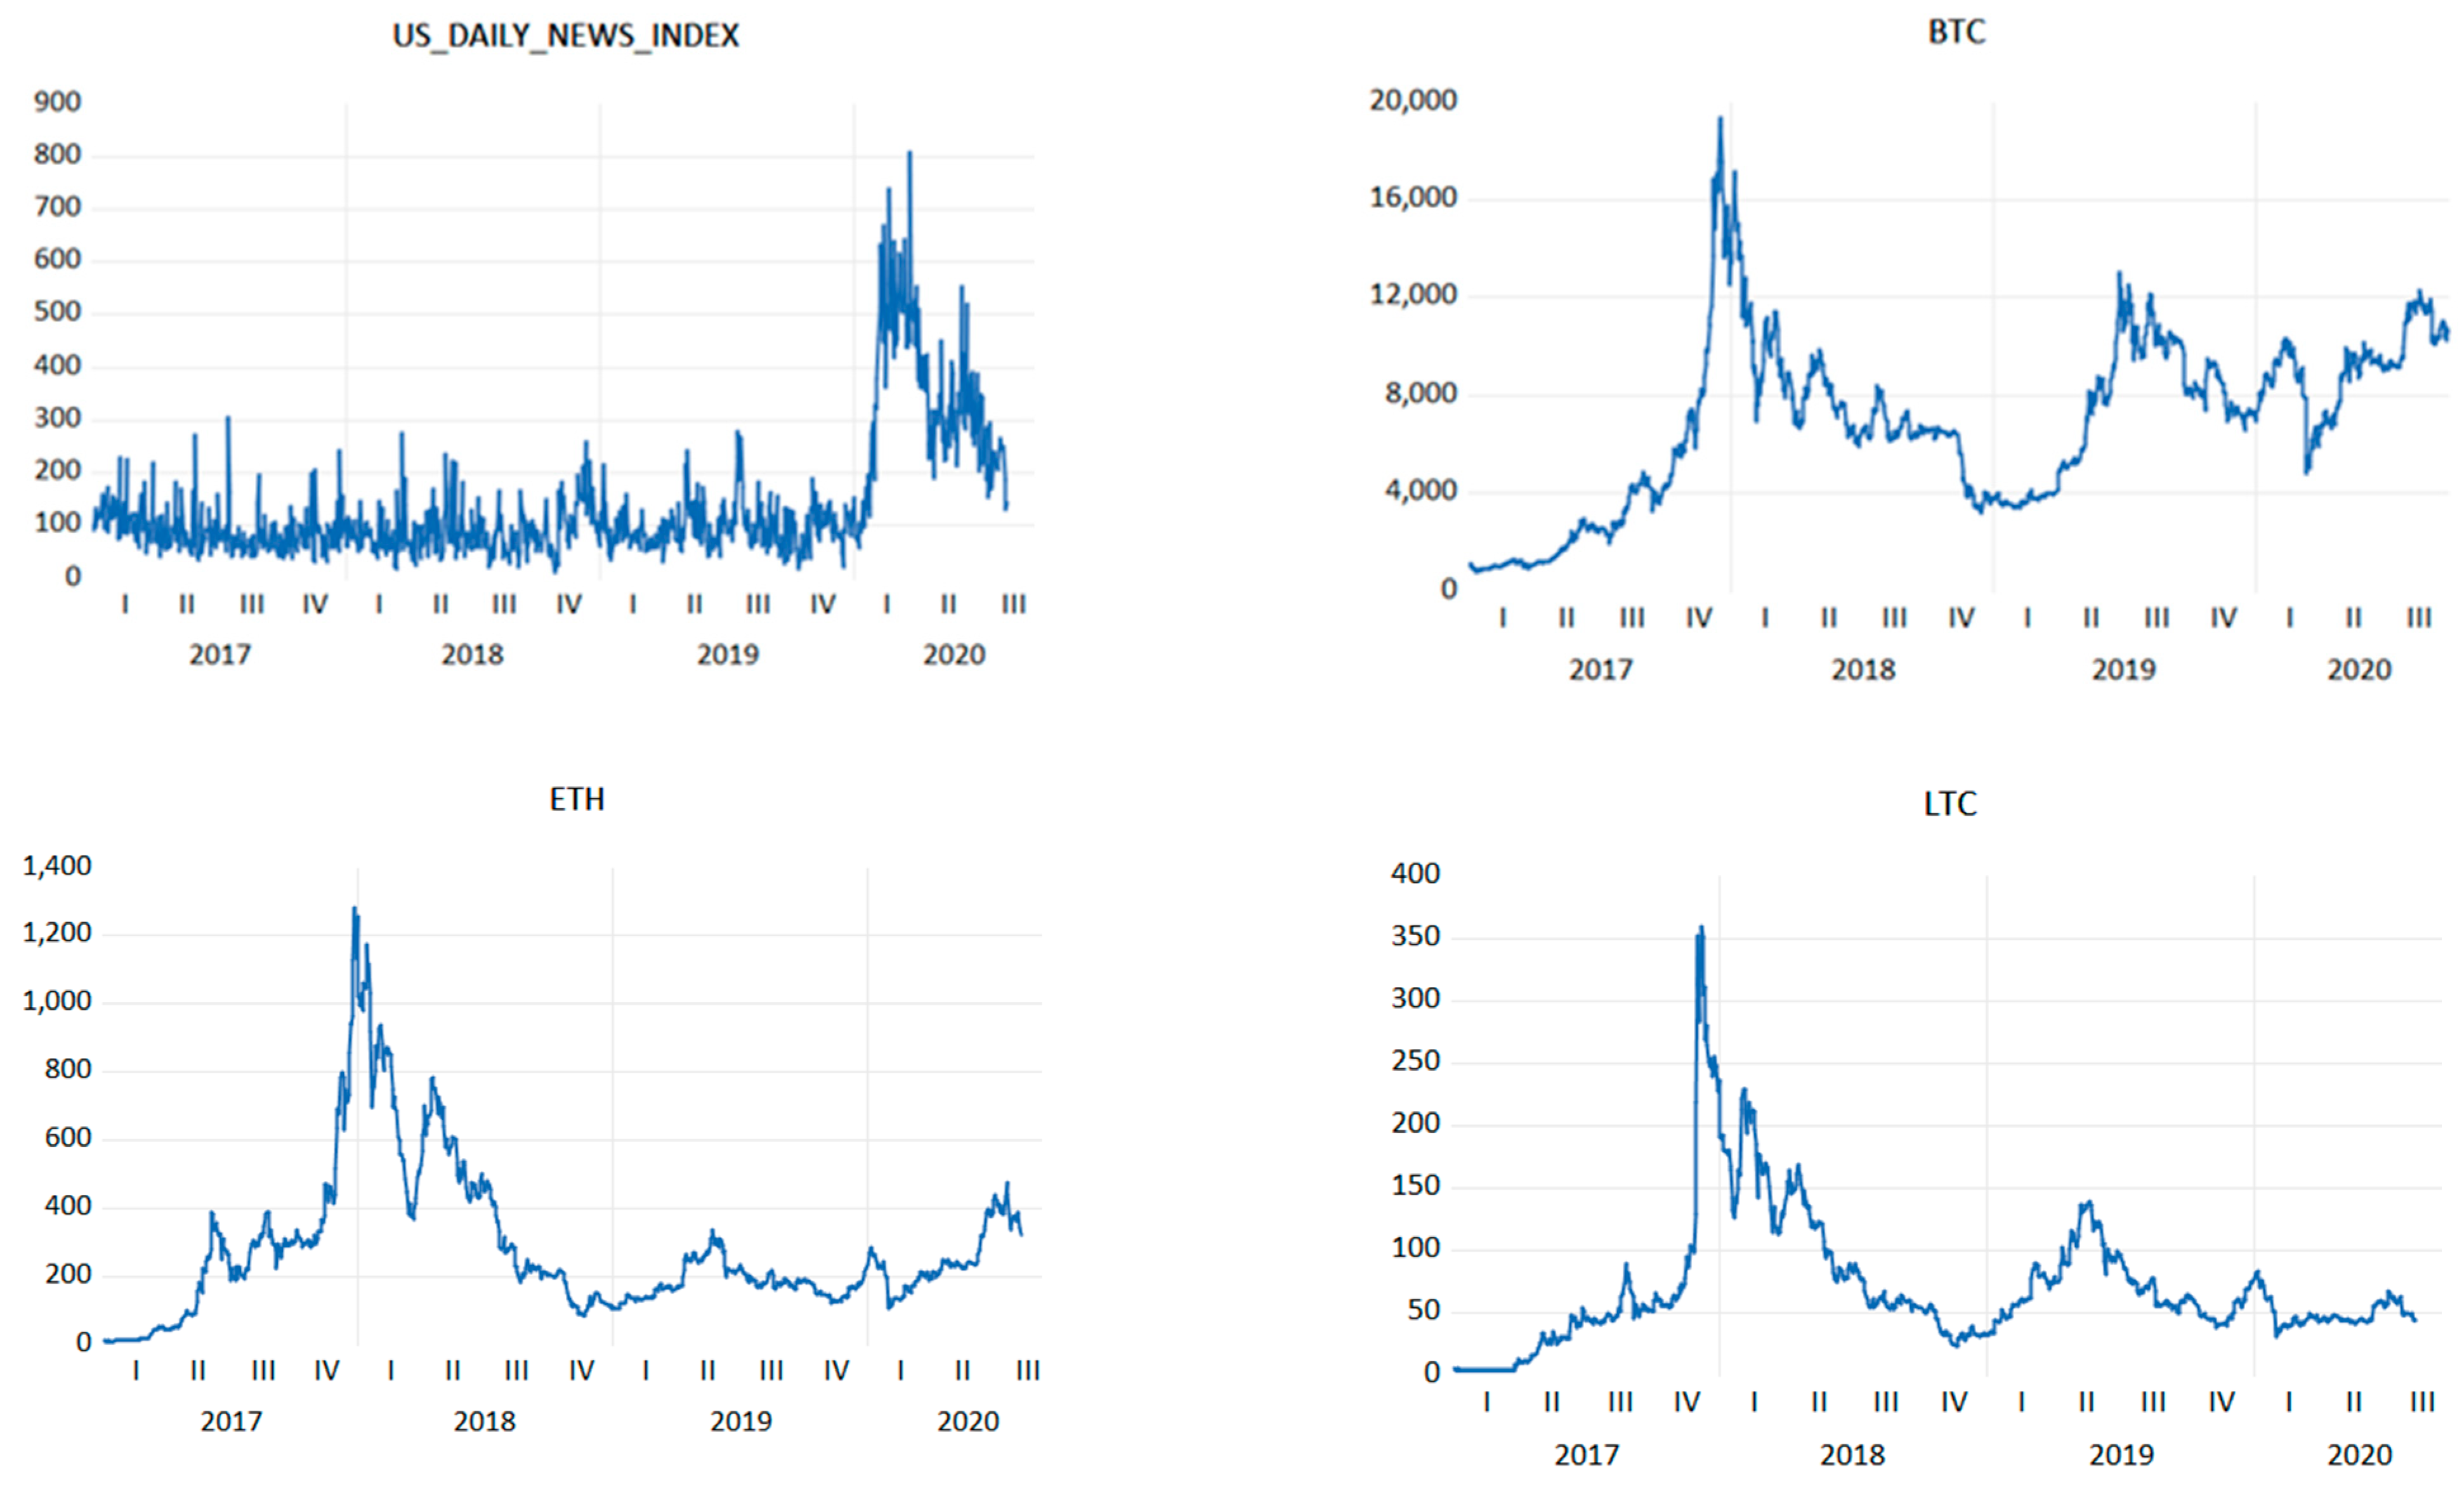
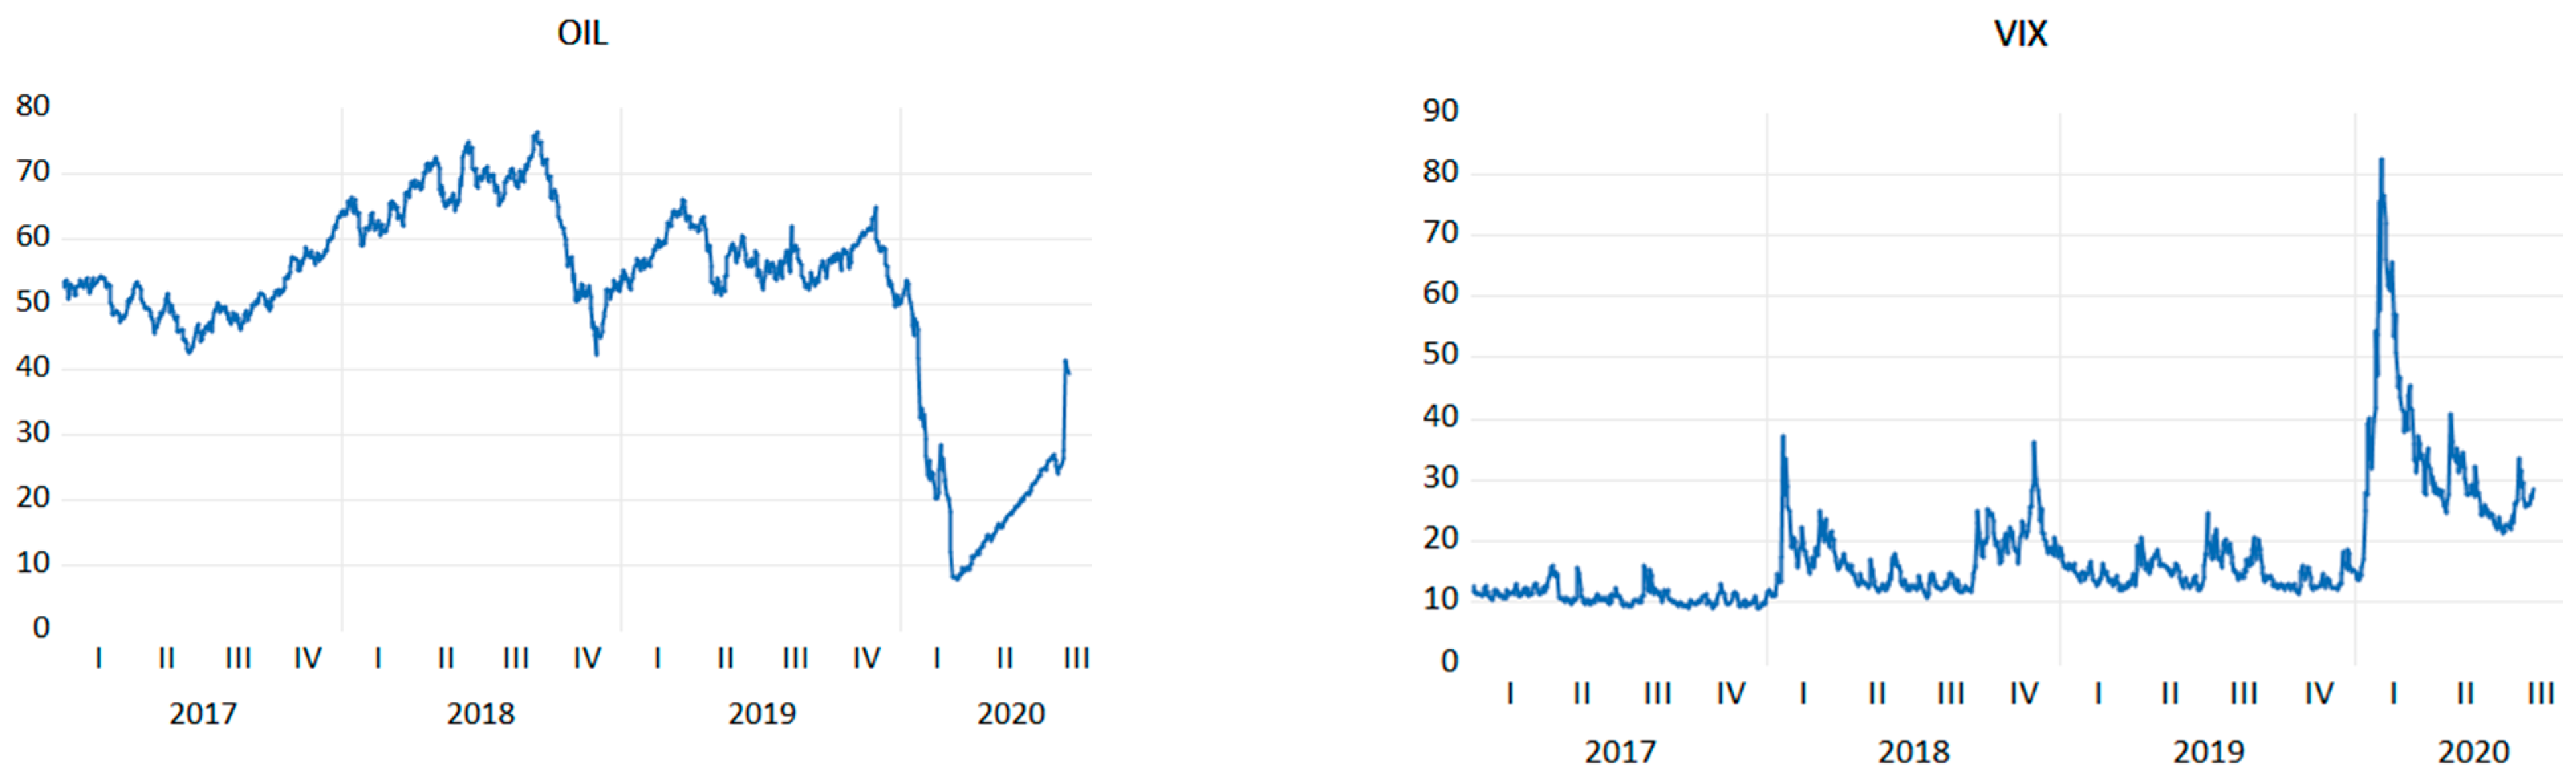
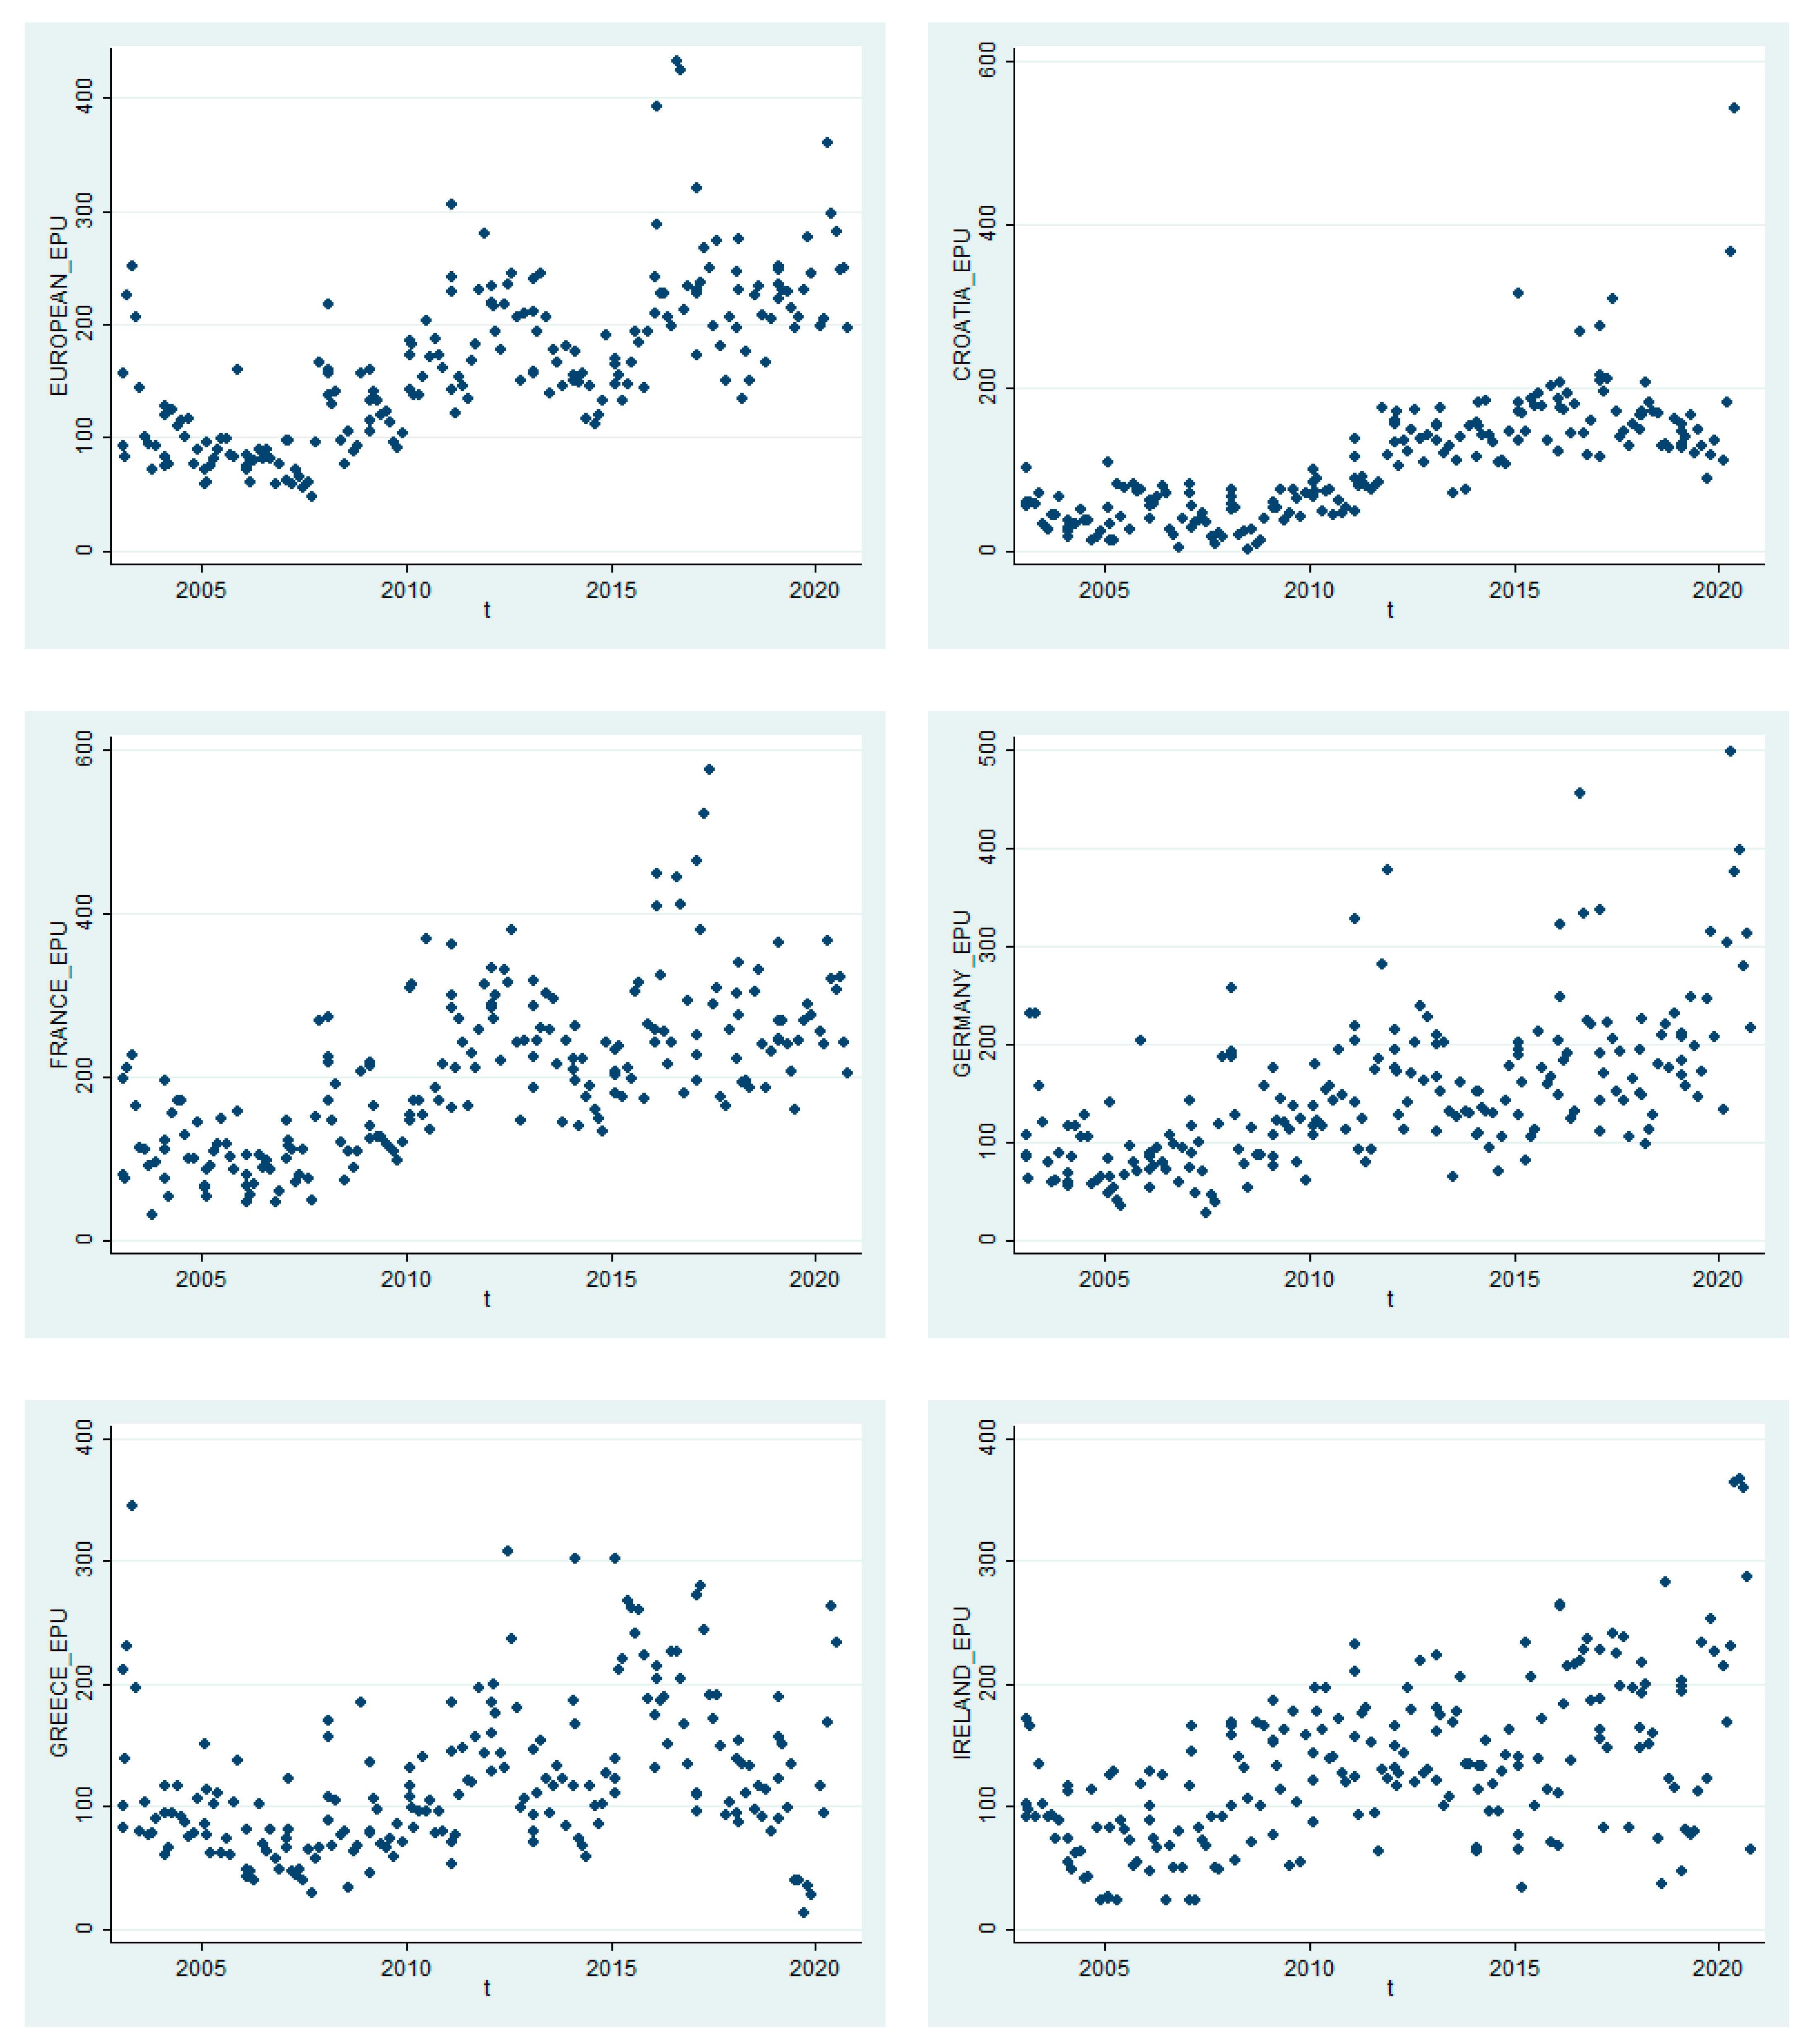
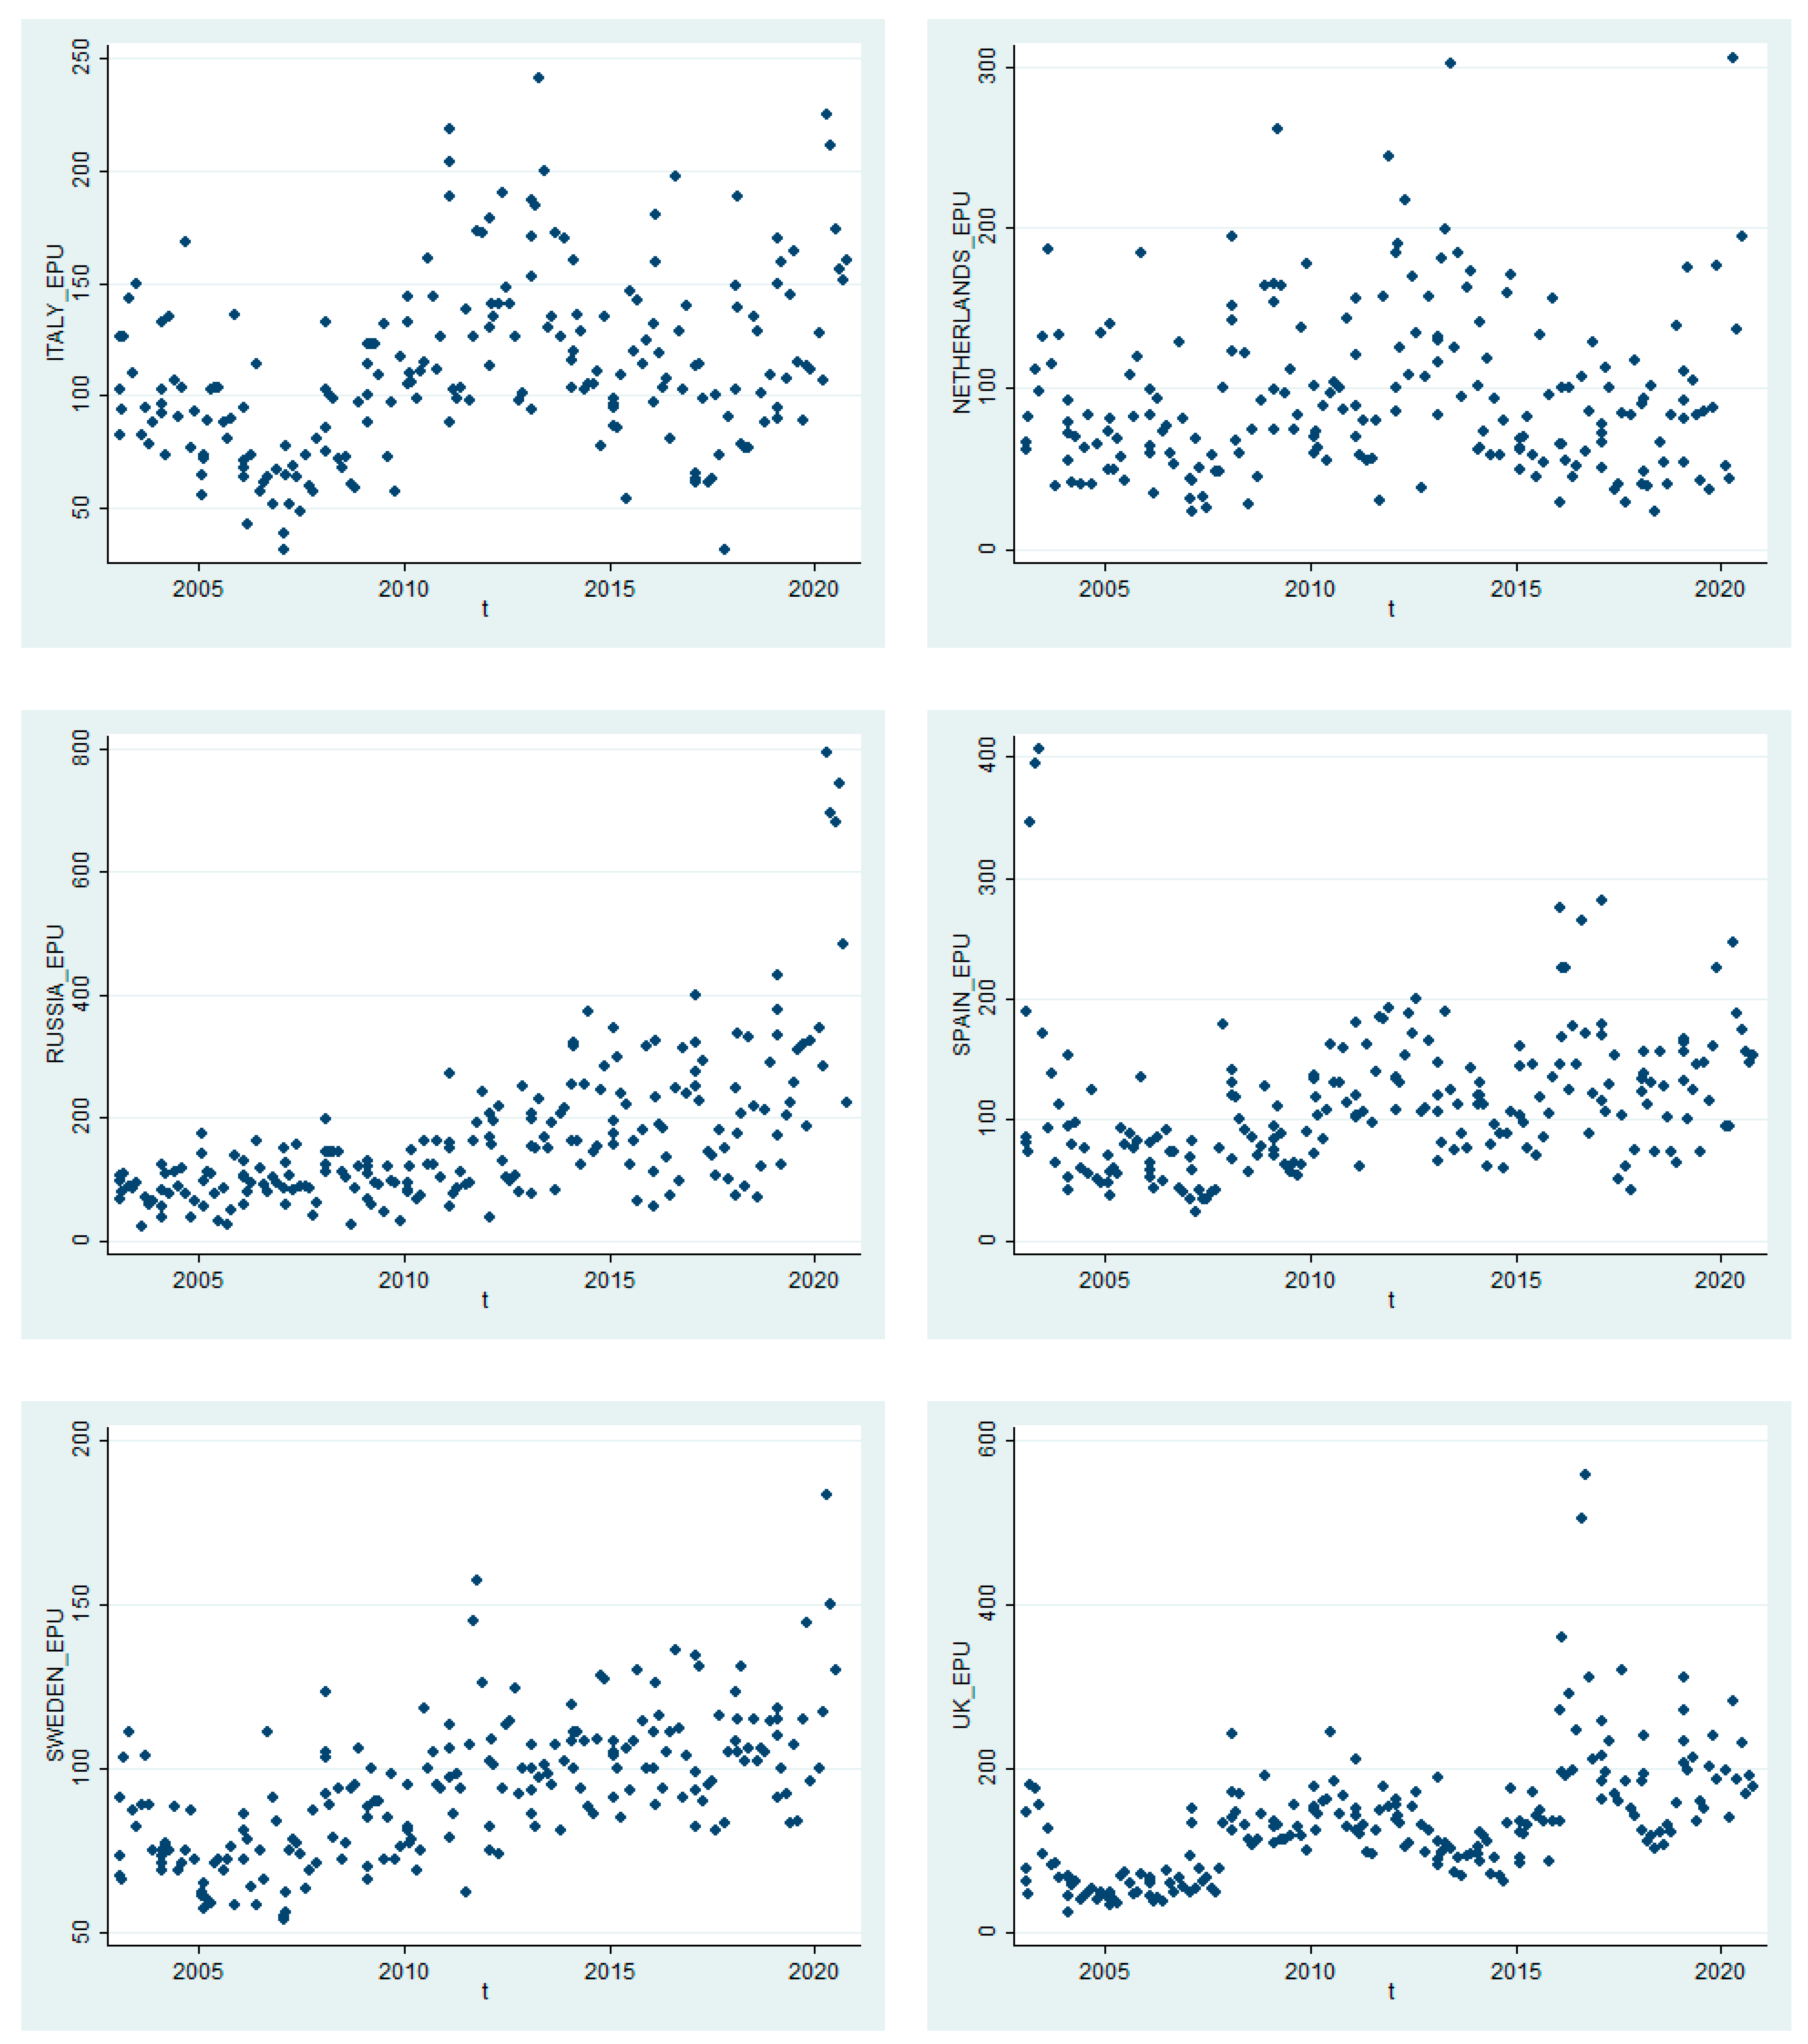
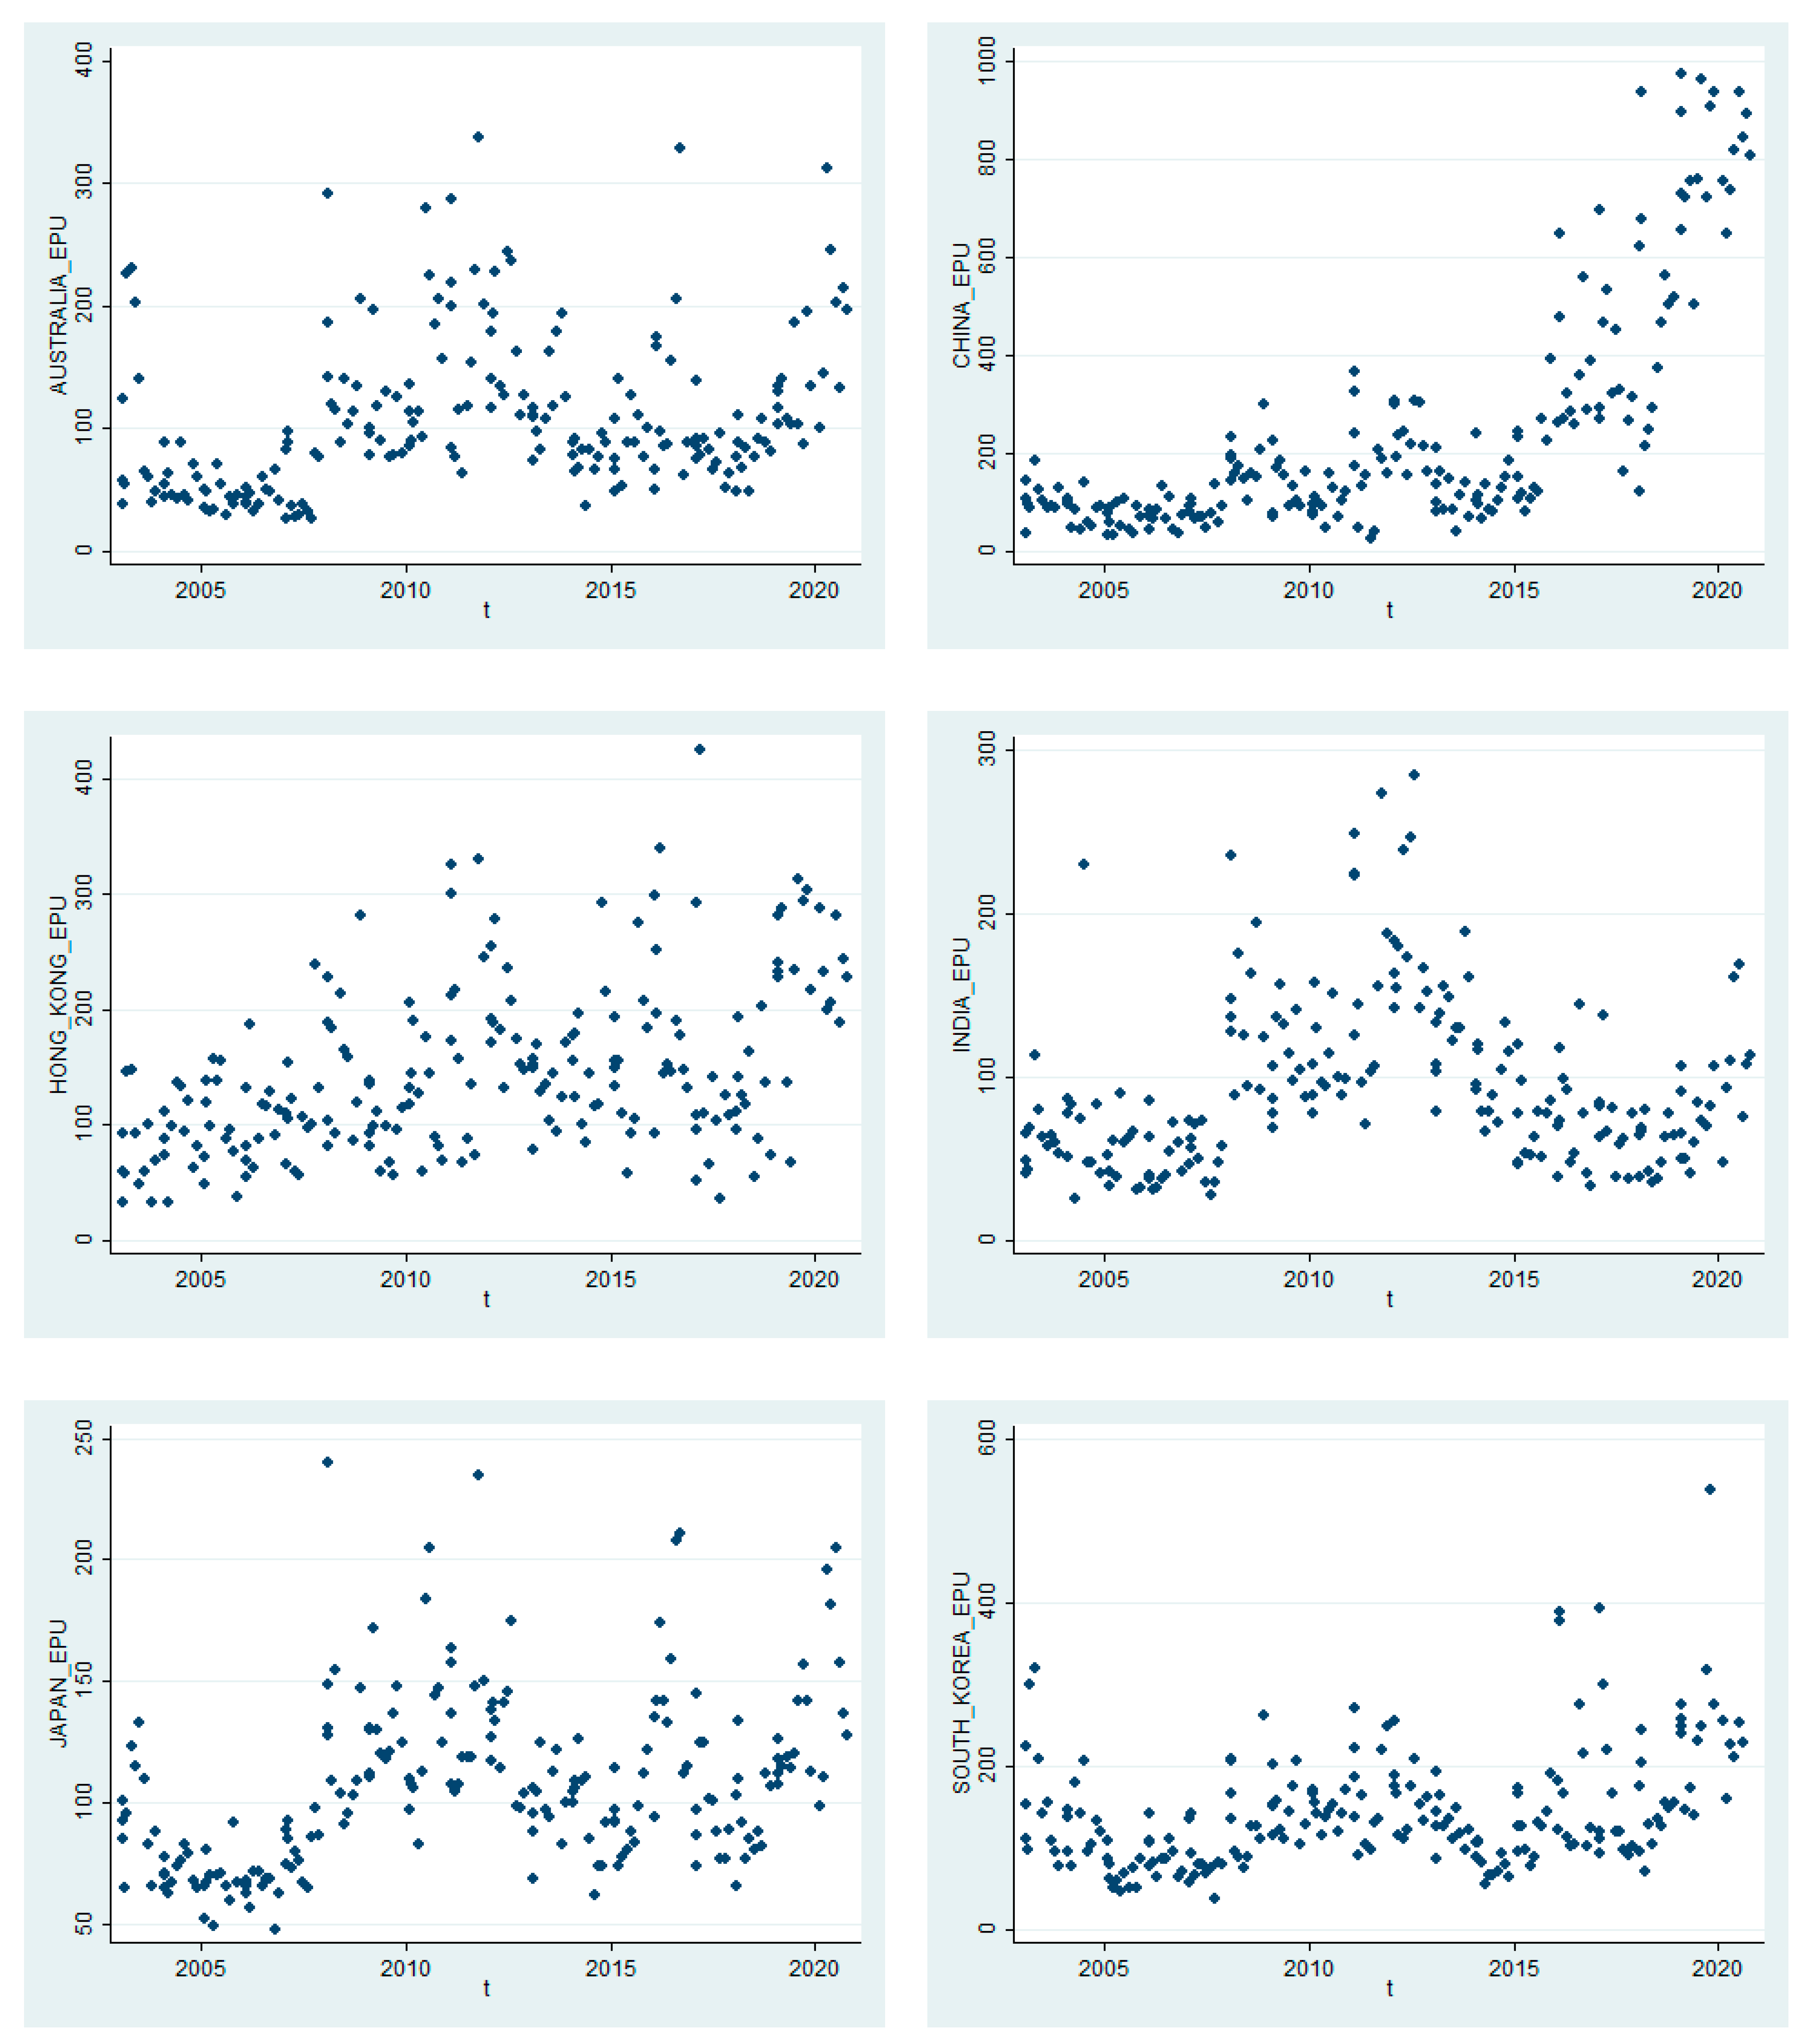
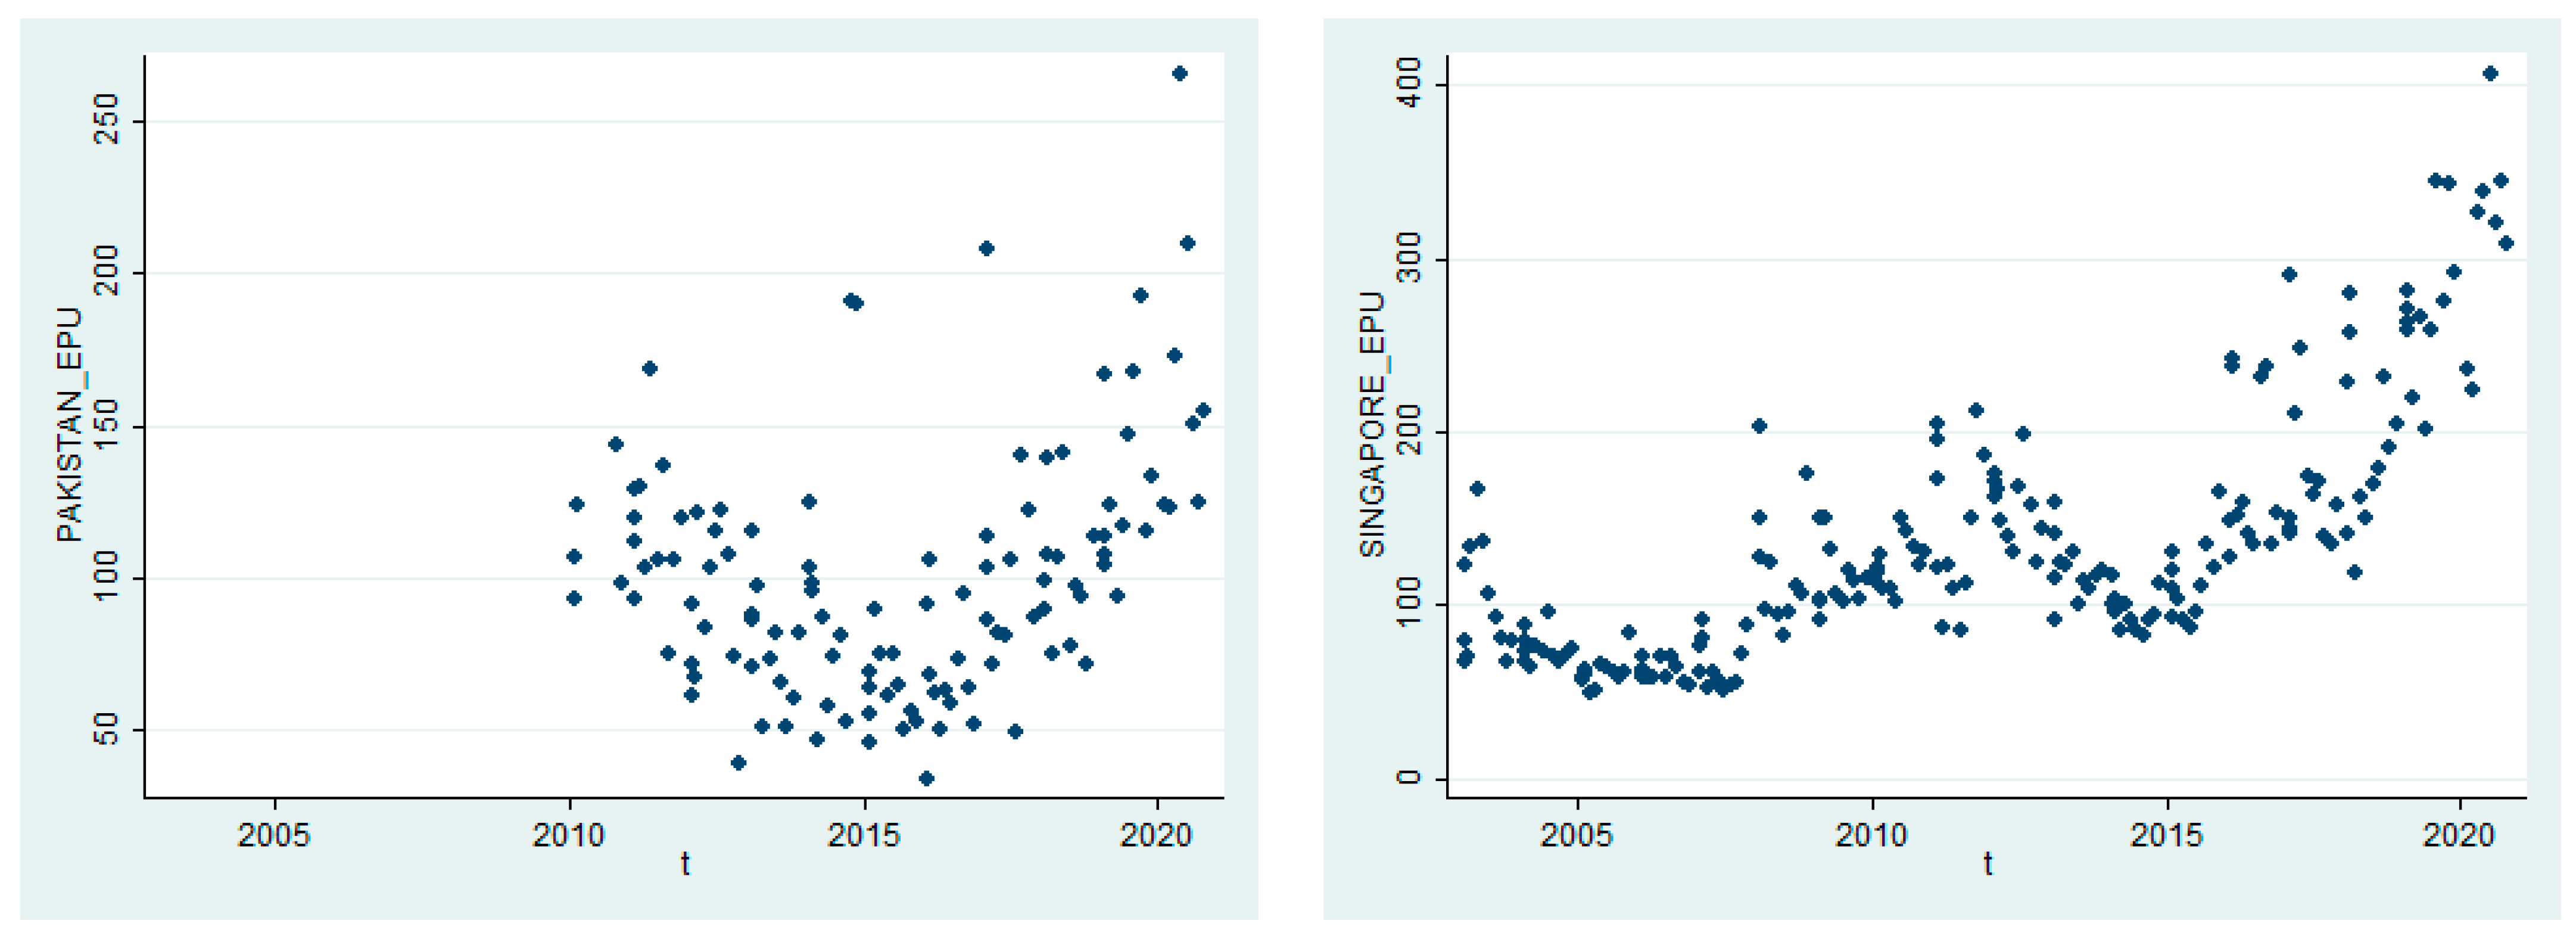
Figure 2 provides the values of the US Daily News index and of the financial variables during the period under scrutiny. It can be seen that the US economic policy uncertainty presents large fluctuations since late 2019 due to the COVID-19 outburst and racial violence but has also been volatile before that. Moreover, the three major ctyptocurrencies investigated have clearly enjoyed the bull market of 2017 and present abrupt falls during 2018 while seem to present lower fluctuations thereafter. When it comes to oil, an abrupt decrease in prices can be observed since the launch of the coronavirus crisis but very recently an upwards tendency towards a rebound has made its appearance. Furthermore, it should be noted that volatility in US stock exchanges has been modest during the last years but some spikes occasionally emerged. Notably, sharp increases in stock volatility have been brought to the surface since the COVID-19 disease made its appearance. Moreover, Figure A3, Figure A4 and Figure A5 in the Appendix A display how economic policy uncertainty has evolved in European countries and the UK, American countries, and Australia and Asian countries, respectively. It can be seen that the majority of countries present high fluctuations in EPU and at least five spikes are detected at each one of them since 2002. Overall, it could be observed that uncertainty has rendered more intense since the outburst of the Global Financial Crisis –especially in advanced economies- and that it increases in the advent of time. In Figure A3, Figure A4 and Figure A5 in the Appendix A it can be seen that Greece, Italy, Australia, Hong Kong, and South Korea present high fluctuations concerning their EPU measures. Moreover, US, Canada, European countries as a total, Croatia, France, Germany, China, Pakistan, and Singapore display high fluctuations concerning the Economic Policy Uncertainty index.
Finally, it should be stressed that the Netherlands, Russia, and Sweden are highly increasing and volatile regarding their economic conditions during the COVID-19 disease. Table 1 displays the descriptive statistics of the US Daily News index, the major cryptocurrencies examined, crude oil prices and the stock market volatility index. It can easily be seen that Bitcoin, Ethereum and Litecoin have been highly volatile. The remaining variables also exhibit large fluctuations in their values. Notably, the joint hypothesis of normality in distribution (the skewness being zero and the excess kurtosis being zero) is rejected for the majority of variables as indicated by the values of the Jarque-Bera test. It should be emphasized that five out of the six variables under scrutiny are found to be leptokurtic.
In Table 2, the correlation matrix of variables can be seen. Intriguingly, Ethereum, Litecoin and oil are found to be weak hedgers against the US economic policy uncertainty. Thereby, they should not be good investment options during crises as high US EPU values lead to lower market values of these assets. Moreover, correlation coefficients indicate that Ethereum and Litecoin prices are weak diversifiers of Bitcoin prices as they are positively related in a modest to high level. Consequently, they cannot serve as efficient diversifiers or hedgers against Bitcoin in investor portfolios. It should also be noted that oil is negatively related with the US EPU index, Bitcoin and the VIX index. This clearly demonstrates that oil could be useful for hedging purposes against risky investments during periods of high volatility in markets.
The methodologies employed in order to conduct econometric estimations are the threshold ARCH, simple asymmetric ARCH and non-linear ARCH specifications. All three methodologies are based on the seminal work of [53] concerning autoregressive conditional heteroskedasticity (ARCH) models in order to study heteroskedasticity in highly volatile time series. This work was later augmented by [54] that provided the generalized form of ARCH methodologies.
In our study, the threshold ARCH [55], simple asymmetric ARCH [56] and non-linear ARCH [57] models are adopted in order to test whether the Ethereum and Litecoin display thresholds, asymmetries or non-linearities in their volatilities due to US economic policy uncertainty. Investigation of the patterns of volatility of major cryptocurrencies through the use of advanced methods that take into consideration special features of fluctuations could significantly enlighten investors as regards their decision-making. Thereby, fruitful implications could emerge for ameliorating the synthesis of investor portfolios if such innovative ARCH specifications are employed when estimating EPU effects on modern financial assets.
Estimations conducted by adopting the Dickey-Fuller and Phillips-Perron tests reject the existence of autocorrelation. Moreover, we proceed by identifying the most appropriate methodology among the specifications employed by using the AIC [58] and [59] criteria.
The conventional ARCH model is given as:
And the GARCH specification is as follows:
The three specifications employed for the purposes of estimating the US EPU effects on cryptocurrencies are presented by the following equations:
Threshold ARCH by [55]:
Simple asymmetric ARCH based on Capie et al. [56] has also been employed.
Non-linear ARCH by [57]:
Moreover, the Akaike Information Criterion (AIC) is used:
as well as the Information Bayesian Criterion (SBC/BIC) provide us with information about the optimal specification that should be adopted:
Both criteria indicate that the model with the lowest value estimated should be preferable for econometric applications.
4. Empirical Outcomes and Economic Implications
Econometric estimations have taken place in order to investigate whether the US Economic Policy Uncertainty, Bitcoin market values, WTI Oil prices and the VIX index that represents volatility in US stock markets influence the returns and volatility of Ethereum and Litecoin. The findings of this research could enlighten investors in risky assets as they would acquire deeper knowledge into whether unclear economic conditions in the US, the market values of the highest importance cryptocurrency, oil prices which are major determinants of economic activity as well as the risk level in the US stocks can affect the closest substitutes of Bitcoin (Ethereum, Litecoin) in portfolios of risk-loving investors during extreme periods.
Thereby, the major determinants (assets) of investor profitability are included in this study and their linkage with popular cryptocurrency investments is examined. These econometric results also reveal whether herding phenomena could emerge in the markets of digital currencies during periods with high volatility as the nexus between Bitcoin and alternative cryptocurrencies’ prices is under scrutiny. Special emphasis should be put in whether the pattern that the volatilities of Ethereum and Litecoin follow present a threshold, follows an asymmetric or a non-linear scheme. This would significantly reduce on the large level of ignorance concerning risky investment strategies during turbulent eras.
First of all, estimations presented in Table 3 have been conducted for acquiring measurable influences of the US EPU, oil, and the VIX index on the most important cryptocurrency in terms of trading volume and market capitalization, which is Bitcoin. The latter has always been the driver of market values and volatility of the great majority of cryptocurrencies, Econometric outcomes reveal that US economic uncertainty triggers a positive but negligible effect on Bitcoin prices and fluctuations. Moreover, these results are not statistically significant. Nevertheless, evidence indicates that crude oil generates a substantially higher and positive impact (0.0904) on Bitcoin when threshold ARCH estimations take place. Results by simple asymmetric ARCH and non-linear ARCH corroborate this finding but bear not adequate statistical significance. Emphasis should be given on the impacts that the ‘’fear index’’ exerts on this leading cryptocurrency. More specifically, it is estimated that higher volatility in the US market–as expressed by the VIX-leads to lower Bitcoin returns as the −0.0824, −0.0834, and −0.0834 coefficients present by TARCH, SAARCH, and NARCH specifications respectively. Thereby, higher economic activity–as is usually represented by oil- results into higher demand for Bitcoin and this indicates that the latter enjoys higher demand during flourishing periods. This is in tandem with outcomes about the fear index effects that display lower popularity of Bitcoin when economic conditions are not favourable.
Estimation results about the connection of Ethereum price behaviour with the US EPU and alternative assets are displayed in Table 4. Evidence deriving from the threshold ARCH indicates that the US EPU exerts an anemic negative impact (−0.0008) on Ethereum prices but this estimation is not statistically significant. Moreover, Bitcoin is found to influence Ethereum in a positive and statistically significant manner and in a considerable extent (1.0022).
Moreover, oil prices are found to be weakly influential (0.0332) in a positive but not statistically reliable manner. As concerns the US stock market volatility index (VIX), it influences Ethereum market values in a weak and negative way (−0.0444) as indicated by reliable estimations.
When it comes to findings by the asymmetric ARCH methodology, not large deviations from the threshold ARCH outcomes can be traced. The US EPU index remains slightly influential but in a positive direction though estimations are still not trustworthy. Bitcoin appears to be somewhat less influential but still a reliable determinant whereas oil effects are larger (and become statistically significant) as well as the VIX impacts. Nevertheless, the asymmetric factor estimation in the variance equation is not reliable. It should be noted that outcomes estimated by the non-linear ARCH methodology are in great resemblance with the simple asymmetric ARCH results concerning Ethereum price determinants. It should also be emphasized that according to both the AIC and BIC selection criteria the threshold ARCH methodology is found to provide the best fir for the purposes of our estimations. Namely, it is revealed that volatility in Ethereum market values changes when a low positive threshold (0.0967) is reached.
Results generated by estimations about the impacts of US economic policy uncertainty, Biitcoin and oil prices and the VIX index on Litecoin are exhibited in Table 5. Remarkably, estimations in all three ARCH specifications employed bring to the surface results of the same sign concerning the determinants investigated. To be more precise, the US EPU is revealed to exert weak, positive and statistically significant effects on Litecoin prices. This is not fully in tandem with results about Ethereum impacts.
Moreover, Bitcoin market values constitute a significantly stronger giver of effects in a statistically reliable manner. Notably, this is in accordance with outcomes about Ethereum but impacts on Litecoin are slightly higher. Whatsoever, it should be emphasized that all three specifications concerning Litecoin display that this is influenced by WTI Oil prices by an anemic level and towards a negative direction in a statistically non-significant manner. This does not corroborate the findings about Ethereum, which indicate that oil is weakly but positively influential and that relevant estimations are reliable in two out of three models. When it comes to VIX impacts, they remain negative as in Ethereum but of a lower scale. Nevertheless, these estimations are significantly less trustworthy that Ethereum outcomes. One should pay attention in that coefficients in variance equations are all statistically significant. Additionally, both the AIC and BIC criteria select the threshold ARCH specification as the optimal model for estimations at the detriment of simple asymmetric or non-linear schemes.
Evidence indicates that the US EPU does not constitute an important determinant of returns and volatility in the major Ethereum and Litecoin cryptocurrencies, which are the closest substitutes of the highly innovative and leading Bitcoin cryptocurrency. This is in accordance with [35,45] that argue for a strong link between EPU and cryptocurrencies whereas contrary to findings of [20] that support that no significant nexus exists. In contrast to EPU results, Bitcoin-which is constantly the highest market-cap digital currency and the generator of herding effects in cryptocurrency markets (see: [18])-is influential in a powerful and positive manner towards both Ethereum and Littecoin.
Notably, WTI Oil is found to be significantly more influential towards Ethereum than towards Litecoin. Effects on Ethereum prices are favourable whereas on Ethereum are negative but negligible. This is in accordance with the findings of [60] that provide mixed results about the nexus between oil and cryptocurrencies. Moreover, volatility in US stock markets constitutes an adverse factor for growth in Ethereum and Litecoin prices, as results based on the VIX index indicate. This partially abides by the findings of [61] about the existence of co-movements between the VIX and cryptocurrencies.
A number of significant economic and financial implications emerge from the empirical outcomes of our study. It should be highlighted that news about the US Economic Policy Uncertainty do not substantially influence the market values of two of the most important cryptocurrencies. On the contrary, a significant number of studies have revealed that a powerful nexus between EPU and Bitcoin exists. Thereby, less-influential cryptocurrencies are found not to be affected by news about economic conditions in a significant level. Thereby, Ethereum and Litecoin could be employed by investors in order to protect themselves from profit losses during adverse economic conditions. This would enable them to use risky and modern assets in order to achieve high profits but at the same time not suffer the extra volatility implied by turmoil.
Moreover, the positive linkages that Bitcoin exhibits with Ethereum and Litecoin verify that they are close substitutes and indicate that the latter are receivers of herding effects from Bitcoin. These two major cryptocurrencies could not be useful as efficient hedgers against Bitcoin. Nevertheless, they could serve as modest to weak diversifiers in portfolios that used to contain Bitcoin. Replacing Bitcoin with Ethereum or Litecoin could allow investors with lower amounts to invest to participate in cryptocurrency investments and at the same time better protect themselves from the impacts of EPU as analyzed above. Consequently, higher levels of profitability could be reached by suffering mainly the financial risk deriving from the threshold schemes of volatility but avoiding economic or country risks.
It should also be underlined that WTI Oil can be a better diversifier for Litecoin as they are practically unrelated than for Ethereum which exhibits a weak positive relation with oil. Investors should be aware that evidence indicates higher-cap cryptocurrencies such as Bitcoin (as found in earlier studies) and Ethereum are more closely connected with oil prices. Thereby, higher economic activity and willingness to invest (as indicated by oil prices) lead to higher demand for Bitcoin and Ethereum while leave Litecoin mostly unaffected. This could provide a compass for interested investors that the first and second largest cryptocurrencies are more connected with economic activity than also known but less crucial digital currencies. Namely, investments in Ethereum should be preferable during crises.
Another highly important aspect of our findings is that higher levels of volatility in the US stock market lead to lower market values of Ethereum and Litecoin. Even though the effects are not powerful it can be seen that a hedging nexus could be argued between US stock market volatility and these major cryptocurrencies. On this account, Ethereum and Litecoin could be used as alternative solutions with regard to US stocks during times of overall large fluctuations in financial markets and vice versa. This should provide interested investors with caution as this nexus can be indicative of modern forms of liquidity and investments could be worth pondering during periods with high speculative opportunities. Even though stocks are also considered risky investments there could be a possibility of reducing the overall portfolio risk by investing in other risky but more modern financial assets.
Special emphasis should also be put on the threshold form of Ethereum and Litecoin volatilities. This is indicative of their volatilities being less predictable than with safer assets. Consequently, Ethereum and Litecoin are found to constitute highly fluctuating forms of digital currencies and investments that could satisfy the risk- and profit- appetite of investors and speculators. Its lack of serious ties with economic policy uncertainty and forms of investments other than the leading cryptocurrency renders them very useful investment and risk-fighting means in the arsenal of economic agents in their effort to ameliorate their risk-return trade-off.
5. Conclusions
Investigating the economic implications from primary academic studies on the nexus between Economic Policy Uncertainty and cryptocurrencies is of primary importance in order to enlighten regarding unknown aspects of modern forms of liquidity and investments. Moreover, original empirical estimations are conducted by sophisticated GARCH specifications in order to examine the impacts of the US Daily News index, Bitcoin and WTI Oil prices as well the effects of the S&P500 Volatility index (VIX) on the market values of Ethereum and Litecoin. The latter are among the highest-capitalized cryptocurrencies and close substitutes of the leading Bitcoin cryptocurrency. This study enables to provide a thorough analysis on the determinants of returns and volatility of major digital currencies with special emphasis on the influence that EPU exerts on them. This paper builds on and contributes to both the strand of literature about economic policy uncertainty and about digital currencies. Moreover, our paper contributes to better understanding commodity as well as stock markets.
This integrated survey analyzes the findings of eleven high-quality academic papers that examine the linkages between EPU and digital currencies (Table 6). Based on primary findings, it can be argued that the majority of academic work supports a powerful connection between economic policy uncertainty and Bitcoin as well as other cryptocurrencies. Predictive capabilities of the EPU index are traced and volatility spillover effects are detected. Non-linearities are found in a significant bulk of research. Sophisticated specifications of GARCH schemes, Quantile-in-Quantile estimations, modern forms of vector autoregressive schemes, methodologies based on econophysics as well as alternative advanced methodologies indicate that the EPU-cryptocurrency relation can take various forms that indicate high levels of dependence between these variables.
Apart from the survey, an empirical examination has taken place by employing data spanning from 1 January 2017 up to 23 September 2020. Thereby, the bull, the bear and the subsequent highly volatile period in cryptocurrency markets is considered. Both the AIC and BIC selection criteria indicate that asymmetric ARCH is the appropriate methodology for estimating the nexus of Ethereum and Litecoin with the US EPU, Bitcoin, oil and the VIX index. Surprisingly, these two major cryptocurrencies bear no tight connection with economic policy uncertainty, while they are closely linked with Bitcoin’s performance. Moreover, weak negative relations are estimated between Litecoin and oil prices as well as the VIX index. Whatsoever, Ethereum is weakly positively connected with oil while its nexus with the VIX is of about the same size but at the opposite direction. Econometric outcomes by the simple asymmetric ARCH and the non-linear ARCH specifications are by a large part in tandem with these findings.
All in all, findings from this study reveal that larger-capitalization cryptocurrencies present tighter connection with traditional assets but only Bitcoin is strongly linked with news about economic policy uncertainty. Notably, Ethereum and Litecoin present threshold points at their volatilities and this renders them unpredictable and risky. Despite that, these two major cryptocurrencies could serve as better hedgers against economic policy uncertainty as well as traditional financial assets than Bitcoin during eras of high volatility in markets and economic uncertainty. Consequently, the risk-return trade-off in investor portfolios could be ameliorated by replacing Bitcoin with Ethereum and Litecoin.
Τhis integrated survey and empirical investigation provides a threefold contribution. First of all, the interested reader acquires a broader perspective of how economic affects innovative financial tools such as cryptocurrencies and this enables better understanding of financial markets in modern economic environments nowadays. Moreover, studying such linkages permits the comparison of influences among alternative countries or regions. This allows better elucidating whether economic conditions such as bull markets, bear markets or crises can be beneficial or detrimental for each region during this era of high-speed information. The third axis of our contribution lies in the empirical investigation undertaken about how economic policy uncertainty combined with modern and traditional financial assets of primordial importance have impacts on the returns and volatility of major cryptocurrencies.
The aim of this study is to provide a compass for interested researchers that could probably lead to a significant boost in this topic of fundamental importance in economics and finance. Avenues for further research could include investigation of the effects that EPU in other countries–apart from the US- exert on cryptocurrencies of high- or medium-capitalization. Furthermore, alternative methodologies could be adopted in order to better capture asymmetric, non-linear or other forms of effects that economic and financial factors exert on cryptocurrency returns and volatility.
Funding
This research received no external funding.
Institutional Review Board Statement
Not Applicable.
Informed Consent Statement
Not Applicable.
Data Availability Statement
Data are available upon request.
Conflicts of Interest
The author declares no conflict of interest.
Appendix A
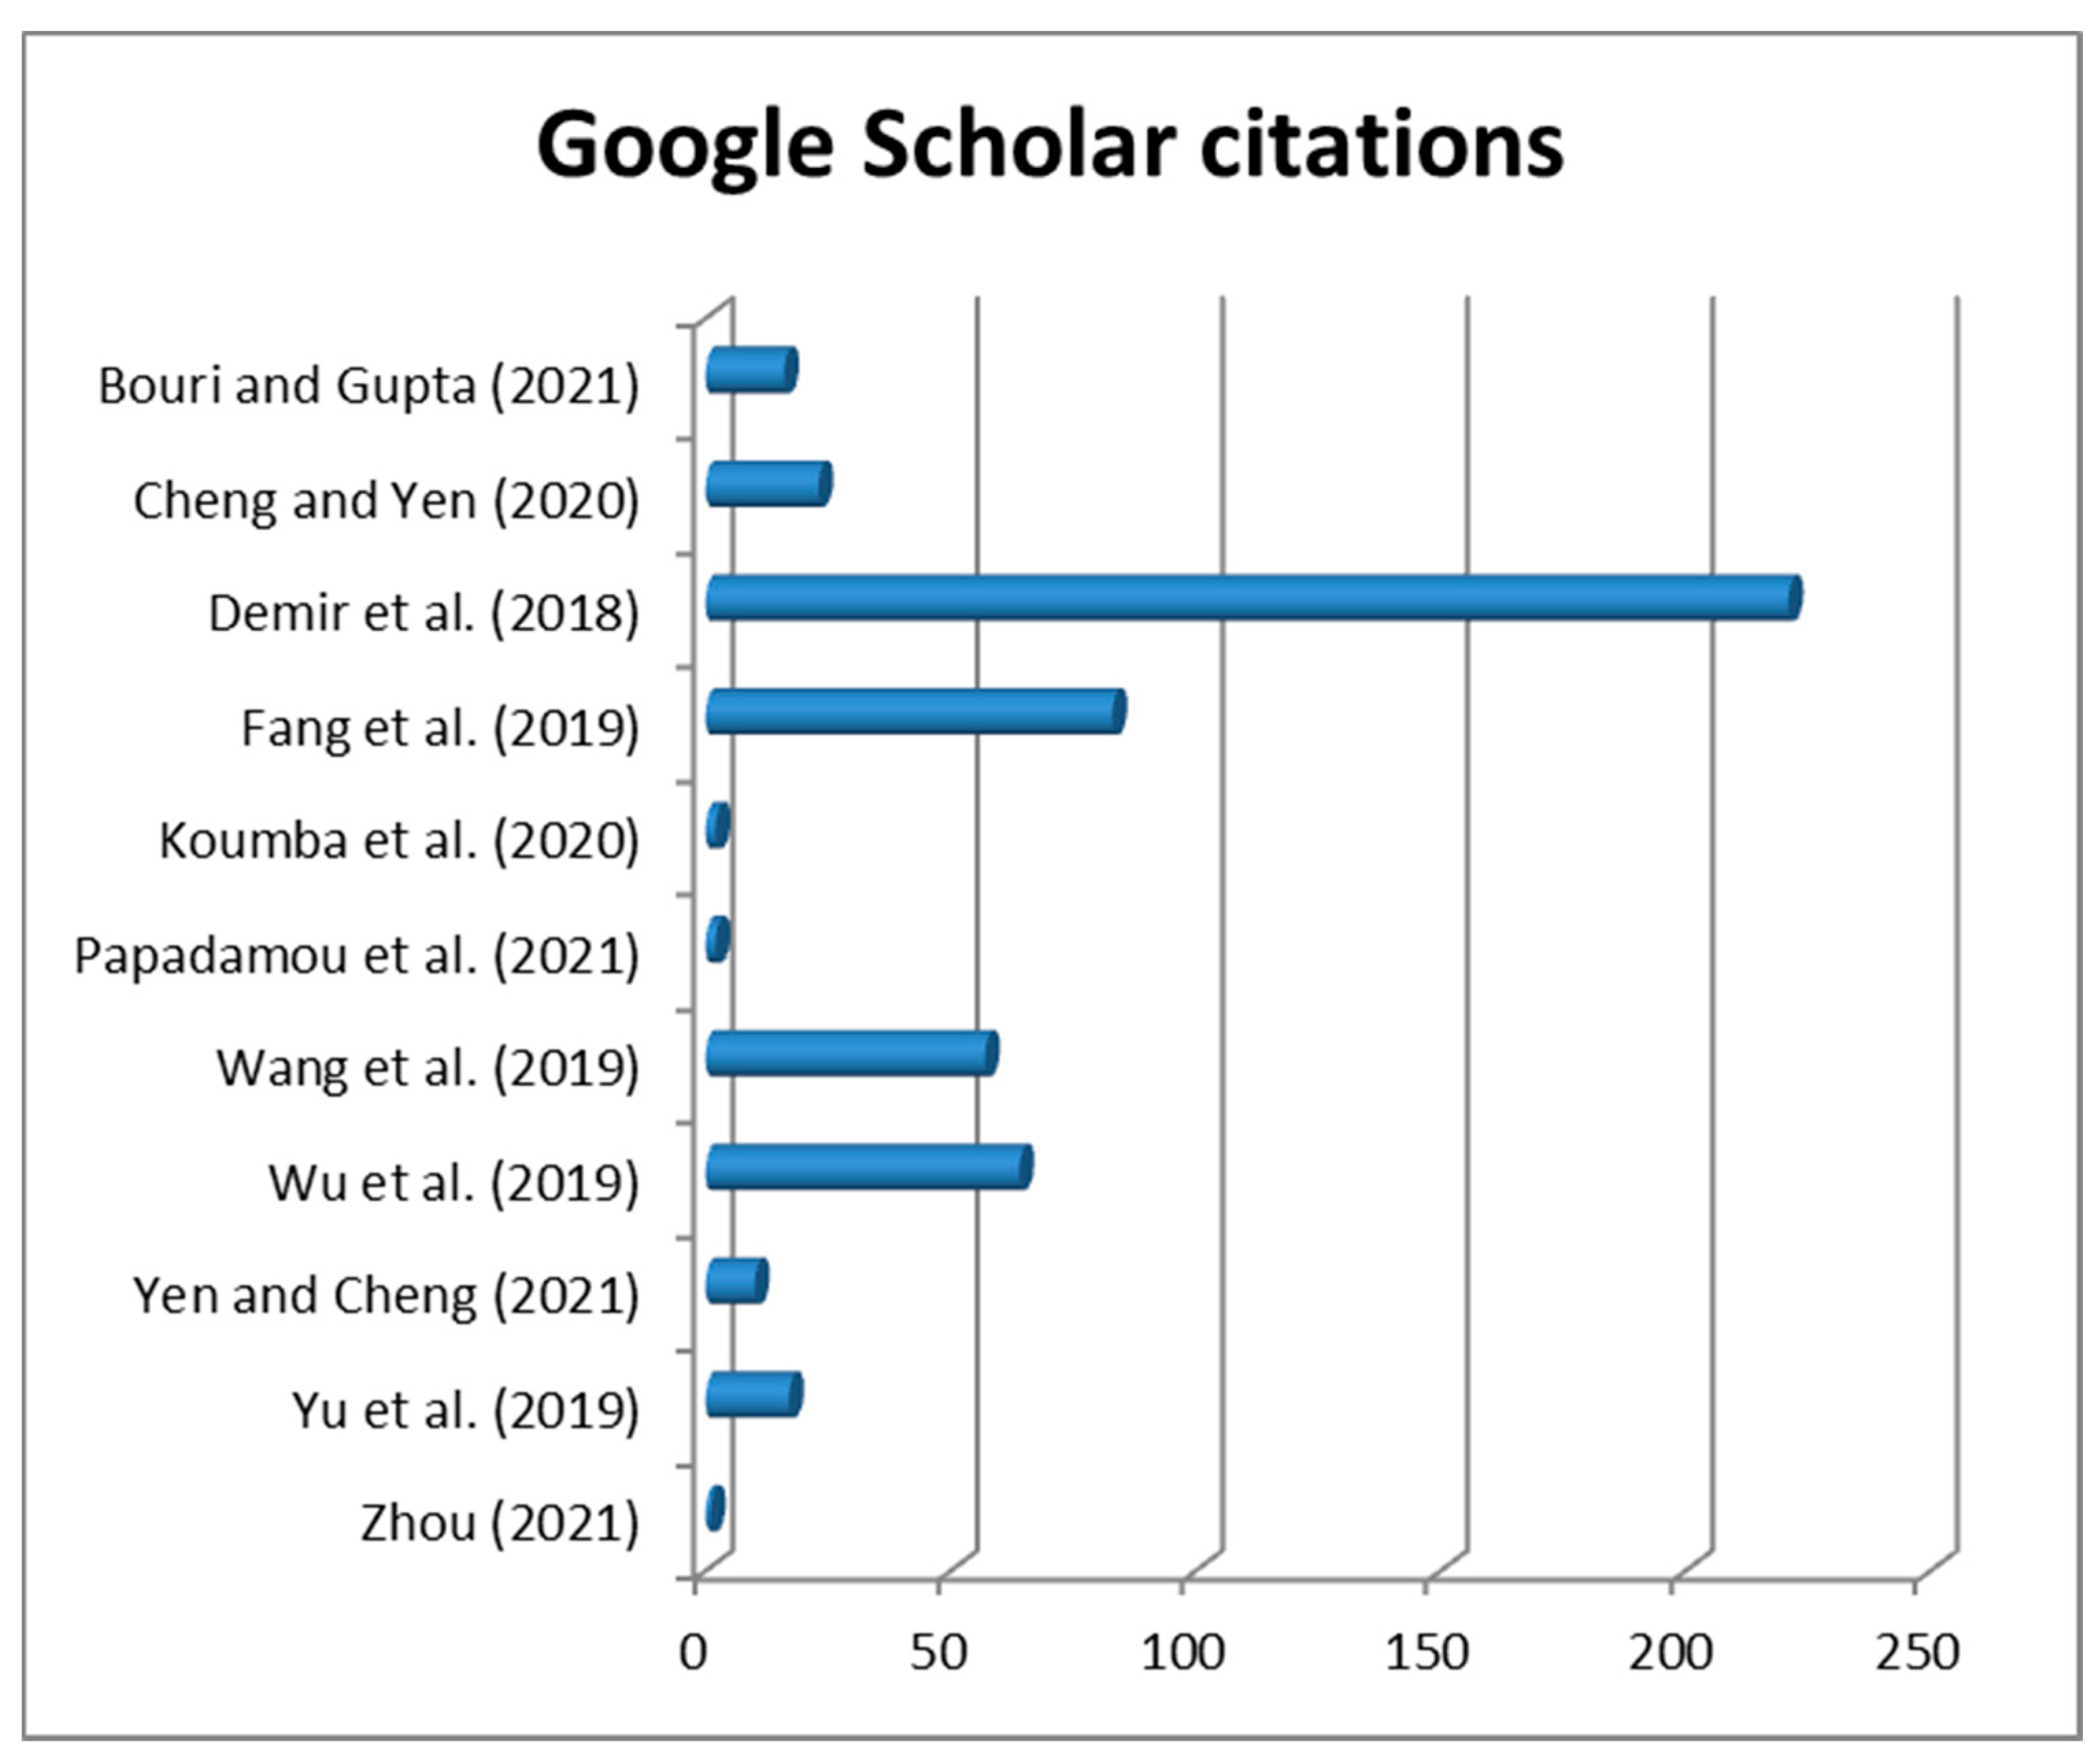
Figure A1.
Google Scholar citations of the studies investigated (as of 21 March 2021).

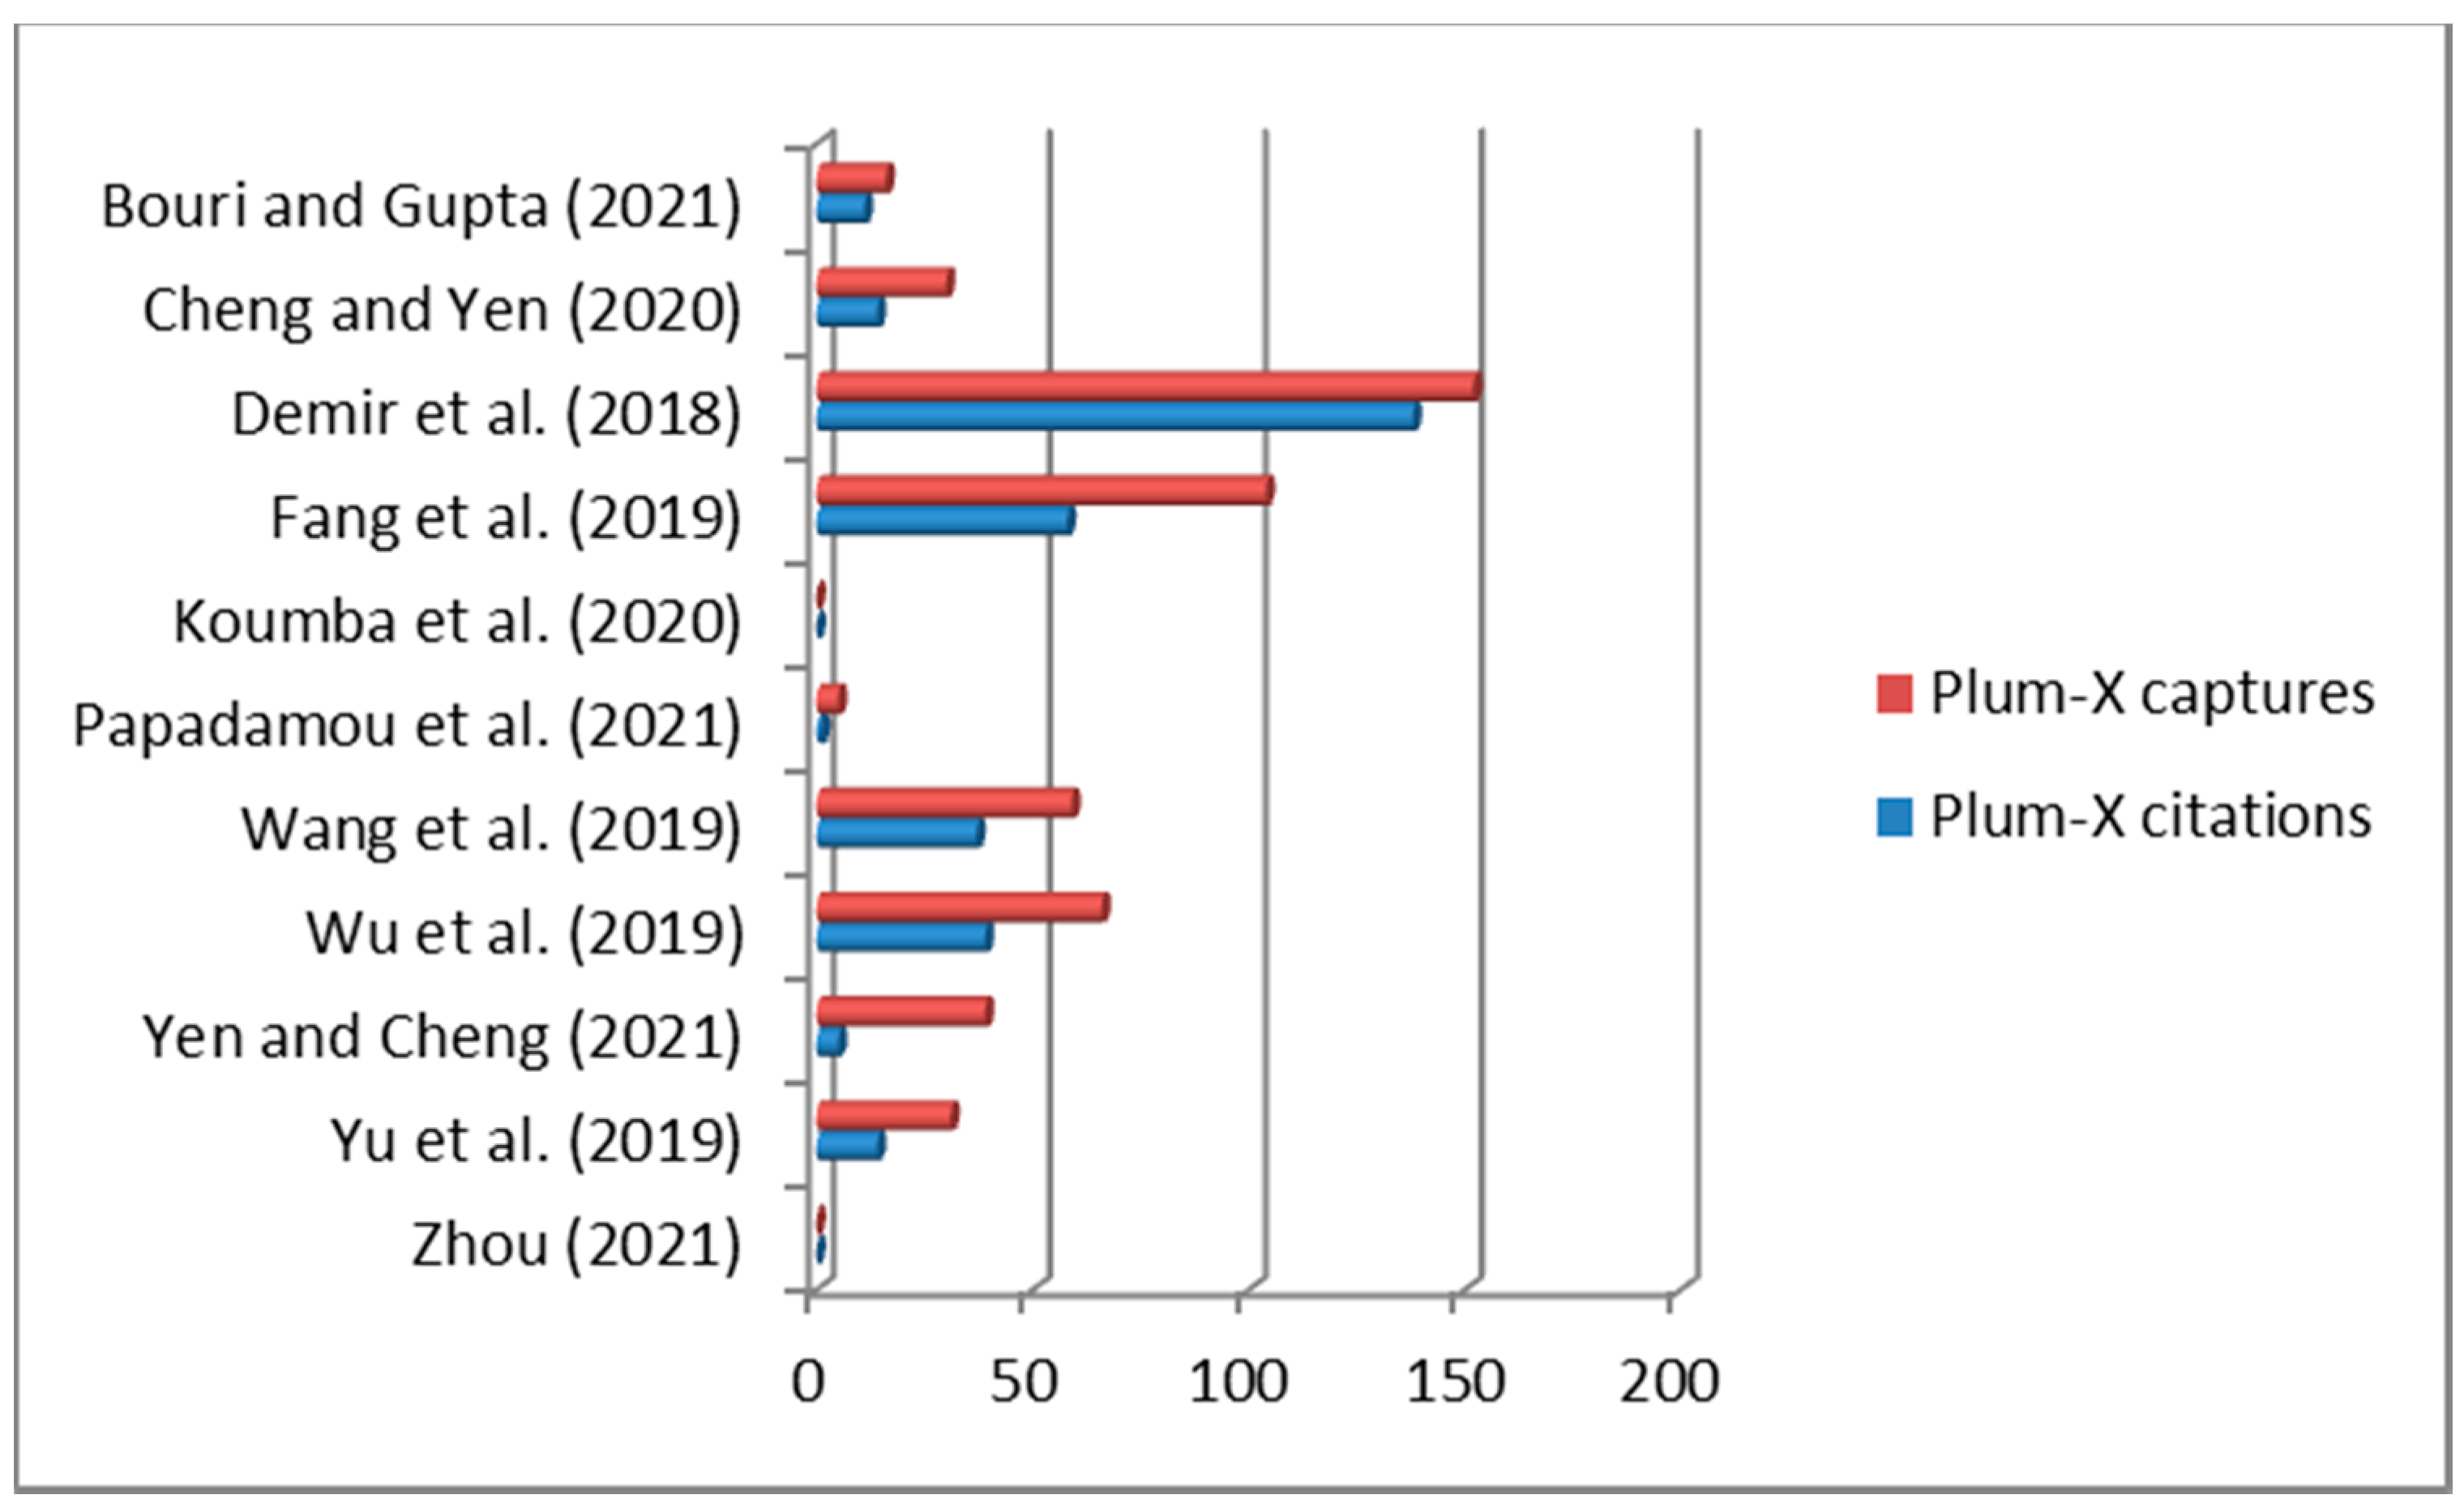
Figure A2.
Plum-X captures and Plum-X citations of the studies investigated (as of 21 March 2021).

Figure A3.
EPU indices of All European countries, Croatia, France, Germany, Greece and Ireland.

Figure A4.
EU indices of Italy, The Netherlands, Russia, Spain, Sweden and the United Kingdom.

Figure A5.
EPU indices of American countries.

Figure A6.
EPU indices of Australia and Asian countries.


References
- Selgin, G. Synthetic commodity money. J. Financ. Stab. 2015, 17, 92–99. [Google Scholar] [CrossRef]
- Baur, D.G.; Hong, K.; Lee, A.D. Bitcoin: Medium of exchange or speculative assets? J. Int. Financ. Mark. Inst. Money 2018, 54, 177–189. [Google Scholar] [CrossRef]
- Dyhrberg, A.H. Bitcoin, gold and the dollar—A GARCH volatility analysis. Financ. Res. Lett. 2016, 16, 85–92. [Google Scholar] [CrossRef] [Green Version]
- Klein, T.; Thu, H.P.; Walther, T. Bitcoin is not the New Gold–A comparison of volatility, correlation, and portfolio performance. Int. Rev. Financ. Anal. 2018, 59, 105–116. [Google Scholar] [CrossRef]
- Yermack, D. Is Bitcoin a real currency? An economic appraisal. In Handbook of Digital Currency; Academic Press: New York, NY, USA, 2015; pp. 31–43. [Google Scholar]
- Corbet, S.; Lucey, B.; Urquhart, A.; Yarovaya, L. Cryptocurrencies as a financial asset: A systematic analysis. Int. Rev. Financ. Anal. 2019, 62, 182–199. [Google Scholar] [CrossRef] [Green Version]
- Kyriazis, Ν.A.; Corbet, S.; Papadamou, S. A Systematic Review of the Bubble Dynamics of Cryptocurrency Prices. SSRN Electron. J. 2020, 101254. [Google Scholar] [CrossRef]
- Kyriazis, N.A. A Survey on Efficiency and Profitable Trading Opportunities in Cryptocurrency Markets. J. Risk Financ. Manag. 2019, 12, 67. [Google Scholar] [CrossRef] [Green Version]
- Beneki, C.; Koulis, A.; Kyriazis, N.A.; Papadamou, S. Investigating volatility transmission and hedging properties between Bitcoin and Ethereum. Res. Int. Bus. Financ. 2019, 48, 219–227. [Google Scholar] [CrossRef]
- Katsiampa, P.; Corbet, S.; Lucey, B. High frequency volatility co-movements in cryptocurrency markets. J. Int. Financ. Mark. Inst. Money 2019, 62, 35–52. [Google Scholar] [CrossRef]
- Kyriazis, N.A. A Survey on Empirical Findings about Spillovers in Cryptocurrency Markets. J. Risk Financ. Manag. 2019, 12, 170. [Google Scholar] [CrossRef] [Green Version]
- Kyriazis Ν, A.; Daskalou, K.; Arampatzis, M.; Prassa, P.; Papaioannou, E. Estimating the volatility of cryptocur-rencies during bearish markets by employing GARCH models. Heliyon 2019, 5, e02239. [Google Scholar] [CrossRef]
- De La O González, M.; Jareño, F.; Skinner, F.S. Nonlinear Autoregressive Distributed Lag Approach: An Application on the Connectedness between Bitcoin Returns and the Other Ten Most Relevant Cryptocurrency Returns. Mathematics 2020, 8, 810. [Google Scholar] [CrossRef]
- Jareño, F.; de la O González, M.; Tolentino, M.; Sierra, K. Bitcoin and gold price returns: A quantile regression and NARDL analysis. Resour. Policy 2020, 67, 101666. [Google Scholar] [CrossRef]
- Vidal-Tomás, D.; Ibáñez, A.M.; Farinós, J.E. Herding in the cryptocurrency market: CSSD and CSAD approaches. Financ. Res. Lett. 2019, 30, 181–186. [Google Scholar] [CrossRef]
- Gurdgiev, C.; O’Loughlin, D. Herding and anchoring in cryptocurrency markets: Investor reaction to fear and uncertainty. J. Behav. Exp. Financ. 2020, 25, 100271. [Google Scholar] [CrossRef]
- Kaiser, L.; Stöckl, S. Cryptocurrencies: Herding and the transfer currency. Financ. Res. Lett. 2020, 33, 101214. [Google Scholar] [CrossRef]
- Kyriazis, N.A. Herding behaviour in digital currency markets: An integrated survey and empirical estimation. Heliyon 2020, 6, e04752. [Google Scholar] [CrossRef]
- Papadamou, S.; Kyriazis, N.A.; Tzeremes, P.G.; Corbet, S. Herding behaviour and price convergence clubs in cryptocurrencies during bull and bear markets. J. Behav. Exp. Financ. 2021, 30, 100469. [Google Scholar] [CrossRef]
- Wang, G.-J.; Xie, C.; Wen, D.; Zhao, L. When Bitcoin meets economic policy uncertainty (EPU): Measuring risk spillover effect from EPU to Bitcoin. Financ. Res. Lett. 2019, 31. [Google Scholar] [CrossRef]
- Cheng, H.-P.; Yen, K.-C. The relationship between the economic policy uncertainty and the cryptocurrency market. Financ. Res. Lett. 2020, 35, 101308. [Google Scholar] [CrossRef]
- Kyriazis, N.A. The Effects of Gold, Stock Markets and Geopolitical Uncertainty on Bitcoin Prices and Volatility. Glob. Econ. J. 2020, 20, 1–15. [Google Scholar] [CrossRef]
- Kyriazis, Ν.A. The effects of geopolitical uncertainty on cryptocurrencies and other financial assets. SN Bus. Econ. 2021, 1, 1–14. [Google Scholar] [CrossRef]
- Papadamou, S.; Kyriazis, N.A.; Tzeremes, P.G. Non-linear causal linkages of EPU and gold with major crypto-currencies during bull and bear markets. N. Am. J. Econ. Financ. 2021, 56, 101343. [Google Scholar] [CrossRef]
- Wei, W.C. Liquidity and market efficiency in cryptocurrencies. Econ. Lett. 2018, 168, 21–24. [Google Scholar] [CrossRef]
- Kyriazis, Ν.A.; Prassa, P. Which Cryptocurrencies Are Mostly Traded in Distressed Times? J. Risk Financ. Manag. 2019, 12, 135. [Google Scholar] [CrossRef] [Green Version]
- Brauneis, A.; Mestel, R.; Riordan, R.; Theissen, E. How to measure the liquidity of cryptocurrency markets? J. Bank. Financ. 2021, 124, 106041. [Google Scholar] [CrossRef]
- Baker, S.R.; Bloom, N.; Davis, S.J. Measuring economic policy uncertainty. Q. J. Econ. 2016, 131, 1593–1636. [Google Scholar] [CrossRef]
- Papadamou, S.; Kyriazis, Ν.A.; Tzeremes, P.G. Unconventional monetary policy effects on output and inflation: A meta-analysis. Int. Rev. Financ. Anal. 2019, 61, 295–305. [Google Scholar] [CrossRef]
- Papadamou, S.; Siriopoulos, C.; Kyriazis, N.A. A survey of empirical findings on unconventional central bank policies. J. Econ. Stud. 2020, 47, 1533–1577. [Google Scholar] [CrossRef]
- Kyriazis, N.A. Is Bitcoin Similar to Gold? An Integrated Overview of Empirical Findings. J. Risk Financ. Manag. 2020, 13, 88. [Google Scholar] [CrossRef]
- Kyriazis, N.A. Trade Policy Uncertainty Effects on Macro Economy and Financial Markets: An Integrated Survey and Empirical Investigation. J. Risk Financ. Manag. 2021, 14, 41. [Google Scholar] [CrossRef]
- Fassas, A.P.; Siriopoulos, C. Implied volatility indices–A review. Q. Rev. Econ. Financ. 2021, 79, 303–329. [Google Scholar] [CrossRef]
- Bouri, E.; Gupta, R. Predicting Bitcoin returns: Comparing the roles of newspaper- and internet search-based measures of uncertainty. Financ. Res. Lett. 2021, 38, 101398. [Google Scholar] [CrossRef] [Green Version]
- Yu, M.; Gao, R.; Su, X.; Jin, X.; Zhang, H.; Song, J. Forecasting Bitcoin volatility: The role of leverage effect and uncertainty. Phys. A Stat. Mech. Its Appl. 2019, 533, 120707. [Google Scholar] [CrossRef]
- Engle, R.F.; Manganelli, S. CAViaR: Conditional autoregressive value at risk by regression quantiles. J. Bus. Econ. Stat. 2004, 22, 367–381. [Google Scholar] [CrossRef]
- Hong, Y.; Liu, Y.; Wang, S. Granger causality in risk and detection of extreme risk spillover between financial markets. J. Econ. 2009, 150, 271–287. [Google Scholar] [CrossRef] [Green Version]
- Andersen, T.G.; Bollerslev, T. Answering the Skeptics: Yes, Standard Volatility Models do Provide Accurate Forecasts. Int. Econ. Rev. 1998, 39, 885. [Google Scholar] [CrossRef]
- Müller, U.A.; Dacorogna, M.M.; Davé, R.D.; Olsen, R.B.; Pictet, O.V.; von Weizsäcker, J.E. Volatilities of different time resolutions—Analyzing the dynamics of market components. J. Empir. Financ. 1997, 4, 213–239. [Google Scholar] [CrossRef]
- Hansen, P.R.; Lunde, A.; Nason, J.M. The model confidence set. Econometrica 2011, 79, 453–497. [Google Scholar] [CrossRef] [Green Version]
- Demir, E.; Gozgor, G.; Lau, C.K.M.; Vigne, S.A. Does economic policy uncertainty predict the Bitcoin returns? An empirical investigation. Financ. Res. Lett. 2018, 26, 145–149. [Google Scholar] [CrossRef] [Green Version]
- Yen, K.-C.; Cheng, H.-P. Economic policy uncertainty and cryptocurrency volatility. Finance Res. Lett. 2021, 38, 101428. [Google Scholar] [CrossRef]
- Koumba, U.; Mudzingiri, C.; Mba, J. Does uncertainty predict cryptocurrency returns? A copula-based approach. Macroecon. Financ. Emerg. Mark. Econ. 2020, 13, 67–88. [Google Scholar] [CrossRef]
- Wang, Y.H.; Yen, K.C. The information content of the implied volatility term structure on future returns. Eur. Financ. Manag. 2019, 25, 380–406. [Google Scholar] [CrossRef]
- Balcilar, M.; Bekiros, S.D.; Gupta, R. The role of news-based uncertainty indices in predicting oil markets: A hybrid nonparametric quantile causality method. Empir. Econ. 2017, 53, 879–889. [Google Scholar] [CrossRef] [Green Version]
- Wu, S.; Tong, M.; Yang, Z.; Derbali, A. Does gold or Bitcoin hedge economic policy uncertainty? Financ. Res. Lett. 2019, 31, 171–178. [Google Scholar] [CrossRef]
- Zhou, S. Exploring the driving forces of the Bitcoin currency exchange rate dynamics: An EGARCH approach. Empir. Econ. 2021, 60, 557–606. [Google Scholar] [CrossRef]
- Fang, L.; Bouri, E.; Gupta, R.; Roubaud, D. Does global economic uncertainty matter for the volatility and hedging effectiveness of Bitcoin? Int. Rev. Financ. Anal. 2019, 61, 29–36. [Google Scholar] [CrossRef]
- Ma, Y.-R.; Zhang, D.; Ji, Q.; Pan, J. Spillovers between oil and stock returns in the US energy sector: Does idiosyncratic information matter? Energy Econ. 2019, 81, 536–544. [Google Scholar] [CrossRef]
- Al-Yahyaee, K.H.; Mensi, W.; Al-Jarrah, I.M.W.; Hamdi, A.; Kang, S.H. Volatility forecasting, downside risk, and diversification benefits of Bitcoin and oil and international commodity markets: A comparative analysis with yellow metal. N. Am. J. Econ. Financ. 2019, 49, 104–120. [Google Scholar] [CrossRef]
- Bekaert, G.; Hoerova, M. The VIX, the variance premium and stock market volatility. J. Econom. 2014, 183, 181–192. [Google Scholar] [CrossRef] [Green Version]
- Yi, S.; Xu, Z.; Wang, G.J. Volatility connectedness in the cryptocurrency market: Is Bitcoin a dominant cryptocur-rency? Int. Rev. Financ. Anal. 2018, 60, 98–114. [Google Scholar] [CrossRef]
- Engle, R.F. Autoregressive Conditional Heteroscedasticity with Estimates of the Variance of United Kingdom Inflation. Econ. 1982, 50, 987. [Google Scholar] [CrossRef]
- Bollerslev, T. Generalized autoregressive conditional heteroskedasticity. J. Econ. 1986, 31, 307–327. [Google Scholar] [CrossRef] [Green Version]
- Zakoian, J.-M. Threshold heteroskedastic models. J. Econ. Dyn. Control. 1994, 18, 931–955. [Google Scholar] [CrossRef]
- Capie, F.; Mills, T.C.; Wood, G. Gold as a hedge against the dollar. J. Int. Financ. Mark. Inst. Money 2005, 15, 343–352. [Google Scholar] [CrossRef]
- Higgins, M.L.; Bera, A.K. A Class of Nonlinear Arch Models. Int. Econ. Rev. 1992, 33, 137. [Google Scholar] [CrossRef]
- Akaike, H. A new look at the statistical model identification. IEEE Trans. Autom. Control 1974, 19, 716–723. [Google Scholar] [CrossRef]
- Schwarz, G. Estimating the Dimension of a Model. Ann. Stat. 1978, 6, 461–464. [Google Scholar] [CrossRef]
- Das, D.; Le Roux, C.L.; Jana, R.; Dutta, A. Does Bitcoin hedge crude oil implied volatility and structural shocks? A comparison with gold, commodity and the US Dollar. Financ. Res. Lett. 2020, 36, 101335. [Google Scholar] [CrossRef]
- Al-Yahyaee, K.H.; Rehman, M.U.; Mensi, W.; Al-Jarrah, I.M.W. Can uncertainty indices predict Bitcoin prices? A revisited analysis using partial and multivariate wavelet approaches. N. Am. J. Econ. Financ. 2019, 49, 47–56. [Google Scholar] [CrossRef]
- Nelson, D.B. Conditional Heteroskedasticity in Asset Returns: A New Approach. Econometrica 1991, 59, 347. [Google Scholar] [CrossRef]
- Ahelegbey, D.F.; Billio, M.; Casarin, R. Bayesian graphical models for structural vector autoregressive processes. J. Appl. Econom. 2016, 31, 357–386. [Google Scholar] [CrossRef] [Green Version]
- Sim, N.; Zhou, H. Oil prices, US stock return, and the dependence between their quantiles. J. Bank. Financ. 2015, 55, 1–8. [Google Scholar] [CrossRef]
- Engle, R.F.; Ghysels, E.; Sohn, B. Stock Market Volatility and Macroeconomic Fundamentals. Rev. Econ. Stat. 2013, 95, 776–797. [Google Scholar] [CrossRef]
- Colacito, R.; Engle, R.F.; Ghysels, E. A component model for dynamic correlations. J. Econ. 2011, 164, 45–59. [Google Scholar] [CrossRef] [Green Version]
- White, H.; Kim, T.H.; Manganelli, S. VAR for VaR: Measuring tail dependence using multivariate regression quan-tiles. J. Econom. 2015, 187, 169–188. [Google Scholar] [CrossRef] [Green Version]
Figure 1.
Economic Policy Uncertainty index in a worldwide level.

Figure 2.
Graphs of the US Daily News index, major crytpocurrencies, WTI Oil and the VIX volatility index.
Figure 2.
Graphs of the US Daily News index, major crytpocurrencies, WTI Oil and the VIX volatility index.


Table 1.
Descriptive statistics of variables.
| Variables | Mean | Std. Dev. | Min | Max | Skewness | Kurtosis | JB |
|---|---|---|---|---|---|---|---|
| US_EPU | 134.657 | 116.9531 | 10.92 | 807.66 | 2.403 | 9.126 | 2369.167 (0.000) *** |
| Bitcoin | 6876.104 | 3380.153 | 778.58 | 18934 | 0.126 | 2.87 | 3.133 (0.209) |
| Ethereum | 283.1728 | 217.9626 | 9.67 | 1283.7 | 1.764 | 6.429 | 946.167 (0.000) *** |
| Litecoin | 69.89341 | 53.04969 | 3.69 | 359.4 | 2.041 | 8.504 | 1834.846 (0.000) *** |
| WTI_Oil | 51.76523 | 15.39278 | 7.79 | 76.39 | −1.248 | 4.01 | 283.205 (0.000) *** |
| VIX | 17.56415 | 9.666426 | 9.14 | 82.69 | 2.866 | 13.997 | 6010.341 (0.000) *** |
Note: *, **, and *** represent statistical significance at the 90%, 95%, and 99% confidence levels, respectively.
Table 2.
Correlation matrix.
| US_EPU | Bitcoin | Ethereum | Litecoin | WTI_Oil | VIX | |
|---|---|---|---|---|---|---|
| US_EPU | 1.0000 | |||||
| Bitcoin | 0.1744 | 1.0000 | ||||
| Ethereum | −0.1315 | 0.5796 | 1.0000 | |||
| Litecoin | −0.1924 | 0.6856 | 0.8480 | 1.0000 | ||
| WTI_Oil | −0.7762 | −0.0716 | 0.2572 | 0.3503 | 1.0000 | |
| VIX | 0.7204 | 0.1826 | −0.1009 | −0.1284 | −0.6106 | 1.0000 |
Table 3.
Econometric outcomes about the impacts of US Daily News index, WTI Oil and the VIX volatility index on Bitcoin returns.
Table 3.
Econometric outcomes about the impacts of US Daily News index, WTI Oil and the VIX volatility index on Bitcoin returns.
| Threshold ARCH | Simple Asymmetric ARCH | Non-Linear ARCH | ||
|---|---|---|---|---|
| Mean equation | US_EPU | 0.0008 (0.806) | 0.0008 (0.817) | 0.0008 (0.816) |
| Oil | 0.0904 (0.063) * | 0.0768 (0.141) | 0.0767 (0.141) | |
| VIX | −0.0824 (0.000) *** | −0.0834 (0.000) *** | −0.0834 (0.000) *** | |
| constant | 0.0022 (0.183) | 0.0025 (0.158) | 0.0025 (0.157) | |
| Variance equation | Arch | 0.0975 (0.001) *** | ||
| Abarch | 0.0985 (0.002) *** | |||
| Atarch | 0.0417 (0.319) | |||
| Saarch | 0.0032 (0.154) | |||
| Narch | 0.0974 (0.001) *** | |||
| Narch_k | −0.0168 (0.134) | |||
| constant | 0.0464 (0.000) *** | 0.0023 (0.000) *** | 0.0023 (0.000) *** | |
| AIC | −2933.54 | −2933.762 | −2933.782 | |
| BIC | −2899.633 | −2899.856 | −2899.876 |
Note: *, **, and *** represent statistical significance at the 90%, 95%, and 99% confidence levels, respectively.
Table 4.
Econometric outcomes about the impacts of US Daily News index, Bitcoin, WTI Oil and the VIX volatility index on Ethereum returns.
Table 4.
Econometric outcomes about the impacts of US Daily News index, Bitcoin, WTI Oil and the VIX volatility index on Ethereum returns.
| Threshold ARCH | Simple Asymmetric ARCH | Non-Linear ARCH | ||
|---|---|---|---|---|
| Mean equation | US_EPU | −0.0008 (0.572) | 0.0015 (0.407) | 0.0015 (0.406) |
| Bitcoin | 1.0022 (0.000) *** | 0.9734 (0.000) *** | 0.9735 (0.000) *** | |
| Oil | 0.0332 (0.159) | 0.0738 (0.027) ** | 0.0738 (0.027) ** | |
| VIX | −0.0444 (0.000) *** | −0.0502 (0.001) *** | −0.0503 (0.001) *** | |
| constant | −0.0027 (0.015) ** | −0.0003 (0.852) | −0.0003 (0.846) | |
| Variance equation | Arch | 0.9307 (0.000) *** | ||
| Abarch | 0.5306 (0.000) *** | |||
| Atarch | 0.0967 (0.029) ** | |||
| Saarch | 0.0045 (0.138) | |||
| Narch | 0.9319 (0.000) *** | |||
| Narch_k | −0.0024 (0.151) | |||
| constant | 0.0321 (0.000) *** | 0.0013 (0.000) *** | 0.0013 (0.000) *** | |
| AIC | −3062.124 | −3051.328 | −3051.506 | |
| BIC | −3023.374 | −3012.578 | −3012.756 |
Note: *, **, and *** represent statistical significance at the 90%, 95%, and 99% confidence levels, respectively.
Table 5.
Econometric outcomes about the impacts of US Daily News index, Bitcoin, WTI Oil and the VIX volatility index on Litecoin returns.
Table 5.
Econometric outcomes about the impacts of US Daily News index, Bitcoin, WTI Oil and the VIX volatility index on Litecoin returns.
| Threshold ARCH | Simple Asymmetric ARCH | Non-Linear ARCH | ||
|---|---|---|---|---|
| Mean equation | US_EPU | 0.0081 (0.000) *** | 0.006 (0.02) ** | 0.006 (0.02) ** |
| Bitcoin | 1.0523 (0.000) *** | 1.02 (0.000) *** | 1.02 (0.000) *** | |
| Oil | −0.0199 (0.518) | −0.0007 (0.986) | −0.0006 (0.987) | |
| VIX | −0.014 (0.113) | −0.0058 (0.517) | −0.0058 (0.517) | |
| constant | −0.0026 (0.021) ** | −0.0026 (0.133) | −0.0025 (0.136) | |
| Variance equation | Arch | 0.9369 (0.000) *** | ||
| Abarch | 0.4859 (0.000) *** | |||
| Atarch | 0.2984 (0.000) *** | |||
| Saarch | 0.0216 (0.000) *** | |||
| Narch | 0.9356 (0.000) *** | |||
| Narch_k | −0.0116 (0.000) *** | |||
| constant | 0.0325 (0.000) *** | 0.0015 (0.000) *** | 0.0014 (0.000) *** | |
| AIC | −2956.65 | −2934.744 | −2934.7 | |
| BIC | −2917.9 | −2895.994 | −2895.95 |
Note: *, **, and *** represent statistical significance at the 90%, 95%, and 99% confidence levels, respectively.
Table 6.
Studies focusing only on the nexus between Cryptocurrencies and EPU.
| Authors | Variables | Frequency | Source | Data Period | Methodology | Findings |
|---|---|---|---|---|---|---|
| Bouri and Gupta [34] | Bitcoin returns EPU EURQ | Monthly | www.cruptocompare.com | July 2010–May 2019 | Exponential GARCH as in [62] | The intensity of individual measures on the internet is a better measure of uncertainty than uncertainty based on newspaper articles |
| Cheng and Yen [21] | Bitcoin Ethereum Ripple Litecoin China EPU US EPU Japan EPU Korea EPU | Monthly | Coinmarketcap.com www.policyuncertainty.com | February 2014–June 2019 September 2015–June 2019 (concerning Ethereum) | Regression with dummies | China EPU better predicts cryptocurrency returns whereas US EPU, Japan EPU and Korea EPU cannot |
| Demir et al. [41] | Bitcoin EPU index | Daily | www.coindesk.com www.policyuncertainty.com | 18 July 2010–15 November 2017 | Bayesian Graphical Structural Vector Autoregressive (BGSVAR) model of [63] Ordinary Least Squares (OLS) Quantile-on-Quantile (QQ) methodology of [64] | EPU present predictive power over Bitcoin returns and there is negative nexus between Bitcoin and EPU Bitcoin can be used as a hedge against uncertainty but not at the higher quantiles |
| Fang et al. [48] | Global Economic Policy Uncertainty (GEPU) CoinDesk Bitcoin Price Index MSCI World Stock Index S&P GSCI Commodity Index PIMCO Investment-Grade Corporate Bonds Index | Daily Monthly | www.policyuncertainty.com Coindesk.com DataStream | 21 September 2010–26 January 2018 | GARCH- MIDAS model proposed by [65] DCC-MIDAS model of [66] | The EPU index displays positive impacts on the hedging capabilities of Bitcoin against global equities and global bonds |
| Koumba et al. [43] | Bitcoin Ethereum Ripple EPU index Volatility Index (VIX) | Daily | www.coingecko.com www.policyuncertainty.com www.cboe.com | 10 August 2016- 23 February 2018 | D-vine pair copula method | Cryptocurrency prices are correlate with VIX and especially with EPU in a positive manner Ethereum displays significant correlations and better returns than Bitcoin and Ripple, so is preferable as a hedger against uncertainty |
| Papadamou et al. [24] | US EPU Gold Bitcoin Ethereum Tether Litecoin Monero Dash Ethereum Classic Ripple Zcash Factom MaidSafeCoin Dogecoin Augur NEM Stellar Lumens BitShares Lisk GameCredits Nxt Steem Siacoin Stratis Peercoin Waves EDRcoin Ardor Potcoin Syscoin Golem HyperSpace | Daily | www.policyuncertainty.com Coinmarketcap.com Datastream | 1 December 2017–18 December 2017 19 December 2017–13 September 2019 | Non-linear Granger causality as in [45] | Strong connection between EPU and half of the cryptocurrencies during bull markets and with even more of them during bear markets. Causality-in-variance is significant in all but the higher quantiles in both bull and bear eriods. |
| Wang et al. [20] | US EPU US EMU Bitcoin VIX index | Daily Weekly | www.policyuncertainty.com Yahoo Finance www.coindesk.com | 18 July 2010–31 May 2018 | MVQM- CAViaR model based on [36,67]. Granger causality risk test of [37] | Downside and upside risk spillover impacts from uncertainty indices to Bitcoin are statistically non-significant |
| Wu et al. [46] | US EPU Bitcoin (in USD) Gold | Daily | Investing.com www.policyuncertainty.com | 2 February 2012–31 December 2018 | GARCH with dummy variables Quantile regression with dummy variables | Bitcoin is responsive to EPU shocks. During bull or bear markets Bitcoin can serve as a weak safe haven against EPU |
| Yen and Cheng (2021) [42] | China EPU US EPU Japan EPU Korea EPU Bitcoin Litecoin Ripple | Daily | Coinmarkecap.com | February 2014–June 2019 | Regression based on thestochastic volatility model of [44] | Negative linkages between EPU and the future volatility of Bitcoin. China EPU is very important for determining cryptocurrency volatility in Bitcoin and Litecoin |
| Yu et al. [35] | EPU Bitcoin (price and volume) | 5-min frequency | Bitcoincharts.com | 1 March 2003–30 September 2018 | Realized volatility model by [38] Heterogeneous ARCH specifications (HAR-RV and HAR-GJ) by [39] | EPU does not affect the future volatility during in-sample period |
| Zhou [47] | EPU Gold Global VIX index S&P Global 1200 MSCIWorld MSCI Emerging Market Hash rate (HR) Number of transactions Miners’ revenue in BTC Trading volume in BTC Amihud’s illiquidity measure | Daily | www.policyuncertainty.com www.blockchain.com Datastream | 16 March 2011–21 June 2018 | Exponential GARCH based on [62] Event analysis | Non-linear linkage between Bitcoin volatility and global uncertainty. During normal conditions Bitcoin a hedge whereas during stressed periods is positively connected with stock markets. Bitcoin’s safe haven capabilities are certain only with great economic uncertainty. |
Publisher’s Note: MDPI stays neutral with regard to jurisdictional claims in published maps and institutional affiliations. |
© 2021 by the author. Licensee MDPI, Basel, Switzerland. This article is an open access article distributed under the terms and conditions of the Creative Commons Attribution (CC BY) license (https://creativecommons.org/licenses/by/4.0/).
Share and Cite
MDPI and ACS Style
Kyriazis, N.A. The Nexus of Sophisticated Digital Assets with Economic Policy Uncertainty: A Survey of Empirical Findings and an Empirical Investigation. Sustainability 2021, 13, 5383. https://0-doi-org.brum.beds.ac.uk/10.3390/su13105383
AMA Style
Kyriazis NA. The Nexus of Sophisticated Digital Assets with Economic Policy Uncertainty: A Survey of Empirical Findings and an Empirical Investigation. Sustainability. 2021; 13(10):5383. https://0-doi-org.brum.beds.ac.uk/10.3390/su13105383
Chicago/Turabian StyleKyriazis, Nikolaos A. 2021. "The Nexus of Sophisticated Digital Assets with Economic Policy Uncertainty: A Survey of Empirical Findings and an Empirical Investigation" Sustainability 13, no. 10: 5383. https://0-doi-org.brum.beds.ac.uk/10.3390/su13105383
Note that from the first issue of 2016, this journal uses article numbers instead of page numbers. See further details here.