
Identifying Project Corporate Behavioral Risks to Support Long-Term Sustainable Cooperative Partnerships


1
Department of Industrial Engineering, University of Beira Interior, 6201-001 Covilhã, Portugal
2
Department of Mechanical Engineering, Polytechnic Institute of Lisbon, 1959-007 Lisbon, Portugal
3
Center of Technology and Systems, CTS Uninova, 2829-516 Caparica, Portugal
4
Department of Informatic Engineering, University of Trás-os-Montes and Alto Douro (UTAD), 5000-801 Vila Real, Portugal
*
Authors to whom correspondence should be addressed.
Sustainability 2021, 13(11), 6347; https://0-doi-org.brum.beds.ac.uk/10.3390/su13116347
Submission received: 27 April 2021
/
Revised: 21 May 2021
/
Accepted: 31 May 2021
/
Published: 3 June 2021
(This article belongs to the Collection Project Risk Assessment and Corporate Behavior: Creating Knowledge for Sustainable Business)
Abstract
:Projects are considered crucial building blocks whereby organizations execute and implement their short-, mid-, and long-term strategic visions. Projects are thought, developed, and implemented to solve problems, drive change, satisfy unique needs, add value, and exploit opportunities, just to name a few objectives. Although existing project management tools and techniques aim to deliver projects with success, according to the latest reviewed literature, projects still keep failing at an impressive pace. Among the extensive list of factors that may threaten project success, several articles from the research literature place particular importance on a still underexplored factor that may strongly lead to unsuccessful project delivery. This factor—usually known as corporate behavioral risks—usually emerges and evolves as organizations work together to deliver projects across a bounded period of time, and is characterized by the mix of formal and informal dynamic interactions between the different stakeholders that constitute the different organizations. Furthermore, several articles from the research literature also point out the lack of proper models to efficiently manage corporate behavioral risks as one of the major factors that may lead to projects failing. To efficiently identify and measure how such corporate behaviors may contribute to a project’s outcomes (success or failure), a heuristic model is proposed in this work, developed based on four fundamental fields ((1) project management, (2) risk management, (3) corporate behavior, and (4) social network analysis), to quantitatively analyze four critical project social networks ((1) communication, (2) problem-solving, (3) advice, and (4) trust), by applying the theory of social network analysis (SNA). The proposed model in this work is supported with a case study to illustrate its implementation and application across a project lifecycle, and how organizations can benefit from its application.
1. Introduction
Projects have been around since humans have inhabited the planet earth [1]; consequently, project management has as well [1]. Although there is very little documentation regarding how projects such as the Great Wall of China, the Great Pyramid of Giza, the Coliseum, or the Hanging Gardens of Babylon—just to name a few—have been managed, after the mid-1950s organizations began to apply systematic tools and techniques to manage complex projects [1].
A project can be defined as a temporary endeavor undertaken to create a unique product, result, or service, and it is usually managed by the project management standards scientific field, which can be defined as a set of tools, techniques, skills, and knowledge that are applied to project tasks and activities to meet project requirements across the different phases of a given project lifecycle [1,2,3,4].
Some authors argue that from the 1900s initiated the so-called modern project management era, which is essentially characterized by the introduction of innovative tools and techniques such as Gant Charts, the Critical Path Method, the PERT technique, the PRINCE model, the CCPM model, the PMBOK book of knowledge, and the Agile methodologies—just to name a few—to efficiently plan and execute projects [1,2,3,4]. For example, the Gant Charts—developed by Henry Gant (1861–1919)—are used to break large projects into smaller manageable activities and tasks and explicitly illustrate the dependency of some tasks on each other across a project lifecycle [2,4]. The Critical Path Method (also known as CPM)—developed by the E.I du Pont de Nemours Company in the 1950s— is used to accurately estimate the cost and time of a project. The Program Evaluation Review Technique (also known as PERT)—developed by the US Navy in the 1950s—is used to visualize the different scheduling scenarios of a project. The Projects in Controlled Environments method (also known as PRINCE)—developed by the UK Government in the late 1980s—is used to manage information systems projects. The Critical Chain Project Management method (also known as the CCPM method)—developed by Israelis Eliyahu M. Goldrat in the 1990s—is used as an alternative to the PRINCE method. The Project Management Body of Knowledge (also known as PMBOK)—developed by the Project Management Institute (PMI) in the late 1990s—is used to manage physical projects of all sizes and complexities. The Agile manifesto—developed by software developers in USA in the late 1990s—is used as an alternative to one of the most used methods of managing physical and software projects, the waterfall method (also known as the stage gate model), to better meet changing project needs.
Despite the large number of existing methods, methodologies, tools, and techniques developed to manage projects, according to the latest research [5,6,7,8,9], projects still keep failing at an impressive rate. According to the latest research, only about 29% of all delivered projects were delivered successfully [7,8]. Among the multiple factors that potentially threaten the successful delivery of a project—such as poor communication, inaccurate project requirements, unskilled project team, lack or inexistence of effective stakeholder management, just to name a few—one factor has been arousing particular interest among the project management scientific community’s researchers and practitioners. This factor concerns the different project stakeholders’ dynamic interactions (also known as dynamic behaviors [10]) that emerge and evolve across the different phases of a project lifecycle, and the impact that such dynamic interactions—characterized by a mix of formal and informal relationships—may have on a project’s outcome [6,10,11,12]. In fact, several studies argue that more important than individual competencies, training, and skills is the way that the different project stakeholders collaborate (dynamically interact within the mix of formal and informal relationships) across a project lifecycle, which dictates how successful or unsuccessful a project will be [13,14,15].
Although several studies show that it is not very clear to distinguish formal from informal organizational networks of relationships [16,17], if they are not identified in a timely way and efficiently managed (particularly the informal organizational networks), they may either evolve to two different collaborative extremes: (1) a collaborative overload status, or (2) a lacking or nonexistent collaborative status [18]. Whichever the extreme they evolve to (either (1) or (2), as mentioned before), such organizational networks of relationships may strongly threaten or boost the successful delivery of a project, being thus characterized as project corporate behavioral risks. According to [12], project corporate risks can be delayered into four different types. These are: (1) critical enterprise risks (risks associated with project stakeholders who have exclusive competencies, know-how, or resources), (2) resource allocation risks (risks associated with the distribution of project tasks and activities throughout the different project stakeholders), (3) managerial risks (risks related to the authority, structure, and level of communication within the project stakeholder collaborative network), and finally (4) behavioral risks (risks that derive from the mix of myriad formal and informal dynamic interactions between different project stakeholders, across the different phases of a project lifecycle).
Understanding the extent to which corporate behavioral risks influence a project’s outcomes is of high importance for organizations and society in general, and can be explained in two dimensions. (1) It is a driver of sustainable business because it enables organizations that deliver projects (among other things) to increase the chances of project success, by enabling the development and implementation of effective, appropriate, and timely corrective/supportive measures for a project’s tasks and activities. (2) It generates unique, valuable, and actionable knowledge regarding the emergence and evolution of cooperative risks, contributing thus to the scientific community in the organizational field, to society in general, and to the development of new theories and approaches for how to efficiently and properly manage behavioral project risks across a project lifecycle [10,14,19].
Research in sociology and project management shows that the only effective way to understand how such dynamic interactions between the different stakeholders across a period emerge, evolve, and eventually continue or disappear is by the application of social network analysis (SNA) tools and techniques [10,14,20,21,22]. The reason behind this is that contrary to traditional project management tools and techniques, SNA provides the adequate theoretical frameworks for modeling dynamic social interactions, where entities (persons, groups, organizations, and so on) are transformed into nodes or points, and the different relationships between them are represented by lines, or links, which can be quantitatively measured by analyzing their direction (preferences) and weights (intensities) [10,14,20,21,22].
In a nutshell, the objective of this work is to present a heuristic model that efficiently identifies and correlates corporate behavioral risks to support long-term sustainable cooperative partnerships by analyzing and quantitatively measuring the different dynamic interactions between the different project stakeholders contained in a set of interactional networks, such as communication, problem-solving, advice, and trust, that usually emerge and evolve across the different phases of a project lifecycle, by applying SNA centrality metrics. The proposed model in this work results from the combination of four scientific fields ((1) project management, (2) risk management, (3) corporate behavior, and (4) social network analysis), which in a holistic way provides the model with a novelty and uniqueness to its approach in identifying corporate behavioral risks (also known as critical project social networks).
Essentially, the combination consists of the harmonization of the individual contributions of each of the scientific fields in one block (the model), providing three main benefits for organizations: (1) it efficiently enables an effective implementation and adaptation of the proposed model in projects environments, causing the least disturbance (contributions of the project management field); (2) it accurately captures unique dynamic interactive behaviors that flow in some interactive social channels (contributions of the cooperative behavior field); and (3) it efficiently, quantitatively measures and pragmatically analyzes results according to best practices and worldwide accepted standards (contributions of social network analysis theory and risk management fields), especially when correlating them with a project’s outcomes (success or failure).
Structure of This Work
The present work is divided into five chapters. In Section 1, we introduce the main scientific fields and their individual contributions, as well the motivation that led to the development of the proposal in this work. In Section 2, an extensive literature review is presented on the main scientific fundamental fields ((1) project management, (2) risk management, (3) corporate behavior, and (4) social network analysis) that support the development of the proposed model. In Section 3, the development of the proposed model is explained, as well as the implementation steps in an organizational context. In Section 4, a case study is presented regarding the implementation and application of the proposed model, covering the complete analysis process that goes from data collection and analysis, to the interpretation of results. Finally, in Section 5, the implications of the proposed model regarding managerial and research dimensions are discussed, covering subjects such as benefits, limitations, and further research regarding the proposed model in the context of organizational project management.
2. Literature Review
2.1. Project Management
According to the PMI (Project Management Institute) [4], a project is defined as a temporary endeavor with a defined start and end, which aims at the creation of a unique result, product, or service. In order to increase the chances of delivery, successful project management tools and techniques are applied to projects tasks and activities. The PMI defines project management as the application of knowledge and techniques to project activities throughout the different phases of a project lifecycle, aiming at the successful delivery of a project within a project’s constraints [4]. Project management methods, tools, and techniques, such as those already mentioned in the introduction (the Gant Charts, the Critical Path Method, the PERT technique, the PRINCE model, the CCPM model, the PMBOK book of knowledge, the Agile methodology), are applied throughout the different phases of a project’s lifecycle to, in a timely manner, identify and manage project risks, so that projects can be delivered with success [4,5]. However, according to the Standish Group [8], over the last 20 years, it seems that such project management methods, tools, and techniques have done little or nothing to improve project success. A survey conducted by the Standish Group regarding private and public projects shows that only 29% of all projects delivered were delivered successfully. Such results are supported by the PMI’s Pulse report of the project management profession [9], where it shows that on average more than 50% of delivered projects experienced some type of scope creep—which means a continuous or uncontrolled growth in a project’s scope that it is different from the plan. Still, according to The Standish Group [8], the four main reasons that lead to project failure are: (1) low or lack of end-user involvement and input, (2) low or lack of executive management support, (3) unclear statement of requirements, and (4) uncontrolled change requirements and specifications.
In addition, other researchers still point out organizational culture, inadequately trained and/or inexperienced project managers, lack of project governance, inadequate tools and methods, poor requirements management, poor planning and estimating, inadequate communication and reporting, poor risk management, and misalignment between projects and organizational strategy, as being factors responsible for project failure [22,23].
According to David Hillson [11], a renowned risk and project management author and researcher, the results published in the Standish Group and PMI’s reports are no surprise. Hillson [11] suggests three major project areas where further research should be undertaken to improve project success. These are (1) processes (project risk management approaches and standards still must be improved), (2) principles (the definition of risk in the project environments is still very subjective), and (3) people (people’s culture, know-how, skills, interactions, and roles are different from person to person and have different impacts in how project tasks and activities are executed).
Similarly to other researchers in the field of project management [10,14,15], Hillson [11] highlights the importance of the people aspect in project management. The reason behind this is that there are no two persons alike, and cultural differences seem to directly influence how risk is perceived and understood, which in turn, creates different behaviors towards risk management in project environments, among other things.
In this line of thought, the proposed model in this work is in line with the latest research in the project management field, which place particular importance on understanding the extent to which different human behaviors contribute to the failure or success of projects, by analyzing how the different project stakeholders’ dynamic behaviors emerge and evolve across the different phases of a project lifecycle, and how these may be correlated with project success or failure.
2.2. Risk Management
Risk management can be defined as a set of coordinated activities to direct and control an organization regarding risk [4,24]. It is a combined and continuous process that includes analysis, decision-making, and proactive management across the different tangible and intangible parts of an organization, such as design and structure, strategy, operations, culture, and governance, respectively, where instead of being policed by experts internal or external to the organization, it should be supported and incentivized [25,26].
One of the most popular processes to support risk management activities is the ISO 31000:2018—Risk management—Guideline’s standard, published by the ISO (the International Organization for Standardization) [24]. The reason for its popularity is due to its ability to be implemented in almost any scenario, regardless of an organization’s type, objective, or size [24].
The risk management process defined in the 31000:2018 standard [24] is essentially described in six interrelated steps. They are: (1) establishing scope context and criteria (consists in defining the scope of the risk management activities, including the internal and external context, and the amount and type of risk that a particular organization is willing to take, relative to their objectives), (2) risk identification (comprises the activities of finding, recognizing, and describing risks that might contribute to or hinder an organization achieving its objectives), (3) risk analysis (consists in understanding the nature of a particular risk in different dimensions, such as uncertainties, risk sources, consequences, likelihood, events, scenarios, and controls and their effectiveness), (4) risk evaluation (consists in comparing the results of the risk analysis with the previously established organizational risk criteria to identify where additional action is required), (5) risk treatment (consists in the specification of how to choose treatment options to be implemented), and finally (6) record and report previous steps (comprises the continuously monitoring and reviewing of identified risks evolution across time, and the efficacy of applied control or corrective measures).
Although the word risk is immediately connotated with some kind threat, risk comprises two dimensions [4]. First, risk can be a threat that, if it occurs, will negatively impact organizational goals and objectives. Second, risk can be an opportunity that, if it occurs, will positively impact organizational goals and objectives. Research in the field of project risk management [11,27] simply defines project risks as the uncertainty that matters. This simple but efficient definition aims to develop a certain mindset that stresses that it is critical to separate real project risks from unreal project risks. To better understand and classify the different project risk types, Hillson [27] proposes four generic types of project risks. They are (1) event risks, (2) variability risks, (3) ambiguity risks, and (4) emergent risks, and are illustrated and explained in Table 1.
As is illustrated in Table 1, project risks can be divided into four major types where for each type, a management process is also suggested. The overall functioning principle of the proposed model in this work is inspired by the risk management process steps defined in the ISO 31000:2018; the equivalent process steps are illustrated in Table 2.
As can be seen in Table 2, the proposed model in this work frames the ISO standard 31000:2018—Risk management—Guidelines standard steps throughout the identification and analysis process of project corporate behavioral risks. Simultaneously, the proposed model in this work particularly addresses the ambiguity project risk type illustrated in Table 1. This happens because the model identifies hidden behaviors in a quantitative way regarding the dynamic interactions of project stakeholders across a project lifecycle, contributing to the generation of knowledge (lessons learned) concerning which factors are more or less important to drive a project to success.
2.3. Corporate Behavior
Corporate behavior can be defined as the set of actions of an organization or group that defines the organization’s ethical strategies and simultaneously describes the external and internal image of an organization [28]. Such actions essentially define the way an organization behaves within the environment where it exists, in both internal (characterized by internal processes and procedures) and external (characterized by collaboration with other organizations) environments [28]. Research shows that there is interdependence between three essential concepts that explain how behavior emerges and is adopted as normal [5,6,11]. Such interdependence is explained by the ABC model (attitude, behavior, culture), also known as the ABC of risk culture [11]. In a nutshell, the ABC model states that, first, attitude shapes behavior; second, repeated behavior forms culture; and third, culture influences attitude and behaviors. In this line of thought, it can be concluded that neither attitudes nor behaviors are static. They rather depend on culture’s influence, which is also not static. This suggests that it is possible to act in one of the three mentioned dimensions (attitudes, behavior, or culture) to influence the other two.
According to research, in organizations, as a function of their dynamic interactions as they operate in the internal and external environments, behavioral risks (also known as collaborative risks) are likely to emerge [6,12]. Research suggests the classification of organizational collaborative risks into four distinct but interrelated dimensions [12]. The first dimension, called critical enterprise risks, covers risks that are associated with project social network members who have exclusive resources or competencies or are assigned to tasks or activities of great complexity. It regards various aspects, such as what may happen to collaborative performance if a particular partner is removed from a project social network of an ongoing project. The second dimension, called resource allocation risks, covers risks that result from how tasks and project activities are distributed across the different organizations that work together to deliver projects. It comprises aspects, such as access to resources (knowledge, technologies, social capital, and so on), that enable organizations to perform assigned project tasks or activities, or how equally the workload is distributed across project partners. The third dimension, called managerial risks, are risks that are associated with authority and structure regarding communication in a collaborative network. It comprises the identification of how organizations can get help other partners to accomplish their project tasks and activities, and analysis of how balanced the communication of a given project social network is. Finally, the fourth dimension, called behavioral risks, are risks associated to the type of relationships that emerge, evolve, and eventually continue or disappear across time, between the different project stakeholders that work together to deliver projects. It consists in the identification of how collaboration (which involves communication, information exchange, and so on) evolves among the different project stakeholders, accessing various aspects, such as how project information is being shared, who turns to whom to get help and advice to perform project tasks or activities, who has expertise skills regarding a particular project task or activity, and so on. In addition to the ambiguity risk types, as previously mentioned in the risk management section, the proposed model in this work will address the above-mentioned behavioral risk dimension, also called cooperative behavioral risks.
2.4. Social Network Analysis
SNA can be defined as a process of studying and analyzing social structures, by the application of a variety of metrics developed based on graph theory, that contributes to the explanation of how social structures emerge, evolve, and eventually continue or disappear across time, and how they impact the environment where they exist [20]. SNA is continuously increasing in popularity in organizations, namely in the study of how dynamic interactions between entities across time may impact outputs and outcomes [20,29].
Furthermore, the application of SNA covers diverse scientific fields, such as management and leadership [30]; behavioral sciences [31]; law, criminology, and terrorism [32]; communication, learning and media [33]; and political science [34], just to name a few.
SNA is characterized by a set of specific linkages or connections among a defined set of actors or entities, where such linkages or connections are used to interpret social behavior of the involved entities or actors [35].
SNA efficiently addresses social capital challenges and has been integrated into traditional organizational risk management processes and frameworks, essentially to support decision making [10,36].
In organizations, SNA can be used to study employee retention and turnover, network collaboration levels, collective and individual performance, culture, innovation, social cohesion, information diffusion, values, ethics, behavior, wellness, satisfaction, fraud, and many other things [6,36].
In project management, the application of SNA—although still at a very initial stage according to some research [37]—is essentially used to identify project critical success factors by studying how the different project stakeholders’ behaviors emerge and evolve across a given project lifecycle, and how such behaviors may impact project activities and outcomes [38,39]. In the last years, several researchers and authors have been showing how the application of SNA in project management can help organizations to be more efficient.
For example, Krackhardt and Hanson [40] identified three key informal networks that managers should be aware of to increase performance and project success. Such networks are still today considered by several research as being some of the most important informal networks to be analyzed, because they provide meaningful and actionable insight regarding how the different project stakeholders interact across a given project lifecycle [6,10,14,40]. They are: (1) advice network (identifies people to whom others go to get their job done, (2) trust network (identifies people who share project-related information and with whom), and (3) communication network (identifies who talks to whom about project-related matters).
Mead [41] applied SNA to the analysis of different project teams to assess project communication evolution across time. Through this assessment, Mead identified a set of isolated project stakeholders, which enabled the development and implementation of an efficient corrective plan to better integrate those isolated project stakeholders in the project communication network.
Cross and Parker [42] applied SNA in diverse organizations, which led to the identification and characterization of a set of very popular informal actors’ functions, in terms of their location within an organization’s informal network, that strongly impact how work is done in organizations. They are: (1) central connectors (people who others heavily rely on for support and advice regarding work and personal matters), (2) boundary spanners (people who connect different organizations and groups), (3) information brokers (people that connect different functions within an organization), (4) peripheral experts (people that are subject matter experts), (5) peripheral intentionally (people that aren’t well integrated in a project social network), and (6) energizers (people who energize others with positive energy).
Prell [43] applied SNA centrality metrics to identify and analyze project stakeholder networks in a natural resource management project. He used the results of SNA assessment to first select and then manage important project stakeholders.
Mok [44] applied SNA centrality metrics to identify critical challenges in major engineering projects (MEPs) based on interdependencies among critical stakeholders’ concerns. The results of his assessment enabled the identification of several critical challenges that occurred in major engineering projects, which contributed to the development of a set of best project practices to properly manage future MEPs similar challenges.
Arena [15] applied SNA centrality metrics to develop a theory called adaptive space, which essentially argues that successful organizations efficiently connect two different critical areas—the operational and the entrepreneurship pockets—which enables them to create and explore new ideas in a more agile way.
As seen in the examples above, the use of SNA centrality metrics is quite popular in organizations and in project environments. In a social network, centrality refers to a network’s structure, which results from how different entities are connected within that network’s structure [6,10,45,46]. Research in SNA centrality metrics suggests that centrality metrics, such as degree (which can be an indicator of a network’s activity potential), closeness (which can be an indicator of the independence potential of a network), or betweenness (which can be an indicator of control and communication between two different groups), can efficiently measure the importance, influence, prestige, prominence, and control of individual entities (people, groups, or organization) within a social network [10,45,46]. Furthermore, research argues that network centrality is correlated with informal power in project collaborative networks, which strongly influences coordination and decision making, especially in project environments [45,46].
Research shows also that dynamic interactive relationships (also called corporate behaviors) are complex by nature and cannot be completely explained by traditional social theory methods [47,48]. Such dynamic interactive relationships must rather be described and analyzed by the application of methods that are based in sociology, where the individual’s social context in the process of making choices is taken into consideration [48]. In the fields of sociology and project management, several studies show that the most effective way of understanding the way dynamic interactions between entities across a period emerge, evolve, and eventually keep or disappear is through the application of SNA centrality metrics [10,14,20,21,22]. This is explained, due the ability of quantitatively measured behaviors (dynamic interactions) between members of a given social network, by transforming entities into nodes or points of a graph, and the relationships between them into preferential, measurable links.
In this line of thought, the proposed model in this work is aligned with the latest research conducted in the fields of sociology and project management in two dimensions. First, by applying SNA centrality metrics to quantitatively identify behavioral patterns in a project social network across a finite period of time, the proposed model in this work is in line with recent research that argues that the application of SNA centrality metrics is the only effective way to uncover hidden behavioral patterns in the mix of formal and informal networks of relationship [6,10,14,20,21,22]. Second, the proposed model in this work is fully aligned with recent sociology and project management research, as it analyzes some of the most important social networks in project management, such as communication, problem-solving, advice, and trust, as mentioned above.
3. Model Development and Implementation
3.1. Development to the Proposed Model
As already mentioned in the introduction, in this work is proposed a heuristic model to identify in a holistic way corporate behavioral risks in project environments. The proposed model was developed based on four fundamental fields, which are illustrated in Figure 1.
As illustrated in Figure 1, the first field that supports the development of the proposed model in this work is the project management scientific field. This field contributes to the proposed model in this work with the standard definitions and structure of a project, and the tools and techniques applied in project management.
The second field is the risk management scientific field. This field provides the proposed model with the standard definitions, approaches, and risk-management process frameworks that will be used across the development and implementation of the proposed model in this work. It provides the process of identifying, analyzing, measuring, treating, monitoring, and updating project cooperative behavioral risks (dynamic interactions) that emerge and evolve as the different stakeholders work together to deliver projects.
The third field is the corporate behavior scientific field. This field provides the proposed model with the definitions of the different corporate risk types and their characteristics in the project management environment.
The fourth and final field is the social network analysis scientific field. This field provides the proposed model with the tools and techniques to map, identify, and quantitatively measure different corporate behavioral patterns that emerge, evolve, and eventually continue or disappear as the different project stakeholders work together to deliver projects. More concretely, the SNA field (the SNA tools and techniques) will be used to identify and quantify the evolution of those different corporate behavioral patterns by analyzing four critical social project networks, through the application of social network analysis centrality metrics. The four critical social project networks are: (1) communication (which identifies, within the project stakeholders network, who communicates with who and how balanced or unbalanced the project stakeholder’s communication network is), (2) problem-solving (which identifies, within the project stakeholders network, who turns to who in search of expertise, know-how, or know-what regarding project-related matters), (3) advice (which identifies, within the project stakeholders network, who turns to whom in search of advice and support regarding project-related matters), and finally (4) trust (which identifies, within the project stakeholders network, who trusts whom regarding project-related matters). In Table 3 are described the four critical project social networks.
As illustrated in Table 3, each one of the four critical project networks have their own specificity regarding the identification of project behavioral patterns. However, even though each individual specificity is comprised in each of the four critical networks, they complement each other. This fact enables one to create a holistic approach regarding the identification and understanding of how collaboration emerges, evolves, and eventually disappears, as different project stakeholders work together across a project lifecycle.
In the proposed model in this work, for the communication network dimension, project email exchange data between project stakeholders will be used to map the communication network of the project social network. The problem-solving network will be mapped and analyzed with data collected in a project survey launched to all the project stakeholders. The advice network will be mapped and analyzed with data collected in on-site observations of all project stakeholders. The trust network will be mapped and analyzed with data collected in a project survey launched to all the project stakeholders. The construction of the assessment is to be agreed upon by the network analytics team or individual and the entity to be analyzed. This comprises, for example, the types of data collection methods (survey, observations, emails), as well as what and how many questions are to be launched in the survey. As previously mentioned, for each one of the four critical project networks, a respective network (also known as graph) will be created by applying SNA centrality metrics. An example of what each one of the four critical project networks look like is illustrated in Figure 2.
In Figure 2 are illustrated the four different critical project networks that the proposed model in this work will analyze in detail. As previously mentioned, the project communication network will be mapped with data collected in project emails exchange. The resulting network is illustrated in Figure 2a (communication network). In Figure 2a are illustrated five different organizations that collaborate to deliver a given project. Each organization is represented by a different color. As the legend of Figure 2a illustrates, the employees of organizations 1, 2, 3, 4, and n are connected through lines between them. These represent the email communication network channels. In the communication network, the lines between the different organizations’ employees may be weighted and classified into different customizable classes or levels, such as those indicated in the legend of Figure 2a (Weighted L1, L2, or Lm). Such weighted linkages represent the number of emails that have been exchanged between any two given employees within a finite period. The communication network is characterized by a non-directional connection type. One link or line represents that there is a communication channel between two given entities wherein several emails have been exchanged across a bounded period of time. If no link exists between any two given entities, it means that no single email has been directly or indirectly exchanged between them. The links within the communication social network are divided into interorganizational links (black lines) and intraorganizational links (grey lines). These represent the communication between different organizations and within an organization, respectively.
In Figure 2b is illustrated the problem-solving network. In this network are illustrated the same organizations as in the previous network (communication network), containing also their respective employees and a set of links between them. This network maps the connections (dynamic relationships) between the different employees of the different organizations with directed links. These type of links (directed) represent preferences, choices, or nominations, and can be classified into one-way-directed or reciprocal, as illustrated in the legend of Figure 2b. The problem-solving network is mapped with the answers collected by a survey addressed to all organization’s employees that participated in project tasks or activities, where questions such as “who do you turn to in order to get help regarding a given project problem or challenge?” may be formulated.
The two networks of advice (Figure 2c) and trust (Figure 2d) follow the same principle as the problem-solving network regarding the mapping and analysis process. However, the data collection method may be different. To map the advice network, data collected in observations was used. This method implies an active monitoring process of organization’s employees, regarding who they go to in order to get advice concerning project task or activities. However, the proposed model in this work is not by any means constrained to a given type of data collection method. This means that other data collecting methods may be applied if they collect valuable and reliable data to map the four different critical networks. The last network to be mapped is the trust network, as illustrated in Figure 2d. To map this network, data from surveys conducted of an organization’s employees is collected, where questions such as “who do you trust to confide in about project-related problems or challenges without fearing retaliation?” may be formulated.
As can be seen in the problem-solving, advice, and trust networks, not all employees are connected either by a directed or reciprocal link. This means that those employees that were not nominated—for example, as being people whom others can trust—have no directed link attached to them. For example, in the problem-solving network illustrated in Figure 2c, there is one reciprocal connection between organizations n and 4 through one element of each organization. This means that one element of organization n trusts one element of organization 4, and vice-versa. In the same network, there are two non-reciprocal connections between organizations 4 and 1. In this case, and according to the network of Figure 2c, one element of organization 4 trusts two elements of organization 1. Another way to represent such relationships (when analyzing dynamic interactions between the different organizations) is by drawing one link from organization 4 to organization 1 with a numeric value of 2. This value represents the two nominations from the element of organization 4 to one element of organization 1. This representation is also known as the weight of a directional link.
3.2. Implementation of the Proposed Model
In Figure 3 is illustrated the implementation process of the proposed model in this work. The generic project lifecycle used by the proposed model in this work, which is illustrated in Figure 3, is adopted from the PMI (Project Management Institute) book of knowledge [4], and is constituted of four project phases.
Due to illustrative purposes, the detailed explanation regarding the implementation process of the proposed model in this work illustrated in Figure 3 only covers the first two project lifecycle phases (starting the project, and organizing and preparing). This does not mean that the implementation process of the proposed model in this work illustrated in Figure 3 is different in the remaining phases (carrying out the work and ending the project). In fact, the process is completely replicable across the other remaining project lifecycle phases. This also implies that the interpretation of results is done in a similar way across all the different phases of a project lifecycle. Moreover, regardless of the number of phases a project has, the implementation process of the proposed model always follows the same principle that is explained in detail in Figure 3 in starting the project and the organizing and preparing phases, as we will see in the following.
In Figure 3 are illustrated the four typical different phases of a project lifecycle proposed by the PMI [4], and the respective expected level of effort for each one of the different project phases. The four project phases are: (1) starting the project (where the project scope, definition, and project charter are defined), (2) organizing and preparing (where the development of the project begins in all the its different dimensions, ranging from budgeting, to risk analysis, to resource planning, just to name a few), (3) carrying out the work (which is the execution of what has been planned, but also complementing support activities such as change management, quality control, and stakeholder management, just to name a few), and finally (4) ending the project (which comprises the final project activities, such as financial handover, release of resources, and collection of lessons learned, just to name a few).
In Figure 3 are illustrated the finite periods of time pt1, pt2, pt3, …, pti. These represent the bounded period of time where the proposed model in this work will be applied. In Figure 3 are also illustrated the monitoring points (also called collecting points) mt1, mt2, mt3, …, mte. These represent simultaneously the length of a given pti finite period of time, and when data will be collected and analyzed.
For a given period pti—which comprises the time between any two given mte (monitoring time) and mte + 1—data regarding the interaction of the different stakeholders that work together to deliver a project is generated. This time-period is entirely customizable and can either be defined by the network analyst or the organization that conducts the assessment. For the purpose of analysis, the overlap between different project phases has no negative implication. This happens because the objective of the proposed model is not to clearly define the different phases of a project lifecycle, but rather to analyze how dynamic collaboration between different project stakeholders emerges and evolves within a finite or bounded period of time. In each monitoring time mte, which includes the processes of collecting and analyzing data, the proposed model in this work will apply SNA centrality metrics to quantitatively measure the already mentioned four critical project social networks ((1) communication, (2) problem-solving, (3) advice, and (4) trust).
In Table 4 are illustrated the SNA centrality metrics that will be applied to quantitatively measure the four critical project social networks, as well as the respective data collection method, and the objective of each centrality metric.
As illustrated in Table 4, to analyze the communication network, the weighted in-degree SNA centrality metric will be applied to identify who is central and who is peripherical within the project email exchange network. To analyze the problem-solving network, the in-degree centrality metric will be applied to identify how the problem-solving network is structured across the project social network. To analyze the advice network, the in-degree centrality metric will be applied to identify how the advice network is structured across the project social network. Finally, to analyze the trust network, the in-degree centrality metric will be applied to identify how the trust network is structured across the project social network.
4. Case Study
4.1. Introduction to the Case Study
The case study introduced in this section was conducted by an international market leader food and beverage organization at the end of 2018 in Europe. The case study was aimed at the analysis and continuous monitoring of project stakeholders’ behaviors’ importance in project evolution, and how changes in behavioral patterns could impact project deliverables and ultimately project outcomes. For this matter, the proposed model in this work was applied. The organization that conducted the following case study—named in this work, due to privacy reasons, organization A—won a contract to develop and implement a food-related project—named project 1 in this work—in mid-Europe. The project, which consisted in the implementation of a new production line of an end-user good for one of its customers in Europe, was budgeted at about 5 million euros and meant to be completed within a 3-year period of time. Organization A sub-contracted another organization—named organization 1 in this work—to accomplish project 1. Organization 1 was also responsible for the outsourcing of some project-1-related tasks and activities to other specialized organizations in four different areas: (1) mechanical installations, (2) automation engineering, (3) electrical engineering, and (4) processing engineering. Organization 1 was responsible for the mechanical installation works in project 1 and contracted the following organizations: organization 2, which was responsible for the automation engineering works in project 1; organization 3, which was responsible for the electrical engineering works in project 1; and organization 4, which was responsible for the processing engineering works in project 1. All organizations agreed to participation in the case study conducted by organization A. The number of employees in each of the selected organizations involved in accomplishing project 1 varies as follows: organization 1, 23 employees; organization 2, 5 employees; organization 3, 9 employees; and organization 4, 6 employees. The case study conducted by organization A involves the application of the proposed model in this work to identify, quantitatively measure, and monitor the impact of the different stakeholders’ (organizations 1, 2, 3, and 4) dynamic behaviors across the different phases of project 1 on project 1 outcomes, by analyzing the already mentioned four critical project social networks ((1) communication, (2) problem-solving, (3) advice, and (4) trust).
Organization A believes that understanding how collaboration is occurring between the different project’s stakeholders—which is mirrored across the different dynamic behaviors between project 1’s stakeholders—could enable organization A to, in a timely manner, take corrective measures to minimize the potential negative impacts and optimize the potential positive impacts on project 1’s deliverables. The assessment was conducted by a dedicated team belonging to Organization A (which is referred to in the present case study as an external team regarding project implementation) that received training in network analysis, namely in the development and implementation of the proposed model in this work.
Finally, Organization A believes that by applying the proposed model in this work, organization A did not only proactively act to increase the chances of project success, but also promoted the sustainable long-term cooperative partnership between the project’s participating stakeholders in further project partnerships.
4.2. Application of the Proposed Model and Interpretation of Results
In this section will be presented an extract of the complete application of the proposed model, focused on the organizing and preparing phase according to the steps defined in Table 2. It includes the implementation of the proposed model according to Figure 3 and the application of SNA centrality metrics according to Table 3.
The results of the assessment conducted across organizations 1, 2, 3, and 4 illustrated in Figure 4 took place around the first quarter of the project, in the phase of organizing and preparing. It comprises the analysis of four project social networks decided by Organization A (communication, problem-solving, advice, and trust network), as is also suggested by the proposed model in this work.
In Figure 4 are illustrated the results the assessment conducted across organizations 1, 2, 3, and 4 regarding the four already mentioned critical project social networks.
In the left side of Figure 4 is illustrated project 1’s first lifecycle phase of organizing and preparing (represented with the blue line), which is the phase that corresponds to the case study illustrated in this work regarding the application of the proposed model. Within the four boxes (a–d) in Figure 4 are illustrated the results of the application of SNA centrality metrics for this time period of project 1, according to Table 3, regarding the four critical project social networks of (a) communication, (b) problem solving, (c) advice, and (d) trust, respectively.
Although all phases of project 1 have been analyzed by the proposed model in this work to identify corporate behavioral risks, in the present work (and in this section, namely the case study), only the application of the proposed model within the project’s pt7 period will be illustrated and described, which corresponds to the period between mt6 and mt7, as illustrated in the left side of Figure 4. This is so due to paper length constraints and redundancy analysis.
Email-communication-related data was collected in the mt7 monitoring time, and contained all the project email communication between project 1’s stakeholders (organizations 1, 2, 3, and 4) within the pt7 time period. The respective network is illustrated in Figure 4a. Project-related email data was collected and filtered by the external network analyst team, according to Table 4.
Problem-solving-related data was collected through a survey conducted on all of project 1’s stakeholders in the mt7 monitoring time. The respective network is illustrated in Figure 4b. The question used to create and later map this network was the following: to whom do you usually turn to get an effective solution for a problem or a project challenge? The question used to create and later map this network was designed by the external analyst team and agreed upon by Organization A’s top managers. The chosen question, although not being very specific, aims to capture and map a project social network that explicitly shows the dependencies among project stakeholders related to project technical solutions.
Advice-related data was collected through a set of daily observations, conducted by elements of the network analytic team of Organization A, of all of project 1’s stakeholders across pt7. The respective network is illustrated in Figure 4c. To create and later map this network, on-site observations targeting personal communication (face-to-face (F2F) small talk and project-related meetings) were recorded, aiming to capture interactions regarding the search for advice and guidance related to project tasks and activities. For example, these observations comprise the search for help from a project stakeholder regarding a project activity or task within the period pt7.
Trust-related data was collected through a survey conducted on all of project 1’s stakeholders in the mt7 monitoring time. The respective network is illustrated in Figure 4d. The question used to create and later map this network was the following: to whom do you usually turn or who do you trust to discuss or present new ideas regarding the project evolution without fearing retaliation?
This question was proposed by the analytics team and agreed to by Organization A’s top management. It aims to uncover the collective innovative capacity of the project social network while simultaneously reflecting the social behavioral safety level.
In the right side of Figure 4, the organizations are represented by the different bold colored circles, which represent all the employees from each organization, as previously illustrated in Figure 2.
Turning back to Figure 4a, it illustrates the communication network for the pt7 time period of project 1’s organizing and preparing phase. This network is characterized by an indirect connection type between all of project 1’s stakeholders, as illustrated in the legend of Figure 4a. In this network, the lines between any two given two organizations represent project 1’s exchanged email network for the pt7 period. For example, between organizations 1 and 3, according to the line thickness illustrated in the legend of Figure 4, more than 101 emails have been exchanged within the pt7 period of project 1’s organizing and preparing phase. On the other hand, within the same pt7 period, very few project-related emails have been exchanged between organizations 1 and 2 (less than 51 emails). Still, between organizations 2 (automation engineering, 5 workers) and 4 (process engineering, 6 workers) within the pt7 period of project 1’s organizing and preparing phase, zero emails have been exchanged. Such an event (behavior) should represent an alert for organization A. Although there may have been many different reasons for this behavior between organizations 2 and 4, it means that some of the email-information that flew between the other organizations did not flow through organization 4. Such behavior may say a lot regarding the communication degree between organizations 2 and 4. In such cases, a further investigation is recommendable (also known as a follow-up assessment), either by analyzing other networks, or by conducting follow-up interviews with involved project stakeholders (which in this case are organizations 2 and 4) in order to uncover the real reasons behind such behavior.
Another interesting conclusion that arises from observing the communication network is that for the pt7 period, not all project-related information that was exchanged within the email network reached all of project 1’s stakeholders in a balanced way. This can be seen by the different number of exchanged emails between project 1’s stakeholders. Moreover, in this case, organization A should undertake further research (and take actions as needed) to assure that all necessary information reaches the respective receptor, and that in the next phases, that it not only reaches the respective receptor, but that it also does so in a timely manner. Finally, we can conclude that organizations 1 and 3 have a central position within the communication network of project 1. On the other hand, we can also conclude that organizations 2 and 4 are to a certain extent peripherical organizations (or less central than the previous mentioned organizations) within project 1’s email communication network.
In Figure 4b is illustrated the problem-solving network for the pt7 period of project 1’s organizing and preparing phase. This network is characterized by a directed network type where the links or connections between project 1’s participating organizations (stakeholders) indicate a preference or a choice, which may still be reciprocal or not. For example, it can be clearly seen that most organizations heavily rely on organization 1 when it comes to solving project-related issues or problems. Organization 1 has a total of 5 nominations (3 nominations from organization 2, 1 nomination from organization 4, and 1 nomination from organization 5). At this stage, it can be concluded that there is a high dependency from organizations 2, 3, and 4 on organization 1, regarding who to turn to get project 1’s problems and challenges solved. This behavior may represent a risk (threat) to the accomplishment of project 1’s deliverables. Such a risk may be explained as follows: by overloading organization 1 members with constant problem-solving requests, it may lead to answering delays within organization 1 members, which in turn may result in information exchange bottlenecks. This, in turn, may originate critical project delays in project activities or tasks. Furthermore, it seems that are no valuable competencies in organizations 2 and 4 that organizations 1 and 3 can rely on (need) to get project 1’s problems or challenges solved.
Still, in this network some reciprocity level can be observed between organizations 1 and 3. However, while organization 1 has 1 problem-solving request from organization 3, organization 3 has 5 nominations from organization 1. This behavior clearly represents a non-balanced reciprocity status within project 1’s social network regarding problem-solving initiatives.
Finally, the network results illustrated in Figure 4b clearly provide organization A with a unique picture of how collaboration regarding problem-solving is evolving within the pt7 period of project 1. This way, organization A should be aware of the negative or positive consequences (behavioral risks) that may arise from such observed dynamic behaviors, and conduct follow-up interviews in order to uncover the underlying reasons that led to such dynamic interactions.
In Figure 4c is illustrated the advice network for pt7 of project 1’s organizing and preparing phase. This network is also characterized by a directed network, where the links from one organization directed to another organization represent a choice or preference. As can be seen in the advice network, for pt7, organization 4 has more advice requests than all the remaining organizations. Organization 4 received a total of 9 nominations (2 nominations from organization 1, and 7 nominations from organization 3). Organization 4 has by far the highest number of nominations (more than double the other nominated organizations) in the advice network for pt7 illustrated in Figure 4c. In the advice network, organizations 3 and 2 each have 2 nominations. These nominations are totally reciprocal. This means that there is a full balanced relationship between organizations 2 and 3 regarding the search for advice on project-related matters. Interesting to compare is the behavior of organization 1 in the advice network and in the problem-solving network. Although organization 1 had the highest number of nominations in the previous network (the problem-solving network), when it comes to the advice network, organization 1 abruptly drops to zero nominations. This extreme behavior change may represent a corporate behavioral risk. This could mean that organization 1 is heavily requested to solve project-related problems; however, it seems that organization 1 has no meaningful advice regarding project-1-related activities for the other organizations. At first sight, such dynamic behaviors seem to be contradictory. However, when deeply analyzed, it is not so unusual to find people in an organization that are known as the top problem-solvers (also called subject matter experts); however, they do not really fit within the social network they are embedded in. Such people were characterized by Cross and Parker as peripheral people [42]. According to [42], peripheral people can be divided into peripheral experts and peripheral intentionally. In this case, regarding the extreme behavior change of organization 1 in reference to the problem-solving and advice networks, organization A should conduct follow-up interviews to uncover which peripheral type is emerging within project 1’s social network regarding organization 1. Still, such an abrupt shift regarding the influence of certain organizations in a given social network—as is observed in organizations 1 and 4 when analyzing the problem-solving and advice networks—may represent that collaboration is occurring in two different extremes, as mentioned in the literature review section. The first extreme is characterized by a lack of collaboration regarding the contributions of other organizations—organizations 2 and 4—to the problem-solving network, and the advice network—organization 1—as can be observed in Figure 4b,c. The second extreme may be characterized as a collaborative overload status (as can be observed in Figure 4b,c, where organization 1 plays by far an extremely central role regarding the contributions to the problem-solving network, and organization 4 plays by far an extremely central role regarding the contributions to the advice network, respectively). Both lack of collaboration and collaborative overload status are, according to research [13,18], highly prejudicial to the organizational collaborative performance, threatening project 1’s deliverables.
Finally, the last network to be analyzed in this work is the trust network for p7, as illustrated in Figure 4d. This network is particularly interesting and important because it may shed light on the observed behaviors in the two already-analyzed networks (problem-solving and advice networks). Trust, according to several studies [6,10,14,22], is a fundamental pillar of efficient collaboration between organizations that work together to achieve a common goal. Trust is, in fact, fundamental to diversity and inclusion, because it opens the communication paths between and within an organizations member’s and fuels them with energy and psychological safety [13,14,15]. This, in turn, boosts collaboration performance and innovation [13,15]. In Figure 4c is illustrated the trust network for the pt7 period of project 1’s organizing and preparing phase. In this network, organizations 3 and 4 play a central role in project 1’s organizing and preparing phase regarding the trust dimension. Organizations 1 and 2 are, to a certain extent, isolated within the trust network when compared with the other organizations. This can be seen in the number of nominations they have. Once again, organization 4 plays a central role, now in project 1’s trust network, with a total of 7 nominations, immediately followed by organization 3, with a total of 4 nominations. The behaviors observed in organizations 4 and 3 regarding the trust network are to a certain extent in line with the behaviors observed in the previous network (the advice network). This happens because both networks (trust and advice) are related regarding their intrinsic meaning. In other words, the likelihood of getting advice from someone who one trusts is higher than from someone who one does not trust. The same may not be observed when analyzing trust and problem-solving networks because both networks are not so closely related regarding their intrinsic meaning. This fact may explain why there is a shift in the choice of the most influential organization in the project’s social network as it moves forward. For example, between organizations 1 and 4, there has been a relatively good collaboration level, which can be observed in the communication, problem-solving, advice, and trust networks. In fact, both organizations have always been connected across the four networks—a fact that is not observed between any other two given organizations in project 1’s pt7 time period. On the other side, the collaboration level in all four networks between organizations 2 and 4 seems to be poor or very poor, because there is no single connection between them in all four analyzed critical social project networks. A particular finding in the trust network has to do with the reciprocity aspect. In all existing connections in the trust network, there is reciprocity to be observed, but not always with the same intensity. For example, between organizations 2 and 3, there is a line between them with a value of 2 from organization 2 to 3, and a value of 1 in the inverse direction. This means that the trust network is unbalanced. This may represent a trust issue (or risk) within the project 1 social network. Ultimately, this issue may lead to project behavioral risks which can be translated into mistrust among project 1’s stakeholders, which in turn may lead to a poor accomplishment of project tasks and activities, and to the emergence of organizational silos. Still, in the trust network, organization A should conduct further investigations to understand the underlying reasons that lead to the observed behaviors illustrated in Figure 4d.
Until now, the analysis process conducted on the four critical networks were done in a unique timeslot comprised of the time between mt6 and mt7. To better understand how the four critical project social networks evolved across a longer period (within a particular phase or across multiple phases of a given project’s lifecycle), one needs to plot the results from the previous analysis (if they have been previously done) regarding the following time periods: from mt1 to mt2, from mt2 to mt3, from mt3 to mt4, from mt4 to mt5, and from mt5 to mt6. Doing this results in a longitudinal evolution analysis, which would stretch across a larger period regarding the four critical project social networks. The benefits of such longitudinal analysis are that it enables one to better understand the variations that did occur (if they did occur) across a given bounded time period, allowing the identification of key events that were responsible for smooth or abrupt shifts regarding the different corporate behaviors that emerge and evolve as the project’s different stakeholders deliver projects. Performing such longitudinal analysis is like taking a set of real time pictures of how the different project stakeholders have been working together (dynamically interacting) to achieve a common goal across a finite period. For this matter, the data analysis process of two of the four networks (advice and trust) between mt1 and mt7–which represents the period between the beginning of the phase of organizing and preparing (mt1), until the actual point (mt7) of the phase of organizing and preparing—will be presented in this section. In Figure 5 is illustrated the evolution degree of the advice network between project 1 over the mt1-to-mt7 period.
In Figure 5 are illustrated the four organizations (O1, O2, O3, and O4) that participated in the organizing and planning phase of project 1 from mt1 until mt7. Each organization evolution illustrated in Figure 5 is characterized by a respective color, as illustrated in Figure 4. As can be seen in Figure 5, organization 4 seems to have continuous growth between mt1 and mt7 regarding the advice network within project 1’s social network. On the other side, it seems that all the remaining organizations (O1, O2, and O3) have been considerably decreasing their contribution to the advice network in the same period. The dynamic behavior identified in pt7—which corresponds to the period between mt6 and mt7—seems to be the result of an “older identical evolution” that can now be seen in the previous periods of time (from pt1-mt1 up until pt7-mt7), as illustrated in Figure 5. This means that from mt3 onwards, there has been a certain acceptance within the project 1 social network that only organization 4 is able provide valuable advice regarding project-1-related matters. It is now quite clear to see (observing the evolution in Figure 5), from when it began, the shift regarding the advice network of the project 1’s social network. Moreover, in the beginning of the project 1 organizing and preparing phase, organization 1 was the organization with the highest nomination number regarding the advice network. However, as project 1 moves along the time axis, organization 1 has abruptly dropped its leading position in the advice network, namely from mt3 onwards until mt7. On the other side, the evolution of the advice network regarding organizations 2 and 3 seems to be quite parallel across time. This quite balanced advice network level observed in organizations 2 and 3 seems like it could be translated into a reciprocal dynamic interaction type, as is observed in Figure 4 in the advice network for pt7.
In Figure 6 is illustrated the evolution degree of the trust network, in the period between mt1 and mt7, within the project 1 social network.
As can be seen in Figure 6, the trust network has a lower variability across time when compared with the previous longitudinal analysis on the advice network. This only reflects the reality regarding trust: it takes time to gain, but it can be lost very fast. As we move along project 1’s preparing and organizing phase towards its end, it can be observed that organization 4 has increased its trust level in a very sustainable way. Once again, organization 4 has been gaining a very central position within the project social network regarding trust, namely from mt2 onwards. Simultaneously, but in the inverse direction, organizations 1 and 3 have become more peripheral within the project 1 trust network. As previously said, trust is a fundamental pillar to effective collaboration, and as can be observed in Figure 6, it seems that there is a low level of trust between all the organizations that participated in the accomplishment of project 1 in the organizing and preparing phase. Such a behavioral shift regarding the trust network may represent a threat to the stability of the project’s social network, as mentioned before. In this case, organization A should take into consideration a further analysis (follow-up assessment) to uncover the real reason(s) that led to the observed dynamic behaviors illustrated in Figure 6, and if necessary, consider the implementation of corrective or supportive measures aimed at the creation of trust among project 1’s different stakeholders, to increase the chances of project success.
5. Conclusions, Implications, and Further Developments
The research conducted in this work, which led to the development of the proposed model, addresses different dimensions of different areas beyond the already mentioned fundamental four fields (1) project management, (2) risk management, (3) corporate behavior, and (4) social network analysis) that were used to develop the proposed model in this work. This provides the research conducted in this work with an innovative and expansionist character, laying the foundations for further research in this intriguing, interesting, and underexplored scientific field, which is essentially characterized by the quantitative identification of the impact that human dynamic relationships (dynamic behaviors) have on outputs and outcomes.
The main objective of this work is to present a heuristic model that, in a holistic and effective way, identifies, quantitatively measures, and analyzes how the different corporate behavioral patterns may turn into project behavioral risks, and thus influence project’s outcomes across the different phases of a given project lifecycle. This is done by analyzing four critical project social networks ((1) communication, (2) problem-solving, (3) advice, and (4) trust) that usually emerge and evolve as a cooperative project is being delivered, and are the result of the mix of formal and informal networks of collaboration.
The research conducted in this work contributes to answer one of the fundamental research questions in project management, which can be stated as follows: to what extent do the different dynamic behavioral interactions between the different project stakeholders across all the different phases of a given project lifecycle positively or negatively impact a project’s outcome?
As seen in the case study section, the application of the proposed model in this work benefits organizations with unique and actionable insights by answering the mentioned research question, which, in turn, enables organizations to better support (plan, guide, and monitor) cooperative projects’ tasks and activities. This, in turn, is a critical asset to drive long-term sustainable cooperative partnerships. Furthermore, this fact is supported by several studies in the project management field, which argue that organizations that exert more control over inter- and intraorganizational project environments clearly increase the chances of project outcome, compared to those that leave inter- and intraorganizational collaboration to chance [13,15,49].
The model proposed in this work also enables organizations to accurately quantify the extent to which informal and formal project organizational networks of relationships may be correlated to project outcome. This particular aspect can be considered as a unique and effective approach to, in a quantitatively way, support or contest research that argues for the importance of informal organizational networks (sometimes more than formal organizational networks) in successful project outcomes [6,10,13,15,19], and research that argues that other factors, such as education, business referral, and expertise, are of much greater importance than informal organizational networks in successful project outcomes [50].
Still, the proposed model in this work is aligned with the latest organizational trends regarding the improvement of organizational performance and innovation, simultaneously being sustainability-oriented and customer-centric, through the application of digital transformation and industry 4.0 strategies. It is common to hear and read that data is the new oil [51,52,53]. This quote—coined by British mathematician Clive Humby in 2006 [51]—seems to be alive and kicking. In fact, as organizations generate countless gigabytes of data on a daily basis, they also increase their data analysis activities in order to extract unique and meaningful insights that may help them do more accurate (also known as data-informed) decisions. This, in turn, enables organizations to craft more data-driven strategies, increasing their performance and innovation levels, as well as their chances of success. Furthermore, the incorporation of the proposed model into an organizational business intelligent architecture is able to transform the proposed model in this work into a potential supervised machine learning model, which organizations can use for the development of integrated intelligent strategic risk management solutions. This, in turn, will enable a faster and more accurate descriptive, predictive, and prescriptive analysis, and still enable a correlational analysis by adding other organizational departments, such as HR, sales, marketing, and so on.
Finally, the implementation and application of the proposed model in organizations positively contributes to actual social, economic, and environmental sustainability challenges. In organizations, sustainability can be interpreted as a holistic, consistent, and incremental growth process that concentrates on the long term, instead of on short-term approaches only [10,14]. The ability provided by the proposed model of accurately knowing where, when, and what must be done to improve collaboration between the different project stakeholders to deliver projects with higher success chances is a key pillar that goes across the three major pillars of sustainability (social, economic, and environmental). The sequence goes as follows: identifying, quantifying, and predicting corporate project behavioral risks enables organizations to, in a timely manner, develop more data-informed decisions for the optimal management of necessary resources (people, time, money, just to name a few) for the successful accomplishment of projects. This, in turn, enables organizations to become leaner, and thus, increases the chances of achieving sustainable competitive advantages.
5.1. Proposed Model in This Work and Literature Research Implications
The proposed model in this work addresses two major organizational cooperative risks. These are (1) ambiguity risks and (2) behavioral risks, as proposed by [12,27], respectively. The proposed model provides a valuable and unique contribution to the corporate behavioral risk scientific field, which, according to several studies [6,10,12,13,27], is still underdeveloped.
The application of SNA centrality metrics enables one to quantify how much the mix of formal and informal networks of relationships impacts project outcomes.
The proposed model in this work offers an effective approach to obtain quantitative results that can support or contest—in a more data-informed way—research that argues over the fundamental role of the mix of formal and informal organizational networks in innovation and performance [13,18,40,54], and research that argues that other factors, such as education, business referral, and expertise, are of greater importance than the mix of formal and informal networks of relationships [50].
The proposed model also contributes to the organizational transformation trend, in the sense that it provides organizations with a new approach for managing corporate behavioral risks across the different phases of a project lifecycle by the application of quantitative information, technology, tools, and approaches, as is achieved with the incorporation of the proposed model into a typical business intelligence architecture. Such a transformation involves not only the implementation of a new technologies across an organization’s structure, but also the adoption of a new way of working, as suggested by several studies in the field of organizational management and sociology [10,12,13,15]. This, ultimately, could lead to the development of new organizational theories and approaches.
5.2. Proposed Model in This Work and Managerial Implications
From a managerial perspective, the proposed model in this work addresses several different critical organizational dimensions. The main objective of the proposed model is to provide organizations a practical heuristic risk model to holistically and efficiently manage corporate behavioral risks, which, according to research [55], is still a major obstacle to organizations more often engaging in collaborative projects.
Because the proposed model quantitatively uncovers corporate behavioral patterns across a bounded period of time, organizations can better understand and better correlate different behaviors with different project outcomes, and thus make the decision-making process more data-informed, rather than uniquely relying on gut feelings and organizational key influencers’ opinions.
The proposed model in this work provides organizations with a unique and valuable tool to, in a quantitative way, identify hidden corporate dynamic behaviors, which, according to latest research [6,10,12,48], cannot be understood and managed by the application of traditional project management tools and techniques.
Furthermore, the proposed model maps (uncovers) and analyzes four critical project social networks ((1) communication, (2) problem-solving, (3) advice, and (4) trust), which, according to several studies [6,12,13,15,29,45,46,56]—as they center the analysis in the centrality of a social network—, are the networks that are most unique and valuable in providing insight regarding the understanding of how corporate behavioral patterns may evolve to behavioral risks and thus impact project’s outputs and outcomes.
The application of the proposed model in organizations provides a valuable and measurable historic evolution regarding collaboration between the different project stakeholders that participate in collaborative projects across the different phases of a project lifecycle. In other words, the proposed model enables one to generate lessons learned in a quantitative way that can be better understood and can be correlated to project outputs and outcomes. This aspect strongly contributes to the achievement of sustainable competitive advantages in the short-, medium-, and long-term, regarding cooperative partnerships. Still, the proposed model provides organizations a unique push towards the adoption of a new way of thinking about organizational work, and the implementation of new technologies that ultimately contribute to a more effective and efficient working culture.
The model presented in this work can be fully automated once efficiently integrated into an organizational business intelligence architecture. By doing so, the proposed model in this work can access data and perform analysis in a more bias-free way, while simultaneously eliminating or minimizing data collection down-time, contrary to the traditional process of, for example, answering surveys in an online project-dedicated platform (also called pulse surveys).
Still, the proposed model in this work contributes to the transformation process from a reactive reporting organization (recording past business events) towards a more responsive and intelligent organization, which is characterized by the transformation of data into valuable and unique business insights that improve performance and innovation by helping take the right decisions at the right time in a more data-informed way. This represents a whole new paradigm in organizations across their traditional organizational value-chains.
Finally, it can be concluded that the proposed model in this work provides organizations with a heuristic model to better plan and manage their corporate partnerships, which in turn will help them to optimize resource usage, while simultaneously leading them to a leaner organization, positively contributing to the three fundamental pillars of sustainability ((1) economic, (2) social, and (3) environmental) in a more effective way.
5.3. Proposed Model in This Work and Ethical and Legal Considerations
The proposed model in this work accesses and analyzes data that can be classified as sensitive and confidential by many organizations that deliver projects. Many organizations may not want such project-related information that flows across the different project stakeholders across a project lifecycle to be accessed and/or exposed. Therefore, the implementation and application of the proposed model in this work is totally dependent on the acceptance of the competent authorities, at both the organizational and national levels, that administer the respective legal and ethical issues, as is the case of the GDPR (General Data Protection Regulation) regulations applied in European countries. Furthermore, for a healthy application of the proposed model in this work, all the project stakeholders that participate in the delivery of a project should be informed in advance that project behavioral information will be accessed and analyzed for the purpose of controlling and monitoring project evolution, thus minimizing the chances of project failure.
5.4. Suggestions for Future Research
The implementation and application of the model proposed in this work may represent a certain challenge for organizations. This may happen as organizations do not yet have the necessary technologies and/or working culture that enables the proposed model in this work to efficiently identify corporate behavioral risks. To efficiently implement and apply the proposed model in this work, it is recommended that organizations first create an organizational architecture (for example, the integration of the model proposed in this work into an organizational business intelligence architecture), where data can be collected, stored, and available to be analyzed. Unfortunately, such a step may not be possible for many organizations. Becoming a data-literate organization—which is characterized by the ability to understand, engage, analyze, and reason with data—is still a challenge for many organizations. Therefore, further research should be also conducted into finding alternative ways (more accessible to the majority of organizations) that enable organizations to acquire technology that enables them to democratize (make accessible to everyone, bottleneck-free, except if it is considered confidential or highly sensitive), normalize (standardized—the same values, expressions, language, and so on), and create or acquire relational data across different applications and geographies.
The model proposed in this work collects data from project emails, project surveys, and project observations. However, as there are several project-information-related flows across other communication channels, such as phone calls, corridor meetings, and virtual communication platforms, research in the data collection methods field should be conducted in order to create mechanisms to access data in a way that would not go against GDPR regulations, namely regarding the access to private data.
Still, in order to support the applicability of the proposed model in the identification of project cooperative behavioral risks, the implementation and application of the model proposed in this work in a broader group of organizations that deliver projects is suggested. By doing so, it would be possible not only to improve the application process of SNA centrality metrics that are part of the actual version of the proposed model, but also to gain more insight regarding the impacts of dynamic corporative behaviors in project outcomes, and thus generalize (correlate) cooperative dynamic behaviors with project outcomes with a higher degree of likelihood.
Finally, further research should be conducted to explore the capabilities of other existing SNA centrality—but not only centrality—metrics regarding the quantification of cooperative behavioral patterns.
Author Contributions
M.N. carried out the investigation methodology, writing—original draft preparation, conceptualization, formal analysis, and collected resources. A.A. contributed with the writing—review and editing, supervision, and final validation. C.S. contributed with the writing—review and editing, and final validation. All authors have read and agreed to the published version of the manuscript.
Funding
This research received no external funding.
Institutional Review Board Statement
Not applicable.
Informed Consent Statement
Not applicable.
Data Availability Statement
All available data to support results is available in the present manuscript and can be publicly consulted in the present manuscript.
Conflicts of Interest
The authors declare no conflict of interest.
References
- Seymour, T.; Hussein, S. The history of project management. Int. J. Manag. Inf. Syst. 2014, 18, 233–240. [Google Scholar] [CrossRef] [Green Version]
- Kwak, Y.H. Brief history of project management. In The Story of Managing Projects; Carayannis, K.A., Ed.; Quorum Books: Westport, CT, USA, 2003; Chapter 2. [Google Scholar]
- Snyder, J.R. Modern project management: How did we get here—Where do we go? Proj. Manag. J. 1987, 18, 28–29. [Google Scholar]
- PMI.PMI® (Project Management Institute). Project Management Body of Knowledge (PMBOK® Guide), 6th ed.; Project Management Institute: Newtown Square, PA, USA, 2017. [Google Scholar]
- Hillson, D.D. The Risk Doctor—Speaker at Risk Zone 2012. Stamford Global. Available online: https://www.youtube.com/watch?v=0d3y863itjk (accessed on 1 January 2018).
- Nunes, M.; Abreu, A.; Saraiva, C. A Model to Manage Cooperative Project Risks to Create Knowledge and Drive Sustainable Business. Sustainability 2021, 13, 5798. [Google Scholar] [CrossRef]
- The Standish Group International, Inc. CHAOS REPORT 2015. Available online: https://www.standishgroup.com/sample_research_files/CHAOSReport2015-Final.pdf (accessed on 1 February 2017).
- The Standish Group International, Inc. Project Resolution Benchmark Report—Jennifer Lynch—2018. Available online: https://www.standishgroup.com/sample_research_files/DemoPRBR.pdf (accessed on 1 February 2018).
- Project Performance Metrics. Reprinted from PMI’s Pulse of the Profession 9th Global Project Management Survey, by Project Management Institute. 2017. Available online: https://www.pmi.org/-/media/pmi/documents/public/pdf/learning/thought-leadership/pulse/pulse-of-the-profession-2017.pdf (accessed on 1 February 2018).
- Nunes, M.; Abreu, A. Applying social network analysis to identify project critical success factors. Sustainability 2020, 12, 1503. [Google Scholar] [CrossRef] [Green Version]
- Hillson, D.; Murray-Webster, R. Understanding and Managing Risk Attitude; Gower Publishing Ltd.: Aldershot, UK, 2007. [Google Scholar]
- Abreu, A.; Martins Moleiro, J.D.; Calado, J.M.F. Fuzzy Logic Model to Support Risk Assessment in Innovation Ecosystems, 2018. In Proceedings of the 13th APCA International Conference on Automatic Control and Soft Computing (CONTROLO), Ponta Delgada, Portugal, 4–6 June 2018; pp. 104–109. [Google Scholar]
- Workday Studios. Good Company—Michael Arena, Chris Ernst, Greg Pryor: Organizational Networks. 2018. Available online: https://www.youtube.com/watch?v=6faV0v0yVFU (accessed on 12 January 2021).
- Nunes, M.; Abreu, A. Managing open innovation project risks based on a social network analysis perspective. Sustainability 2020, 12, 3132. [Google Scholar] [CrossRef]
- Arena, M. Adaptive Space: How GM and Other Companies are Positively Disrupting Themselves and Transforming into Agile Organizations; McGraw Hill Education: New York, NY, USA, 2018. [Google Scholar]
- Björkman, I.; Kock, S. Social relationships and business networks: The case of Western companies in China. Int. Bus. Rev. 1995, 4, 519–535. [Google Scholar] [CrossRef]
- Kontinen, T.; Ojala, A. Network ties in the international opportunity recognition of family SMEs. Int. Bus. Rev. 2011, 20, 440–453. [Google Scholar] [CrossRef] [Green Version]
- Cross, R.; Rebele, R.; Grant, A. Collaborative Overload. Harv. Bus. Rev. 2016, 94, 74–79. [Google Scholar]
- Nunes, M.; Dias, A.; Abreu, A.; Martins, J.D.M. A predictive risk model based on social network analysis. In Proceedings of the 34th European Simulation and Modelling Conference, Toulouse, France, 21–23 October 2020; pp. 82–86. [Google Scholar]
- Durland, M.; Fredericks, K. An introduction to social network analysis. New Dir. Eval. 2006, 2005, 5–13. [Google Scholar] [CrossRef]
- Otte, E.; Rousseau, R. Social network analysis: A powerful strategy, also for the information sciences. J. Inf. Sci. 2002, 28, 441–453. [Google Scholar] [CrossRef]
- Nunes, M.; Abreu, A. A Model to support OI collaborative risks applying social network analysis. In Boosting Collaborative Networks 4.0. PRO-VE 2020. IFIP Advances in Information and Communication Technology; Camarinha-Matos, L.M., Afsarmanesh, H., Ortiz, A., Eds.; Springer: Cham, Switzerland, 2020; Volume 598. [Google Scholar]
- Shehab, E. The True Cause of Project Failures, 2016—MCI Group—USA. Project Smart UK. 2018. Available online: https://articlebiz.com/article/1051638112-the-true-cause-of-project-failures (accessed on 12 March 2021).
- ISO–The International Organization for Standardization. Available online: https://www.iso.org/home.html (accessed on 1 September 2020).
- Hamdu, M.; Knapkova, A. The impact of total risk management on company’s performance. Procedia Soc. Behav. Sci. 2016, 220, 271–277. [Google Scholar]
- Davies, D. Risk management: Holistic risk management. Comput. Law Secur. Rev. 1997, 13, 336–339. [Google Scholar] [CrossRef]
- Hillson, D. How to manage the risks you didn’t know you were taking. In Proceedings of the PMI® Global Congress 2014—North America, Phoenix, AZ, USA, 26–28 October 2014. [Google Scholar]
- Seed, P.; Lloyd, G. Quality of Life; Jessica Kingsley Publishers: London, UK, 1997. [Google Scholar]
- Borgatti, S.P.; Everett, M.; Johnson, J. Analyzing Social Networks, 2nd ed.; Sage Publications Ltd.: London, UK, 2017. [Google Scholar]
- Kacanski, S.; Lusher, D. The Application of Social Network Analysis to Accounting and Auditing. Int. J. Acad. Res. Account. Financ. Mang. Sci. 2017, 7, 182–197. [Google Scholar] [CrossRef] [Green Version]
- Clifton, A.; Webster, G. An Introduction to Social Network Analysis for Personality and Social Psychologists. Soc. Psychol. Pers. Sci. 2017, 8, 442–453. [Google Scholar] [CrossRef]
- Maghraoui, A.; Richman, B.; Siegel, D.; Zanalda, G. Networks of Cooperation and Conflict in the Middle East (2017–2018). 2019. Available online: https://bassconnections.duke.edu/project-teams/networks-cooperation-and-conflict-middle-east-2017-2018 (accessed on 4 January 2020).
- Jarman, D.; Eleni, T.; Hazel, H.; Ali-Knight, J. Social network analysis and festival cities: An exploration of concepts, literature, and methods. Int. J. Event Festiv. Manag. 2014, 5, 311–322. [Google Scholar] [CrossRef]
- Ward, M.; Stovel, K.; Sacks, A. Network analysis and political science. Annu. Rev. Political Sci. 2011, 14, 245–264. [Google Scholar] [CrossRef]
- Mitchell, J.C. Social Network Analysis for Organizations, 4th ed.; Tichy, N.M., Tushman, M.L., Fombrun, C., Eds.; Academy of Management Review: Briarcliff Manor, NY, USA, 1979; pp. 507–519. [Google Scholar]
- Meyer, M.; Roodt, G.; Robbins, M. Human resources risk management: Governing people risks for improved performance. SA J. Hum. Resour. Manag. 2011, 9, 366. [Google Scholar] [CrossRef] [Green Version]
- Ruan, X.; Ochieng, P.; Price, A. The Evaluation of Social Network Analysis Application’s in the UK Construction Industry. In Proceedings of the 27th Annual ARCOM Conference, Bristol, UK, 5–7 September 2011; Association of Researchers in Construction Management ARCOM: London, UK, 2011. [Google Scholar]
- Carlsson, L.; Sandström, A. Network governance of the commons. Int. J. Commons 2008, 2, 33–54. [Google Scholar] [CrossRef]
- Newig, J.; Günther, D.; Pahl-Wostl, C. Synapses in the network: Learning in governance networks in the context of environmental management. Ecol. Soc. 2010, 15, 24. [Google Scholar] [CrossRef]
- Krackhardt, D.; Hanson, J. Informal Networks the Company behind the Charts; Harvard College Review: Cambridge, MA, USA, 1993; Available online: https://hbr.org/1993/07/informal-networks-the-company-behind-the-chart (accessed on 5 March 2019).
- Mead, S.P. Using social network analysis to visualize project teams. Proj. Manag. J. 2001, 32, 32–38. [Google Scholar] [CrossRef]
- Cross, R.; Parker, A. The Hidden Power of Social Networks: Understanding How Work Really Gets Done in Organizations; Harvard Business School Press: Boston, MA, USA, 2004. [Google Scholar]
- Prell, C.; Hubacek, K.; Reed, M. Stakeholder analysis and social network analysis in natural resource management. Soc. Nat. Resour. 2009, 22, 501–518. [Google Scholar] [CrossRef]
- Mok, K.Y.; Shen, G.Q.; Yang, R.J.; Li, C.Z. Investigating key challenges in major public engineering projects by a network-theory based analysis of stakeholder concerns: A case study. Int. J. Proj. Manag. 2017, 35, 78–94. [Google Scholar] [CrossRef]
- Freeman, L. Centrality in social networks conceptual clarification. Soc. Netw. 1979, 1, 215–239. [Google Scholar] [CrossRef] [Green Version]
- Ove, F. Using centrality modeling in network surveys. Soc. Netw. 2002, 24, 385. [Google Scholar]
- Brass Daniel, J.; Borgatti Stephen, P. Social Networks at Work (SIOP Organizational Frontiers Series), 1st ed.; Routledge Publisher: New York, NY, USA, 2020. [Google Scholar]
- Knoke, D.; Kuklinski, J.H. Network analysis. In Sage University Paper Series on Quantitative Applications in the Social Sciences; Sage: Newbury Park, CA, USA, 1982. [Google Scholar]
- Narsalay, R.; Kavathekar, J.; Light, D. A Hands-Off Approach to Open Innovation Doesn’t Work. 2016. Available online: https://hbr.org/2016/05/a-hands-off-approach-to-open-innovation-doesnt-work (accessed on 4 March 2020).
- Ng, D.; Law, K. Impacts of informal networks on innovation performance: Evidence in Shanghai. Chin. Manag. Stud. 2015, 9, 56–72. [Google Scholar] [CrossRef]
- Arthur, C. Tech Giants May Be Huge, but Nothing Matches Big Data. Available online: https://www.theguardian.com/technology/2013/aug/23/tech-giants-data (accessed on 20 January 2021).
- Bhageshpur, K. Data Is the New Oil—And That’s a Good Thing. Available online: https://www.forbes.com/sites/forbestechcouncil/2019/11/15/data-is-the-new-oil-and-thats-a-good-thing/?sh=44f0b44c7304 (accessed on 10 January 2021).
- European Parliament. Is Data the New Oil? Competition Issues in the Digital Economy. Available online: https://www.europarl.europa.eu/RegData/etudes/BRIE/2020/646117/EPRS_BRI(2020)646117_EN.pdf (accessed on 7 January 2021).
- Arena, M.; Cross, R.; Sims, J.; Uhl-Bien, M. How to Catalyze Innovation in Your Organization. 2017. Available online: https://www.robcross.org/wp-content/uploads/2020/03/SMR-how-to-catalyze-innovation-in-your-organization-connected-commons.pdf (accessed on 29 March 2021).
- Santos, R.; Abreu, A.; Anes, V. Developing a green product-based in an open innovation environment. Case study: Electrical vehicle. In Collaborative Networks and Digital Transformation; IFIP Advances in Information and Communication Technology; Camarinha-Matos, L., Afsarmanesh, H., Antonelli, D., Eds.; Springer: Cham, Switzerland, 2019; Volume 568. [Google Scholar]
- Ballinger, G.; Craig, E.; Cross, R.; Gray, P. A stitch in time saves nine: Leveraging networks to reduce the costs of turnover. Calif. Manag. Rev. 2011, 53, 111–133. [Google Scholar] [CrossRef] [Green Version]
Figure 1.
The four fundamental scientific fields that support the development of the proposed model in this work.
Figure 1.
The four fundamental scientific fields that support the development of the proposed model in this work.

Figure 2.
The four critical networks of the proposed model in this work: (a) communication, (b) problem-solving, (c) advice, and (d) trust.
Figure 2.
The four critical networks of the proposed model in this work: (a) communication, (b) problem-solving, (c) advice, and (d) trust.

Figure 3.
Implementation process of the proposed model in this work, adapted from [4].
Figure 3.
Implementation process of the proposed model in this work, adapted from [4].

Figure 4.
Results of the application of SNA centrality metrics to the four critical project social networks of project 1, where sub-figures (a–d) are the communication network for pt7, the problem-solving network for pt7, the advice network for pt7, and the trust network for pt7 respectively.
Figure 4.
Results of the application of SNA centrality metrics to the four critical project social networks of project 1, where sub-figures (a–d) are the communication network for pt7, the problem-solving network for pt7, the advice network for pt7, and the trust network for pt7 respectively.

Figure 5.
Advice degree evolution throughout the organization and preparation phase of project 1.

Figure 6.
Trust degree evolution throughout the organization and preparation phase of project 1.


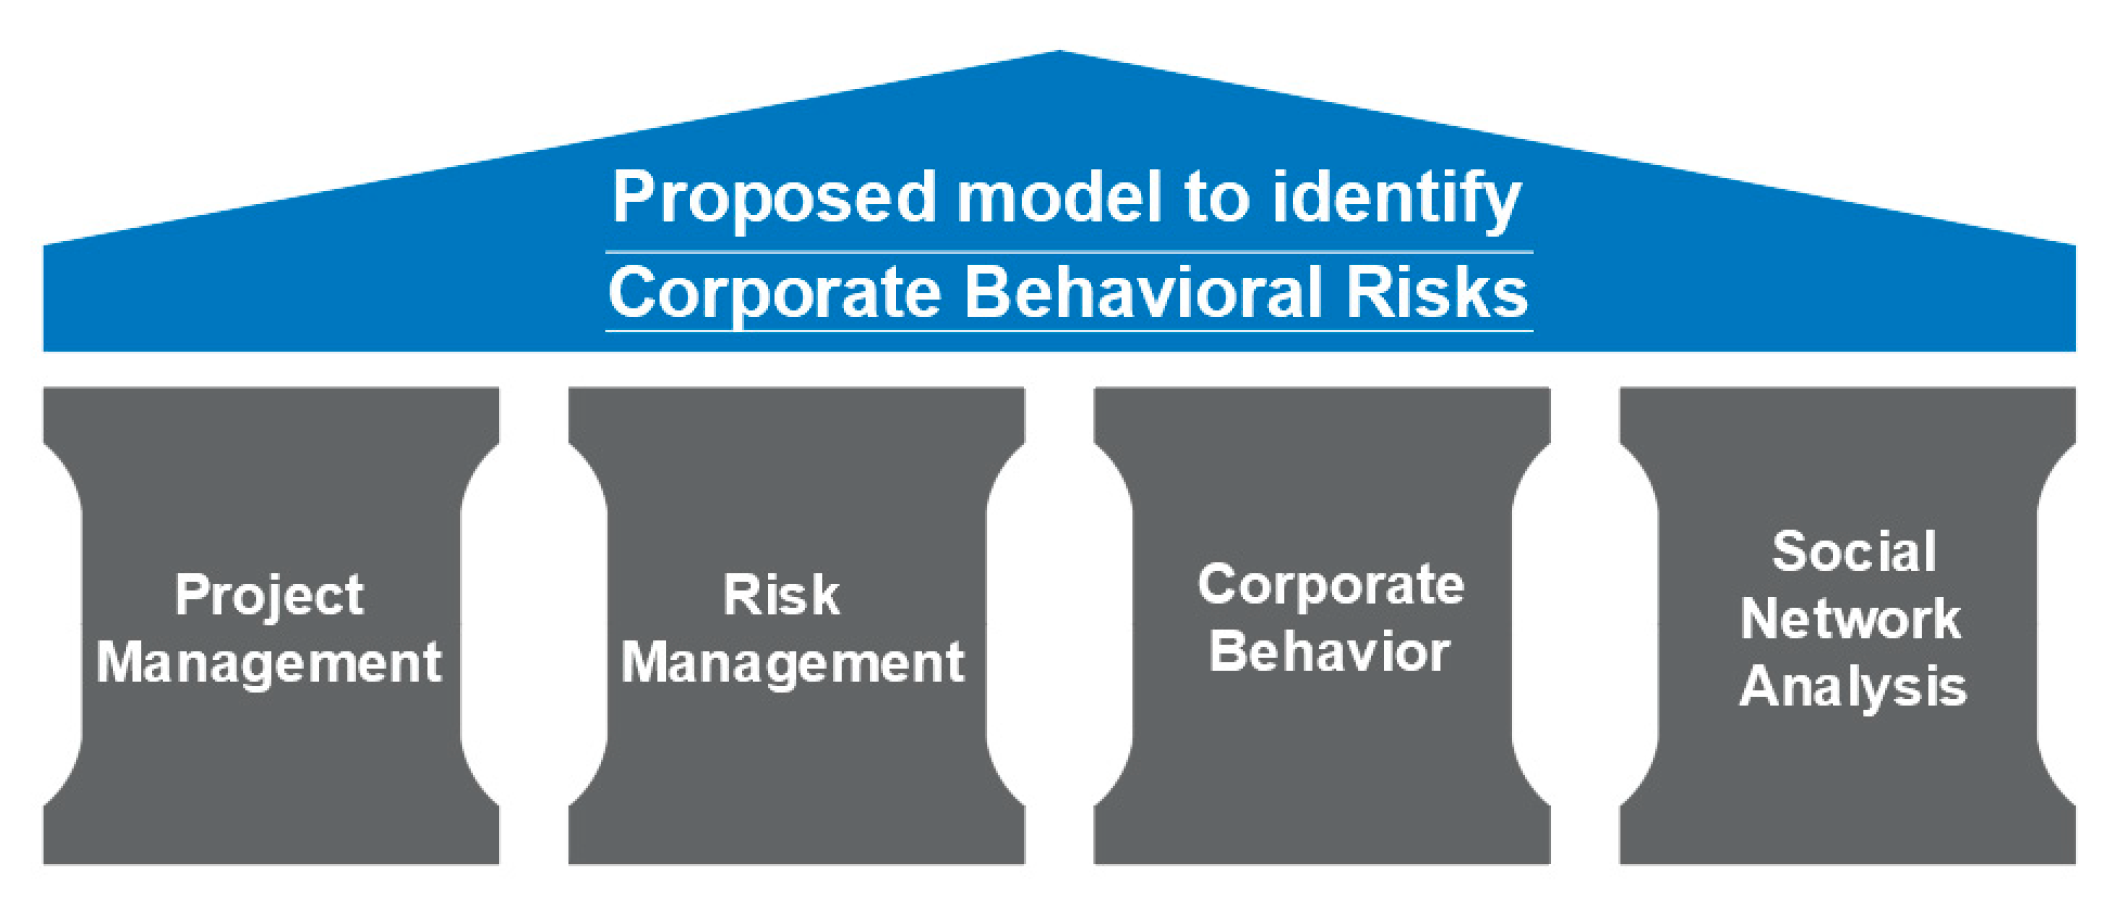
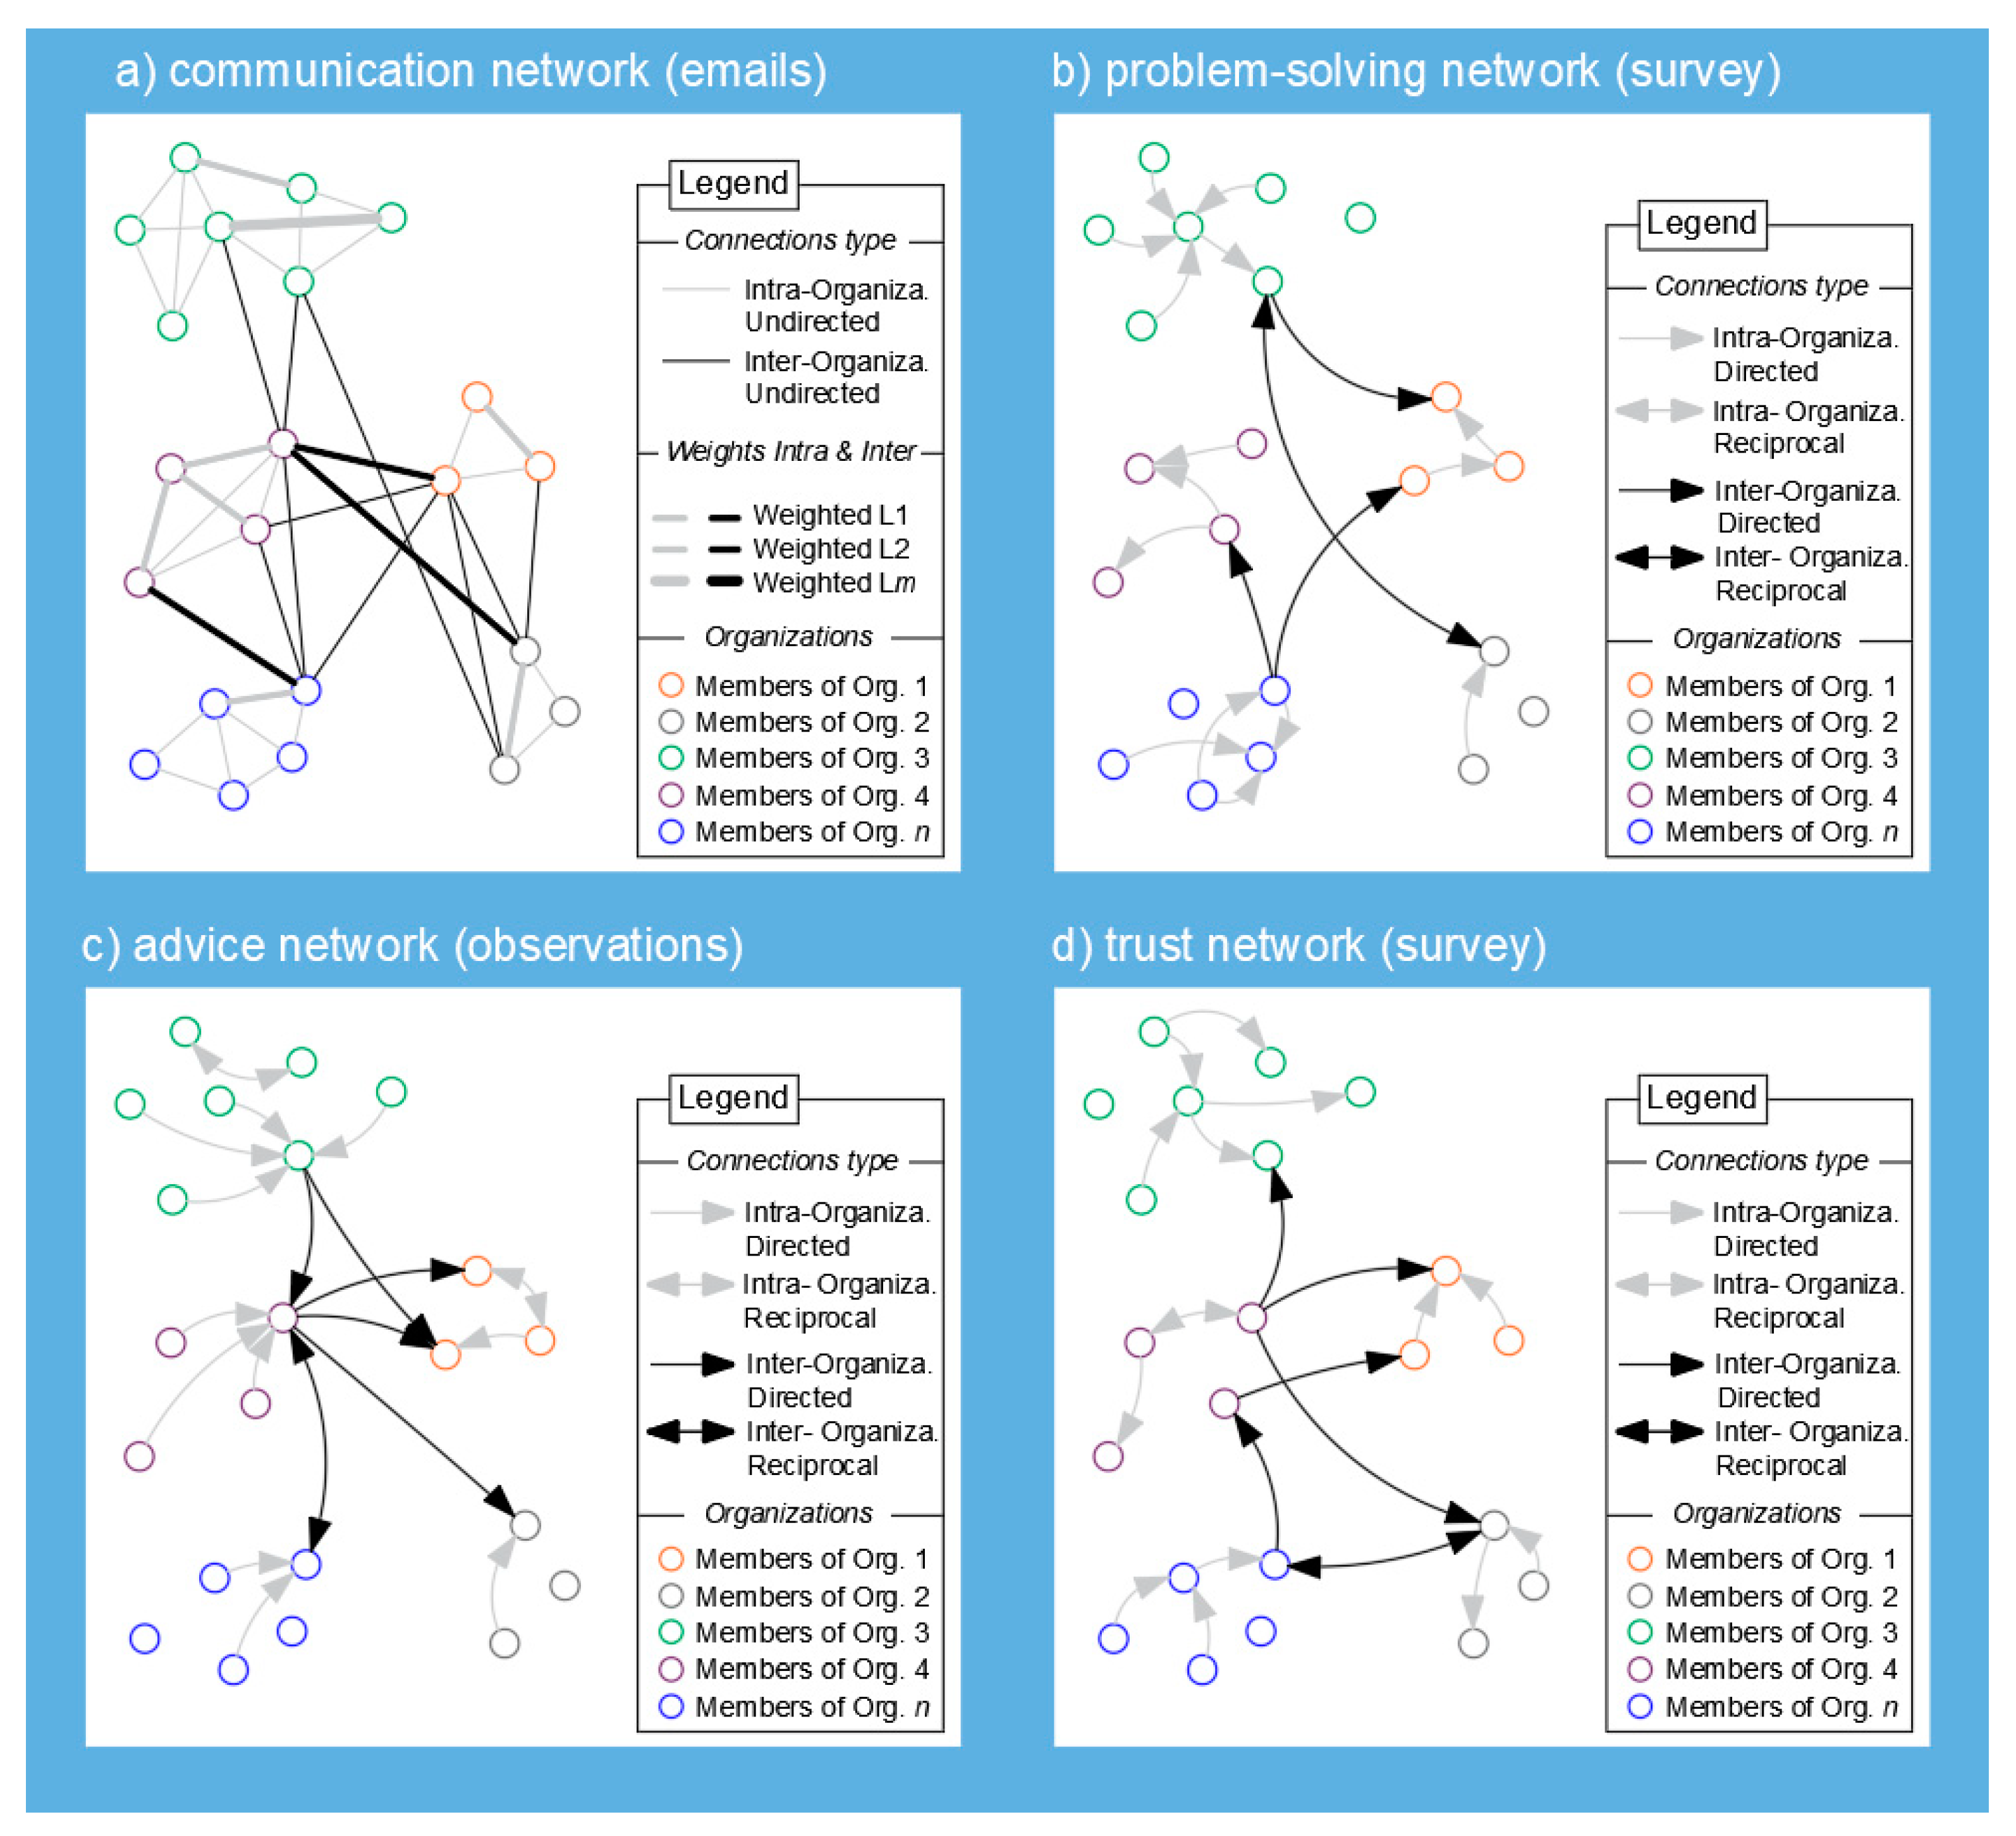
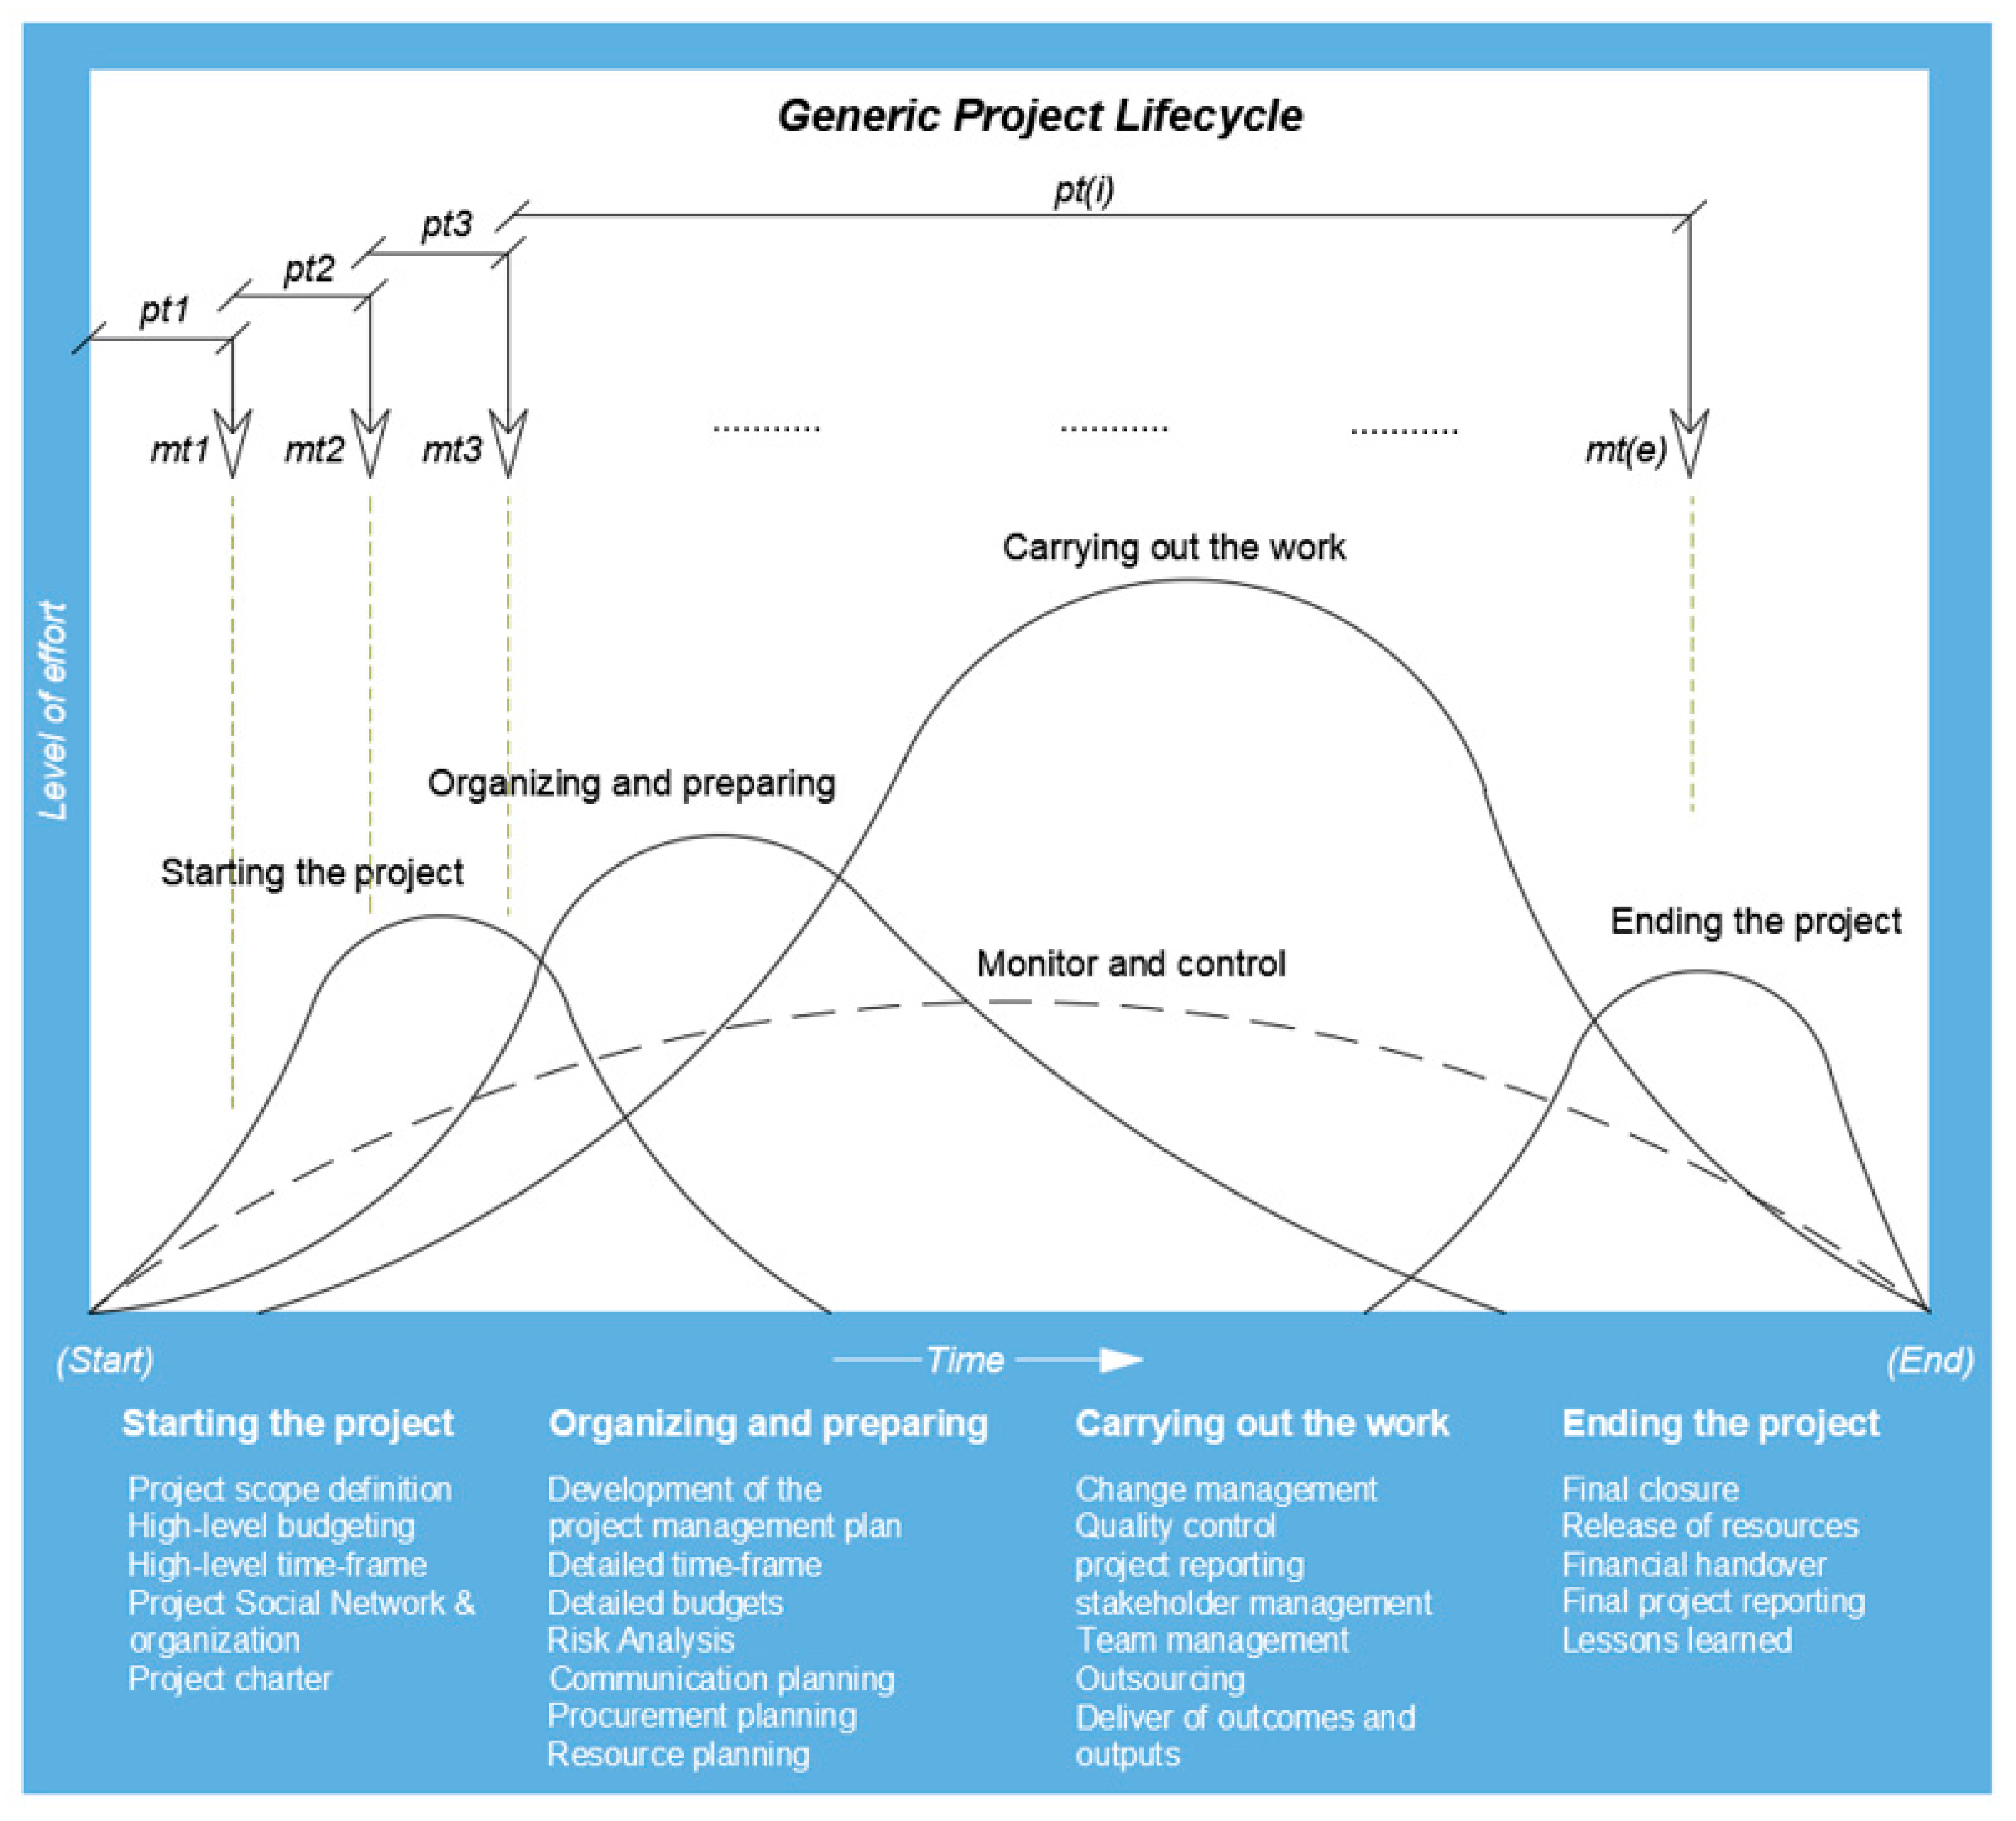
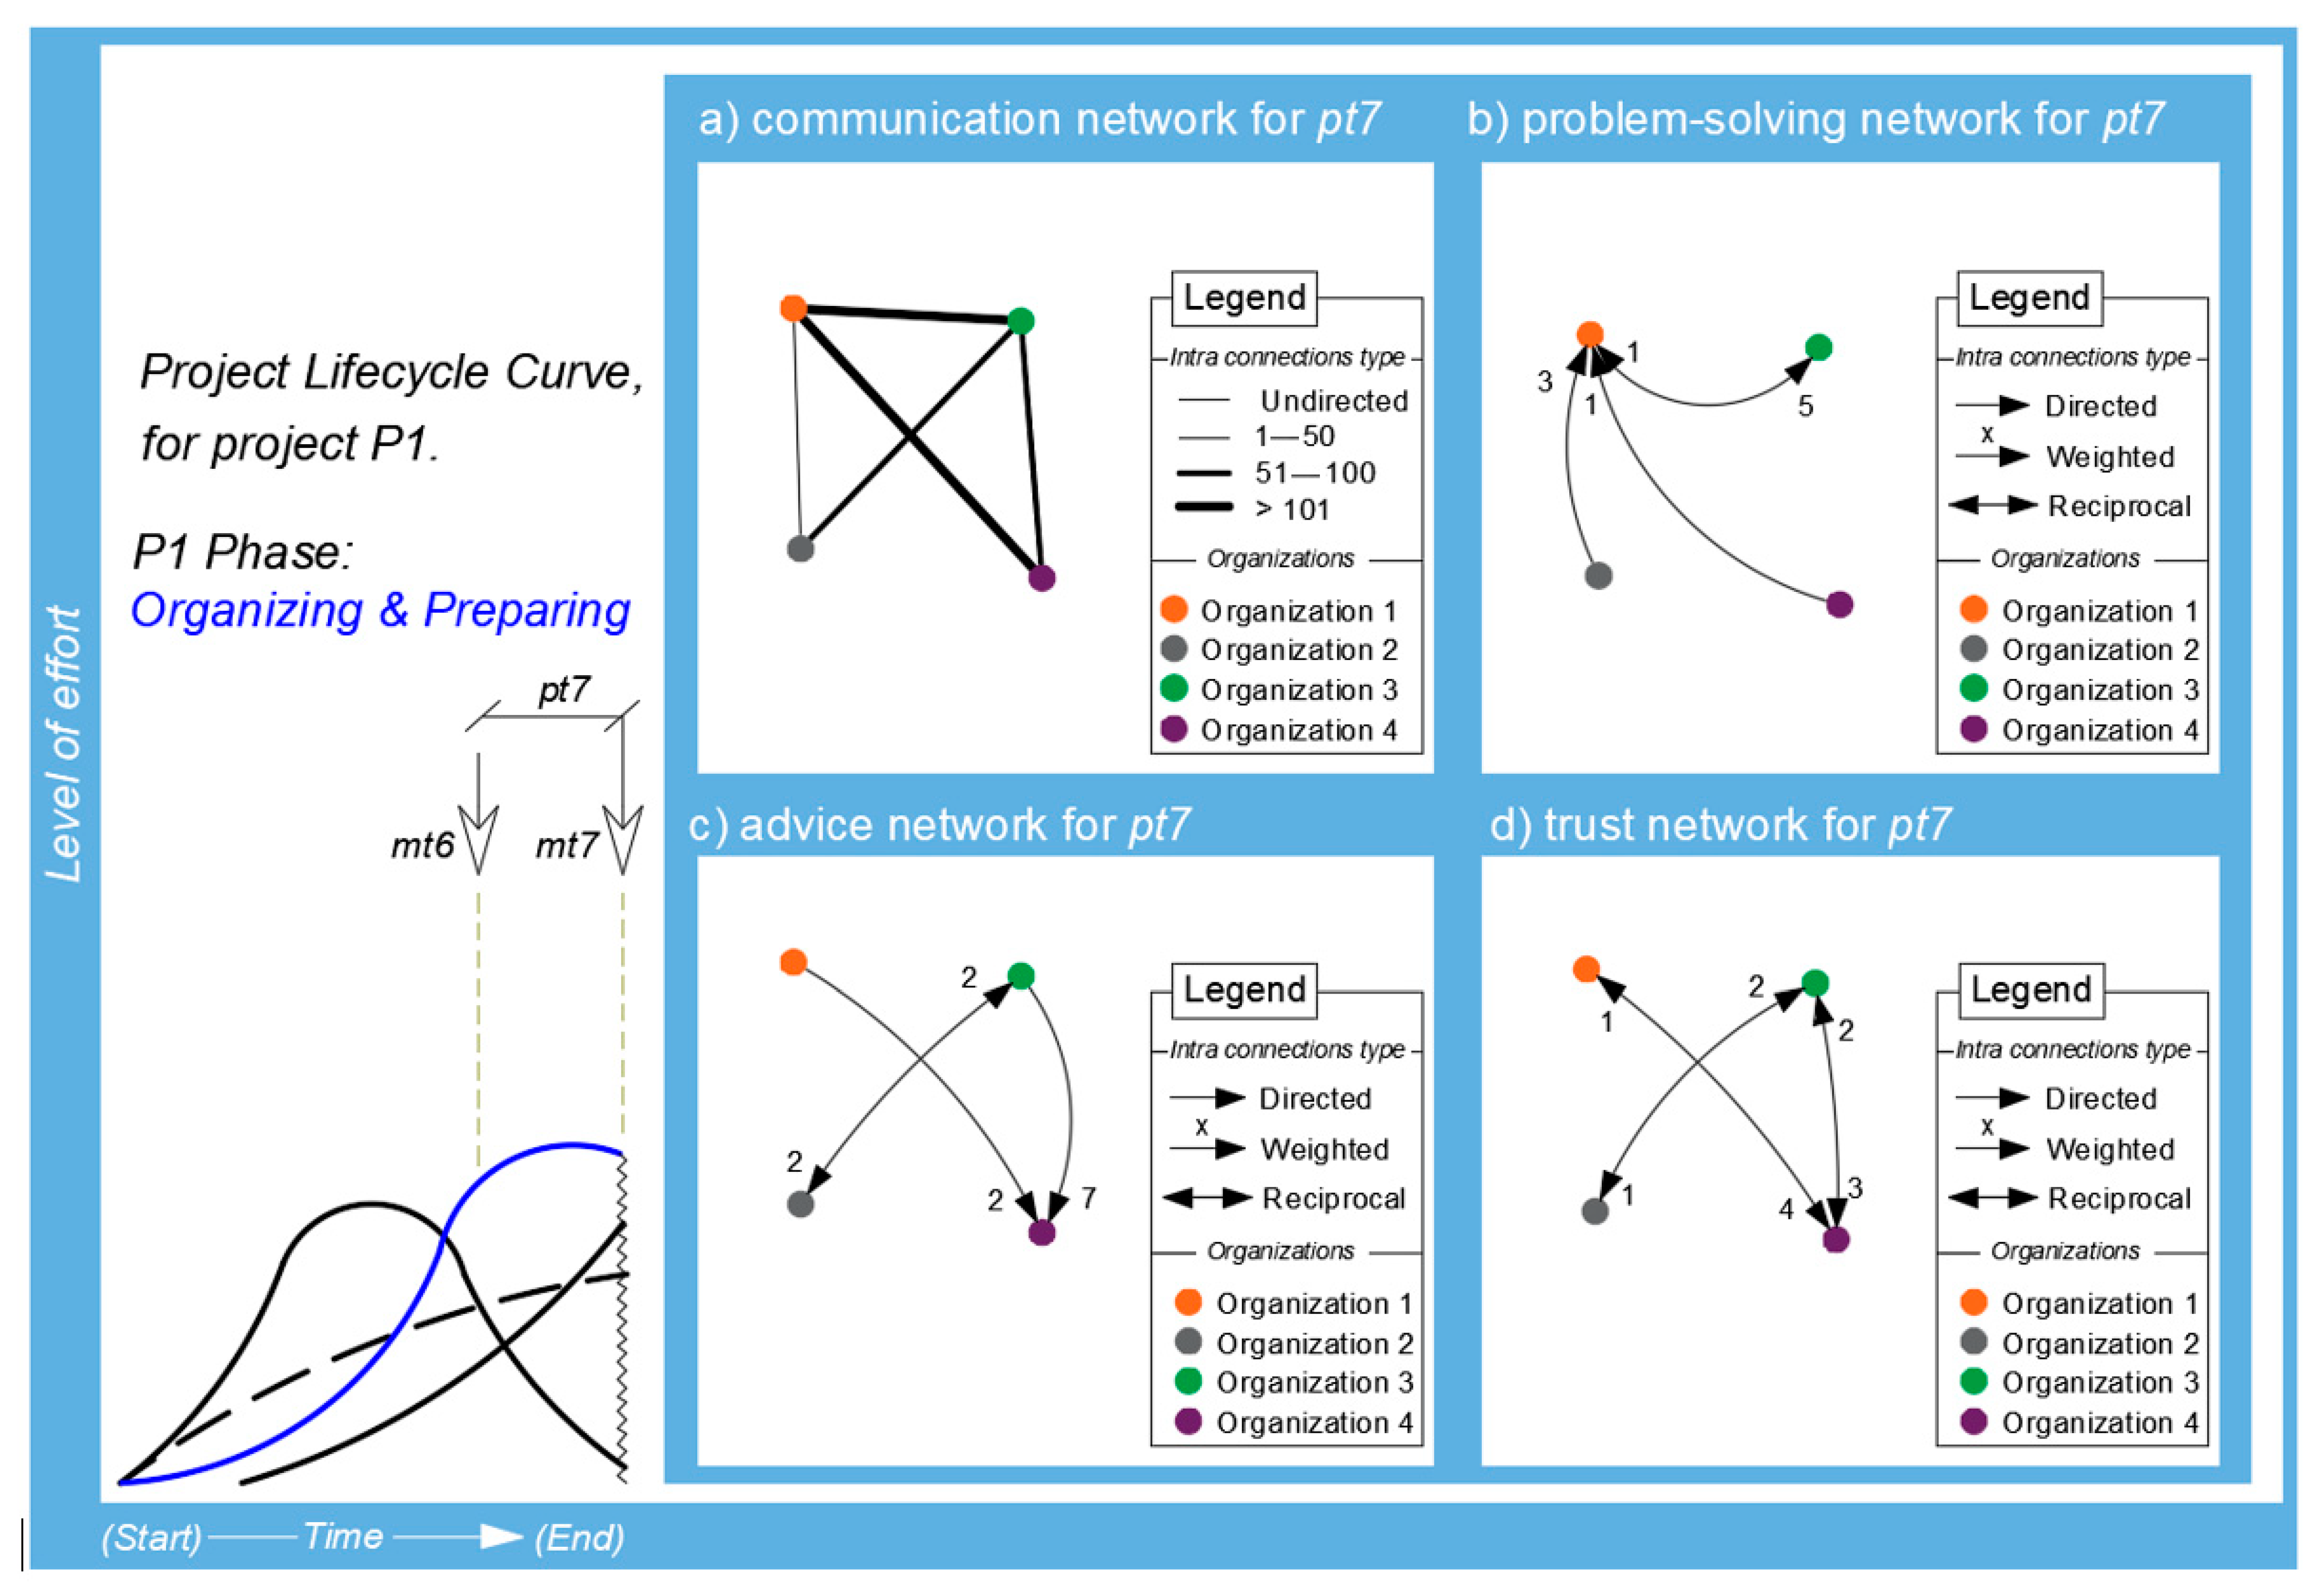
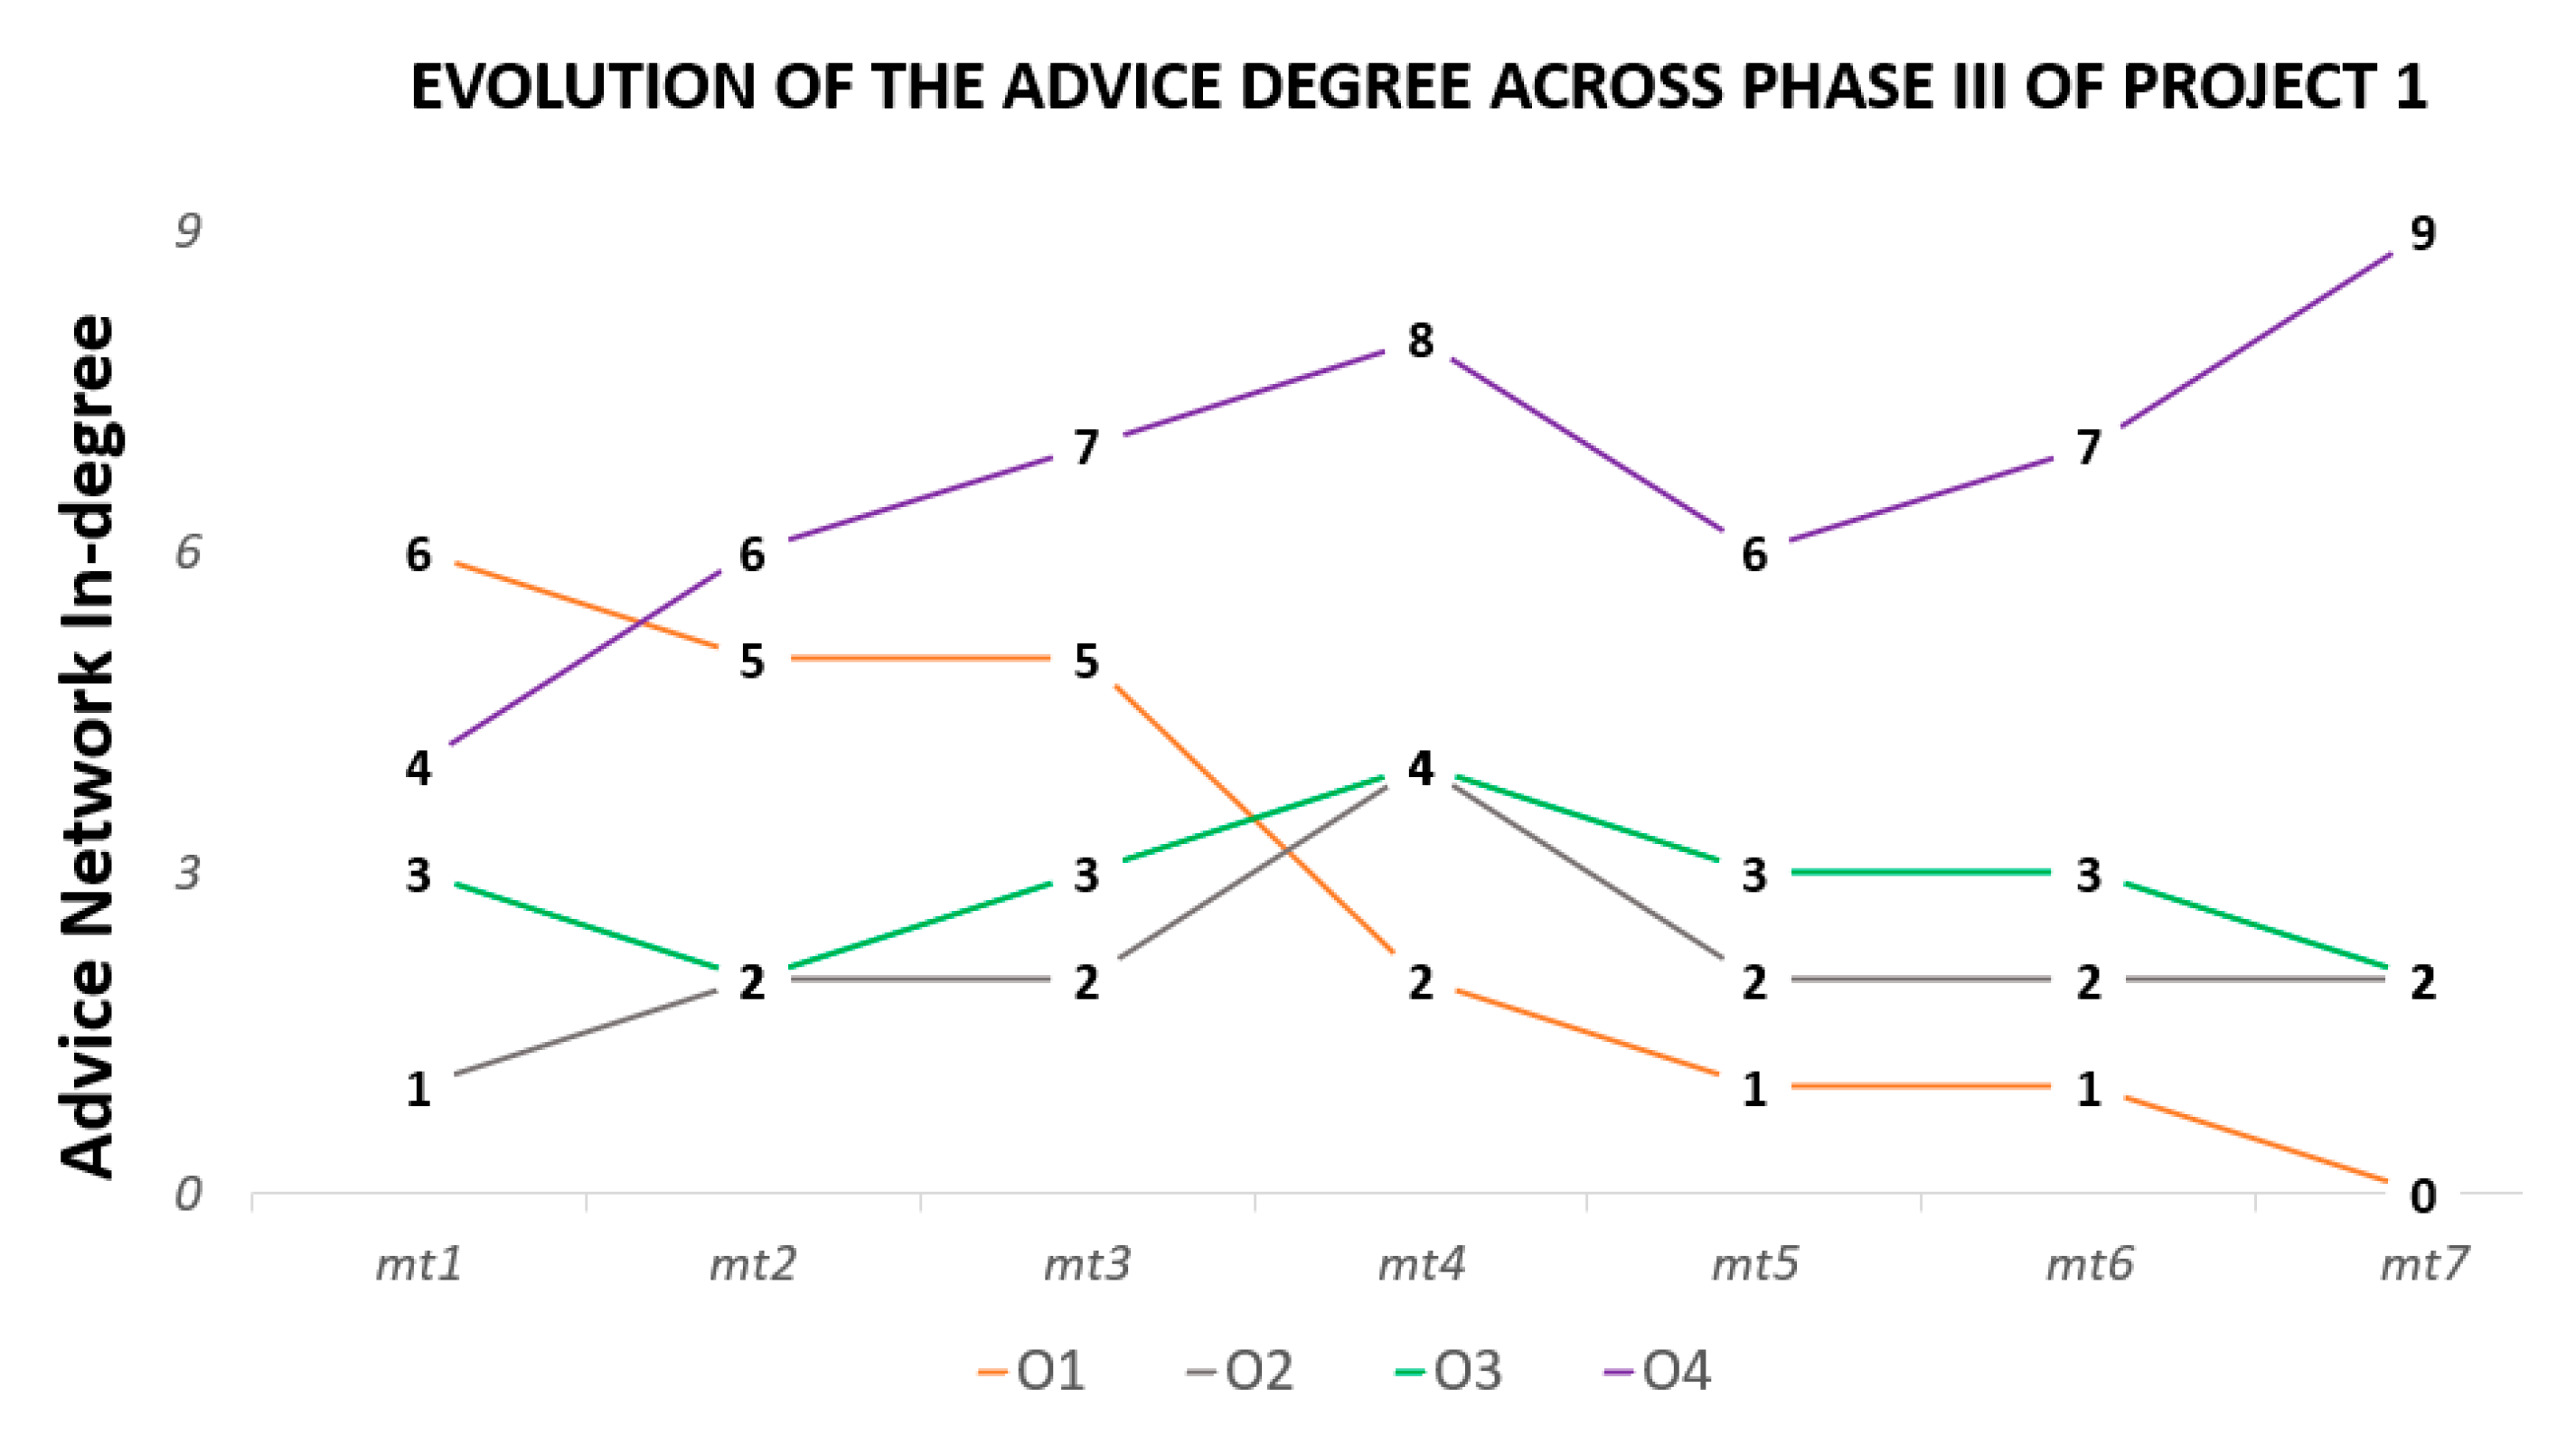
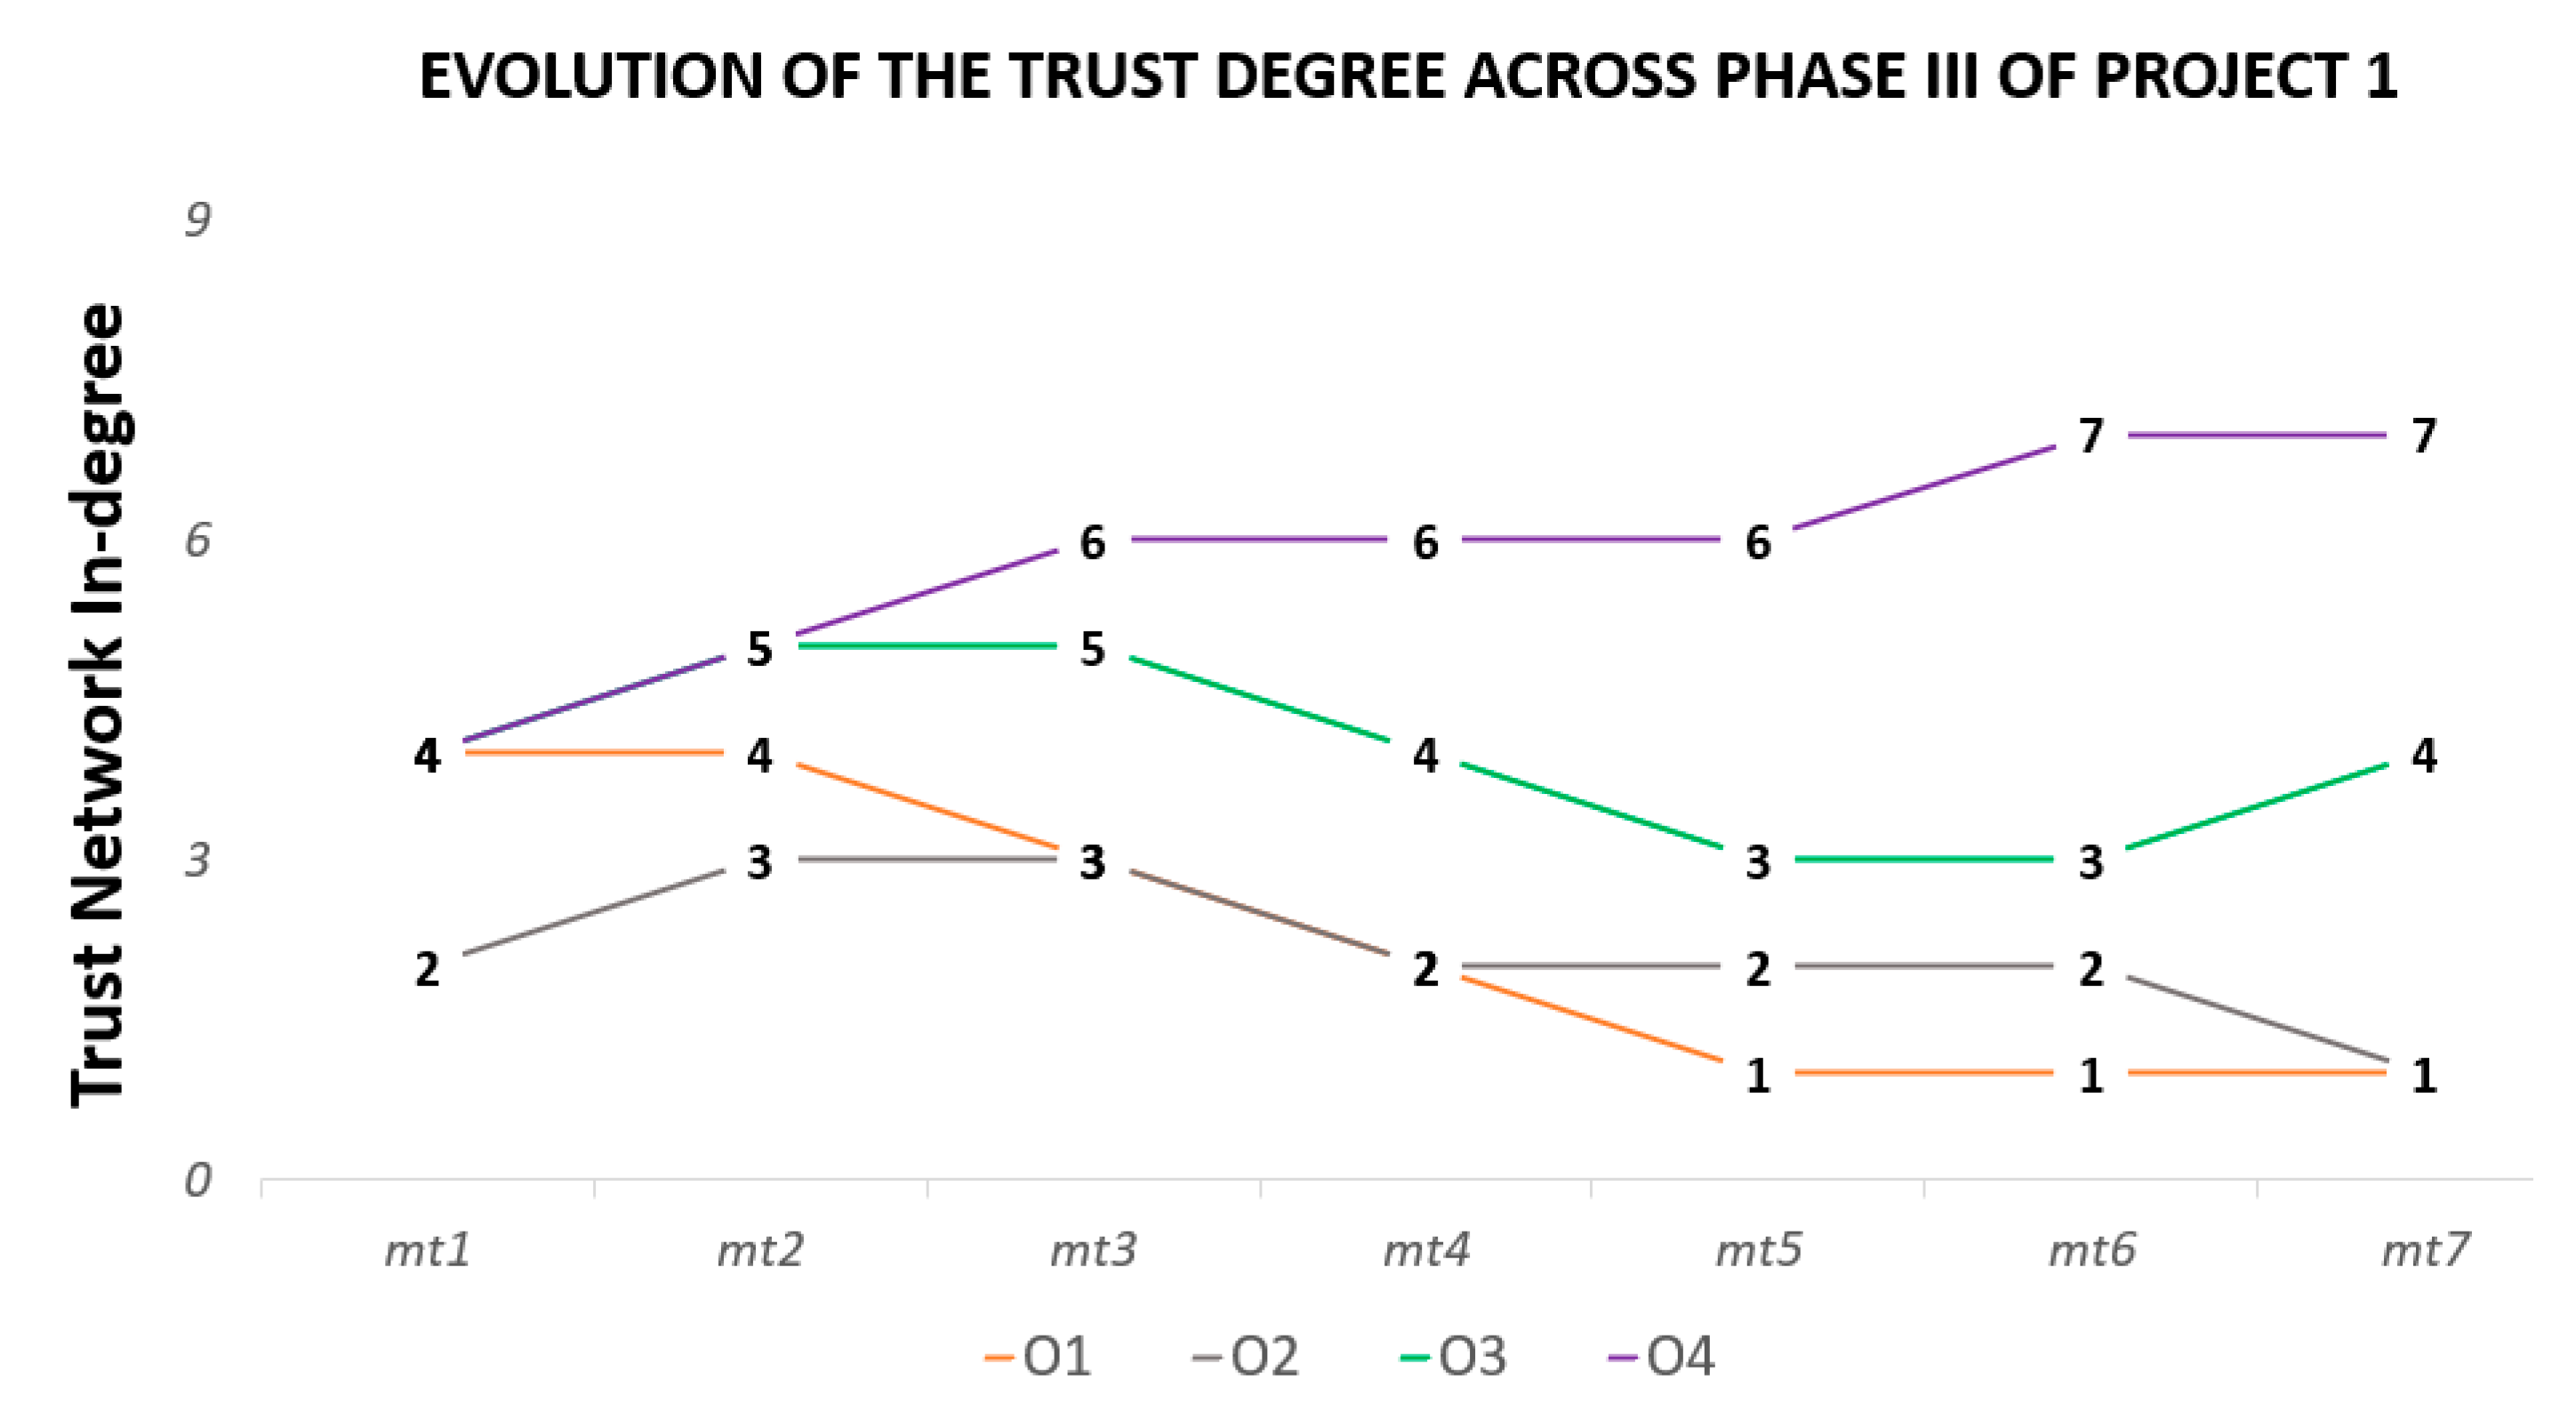
Table 1.
Four generic project risk types.
| Project Risk Types | What They Mean | How to Manage Them |
|---|---|---|
| (1) Event Risk | Risks related to something that has not yet happened, and it may indeed not happen at all, but if it does, it will surely impact project objectives. | Tools and techniques for identifying, assessing, treating, and monitoring risks, supported by well-known risk management standards and best practices. |
| (2) Variability Risk | Risk characterized by a given number of possible known outcomes; however, no one knows exactly which one will take place. | Advanced risk analysis models such as the Monte Carlo simulation. |
| (3) Ambiguity Risk | Risks that arise from lack of knowledge (know-how and know-what). They may include use of the latest project technology, and market and competitor capability or intentions, among other things. | Lessons learned, prototyping, and simulating techniques. |
| (4) Emergent Risk | Risk that are just unable to be seen or predicted, because they are outside a person’s mindset, and usually arise from game-changers and paradigm-shifters, such as disruptive inventions. | Efficient contingency planning. |
Table 2.
Proposed model functioning process.
| Risk Management Steps According to the ISO 31000:2018 Standard [24] | Proposed Model Process Equivalent Steps |
|---|---|
| Step 1: establish scope, context, and criteria | Define scope (project stakeholders’ behaviors across a project lifecycle) and establish information collection process (mails, surveys, etc.) to map the four critical project social networks (communication, problem-solving, advice, and trust). |
| Step 2: risk identification | Apply SNA centrality metrics to collected data, to quantitatively measure different behavioral patterns from project stakeholders. |
| Step 3: risk analysis | Analyze the results and correlate them with project evolution and desired or established collaborative patterns. |
| Step 4: risk evaluation | Evaluate the impact of identified collaborative behaviors in project outputs and outcomes in two dimensions—threats and opportunities. |
| Step 5: risk treatment | Define and implement strategies to support, correct, or adjust identified behavioral patterns. |
| Step 6: monitoring, & reviewing | Continuously monitor implemented supportive or corrective measures, in order to access their effectiveness and record lessons learned. |
Table 3.
Description of the four critical project social networks.
| (1) Communication | The mapping of the communication network in a project social network enables one to analyze aspects related to how effective, efficient, and centralized (or de-centralized) the communication that occurs between the different project stakeholders that work together to deliver projects is. Aspects such as frequency, intensity, reach, and broadness are entitled to be analyzed. For this matter, data from project email exchange, surveys or questionnaires, or observations can be used to map the communication of a project social network. |
| (2) Problem-solving | The mapping of the problem-solving network in a project social network enables one to identify critical partners or sub-networks, whereby expertise flows regarding project-related matters. Aspects such as frequency, intensity, reach, and diversity are entitled to be analyzed in the problem-solving network. For this matter, data from project email exchange, surveys or questionnaires, or observations can be used to map the project problem-solving of a project social network. |
| (3) Advice | The mapping of the advice network in a project social network enables one to identify key project partners or subnetworks, whereby support and some project matter expertise flows. Aspects such as intensity (translated into dependency), broadness, and diversity are entitled to be analyzed in the advice network. For this matter, data from project surveys or questionnaires, or observations can be used to map the project advice network of a project social network. |
| (4) Trust | The mapping of the trust network in a project social network enables one to identify critical project partners or sub-networks, whereby trust and support (translated into professional and personal) is established. Aspects such as intensity, frequency, confidence, empowerment, and reliability are entitled to be analyzed in the trust network. For this matter, data from project surveys or questionnaires, or observations can be used to map the project trust of a project social network. |
Table 4.
Proposed model SNA centrality metrics.
| Critical Project Social Networks | Data Collecting Method | Project Social Network Analysis Metrics and Objectives |
|---|---|---|
| (1) Communication | Emails: All exchanged email data (sent and received) between all participating project stakeholders related to project information regarding a given project phase. To be collected at the end of each project time mtn. | Objective: Identify who is central and who is peripherical within the project email exchange network. SNA Metric: Weighted in-degree Where: = total weighted degree of an entity within a graph n = total number of entities within a graph for i = 1 …, n xji = number of links and their weight from entity j to entity i, where i ≠ j, and vice versa, function of directed or undirected graph |
| (2) Problem-Solving | Survey: Addressed to all project stakeholders’ members that have participated in a given project phase. Data is collected at the end of each project time mtn. | Objective: Identify how the problem-solving network is established across the project social network. SNA Metric: In-degree Where: = total degree of an entity within a graph n = total number of entities within a graph for i = 1 …, n xji = number of links from entity j to entity i, where i ≠ j, and vice-versa, function of directed or undirected graph |
| (3) Advice | Observation: All project stakeholders’ dynamic interactions regarding the search for advice concerning project related matters observed on-site. Data is collected across a period of time ptn. | Objective: Identify how the advice network is established across the project social network. SNA Metric: In-degree (see Equation (b)) |
| (4) Trust | Survey: Addressed to all of an organization’s members that have participated in a given project phase. Data is collected at the end of each project time mtn. | Objective: Identify who trusts who, regarding project related information. SNA Metric: In-degree (see Equation (b)) |
Publisher’s Note: MDPI stays neutral with regard to jurisdictional claims in published maps and institutional affiliations. |
© 2021 by the authors. Licensee MDPI, Basel, Switzerland. This article is an open access article distributed under the terms and conditions of the Creative Commons Attribution (CC BY) license (https://creativecommons.org/licenses/by/4.0/).
Share and Cite
MDPI and ACS Style
Nunes, M.; Abreu, A.; Saraiva, C. Identifying Project Corporate Behavioral Risks to Support Long-Term Sustainable Cooperative Partnerships. Sustainability 2021, 13, 6347. https://0-doi-org.brum.beds.ac.uk/10.3390/su13116347
AMA Style
Nunes M, Abreu A, Saraiva C. Identifying Project Corporate Behavioral Risks to Support Long-Term Sustainable Cooperative Partnerships. Sustainability. 2021; 13(11):6347. https://0-doi-org.brum.beds.ac.uk/10.3390/su13116347
Chicago/Turabian StyleNunes, Marco, António Abreu, and Célia Saraiva. 2021. "Identifying Project Corporate Behavioral Risks to Support Long-Term Sustainable Cooperative Partnerships" Sustainability 13, no. 11: 6347. https://0-doi-org.brum.beds.ac.uk/10.3390/su13116347
Note that from the first issue of 2016, this journal uses article numbers instead of page numbers. See further details here.