1. Introduction
It is generally assumed that industry, logistics, and labor mobility do not function well without quality transport infrastructure and its maintenance. Moreover, a lack of investment in transport development deters international investors, affecting gross domestic product (GDP). The demand for freight transport is driven by economic growth [
1,
2,
3].
Most of the past research focused on the impact of building transport infrastructure on GDP in specific regions through which the new transport infrastructure leads.
The issue of the dependence of the length of transport infrastructure on transport performance in rail and road freight transport was addressed by Gnap et. al. [
4], but only selected European countries were examined using correlation analysis, which may distort the overall view of the importance of transport infrastructure, especially if its new construction in the EU Member States of Central and Eastern Europe is largely funded by EU structural funds.
The aim of the research was to consider the original study of the investments in transport infrastructure, not only the length of transport infrastructure. A new research question was also considered: on what do investments in transport infrastructure and the performance of road and rail freight transport depend? Moreover, the authors decided to compare the EU countries’ circumstances with the adequate ones in Japan, as the latter is a country where the use of rail passenger transport is highly developed and recognized. However, the development of rail freight transport is less commonly researched. It should be underlined that passenger transport is of greater interest to rail companies than freight in Japan, for several reasons, e.g., the country’s population, geographical distribution (an island country, stretching mainly in the northeast–southwest direction, characterized by long distances between localities), and both foreign and domestic tourism, shifting the burden of cargo delivery to maritime transport. The authors focus on these aspects and freight transport in Japan, in general, in the future; therefore, they are only briefly highlighted in this introduction. The data necessary for the research were obtained during a research visit by one of the coauthors of the paper in 2019 in Japan.
The main research question is whether there is any correlation between transport performance and infrastructure or transport performance and investment in infrastructure in relation to the mentioned countries and, if so, whether there is a connection between the selected countries where this correlation occurs.
The results of the research can in part help to decide on the priorities and benefits of investing in road and rail transport infrastructure. The transport infrastructure does not only need to be built, but it is necessary to ensure its continuous maintenance and repairs in order for its safe operation to be sustainable in the long run. This aspect is forgotten, especially in short-term planning, which is often linked to the election terms. The new or significantly reconstructed transport infrastructure also impacts transport performance in freight transport. Is it approximately the same in all countries surveyed? This question was also examined in this study.
2. Literature Review
The importance of transport infrastructure in terms of the transnational logistics chain is described in detail by Grakh et al. [
5], who address the redistribution of power to high-speed infrastructure in road, but mainly rail, transport. The need for quality infrastructure is further described by Aswal [
6], who highlights the need for, inter alia, industrial development, international trade, sustainable energy sources, and foreign investment. Rokick et al. examined the impact of the significant completion of motorways between 2005 (500 km) and 2015 (3000 km) on GDP growth and employment in the regions connected by the new transport infrastructures [
7]. The relationship between transport infrastructure and urban economic growth was examined based on a sample of 216 cities in China [
8]. The impact of the construction of high-speed railways in Italy on the economic growth and accessibility of the regions over a 10 year period is addressed by Cascetta et al. [
9]. The Granger causality between wealth and transport was examined based on a data sample involving 18 countries between 1970 and 2017 [
10]. Another contribution quantified the direct and indirect effects of part of the completed TEN-T corridors in the eastern part of the EU on regional GDP growth. Data and developed spatial analyses showed that regional GDP growth at the third level of the Nomenclature of Territorial Units for Statistics NUTS3 is 0.5–2% higher if the region has direct access to the newly built road [
11].
Skorobogatova and Kuzmina-Merlino outlined the issue of creating a methodology for the correct calculation of transport performance [
12]. The authors also describe how appropriate transport infrastructure has a positive effect on the economic and social development of the areas in which it is built.
Torrisi (2009) [
13] compared different methodologies for examining the impact of infrastructure on the economy, comparing four basic approaches to this analysis. The author shows that, even with the use of different methodologies, it is demonstrable that infrastructure development has a positive impact on domestic economies.
Financing infrastructure can be challenging, especially in developing countries. Correlation analysis was used to examine the impact of development aid investment in road transport infrastructure in Vietnam on GDP growth [
14].
The developed infrastructure should be treated with special care regarding aspects of sustainability. The issue of financing low-emission infrastructures, specifically in Japan, was addressed by Schumacher et. al. [
15]. Research on investment in political–economic infrastructure has also been conducted by Lorz [
16] and Baum-Snow et al. [
17]. Their research, in turn, showed that countries that are more export oriented than import oriented more strongly emphasize building ground infrastructure. Bond [
18] further examined the impact of investment in transport infrastructure and how cooperation in building international infrastructure connections may ultimately lead to lower transport costs. In their contribution [
19], the Polish researchers Kowalski and Wiśniewski pointed out that investments affect changes in transport accessibility and mobility, as well as resulting in changes in traffic flows. Further research has been carried out in China to determine the impact of motorway construction and regional interconnections on GDP, the environment, and CO
2 emissions [
20,
21].
The need to build TEN-T corridors to connect Western and Eastern Europe and the availability of this infrastructure was investigated using regression analysis [
11]. The results of the study of improving accessibility by building new road transport infrastructure using an econometric model can be found in [
22]. Research in China has also been carried out using correlation analysis to increase the impact of new transport corridors and hubs on GDP and the number of residents [
23]. Another study, using correlation analysis, was conducted on how the intensity of traffic on motorways correlates with an indicator of regional economic development [
24]. A similar output was realized in Mongolia for the period of 2000–2016, where the relationship between economic growth and traffic intensity according to transport infrastructure was examined [
25]. Correlation analysis was also applied to examine the impact of development aid investment in road transport infrastructure in Vietnam on GDP growth [
14].
The need to build transport infrastructure, especially with the aim of connecting regions, and to build integrated transport systems competitive with individual transport also requires the application of methods for setting construction priorities, as pointed out by Gasparik et al. [
26]. Both road and rail transport infrastructures are necessary to connect intermodal terminals to support the increased use of sustainable transport sectors [
27]. It is also important to increase the capacity of railway lines, where they are at the limit of permeability for rail freight [
28]. It is also necessary to revitalize regional railway lines if they are important for freight transport and integrated public passenger transport systems, as suggested by the authors in [
29,
30] for the example of Slovakia and Serbia.
The built transport infrastructure requires regular maintenance and, due to climate change, the additional construction of flood protection systems. Koks et al. point out that the annual cost of direct damage to road and rail infrastructure ranges from 3.1–22 billion dollars globally, 73% of which is caused by floods [
31]. The study did not take into account the additional damage associated with the malfunction of the transport infrastructure during repair. Dynamic weighing is important for the protection of new or reconstructed railway transport infrastructure as well as the correct collection of charges for their use [
32].
In order to increase rail freight performance, it is also important to address tariffs in order to be competitive, particularly against road freight [
33]. The prices in international road freight transport can be significantly affected by the harmonization of social regulations, especially in the area of minimum wages for drivers [
34].
As can be concluded based on the conducted literature review, investments in transport infrastructure are little researched, and most of the research concerns only one mode of transport. Therefore, it is worth analyzing investments in transport infrastructure from a broader perspective, not only the straightforward length of transport infrastructure. Consequently, the authors decided to consider a new research question that was noted in the introduction: on what do investments in transport infrastructure and the performance of road and rail freight transport depend, from the perspective of the selected countries? To answer this question, the appropriate methodology was applied, and an appropriate set of materials and data was collected and analyzed.
3. Materials and Methods
As already mentioned, previous research has focused mainly on the impact of building transport infrastructure on the change in GDP in the specific regions through which the new transport infrastructure leads.
Our proposed methodology examines the dependence of the length of transport infrastructure and also the investment in transport infrastructure on transport performance in road and rail freight transport. Transport performance of road and rail freight transport is related to economic activity in the given state’s respective region, especially with industrial production. A number of politicians are calling for the construction of new transport infrastructure in their regions in order to attract investment in industry in particular.
Japan was selected on the basis of well-known high-quality rail passenger transport, but knowledge about rail freight is not widely published. The data needed for carrying out the research were obtained during a study visit to Japan by one of the coauthors.
We examined possible data sources in the first step of our research. In order to correctly calculate the correlation coefficients, it was necessary to appropriately analyze data obtained from reliable sources. Therefore, the data were drawn from the Eurostat and Organisation for Economic Cooperation and Development (OECD) databases. However, not all data were available for all countries under the period studied. Therefore, the missing data were computed using trend curves based on moving averages.
The coefficients of the correlation between transport performance (X, further noted as Xroad and Xrail in relation to certain modes of transport) and the length of the infrastructures (Y, further noted as Yroad and Yrail in relation to certain modes of transport) were calculated, and it was verified whether the calculated correlation dependences between X and Y (X and Y—each separately is a data sample, a set of individuals or objects collected or selected from a statistical population) were statistically significant or random. To verify statistical significance, we used a 0.05 p-value for the α test. The null hypothesis (H0) was that there is no statistically significant linear dependence (Y = X) between Y and X (outputs and network length); the alternative hypothesis (H1) was that there is a statistically significant linear dependence between Y and X (outputs and network length) (rxy ≠ 0). The same procedure was followed when calculating the coefficients of the correlation between transport performance (X, further noted as Xroad and Xrail in relation to certain modes of transport) and infrastructure investment (Y1, further noted as Y1road and Y1rail in relation to certain modes of transport).
After calculating the correlation coefficients and verifying the statistical significance, other relative indicators were developed: the length of the infrastructure to the area of the territory and the length of the infrastructure to 1 million inhabitants. These values are shown in graphs further down in the paper for better visualization.
3.1. Correlation Analysis
The dependence of two random variables is evaluated with a simple correlation analysis, which places more emphasis on the intensity of the relationship than on investigating the variables in the cause–effect direction (regression). The dependences it examines are mainly linear, where the correlation, from the Latin correlátio [cor-together + relation-relationship], is a measure of the linear relationship. It is important to note that correlation is not causality. Quantities that correlate with each other are probably interdependent, but it cannot be concluded that they are conditional. The aim of correlation analysis is to identify, quantify, and statistically test correlation. A necessary part is a logical analysis of the problem, in terms of the significance of the correlation itself, which may be distorted or not exist at all. When using two-dimensional methods, a false correlation often occurs, which is an apparent but nonexistent correlation between the variables
X and
Y (any; not related to the notations assigned in the currently developed research—this generalization only concerns the data in
Section 3.1) that appears to be strong due to other (disregarded) variables. The value of correlation is also affected by a lack of homogeneity in a sample and the formal relationship between the quantities (e.g., in the correlation of percentage characteristics, which are supplemented to 100%). The tool of correlation analysis is the so-called correlation coefficient (denoted by
rxy). This tool determines the degree of tightness (degree) of dependence. The correlation coefficient is a measure of the linear dependence of two variables and can be expressed by the following relation (1):
A common task in mathematical statistics is to determine whether random variables X and Y are correlated or not. The value of the correlation coefficient depends on the elements that were randomly selected. If the value of the correlation coefficient is close to zero, it shows that the value is only random (caused by random selection) or really represents a linear independence. The linear independence test is used for verification. To determine whether the random variables X and Y are correlated or not, the null hypothesis (H0) ρ = 0 is evaluated against the alternative hypothesis (H1) ρ ≠ 0.
The correlation coefficient takes values in the interval <−1, +1>. If rxy = 1, then a positive linear relationship between X and Y can be considered: i.e., larger values of X correspond to larger values of Y and vice versa. If rxy = −1, then a negative correlation between the X and Y can be regarded (a markedly opposite relationship): larger values of X correspond to smaller values of Y and vice versa. In the case of independence between the values of X and Y, the correlation coefficient is close to 0. In this case, the values of X and Y are scattered independently of each other. The correlation coefficient can be 0 even if there is a statistical relationship, other than linear, between X and Y. A positive correlation coefficient shows direct dependence, and negative values, indirect dependence. Other values of the correlation coefficient can be interpreted as follows: (it is worth remembering that the following thresholds are guidelines, and a dependence also relies on what sort of data are compared—the presented thresholds are based on the authors’ experience):
If 0 ≤ |rxy| < 0.4, there is a weak dependence between X and Y;
If 0.4 ≤ |rxy| < 0.8, there is a moderate dependence between X and Y;
If |rxy| ≥ 0.8, there is a strong dependence between X and Y.
3.2. Data in the Analysis
Data were drawn from the Eurostat and OECD databases. The absolute values of the examined parameters of infrastructure, performance, and investment are given in the
Supplementary Material.
Table S1 consists of the length of the railway network and its development for the period 2004–2018. In addition to Japan, 27 selected European countries were assessed, three of which were non-EU countries (Norway, Ukraine, and Switzerland). In the
Supplementary Material Table S2, the length of the road network and its development for the period 2004–2018 are given.
Supplementary Material Table S3 shows the transport performance in rail freight transport in millions of tonne-kilometers, which were realized in the assessed countries for the period 2004–2018, and in
Supplementary Material Table S4, the performance of road freight transport is presented.
In its transport and cohesion policy strategy, the EU promotes the interconnection of Member States, particularly through the superior TEN-T transport infrastructure. In some Central and Eastern European countries, the EU Structural Funds are the most important source of investment in transport infrastructure. Therefore, we also examined the development of investments in road transport infrastructure for the individual countries studied and the period 2004–2018, as described in the
Supplementary Material Table S5. In the
Supplementary Material Table S6, investments into railway transport infrastructure, in millions of euros, are described.
4. Results
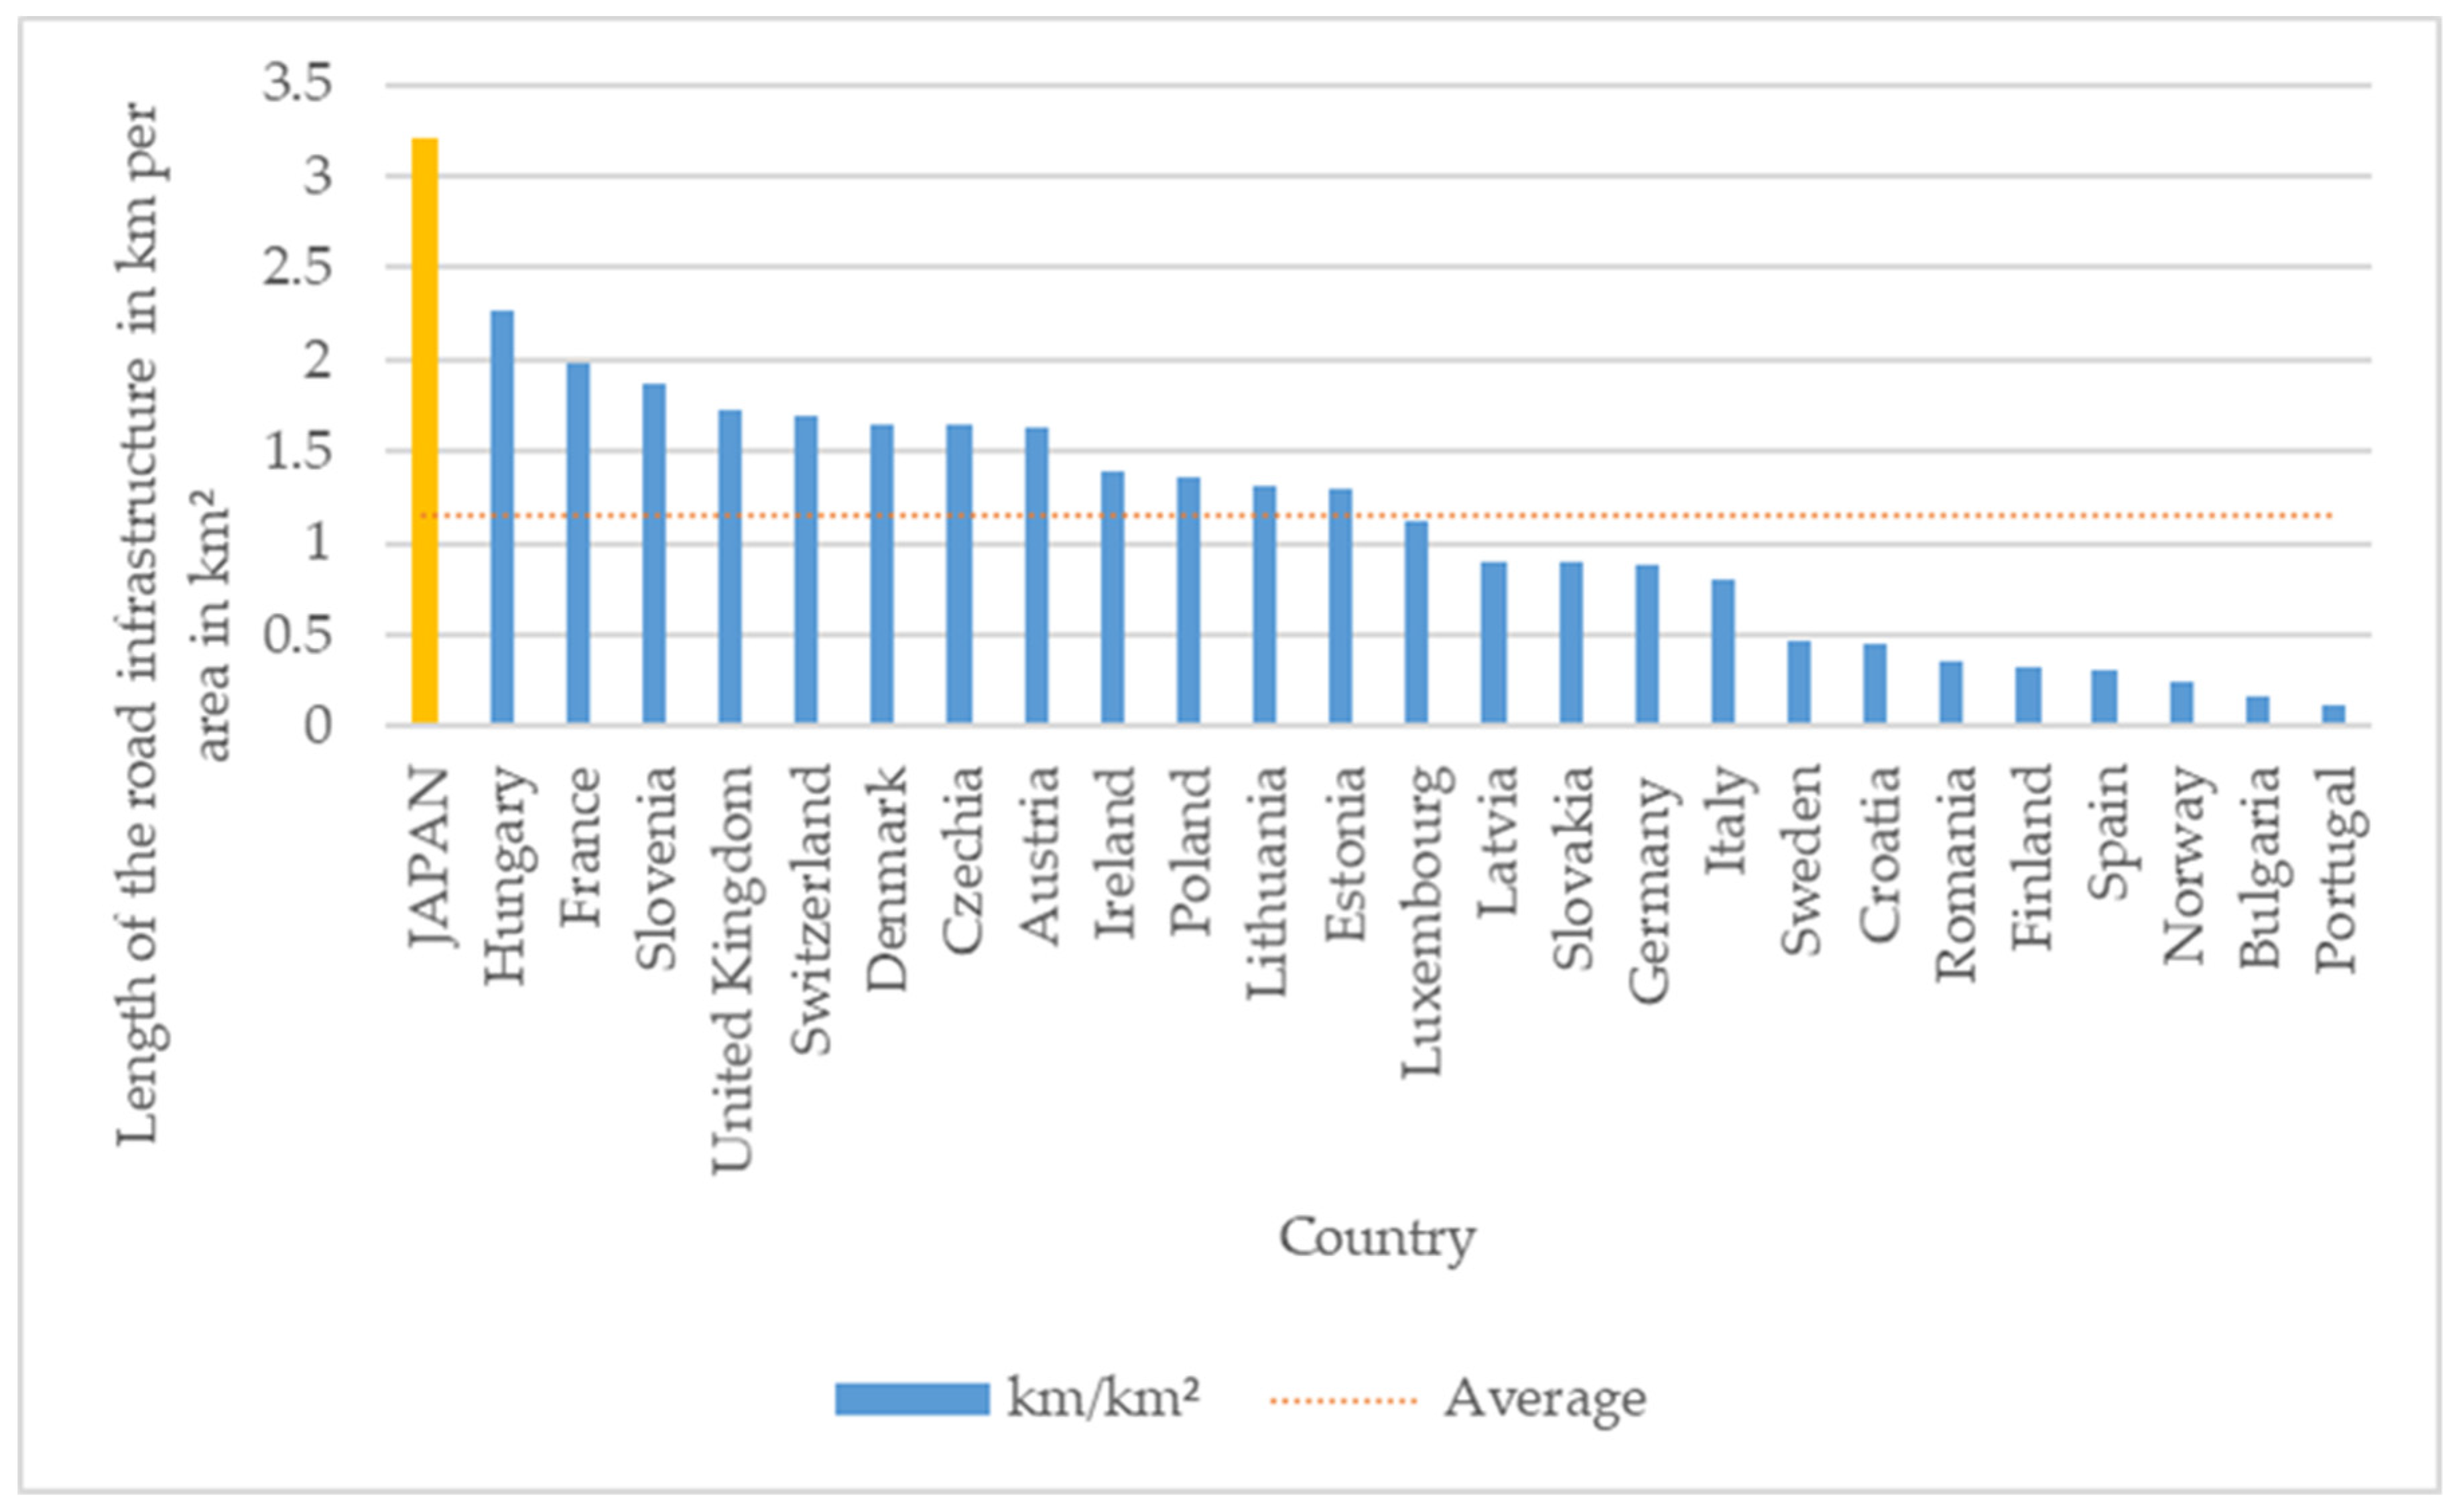
The first results were obtained by calculating the length of the road infrastructure in km per area in km
2 for the studied countries (
Figure 1). According to this indicator, Japan is the best; of the European countries, Hungary is in first place and Slovenia in third. Portugal is last with 0.12 km of road infrastructure per 1 km
2 of area. This is partly understandable because it is not an EU transit state. In second place, with the lowest length in km per 1 km
2 of area, is Bulgaria, which is a member of the EU and is a transit country from Turkey and, partly, Greece.
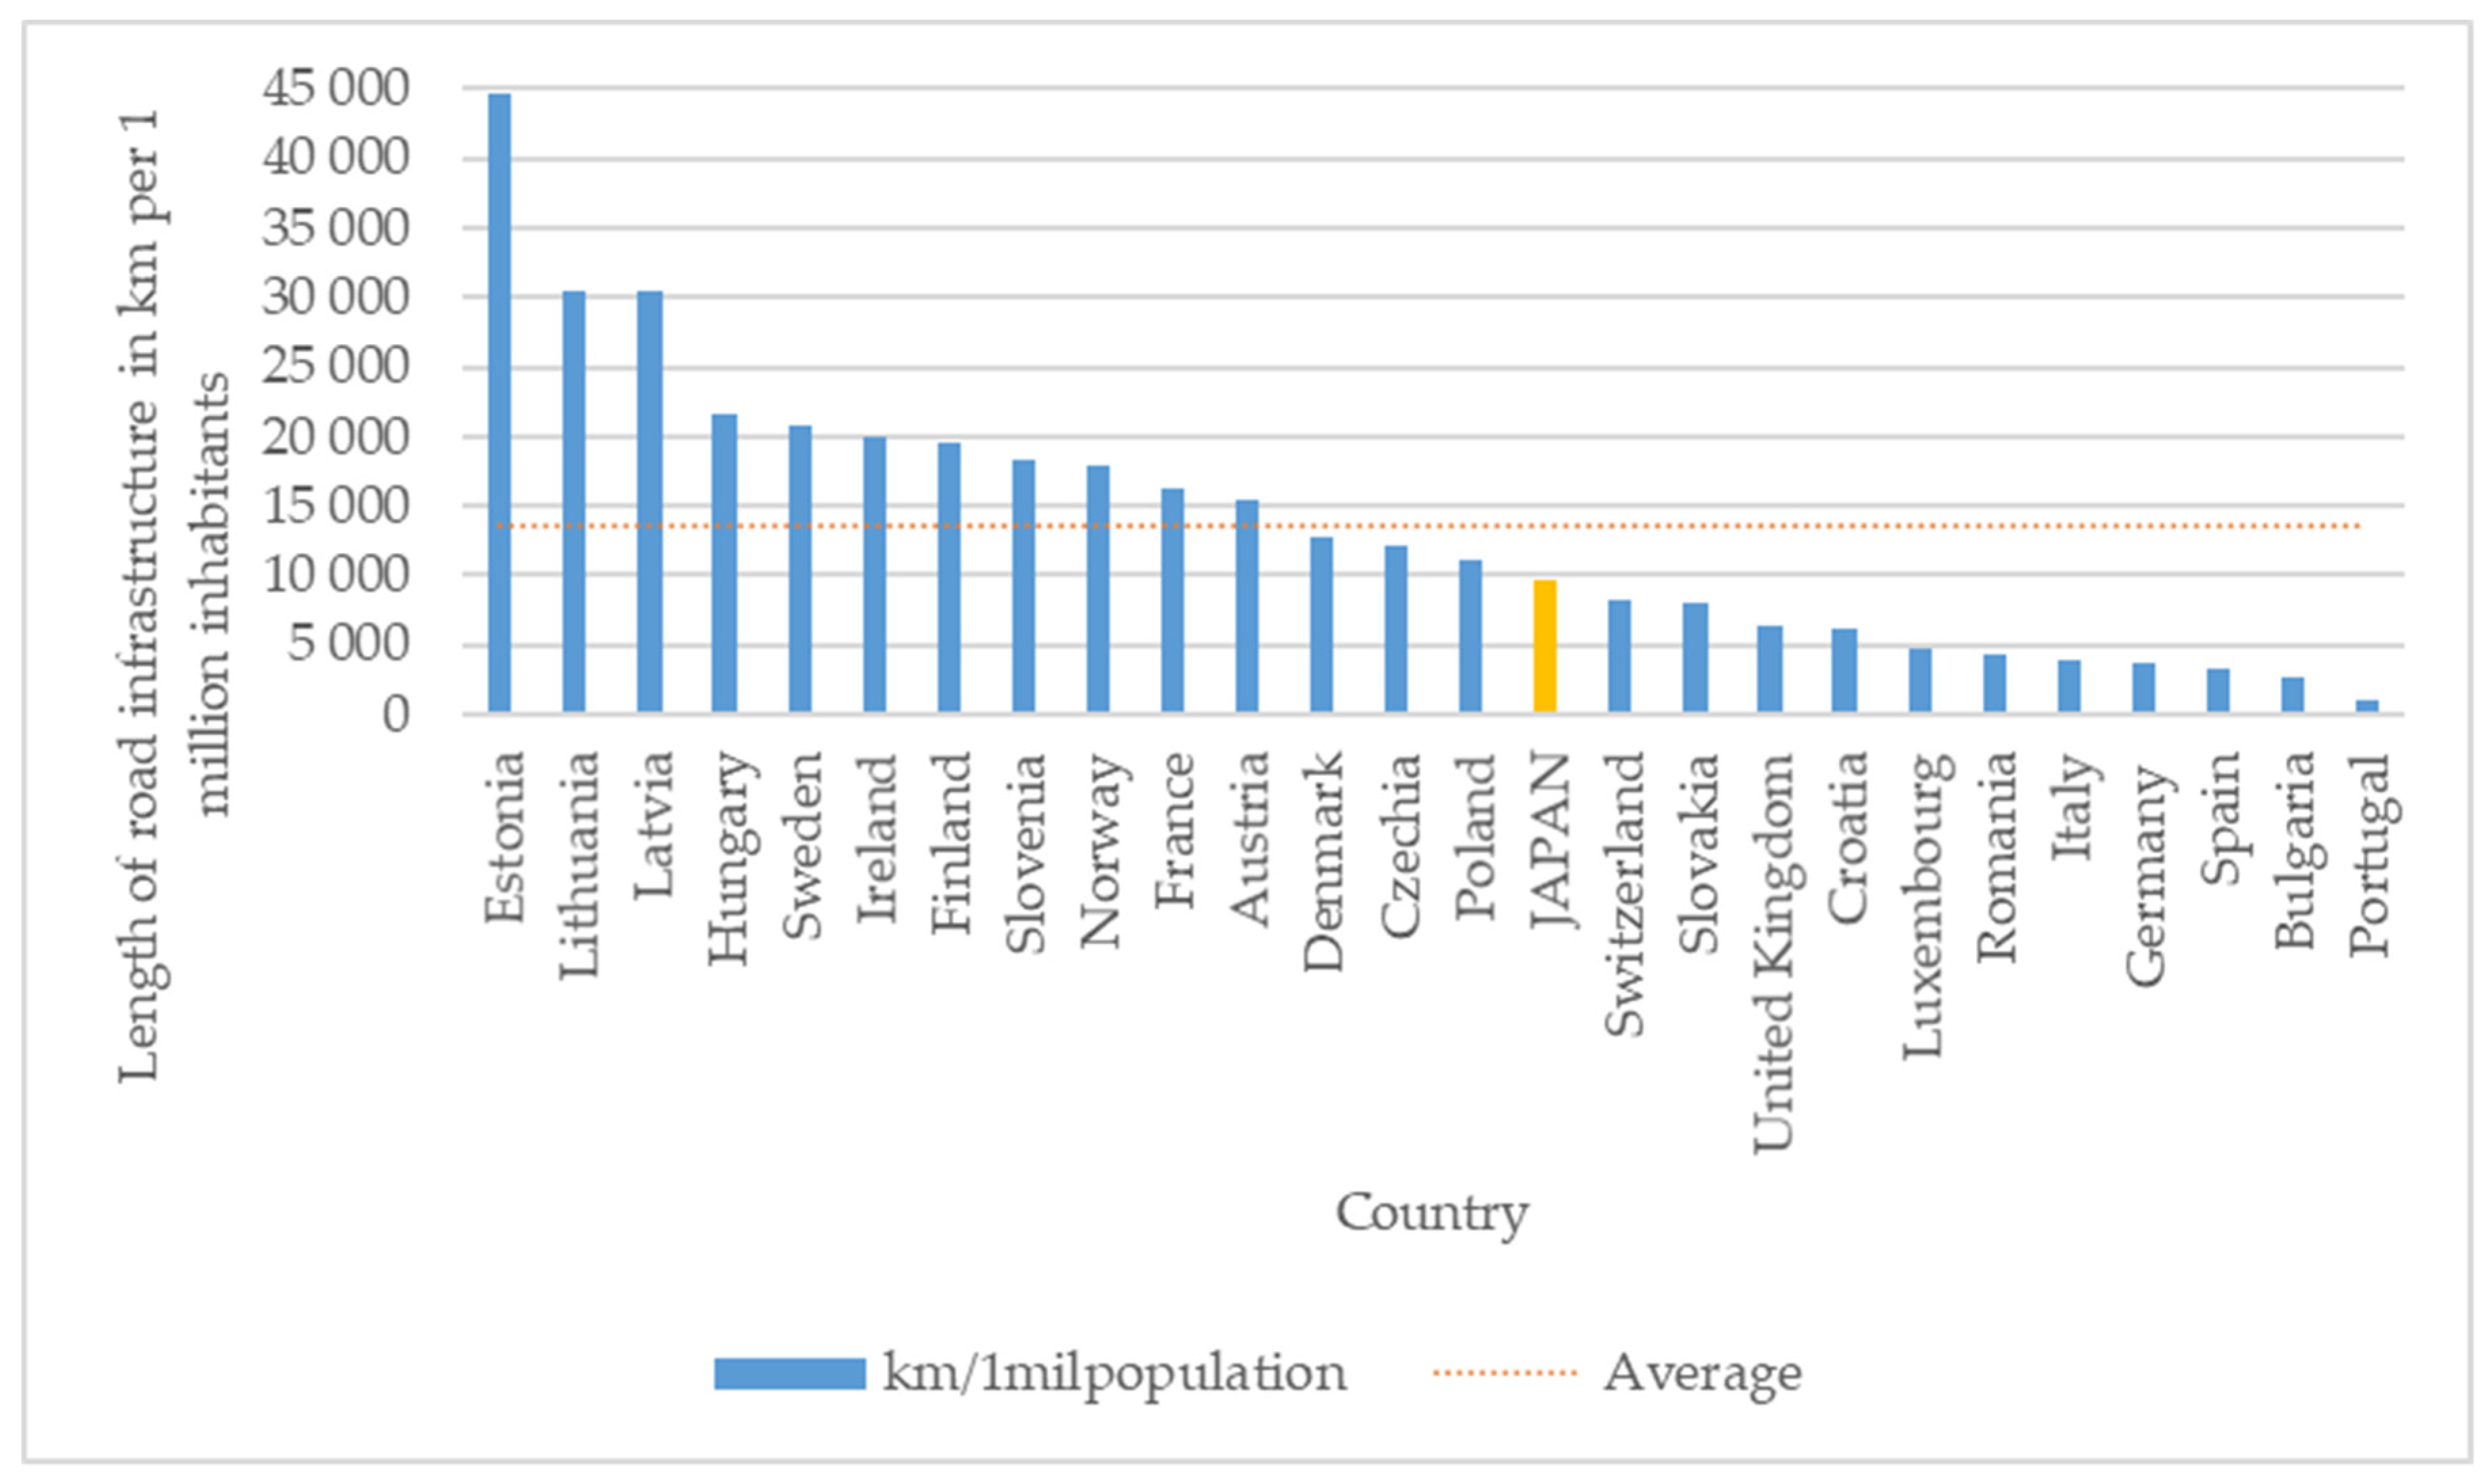
According to the length of road infrastructure in km per 1 million inhabitants (
Figure 2), Japan is in 15th place. Of the European countries, Estonia is interestingly in first place, followed by the other Baltic states of Latvia and Lithuania. Portugal and Bulgaria have the least length of road infrastructure per 1 million inhabitants. Interestingly, Norway ranks third from last according to the first indicator, length per area (
Figure 1), but it is significantly better in terms of length per population.
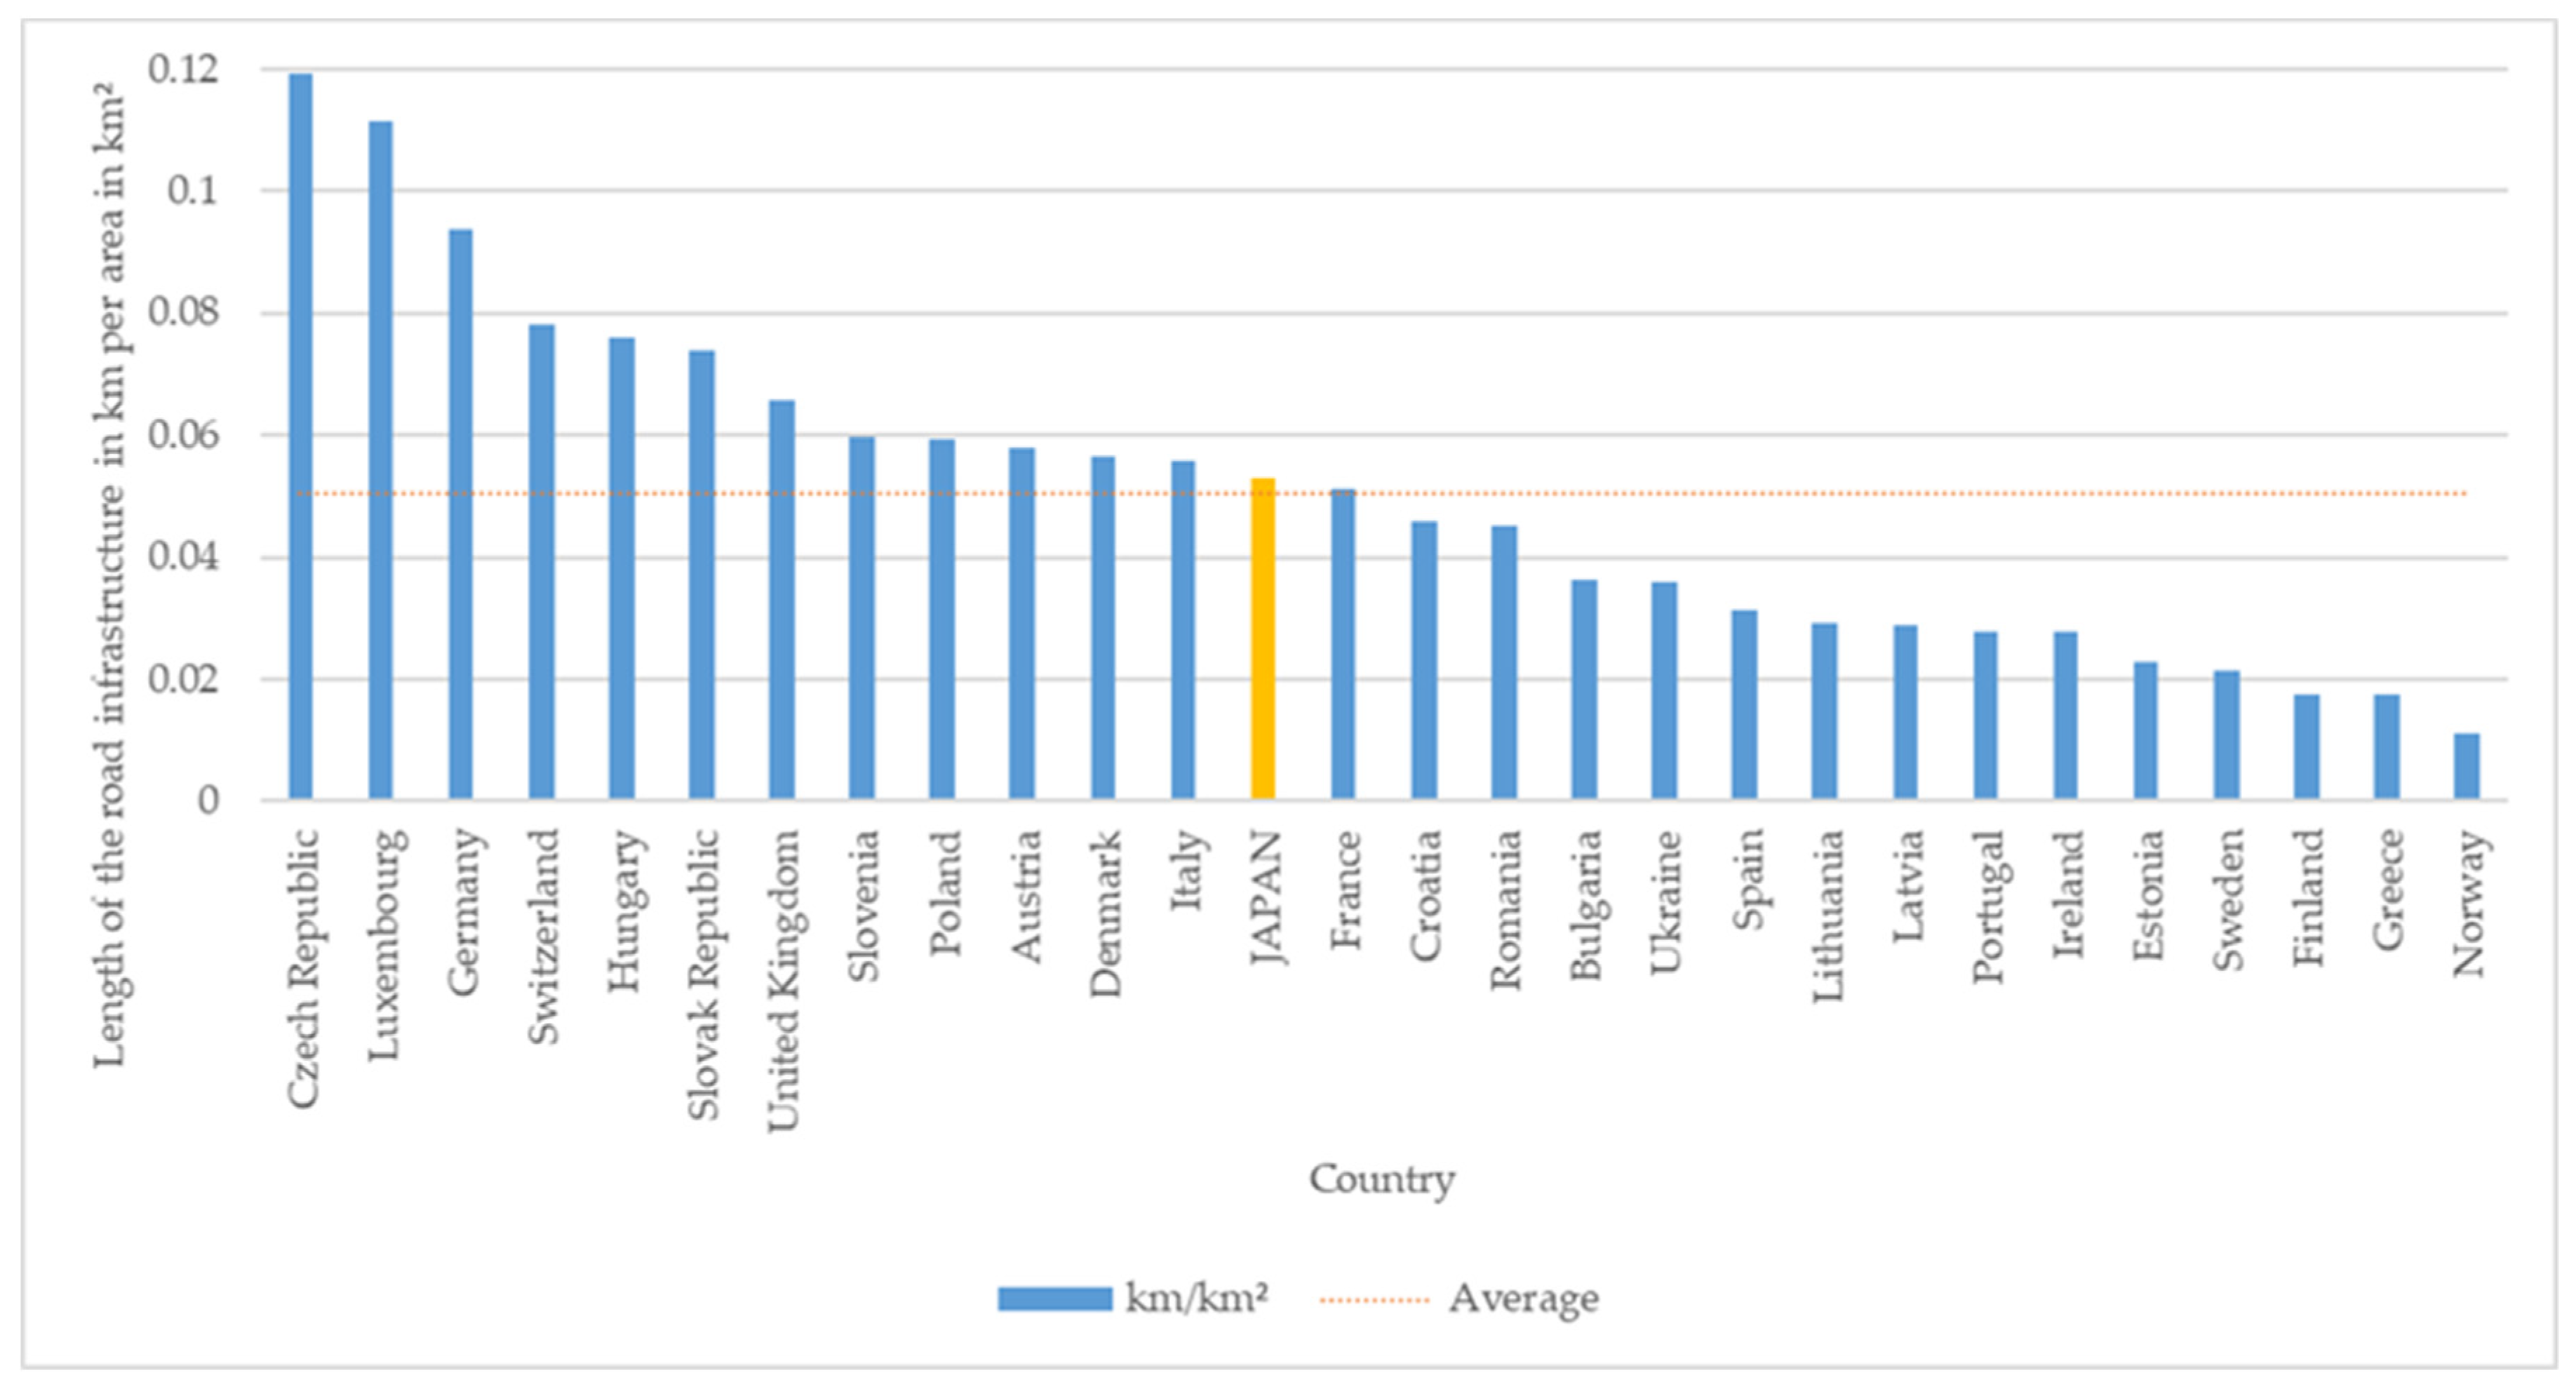
The length of the railway infrastructure in km per km
2 of area of the studied countries was calculated (
Figure 3). According to this indicator, the three EU countries are the best—the Czech Republic, Luxembourg, and Germany—followed by a non-EU country, Switzerland, which has built transport infrastructure from its own resources. Japan is in 13th place according to this indicator. The Nordic states of Norway, Finland, and Sweden, as well as Greece, have the least km of railway infrastructure per km
2. This is partly understandable because they are not transit states, and in the case of Greece, the islands, of which there are over 2000, are also included in the area.
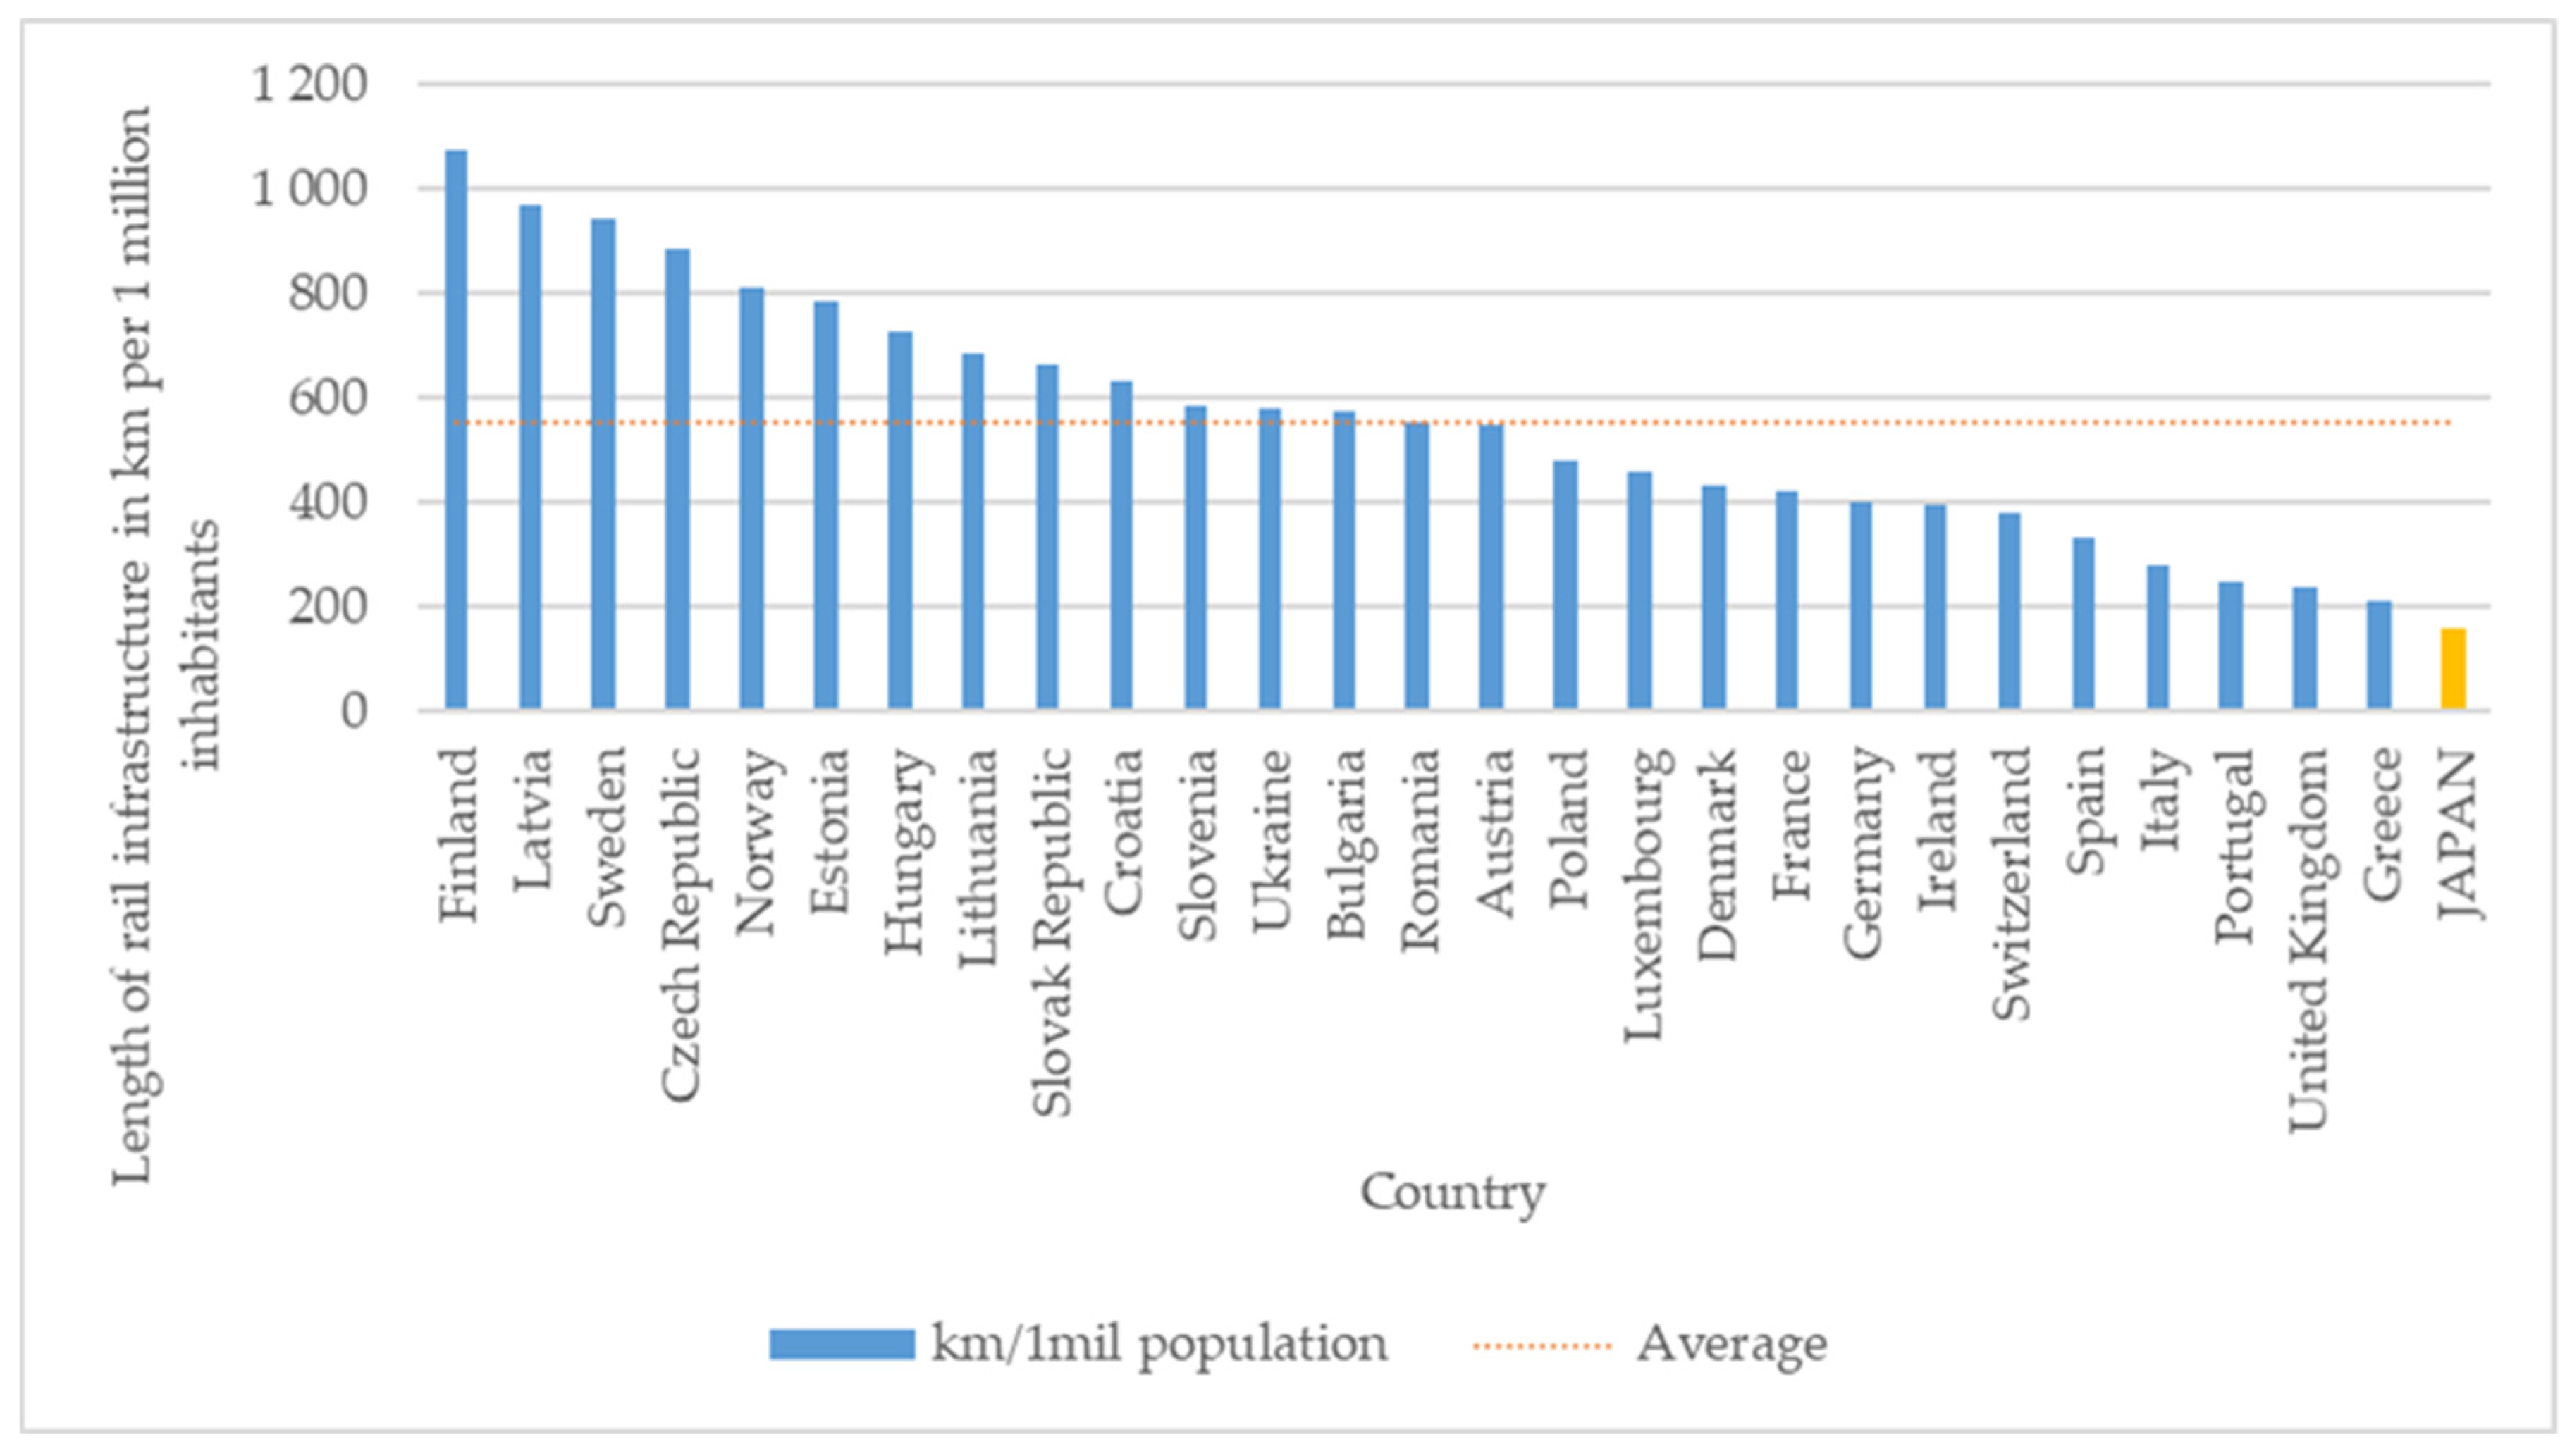
The low position of Japan according to the length of the railway infrastructure per 1 million inhabitants (
Figure 4) is interesting; Japan is at the bottom, with the lowest value of 159.92 km of network per 1 million inhabitants. Finland, Lithuania, and Sweden rank the highest.
The above comparison shows that it is not only the length of the transport infrastructure that matters; quality and performance are also important. Additionally, some countries that are not in transit have built infrastructure mainly for their own needs.
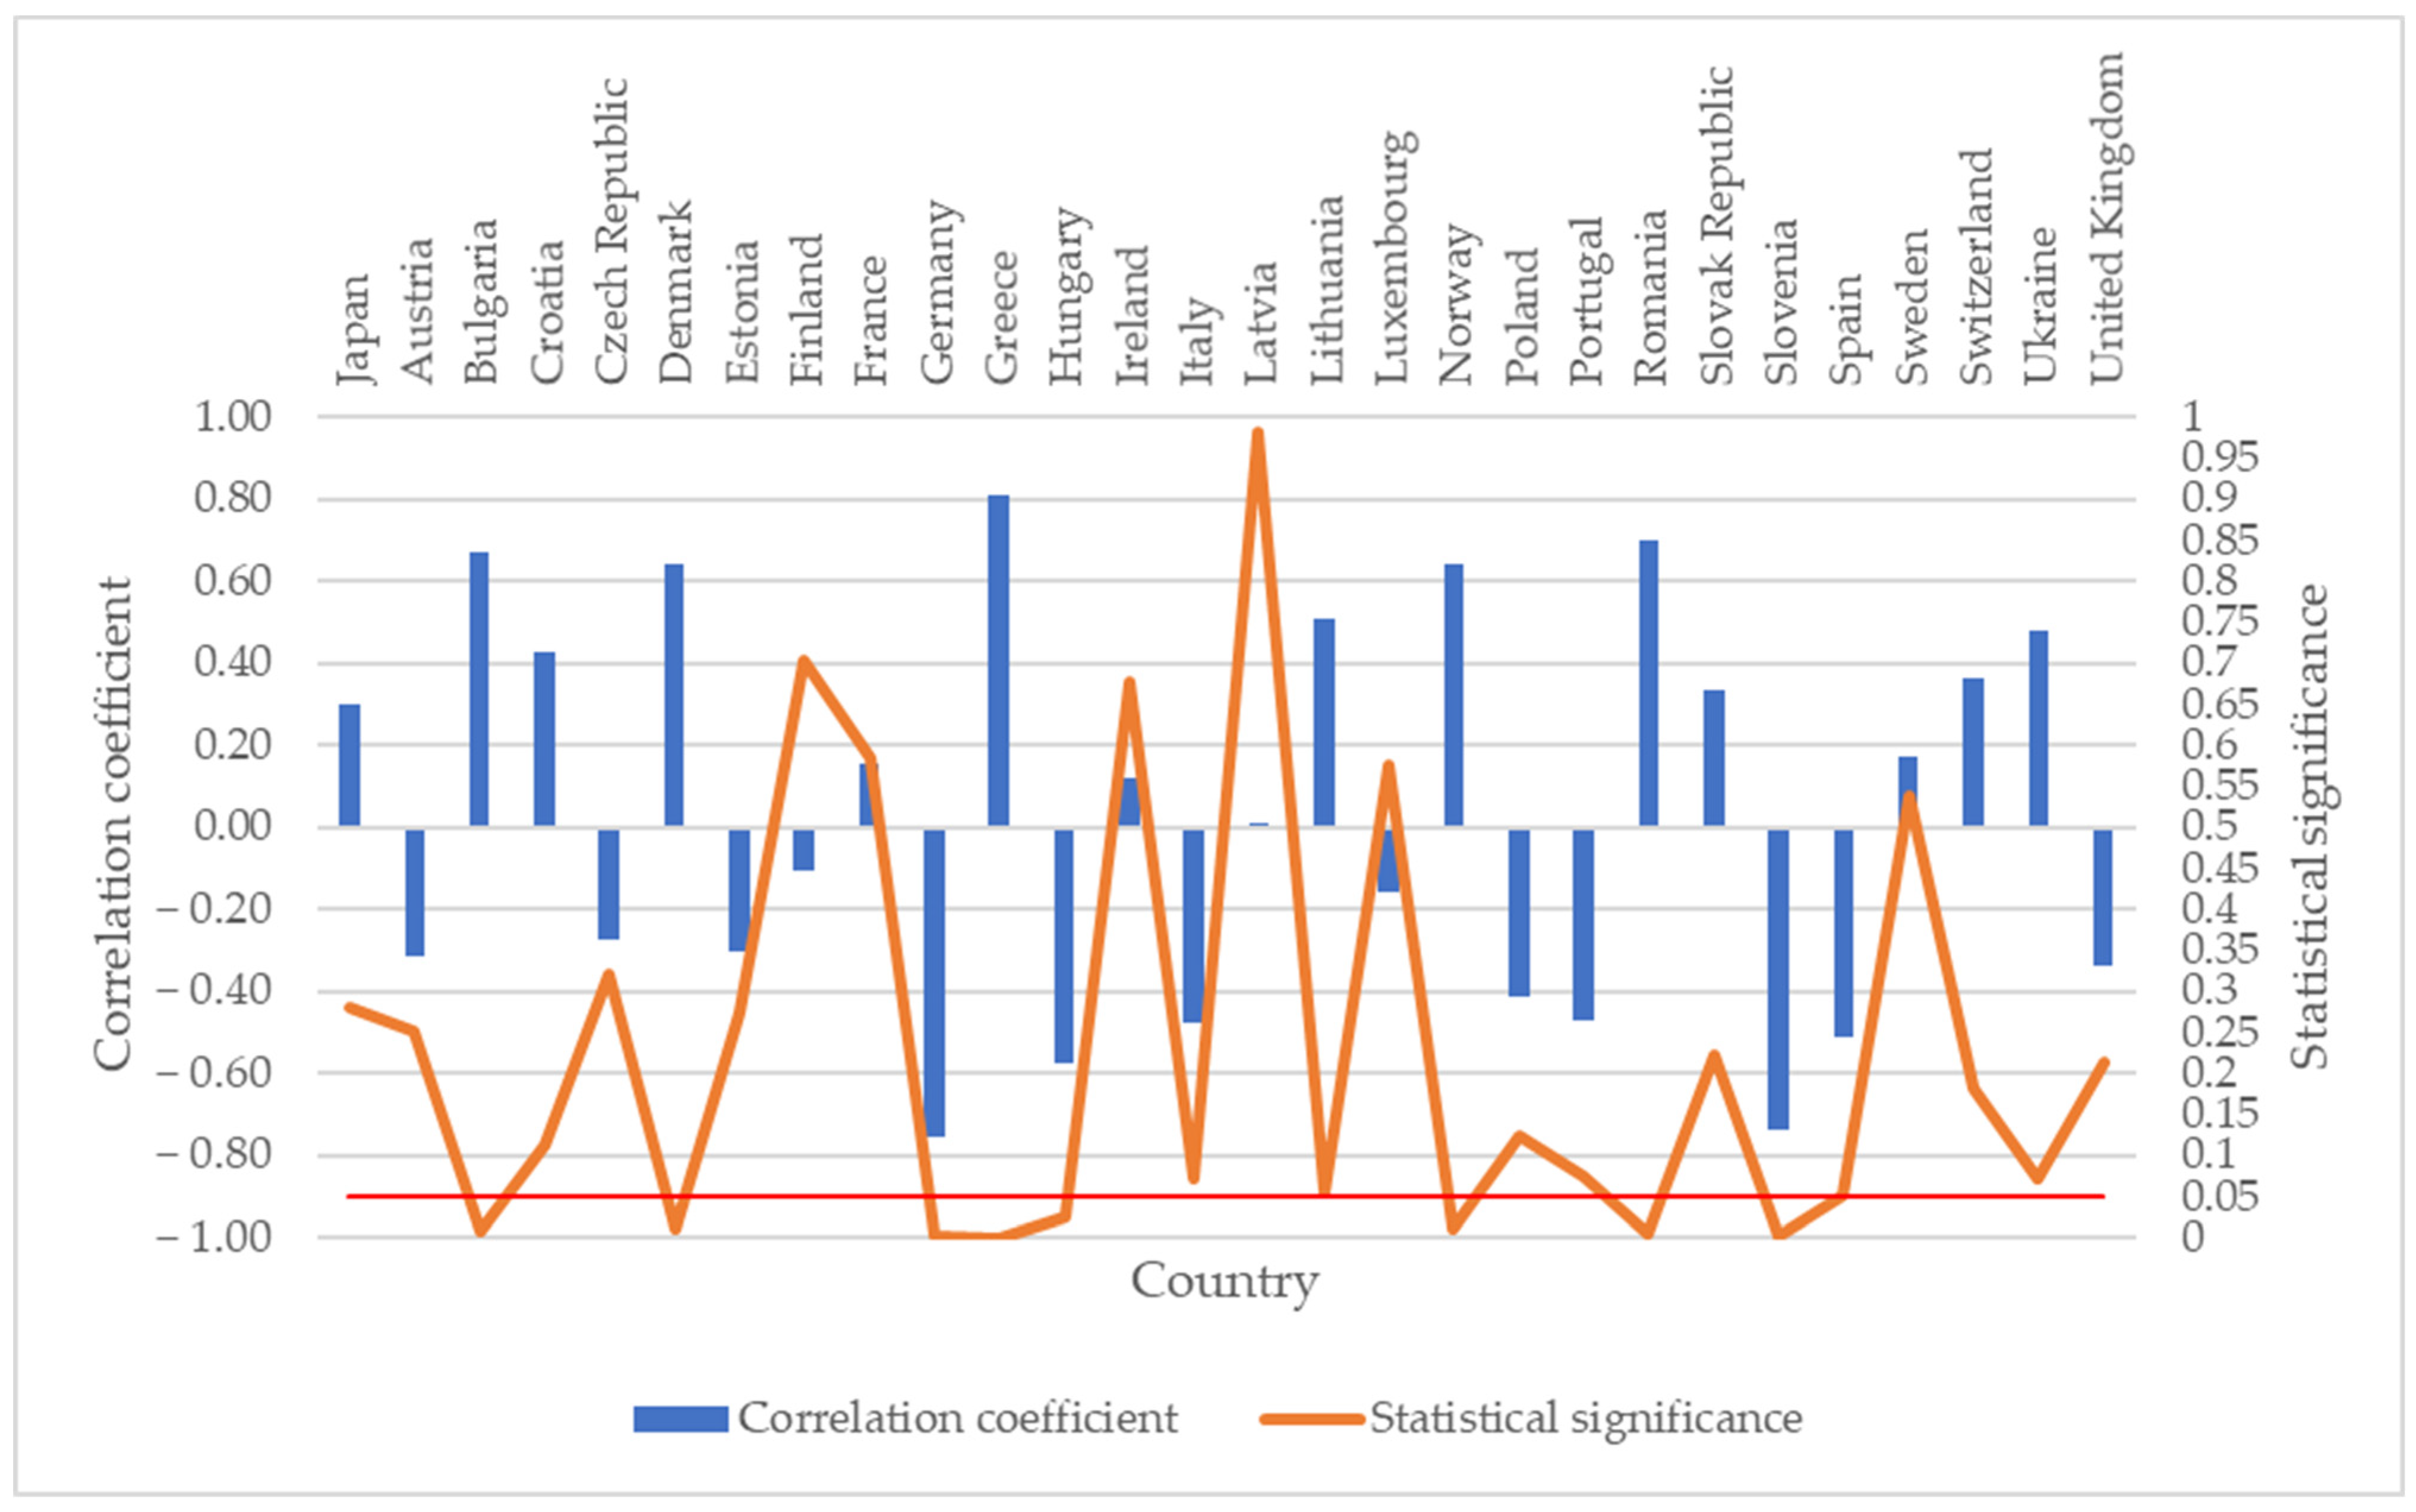
Therefore, the main research was focused on examining the correlation between the length of railway infrastructure and the performance of rail freight transport (
Table 1 and
Figure 5). Various statistical programs are currently used to process statistical files, which can process large data files relatively quickly. In the research, we focused not only on the calculation of the correlation coefficient but also on whether there was a statistically significant linear relationship between the variables. The decision (whether there is a statistically significant linear relationship between the variables) is made according to the
p-value of the test. An important step is to define the null hypothesis (H0) and the alternative hypothesis (H1); we choose the significance level α = 0.05. In the last step, we define a
p-value: if the
p-value > α, then we do not reject H0; if the
p-value < α, we reject H0 and accept H1.
The calculated correlation coefficients and the values of statistical significance are given in
Table 1. In the case of Greece, Romania, Bulgaria, Norway, and Denmark, the
p-values < α refute H0, and we accept H1. Thus, there is a statistically significant linear relationship between
Yrail and
Xrail (the length of infrastructure and transport performance realized by rail transport). In the case of the abovementioned countries, the correlation coefficients range from 0.810285 to 0.639023, i.e., from a strong direct dependence to a medium direct dependence. These values can be interpreted as meaning that the length of the infrastructure significantly influences the performance realized by rail freight transport.
In the case of Hungary, Slovenia, and Germany, the p-values < α refute H0 and support H1. Thus, there is a statistically significant linear relationship between Yrail and Xrail (the length of infrastructure and the performance realized by rail transport). In the case of the abovementioned countries, the correlation coefficients range from −0.57377 to −0.75587, i.e., they show a medium indirect dependence. For the countries concerned, the coefficient shows that the length of the infrastructure does not affect the services that are provided by rail freight transport.
In the case of other states, the p-values > α do not refute H0, i.e., there is no statistically significant linear relationship between Yrail and Xrail (the length of infrastructure and the transport performance realized by rail freight transport).
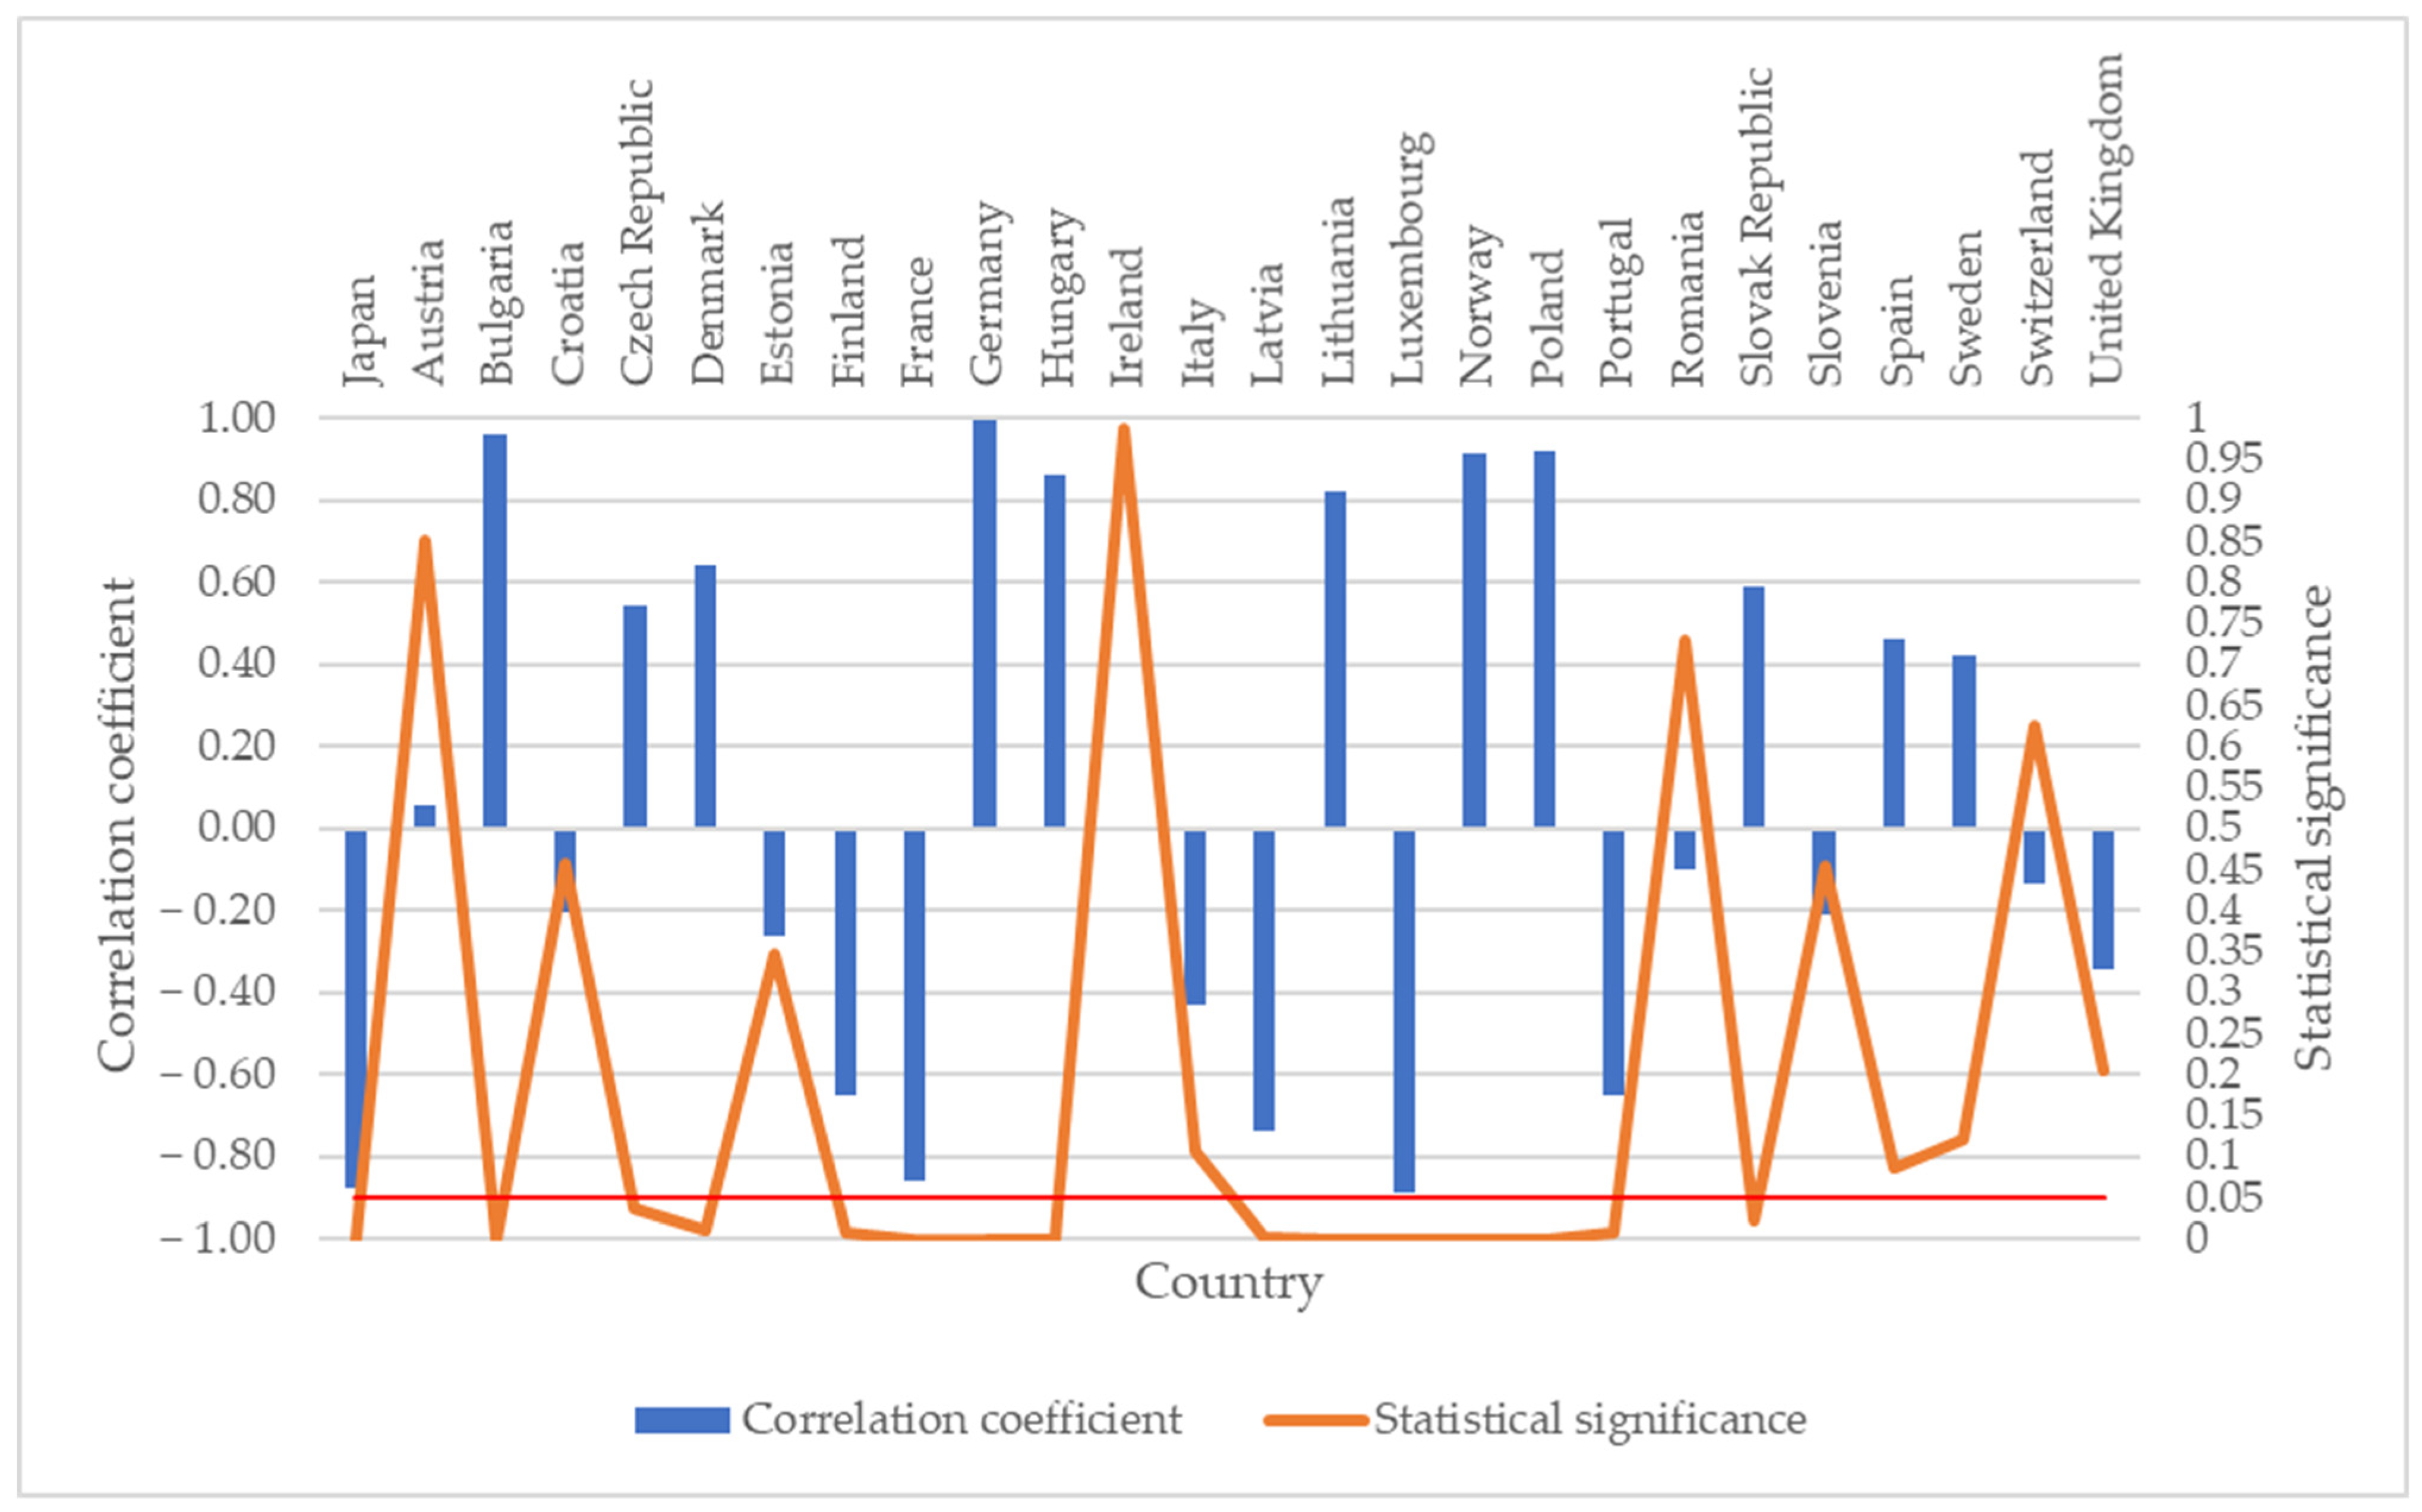
Further results regarding the correlation between the length of road infrastructure and transport performance in road freight transport are shown in
Table 2 and
Figure 6.
We carried out a similar study in the case of road freight transport. In addition to calculating the correlation coefficient, we also examined whether there was a statistical dependence between the variables. All the conditions remained the same as when we examined whether a statistical dependence occurred between the length of the infrastructure and the performance in rail freight transport.
In the case of Germany, Bulgaria, Poland, Norway, Hungary, Lithuania, Denmark, Slovakia, and the Czech Republic, the
p-values < α; therefore, we reject H0 and accept H1. There is a statistically significant linear relationship between
Yroad and
Xroad (between the length of infrastructure and the performance of road transport). The strength of the relationship ranges from strong to moderately direct dependence (
Table 2). It follows that the length of the infrastructure in the concerned countries affects the performance of road transport. A strong-to-medium indirect relationship in Finland, Portugal, Latvia, France, Japan, and Luxembourg was observed. The indirect relationship determines that the length of the infrastructure does not affect the road transport performance. In the case of the other states listed in
Table 2, the
p-values > α; thus, H0 is not rejected. No statistically significant linear relationship between
Yroad and
Xroad can be stated (between the length of the infrastructure and the services provided by road transport).
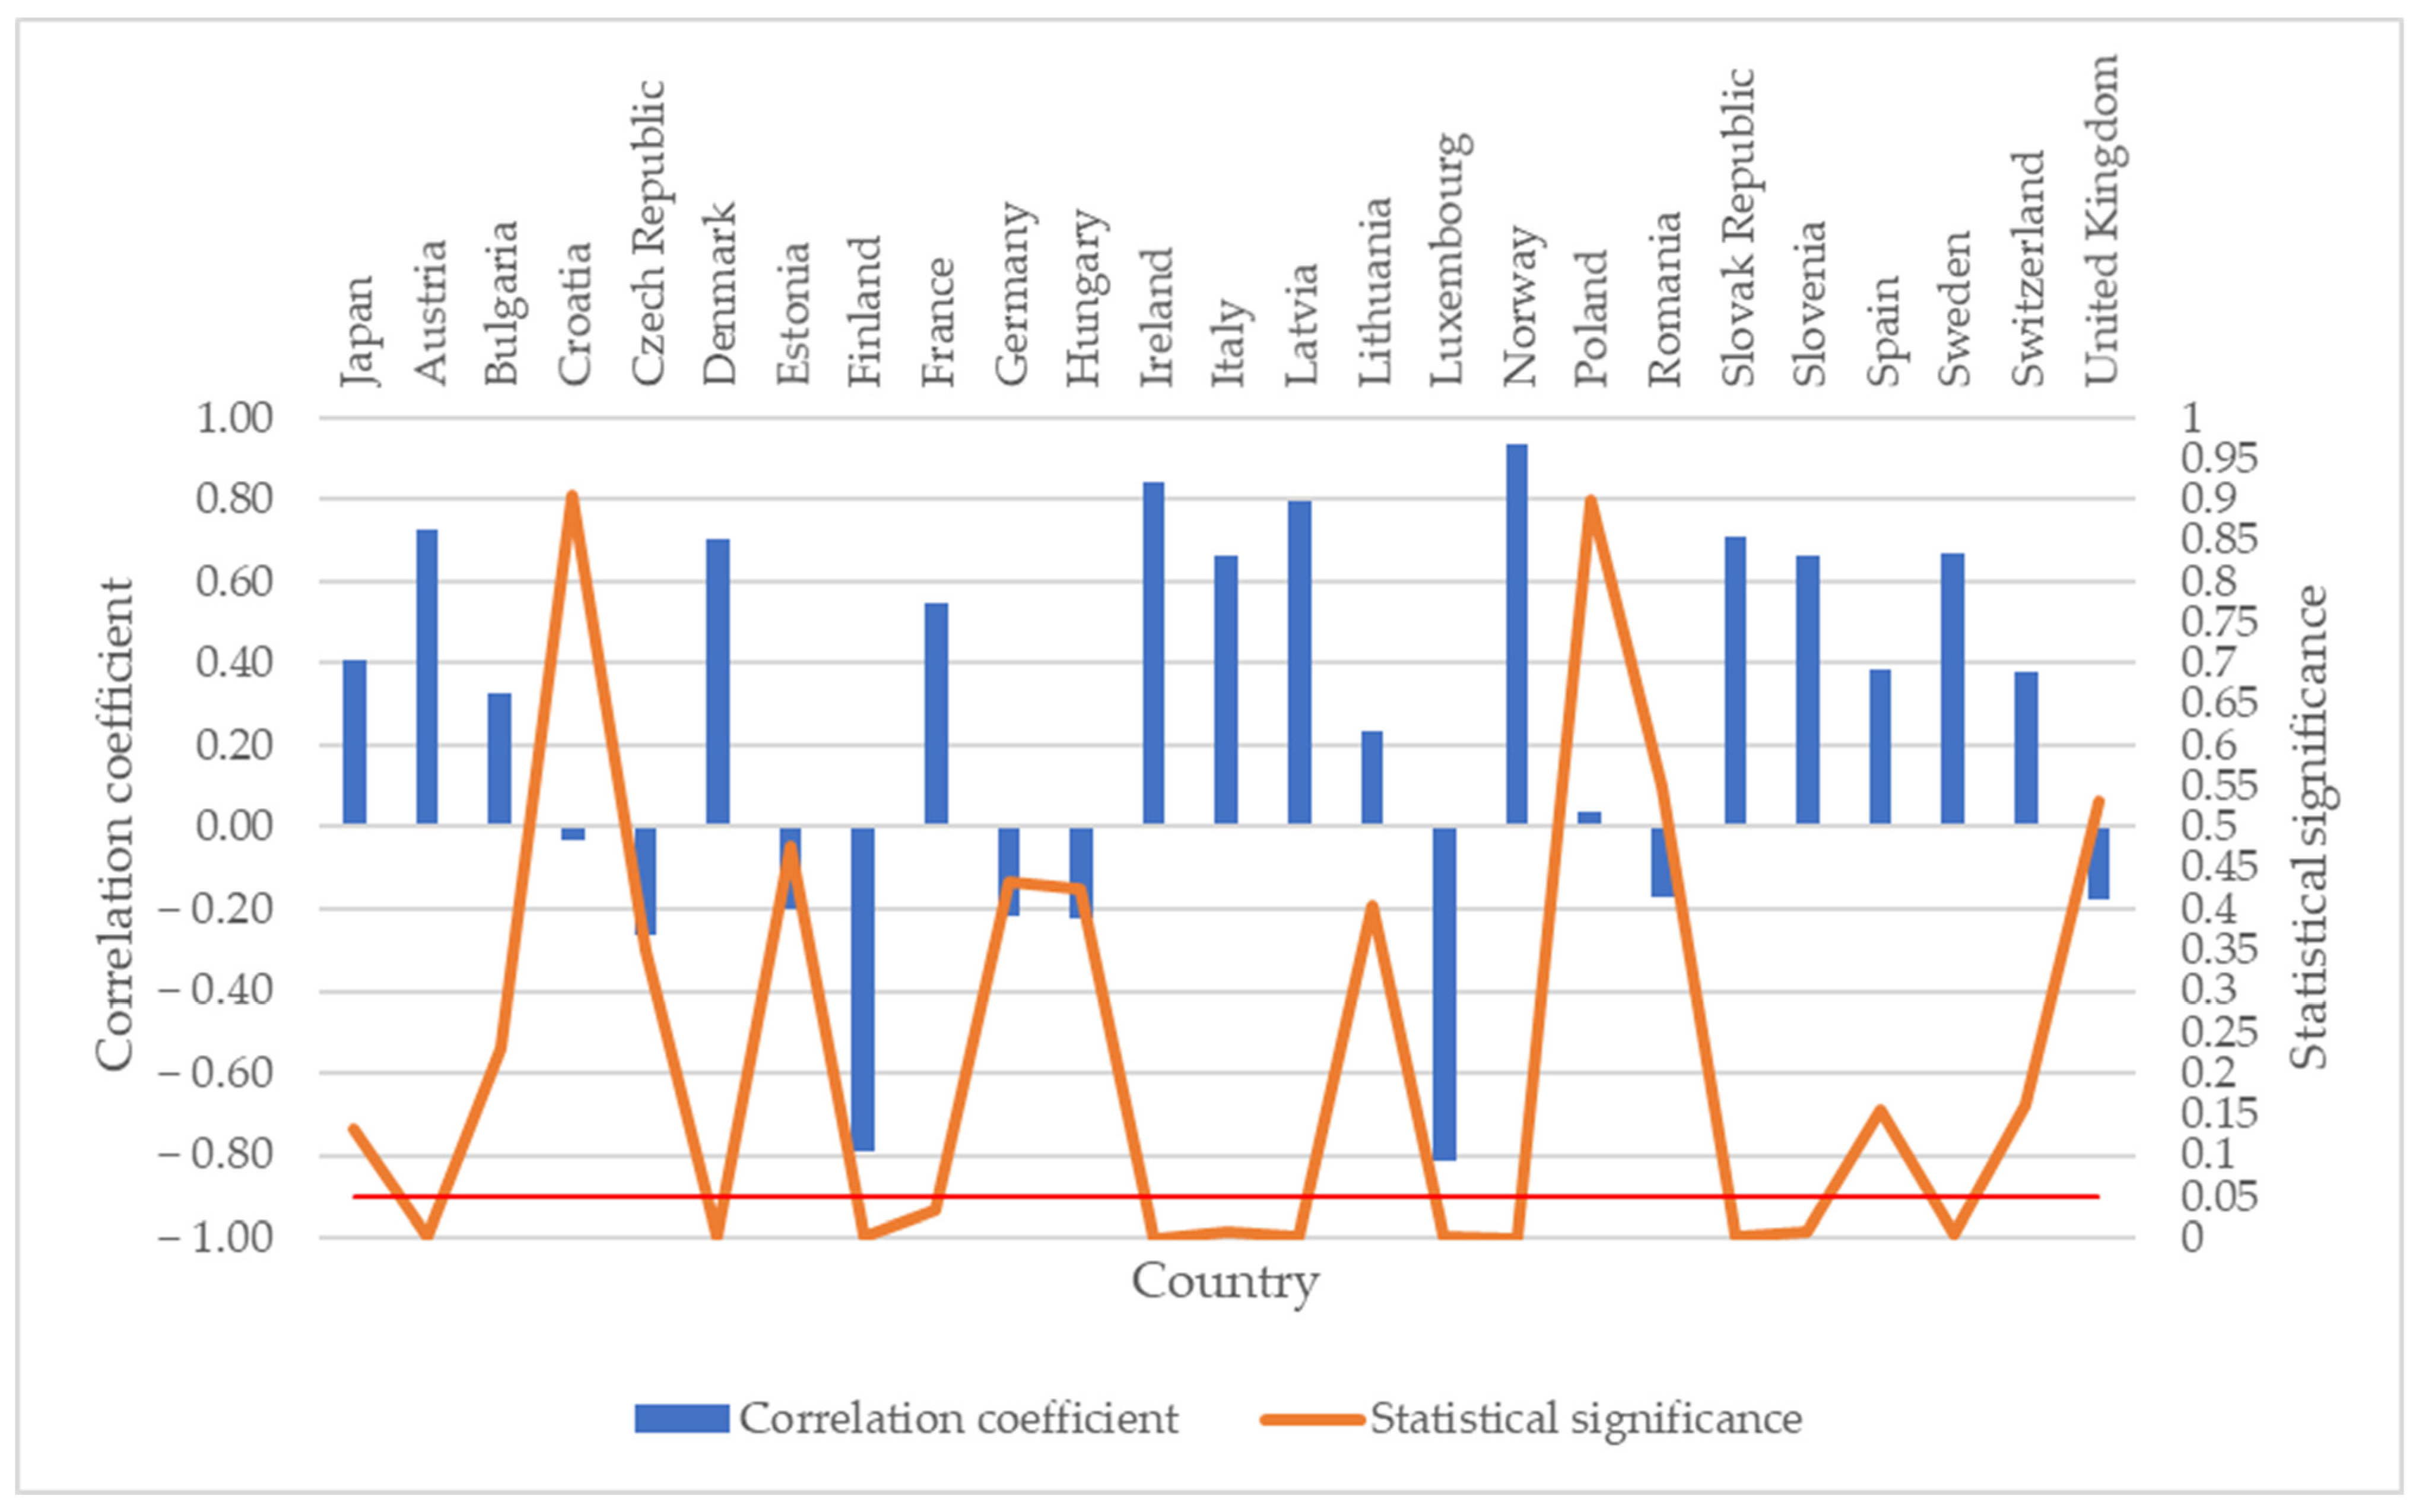
Transport infrastructure needs to be built or continuously repaired, and therefore, further research focused on examining the correlation between investments in road infrastructure and the performance of road freight transport (
Table 3 and
Figure 7). In this case, in addition to the correlation coefficient, we also examined whether statistically significant linear relationships between particular variables occurred. The conditions for determining the
p-value, as well as the expression of the null and alternative hypotheses and the determination of the α level of significance, remained the same throughout the research. In the case of road transport (Ireland, Latvia, Austria, Slovakia, Denmark, Sweden, Slovenia, Italy, and France), the
p-values < α, refuting H0 and supporting H1; there is a statistically significant linear relationship between
Y1road and
Xroad (between infrastructure investment and the performance realized by road transport). The correlation coefficients showed strong-to-moderate direct dependence. This is connected to the fact that investments in infrastructure in the given states also directly affect the performance realized there by road transport. A statistically significant linear relationship was also confirmed in the case of Finland and Luxembourg; however, the correlation coefficients for these countries are negative (strong and moderate indirect dependences): i.e., infrastructure investment does not affect the performance of road freight transport. In the case of the other states, the
p-values > α; we do not reject H0, i.e., there is no statistically significant linear relationship between the variables
Y1road and
Xroad (infrastructure investment and output).
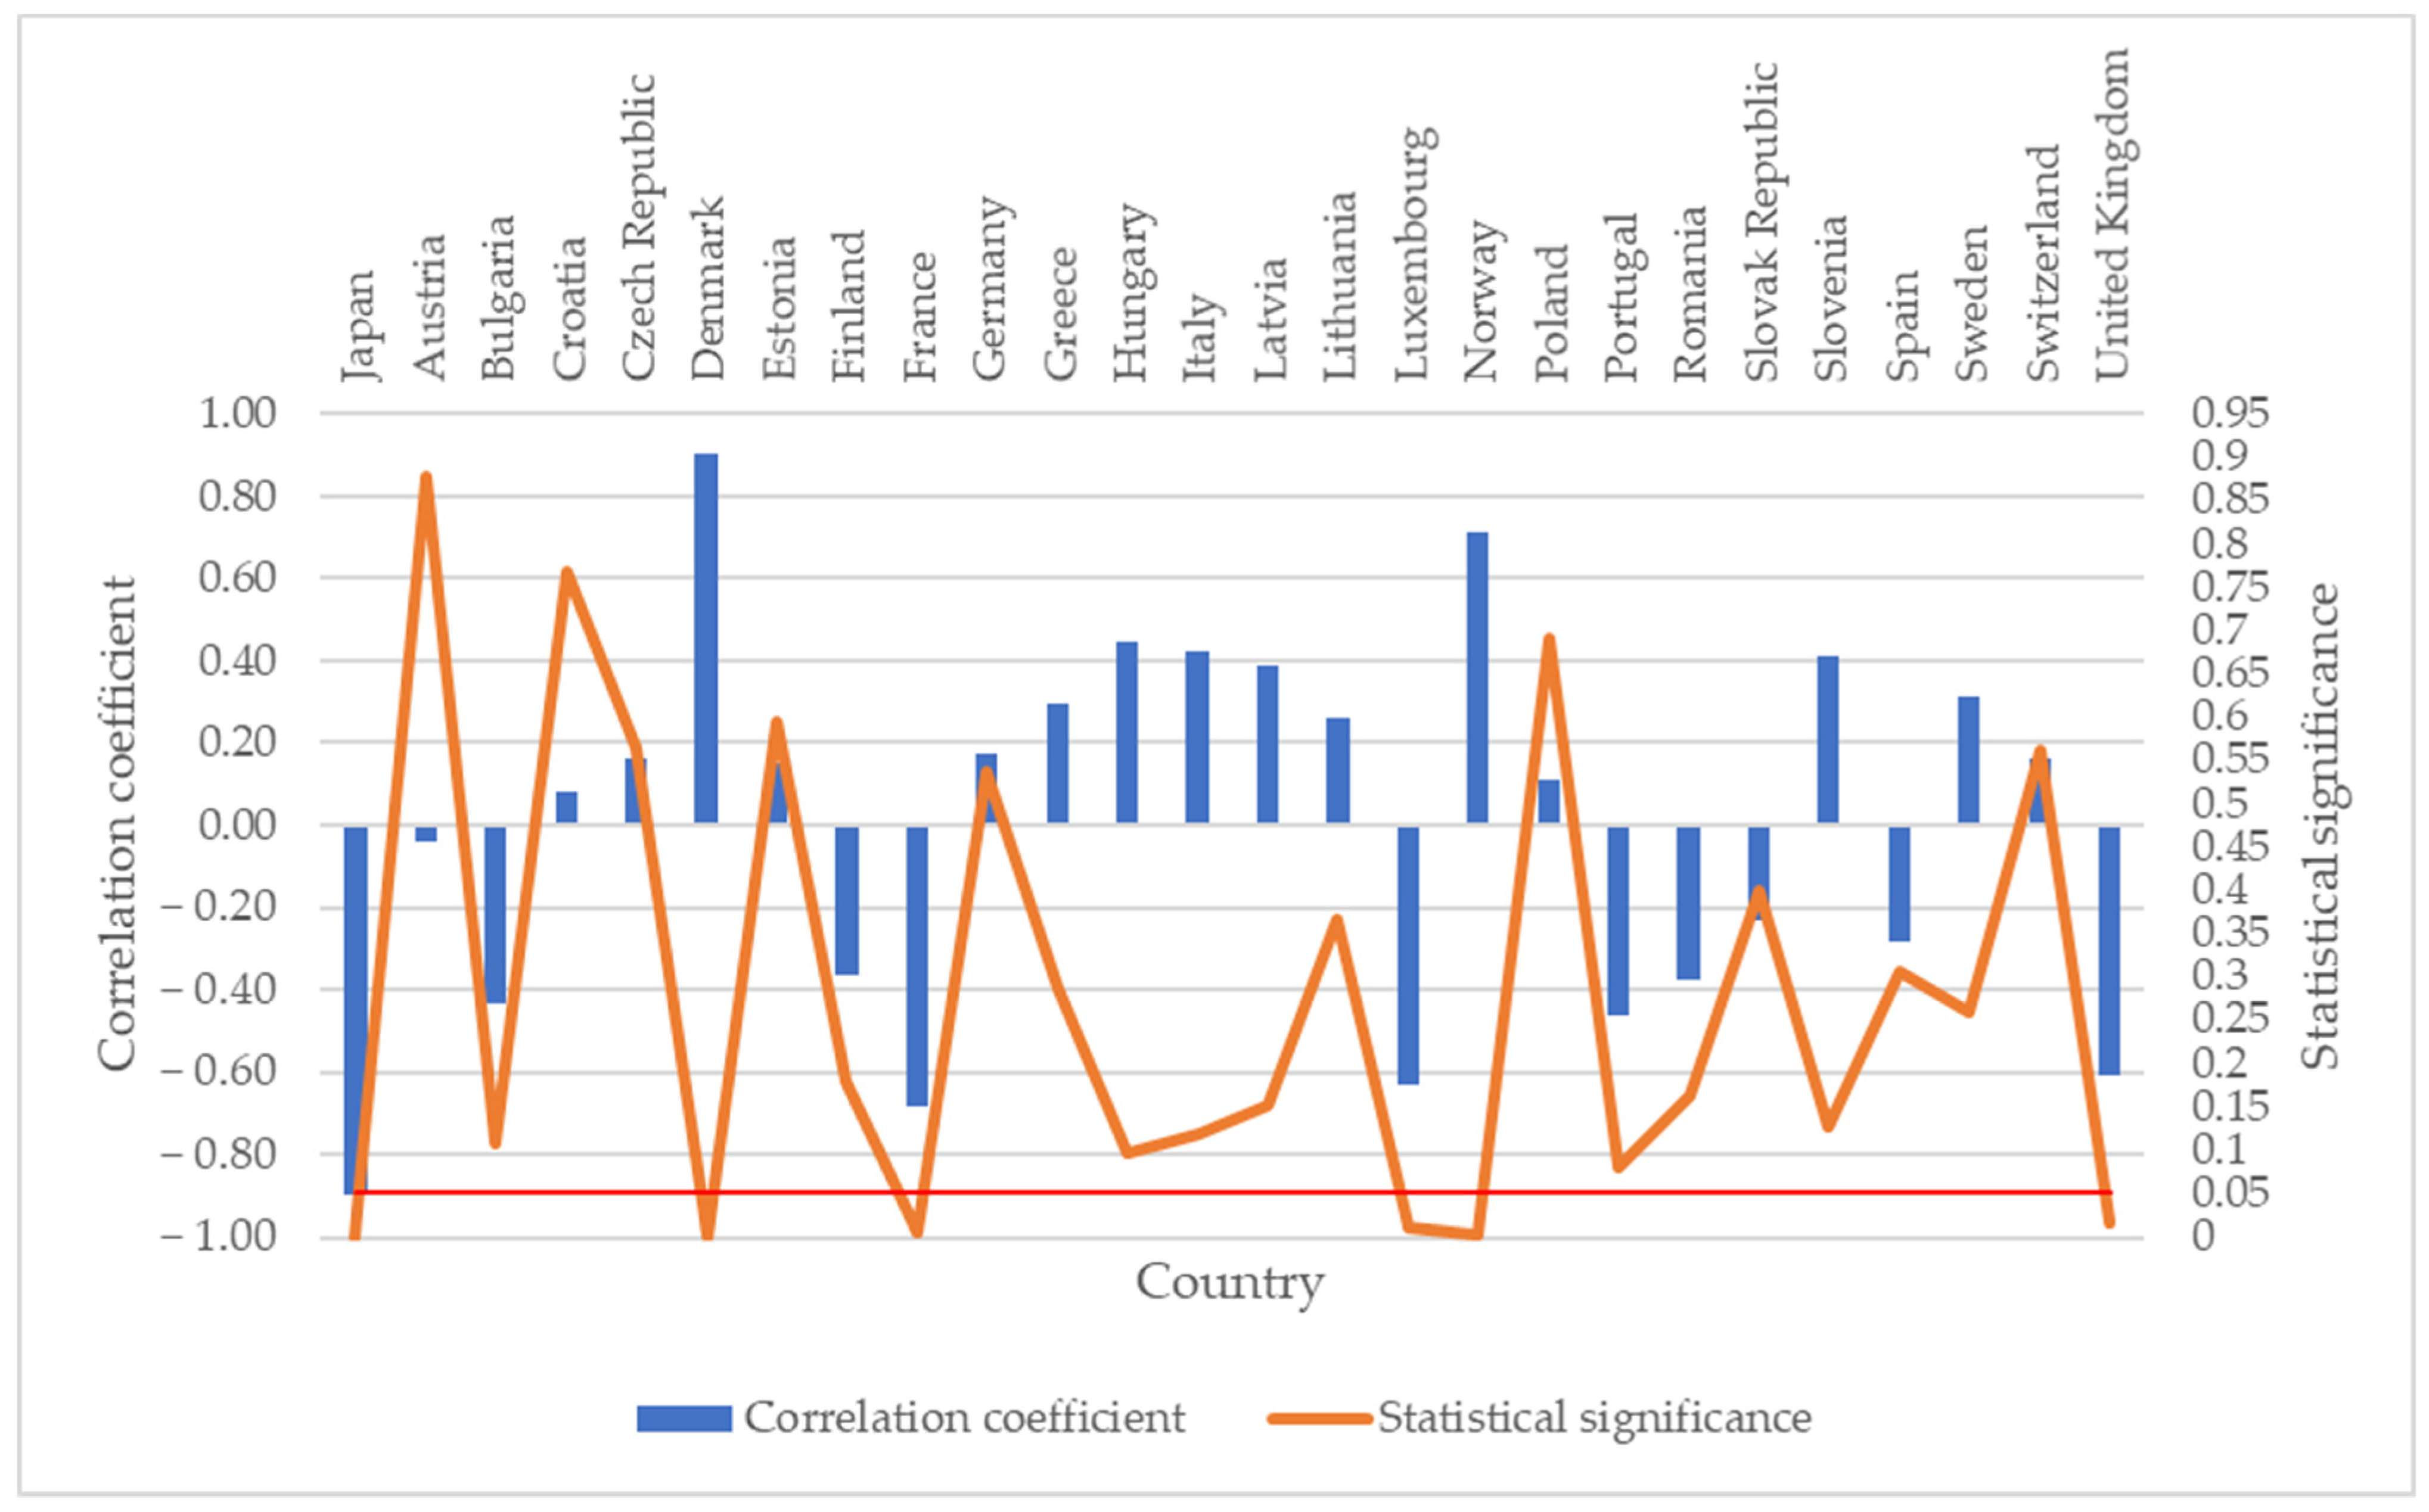
In particular, the European Union supports investment in rail transport infrastructure in order to change the modal split between road freight and rail freight. The results from examining the correlation between investments in railway infrastructure and the performance of rail freight transport are shown in
Table 4 and
Figure 8. Regarding rail transport, there is a statistically significant relationship between investments in infrastructure, and the services are realized within rail transport in the case of Denmark, Norway, United Kingdom, Luxembourg, France, and Japan. In the case of Denmark and Norway, a strong-to-medium direct dependence between the variables is observed, which means that investment in infrastructure affects the performance of rail transport in these countries. The opposite can be observed for United Kingdom, Luxembourg, France, and Japan, where we observe a medium indirect dependence: i.e., investments in infrastructure do not affect the performance realized by rail freight transport. In the case of other countries, no statistically significant linear relationship was noted between the variables
Y1rail and
Xrail (the investments in infrastructure and services provided by rail freight).
5. Discussion and Conclusions
In general, it can be concluded that the study of correlations in which performance is one of the dependent variables makes more sense in road transport than in rail transport, as the results show that greater statistical significance could be observed for road transport than at the railway. The topic of correlation in transport needs to be given more attention in further research.
The results of the correlation analysis show that, if we compare Japan with European countries, the country that behaves the most similarly according to the results of the correlation is France. Not only are France and Japan equal in the results, but their resulting values for the correlation coefficient are often very similar. There was a difference in the correlations between the investment in infrastructure and rail transport performance; however, France ranks second after Japan but shows a different value of the resulting correlation.
Countries considered to be more economically developed show stronger correlations between infrastructure performance and investment, regardless of direct or indirect dependence. This was not observed regarding the length of the infrastructure and its performance. When examining the relative indicators of infrastructure, it is possible to note from the results that, if we observe the parameters (values) for the length of infrastructure relative to the territory of the state (the area in km2), Japan and France show very similar values. In road infrastructure, Japan ranked first owing to a very developed road infrastructure network.
However, Japan performs much worse according to the road infrastructure per 1 million inhabitants, below average. Japan was even in last place in terms of the railway infrastructure per 1 million inhabitants, with 159.92 km of network per 1 million inhabitants. However, Japan has a very well-established network of high-speed trains (eight Shinkansen system main lines) for rail passenger transport with a large number of transported passengers, which compensates for the smaller extent of road infrastructure. It should be underlined that the Shinkansen bullet train system does not transport freight. One of the biggest rail freight companies in Japan is JR Freights. The company rents infrastructure from other companies (passenger ones) [
35], which makes freight transport dependent on the time windows between passengers’ transportation. Additionally, Japan, as an island country, does not have transit road freight transport like a number of European countries such as Germany, Austria, Slovakia, and the Czech Republic.
Another factor that can reduce transport performance in tonne-kilometers, especially in rail and also partly in road freight transport, is the use of coastal sea transport or river freight transport. Here, we see the possibility of refining the research of the relationship between the need for transport infrastructure for freight transport as an important factor for the economic development of regions based on industry and the extraction and processing of raw materials. In the selection of European countries for research, we also did not consider typical island states such as Cyprus and Malta, which no longer have a railway transport infrastructure in operation.
France and Japan are among the founding states of the so-called Group of Seven (G7) of the most developed countries in the world and also have access to the sea, and thus, part of the transport of goods can be realized by coastal maritime transport, which may be one of the reasons that they have similar results.
In terms of the correlation between the length of infrastructure and the performance in rail transport or road transport, we found a statistically significant linear relationship between the pairs of variables Yrail − Xrail and Yroad − Xroad in different countries. Therefore, it is necessary to focus further research on the correlations between those variables in countries where the core network is clearly defined, while at the same time analyzing in more depth the countries in which the correlations for road and rail transport have intersected.
The results of the correlation between the length of railway infrastructure and performance in rail freight transport show a statistically significant relationship (strong or medium direct dependence) also in the case of Greece, Romania, Bulgaria, Norway, Denmark, Lithuania, Ukraine, Croatia, Switzerland, and Slovakia. Surprisingly, there is a weak dependence in the Czech Republic, which ranks first in the number of km of railway lines per km2 of its area from the studied countries. This can be caused by insufficient maintenance of railway lines but also by a significant change in the structure of the industry.
The results of the examination of the correlation between investments in railway infrastructure and transport performance in rail freight transport also show a statistically significant relationship in the case of the states of Denmark, Norway, the United Kingdom, and Luxembourg. In the case of Denmark and Norway, we observe a strong-to-medium direct dependence between the variables, which means that investment in infrastructure affects the performance of rail transport in the countries concerned.
The opposite case can be observed in the case of countries such as the United Kingdom, where we observe a medium indirect dependence, i.e., investment in infrastructure does not affect the performance of rail freight transport. Especially in rail freight transport, it is not enough to build or reconstruct railway lines, but it is necessary to create additional conditions for the growth of rail freight transport: for example, the construction of railway sidings, the construction of combined transport terminals, access to the transport market and foreign carriers, and also, indirectly, greater regulation of road freight transport.
The results of the study of the correlation between the length of road infrastructure and transport performance in road freight transport show a statistically significant linear relationship in the case of Germany, Bulgaria, Poland, Hungary, Lithuania, Denmark, Slovakia, and the Czech Republic. The strength of a relationship ranges from strong to moderate direct dependence. It follows that the length of the infrastructure in the countries concerned affects the performance of road transport. It should be noted that these are transit countries through which main routes pass from east to west and from north to south of Europe.
In the case of the results of the study of the impact of road infrastructure investments on road freight transport performance, Germany has a strong direct dependence (correlation coefficient up to 0.99694), which is the largest transit country in Europe in addition to the strongest EU economy. There is also strong direct dependence in Bulgaria, which is a transit country mainly from Turkey and Greece, and Poland, which, in addition to its own growing economy, is the main transit country from East to West Europe and vice versa.
Weak direct dependence between investments in road infrastructure and transport performance in road freight transport is, e.g., in Croatia, which has invested heavily, especially in motorways. However, they are used mainly by passenger cars, and it is related to the support of tourism on the Adriatic Sea.
Given the focus of research on rail and road transport infrastructure, it would be interesting to examine only countries that do not have access to the sea and do not use this mode of transport for freight. However, the sample examined would be significantly reduced to the following countries: the Czech Republic, Luxembourg, Hungary, Austria, Slovakia, and Switzerland.
Statistical data on transport performance in tonne-kilometers are much more accurate for rail freight transport because they are obtained from all freight transport carriers; for example, there are only 25 of them in the Slovak Republic. There are more than 6000 carriers registered in road freight transport in the Slovak Republic, and only carriers with more than 20 employees are obliged to provide statistics. For others, a sample survey is performed, and statistics are calculated. Regulated cabotage is allowed within the EU. The point is that, for example, carriers from other Member States may perform up to three domestic transports on the territory of the Slovak Republic after international transport, and they enter the statistics of other states and not the statistics of the Slovak Republic. The numbers of these shipments are difficult to control, and therefore, the EU requires tachographs to enter domestic borders from 2 February 2022, and new digital tachographs from 2023 will record border crossings and (un)loading points without driver intervention. This creates a precondition for the refinement of data in statistics on the performance of domestic road freight transport.
The question of how investments in transport infrastructure affect the environment is also important for a sustainable green economy. For example, Reference [
36] examines the interaction between VAT growth and investments in transport infrastructure, where the impact on rail infrastructure is not very significant but helps to build sustainable transport systems. Meanwhile, investments in road and air transport infrastructure have a negative impact on the environment. However, the research question requires a more comprehensive study because the structure of the vehicle fleet in road transport can be significantly changed in favor of the use of alternative fuels, and other elements from sustainable mobility plans can be employed, e.g., improving the quality of public passenger transport, bicycle transport, bike sharing, carsharing, the regulation of individual transport through the creation of low-emission zones, etc. The impacts of building road infrastructure on the environment can thereby be reduced. The relationship between urban transport infrastructure in a sample of 280 cities in China and air quality according to the panel smooth-transition regression (PSTR) model is given in [
37].
When examining the impact of transport infrastructure development on the performance of individual modes of transport and the impact on the environment, it is necessary to take into account the equipment of the transport infrastructure, especially charging stations and filling stations dedicated to alternative fuels. Partial results were published for Japan by Watabe et al. [
38]. The aim of transport infrastructure development should be a sustainable transport system that meets the needs of the economy. Some proposals for a sustainable European transport system are published in [
39]. The assessment of the effects of transport infrastructure on road freight transport performance also needs to include the provision of transport infrastructure with car parks and appropriate equipment for drivers’ rest in accordance with social rules, which are still being tightened up [
40].
Transport infrastructure development plans also need to transform transport investments into climate-resistant and low-carbon transport in order to achieve sustainable transport infrastructure.
The European Union is adopting a recovery plan to mitigate the effects of the COVID-19 pandemic on the economy. Slovakia, as an EU Member State, has submitted a plan in which €750 million is allocated for sustainable transport. This is mainly investments in railway repairs, the construction of cycle paths, the promotion of environmentally friendly public passenger transport, the promotion of intermodal transport, and the construction of charging stations for electric vehicles and hydrogen stations [
41,
42,
43]. Similarly, other countries in the world are committed to investing in transport infrastructure, as described in [
44]. Investment decisions need to have the greatest economic benefits but also help to reduce the environmental impact of transport.
It is generally argued, especially at the regional political level, that without transport infrastructure, no industry or other investment will come to a region. The European Commission is proposing to modernize cohesion policy in the next programming period 2021–2027. This is the EU’s main investment policy and one of its most substantial expressions of solidarity. One of the goals of a modernized cohesion policy is to make Europe more connected to strategic transport and digital networks. The global COVID-19 pandemic and the preventive measures taken have significantly affected the mobility of the population and will have particular implications for sustainable urban mobility [
45]. The construction of high-quality digital networks and their accessibility in the EU Member States would reduce the need for travel, i.e., the demand for the completion of transport infrastructure, especially for passenger cars. On the other hand, the need to transport goods, raw materials, etc., would not be affected; rather, it may gradually grow again. Thus, the need for transport infrastructure for freight transport is essential for the interconnection of regions and the international exchange of goods. The aim of this study was to use correlation analysis to compare selected parameters of the road and railway infrastructure of Japan and selected EU countries. A test of the significance of the correlation coefficient was also performed. Correlation analysis is not typical in the freight transport research published to date. Relative indicators comparing only the length of transport infrastructure relative to the area of the state and the population are inaccurate and can lead to distorted results. Therefore, we recommend using correlation analysis to examine the correlation between the performance of rail and road freight transport and infrastructure and the necessary infrastructure investments. For states with access to the sea and navigable rivers for inland freight transport, it is also necessary to examine the transport infrastructure for these modes of transport and their performance within the examined states, with especial consideration of aspects of ecology [
46].
The decline in passenger air transport, especially on domestic airlines in EU countries due to the COVID-19 pandemic, and the promotion of sustainable mobility are leading to a reassessment of the need for domestic air transport. Some EU Member States (France, Germany, and Sweden) have declared that, even after the end of the COVID-19 pandemic, domestic air passenger transport between cities with good and fast rail connections will no longer be resumed. The Czech Republic has announced plans to build a high-speed line between the three largest cities: Prague, Brno, and Ostrava. Therefore, larger investments in the construction of high-speed railway lines can be expected. However, the question arises as to whether this will be to the detriment of investment in rail transport infrastructure for the transport of goods. Due to the lack of funding for transport infrastructure and its possible redistribution in favor of rail passenger transport, investment in the renewal of rail freight sidings may be reduced in some EU countries. The railways needed to increase freight capacity and improve the availability of combined transport terminals, and seaports may therefore not receive sufficient financial support.
According to the EU White Paper on Transport, one of the main objectives is to triple the existing high-speed rail network by 2030 [
47]. In the absence of funding and the current significant support for the construction of high-speed railways and the reduction of domestic air traffic, also due to the COVID-19 pandemic, this may lead to failure to meet EU targets for increasing rail freight transport.


 ,
, 


