
Agricultural Land or Photovoltaic Parks? The Water–Energy–Food Nexus and Land Development Perspectives in the Thessaly Plain, Greece

 ,
, 
 ,
, 
Abstract
:| «οὐκ ἐπ’ ἄρτῳ μόνῳ ζήσεται ἄνθρωπος» (Καινή Διαθήκη, Κατά Ματθαίον 4:4) |
| “Man shall not live on bread alone” (New Testament, Matthew 4:4) |
1. Introduction
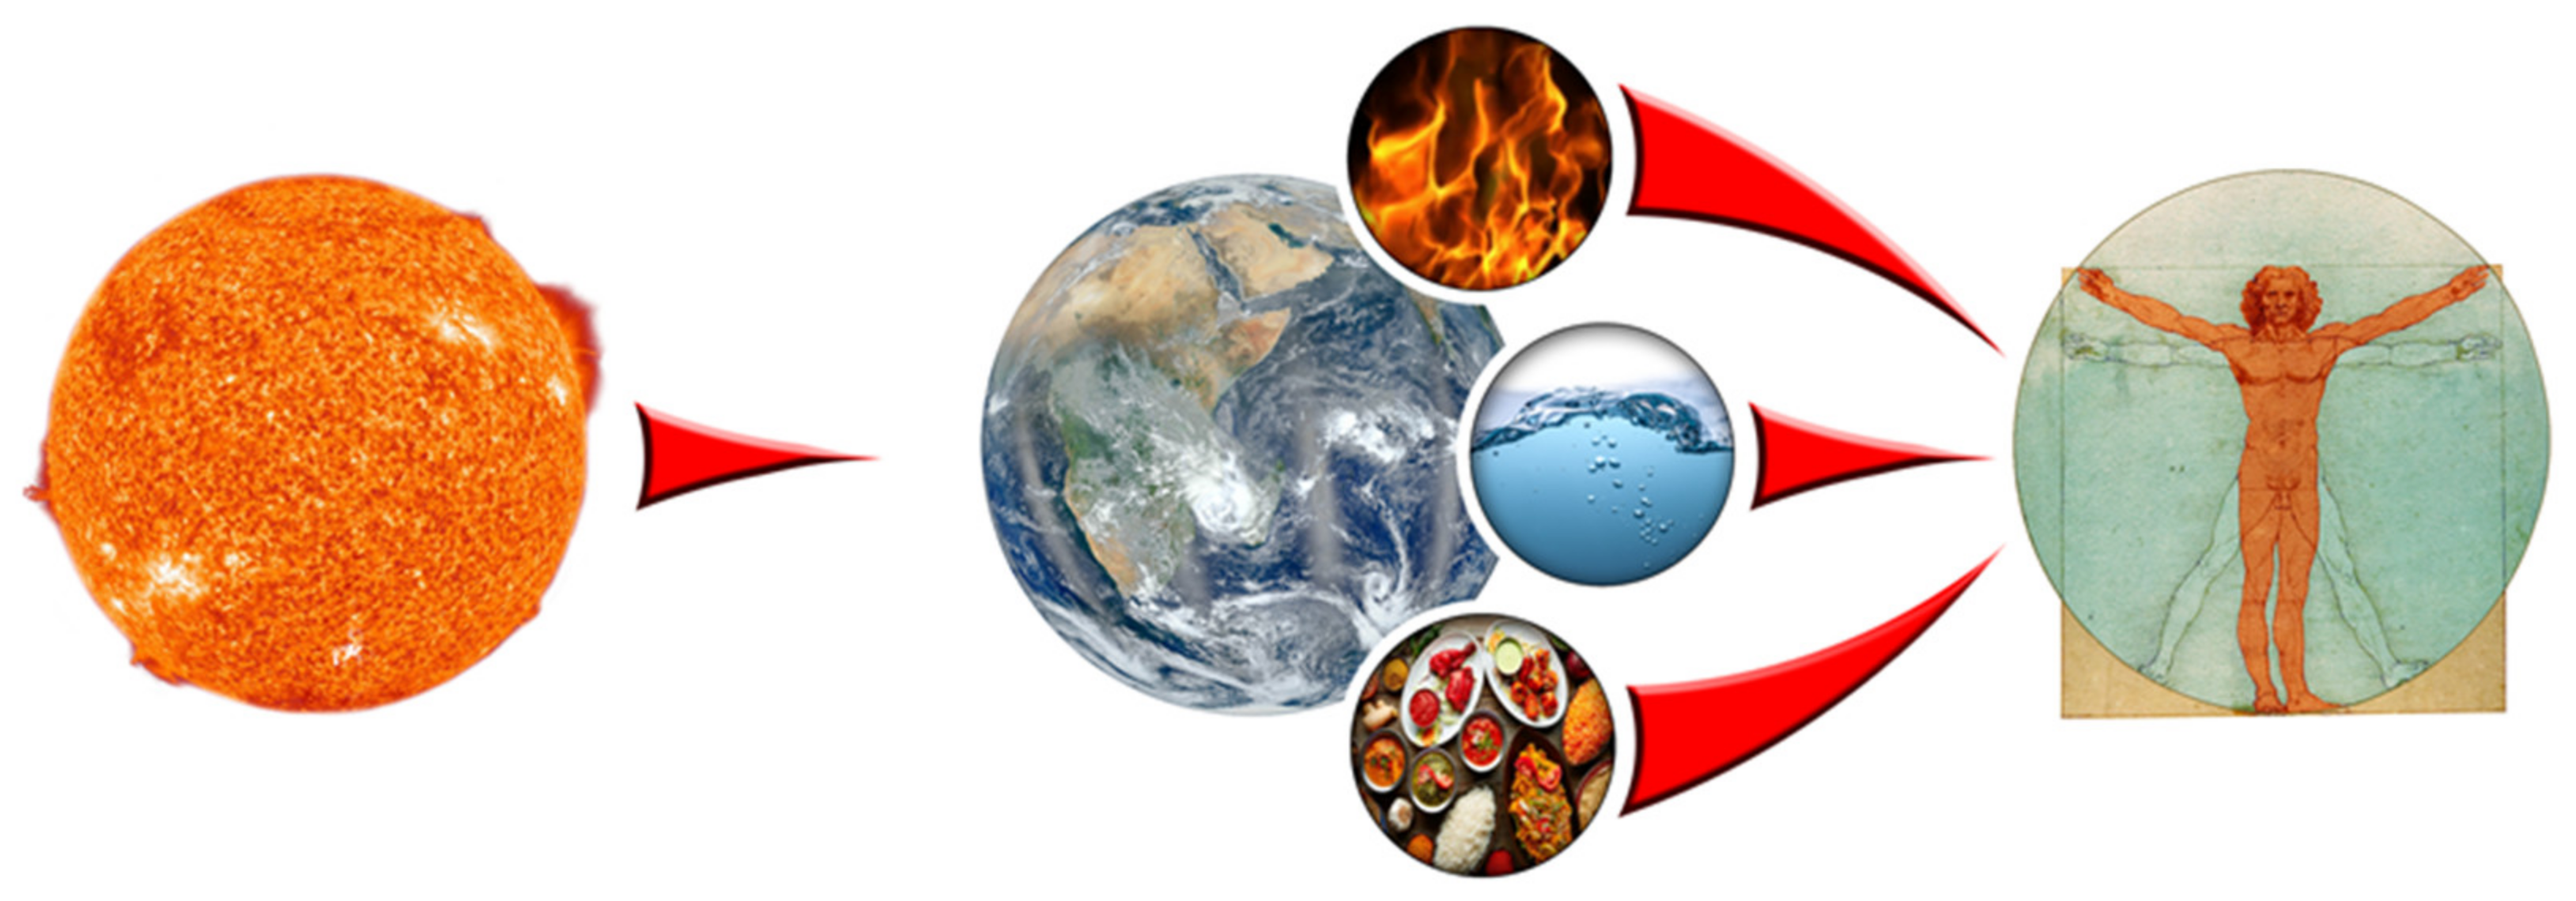
2. Energy Flow: From Sun to Humans
The total energy involved in the hydrological cycle is 1.290 × 1024 J yr−1 or 1290 ZJ yr−1. This is about half the global solar energy absorbed by the Earth (161 W m−2, according to Trenberth et al. 2009 [20]). Compared to the human energy production, which in the past decade was about 170,000 TWh yr−1 or 0.612 ZJ yr−1 (corresponding to the year 2014; Mamassis et al. 2021 [21]), the total energy involved in the water cycle is 2100 times higher. Put differently, the total human energy production in 1 year equals the energy consumed (or released) by the hydrological cycle in about 4 h.
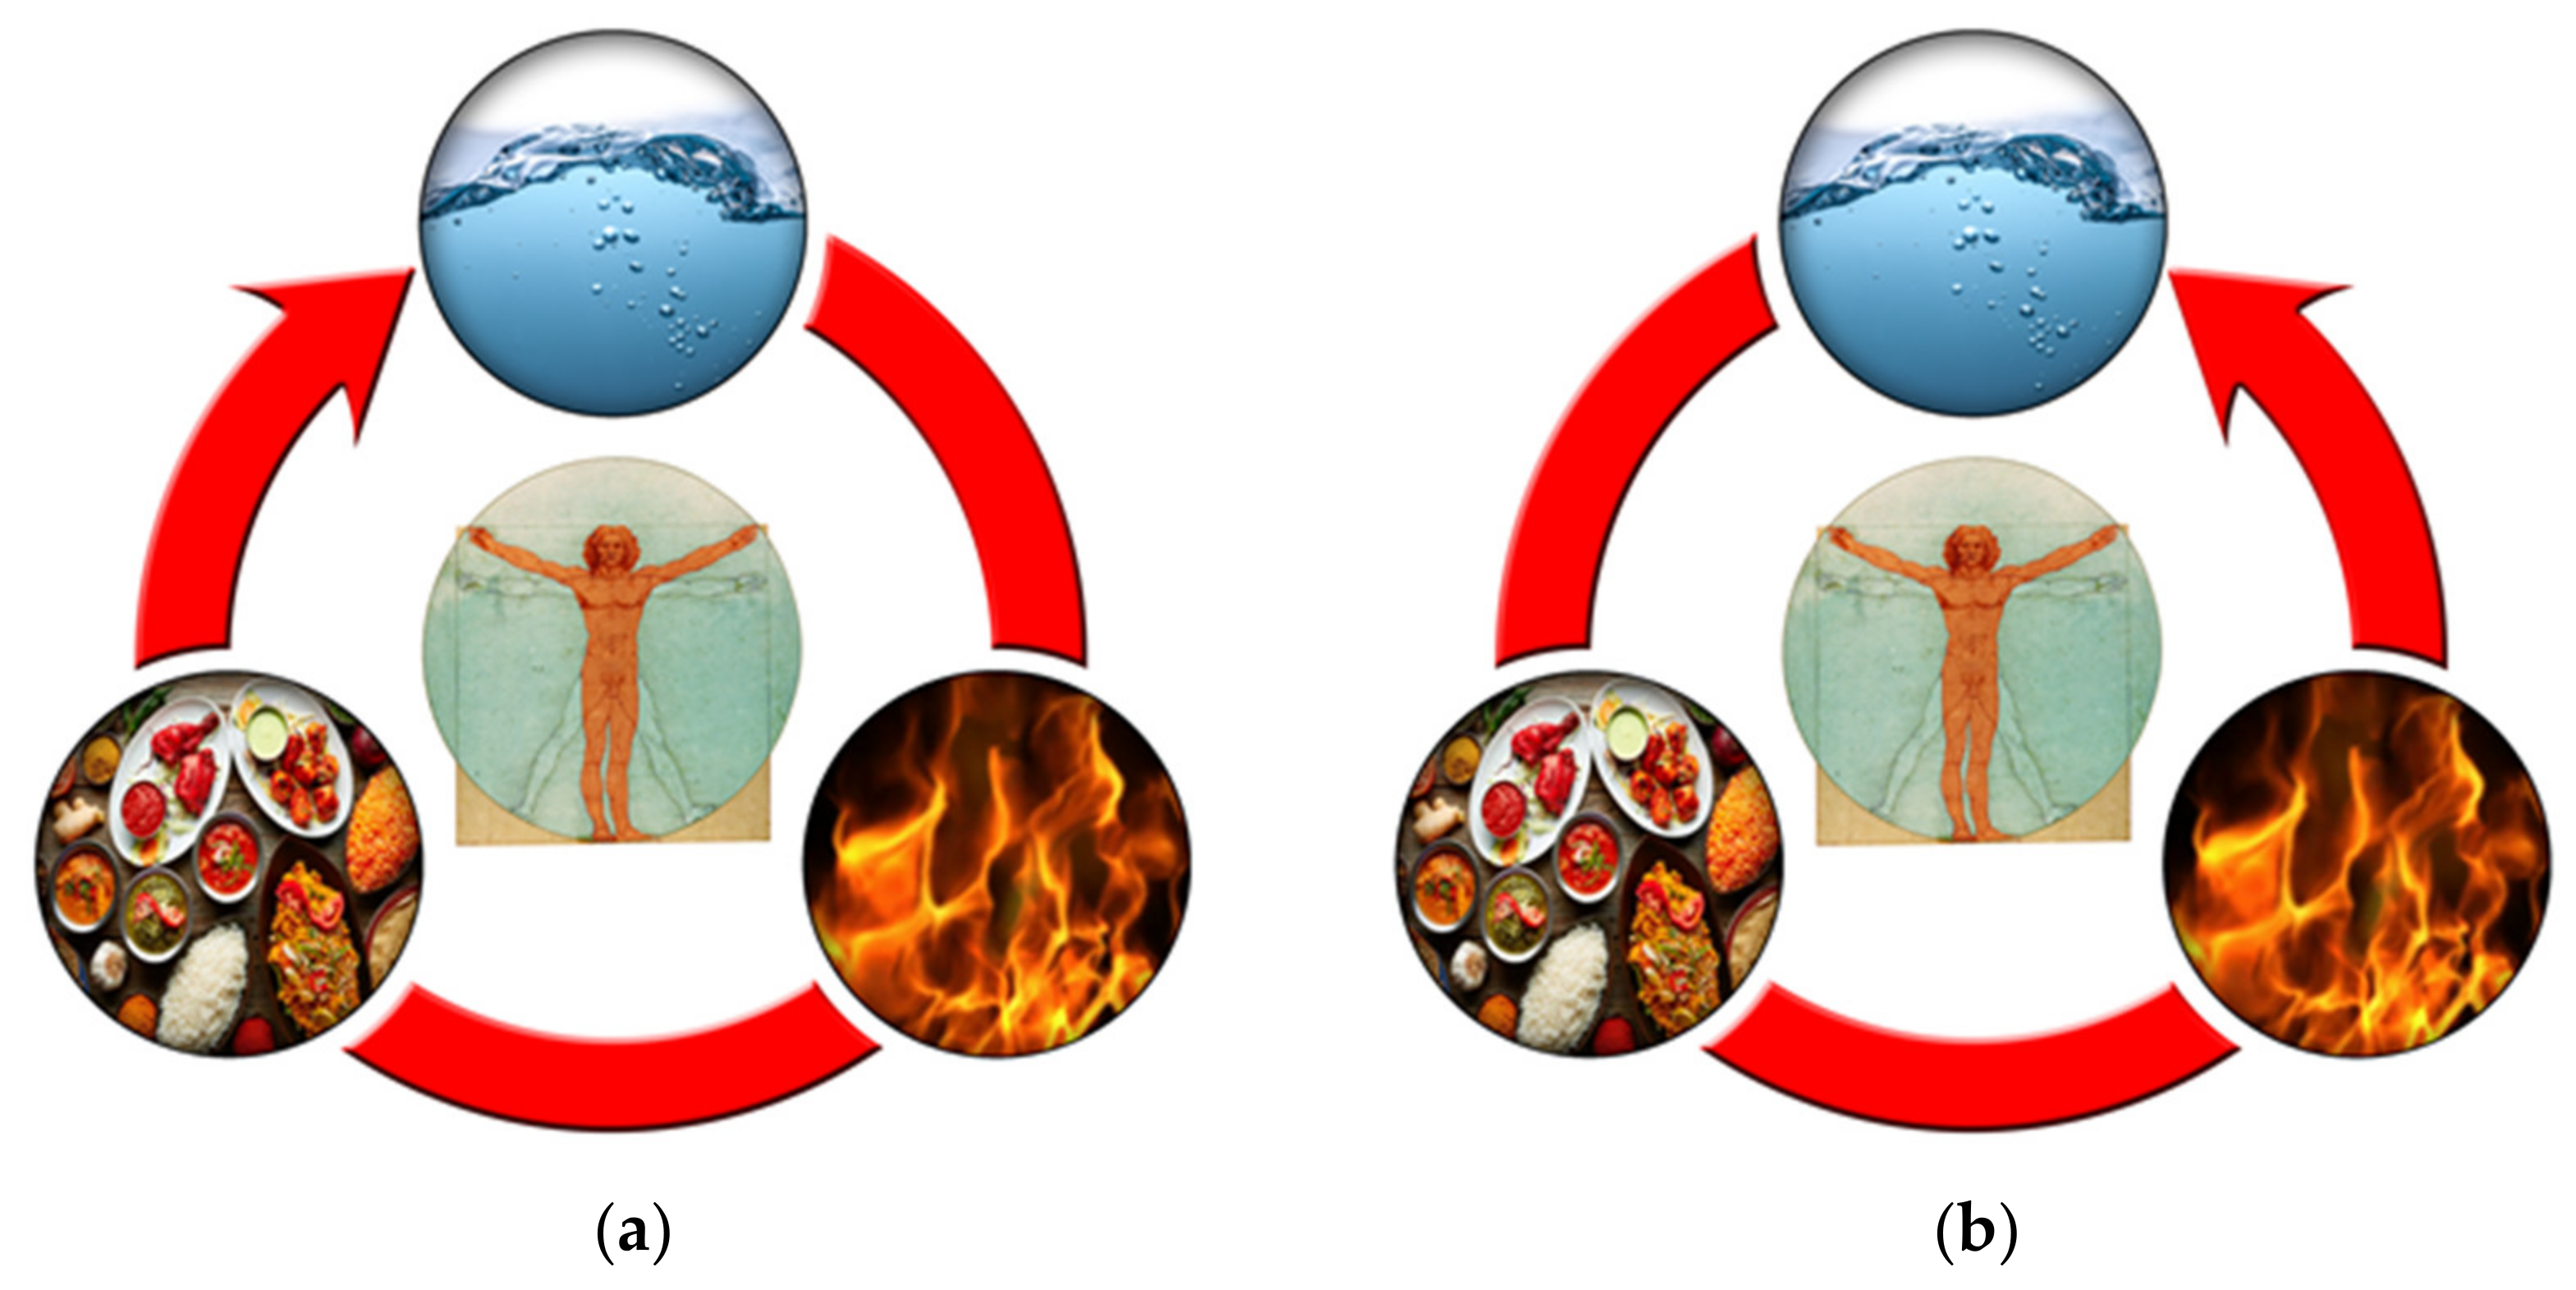
3. The Competition between WEF
3.1. Clockwise Direction
3.1.1. Water to Energy
- There are several water and energy interactions [25].
3.1.2. Energy to Food
- Solar energy is a basic requirement for the cultivation of plants. The production of food is an energy expensive process. Food production consumes globally 30% of total energy [26] (harvesting, tillage, processing, storage).
- The production of fertilizers is an energy intensive process.
3.1.3. Food to Water
- Water is incorporated within the produced food.
- Fertilizers have a negative effect on the quality of water and have serious implications for ecosystems.
3.2. Counterclockwise Direction
3.2.1. Water to Food
- Yields of irrigated agricultural land are higher.
3.2.2. Food to Energy
- Biofuels are produced by food (e.g., corn, soya).
- Land is used for mining, cultivation of biofuel plants, and PV panels, creating competition to the cultivation of food.
3.2.3. Energy to Water
- Groundwater (which needs energy to be pumped in order to be useful) is the world’s most extracted natural source. Koutsoyiannis estimates groundwater uses from several studies, based on global hydrological models and GRACE data, to be 300 km3/year in recent years [19].
- Natural water, clean water, and wastewater need energy for treatment and transportation.
- Water distribution and especially desalination are energy intensive processes.
3.3. Land Use Related to Food, Energy, and Water
- It is important to highlight the competitive relationship of land uses with the water–food–energy nexus. Land can be used:
- For food production
- For energy production
- ○
- cultivation of biofuel plants,
- ○
- installation of PV panels, and
- ○
- creation of reservoirs in hydroelectric dams.
4. The Role of WEF for Humans
4.1. Water
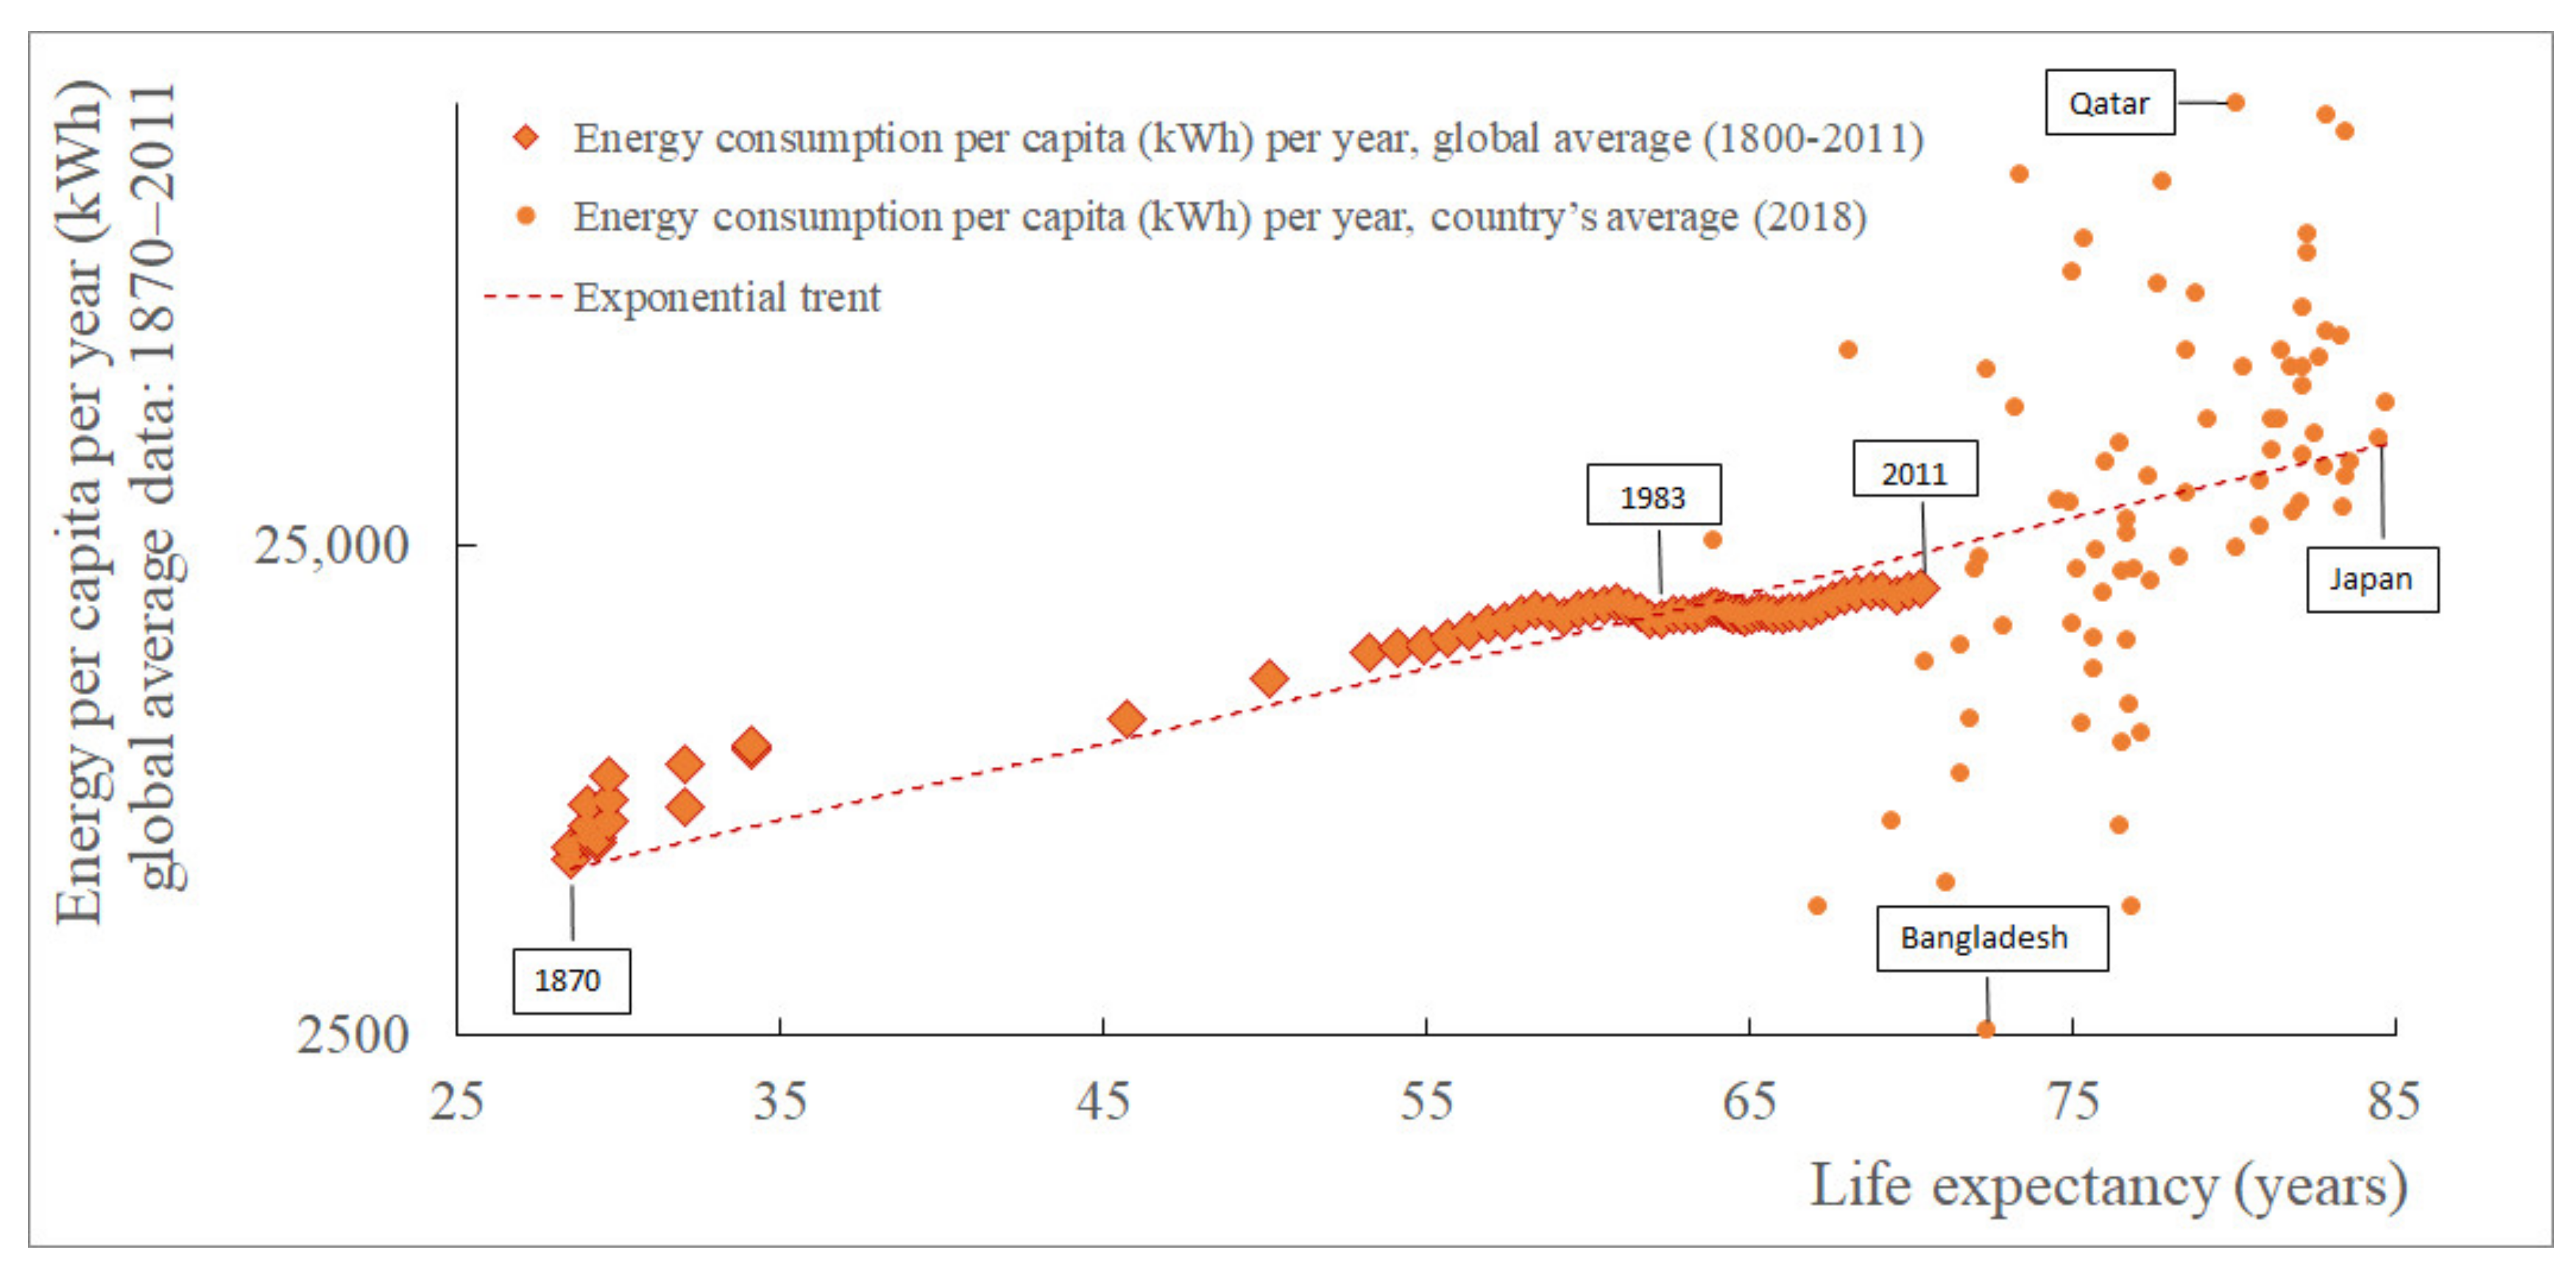
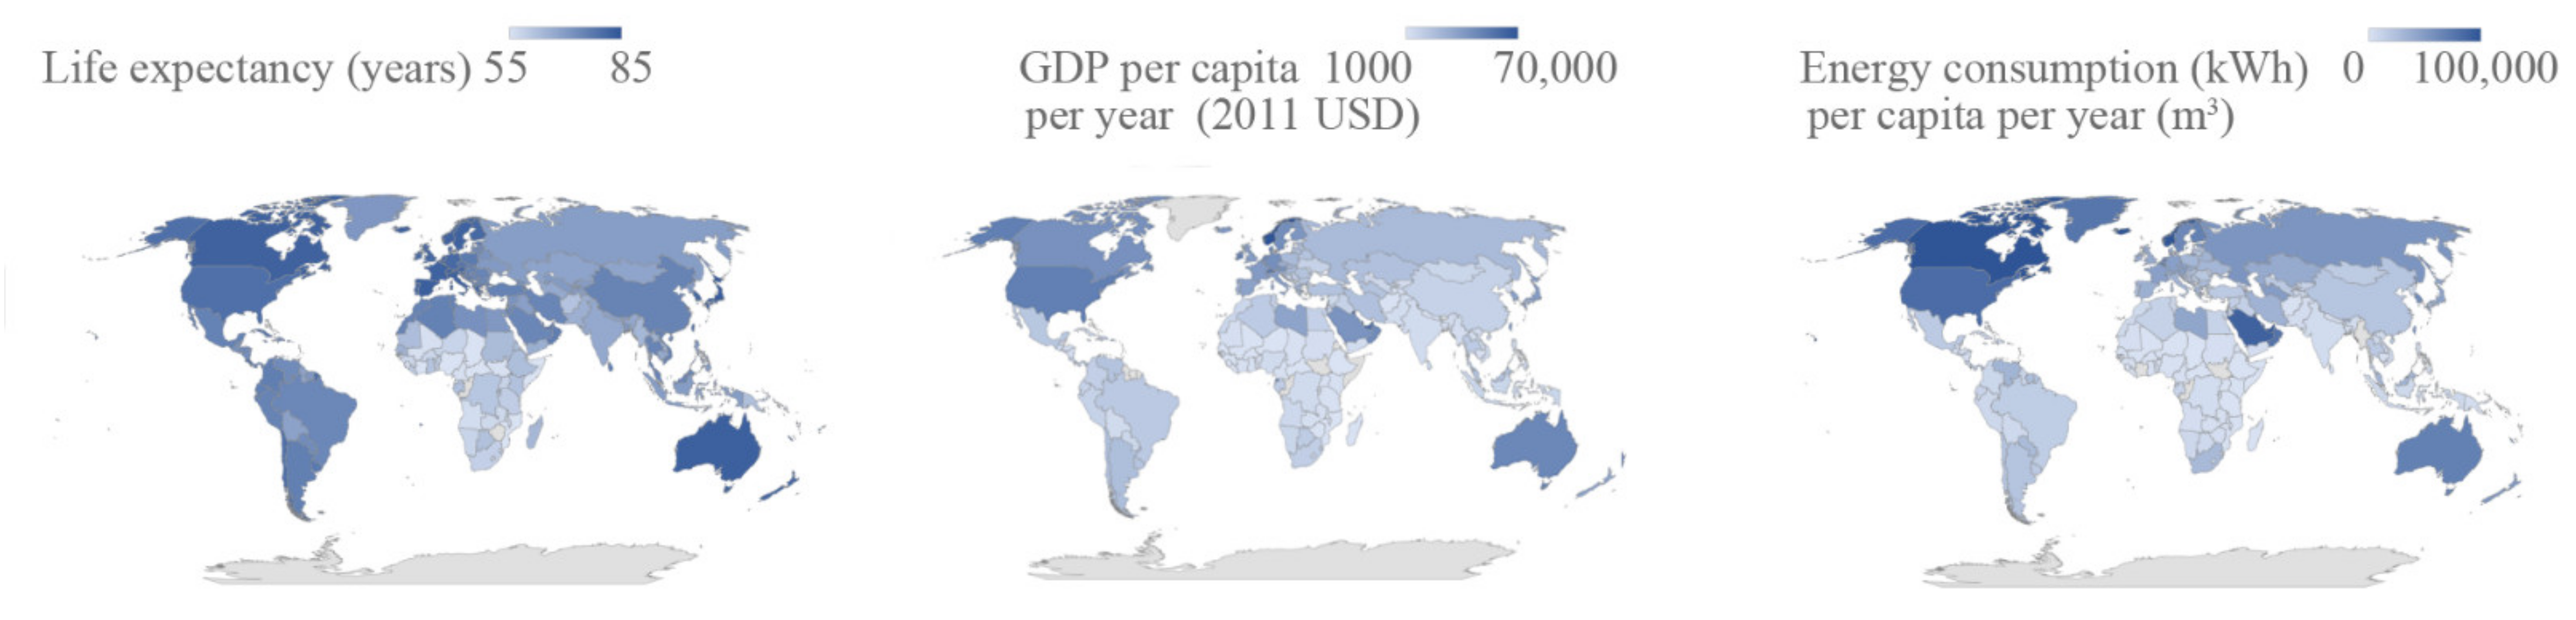
4.2. Energy
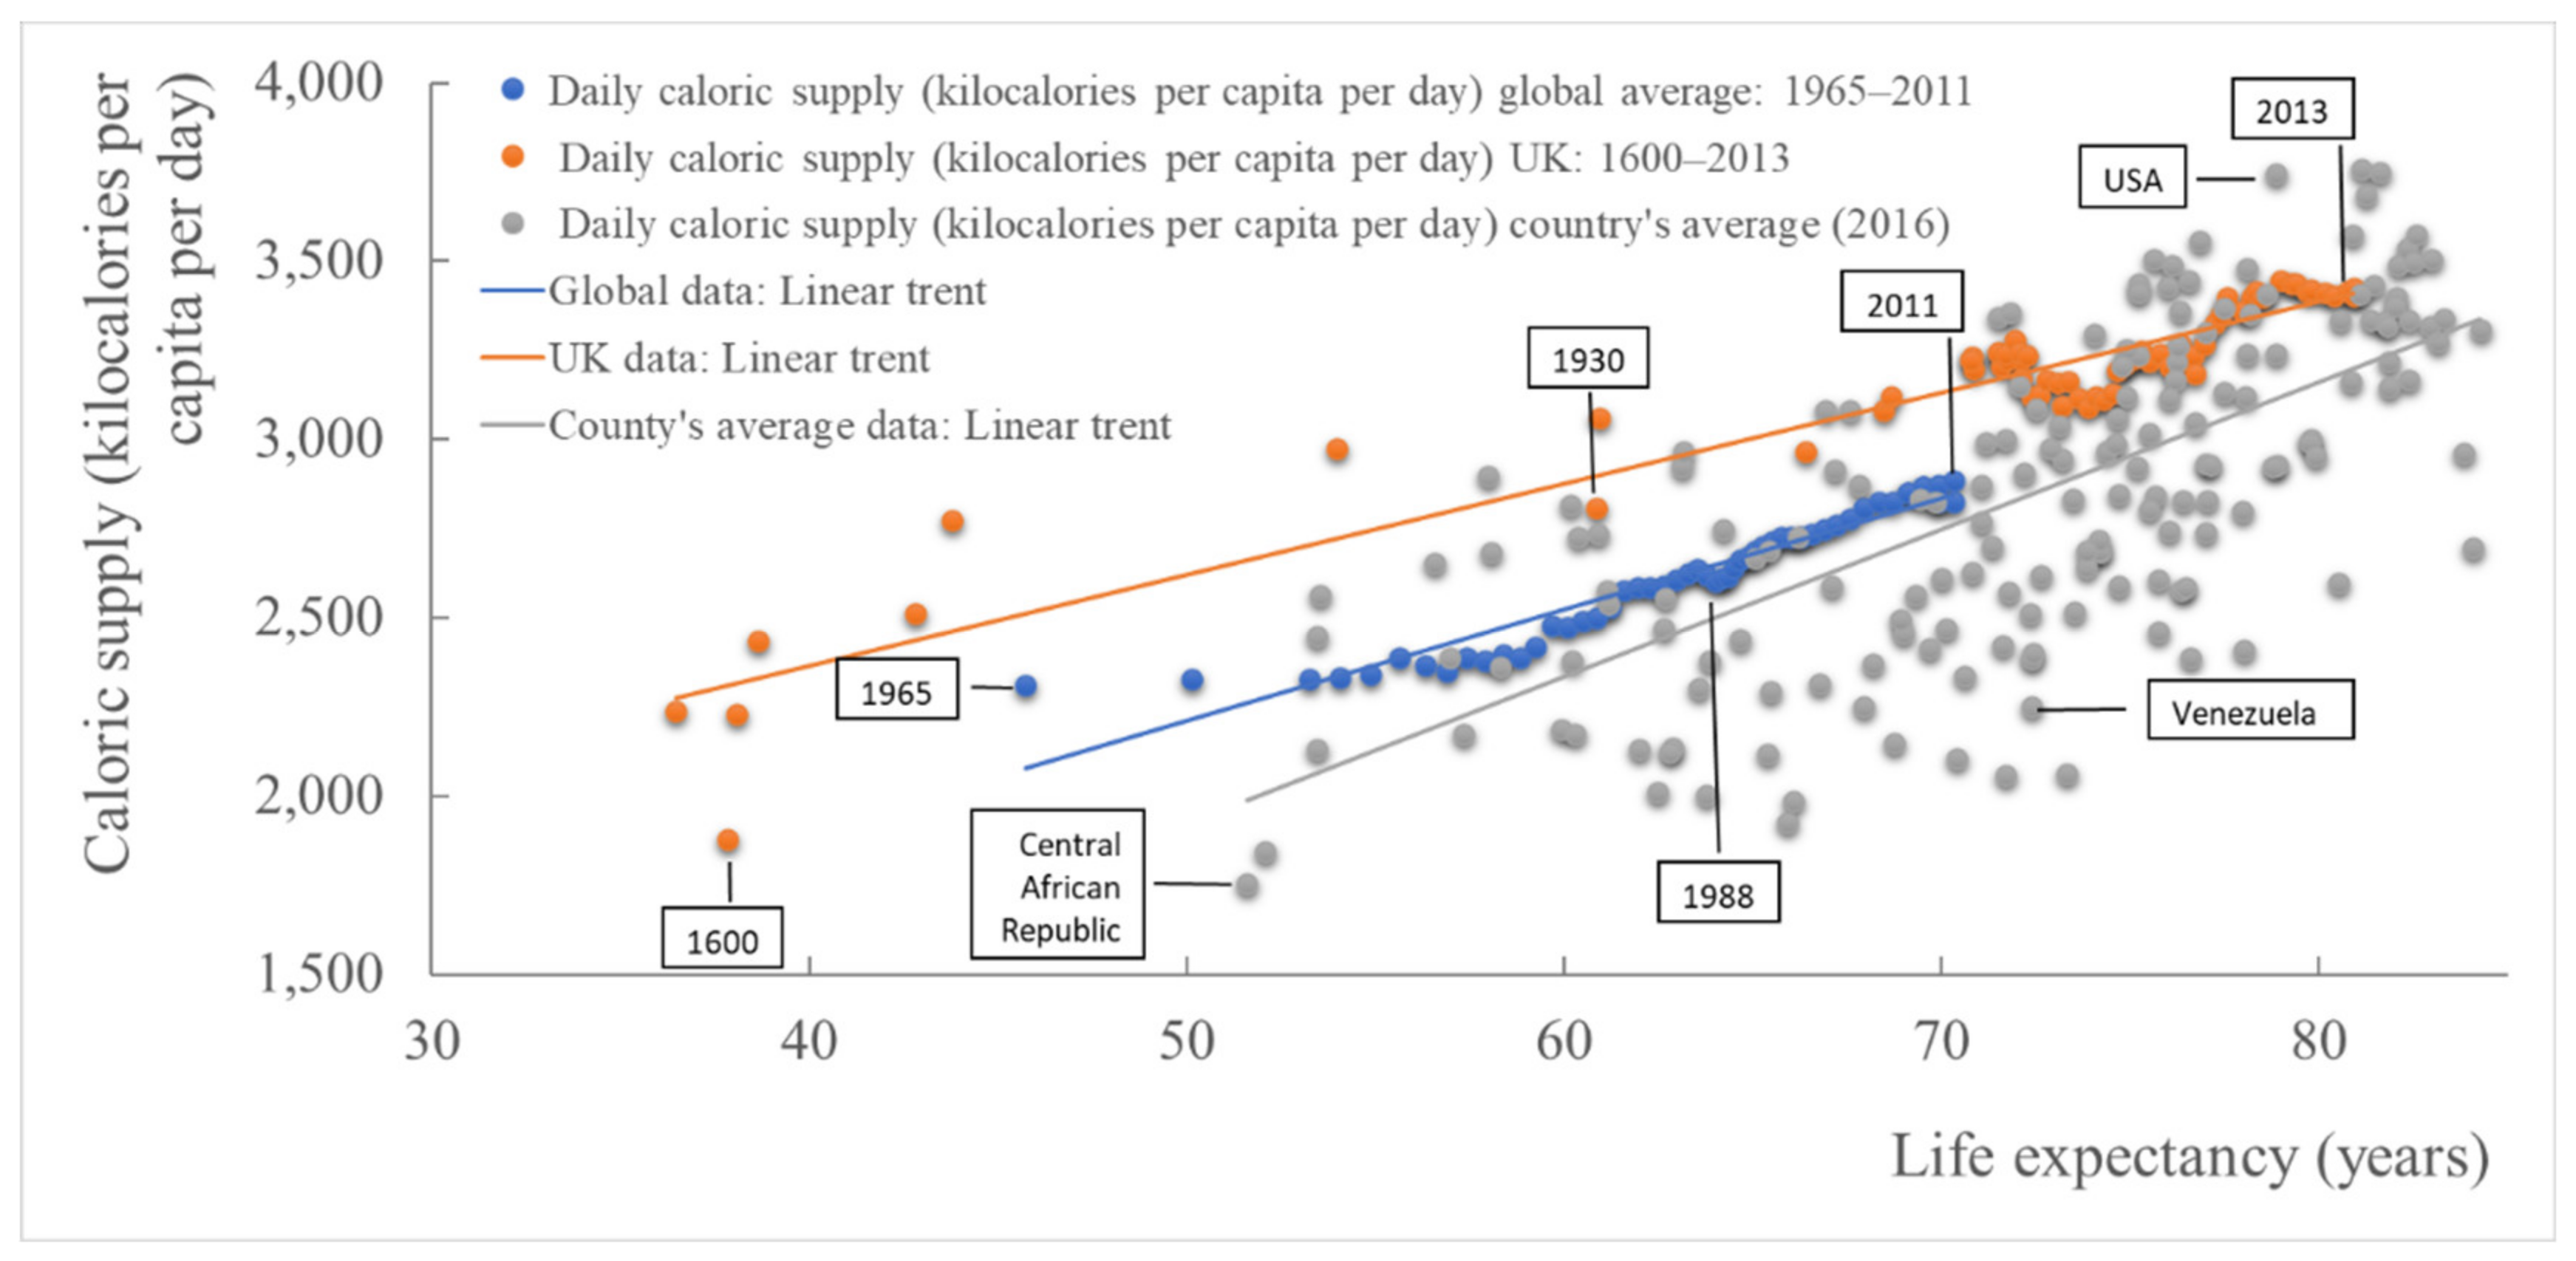
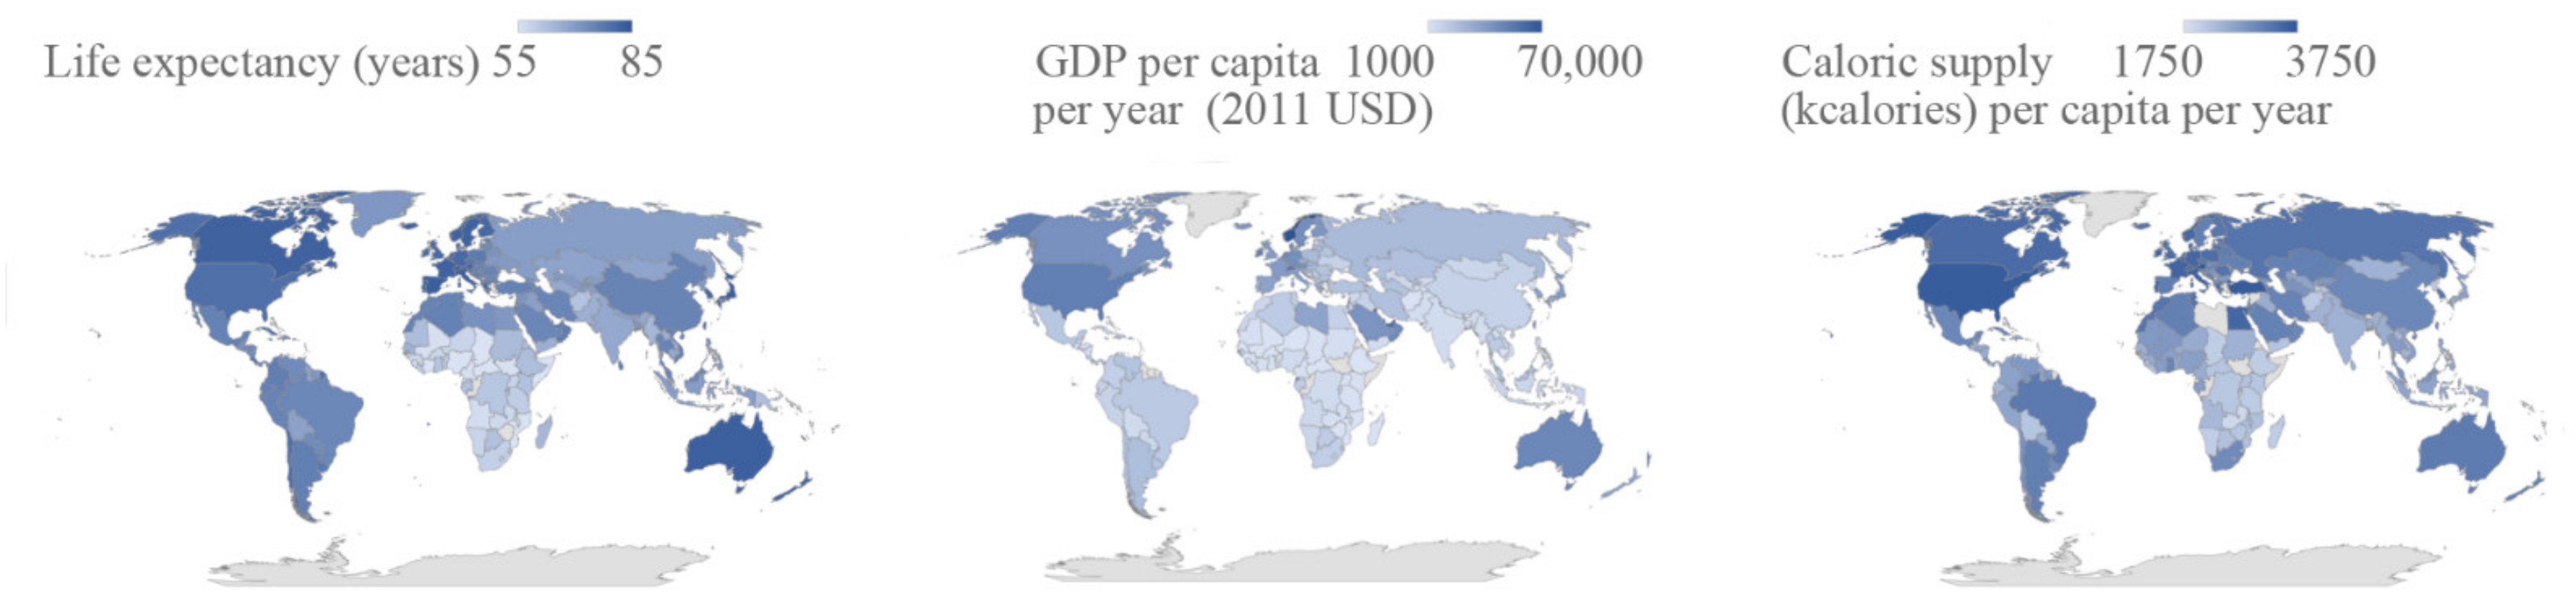
4.3. Food
5. Overview of WEF, Land Synergies, and Conflicts
5.1. Studding the WEF Nexus
5.2. Society, Water–Food–Energy Nexus, and Optimization Aspects
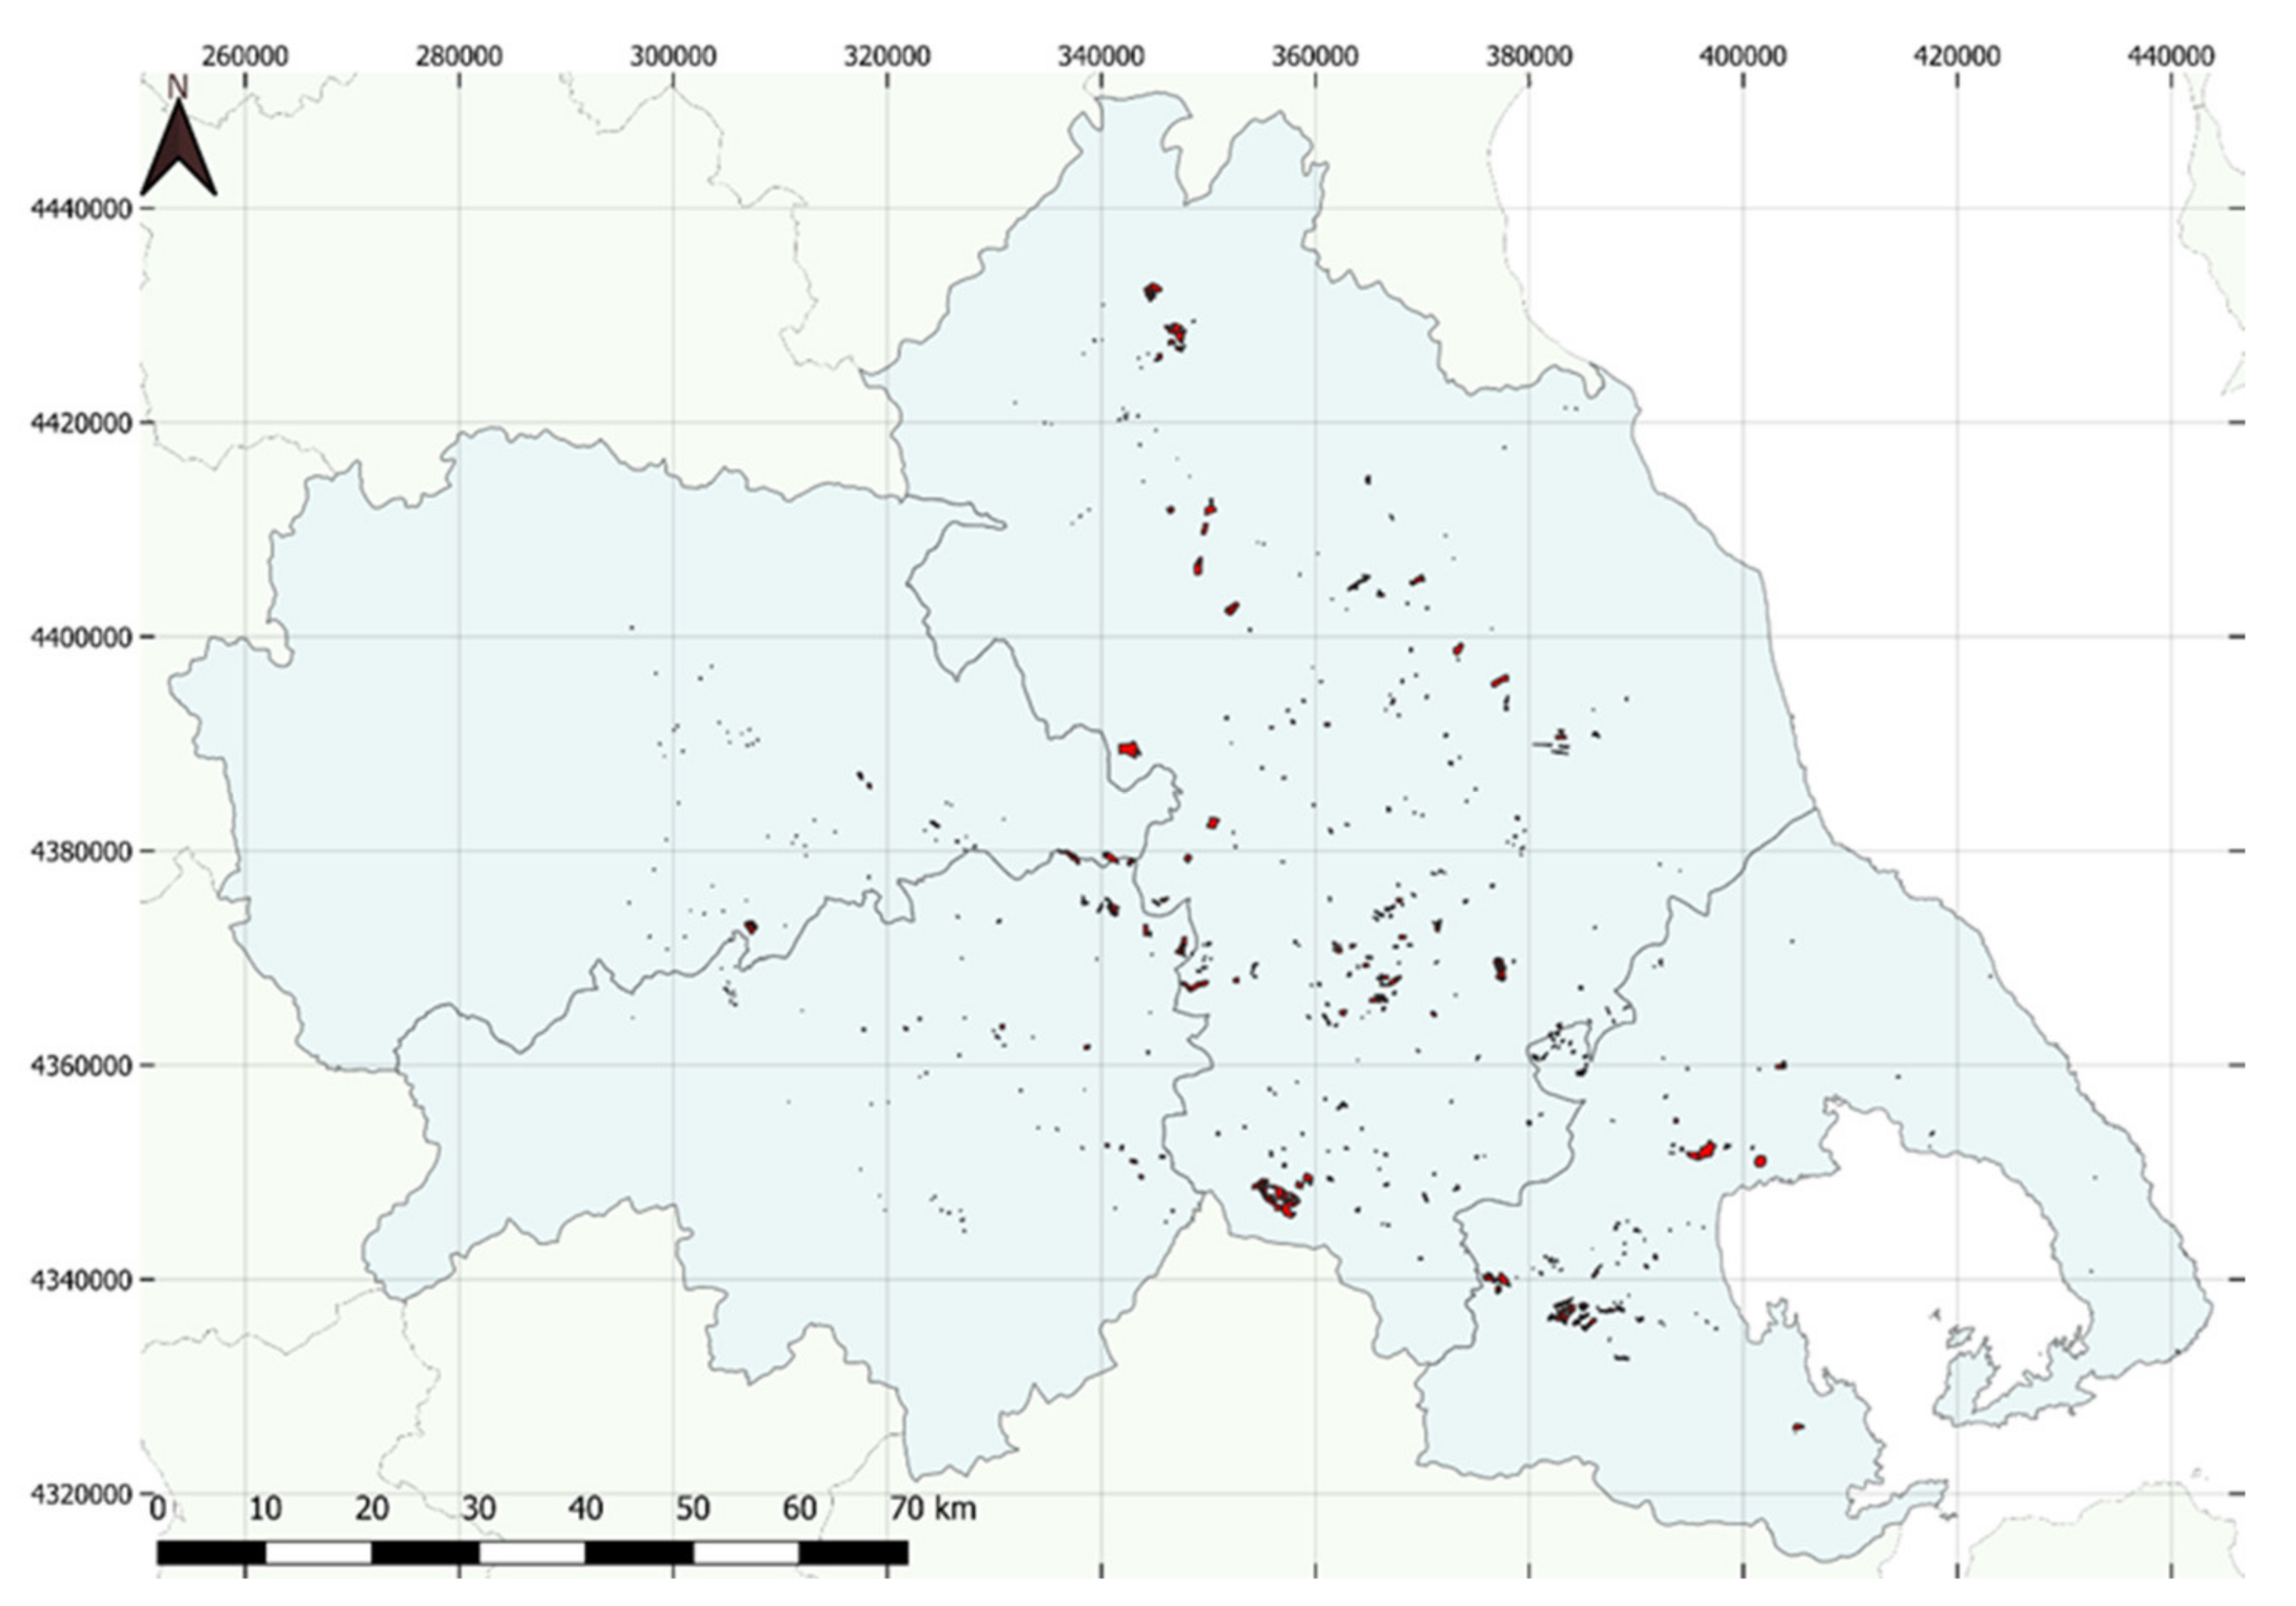
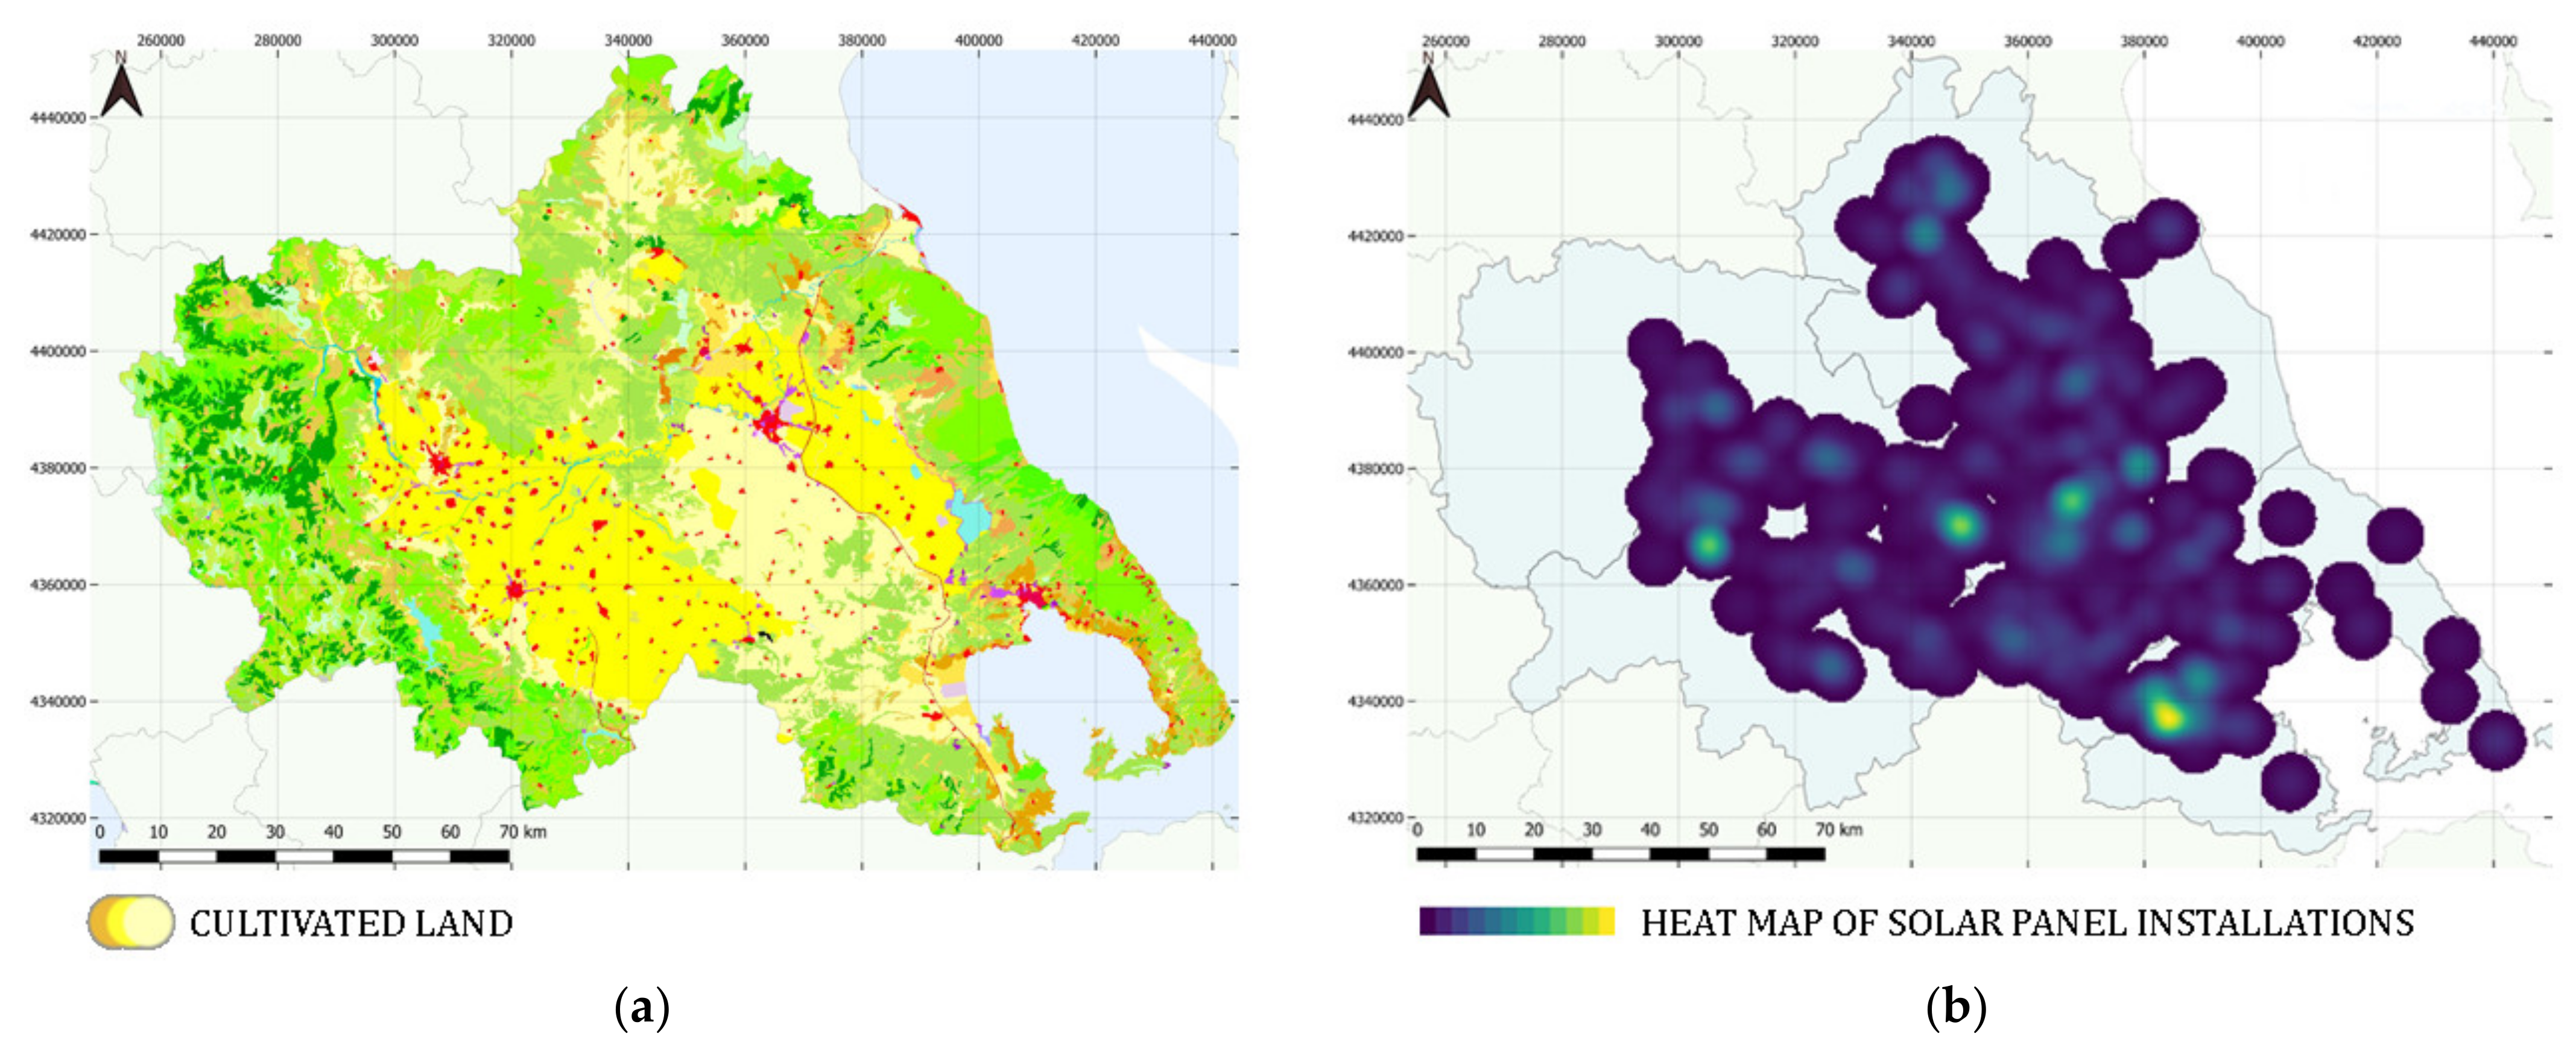
5.3. PV Development in Agricultural Lands
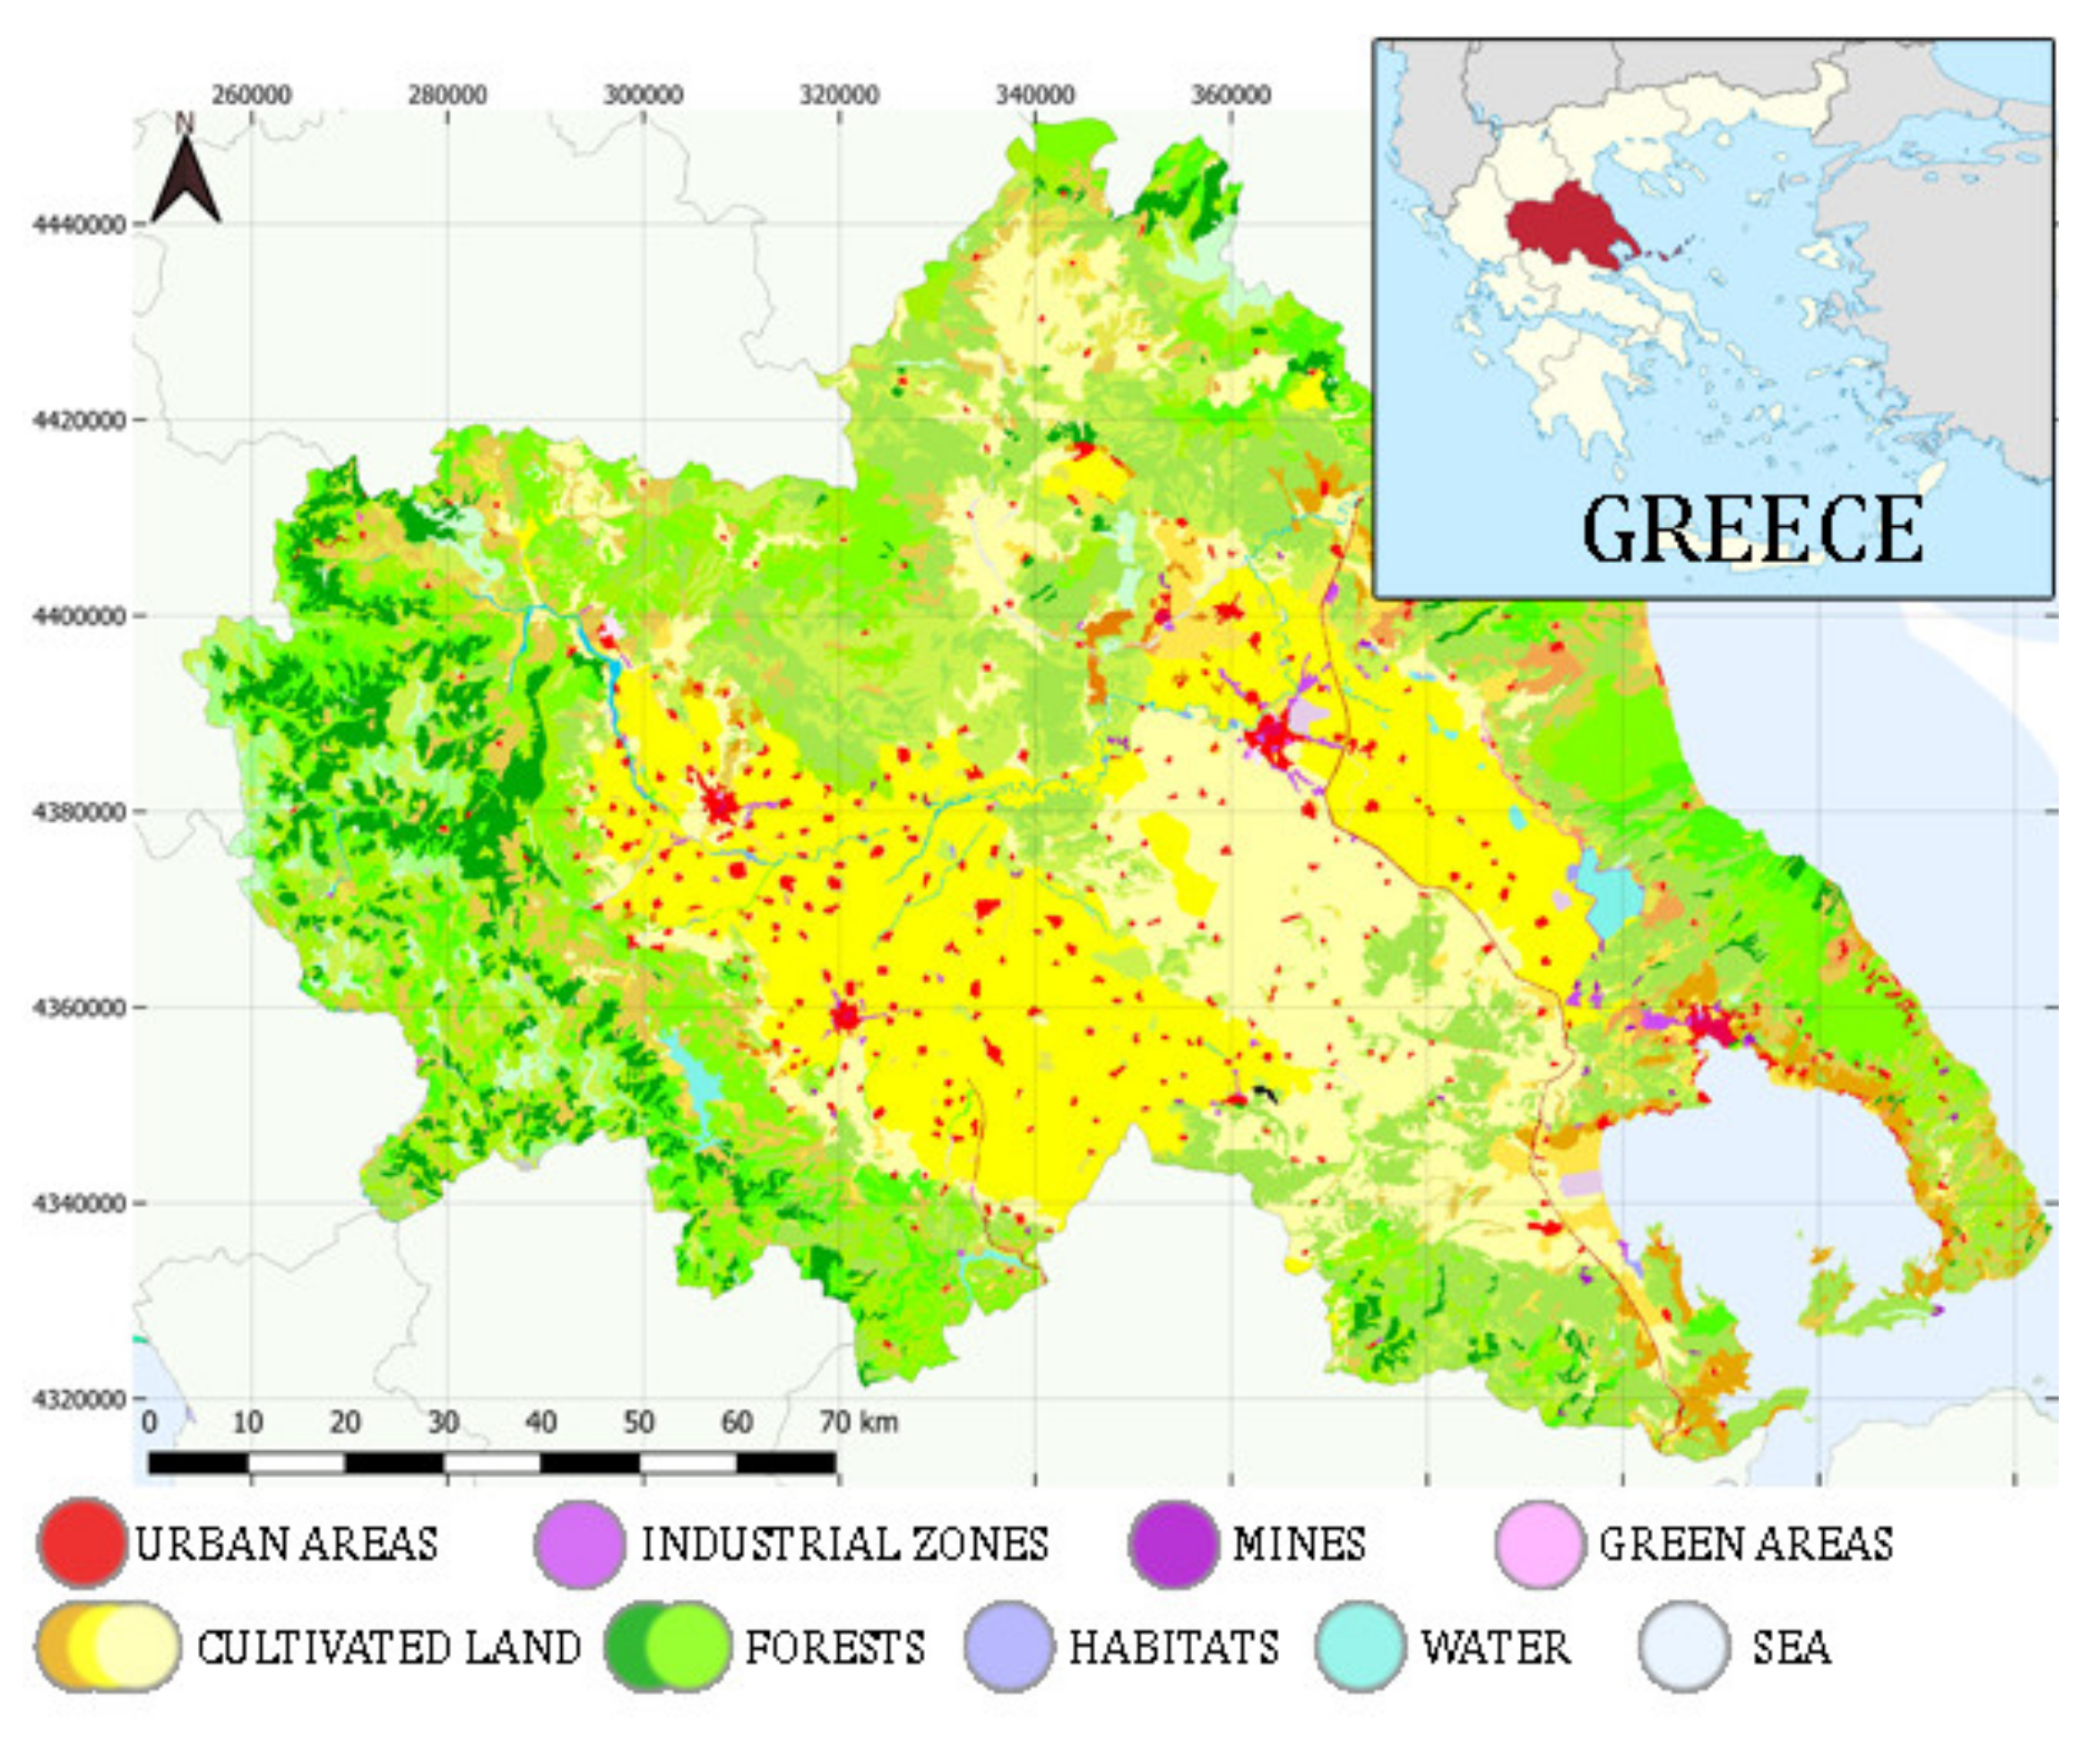
6. Case Study: The Camp of Thessaly
6.1. Overview of the Food–Land–Energy Nexus in Thessaly
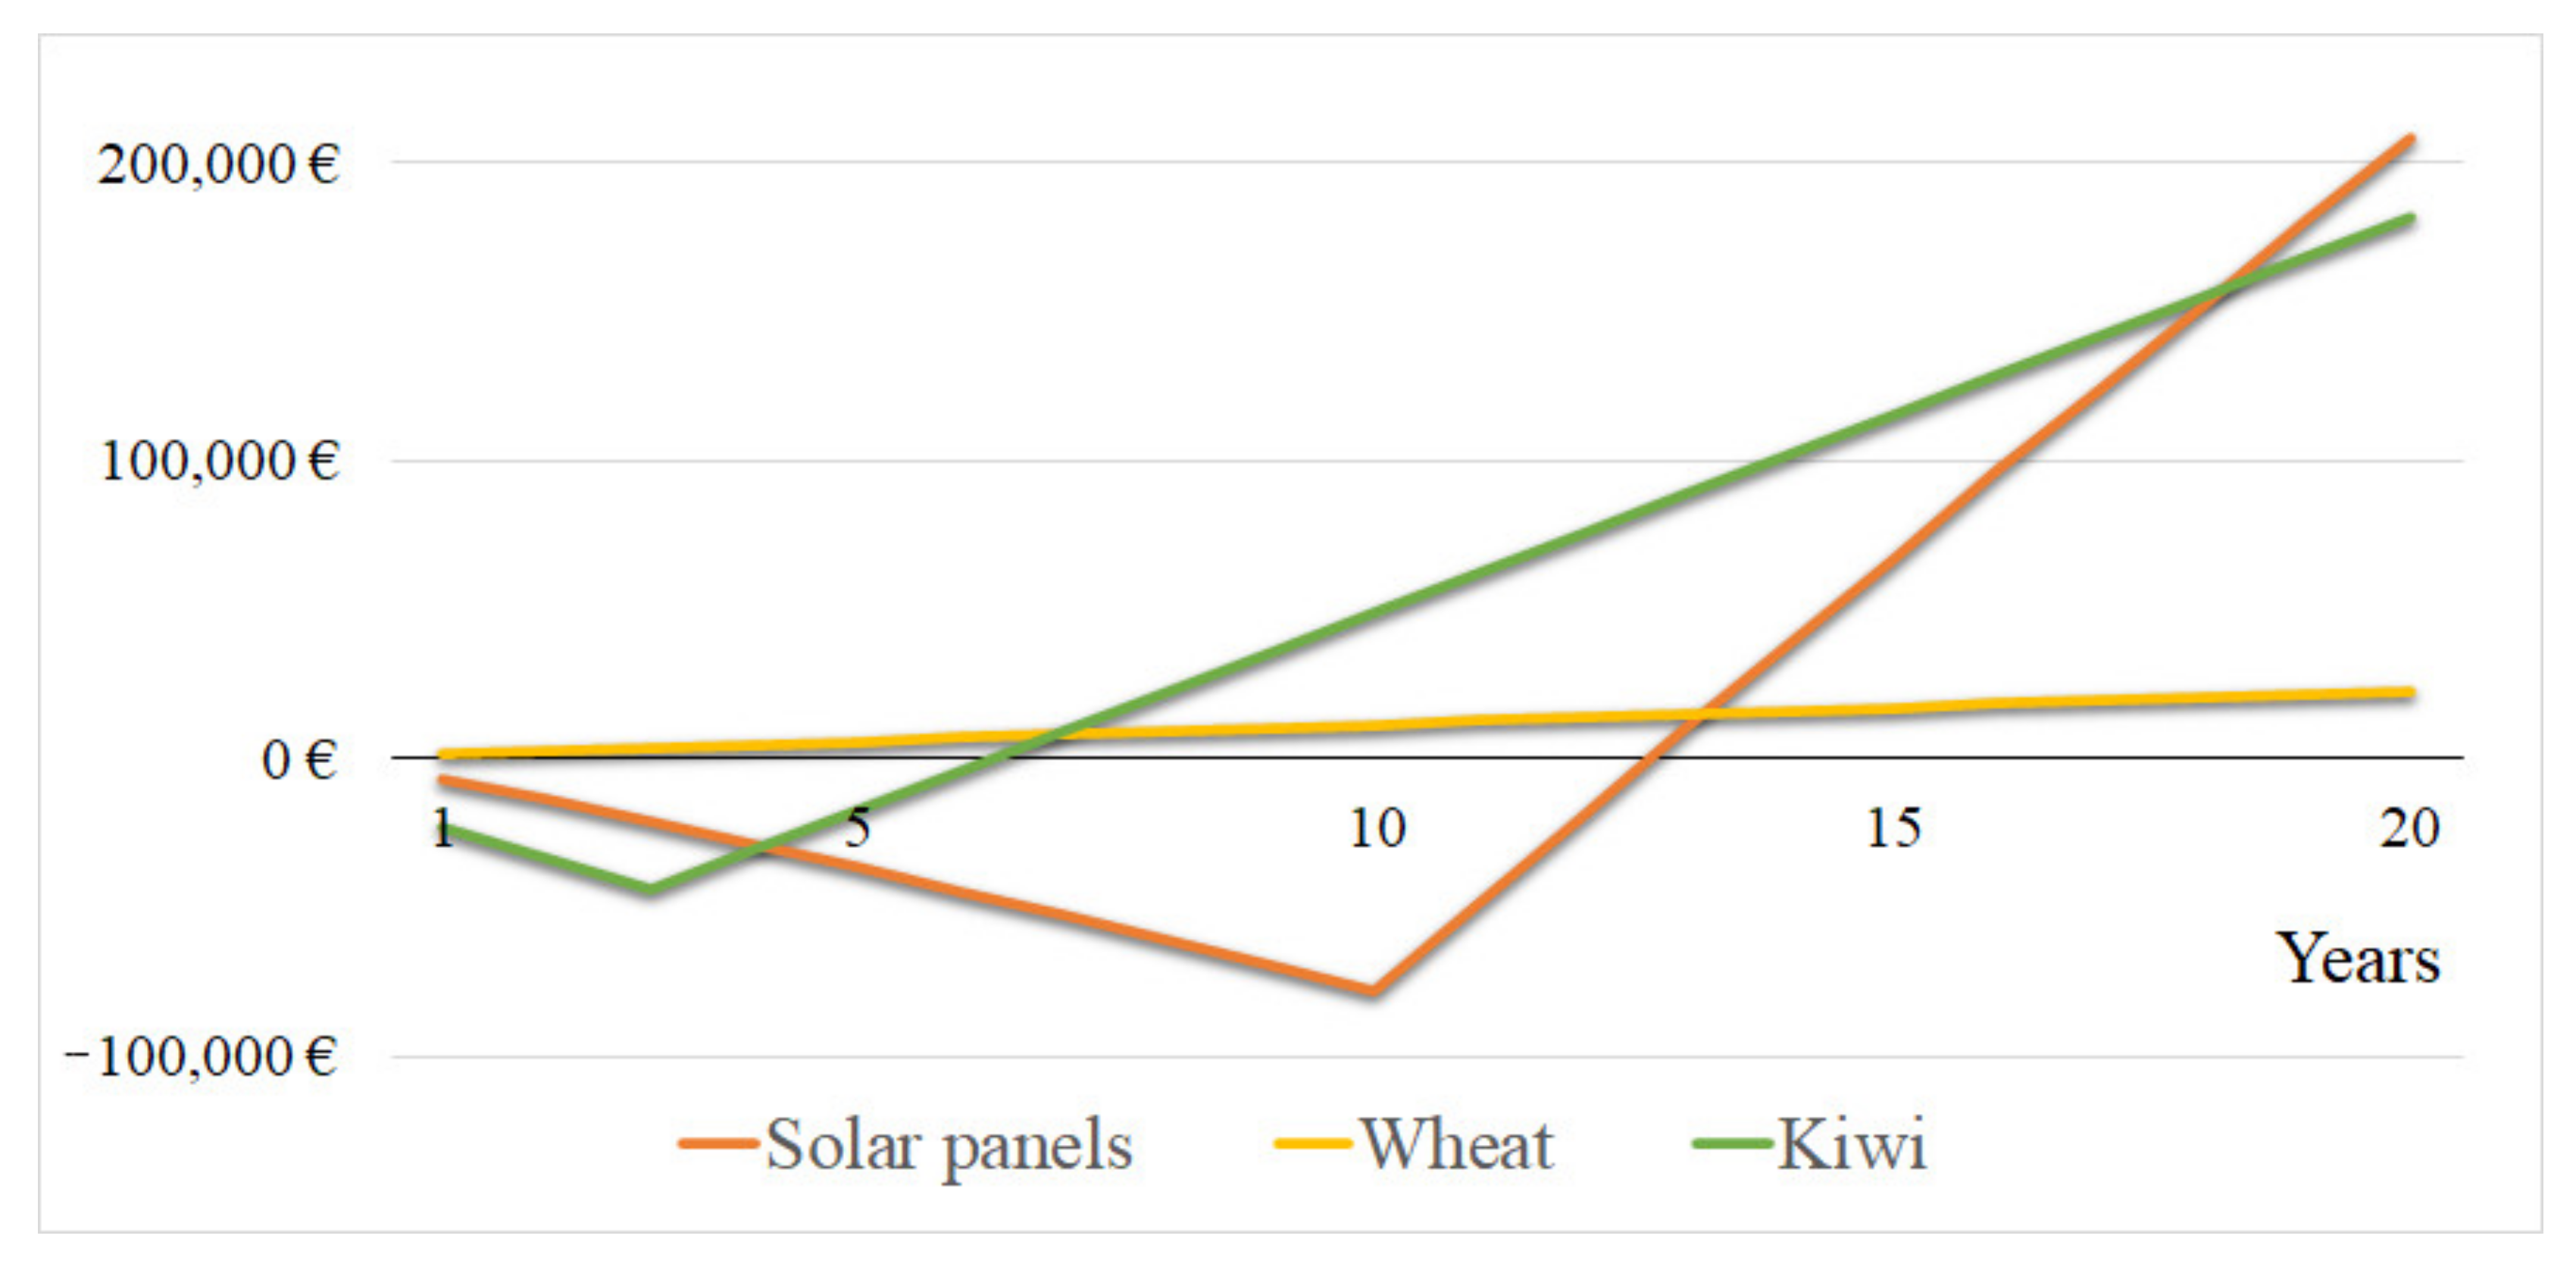
6.2. Quantitative Analysis
- Solar parks, based on recent (2021) prices of electricity produced by PV parks;
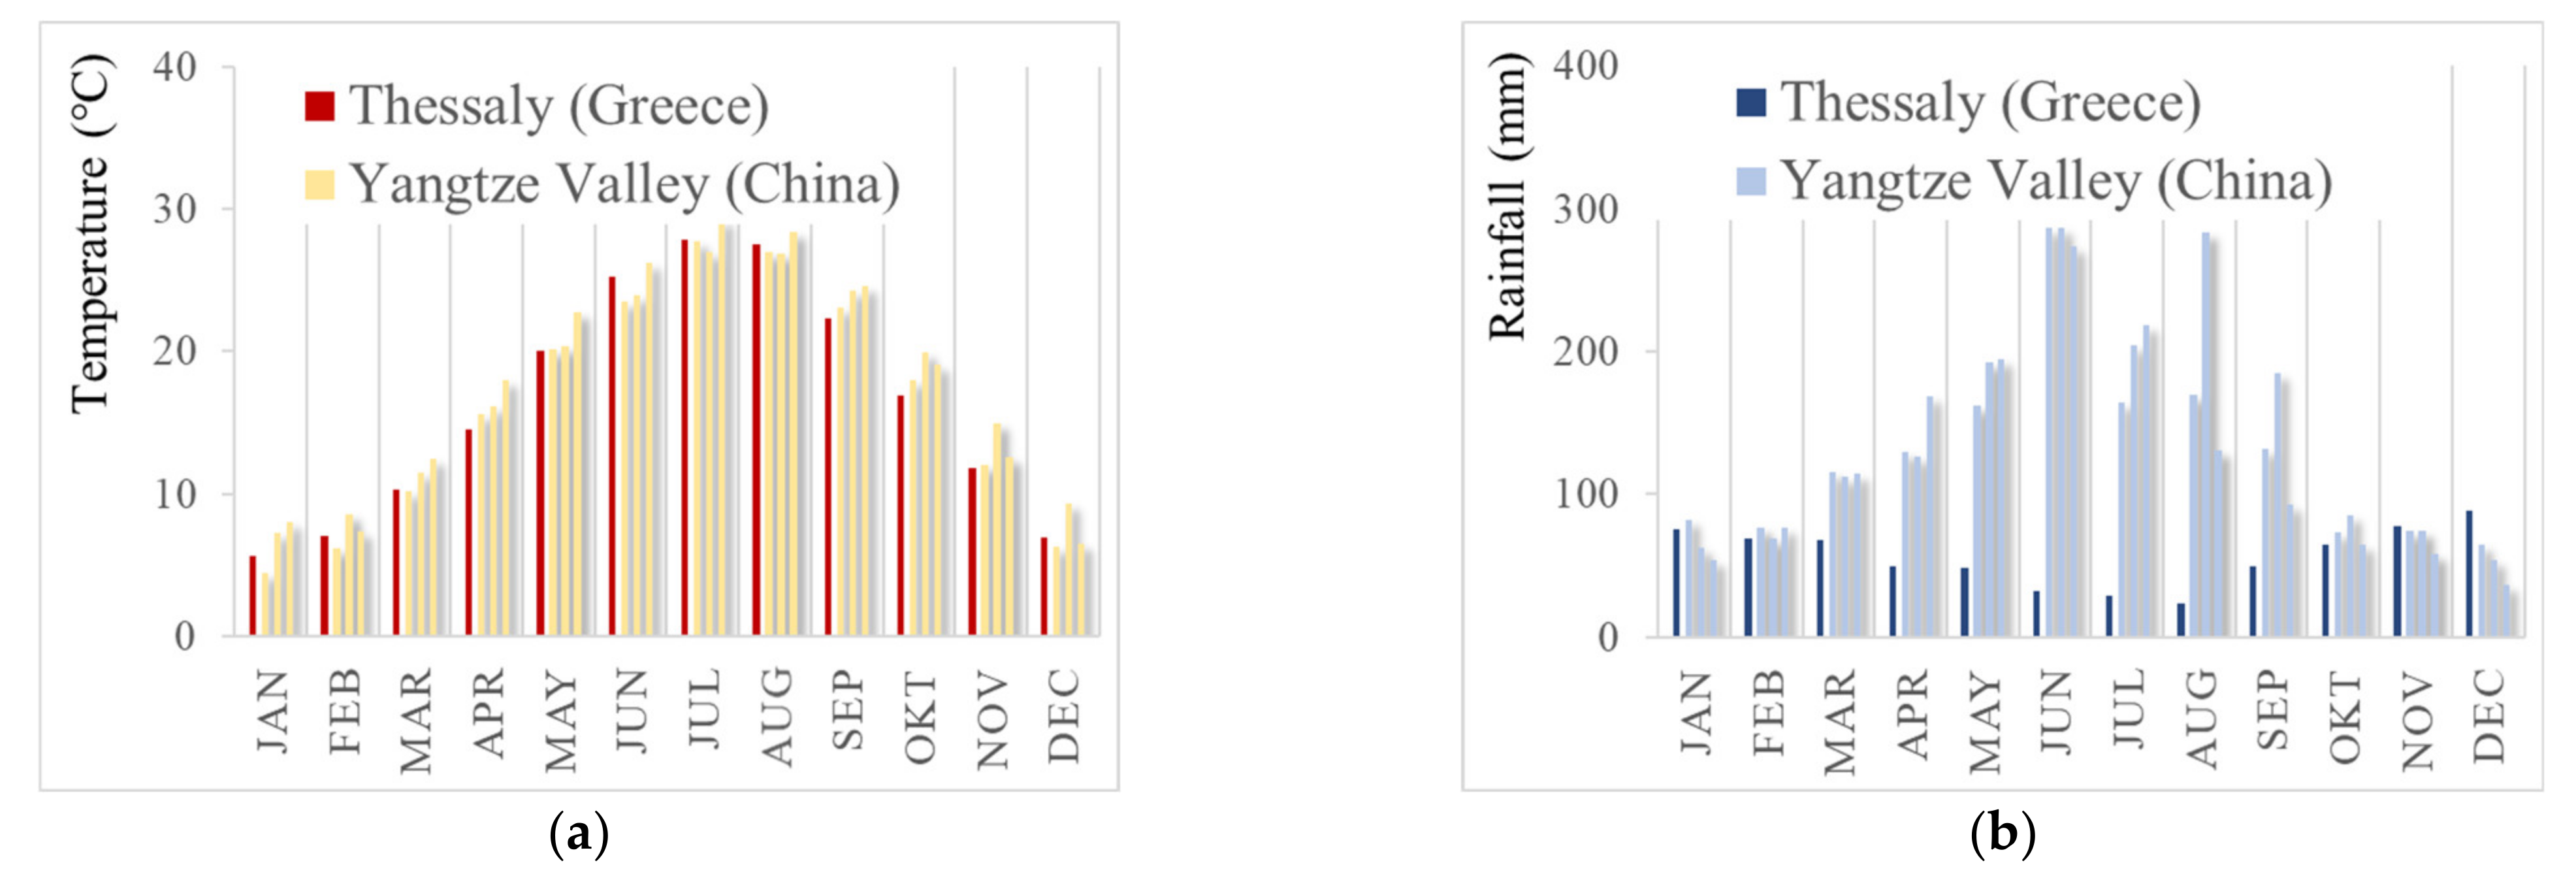
- Financial needs and aspects of the cultivation of kiwifruit in 2021 prices;
- Financial needs and aspects of the cultivation of wheat in 2021 prices.
7. Conclusions
Author Contributions
Funding
Institutional Review Board Statement
Informed Consent Statement
Data Availability Statement
Acknowledgments
Conflicts of Interest
References
- Sargentis, G.-F.; Iliopoulou, T.; Dimitriadis, P.; Mamassis, N.; Koutsoyiannis, D. Stratification: An Entropic View of Society’s Structure. World 2021, 2, 11. [Google Scholar] [CrossRef]
- Pimentel, D.; Pimentel, M. World Population, Food, Natural Resources, and Survival. World Futures 2003, 59, 145–167. [Google Scholar] [CrossRef]
- Gulati, M.; Jacobs, I.; Jooste, A.; Naidoo, D.; Fakir, S. The Water–energy–food Security Nexus: Challenges and Opportunities for Food Security in South Africa. Aquat. Procedia 2013, 1, 150–164. [Google Scholar] [CrossRef]
- Simpson, G.B.; Badenhorst, J.; Jewitt, G.; Berchner, M.; Davies, E. Competition for Land: The Water-Energy-Food Nexus and Coal Mining in Mpumalanga Province, South Africa. Front. Environ. Sci. 2019, 7, 86. [Google Scholar] [CrossRef]
- Yu, L.; Xiao, Y.; Zeng, X.; Li, Y.; Fan, Y. Planning water-energy-food nexus system management under multi-level and uncertainty. J. Clean. Prod. 2020, 251, 119658. [Google Scholar] [CrossRef]
- Del Borghi, A.; Moreschi, L.; Gallo, M. Circular economy approach to reduce water–energy–food nexus. Curr. Opin. Environ. Sci. Health 2020, 13, 23–28. [Google Scholar] [CrossRef]
- Food and Agriculture Organization of United Nations. The Water-Energy-Food Nexus A New Approach in Support of Food Security and Sustainable Agriculture. Rome. 2014. Available online: http://www.fao.org/3/bl496e/bl496e.pdf (accessed on 28 June 2021).
- Rulli, M.C.; Bellomi, D.; Cazzoli, A.; De Carolis, G.; D’Odorico, P. The water-land-food nexus of first-generation biofuels. Sci. Rep. 2016, 6, 22521. [Google Scholar] [CrossRef] [Green Version]
- Magliocca, N.R. Agent-Based Modeling for Integrating Human Behavior into the Food–Energy–Water Nexus. Land 2020, 9, 519. [Google Scholar] [CrossRef]
- Berndes, G.; Cowie, A.L.; Dale, V.H.; Kline, K.L.; Johnson, F.X.; Langeveld, H.; Sharma, N.; Watson, H.; Woods, J. Energy and Land Use; United Nations Convention to Compact Desertification (UNCCD) and International Renewable Energy Agency (IRENA), 2017. Available online: http://iinas.org/tl_files/iinas/downloads/land/IINAS_2017_UNCCD-IRENA_Energy-Land_paper.pdf (accessed on 27 June 2021).
- Food and Agriculture Organization of the United Nations. BIOFUELS: Prospects, Risks and Opportunities; Food and Agriculture Organization of the United Nations: Rome, Italy, 2008; Available online: http://www.fao.org/3/i0100e/i0100e00.htm (accessed on 27 June 2021).
- Popp, J.; Lakner, Z.; Harangi-Rákos, M.; Fári, M. The effect of bioenergy expansion: Food, energy, and environment. Renew. Sustain. Energy Rev. 2014, 32, 559–578. [Google Scholar] [CrossRef] [Green Version]
- Stenzel, F.; Greve, P.; Lucht, W.; Tramberend, S.; Wada, Y.; Gerten, D. Irrigation of biomass plantations may globally increase water stress more than climate change. Nat. Commun. 2021, 12, 1–9. [Google Scholar] [CrossRef] [PubMed]
- Marta, A.D.; Natali, F.; Mancini, M.; Ferrise, R.; Bindi, M.; Orlandini, S. Energy and Water Use Related to the Cultivation of Energy Crops: A Case Study in the Tuscany Region. Ecol. Soc. 2011, 16. [Google Scholar] [CrossRef] [Green Version]
- Teter, J.; Yeh, S.; Khanna, M.; Berndes, G. Water impacts of U.S. biofuels: Insights from an assessment combining economic and biophysical models. PLoS ONE 2018, 13, e0204298. [Google Scholar] [CrossRef]
- OECD. The Land-Water-Energy Nexus; OECD Publishing: Paris, France, 2017. [Google Scholar]
- Hoff, H. Managing the Water-Land-Energy Nexus for Sustainable Development. United Nations Chronicle. Available online: https://www.un.org/en/chronicle/article/managing-water-land-energy-nexus-sustainable-development (accessed on 29 June 2021).
- Spang, E.S.; Moomaw, W.; Gallagher, K.S.; Kirshen, P.; Marks, D.H. The water consumption of energy production: An international comparison. Environ. Res. Lett. 2014, 9, 105002. [Google Scholar] [CrossRef]
- Koutsoyiannis, D. Revisiting the global hydrological cycle: Is it intensifying? Hydrol. Earth Syst. Sci. 2020, 24, 3899–3932. [Google Scholar] [CrossRef]
- Trenberth, K.E.; Fasullo, J.; Kiehl, J. Earth’s Global Energy Budget. Bull. Am. Meteorol. Soc. 2009, 90, 311–324. [Google Scholar] [CrossRef]
- Mamassis, N.; Efstratiadis, A.; Dimitriadis, P.; Iliopoulou, T.; Ioannidis, R.; Koutsoyiannis, D. Water and Energy. In Handbook of Water Resources Management: Discourses, Concepts and Examples; Bogardi, J.J., Tingsanchali, T., Nandalal, K.D.W., Gupta, J., Salamé, L., van Nooijen, R.R.P., Kolechkina, A.G., Kumar, N., Bhaduri, A., Eds.; Springer Nature: Cham, Switzerland, 2021; Chapter 20; pp. 617–655. [Google Scholar] [CrossRef]
- Franck, S.; Von Bloh, W.; Müller, C.; Bondeau, A.; Sakschewski, B. Harvesting the sun: New estimations of the maximum population of planet Earth. Ecol. Model. 2011, 222, 2019–2026. [Google Scholar] [CrossRef]
- Lewis, F.J. Photosynthesis and Related Processes. Nat. Cell Biol. 1945, 156, 487–488. [Google Scholar] [CrossRef]
- Kvenvolden, K.A. Organic geochemistry—A retrospective of its first 70 years. Org. Geochem. 2006, 37, 1–11. [Google Scholar] [CrossRef] [Green Version]
- McMahon, J.E.; Price, S.K. Water and Energy Interactions. Annu. Rev. Environ. Resour. 2011, 36, 163–191. [Google Scholar] [CrossRef] [Green Version]
- IRENA. Renewable Energy in the Water, Energy & Food Nexus. 2015. Available online: https://www.irena.org/-/media/Files/IRENA/Agency/Publication/2015/IRENA_Water_Energy_Food_Nexus_2015.pdf (accessed on 27 June 2021).
- Rehman, S.; Al-Hadhrami, L.M.; Alam, M. Pumped hydro energy storage system: A technological review. Renew. Sustain. Energy Rev. 2015, 44, 586–598. [Google Scholar] [CrossRef]
- Castillo, R.M.; Feng, K.; Hubacek, K.; Sun, L.; Guilhoto, J.; Miralles-Wilhelm, F. Uncovering the Green, Blue, and Grey Water Footprint and Virtual Water of Biofuel Production in Brazil: A Nexus Perspective. Sustainability 2017, 9, 2049. [Google Scholar] [CrossRef] [Green Version]
- Gerbens-Leenes, P.; van Lienden, A.; Hoekstra, A.; van der Meer, T. Biofuel scenarios in a water perspective: The global blue and green water footprint of road transport in 2030. Glob. Environ. Chang. 2012, 22, 764–775. [Google Scholar] [CrossRef] [Green Version]
- Gerbens-Leenes, W.; Hoekstra, A.; van der Meer, T.H. The water footprint of bioenergy. Proc. Natl. Acad. Sci. USA 2009, 106, 10219–10223. [Google Scholar] [CrossRef] [PubMed] [Green Version]
- Water Implications of Biofuels Production in the U.S; Report in Brief; The National Academies, October 2007; Available online: https://www.nap.edu/resource/12039/biofuels_brief_final.pdf (accessed on 27 June 2021).
- Geoff, K.; Jackson, S.; Napoleon, A.; Comings, T.; Ramey, J.A. The Hidden Costs of Electricity: Comparing the Hidden Costs of Power Generation Fuels; Civil Society Institute: Cambridge, UK, 19 September 2009; Available online: https://www.synapse-energy.com/sites/default/files/SynapseReport.2012-09.CSI_.Hidden-Costs.12-013.pdf (accessed on 27 June 2021).
- Yergin, D.; Frei, C. Energy Vision Update 2009. Thirsty Energy: Water and Energy in the 21st Century; World Economic Forum/Cambridge Energy Research Association: Geneva, Switzerland, 2009. [Google Scholar]
- Davis, L. Body Physics: Motion to Metabolism, Open Oregon Educational Resources. EBOOK ISBN 978-1-63635-046-2. Available online: https://openoregon.pressbooks.pub/bodyphysics/ (accessed on 5 April 2021).
- Bryce, E. How Many Calories Can the Brain Burn by Thinking? 9 November 2019. Available online: https://www.livescience.com/burn-calories-brain.html (accessed on 27 June 2021).
- United Nations University; World Health Organization. Human Energy Requirements: Report of a Joint FAO/WHO/UNU Expert Consultation; Food & Agriculture Org: Rome, Italy, October 2001; Volume 1, pp. 17–24. Available online: http://www.fao.org/3/y5686e/y5686e.pdf (accessed on 29 June 2021).
- UNICEF. Water, Sanitation and Hygiene. United Nations International Children’s Emergency Fund (UNICEF). Available online: www.unicef.org/wash (accessed on 27 June 2021).
- World Bank. Water in Agriculture. Available online: https://www.worldbank.org/en/topic/water-in-agriculture (accessed on 27 June 2021).
- Share of Freshwater Withdrawals Used in Industry. Available online: https://ourworldindata.org/water-use-stress (accessed on 27 June 2021).
- Sargentis, G.-F.; Dimitriadis, P.; Ioannidis, R.; Iliopoulou, T.; Frangedaki, E.; Koutsoyiannis, D. Optimal utilization of water resources for local communities in mainland Greece (case study of Karyes, Peloponnese). Procedia Manuf. 2020, 44, 253–260, ISSN 2351-9789. [Google Scholar] [CrossRef]
- Sargentis, G.-F.; Ioannidis, R.; Karakatsanis, G.; Sigourou, S.; Lagaros, N.D.; Koutsoyiannis, D. The Development of the Athens Water Supply System and Inferences for Optimizing the Scale of Water Infrastructures. Sustainability 2019, 11, 2657. [Google Scholar] [CrossRef] [Green Version]
- Hadjibiros, K.; Katsiri, A.; Andreadakis, A.; Koutsoyiannis, D.; Stamou, A.; Christofides, A.; Efstratiadis, A.; Sargentis, G.-F. Multi-criteria reservoir water management. Glob. NEST J. 2005, 7, 386–394. [Google Scholar] [CrossRef] [Green Version]
- Alcamo, J.; Döll, P.; Henrichs, T.; Kaspar, F.; Lehner, B.; Rösch, T.; Siebert, S. Development and testing of the WaterGAP 2 global model of water use and availability. Hydrol. Sci. J. 2003, 48, 317–337. [Google Scholar] [CrossRef]
- Aus der Beek, T.; Flörke, M.; Lapola, D.M.; Schaldach, R.; Voß, F.; Teichert, E. Modelling historical and current irrigation water demand on the continental scale: Europe. Adv. Geosci. 2010, 27, 79–85. [Google Scholar] [CrossRef] [Green Version]
- United Nations. 2019 Revision of World Population Prospects. Available online: https://population.un.org/wpp/ (accessed on 27 June 2021).
- Global Population. Available online: https://clio-infra.eu/Indicators/TotalPopulation.html (accessed on 27 June 2021).
- Life Expectancy. Available online: https://ourworldindata.org/life-expectancy (accessed on 5 October 2020).
- UNU. World Income Inequality Database—WIID. Available online: https://www.wider.unu.edu/database/wiidhttps://www.wider.unu.edu/database/wiid (accessed on 27 June 2021).
- Ostwald, W. Energetische Grundlagen der Kulturwissenschaft; Klinkhardt: Germany, Leipzig, 1909. [Google Scholar]
- Hoff, H. Understanding the Nexus. Background Paper for the Bonn 2011 Nexus Conference: The Water, Energy and Food Security; Nexus: Bonn, Germany. 2011; Available online: https://www.sei.org/publications/understanding-the-nexus/ (accessed on 27 June 2021).
- BP. Statistical Review of World Energy. Available online: https://www.bp.com/en/global/corporate/energy-economics/statistical-review-of-world-energy.html (accessed on 27 June 2021).
- Maddison Project Database 2018. Available online: https://www.rug.nl/ggdc/historicaldevelopment/maddison/releases/maddison-project-database-2018 (accessed on 27 June 2021).
- Gustavsson, J.; Cederberg, C.; Sonesson, U.; Van Otterdijk, R.; Meybeck, A. Global Food Losses and Food Waste; Food and Agriculture Organization of the United Nations: Düsseldorf, Germany, 2011. [Google Scholar]
- Prosekov, A.Y.; Ivanova, S.A. Food security: The challenge of the present. Geoforum 2018, 91, 73–77. [Google Scholar] [CrossRef]
- FAO; IFAD; UNICEF; WFP; WHO. The State of Food Security and Nutrition in the World 2020. Transforming Food Systems for Affordable Healthy Diets; FAO: Rome, Italy, 2020. [Google Scholar] [CrossRef]
- Mercy Corps. The Facts: What You Need to Know about Global Hunger. Available online: https://www.mercycorps.org/blog/quick-facts-global-hunger (accessed on 27 June 2021).
- FAOSTAT. United Nations Food and Agricultural Organization (FAO). Available online: http://www.fao.org/faostat/en/#data/FBS (accessed on 27 June 2021).
- Bank of England. Home Statistics Research Datasets. Available online: https://0-www-bankofengland-co-uk.brum.beds.ac.uk/statistics/research-datasets (accessed on 27 June 2021).
- Koutsoyiannis, D.; Makropoulos, C.; Langousis, A.; Baki, S.; Efstratiadis, A.; Christofides, A.; Karavokiros, G.; Mamassis, N. Climate, hydrology, energy, water: Recognizing uncertainty and seeking sustainability. Hydrol. Earth Syst. Sci. 2009, 13, 247–257. [Google Scholar] [CrossRef] [Green Version]
- Simpson, G.B.; Graham, J. The Development of the Water-Energy-Food Nexus as a Framework for Achieving Resource Security: A Review. Front. Environ. Sci. V. 2019, 7, 8. [Google Scholar] [CrossRef] [Green Version]
- WEF (World Economic Forum). Global Risks 2011, Sixth Edition: An Initiative of the Risk Response Network. 2011. Available online: http://reports.weforum.org/global-risks-2011/ (accessed on 27 June 2021).
- The Water, Energy & Food Security Resource Platform. Available online: https://www.water-energy-food.org/ (accessed on 27 June 2021).
- Yang, J.; Yamazaki, A. Water and energy nexus: A literature review. Water West Stanf. Univ 2013, 1, 146. Available online: https://waterinthewest.stanford.edu/sites/default/files/Water-Energy_Lit_Review_0.pdf (accessed on 27 June 2021).
- WEF Nexus Index. Available online: https://wefnexusindex.org/ (accessed on 27 June 2021).
- Albrecht, T.R.; Crootof, A.; Scott, C. The Water-Energy-Food Nexus: A systematic review of methods for nexus assessment. Enviromental Res. Lett. 2018, 13, 4. [Google Scholar] [CrossRef]
- Sargentis, G.-F.; Iliopoulou, T.; Sigourou, S.; Dimitriadis, P.; Koutsoyiannis, D. Evolution of Clustering Quantified by a Stochastic Method—Case Studies on Natural and Human Social Structures. Sustainability 2020, 12, 7972. [Google Scholar] [CrossRef]
- Chatzimpiros, P.; Lagos, G.; Sargentis, G.-F. Man and City. Myth and Vision. In Proceedings of the 10th International Conference on Environmental Science and Technology, Kos Island, Greece, 5–7 September 2007; Department of Environmental Studies, University of the Aegean. [Google Scholar] [CrossRef]
- WEF Background. Available online: www.water-energy-food.org/mission (accessed on 27 June 2021).
- IRENA. Global Energy Transformation: A Roadmap to 2050. 2019. Available online: https://www.irena.org/publications/2019/Apr/Global-energy-transformation-A-roadmap-to-2050-2019Edition (accessed on 27 June 2021).
- Michael, D.; Sockol, D.; Raichlen, A.; Herman, P. Chimpanzee locomotor energetics and the origin of human bipedalism. Proc. Natl. Acad. Sci. USA 2007, 104, 12265–12269. [Google Scholar] [CrossRef] [Green Version]
- Boyer, D.M.; Harrington, A.R. Scaling of bony canals for encephalic vessels in euarchontans: Implications for the role of the vertebral artery and brain metabolism. J. Hum. Evol. 2018, 114, 85–101, ISSN 0047-2484. [Google Scholar] [CrossRef] [PubMed]
- Manta, E.; Ioannidis, R.; Sargentis, G.-F.; Efstratiadis, A. Aesthetic evaluation of wind turbines in stochastic setting: Case study of Tinos island, Greece. In Proceedings of the European Geosciences Union General Assembly 2020, Online. 4–8 May 2020; European Geosciences Union Geophysical Research Abstracts. ; Volume 22. EGU2020-5484. [Google Scholar] [CrossRef]
- Ioannidis, R.; Dimitriadis, P.; Meletopoulos, I.T.; Sargentis, G.-F.; Koutsoyiannis, D. Investigating the spatial characteristics of GIS visibility analyses and their correlation to visual impact perception with stochastic tools. In Proceedings of the European Geosciences Union General Assembly, Online. 4–8 May 2020; European Geosciences Union Geophysical Research Abstracts. ; Volume 22. EGU2020-18212. [Google Scholar] [CrossRef]
- Ioannidis, R.; Dimitriadis, P.; Sargentis, G.-F.; Frangedaki, E.; Iliopoulou, T.; Koutsoyiannis, D. Stochastic similarities between hydrometeorogical and art processes for optimizing architecture and landscape aesthetic parameters. In Proceedings of the European Geosciences Union General Assembly 2019, Vienna, Austria, 7–12 April 2019; European Geosciences Union Geophysical Research Abstracts. , 2019; Volume 21. EGU2019-11403. Available online: https://www.itia.ntua.gr/en/docinfo/1946/ (accessed on 27 June 2021).
- Ioannidis, R.; Koutsoyiannis, D. A review of land use, visibility and public perception of renewable energy in the context of landscape impact. Appl. Energy 2020, 276, 115367. [Google Scholar] [CrossRef]
- IRENA. Renewable Capacity Statistics 2021; International Renewable Energy Agency (IRENA): Abu Dhabi, United Arab Emirates, 2021; ISBN 978-92-9260-342-7. [Google Scholar]
- Mamassis, N.; Efstratiadis, A.; Apostolidou, E. Topography-adjusted solar radiation indices and their importance in hydrology. Hydrol. Sci. J. 2012, 57, 756–775. [Google Scholar] [CrossRef]
- Adeh, E.H.; Good, S.P.; Calaf, M.; Higgins, C.W. Solar PV Power Potential is Greatest Over Croplands. Sci. Rep. 2019, 9. [Google Scholar] [CrossRef] [PubMed]
- Späth, L. Large-scale photovoltaics? Yes please, but not like this! Insights on different perspectives underlying the trade-off between land use and renewable electricity development. Energy Policy 2018, 122, 429–437. [Google Scholar] [CrossRef]
- Guerin, T.F. Impacts and opportunities from large-scale solar photovoltaic (PV) electricity generation on agricultural production. Environ. Qual. Manag. 2019. [Google Scholar] [CrossRef]
- Dias, L.; Gouveia, J.P.; Lourenço, P.; Seixas, J. Interplay between the potential of photovoltaic systems and agricultural land use. Land Use Policy 2019, 81, 725–735. [Google Scholar] [CrossRef]
- Nonhebel, S. Renewable energy and food supply: Will there be enough land? Renew. Sustain. Energy Rev. 2005, 9, 191–201. [Google Scholar] [CrossRef]
- Sacchelli, S.; Garegnani, G.; Geri, F.; Grilli, G.; Paletto, A.; Zambelli, P.; Ciolli, M.; Vettorato, D. Trade-off between photovoltaic systems installation and agricultural practices on arable lands: An environmental and socio-economic impact analysis for Italy. Land Use Policy 2016, 56, 90–99. [Google Scholar] [CrossRef] [Green Version]
- Sargentis, G.-F.; Dimitriadis, P.; Ioannidis, R.; Iliopoulou, T.; Koutsoyiannis, D. Stochastic Evaluation of Landscapes Transformed by Renewable Energy Installations and Civil Works. Energies 2019, 12, 2817. [Google Scholar] [CrossRef] [Green Version]
- Sargentis, G.-F.; Ioannidis, R.; Chiotinis, M.; Dimitriadis, P.G.; Koutsoyiannis, D. Aesthetical Issues with Stochastic Evaluation. In Data Analytics for Cultural Heritage; Belhi, A., Bouras, A., Al-Ali, A.K., Sadka, A.H., Eds.; Springer Science and Business Media LLC: New York, NY, USA, 2021; pp. 173–193. [Google Scholar]
- Delfanti, L.; Colantoni, A.; Recanatesi, F.; Bencardino, M.; Sateriano, A.; Zambon, I.; Salvati, L. Solar plants, environmental degradation and local socioeconomic contexts: A case study in a Mediterranean country. Environ. Impact Assess. Rev. 2016, 61, 88–93. [Google Scholar] [CrossRef]
- Dinesh, H.; Pearce, J.M. The potential of agrivoltaic systems. Renew. Sustain. Energy Rev. 2016, 54, 299–308. [Google Scholar] [CrossRef] [Green Version]
- Dupraz, C.; Marrou, H.; Talbot, G.; Dufour, L.; Nogier, A.; Ferard, Y. Combining solar photovoltaic panels and food crops for optimising land use: Towards new agrivoltaic schemes. Renew. Energy 2011, 36, 2725–2732. [Google Scholar] [CrossRef]
- Pascaris, A.S.; Schelly, C.; Burnham, L.; Pearce, J.M. Integrating solar energy with agriculture: Industry perspectives on the market, community, and socio-political dimensions of agrivoltaics. Energy Res. Soc. Sci. 2021, 75, 102023. [Google Scholar] [CrossRef]
- Weselek, A.; Ehmann, A.; Zikeli, S.; Lewandowski, I.; Schindele, S.; Högy, P. Agrophotovoltaic systems: Applications, challenges, and opportunities. A review. Agron. Sustain. Dev. 2019, 39, 35. [Google Scholar] [CrossRef]
- Hellenic Statistical Authority, Agriculture and Livestock. Available online: https://www.statistics.gr/el/statistics/agr/- (accessed on 27 June 2021).
- Thessaly. Περιφέρεια Θεσσαλίας. Available online: http://www.gaiapedia.gr/ (accessed on 27 June 2021).
- Hellenic Ministry of Environment and Energy. Geospatial Data, Διαδικτυακή Πύλη Γεωχωρικών Πληροφοριών Υπουργείου Περιβάλλοντος και Ενέργειας (ΥΠΕΝ). Available online: http://mapsportal.ypen.gr/maps/?limit=20&offset=0 (accessed on 27 June 2021).
- Koutsogiannis, D.; Andreadakis, A.; Mavrodimou, R.; Christofidis, A.; Mamasis, N.; Efstratiadis, A.; Koukouvinos, A.; Karavokyros, G.; Kozanis, S.; Mamais, D.; et al. National Management and Protection Program of Water Resources, Support for the Preparation of National Program for Management and Protection of Water Resources; Department of Water Resources and Environment—National Technical University of Athens: Athens, Greece, 2008; 748p. [Google Scholar] [CrossRef]
- Surface Water and Grandwater Sources in Thessaly. Επιφανειακά και Υπόγεια Υδατικά Συστηματα, Υδάτινοι Πόροι και Περιβάλλον Θεσσαλίας (ΥΠΕΘΕ). 1η Aναθεώρηση ΣΔΛAΠ, ΥΔ Θεσσαλίας (EL08). Available online: http://wfdver.ypeka.gr/wp-content/uploads/2017/12/EL08_SDLAP_APPROVED.pdf (accessed on 27 June 2021).
- Smith, A. Ancient and Traditional Agriculture, Pastoralism, and Agricultural Societies in Sub-Saharan Africa. Oxf. Res. Encycl. Environ. Sci. 2019. [Google Scholar] [CrossRef]
- Jiang, Y.; Zhang, Q.; Niu, J.; Wu, J. Pastoral Population Growth and Land Use Policy Has Significantly Impacted Livestock Structure in Inner Mongolia—A Case Study in the Xilinhot Region. Sustainability 2019, 11, 7208. [Google Scholar] [CrossRef] [Green Version]
- Davis, J.; Hatfield, R. The economics of mobile pastoralism: A global summary. Nomadic Peoples 2007, 11, 91–116. Available online: www.jstor.org/stable/43123794 (accessed on 12 December 2020). [CrossRef]
- Coughenour, M.B.; Ellis, J.E.; Swift, D.M.; Coppock, D.L.; Galvin, K.; McCabe, J.T.; Hart, T.C. Energy extraction and use in a nomadic pastoral ecosystem. Science 1985, 230, 619–625. [Google Scholar] [CrossRef]
- Smil, V. Conversion of Energy: People and Animals. In Encyclopedia of Energy; Cutler, J., Ed.; Elsevier: Amsterdam, The Netherlands, 2004; pp. 697–705. ISBN 9780121764807. [Google Scholar] [CrossRef]
- Smil, V. World History and Energy. In Encyclopedia of Energy; Cutler, J., Ed.; Elsevier: Amsterdam, The Netherlands, 2004; pp. 549–561. ISBN 9780121764807. [Google Scholar] [CrossRef]
- Singh, H.; Mishra, D.; Nahar, N.M. Energy use pattern in production agriculture of a typical village in arid zone, India. Energy Convers. Manag. 2002, 43, 2275–2286, ISSN 0196-8904. [Google Scholar] [CrossRef]
- Canakci, M.; Topakci, M.; Akinci, I.; Ozmerzi, A. Energy use pattern of some field crops and vegetable production: Case study for Antalya Region, Turkey. Energy Convers. Manag. 2005, 46, 655–666, ISSN 0196-8904. [Google Scholar] [CrossRef]
- Kander, A.; Warde, P. Energy Availability from Livestock and Agricultural Productivity in Europe, 1815–1913: A New Comparison. Econ. Hist. Rev. 2011, 64, 1–29. Available online: http://0-www-jstor-org.brum.beds.ac.uk/stable/27919479 (accessed on 27 June 2021). [CrossRef]
- Schnepf, R. Energy Use in Agriculture: Background and Issues, CRS Report for Congress, Received through the CRS Web. 2004. Available online: https://nationalaglawcenter.org/wp-content/uploads/assets/crs/RL32677.pdf (accessed on 27 June 2021).
- Vreni, J.-R.; Crump, L.; Abicho, A.A.; Abakar, A.A.; Mahamat, A., II; Bechir, M.; Eckert, S.; Engesser, M.; Schelling, E.; Zinsstag, J. Estimating population and livestock density of mobile pastoralists and sedentary settlements in the south-eastern Lake Chad area. Geospat. Health 2015, 10. [Google Scholar] [CrossRef] [Green Version]
- Energy for Agriculture. Available online: http://www.fao.org/3/X8054E/x8054e05.htm (accessed on 27 June 2021).
- Greece: Energy Country Profile. Available online: https://ourworldindata.org/energy/country/greece (accessed on 27 June 2021).
- Greek Low 2773/1999, (ΦΕΚ 286/A/22-12-1999). Available online: https://ypen.gov.gr/wp-content/uploads/2020/11/%CE%A6%CE%95%CE%9A-%CE%91_286_1999.pdf (accessed on 27 June 2021).
- Directive 96/92/EC of the European Parliament and of the Council of 19 December 1996. Available online: https://eur-lex.europa.eu/legal-content/EN/TXT/?uri=CELEX%3A31996L0092 (accessed on 27 June 2021).
- Laboratory of Atmospheric Physics of the University of Patras. Climatological Maps of Sollar Energy in Greece, Greek Network of Solar Energy, Ελληνικό Δίκτυο Hλιακής Ενέργειας, 2002–2012. Available online: https://www.atmosphere-upatras.gr/solarmaps/Thessaly (accessed on 27 June 2021).
- Regulatory Authority for Energy (RAE). Geobase Map, ΡAΕ, Ρυθμιστική Aρχή Ενέργειας, Γεωπληροφοριακός Χάρτης. Available online: https://geo.rae.gr/ (accessed on 27 June 2021).
- Greek low 4643/2019 (ΦΕΚ 193/A/3-12-2019). Available online: http://www.et.gr/idocs-nph/search/pdfViewerForm.html?args=5C7QrtC22wFqnM3eAbJzrXdtvSoClrL8u_IHzLbdDJF5MXD0LzQTLWPU9yLzB8V68knBzLCmTXKaO6fpVZ6Lx3UnKl3nP8NxdnJ5r9cmWyJWelDvWS_18kAEhATUkJb0x1LIdQ163nV9K--td6SIuVAzU4FN1TikRlIo27KU01ITu702tbfrwe9cmHeaq6vE (accessed on 27 June 2021).
- Global Solar Atlas. Available online: https://globalsolaratlas.info/map?c=39.461644,22.142944,9&s=39.374867,22.355804&m=site (accessed on 27 June 2021).
- Siamparina, P. Water-Food-Energy Nexus and the Comperative Relasionship of Solar Panels with Agriculutre. Case Study Thessaly. (Το πλέγμα νερού-τροφίμων-ενέργειας και η ανταγωνιστική σχέση των φωτοβολταϊκών συστημάτων με την αγροτική παραγωγή: H περίπτωση της Θεσσαλίας). Diploma Thesis, School of Civil Engineering, National Technical University of Athens, Athens, Greece, 2021. Available online: https://www.itia.ntua.gr/el/docinfo/2128/ (accessed on 27 June 2021).
- Morton, J. Fruints of Warm Climates; Florida Flair Books: Miami, FL, USA, 1987. [Google Scholar]
- Holzapfel, E.A.; Merino, R.; Marinno, M.A.; Matta, R. Water production functions in kiwi. Irrig. Sci. 2000, 19, 73–79. Available online: https://0-link-springer-com.brum.beds.ac.uk/article/10.1007/s002710050003 (accessed on 27 June 2021). [CrossRef]
- Cultivation of kiwifruit in Greece. Available online: Shorturl.at/doA23 (accessed on 27 June 2021).
- Climate Data for Cities Worldwide. Available online: https://climate-data.org (accessed on 27 June 2021).
- Visser, C.D.; Buisonjé, F.; Ellen, H.; Stanghellini, C.; Voort, M.V. State of the Art on Energy Efficiency in Agriculture, Country Data on Energy Consumption in Different Agroproduction Sectors in the European Countries. 2012. Available online: https://www.semanticscholar.org/paper/State-of-the-Art-on-Energy-Efficiency-in-Country-on-Visser-Buisonj%C3%A9/72f757a4a816fca1bbad065ddb67ff91eac53531 (accessed on 27 June 2021).
- Gemptos, F. The Irrigation of Wheat. Το πότισμα του σκληρού σιταριού: Πόσο αποδίδει η άρδευση. 26 March 2019. Available online: https://www.eleftheria.gr/αγροτικά/item/226438-το-πότισμα-του-σκληρού-σιταριού-πόσο-αποδίδει-η-άρδευση.html (accessed on 27 June 2021).
- Mohammadi, A.; Rafiee, S.; Mohtasebi, S.S.; Rafiee, H. Energy inputs—Yield relationship and cost analysis of kiwifruit production in Iran. Renew. Energy 2010, 35, 1071–1075, ISSN 0960-1481. [Google Scholar] [CrossRef]
- Piasecka, I.; Bałdowska-Witos, P.; Piotrowska, K.; Tomporowski, A. Eco-Energetical Life Cycle Assessment of Materials and Components of Photovoltaic Power Plant. Energies 2020, 13, 1385. [Google Scholar] [CrossRef] [Green Version]
- Calories 24. Wheat. Available online: https://calories24.com/int/calories-in/wheat (accessed on 27 June 2021).
- Calories 24. Kiwifruit. Available online: https://calories24.com/int/calories-in/kiwifruit (accessed on 27 June 2021).


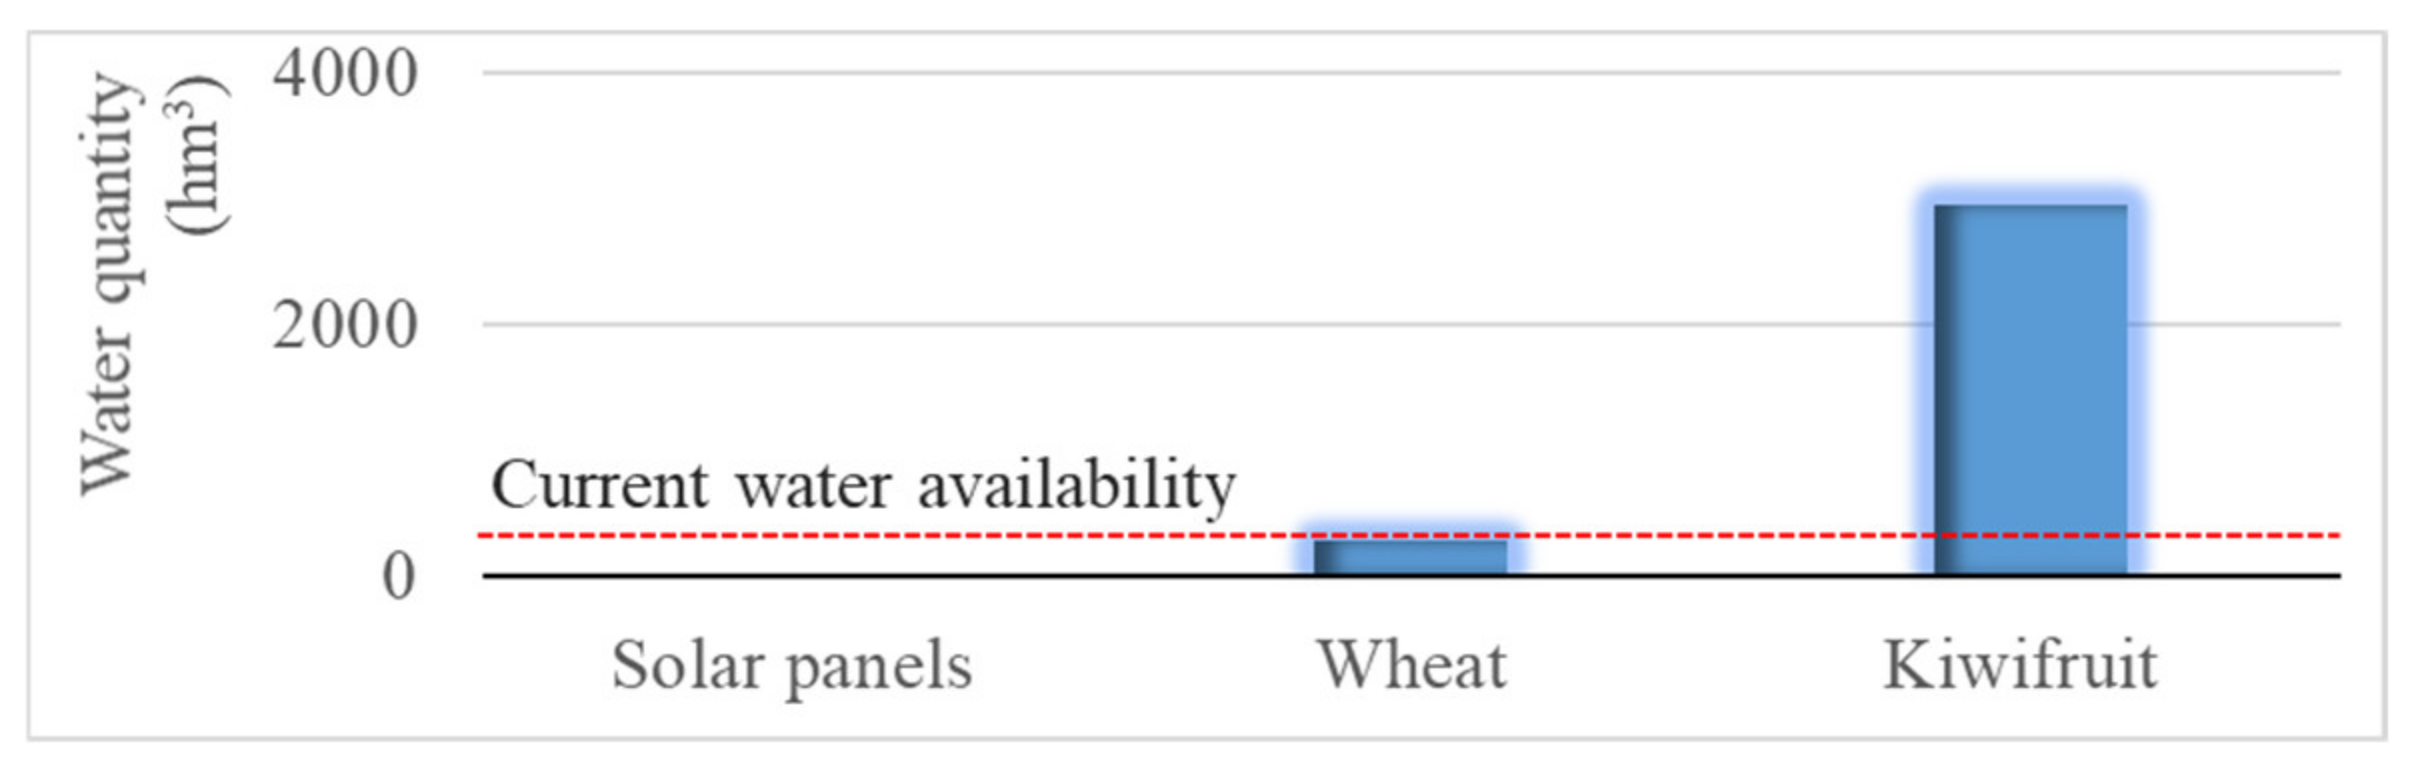
| Type of Consumption | Water Quantity (hm3) |
|---|---|
| Irrigation (2013) | 1306 |
| Municipal water | 94 |
| Livestock | 13 |
| Industry | 9 |
| Total | 1422 |
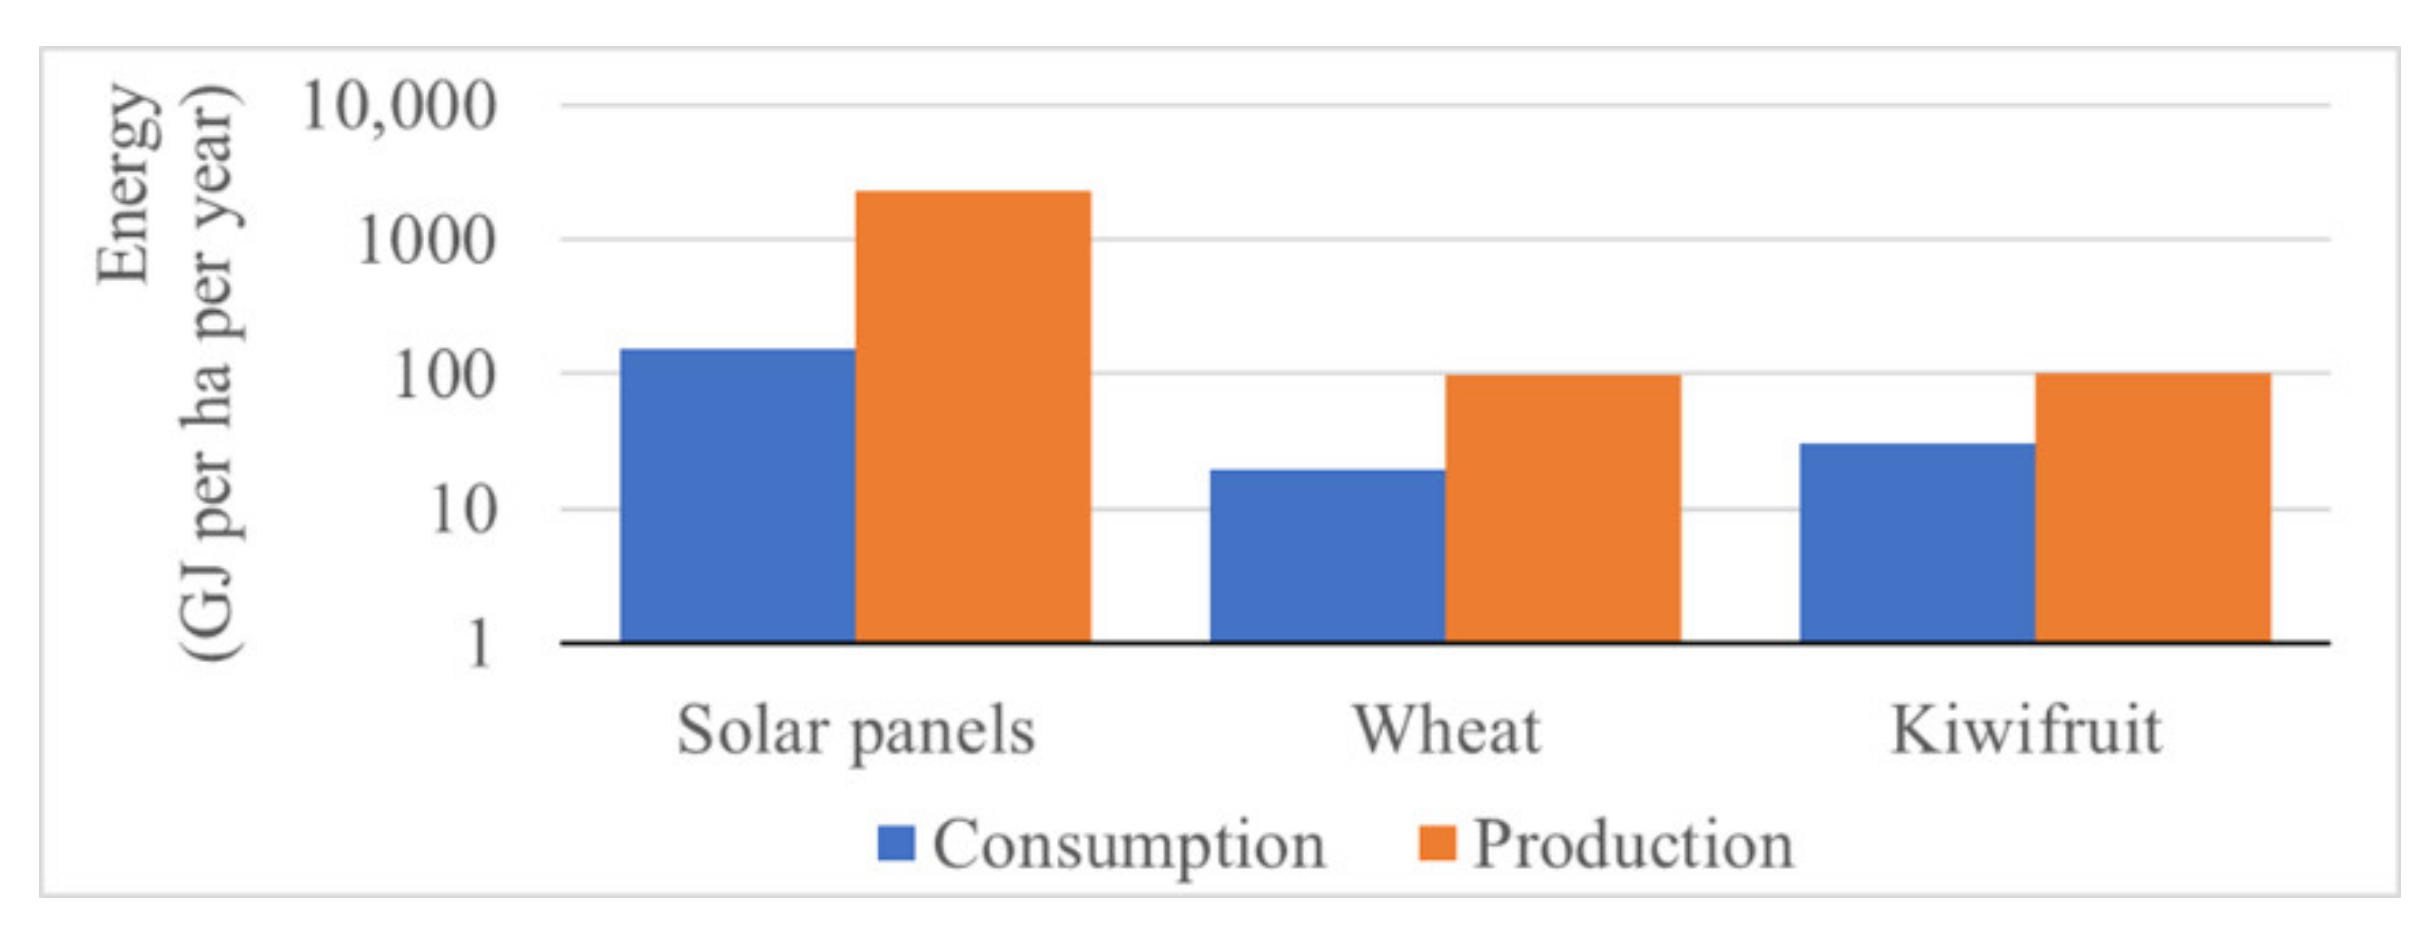
| Consumption | Production | Conversion of Annual Needs | ||
|---|---|---|---|---|
| PV panels | Energy | 151 GJ * | 2255 GJ | energy needs of 19 people; average in Greece |
| Water | ** | |||
| Food | ||||
| Wheat | Energy | 19.5 GJ [120] | 55.4–97 GJ *** | 10–19 (people; food) |
| Water | 0–1500 m3 [121] | |||
| Food | 4–7 t | |||
| Kiwifruit | Energy | 30.5 GJ [122] | 100.48 MJ **** | 20 (people; food) |
| Water | 7000–8000 m3 [118] | |||
| Food | - | 40 t |
Publisher’s Note: MDPI stays neutral with regard to jurisdictional claims in published maps and institutional affiliations. |
© 2021 by the authors. Licensee MDPI, Basel, Switzerland. This article is an open access article distributed under the terms and conditions of the Creative Commons Attribution (CC BY) license (https://creativecommons.org/licenses/by/4.0/).
Share and Cite
Sargentis, G.-F.; Siamparina, P.; Sakki, G.-K.; Efstratiadis, A.; Chiotinis, M.; Koutsoyiannis, D. Agricultural Land or Photovoltaic Parks? The Water–Energy–Food Nexus and Land Development Perspectives in the Thessaly Plain, Greece. Sustainability 2021, 13, 8935. https://0-doi-org.brum.beds.ac.uk/10.3390/su13168935
Sargentis G-F, Siamparina P, Sakki G-K, Efstratiadis A, Chiotinis M, Koutsoyiannis D. Agricultural Land or Photovoltaic Parks? The Water–Energy–Food Nexus and Land Development Perspectives in the Thessaly Plain, Greece. Sustainability. 2021; 13(16):8935. https://0-doi-org.brum.beds.ac.uk/10.3390/su13168935
Chicago/Turabian StyleSargentis, G.-Fivos, Paraskevi Siamparina, Georgia-Konstantina Sakki, Andreas Efstratiadis, Michalis Chiotinis, and Demetris Koutsoyiannis. 2021. "Agricultural Land or Photovoltaic Parks? The Water–Energy–Food Nexus and Land Development Perspectives in the Thessaly Plain, Greece" Sustainability 13, no. 16: 8935. https://0-doi-org.brum.beds.ac.uk/10.3390/su13168935