Article

Agricultural Management Practices and Decision-Making in View of Soil Organic Matter in the Urbanizing Region of Bangalore

by
Virna Estefania Moran-Rodas
1,2,*,
Verena Preusse
3 and
Christine Wachendorf
1
1
Soil Biology and Plant Nutrition, University of Kassel, Nordbahnhofstr. 1a, 37213 Witzenhausen, Germany
2
Department of Crop Sciences, Division of Agricultural Entomology, University of Goettingen, Grisebachstraße 6, 37077 Goettingen, Germany
3
Department of Agricultural Economics and Rural Development, University of Goettingen, Platz der Goettinger Sieben 5, 37073 Goettingen, Germany
*
Author to whom correspondence should be addressed.
Sustainability 2022, 14(10), 5775; https://0-doi-org.brum.beds.ac.uk/10.3390/su14105775
Submission received: 24 March 2022 / Revised: 29 April 2022 / Accepted: 4 May 2022 / Published: 10 May 2022

Abstract

:
Rapid urbanization and agricultural intensification are currently impacting the soils of many tropical countries. Bangalore is a growing megacity experiencing both issues and their derived ecological and socio-economic effects. This paper seeks to understand how the socio-economic effects of urbanization are affecting soil organic carbon (SOC) in Bangalore’s rural–urban interface. We first compiled information on how management practices affect SOC dynamics and specifically evaluated the effects of fertilization practices on SOC levels in major cropping systems. We then used interview data from farmers’ households across an urbanity gradient in Bangalore to test the association between urbanization as well as related socio-economic drivers and farming practices. We found that fertilization increases SOC concentrations, especially when mineral fertilizer is combined with additional farmyard manure. Single mineral fertilizer and a combination of mineral fertilizer and farmyard manure are commonly applied in Bangalore. Conservation practices, such as reduced tillage and mulching, are applied by 48% and 16% of households, respectively. Farm and household characteristics, including market integration, are the most important determinants of management decisions that affect SOC. Our study shows that improving farm and household conditions and opportunities, independently of the degree of urbanity, is necessary for implementing agricultural practices that can benefit SOC in Bangalore.

1. Introduction

Cultivation has led to a decline of soil organic matter (SOM), especially in most weathered tropical soils. Reductions in SOM constitute a negative feedback loop, altering the provision of soil functions, such as C sequestration, habitat for soil organisms, biodiversity, and plant productivity [1]. Consequently, a low SOM content makes farmers more vulnerable to global change conditions, e.g., climate change and urbanization, which is particularly pronounced in regions of quickly growing megacities [2]. Urban expansion implies a loss of fertile cropland to constructed areas, environmental degradation, competition for natural resources, and it might even result in the displacement of farmers into marginal lands [2]. Generally, farmers in urbanizing areas might have a higher adaptive capacity to changing framework conditions like climate change than remote rural farmers, due to better access to certain infrastructures [3,4,5]. However, farmer communities from the city periphery may be more vulnerable to climate change than at least a portion of the urban population in the city center, where the economy is more active and physical and social infrastructures are more developed [6], although such urban facilities may only benefit wealthier urban inhabitants [7].
In India, the soil organic carbon (SOC) concentration in most cultivated soils is less than 5 mg g−1, compared with 15 to 20 g mg g−1 in uncultivated soils [8]. A low SOC concentration is attributed to frequent tillage, the removal of crop residues, and the mining of soil fertility [8]. In recent years, there has been an increased need for and interest in how SOC accumulation can be achieved through agricultural management practices, with reviews on best practices and their impacts on SOC [9,10,11]. Studies suggested that the retention of crop residues mitigates nutrient exports from soils and effectively preserves or even accumulates SOC [11]. Therefore, retaining crop residues on site is an important measure to maintain the chemical, physical, and biological properties of soils [12,13], thus mitigating negative climate change impacts on crop yield [14].
Management practices altering SOC dynamics interact considerably with social-ecological factors that may be changing in the context of rural–urban transformation. For example, crop-choice changes in cultivated soils are increasingly being promoted by urban demand, inducing a switch from traditional rainfed cereal crops to more intensively managed irrigated vegetables in the vicinity of city markets [15]. Furthermore, farm households in urban areas may pursue alternative work outside agriculture, providing an additional income and enabling landowners to invest in innovative agricultural technologies [16]. However, off-farm work may reduce the time and motivation spent on agriculture by directly increasing agriculture’s opportunity cost [17]. Potentially, this might promote the selection of less management-intensive agricultural practices that may only be beneficial in the short term instead of labor-intensive practices often required in sustainable agriculture [18]. The main management factors that affect SOM dynamics are the selection of crop species, the retention of crop residues by using mulching, the application of mineral and organic fertilizer, water management, and tillage. Different combinations of these management practices can counteract SOM accumulation, and the practices’ effects may differ between agricultural systems, soils, and climate regimes.
This paper aimed at providing an overview of how current management practices are affecting the SOC dynamics and SOC accumulation in soils in an urbanizing setting in India. To achieve this objective, we first reviewed the literature on the effects of the abovementioned management factors in relevant tropical systems, performing a more in-depth statistical analysis of fertilization-type effects on SOC concentrations with a focus on agriculture in the surrounding areas of the South Indian megacity of Bangalore. Since socio-economic factors that are dynamically changing during urbanization are expected to affect SOC-related management factors, the second aim of this study was to disentangle and analyze the relationship between socio-economic characteristics of farm households in Bangalore’s urbanizing area and the use of agricultural management practices that affect SOC. We hypothesized that (1) conservation practices, such as mulching, minimum tillage, and FYM addition, improve SOC levels in the context of Indian agriculture; (2) decisions for crop choices are driven by the vicinity of city markets and affect management practices, such as fertilization and irrigation; and (3) decisions for adopting soil conservation practices are more likely for traditional rainfed cereal crops, and these crops are more frequently cultivated in rural areas. To test Hypothesis 1, data from the literature were evaluated. To test Hypotheses 2 and 3, we used survey data from 362 farm households located in the rural–urban interface of Bangalore to examine farmers’ crop choices, the adoption of irrigation, as well as the adoption of mulching practices, farmyard manure, and minimum or no tillage. We used Bangalore as a case study as it exemplifies many key characteristics of urbanization and related agricultural transformations [19,20,21]. Urbanization in Bangalore negatively affects the local environment, ecosystems, and biodiversity [22,23]. We addressed these issues in terms of SOC in our study since SOC is a holistic indicator of soil degradation [24].

2. Literature Review of Management Practices and Their Effects on SOC Dynamics during Rural–Urban Transformations

2.1. Crop Choice and Diversification

Crop diversity is a critical factor in food security because having a variety of crops means that at least some crops will yield despite harsh climate conditions, insect outbreaks, and other natural disasters [25]. Patil et al. [15] reported 82 distinct crops in Bangalore. Among the different categories, cereals and pulses are the main crop choice for farmers in Bangalore, finger millet and maize being the major crops. Commercial crops, such as fruits, vegetables, fodder, and horticultural crops, complement the range [15]. Market proximity supports the production of high-value crops [26]. Proximity to Bangalore city increases the likelihood of farmers choosing vegetables, suggesting that the primary market is a main decision factor [15]. Crop type may interact with fertilization level and water management and may affect the quality of plant residues potentially returned to the soil [27]. Nitrogen and lignin contents are major determinants of decomposition rates [28], with N2-fixing plants playing important roles in a substitution of mineral N fertilizer. High-quality residues increase microbial anabolic activity [12,29,30], promoting the production of microbial residues, thus increasing the C sequestration in soils [31]. Furthermore, crops differing in root traits may impact SOC dynamics via various processes, e.g., finer roots and more branched root systems as well as mycorrhiza infections increase the aggregate stability mainly through the physical enmeshment of soil particles, which increases resistance to soil erosion [32]. In annual cropping systems, species with high root to shoot ratios, such as pigeon pea and finger millet, which are traditionally grown in Bangalore, show higher contributions to SOC compared to plants with lower root shoot ratios, such as maize [30,33]. Perennial crops generally deposit more C than annual species due to their permanent and deeper root systems, promoting the stabilization of SOC [8,10]. These effects are mainly observed in tree plantations, hedges, and agroforestry systems, such as home gardens and alley cropping systems [9,34,35,36,37,38]. However, studies of Bangalore´s perennial representatives are lacking.

2.2. Application of Crop Residues and Mulching

Residue return and mulching are practices oriented toward enhancing soil quality and crop yields by increasing SOC inputs, improving a soil’s structure and water holding capacity [8,13] while preserving soil moisture [14,39]. Depending on the quality of the residue and turnover rates, the return of nutrients by mulching may even directly increase yields [12]. Furthermore, mulched crop residues provide protective litter layers against erosion [28]. Mulching is practiced not only with harvest residues but also with tree pruning from leguminous trees and shrubs that increase C and N inputs into the soil [40]. Thus, legume plants are considered four times more often by tropical agricultural studies analyzing the effects of substrate quality and nutrient release than non-legume species [41]. In India, mulching is preferred for fruit orchards, flowers, and vegetables rather than for traditional food crops [42]. Despite the potential need for and positive effects of mulch, especially in rainfed systems, its use is not frequent in India [43].
In the tropics, lower C inputs into soil are partly caused by higher demands for crop residues for alternative uses, such as livestock feeding, fuel, and fiber [11]. This is particularly true in India where, besides livestock feeding, there is a great demand to use residues for energy, especially for cooking [8,44,45]. This lack of available crop residues is a major constraint for mulch applications as it is restricted cultivation during the dry season that causes increases in bare fallow and erosion [8,44]. Thus, low yields and reduced residue returns generate negative feedback loops with respect to SOC [8]. In this context, a higher urban demand for crop products and land may provide motivation to reduce bare fallow by using frequent cover crops, increasing crop productivity. In any case, all the abovementioned factors reflect a need to identify viable supplementary sources of nutrients, measures against soil erosion, [28] and viable alternative sources of fuel and fiber.

2.3. Use of Organic Manures and Fertilizers

Besides mulching, the application of organic manures increases nutrient cycling and C inputs into soil. Urban cattle in Bangalore are stallfed with purchased or farm-produced concentrates, while in rural locations, during the daytime, animals are allowed to graze on nearby vacant lands and on agricultural farmland. In both systems, dung collections and applications in crop production are low, highlighting a need to strengthen crop–livestock links by using back transfers of some of the products [45]. There is also a need to more efficiently manage urban cattle disposals that pollute water [45]. Thus, the recycling of cattle manure will prevent water pollution and will close C and nutrient cycles in agriculture. Green roughage is produced on a daily basis from the city environment and green spaces, while dry roughage is often purchased weekly and stored. In addition, unused vegetable and food wastes and compounded cattle feed or individually mixed concentrate are fed [45], demonstrating the trade-offs between the crop residues used for mulching and feed. Besides the low dung return rate, a low frequency and amount of organic fertilizer application as well may be due to utilizations for further purposes, such as energy [46,47]. In places where the availability of farmyard manure (FYM) is a major concern due to a decline in the livestock population, crop residues, compost, and municipal biosolids are considered alternative organic material inputs for sustainable crop production [48]. In India, the use of byproducts, such as press cake from the alternative biofuel species Jatropha, has increased plant yields and SOC accumulation [49]. Compost and biochar are potentially more efficient at increasing SOC storage because on top of improvements in soil quality and productivity, they are decomposed more slowly than fresh plant residues [10,13]. However, compost and biochar are less commonly applied in India, and few studies have included comparisons between compost and other organic amendments in relevant cropping systems [50,51,52], while none have included biochar. In irrigated rice-based cropping systems, the prominent means of maintaining SOM has historically been the incorporation of green manures, animal waste, and crop residues [12]. Under the specific dryland conditions of Bangalore, further analyses are required to compare the effects of different fertilizers on C sequestration.
Organic fertilizer is progressively supplemented or substituted with mineral fertilizer. An increased availability of mineral fertilizer and subsidized prices are probably important factors increasing such applications in many regions of the world [46,53]. The application of mineral fertilizers and combinations with organic amendments are recommended to counteract nutrient exports with harvested crops and nutrient losses during cultivations, while increasing soil aggregations, SOC contents, and water retentions of soils [8,13,54]. An N fertilization effect on SOC fractions has not been observed in the short term [30,55,56], whereas long-term individual studies demonstrated positive effects of N fertilization on SOC. However, the positive effects may be outweighed by negative effects due to increased N2O emissions at high fertilization levels [57]. In nutrient-limited soils, fertilization is recommended for sufficient plant growth with a high potential for increasing C inputs in these soils [10]. Once a soil has improved in quality, yields are maintained by using a smaller input of fertilizer [1,13] as there is a threshold at which plant yields level off, despite increasing amounts of fertilizer being applied [1].
The potential of using manures and crop residues for short-term N provisions is limited in light of the manures’ and residues’ low N availabilities and N contents, the latter of which are often lower than 2%, although they can provide long-term benefits in maintaining SOM [28]. Contrasting results observed in individual studies comparing farmyard manure (FYM) with mineral fertilizers or combinations of the two were probably due to differing contents of nutrients in organic manures and biotic as well as abiotic soil properties. Nonetheless, for tropical croplands, manure applications have been some of the most successful practices for increasing SOC compared to mineral fertilization, conservation tillage, and the application of crop residues alone [11].

2.4. Water Management

In India, approximately one third of the country’s arable land is irrigated, and increases in crop yields have been observed after irrigation [8]. However, access to water is limited and costly, emphasizing the importance of rainfed agriculture. Irrigation may induce contrasting effects on C sequestration. Introducing irrigation in dryland areas can increase C inputs [10,58] while enhancing decomposition rates. Likewise, the frequency of irrigation and intensities of wetting and drying cycles affect the soil’s physical properties and microbial decomposition [12], thus regulating C sequestration. The rapid mineralization of crop residues under optimal soil moisture conditions may explain why systems under irrigation do not effectively increase soil organic carbon stocks [11]. Furthermore, the effects of irrigation interact with other management measures as irrigated crops often receive higher fertilization rates and other chemical farm inputs with implications for soil health and the environment [59]. However, the possible negative effects of irrigation, such as increased erosion rates and nutrient losses, are often overlooked [58].
Nevertheless, water conservation practices, such as compartmental bunding, implementing ridges and furrows, and mulching, all increase plant yields and SOC stocks in Bangalore´s agricultural soil [39,60], maintaining the positive effects of improved water availability on agriculture. In terms of irrigation, the adoption of efficient irrigation techniques, such as drip irrigation, in Bangalore may be linked to crop choice decisions, while not all crops can be drip irrigated [15].
The irrigation sources in Bangalore are diverse, ranging from relatively less polluted rivers and underground sources to city wastewater [61,62]. With wastewater, nutrients and organic matter are applied [61], but access to water is the most limiting factor, especially for systems based on natural reservoirs that are constantly depleted [15,62]. Despite water’s primary importance in most soil processes, published studies regarding water management and its relation to SOC dynamics are surprisingly scarce compared to studies concerning other practices, such as fertilization and mulching.

2.5. Tillage

In India and other countries in Southeast Asia, moldboard plow tillage is frequently applied in crop rotations [63]. Soil disruption and intensive tillage practices are classified as immediate causes of SOC declines, so reduced and zero tillage are important mitigation practices to prevent SOC losses [8,9,10,13]. Tillage alters water interception and infiltration, soil porosity, aeration, aggregate distribution, and microclimates, increasing decomposition rates [8,12]. Conservation tillage, leaving 30% or more of a soil’s surface with crop residue [64], is a good conservation strategy enhancing soil quality, yields, and thus SOC [8]. Zero tillage practices are defined as the complete absence of tillage and have been demonstrated to have great potential in increasing SOC accumulations worldwide [65]. In maize systems, zero tillage [66,67] and reduced tillage [68] have presented the highest increases in SOC. Studies about tillage’s effects on SOC in India showed increased SOC levels for reduced tillage and non-tillage practices compared to conventional tillage in 90% of cases (Table A1). Nevertheless, Powlson et al. [13] suggested that increases in SOC from reduced tillage appear to be much smaller than previously claimed and can be overestimated considering differences in the depth, bulk density, and depth distribution of SOC between tillage treatments.

3. Materials and Methods

3.1. Analysis of Published Data on Fertilization’s Effects on SOC Dynamics in India

3.1.1. Study Selection

Among the most relevant management factors affecting SOM dynamics, we focused on the effects of different fertilization practices on SOC under pedoclimatic conditions of India for analysis. We excluded analysis of tillage practices that were only partially addressed in our survey study, while data on effects of mulching and water management in India are scarce and therefore were not suitable for statistical evaluation.
We selected long-term Indian studies that were based on rainfed agriculture and maize and/or finger millet cropping systems as single crops or in combination with other rotation crops as maize and millet are the major representatives of food crops in Bangalore with the largest cultivated area. To prevent pseudo replications, additional studies conducted on the same field experiments under the same treatments, but with variations in sampling time, were excluded. We collected data on further relevant factors on SOC dynamics, such as number of rotation crops, clay content, pH, rainfall, and study period (Table A2). Nevertheless, due to the fact that soil variables other than SOC were not analyzed in field replicates, it was not possible to include these factors as co-variables in the analysis of treatment effects in our study.

3.1.2. Data Analysis

In the selected studies, FYM-N was mainly given as % of the recommended N dose. However, when FYM input was given in terms of fresh biomass per hectare, we calculated the N input (kg ha−1) from the available information on % N content in FYM (Table 1). When SOC was given not in concentration units (g kg−1) but in SOC stocks (Mg ha−1), we used individual bulk density data (when available) to convert stocks into concentrations. If bulk density of different treatments was not available, the calculation was applied to all the treatments using the initial bulk density of the soil. The increases in SOC presented in our results for the different treatments were calculated with the formula
∆SOC= SOCt − SOCc
where SOCt is the SOC concentration (g kg−1) of each treatment and SOCc is the SOC concentration (g kg−1) of the control treatments, i.e., without any fertilizer application.
For statistical analyses, the Shapiro–Wilk test and Levene’s test were used to test normalities and variance homogeneities of the residuals, respectively. We used unbalanced analyses of variance to compare differences between fertilization management treatments, followed by post-hoc Tukey’s tests for individual differences. To analyze whether the treatments significantly differed from the controls (zero), we used the one-sample t test for each treatment. We performed Pearson correlations to analyze the relationships between grain yield and SOC with a selected data set from three experimental fields on finger millet using all treatment samples, including controls without fertilization. The abovementioned statistical analyses were performed in the R environment [69].

3.2. Analysis of Survey Data on Farmers’ Agricultural Practices in the Urbanizing Region of Bangalore
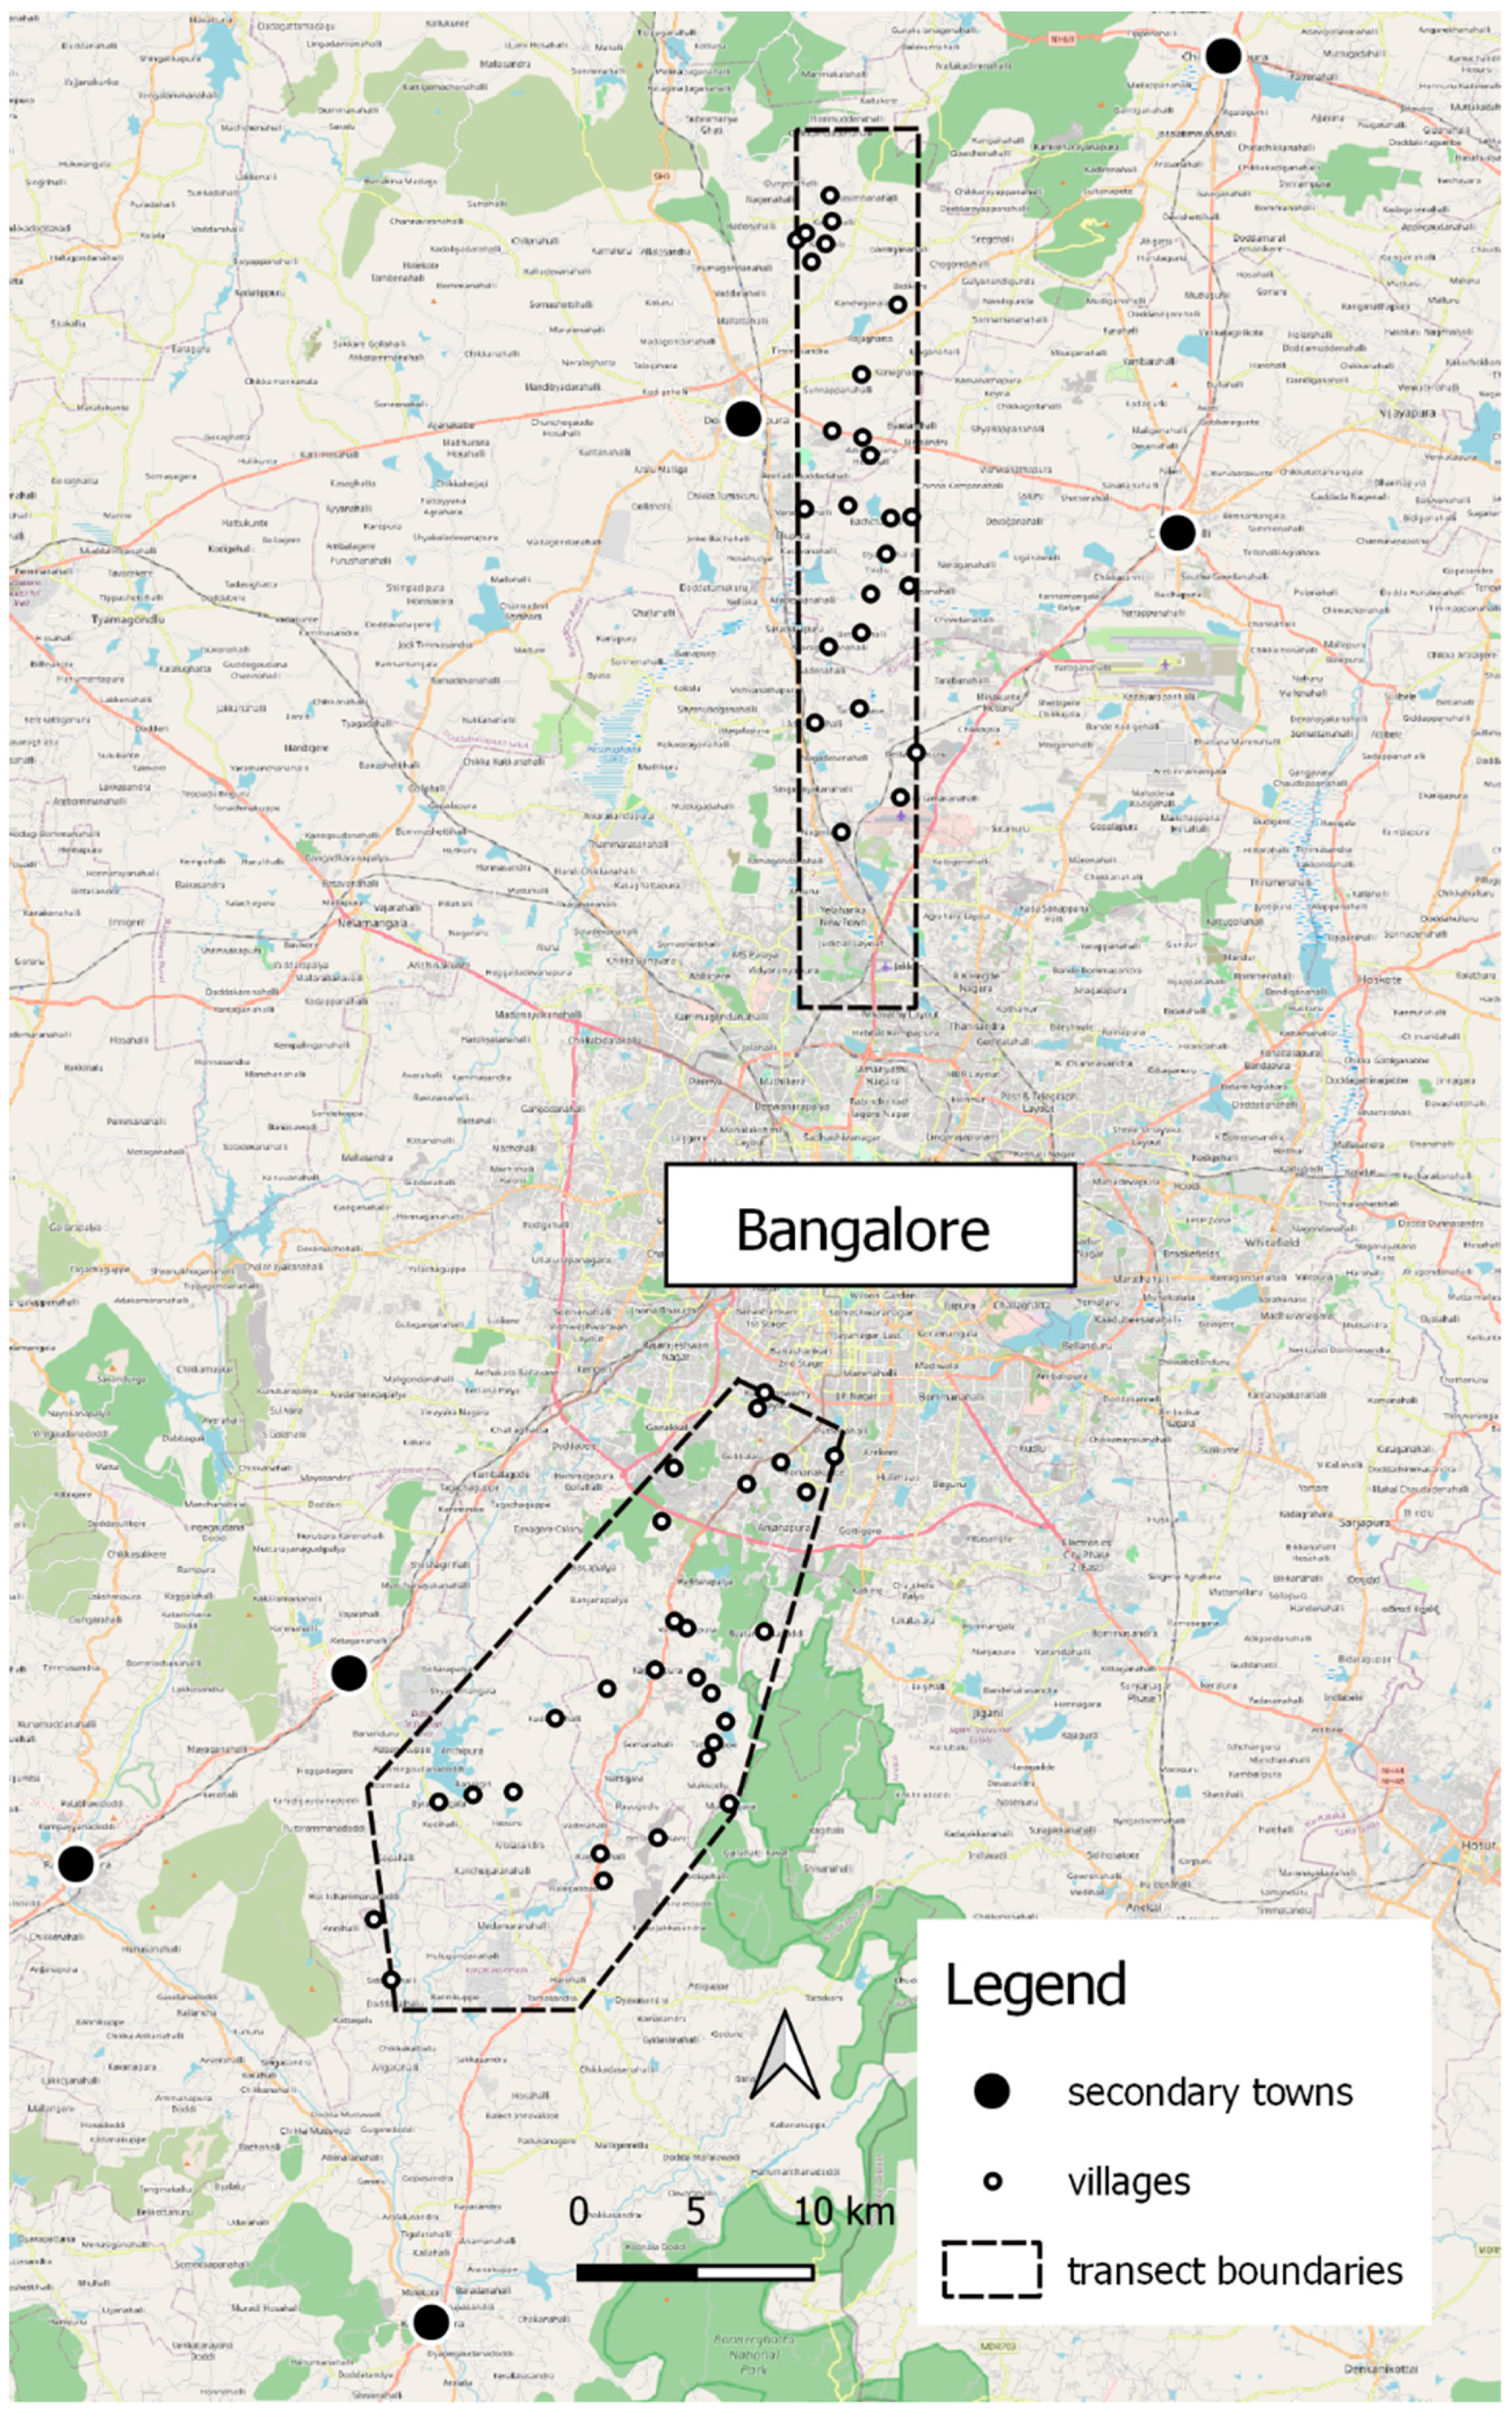
3.2.1. Study Site

Bangalore is a rising megacity located in South India. Its population increased from 5.8 million people in 2001 to 8.7 million in 2011 [70]. Unofficial projections indicated that the population had grown to 12.6 million in 2021 [71]. Beside its population size, the city is characterized by many key characteristics of urbanization and globalization. The city is known as India’s ‘Silicon Valley’ [19] and has a diverse off-farm employment sector that attracts large numbers of migrants [72]. Despite this, the agricultural sector is still of importance as it provides a source of income for 49% of the labor force in the surrounding peri-urban and rural areas [73,74].

3.2.2. Data Collection

We used survey data that was collected from 388 farm households located in two transects in the north and south of Bangalore between 2 February and 10 March 2020. A map of the transects can be found in Figure A1. The sampling of villages and households was done in a previous survey phase in 2016/17 using a two-stage stratified sampling approach [75]. In the sampling process, a Survey Stratification Index (SSI) developed by Hoffmann et al. [75] was used as a proxy for urbanization. The SSI was calculated from the distance to the city center of Bangalore and the percentage of non-built-up area around the villages. The SSI takes a value between 0 and 1, where 1 stands for most rural and 0 indicates most urban. The two transects were classified into six urban, peri-urban, and rural strata based on their degrees of urbanity. Within the strata, villages were randomly sampled proportional to the size of their stratum [75]. Finally, a random sample of farm and non-farm households was drawn proportionate to the size of each village based on household lists obtained from the mother and child care centers of the villages.
Due to the outbreak of the COVID-19 pandemic in India in March 2020, data collection of the second survey had to be suspended on 10 March 2020. 55% of the sampled farm households were interviewed. A total of 415 farm households in 50 out of 58 villages/neighborhoods with farm households were thus re-interviewed in second survey. Hence, attrition occurred within villages rather than across villages. We used a standardized questionnaire to collect data on socio-demographic household characteristics and farm management decisions (e.g., cropping decisions, fertilizer use, and use of sustainable agricultural practices). For our analysis, we focused only on the 388 crop-cultivating farm households as the sampled non-farm households and the farm households that were engaged in only dairy and livestock activities were not relevant to our study. We focused only on the data collected in the second survey in 2020 since data on certain farming practices (i.e., sustainable agricultural practices) that are essential for our analysis were not asked about in sufficient detail in the first survey.

3.2.3. Data Analysis

We start by providing a descriptive overview of farmers’ crop choices, fertilizer use, and irrigation in the study area. For analysis of the socio-economic correlates of farmers’ crop choices and the adoption of irrigation and conservation practices, we employed probit models. The linear probability model for each of the respective outcome variables was specified as:
Pi (Ai = 1 | xi) = β0 + β1Di + β2Hi + β3Li + β4Fii
The binary outcome Ai represent farmers’ crop choices and the adoption of irrigation and conservation methods. Pi denotes farmer i’s probability of adoption and hence the probability that Ai = 1 (where Ai = 1 indicates that a farmer has adopted a crop from a certain category, irrigation, or a conservation method and Ai = 0 indicates if otherwise) [76]. Summary statistics of all outcome variables are provided in Table 2. Farmer i’s probability of adoption is conditional on the explanatory variables xi. On the right-hand side of Equation (2), vectors Di, Hi, Li and Fi include decision-maker, household, location, and farm characteristics, respectively. Summary statistics of the socio-economic variables are provided in Table 3. Decision-maker characteristics include the gender, education and age of the household head. We further included household characteristics: the number of adults (household members aged 15 years or older), whether the household belonged to a marginal caste, a count of the durable assets owned by the household as a proxy for wealth (durable assets refer to household assets as compared to transport and agricultural equipment), and a binary variable indicating whether any household member earned an off-farm income. For farm characteristics, we included farm size, whether the household owned dairy cows, whether it owned other livestock, and whether it owned a borewell. Market integration was measured as a binary variable, and indicated whether the farm household had sold any crops in the market in the year preceding data collection. To measure urbanization, we included the SSI used to sample the households in our model. In addition, we controlled for the farmers’ locations in either the northern or the southern transect to capture any differences between them, but this variable was not the focus of our analysis. In the models on adoption of irrigation and conservation practices, we also controlled for farmers’ crop choices. In Equation (2), β denotes the parameters to be estimated. The unobserved characteristics are captured by the random error term εi. Due to some missing observations of some of the independent variables, we estimated the probit models for a slightly smaller sample of 362 farm households.

4. Results

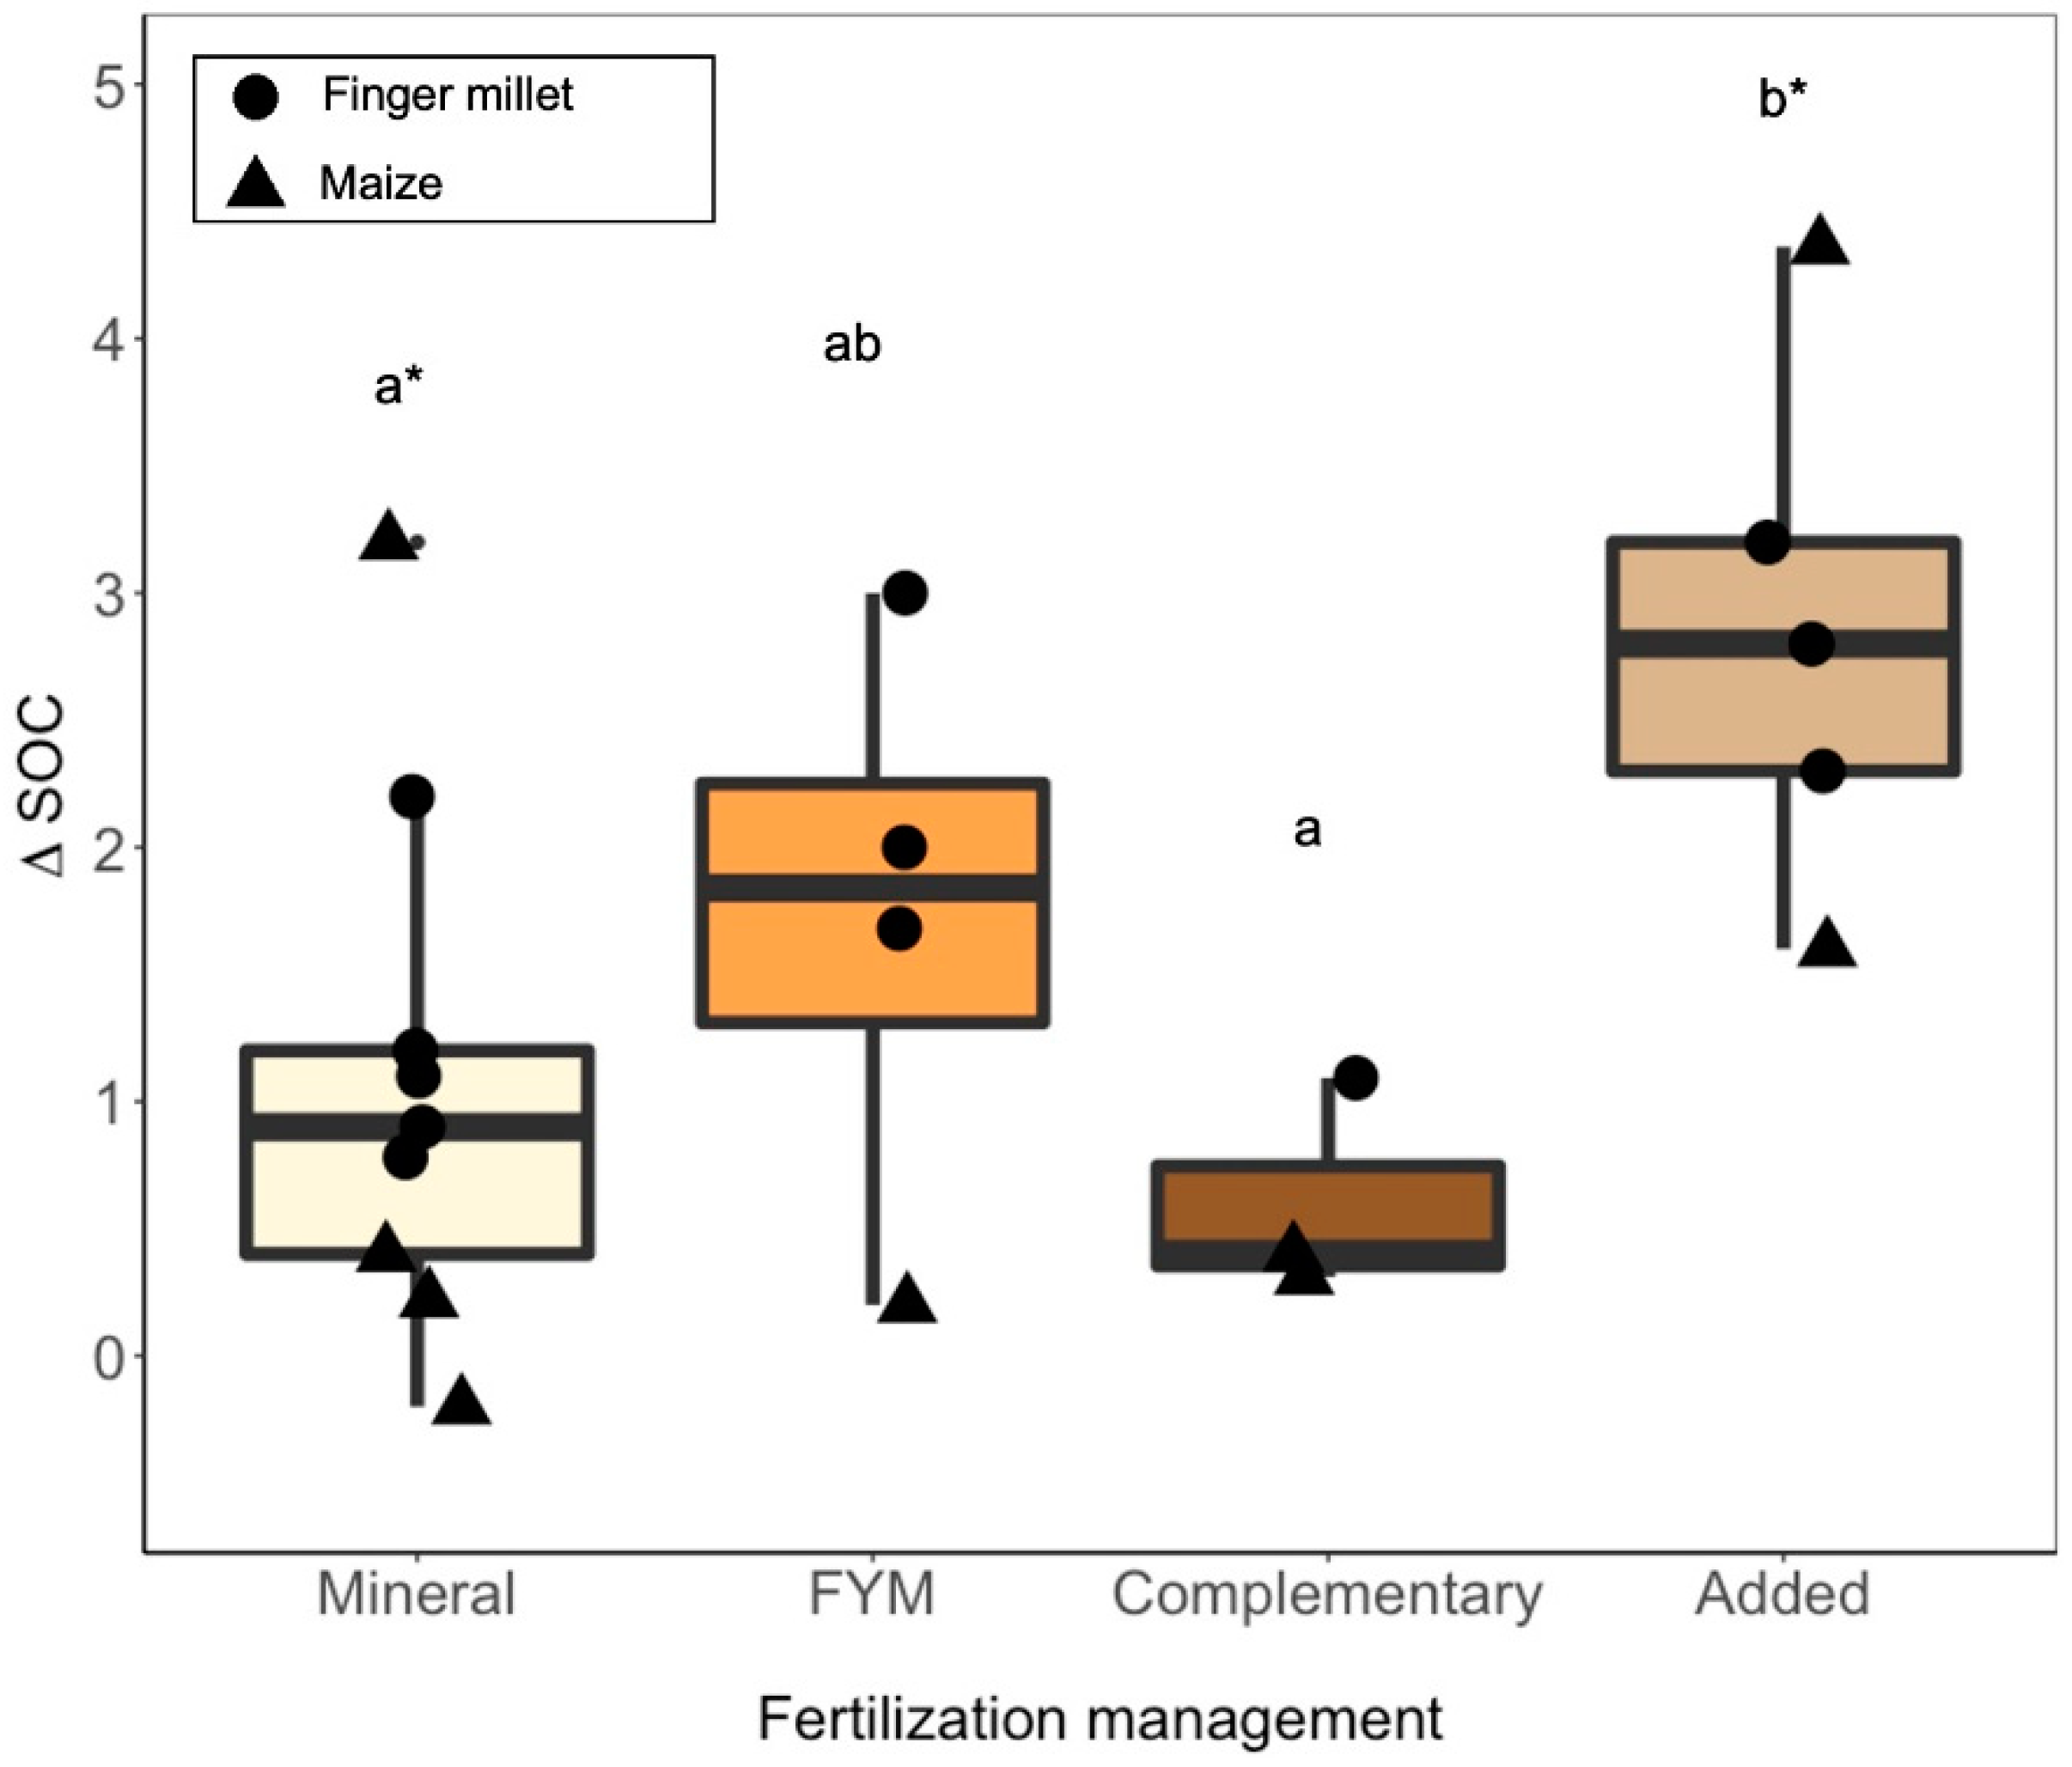
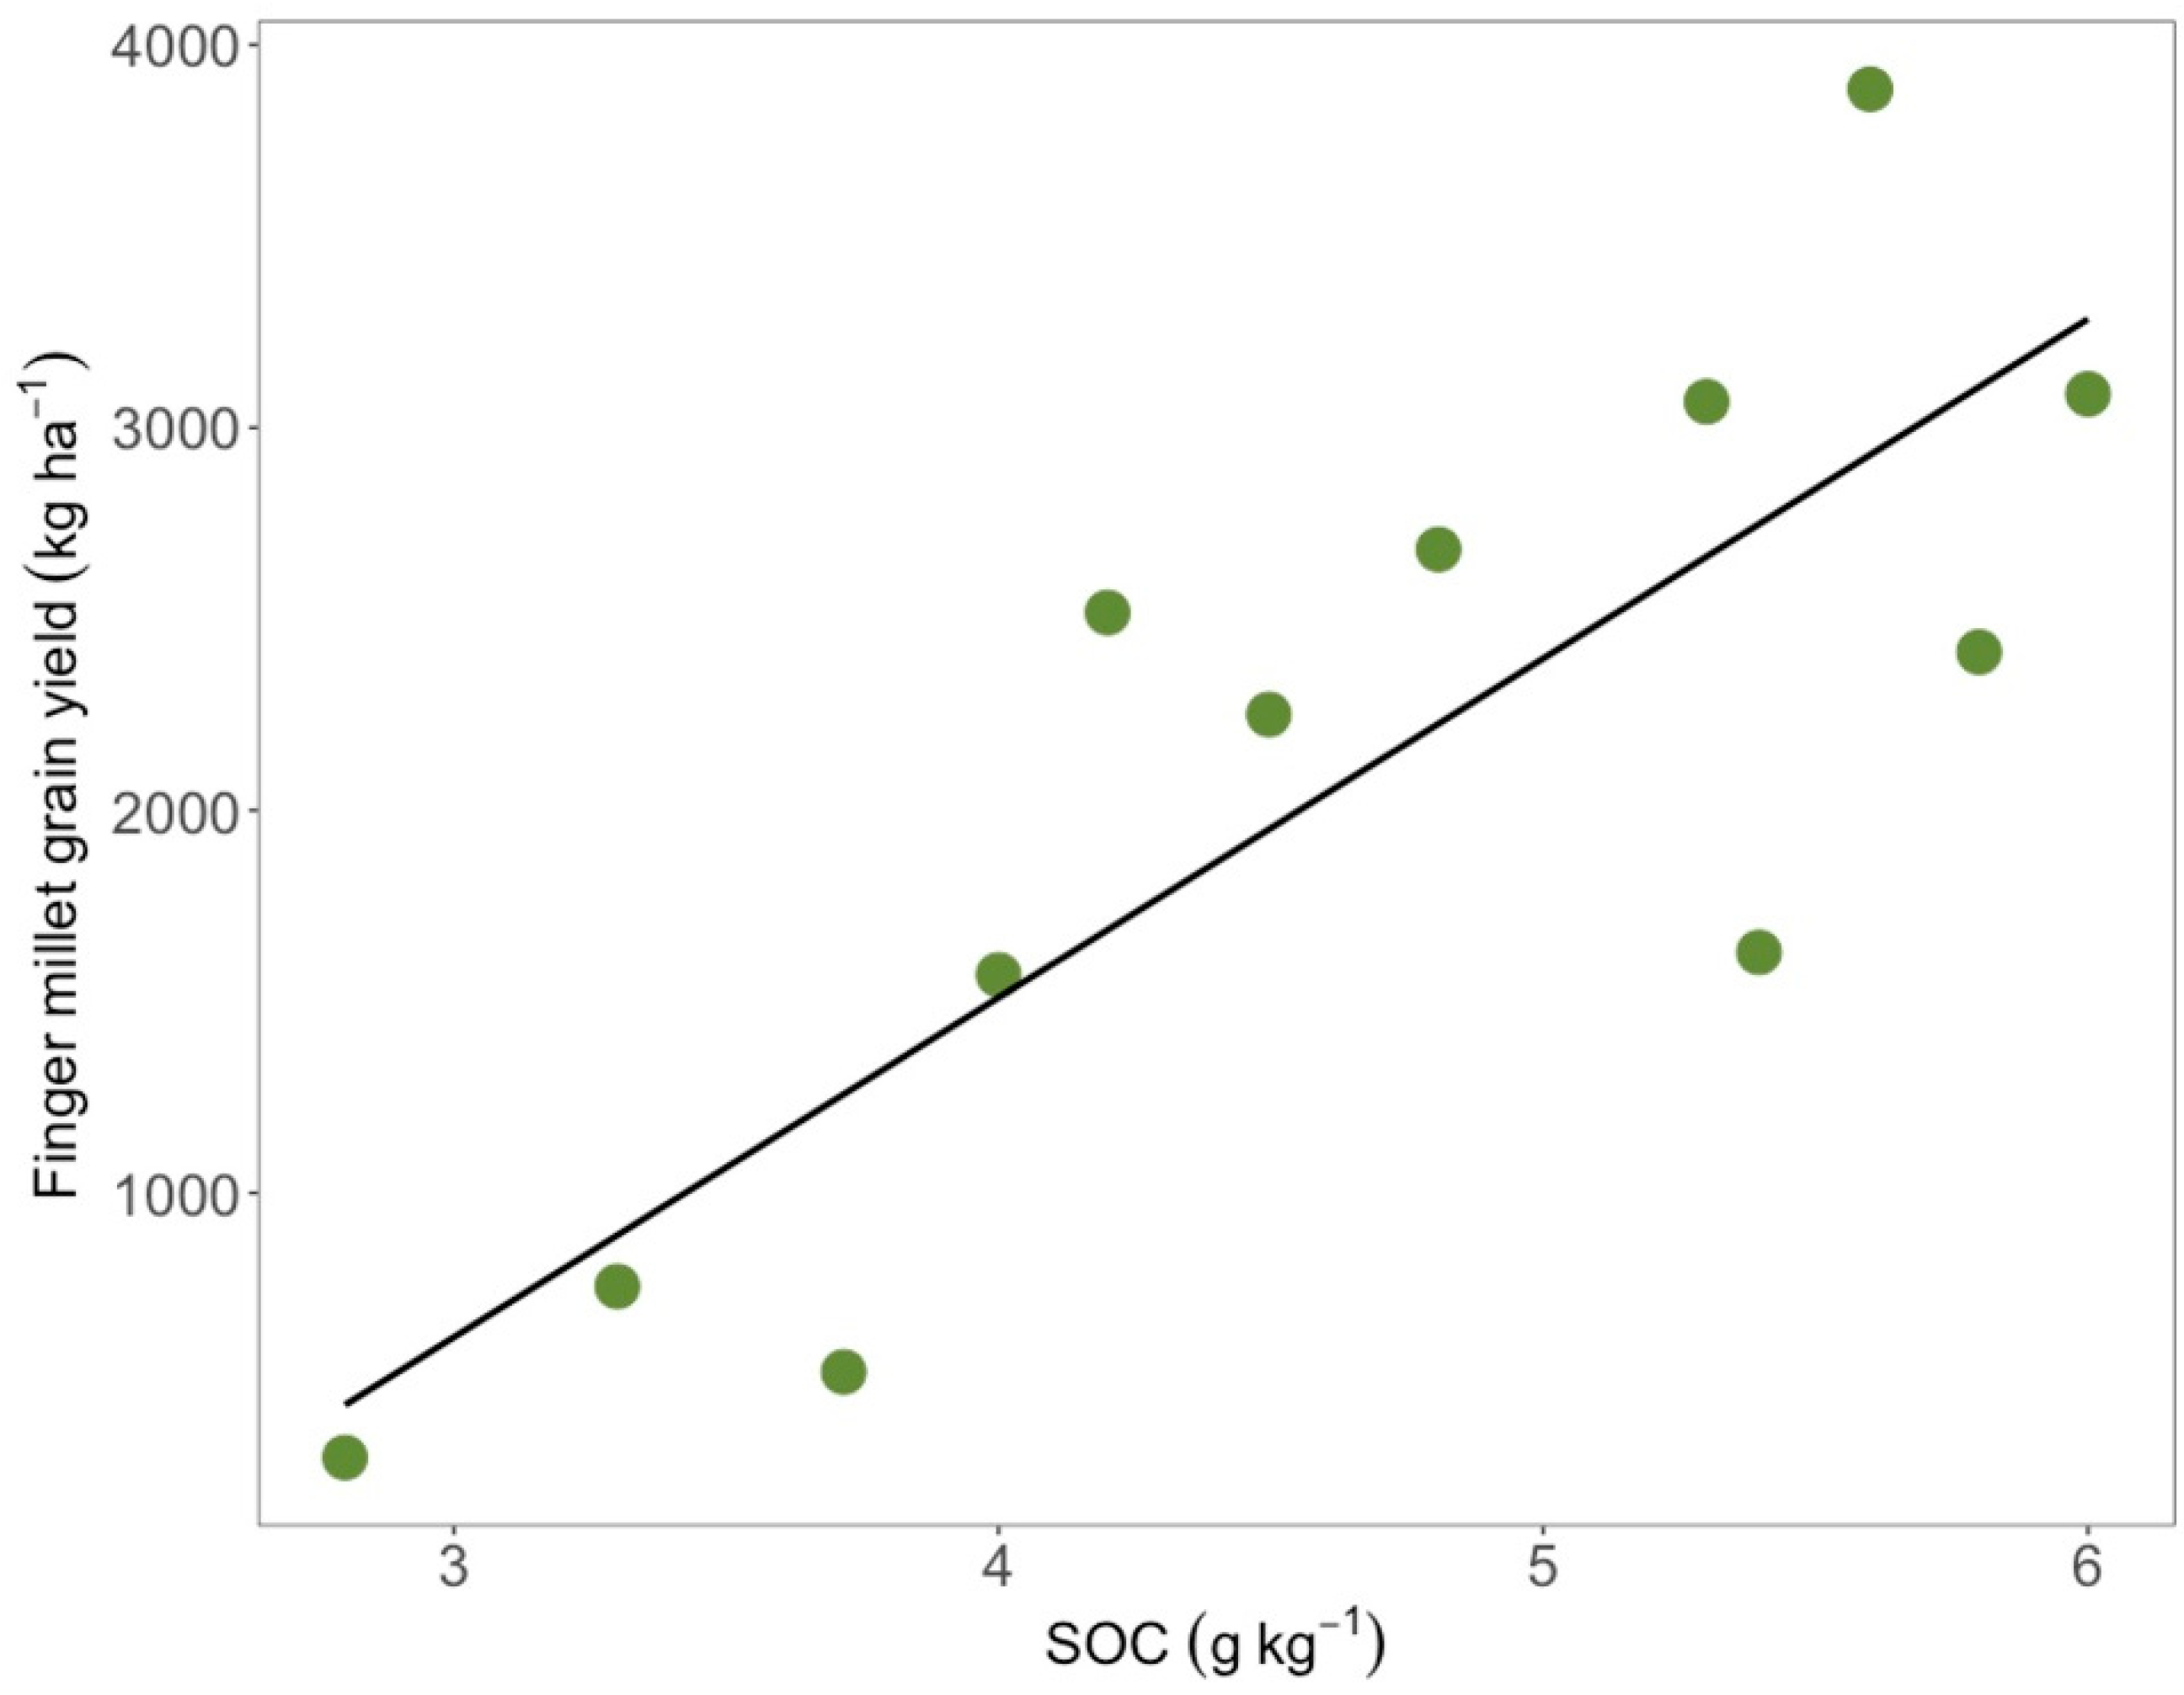
4.1. Fertilization Management’s Effects on Soil Organic Carbon (SOC) in Maize and Finger Millet Cropping Systems in India

We found two medium-term and seven long-term fertilization studies ranging from 4 to 6 and 10 to 44 years, respectively, of which five studies were based on finger millet and four studies were based on maize cropping systems (Table A2). The studies reported significant increases of SOC in top soils compared to control soils for most fertilization practices. The addition of farmyard manure increased the SOC in all studies in finger millet, whether alone or in combination with mineral N, while FYM alone did not increase SOC in the only individual study found for maize, but it did increase SOC in all studies that combined it with mineral fertilizer (Table 1). Compiling the nine individual studies, only mineral fertilization alone or a combination of the recommended dose of mineral fertilization with additional FYM (added min and FYM) increased SOC significantly compared to the control plots (Figure 1). Furthermore, the added min and FYM combination resulted in the highest SOC increase. Nevertheless, in the FYM treatments, N inputs into maize were lower than N inputs into millet [56] despite the fact that maize required higher N doses. The lower N inputs into maize probably caused the lack of significance of this treatment (Figure 1). We additionally found a very strong positive correlation between the grain yields of finger millet and SOC concentrations (Figure 2).

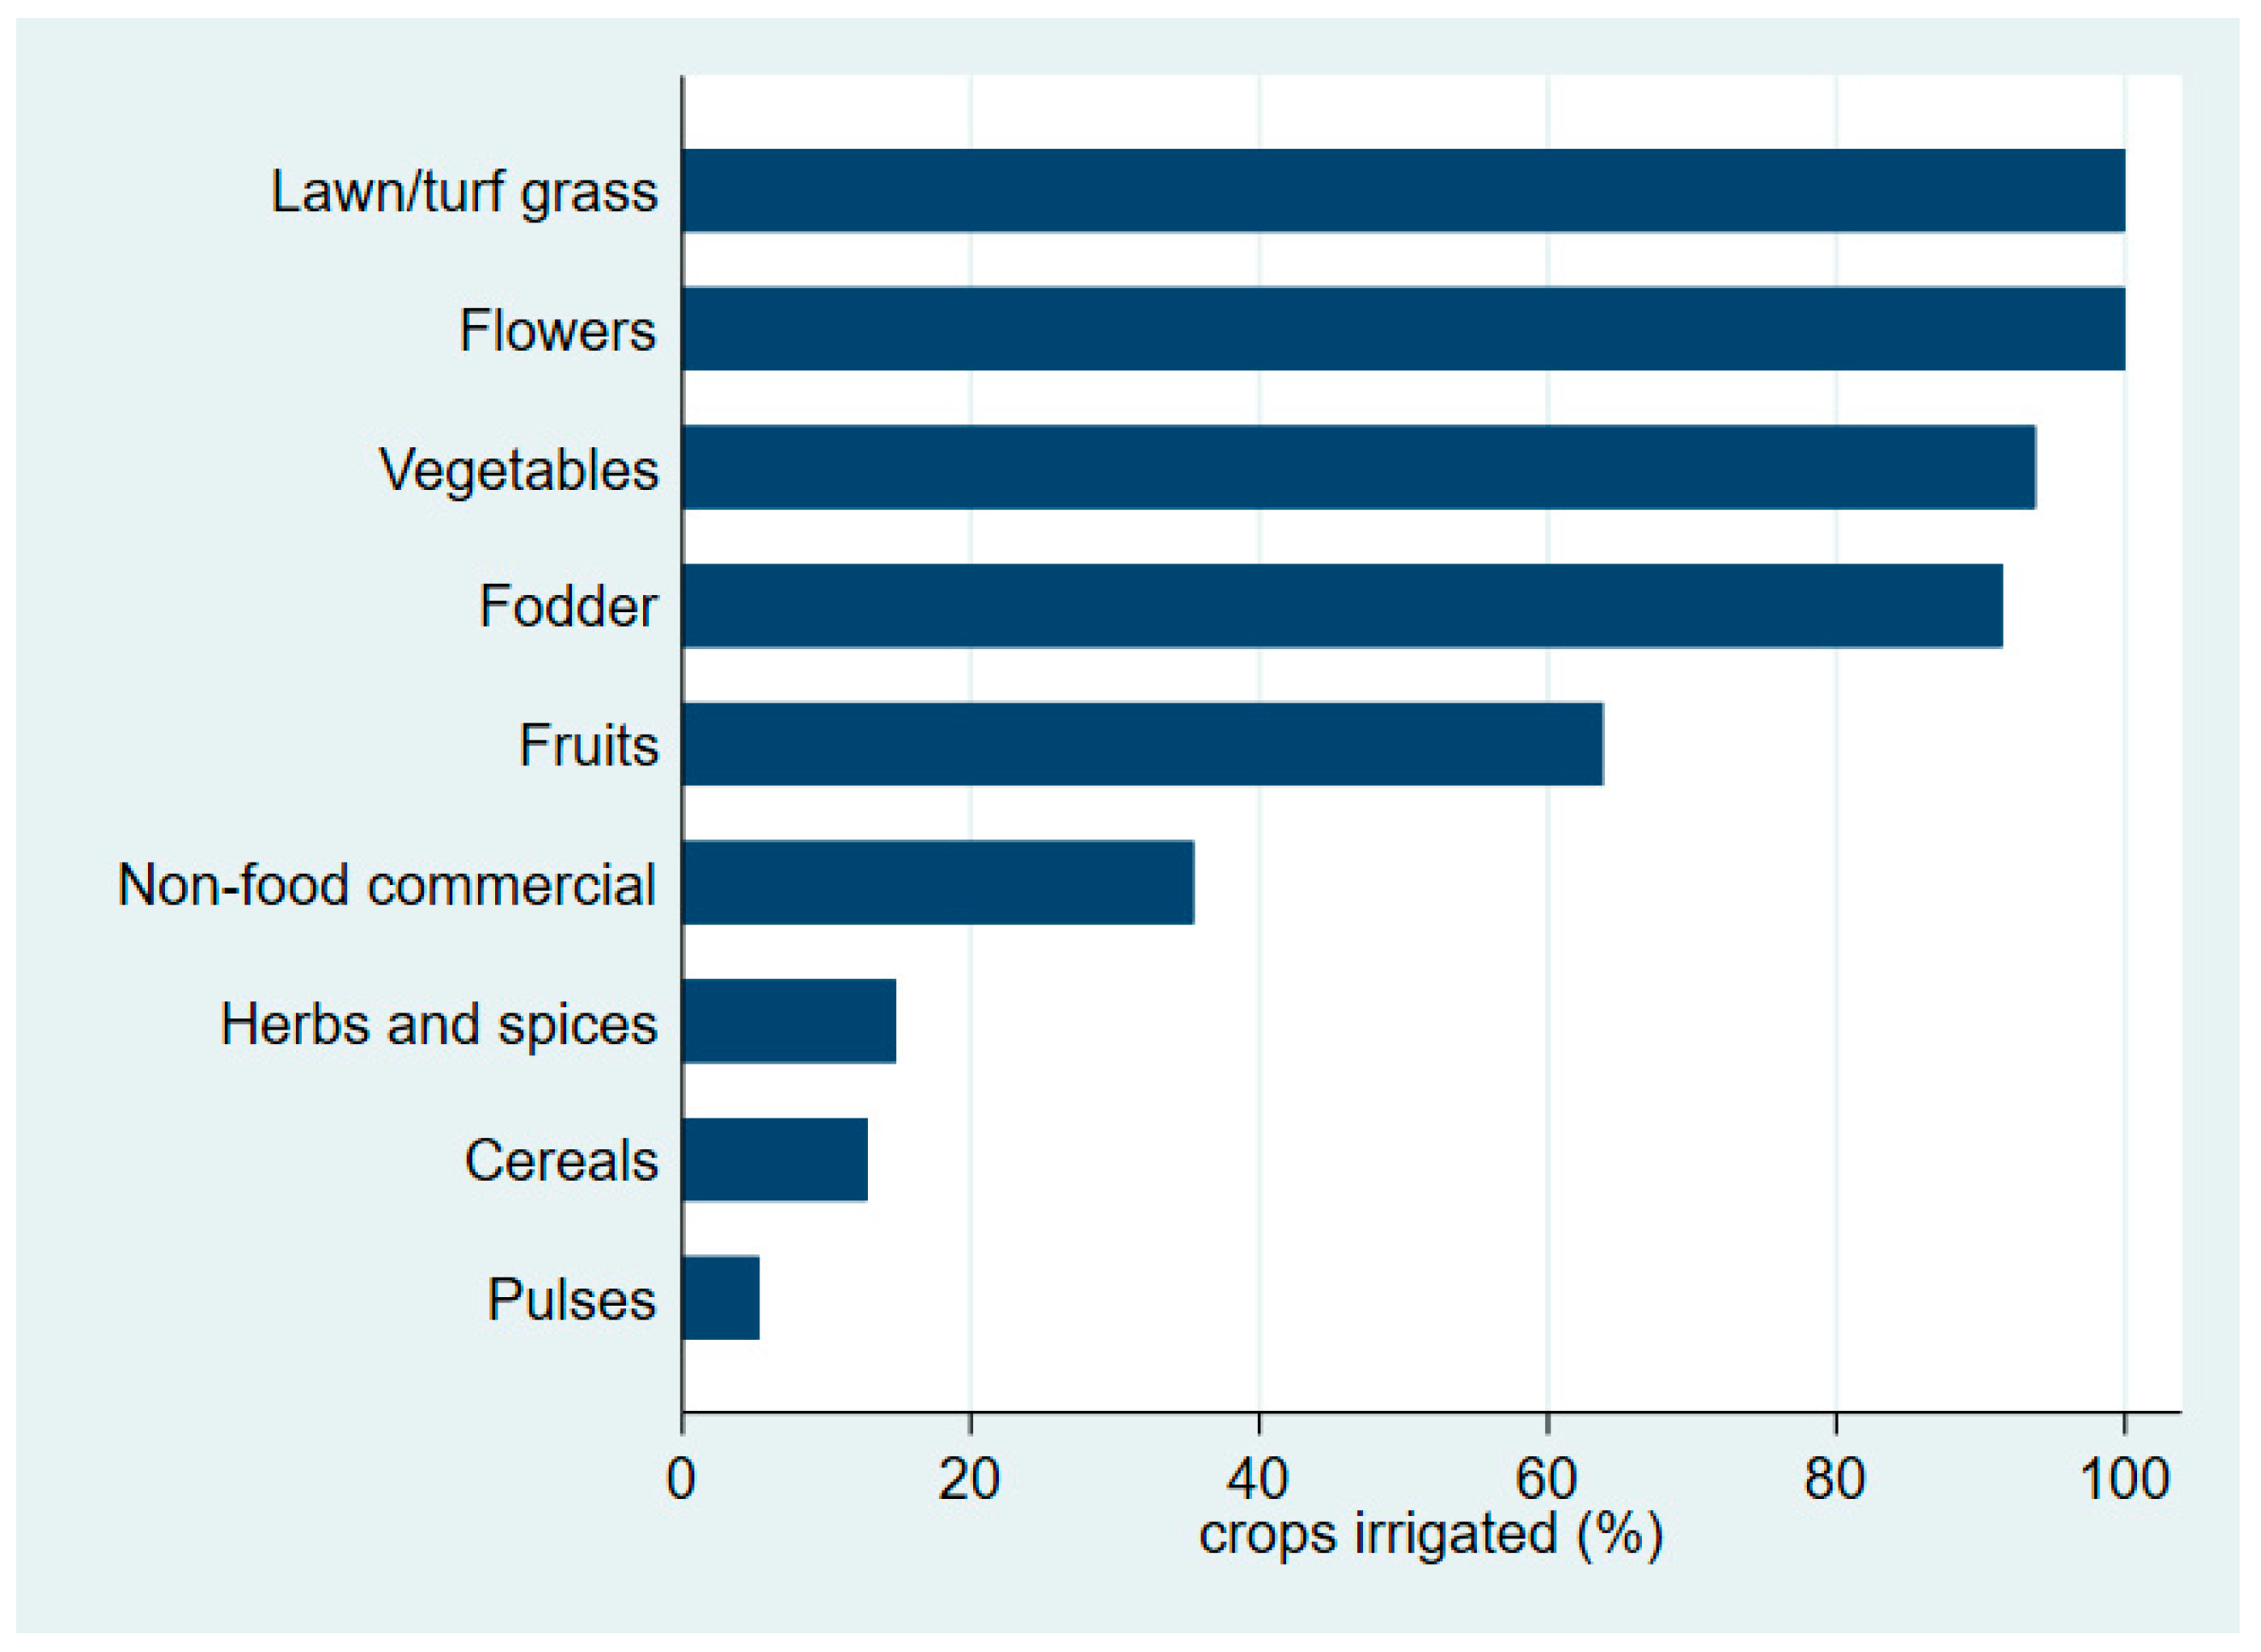
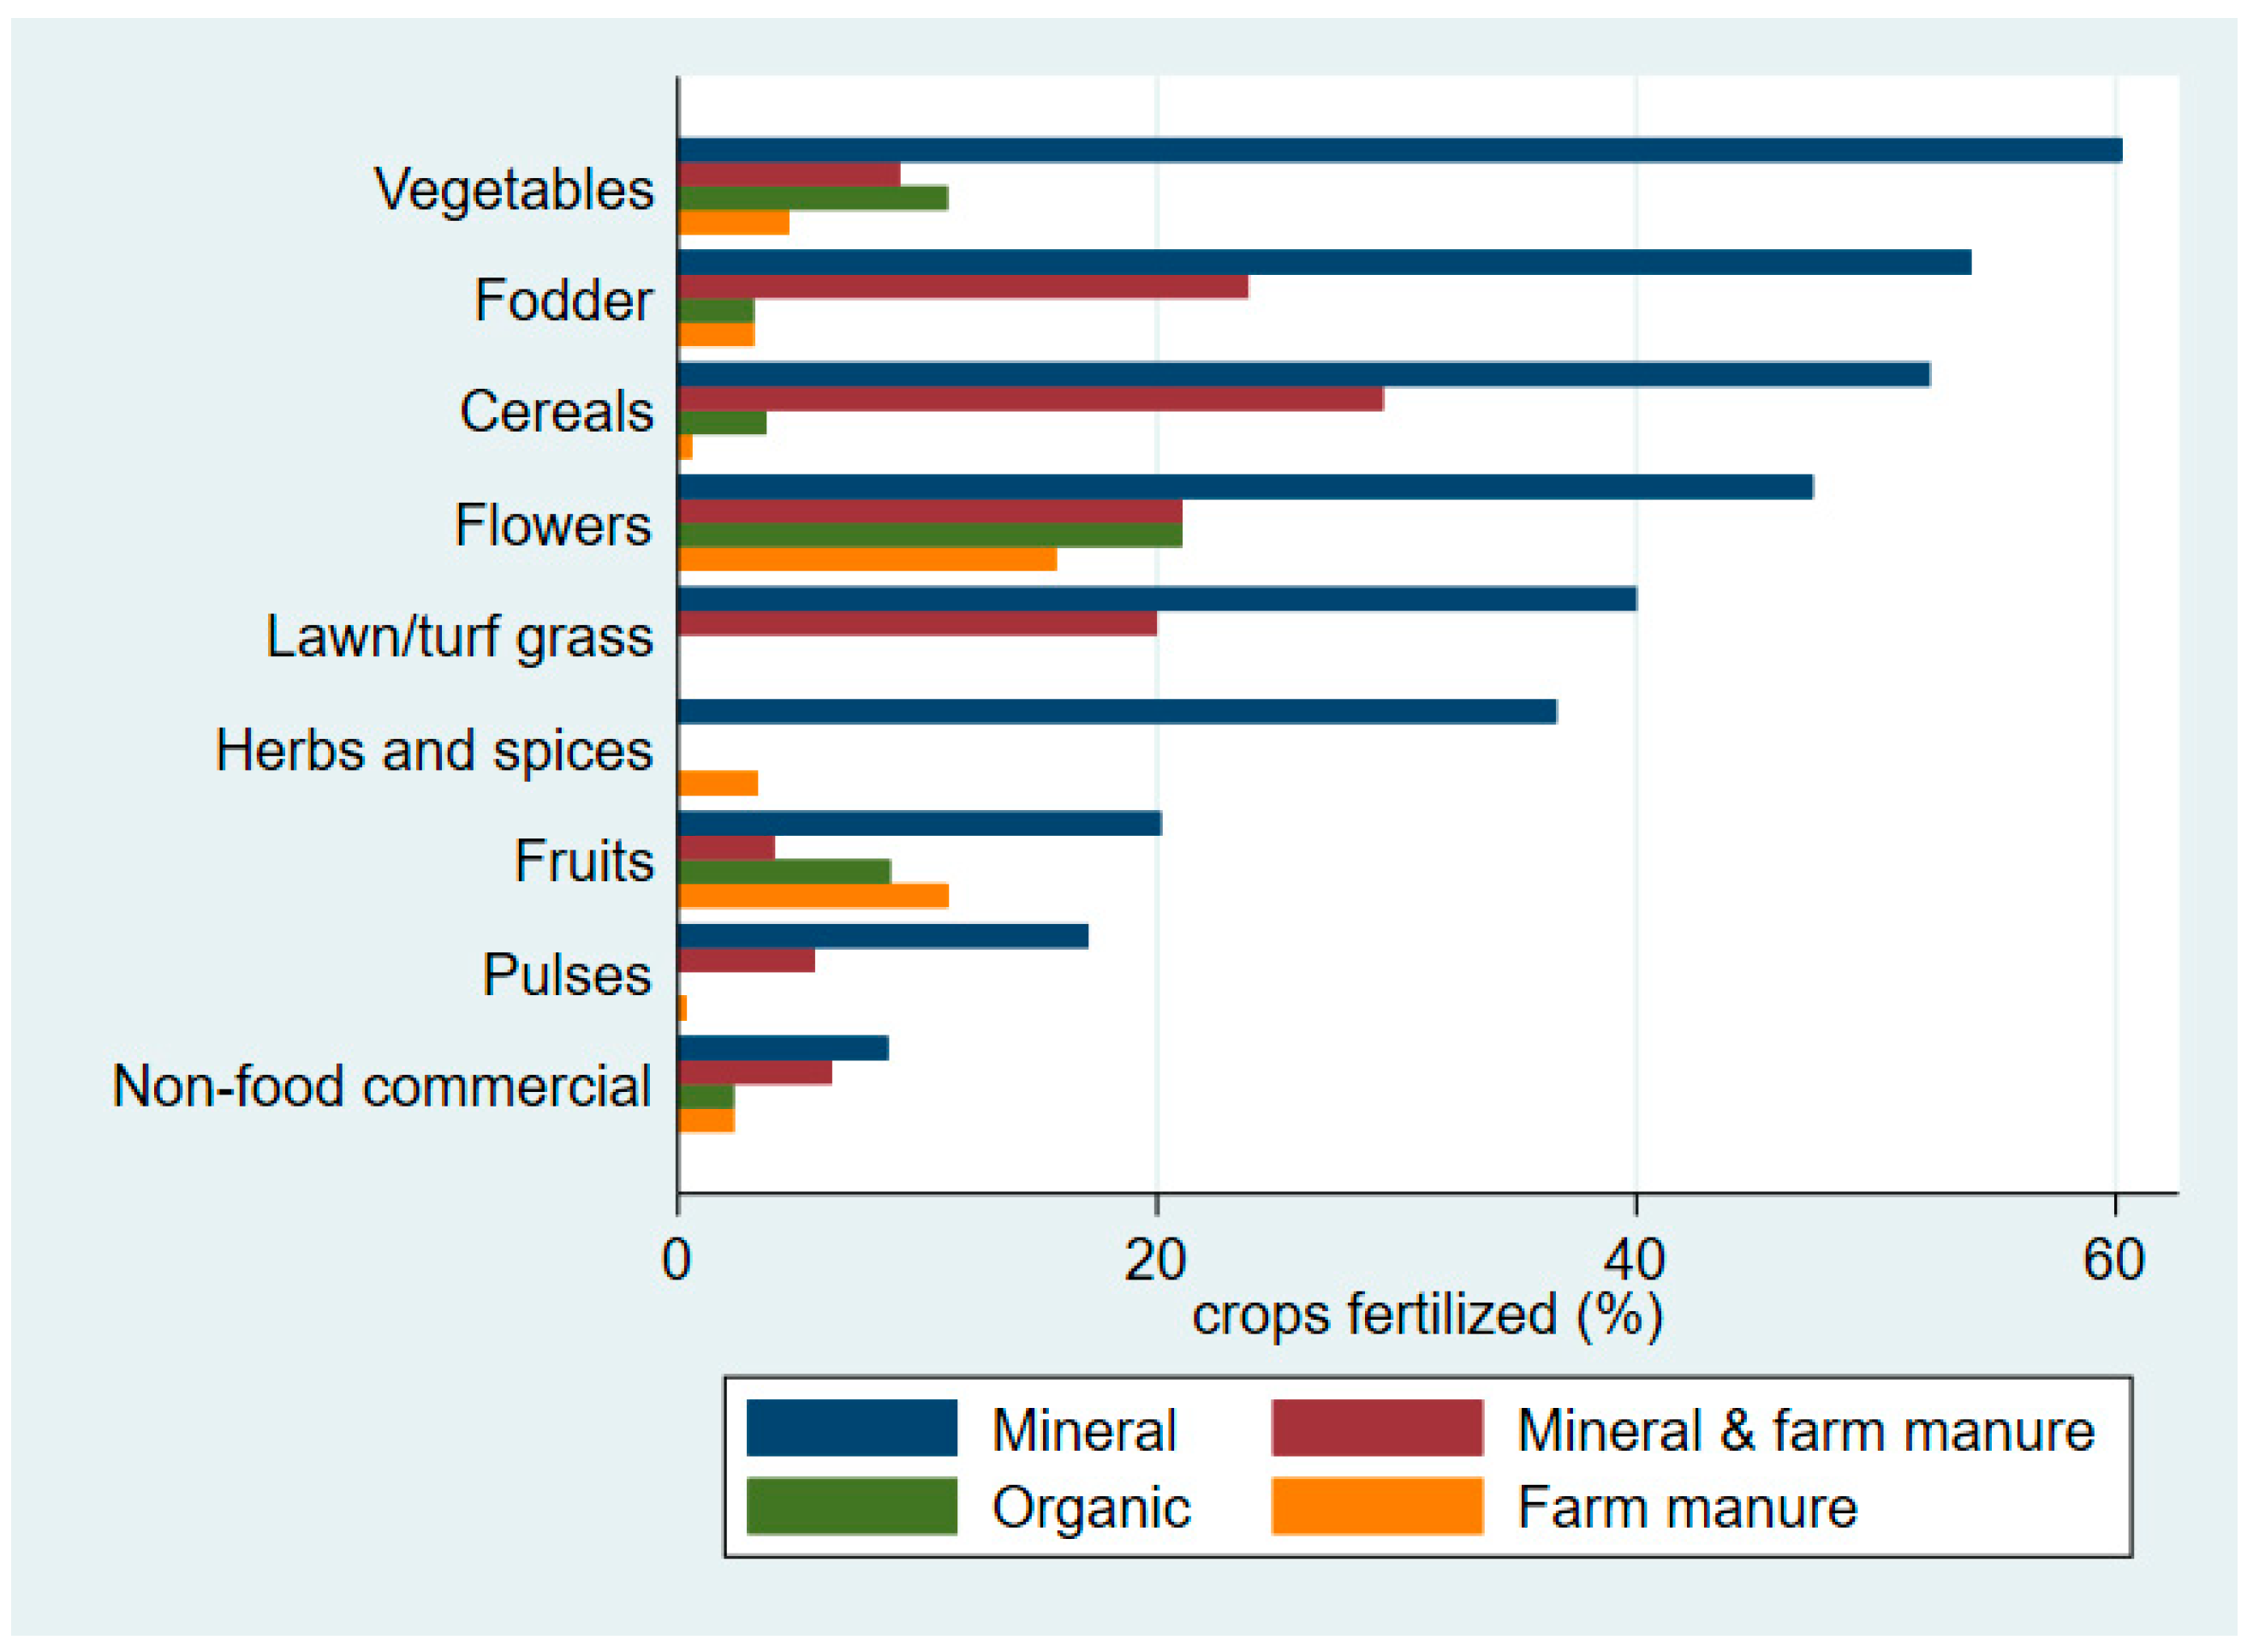
4.2. Management Practices in the Urbanizing Region of Bangalore

A large share of the interviewed farmers grew cereals (86%) and pulses (47%; Table 2). Fruits and vegetables were cultivated by 19% and 15% of the farmers, respectively, while 7% grew herbs/spices and 4% grew flowers. Fodder crops were cultivated by 15% of the farmers (note that fodder is defined here as the cultivation of Napier grass. Farmers may have also used crop residues from crops primarily grown for consumption, e.g., maize, that were classified here under another category, e.g., cereals). Moreover, 16% engaged in the cultivation of non-food commercial crops, such as eucalyptus and mulberry for silk production, while 2% of the farmers cultivated lawn/turf grass. A list of the crops that were included in the different crop categories is provided in Table A3.
In terms of irrigation, descriptive statistics suggested that lawn/turf grass and flowers were always irrigated (Figure 3). Vegetables, fodder, and fruits were also frequently irrigated. Almost 40% of non-food commercial crops were irrigated, while farmers irrigated only a small proportion of herbs and spices, cereals, and pulses. In our sample, 36.5% of the farmers used irrigation for at least one crop (Table 2).
Additionally, 37% of the farmers applied only mineral fertilizers on their farms, whereas 33% of them applied both mineral fertilizers and FYM (Table 4). Mineral and organic fertilizers were used by almost 20% of the farmers. The mineral fertilizers used by the farmers included, e.g., diammonium phosphate (DAP), gypsum, urea, and potassium chloride. The organic fertilizers included, e.g., compost, neem powder, neem oil, and vermicompost. We further differentiated between organic fertilizers and farmyard manure. A very small share of farmers (0.8%) applied exclusively farmyard manure. It should be noted that these observations were on the farm level and therefore only indicated whether the farmers used the respective fertilizers anywhere on their farms. Figure 4 suggests that the farmers did not necessarily apply the combinations of fertilizers to the same crop. For example, while some crops were fertilized with a combination of mineral fertilizer and FYM, no farmer applied both mineral and organic fertilizers to the same crop.

4.3. Decision-Making in the Urbanizing Region of Bangalore

We next examined the household socio-economic and farm characteristics that were associated with farmers’ choices of agricultural management practices that influence SOC. Table 5 shows the results of the probit models estimating the farmers’ probabilities of adopting crops from the different crop categories. The category lawn/turf grass is omitted due to the small number of farmers who cultivated lawn/turf grass. The results indicate that an increase in the years of education that the main decision-maker had received was associated with an increase in the probability that a farmer would cultivate fruits but was negatively related to the cultivation of flowers. Belonging to a non-marginal caste was related to an increase in the likelihood that a farmer would cultivate non-food commercial crops by 16 percentage points, whereas it decreased this likelihood by 8 percentage points for the category herbs and spices. Farm size was positively associated with the adoption of cereals, vegetables, herbs and spices, and non-food commercial crops. Further, the results show that market integration, i.e., whether farmers sold any crop in the market, was correlated with a reduction in the likelihood that farmers would grow cereals, but it was associated with an increase in their probabilities of growing vegetables, fruits, flowers, herbs and spices, and non-food commercial crops. The ownership of a borewell, and thus having access to groundwater irrigation, was associated with farmers’ crop choices in a similar way to market integration but was additionally positively related to growing fodder. Degree of urbanity, measured by using the rural–urban index (SSI), was not strongly associated with farmers’ crop choices except for in the adoption of vegetables, which became less likely the more rural a farm household’s location became.
The results for farmers’ use of irrigation shown in Table 6 suggest that the farmers’ probability of adopting irrigation is mainly related to the farms’ characteristics. In terms of household characteristics, only an off-farm income was negatively associated with irrigation adoption. Dairy and livestock activities were related to increases in the probability that a farmer would irrigate any of his crops. Increasing farm size and market integration were significantly associated with an increase in the probability of irrigation adoption. A farmer who owned a borewell was 20 percentage points more likely to use irrigation than a farmer who did not own a borewell. Growing cereals, pulses, or herbs and spices was related to decreases in the farmers’ probability of adopting irrigation, while the cultivation of fruits, vegetables, and fodder increased that likelihood. We now turn to the farmers’ use of soil conservation methods that contribute to increasing SOC. Overall, 16% of the farm households in our sample adopted mulching, crop residues, or cover crops, while a larger share of farmers, i.e., 66%, used FYM (Table 2). Expectedly, the ownership of cows and other livestock was related to an increase in the farmers’ probability of adopting FYM by 19 and 10 percentage points, respectively (Table 7). Having a female household head decreased the probability of applying FYM by 11 percentage points. Minimum/no tillage was practiced by 48% of the farm households. The results from the probit estimations suggest that decision-maker characteristics were correlated with adoption. A better education and the number of adults in the household were negatively correlated with the adoption of minimum tillage practices, suggesting that households with better educated household heads might have engaged in more intensive agriculture, although, conversely, we found a positive relationship between the number of durable assets owned, and thus wealth, and the adoption of minimum tillage.
For a more differentiated insight into the associations between crop choice and the adoption of soil conservation practices, we estimated probit models with crop choice and soil conservation practice observations on the plot level (Table A4). The results corresponded to the household-level analysis and suggest that the plots on which cereals and pulses were grown had higher likelihoods of being mulched, while cultivating cereals also increased the likelihood of farmers applying minimum tillage on the same plot. Plots on which vegetables or fruit were grown had higher probabilities that farmers would apply mulching practices, while the relationship was negative when farmers cultivated herbs and spices. On the household level, the degree of urbanity seemed to matter for only the adoption of minimum tillage practices to the extent that farmers who were located in less urbanized areas were more likely to use minimum tillage. The plot-level results similarly suggest a positive relationship between rurality and the adoption of mulching practices (Table A4).

5. Discussion

5.1. Crop Choice

The adoption of vegetables is more likely when urbanity increases and when farmers are integrated into markets, which suggests that being located in more urbanized areas provides farmers with marketing opportunities for vegetable crops, as shown in Patil et al. [15]. Compared with rural areas, farmers located closer to the city might cultivate high-value crops without reserving some land for subsistence purposes [78]. Furthermore, farmers with higher socio-economic statuses are often more specialized and commercialized in their production [79]. However, the SSI did not further explain the probability of crop choice. Yet, market integration highly affects preferences for crop choice. On the household level, the probability of growing vegetables, fruits, flowers, and herbs and spices increases in the vicinity of markets, whereas the probability of cultivating cereals decreases. This demonstrates the great importance of local markets for selling high-value crops in Bangalore. Furthermore, the cultivation of pulses, fruits, and vegetables increases the probability of mulching, and growing vegetables and cereals increases the likelihood that FYM is applied. Hence, most of the crop categories are related to some type of soil conservation practice, except for flowers, fodder, and non-food commercial crops. The negative correlation of herbs and spices with mulching may be compensated by using a rotation with other crops that are mulched. Furthermore, the possible negative effect on SOC of these two crop categories may be minor because of the low percentage of farmers growing flowers and herbs and spices. Therefore, the diversification of crop choice is the most relevant practice for SOC sequestration in the tropics [11].

5.2. Irrigation

Growing high-value crops, such as vegetables and fruits that are often sold in markets, is positively associated with irrigation adoption, while irrigation becomes less likely when farmers grow staple crops, in line with research by Patil et al. [15]. This suggests that irrigation might be a requirement for growing certain high-value crops but might also imply that farmers invest more in crops with higher monetary returns. The negative association between off-farm income and irrigation may be related to the proposed idea of increasing the opportunity cost of agricultural investments when other income options are available [17]. Based on our literature review, this would imply that off-farm income activities that prevent farmers from having irrigated systems also prevent potential increases in SOC stocks from more productive irrigated systems. This may be true for the majority of crops in which irrigation increases the production of aboveground and belowground biomass inputs [58] and thus SOC [10], except for turf as its harvest removes all biomass, including roots, with an additional removal of mineral soil, including soil organic matter. The positive association between cattle (dairy) and irrigation is probably related to a greater involvement of cattle owners in farm activities and to a higher necessity of adopting such irrigation practices due to the household’s reliance on agriculture and cattle for their livelihood. Napier grass, produced for fodder, is usually irrigated, probably increasing SOC, although not all dairy farms produce fodder.
Overall, 57% of the households irrigating at least a share of the crops owned borewells, whereas households that did not own borewells might resort to other water sources, such as surface water. Sewage irrigation is a common practice in Indian agriculture close to or in cities, but its effects on SOC and nutrient cycling may vary depending on the contents of organic matter and pollutants. For example, in rice–wheat systems in India, sewage irrigation has increased SOC in the long-term [80]. Furthermore, beside the effects on water quality and irrigated crop type, the irrigation technique may cause soil erosion and thus SOC depletion [58,81,82]. As one third of the fields in India are irrigated [8], this management effect on SOC should be analyzed in future studies.

5.3. Mineral Fertilizer and FYM

In our survey, 98% of the farm households used some type of fertilizer and mostly both mineral and FYM or organic fertilizers on their farms. We found that all but 0.8% of the farmers who used fertilizer used mineral fertilizer on their farms, which corresponded to findings by Bon et al. [78]. This widespread adoption of fertilizers might be facilitated by several ‘enabling conditions’ associated with urbanization that spill over to the more rural hinterlands of cities [83]. In our sample, the average SSI takes a value of 0.71 (Table 3), which implies that the majority of farmers lived in the more rural hinterlands of the study area rather than in the urban neighborhoods at the fringe of the city. However, since the maximum distance of villages to Bangalore was only 50 km in our sample compared to farmers living in very remote rural areas, the farmers in our sample might have had relatively easy access to farm inputs, such as fertilizers. This could be facilitated by the relative proximity to Bangalore and related access to road, transportation, and market infrastructures. Information and knowledge exchanges (e.g., extension services and mobile phones), as well as other institutional conditions might also enable adoption [83]. Besides proximity to the city of Bangalore, several secondary towns along the two study transects (see the map in Figure A1) might provide access to farm inputs and agricultural markets where farmers could also sell their crops [83]. Our results thus differ from studies focusing on tropical low-input small-holder farmers that had less access to mineral fertilizer [46,47,53]. Therefore, the accessibility of mineral fertilizer is not restricted in the households of Bangalore. However, for an analysis on fertilizer’s effects on SOC and the environment, data on the amounts applied to specific crops would be necessary.
A large percentage of farm households (70%) in Bangalore rear their own cows and therefore have access to FYM. A cattle-ranching culture is reflected in the relatively large number of studies that include FYM as a commonly used fertilizer in India. However, it is important to note that even though the percentage of dairy cow owners is high, less than half of the owners use FYM in combination with mineral fertilizer, and very few apply FYM alone. This suggests that many farmers use the manure produced by their cows for purposes other than their own crop’s cultivation.
Given the significantly positive effect of FYM on SOC stocks in Indian soils revealed in the literature review, it is necessary to address the gender factor in this practice as we observed that households with female household heads were less likely to implement it in agriculture. Female education and awareness raising in terms of agricultural practices is therefore required to improve SOC on farms managed by women.

5.4. Mulching and Minimum Tillage

Mulching was positively associated with farmers who grew both staple crops (cereals and pulses) as well as high-value crops (vegetables and fruits), which was shown in research by Gupta et al. [84]. This probably indicates that some of these crops generate more residues that can be used as mulch, e.g., from tree pruning. Furthermore, farmers who do not use plant residues for purposes such as feeding may be more likely to adopt mulching. However, the probability that farmers will adopt mulching increases with rurality (plot level) even though it is positively related to vegetable cultivation, which is more likely in more urbanized areas (household level), as shown by the negative correlation between the SSI and the likelihood of vegetable adoption (Table 5). Possibly, one reason that farmers’ probabilities of mulching increase with rurality is that farmers in more rural areas have bigger farms where they grow crops (e.g., staple crops) that also provide crop residues.
An interesting observation in our study was that education and a higher number of adult household members played negative roles in the likelihood of implementing minimum or no tillage. Although minimum or no tillage is considered an effective conservation practice in terms of SOC accumulation, such practices might be linked to lower yields [50,85]. A higher number of adult household members might imply that more family labor is available to implement tillage on the farm and therefore decrease the likelihood of implementing minimum/no tillage if it might also lead to lower yields. Nevertheless, the probability of implementing this practice was strongly correlated with the durable assets owned by the households, which might indicate that better-off households can afford to implement this conservation practice even at the expense of potentially higher yields.
Our findings indicate a positive correlation between farm size and the likelihood of adopting minimum tillage as well as a positive relationship between a more rural location and the probability of minimum tillage use. These findings likely interact as farm size is positively correlated with rurality (the Pearson’s correlation coefficient was 0.147, which suggests a significant positive correlation between farm size and the SSI (p = 0.005)). Thus, minimum or no tillage is more likely to be used on bigger farms in more rural locations. In other words, our findings might suggest that smaller farms that are located closer to the urban center are managed more intensively with a lower probability of minimum tillage and mulching on the plot level.

5.5. Limitations and Necessary Research

The survey data indicate the wide usage of fertilizer in the agricultural systems of Bangalore, and our analysis on fertilization practices from published studies in India shows their potential to increase SOC. However, the lack of quantitative data on fertilizer application rates and crop yields limits the explanatory power of the survey data on SOC dynamics. Mulching is associated with decisions in favor of vegetable–fruit and cereal staple crops, both groups contrastingly related to market integration. This demonstrates interactions between crop choice, probability of the adoption of soil conservation practices, and socio-economic variables. Data on the adoption of soil conservation practices for specific crops would be necessary to disentangle the interactions.
The rural–urban index used for this analysis measured urbanization as a combination of distance to the Bangalore city center and the percentage of built-up area [75]. However, even when not living in direct proximity to the city of Bangalore with large built-up areas, road infrastructures and transportation networks as well as household wealth and ownership of vehicles may determine farmers’ access to markets and, in turn, their decisions to cultivate certain (perishable) crops, e.g., vegetables. For example, Damania et al. [86] and Minten et al. [87] found that increasing transaction costs and higher costs of transportation are important factors influencing farmers’ technology choices and farming practices in Nigeria and Ethiopia. Vandercasteelen et al. [88] measured urban proximity as travel time and found that an increased travel time affects the decision-making and productivities of rural dairy farmers who produce for urban markets. Such alternative indicators for urbanization were not considered in our study but were partly addressed by the factor market integration, which showed a good explanatory power for crop choice.

6. Conclusions

The present paper showed important relationships between socio-economic variables, crop choice, and the likelihood of adopting soil conservation practices that contribute to improvements in the SOC pools in Bangalore´s agricultural soils. The cropping of vegetables is increasingly correlated with urbanity, higher market integration, off-farm income, and the ownership of borewells and goes along with intensive management, e.g., the application of mineral fertilizer and irrigation, while increasing the probability of farmers adopting conservation practices, such as mulching and the application of farmyard manure. The cultivation of cereals is negatively associated with market integration and irrigation but positively associated with all measures of soil conservation practices, although it is not associated with rurality. Our results therefore confirmed Hypotheses 1 and 2 but rejected Hypothesis 3. Considering that 66, 48, and 16% of farms adopt farmyard manure applications, minimum tillage, and mulching, respectively, there is further potential to increase these conservation practices in rural–urban Bangalore. Further implementations of conservation practices will depend on the availability of resources, experience with climatic shocks, and alternative income opportunities. Our data reveal that the role of gender, age, and education in farm households should be addressed in the interest of achieving an increased application of soil conservation practices. We show that, in general, regardless of the degree of urbanity, the socio-economic advantages of farmers in Bangalore generally translate into a higher likelihood of improved management practices that will support SOC. Hence, improved farmers’ welfare is a prerequisite for an increased implementation of sustainable agriculture, thus increasing the currently depleted SOC levels in Bangalore.

Author Contributions

Conceptualization, C.W. and V.E.M.-R.; data analysis survey, V.P.; data analysis literature, V.E.M.-R.; writing—original draft preparation, V.E.M.-R., V.P., and C.W.; writing—review and editing, V.E.M.-R.; supervision, C.W. All authors have read and agreed to the published version of the manuscript.

Funding

This research was funded by the German Research Foundation (DFG), grants number 279374797 and WO 1470/3-2 in the framework of the Research Unit FOR2432, ‘Social-Ecological Systems in the Indian Rural–Urban Interface: Functions, Scales, and Dynamics of Transition’ and by the Graduate Program BangaDyn: Rural–Urban Dynamics in Bengaluru, funded by the University of Kassel. V.E.M.R. received additional funding in the framework of the DAAD STIBET PhD program financed by the Federal Foreign Office. The APC was funded by the University of Kassel.

Institutional Review Board Statement

Ethical approval was obtained from the ethical review committee of Göttingen University prior to the survey. There were no objections by the committee concerning the implementation of the data collection.

Informed Consent Statement

Written informed consent was obtained from all farmers involved in the study.

Data Availability Statement

The authors can make the interview data available upon request.

Acknowledgments

We thank Meike Wollni for the funding acquisition that made our survey data collection and analysis possible in the framework of the Research Unit FOR2432, ‘Social-Ecological Systems in the Indian Rural–Urban Interface: Functions, Scales, and Dynamics of Transition’. We thank Manuel Santos Silva for his efforts during the survey data collection and thank our FOR2432 project partners at the University of Agricultural Sciences, Bangalore, for their support of the data collection activities. We are thankful to the farmers who contributed to our survey.

Conflicts of Interest

The authors declare no conflict of interest.

Appendix A

Table A1. Tillage practices implemented in agricultural field studies across India and the effects on SOC concentrations in different cropping systems under rainfed and irrigated agriculture.
Cropping SystemIrrigationConventional Tillage (CT)Reduced Tillage (RT)No Tillage (NT)Significant Effects on SOC for TreatmentsReference
Rice–barley
Rainy season and beginning dry season
RainfedXXXAboveground harvest residues withdrawn: RT > NT > CT; aboveground harvest residues retained: RT > CT > NT[89]
Soybean–pigeon pea; soybean–wheat; maize–pigeon pea; maize–gram
Dry and rainy seasons
RainfedXXXRT > NT > CT[68]
Maize–okra
Rainy season and beginning dry season
RainfedXXXNT + weed mulching > RT + weed burial > CT + weed removal[66]
Sorghum–mung Bean (one every year) Rainy seasonRainfedXX-No tillage effect[50]
Soybean wheat
Dry and rainy seasons
Partially irrigatedXXXNT > RT > CT[67]
Maize–wheat–green gram
Dry and rainy seasons
IrrigatedX-XIn macro- and micro-aggregates NT > CT[90]
Maize–maize–field pea
Dry and rainy seasons
Partially irrigatedX-XNT > CT[91]
Rice–maize–cowpea
Dry and rainy seasons
IrrigatedXX-RT > CT[85]
Rice–Rice
Dry and rainy seasons
IrrigatedXXXRT > NT > CT[92]
Soybean–wheat
Dry and rainy seasons
Not applied-XXDepth 0–5: NT > RT;
Depth 5–15: RT > NT
[93]
X = included tillage treatment; and - = not included in the study.
Table A2. Fertilization practices, crop types, soils, environmental factors, locations, and study periods of the individual studies analyzed.
No.Compared Fertilization PracticesMain CropNumber of Crops in a Rotation Initial SOC
(g kg−1)
Clay (%)pHAnnual Rainfall (mm)Location (India)Duration (Years)Reference
1Min; added min and FYMF. millet3N/A318.5N/ACoimbatore29[56]
2Min; FYM; added min and FYMF. millet13.3N/A5666Bangalore20[48]
3Min; FYM; added min and FYMF. millet23.3N/A5666Bangalore20[48]
4Min; FYM; complementary min and FYMF. millet34N/A5.2922.7Bangalore10[77]
5MinF. millet35.5N/AN/AN/ABangalore10[44]
6Min; FYM; added min and FYMMaize2N/A609N/ABellary23[56]
7Min; added min and FYMMaize24.4148.3650New Dehli44[94]
8Min; complementary min and FYMMaize24257.7650New Dehli4[95]
9Min; complementary min and FYMMaize24.2N/A7.5658Rajasthan6[52]
Min = mineral fertilization; FYM = farmyard manure; complementary min and FYM = mineral fertilization and FYM added up to the total recommended N dose for the specific crop; and added min and FYM = combination of total recommended N mineral fertilization with additional FYM.
Figure A1. Map of the study transects used for the farmers’ household interviews. Source: Own illustration based on survey data.
Sustainability 14 05775 g0a1
Table A3. Crops contained in crop categories used for the analysis of socio-economic survey data from farmers in the northern and southern transects of Bangalore.
CategoryCrop
Cereals
Jowar/sorghum/jola
Maize
Paddy/rice
Ragi/finger millet
Small millet
Wheat
Pulses
Avare/lablab
Bengal gram/chickpea
Black gram
Cluster beans
Cowpea/alasunde
Green gram/mung bean/masur/tharguni
Ground nut/peanut
Horse gram/hulli kalu/hurali/urali kal
Masoor
Tur/ahar/red gram/pigeon pea/cajanus cajan/togari
Velvet bean
Vegetables
Amaranth, amaranthus
Beans/field bean
Beet root
Bitter gourd/haagalakaayi
Brinjal/eggplant
Cabbage
Capsicum
Carrot
Cauliflower
Chikidikaayi/bean/vine
Chilli, green chilli
Cucumber
Dantu (leafy vegetable)
Drumstick/moringa
Garlic
Harave soppu (leafy vegetable)
Ivy gourd/thondekayi
Ladiesfinger/okra
Maize (sweet/baby corn)
Onion
Potato/allu/aloo
Pumpkin
Raddish
Ridge gourd/hire gida hee/irekai/heere kayi
Sabbbakki/dillseed (leafy vegetable)
Snake gourd
Soregida/bottle gourd
Spinach/palak
Tomato
Turnip
Fruits
Arecanut
Banana
Coconut
Grapes
Guava
Jackfruit/halasina
Lemon/citrus
Mango
Papaya
Pomegranate
Sapota
Herbs and spices
Basil, basil leaves
Castor
Coriander
Curry leaf/curry leaves
Dill
Fenugreek/menthya
Ginger
Huchellu/nitella
Mustard
Niger seed
Sesamum
Flowers
Batha flower
Button flower
Chanduvva flower/marigold
Chrysanthemum
Crossandra flower
Flower general
Gladiolus
Gerbera
Jasmine
Kakada flower
Rose
Sunflower
Fodder
Napier grass
Non-food commercial
Acacia
Eucalyptus/nilagiri tree
Forest/timber
Mulberry
Ornamental plants
Palm
Silk
Silver oak
Teak
Sugar cane
Lawn/turf grass
Table A4. Association between independent variables, crop choices, and farmers’ adoption of soil conservation practices in the northern and southern transects of Bangalore; N = 558; plot-level).
Mulching/Crop Residues/Cover CropsFarmyard ManureMinimum/No Tillage
Decision-Maker Characteristics
Female (1 = yes)−0.044 (0.037)−0.045 (0.051)−0.087 * (0.053)
Age (years)−0.005 *** (0.001)−0.002 (0.002)0.001 (0.002)
Education (years)−0.004 (0.004)−0.007 (0.005)−0.012 ** (0.005)
Household Characteristics
Non-marginal caste (1 = yes)−0.031 (0.037)0.062 (0.053)−0.113 ** (0.056)
No. of adults (HH members ≥ 15 years)0.006 (0.006)0.009 (0.008)−0.015 (0.010)
Durable assets owned (count)−0.001 (0.002)0.002 (0.003)0.016 *** (0.003)
Off-farm income (1 = yes)0.046 * (0.028)−0.005 (0.041)0.046 (0.042)
Dairy (1 = yes)−0.045 (0.032)0.185 *** (0.044)0.012 (0.050)
Livestock (1 = yes)0.045 (0.028)0.138 *** (0.041)−0.057 (0.043)
Owned borewell (1 = yes)0.107 *** (0.033)−0.026 (0.048)0.070 (0.050)
Location
Rural–urban index (SSI) 10.215 ** (0.093)−0.092 (0.131)0.331 ** (0.136)
Northern transect (1 = yes)0.008 (0.030)0.050 (0.045)0.129 *** (0.045)
Plot Characteristics
Plot size (ha)0.003 (0.011)−0.042 * (0.026)0.041 (0.025)
Marketing crop from plot (1 = yes)0.129 *** (0.036)0.061 (0.051)0.046 (0.052)
Cereals plot (1 = yes)0.114 *** (0.037)0.107 * (0.058)0.322 *** (0.056)
Pulses plot (1 = yes)0.130 *** (0.029)0.018 (0.045)0.008 (0.047)
Vegetable plot (1 = yes)0.077 * (0.042)0.110 (0.076)0.111 (0.075)
Fruit plot (1 = yes)0.114 *** (0.039)0.097 (0.068)0.072 (0.064)
Flower plot (1 = yes)−0.128 (0.106)−0.024 (0.131)0.089 (0.133)
Herbs and spices plot (1 = yes)−0.171 ** (0.083)0.035 (0.089)−0.033 (0.101)
Non-food commercial plot (1 = yes)−0.017 (0.052)−0.041 (0.073)0.038 (0.076)
Fodder plot (1 = yes)−0.073 (0.058)0.124 (0.079)0.054 (0.076)
N558558558
Pseudo R20.1970.08890.102
Wald chi270.3258.3972.04
Log pseudolikelihood−176.9−326.6−341.4
Note: Results of probit models. Average marginal effects reported with robust standard errors in parentheses. Significance levels reported with * (p < 0.1), ** (p < 0.05), and *** (p < 0.01). HH stands for household. 1 The SSI takes a value between 0 and 1; 1 stands for most rural and 0 indicates most urban.

References

  1. Oldfield, E.E.; Bradford, M.A.; Wood, S.A. Global Meta-Analysis of the Relationship between Soil Organic Matter and Crop Yields. SOIL 2019, 5, 15–32. [Google Scholar] [CrossRef] [Green Version]
  2. Seto, K.C.; Ramankutty, N. Hidden Linkages between Urbanization and Food Systems. Science 2016, 352, 943–945. [Google Scholar] [CrossRef] [PubMed]
  3. Bouroncle, C.; Imbach, P.; Rodríguez-Sánchez, B.; Medellín, C.; Martinez-Valle, A.; Läderach, P. Mapping Climate Change Adaptive Capacity and Vulnerability of Smallholder Agricultural Livelihoods in Central America: Ranking and Descriptive Approaches to Support Adaptation Strategies. Clim. Chang. 2017, 141, 123–137. [Google Scholar] [CrossRef] [Green Version]
  4. Gbetibouo, G.A.; Ringler, C.; Hassan, R. Vulnerability of the South African Farming Sector to Climate Change and Variability: An Indicator Approach: Vulnerability of the South African Farming Sector to Climate Change and Variability. Nat. Resour. Forum 2010, 34, 175–187. [Google Scholar] [CrossRef]
  5. Parker, L.; Bourgoin, C.; Martinez-Valle, A.; Läderach, P. Vulnerability of the Agricultural Sector to Climate Change: The Development of a Pan-Tropical Climate Risk Vulnerability Assessment to Inform Sub-National Decision Making. PLoS ONE 2019, 14, e0213641. [Google Scholar] [CrossRef] [Green Version]
  6. Kumar, P.; Geneletti, D.; Nagendra, H. Spatial Assessment of Climate Change Vulnerability at City Scale: A Study in Bangalore, India. Land Use Policy 2016, 58, 514–532. [Google Scholar] [CrossRef]
  7. Satterthwaite, D.; McGranahan, G.; Tacoli, C. Urbanization and Its Implications for Food and Farming. Phil. Trans. R. Soc. B 2010, 365, 2809–2820. [Google Scholar] [CrossRef]
  8. Lal, R. Soil Carbon Sequestration in India. Clim. Chang. 2004, 65, 20. [Google Scholar] [CrossRef]
  9. Oelbermann, M.; Paul Voroney, R.; Gordon, A.M. Carbon Sequestration in Tropical and Temperate Agroforestry Systems: A Review with Examples from Costa Rica and Southern Canada. Agric. Ecosyst. Environ. 2004, 104, 359–377. [Google Scholar] [CrossRef]
  10. Paustian, K.; Lehmann, J.; Ogle, S.; Reay, D.; Robertson, G.P.; Smith, P. Climate-Smart Soils. Nature 2016, 532, 49–57. [Google Scholar] [CrossRef] [Green Version]
  11. Fujisaki, K.; Chevallier, T.; Chapuis-Lardy, L.; Albrecht, A.; Razafimbelo, T.; Masse, D.; Ndour, Y.B.; Chotte, J.-L. Soil Carbon Stock Changes in Tropical Croplands Are Mainly Driven by Carbon Inputs: A Synthesis. Agric. Ecosyst. Environ. 2018, 259, 147–158. [Google Scholar] [CrossRef]
  12. Yadvinder-Singh; Bijay-Singh; Timsina, J. Crop Residue Management for Nutrient Cycling and Improving Soil Productivity in Rice-Based Cropping Systems in the Tropics. In Advances in Agronomy; Elsevier: Amsterdam, The Netherlands, 2005; Volume 85, pp. 269–407. ISBN 978-0-12-000783-7. [Google Scholar]
  13. Powlson, D.S.; Whitmore, A.P.; Goulding, K.W.T. Soil Carbon Sequestration to Mitigate Climate Change: A Critical Re-Examination to Identify the True and the False. Eur. J. Soil Sci. 2011, 62, 42–55. [Google Scholar] [CrossRef]
  14. Liu, D.L.; Zeleke, K.T.; Wang, B.; Macadam, I.; Scott, F.; Martin, R.J. Crop Residue Incorporation Can Mitigate Negative Climate Change Impacts on Crop Yield and Improve Water Use Efficiency in a Semiarid Environment. Eur. J. Agron. 2017, 85, 51–68. [Google Scholar] [CrossRef] [Green Version]
  15. Patil, V.S.; Thomas, B.K.; Lele, S.; Eswar, M.; Srinivasan, V. Adapting or Chasing Water? Crop Choice and Farmers’ Responses to Water Stress in Peri-Urban Bangalore, India: ADAPTING OR CHASING WATER? Irrig. Drain. 2019, 68, 140–151. [Google Scholar] [CrossRef] [Green Version]
  16. Kurgat, B.K.; Ngenoh, E.; Bett, H.K.; Stöber, S.; Mwonga, S.; Lotze-Campen, H.; Rosenstock, T.S. Drivers of Sustainable Intensification in Kenyan Rural and Peri-Urban Vegetable Production. Int. J. Agric. Sustain. 2018, 16, 385–398. [Google Scholar] [CrossRef] [Green Version]
  17. Steinhübel, L.; von Cramon-Taubadel, S. Somewhere in between Towns, Markets and Jobs—Agricultural Intensification in the Rural–Urban Interface. J. Dev. Stud. 2021, 57, 669–694. [Google Scholar] [CrossRef]
  18. Lee, D.R. Agricultural Sustainability and Technology Adoption: Issues and Policies for Developing Countries. Am. J. Agric. Econ. 2005, 87, 1325–1334. [Google Scholar] [CrossRef]
  19. Narayana, M.R. Globalization and Urban Economic Growth: Evidence for Bangalore, India: Debates and Developments. Int. J. Urban Reg. Res. 2011, 35, 1284–1301. [Google Scholar] [CrossRef]
  20. Kraas, F.; Mertins, G. Megacities and Global Change. In Megacities; Kraas, F., Aggarwal, S., Coy, M., Mertins, G., Eds.; Springer Netherlands: Dordrecht, The Netherlands, 2014; pp. 1–6. ISBN 978-90-481-3416-8. [Google Scholar]
  21. Rao, P.P.; Birthal, P.S.; Joshi, P.K.; Kar, D. Agricultural Diversification towards High-Value Commodities and Role of Urbanisation in India. In Agricultural Diversification and Smallholders in South Asia; Joshi, P.K., Gulati, A., Cummings, R., Jr., Eds.; Academic Foundation: New Delhi, India, 2007; pp. 243–270. [Google Scholar]
  22. Sudhira, H.S.; Nagendra, H. Local Assessment of Bangalore: Graying and Greening in Bangalore—Impacts of Urbanization on Ecosystems, Ecosystem Services and Biodiversity. In Urbanization, Biodiversity and Ecosystem Services: Challenges and Opportunities; Elmqvist, T., Fragkias, M., Goodness, J., Güneralp, B., Marcotullio, P.J., McDonald, R.I., Parnell, S., Schewenius, M., Sendstad, M., Seto, K.C., et al., Eds.; Springer: Dordrecht, The Netherlands, 2013; pp. 75–91. ISBN 978-94-007-7087-4. [Google Scholar]
  23. Ramachandra, T.V.; Sellers, J.; Bharath, H.A.; Setturu, B. Micro Level Analyses of Environmentally Disastrous Urbanization in Bangalore. Environ. Monit Assess 2019, 191, 787. [Google Scholar] [CrossRef]
  24. Obalum, S.E.; Chibuike, G.U.; Peth, S.; Ouyang, Y. Soil Organic Matter as Sole Indicator of Soil Degradation. Environ. Monit Assess 2017, 189, 176. [Google Scholar] [CrossRef]
  25. Leff, B.; Ramankutty, N.; Foley, J.A. Geographic Distribution of Major Crops across the World: Global Crop Distribution. Glob. Biogeochem. Cycles 2004, 18, 1–27. [Google Scholar] [CrossRef]
  26. Drechsel, P.; Zimmermann, U. Factors Influencing the Intensification of Farming Systems and Soil-nutrient Management in the Rural-urban Continuum of SW Ghana. Z. Pflanzenernähr. Bodenk. 2005, 168, 694–702. [Google Scholar] [CrossRef]
  27. Seneviratne, G.; Van Holm, L.H.J.; Kulasooriya, S.A. Quality of Different Mulch Materials and Their Decomposition and N Release under Low Moisture Regimes. Biol. Fertil. Soils 1997, 26, 136–140. [Google Scholar] [CrossRef]
  28. Palm, C.A.; Gachengo, C.N.; Delve, R.J.; Cadisch, G.; Giller, K.E. Organic Inputs for Soil Fertility Management in Tropical Agroecosystems: Application of an Organic Resource Database. Agric. Ecosyst. Environ. 2001, 83, 27–42. [Google Scholar] [CrossRef]
  29. Fontaine, S.; Barot, S.; Barré, P.; Bdioui, N.; Mary, B.; Rumpel, C. Stability of Organic Carbon in Deep Soil Layers Controlled by Fresh Carbon Supply. Nature 2007, 450, 277–280. [Google Scholar] [CrossRef]
  30. Moran-Rodas, V.E.; Chavannavar, S.V.; Joergensen, R.G.; Wachendorf, C. Microbial Response of Distinct Soil Types to Land-Use Intensification at a South-Indian Rural-Urban Interface. Plant Soil 2022, 473, 389–405. [Google Scholar] [CrossRef]
  31. Liang, C.; Schimel, J.P.; Jastrow, J.D. The Importance of Anabolism in Microbial Control over Soil Carbon Storage. Nat. Microbiol. 2017, 2, 17105. [Google Scholar] [CrossRef]
  32. Bardgett, R.D.; Mommer, L.; De Vries, F.T. Going Underground: Root Traits as Drivers of Ecosystem Processes. Trends Ecol. Evol. 2014, 29, 692–699. [Google Scholar] [CrossRef]
  33. Manjaiah, K.M.; Voroney, R.P.; Sen, U. Soil Organic Carbon Stocks, Storage Profile and Microbial Biomass under Different Crop Management Systems in a Tropical Agricultural Ecosystem. Biol. Fertil. Soils 2000, 32, 273–278. [Google Scholar] [CrossRef]
  34. Mapa, R.B.; Gunasena, H.P.M. Effect of Alley Cropping on Soil Aggregate Stability of a Tropical Alfisol. Agrofor. Syst. 1995, 32, 237–245. [Google Scholar] [CrossRef]
  35. Tian, G.; Kang, B.T.; Kolawole, G.O.; Idinoba, P.; Salako, F.K. Long-Term Effects of Fallow Systems and Lengths on Crop Production and Soil Fertility Maintenance in West Africa. Nutr. Cycl. Agroecosyst. 2005, 71, 139–150. [Google Scholar] [CrossRef]
  36. Follain, S.; Walter, C.; Legout, A.; Lemercier, B.; Dutin, G. Induced Effects of Hedgerow Networks on Soil Organic Carbon Storage within an Agricultural Landscape. Geoderma 2007, 142, 80–95. [Google Scholar] [CrossRef]
  37. Radrizzani, A.; Shelton, H.M.; Dalzell, S.A.; Kirchhof, G. Soil Organic Carbon and Total Nitrogen under Leucaena Leucocephala Pastures in Queensland. Crop Pasture Sci. 2011, 62, 337. [Google Scholar] [CrossRef]
  38. Nath, A.J.; Brahma, B.; Sileshi, G.W.; Das, A.K. Impact of Land Use Changes on the Storage of Soil Organic Carbon in Active and Recalcitrant Pools in a Humid Tropical Region of India. Sci. Total Environ. 2018, 624, 908–917. [Google Scholar] [CrossRef] [PubMed]
  39. Chaudhary, R.S.; Somasundaram, J.; Mandal, K.G.; Hati, K.M. Enhancing Water and Phosphorus Use Efficiency Through Moisture Conservation Practices and Optimum Phosphorus Application in Rainfed Maize–Chickpea System in Vertisols of Central India. Agric. Res. 2018, 7, 176–186. [Google Scholar] [CrossRef]
  40. Srinivasarao, C.; Lal, R.; Kundu, S.; Babu, M.B.B.P.; Venkateswarlu, B.; Singh, A.K. Soil Carbon Sequestration in Rainfed Production Systems in the Semiarid Tropics of India. Sci. Total Environ. 2014, 487, 587–603. [Google Scholar] [CrossRef]
  41. Seneviratne, G. Litter Quality and Nitrogen Release in Tropical Agriculture: A Synthesis. Biol. Fertil. Soils 2000, 31, 60–64. [Google Scholar] [CrossRef]
  42. Bhardwaj, R.L. Effect of Mulching on Crop Production under Rainfed Condition—A Review. Agri. Rev. 2013, 34, 188. [Google Scholar] [CrossRef]
  43. Lal, R. Managing Soil Water to Improve Rainfed Agriculture in India. J. Sustain. Agric. 2008, 32, 51–75. [Google Scholar] [CrossRef]
  44. Manna, M.C.; Ghosh, P.K.; Acharya, C.L. Sustainable Crop Production Through Management of Soil Organic Carbon in Semiarid and Tropical India. J. Sustain. Agric. 2003, 21, 85–114. [Google Scholar] [CrossRef]
  45. Prasad, C.S.; Anandan, S.; Gowda, N.K.S.; Schlecht, E.; Buerkert, A. Managing Nutrient Flows in Indian Urban and Peri-Urban Livestock Systems. Nutr. Cycl. Agroecosyst. 2019, 115, 159–172. [Google Scholar] [CrossRef]
  46. Thilakarathna, M.; Raizada, M. A Review of Nutrient Management Studies Involving Finger Millet in the Semi-Arid Tropics of Asia and Africa. Agronomy 2015, 5, 262–290. [Google Scholar] [CrossRef] [Green Version]
  47. Agegnehu, G.; Amede, T. Integrated Soil Fertility and Plant Nutrient Management in Tropical Agro-Ecosystems: A Review. Pedosphere 2017, 27, 662–680. [Google Scholar] [CrossRef]
  48. Sathish, A.; Ramachandrappa, B.K.; Shankar, M.A.; Srikanth Babu, P.N.; Srinivasarao, C.; Sharma, K.L. Long-Term Effects of Organic Manure and Manufactured Fertilizer Additions on Soil Quality and Sustainable Productivity of Finger Millet under a Finger Millet-Groundnut Cropping System in Southern India. Soil Use Manag. 2016, 32, 311–321. [Google Scholar] [CrossRef]
  49. Anand, K.G.V.; Kubavat, D.; Trivedi, K.; Agarwal, P.K.; Wheeler, C.; Ghosh, A. Long-Term Application of Jatropha Press Cake Promotes Seed Yield by Enhanced Soil Organic Carbon Accumulation, Microbial Biomass and Enzymatic Activities in Soils of Semi-Arid Tropical Wastelands. Eur. J. Soil Biol. 2015, 69, 57–65. [Google Scholar] [CrossRef] [Green Version]
  50. Sharma, K.L.; Grace, J.K.; Srinivas, K.; Venkateswarlu, B.; Korwar, G.R.; Sankar, G.M.; Mandal, U.K.; Ramesh, V.; Bindu, V.H.; Madhavi, M.; et al. Influence of Tillage and Nutrient Sources on Yield Sustainability and Soil Quality under Sorghum–Mung Bean System in Rainfed Semi-arid Tropics. Commun. Soil Sci. Plant Anal. 2009, 40, 2579–2602. [Google Scholar] [CrossRef]
  51. Nayak, P.; Patel, D.; Ramakrishnan, B.; Mishra, A.K.; Samantaray, R.N. Long-Term Application Effects of Chemical Fertilizer and Compost on Soil Carbon under Intensive Rice–Rice Cultivation. Nutr. Cycl. Agroecosyst. 2009, 83, 259–269. [Google Scholar] [CrossRef]
  52. Srinivasarao, C.; Kundu, S.; Kumpawat, B.S.; Kothari, A.K.; Sodani, S.N.; Sharma, S.K.; Abrol, V.; Ravindra Chary, G.; Thakur, P.B.; Yashavanth, B.S. Soil Organic Carbon Dynamics and Crop Yields of Maize (Zea Mays)–Black Gram (Vigna Mungo) Rotation-Based Long Term Manurial Experimental System in Semi-Arid Vertisols of Western India. Trop. Ecol. 2019, 60, 433–446. [Google Scholar] [CrossRef]
  53. Chianu, J.N.; Chianu, J.N.; Mairura, F. Mineral Fertilizers in the Farming Systems of Sub-Saharan Africa. A Review. Agron. Sustain. Dev. 2012, 32, 545–566. [Google Scholar] [CrossRef] [Green Version]
  54. Banger, K.; Toor, G.S.; Biswas, A.; Sidhu, S.S.; Sudhir, K. Soil Organic Carbon Fractions after 16-Years of Applications of Fertilizers and Organic Manure in a Typic Rhodalfs in Semi-Arid Tropics. Nutr. Cycl. Agroecosyst. 2010, 86, 391–399. [Google Scholar] [CrossRef]
  55. Yagi, R.; Ferreira, M.E.; da Cruz, M.C.P.; Barbosa, J.C.; Araújo, L.A.N. de Soil Organic Matter as a Function of Nitrogen Fertilization in Crop Successions. Sci. Agric. 2005, 62, 374–380. [Google Scholar] [CrossRef] [Green Version]
  56. Vineela, C.; Wani, S.P.; Srinivasarao, C.; Padmaja, B.; Vittal, K.P.R. Microbial Properties of Soils as Affected by Cropping and Nutrient Management Practices in Several Long-Term Manurial Experiments in the Semi-Arid Tropics of India. Appl. Soil Ecol. 2008, 40, 165–173. [Google Scholar] [CrossRef] [Green Version]
  57. Tian, H.; Lu, C.; Melillo, J.; Ren, W.; Huang, Y.; Xu, X.; Liu, M.; Zhang, C.; Chen, G.; Pan, S.; et al. Food Benefit and Climate Warming Potential of Nitrogen Fertilizer Uses in China. Environ. Res. Lett. 2012, 7, 44020. [Google Scholar] [CrossRef]
  58. Sojka, R.E.; Bjorneberg, D.L.; Strelkoff, T.S. Irrigation-Induced Erosion. In Agronomy Monographs; Lascano, R.J., Sojka, R.E., Eds.; American Society of Agronomy; Crop Science Society of America; Soil Science Society of America: Madison, WI, USA, 2007; pp. 237–275. ISBN 978-0-89118-264-1. [Google Scholar]
  59. Environmental Management & Policy Research Institute. State of Environment Report Karnataka. 2015. Available online: https://karunadu.karnataka.gov.in/forestsecretariat/Downloads/SoER_2015.pdf (accessed on 8 January 2021).
  60. Patil, S.L.; Sheelavantar, M.N. Effect of Cultural Practices on Soil Properties, Moisture Conservation and Grain Yield of Winter Sorghum (Sorghum Bicolar L. Moench) in Semi-Arid Tropics of India. Agric. Water Manag. 2004, 64, 49–67. [Google Scholar] [CrossRef]
  61. Patil, S. Urbanisation and New Agroecologies. Econ. Political Wkly. 2018, 53, 71–77. [Google Scholar]
  62. Kulkarni, T.; Gassmann, M.; Kulkarni, C.M.; Khed, V.; Buerkert, A. Deep Drilling for Groundwater in Bengaluru, India: A Case Study on the City’s Over-Exploited Hard-Rock Aquifer System. Sustainability 2021, 13, 12149. [Google Scholar] [CrossRef]
  63. Ghimire, R.; Lamichhane, S.; Acharya, B.S.; Bista, P.; Sainju, U.M. Tillage, Crop Residue, and Nutrient Management Effects on Soil Organic Carbon in Rice-Based Cropping Systems: A Review. J. Integr. Agric. 2017, 16, 1–15. [Google Scholar] [CrossRef]
  64. Conservation Technology Information Center (CTIC). Tillage Type Definitions. 2002. Available online: https://www.mssoy.org/uploads/files/ctic.pdf (accessed on 1 March 2022).
  65. Mehra, P.; Baker, J.; Sojka, R.E.; Bolan, N.; Desbiolles, J.; Kirkham, M.B.; Ross, C.; Gupta, R. A Review of Tillage Practices and Their Potential to Impact the Soil Carbon Dynamics. In Advances in Agronomy; Elsevier: Amsterdam, The Netherlands, 2018; Volume 150, pp. 185–230. ISBN 978-0-12-815175-4. [Google Scholar]
  66. Pandey, C.B.; Chaudhari, S.K.; Dagar, J.C.; Singh, G.B.; Singh, R.K. Soil N Mineralization and Microbial Biomass Carbon Affected by Different Tillage Levels in a Hot Humid Tropic. Soil Tillage Res. 2010, 110, 33–41. [Google Scholar] [CrossRef]
  67. Kushwa, V.; Hati, K.M.; Sinha, N.K.; Singh, R.K.; Mohanty, M.; Somasundaram, J.; Jain, R.C.; Chaudhary, R.S.; Biswas, A.K.; Patra, A.K. Long-Term Conservation Tillage Effect on Soil Organic Carbon and Available Phosphorous Content in Vertisols of Central India. Agric. Res. 2016, 5, 353–361. [Google Scholar] [CrossRef]
  68. Kumar, A.; Mishra, V.N.; Biswas, A.K.; Somasundaram, J. Soil Organic Carbon, Dehydrogenase Activity and Fluorescein Diacetate as Influenced by Contrasting Tillage and Cropping Systems in Vertisols of Central India. JEB 2018, 39, 1047–1053. [Google Scholar] [CrossRef]
  69. R Core Team. R: A Language and Environment for Statistical Computing; R Foundation for Statistical Computing: Vienna, Austria, 2019; Available online: https://www.R-project.org (accessed on 2 March 2022).
  70. Directorate of Census Operations Karnataka. District Census Handbook Bangalore. District Census Handbook Bangalore. Village and Town Directory. (Series 30 PART XII-A). Government of India 2011a. Available online: https://censusindia.gov.in/2011census/dchb/2918_PART_A_DCHB_BANGALORE.pdf (accessed on 6 January 2021).
  71. Population Stat. Bangalore, India Population. Available online: https://populationstat.com/india/bangalore (accessed on 9 September 2021).
  72. Sudhira, H.S.; Ramachandra, T.V.; Subrahmanya, M.H.B. Bangalore. Cities 2007, 24, 379–390. [Google Scholar] [CrossRef]
  73. Directorate of Census Operations Karnataka. District Census Handbook Bangalore Rural. Village and Town Directory (Series-30 Part XII-A). Government of India. 2011. Available online: https://censusindia.gov.in/2011census/dchb/2929_PART_A_DCHB_BANGALORE%20RURAL.pdf (accessed on 6 January 2021).
  74. Directorate of Census Operations Karnataka. District Census Handbook Ramanagara. Village and Town Directory (Series-30 Part XII-A). Government of India. 2011. Available online: https://censusindia.gov.in/2011census/dchb/2930_PART_A_DCHB_RAMANAGARA.pdf (accessed on 6 January 2021).
  75. Hoffmann, E.; Jose, M.; Nölke, N.; Möckel, T. Construction and Use of a Simple Index of Urbanisation in the Rural–Urban Interface of Bangalore, India. Sustainability 2017, 9, 2146. [Google Scholar] [CrossRef] [Green Version]
  76. Wooldridge, J.M. Econometric Analysis of Cross Section and Panel Data; MIT Press: Cambridge, MA, USA, 2010; ISBN 0-262-29679-9. [Google Scholar]
  77. Prasad, J.V.N.S.; Rao, C.S.; Srinivas, K.; Jyothi, C.N.; Venkateswarlu, B.; Ramachandrappa, B.K.; Dhanapal, G.N.; Ravichandra, K.; Mishra, P.K. Effect of Ten Years of Reduced Tillage and Recycling of Organic Matter on Crop Yields, Soil Organic Carbon and Its Fractions in Alfisols of Semi Arid Tropics of Southern India. Soil Tillage Res. 2016, 156, 131–139. [Google Scholar] [CrossRef]
  78. Bon, H.; Parrot, L.; Moustier, P. Sustainable Urban Agriculture in Developing Countries. A Review. Agron. Sustain. Dev. 2010, 30, 21–32. [Google Scholar] [CrossRef] [Green Version]
  79. Pingali, P. Westernization of Asian Diets and the Transformation of Food Systems: Implications for Research and Policy. Food Policy 2007, 32, 281–298. [Google Scholar] [CrossRef] [Green Version]
  80. Masto, R.E.; Chhonkar, P.K.; Singh, D.; Patra, A.K. Changes in Soil Quality Indicators under Long-Term Sewage Irrigation in a Sub-Tropical Environment. Environ. Geol. 2009, 56, 1237–1243. [Google Scholar] [CrossRef]
  81. Koluvek, P.K.; Tanji, K.K.; Trout, T.J. Overview of Soil Erosion from Irrigation. J. Irrig. Drain. Eng. 1993, 119, 929–946. [Google Scholar] [CrossRef]
  82. Fernandez-Gomez, R.; Mateos, L.; Giraldez, J.V. Furrow Irrigation Erosion and Management. Irrig. Sci. 2004, 23, 123–131. [Google Scholar] [CrossRef]
  83. de Bruin, S.; Dengerink, J.; van Vliet, J. Urbanisation as Driver of Food System Transformation and Opportunities for Rural Livelihoods. Food Sec. 2021, 13, 781–798. [Google Scholar] [CrossRef]
  84. Pradhan, S.; Niti, G.; Jain, A.; Patel, N. Sustainable Agriculture in India 2021: What We Know and How to Scale up; Council on Energy, Environment and Water: New Delhi, India, 2021. [Google Scholar]
  85. Neogi, S.; Bhattacharyya, P.; Roy, K.S.; Panda, B.B.; Nayak, A.K.; Rao, K.S.; Manna, M.C. Soil Respiration, Labile Carbon Pools, and Enzyme Activities as Affected by Tillage Practices in a Tropical Rice–Maize–Cowpea Cropping System. Environ. Monit. Assess. 2014, 186, 4223–4236. [Google Scholar] [CrossRef]
  86. Damania, R.; Berg, C.; Russ, J.; Federico Barra, A.; Nash, J.; Ali, R. Agricultural Technology Choice and Transport. Am. J. Agric. Econ. 2017, 99, 265–284. [Google Scholar] [CrossRef] [Green Version]
  87. Minten, B.; Koru, B.; Stifel, D. The Last Mile(s) in Modern Input Distribution: Pricing, Profitability, and Adoption. Agric. Econ. 2013, 44, 629–646. [Google Scholar] [CrossRef]
  88. Vandercasteelen, J.; Minten, B.; Tamru, S. Urban Proximity, Access to Value Chains, and Dairy Productivity in Ethiopia. Agric. Econ. 2021, 52, 665–678. [Google Scholar] [CrossRef]
  89. Kushwaha, C.P.; Tripathi, S.K.; Singh, K.P. Soil Organic Matter and Water-Stable Aggregates under Different Tillage and Residue Conditions in a Tropical Dryland Agroecosystem. Appl. Soil Ecol. 2001, 16, 229–241. [Google Scholar] [CrossRef]
  90. Modak, K.; Biswas, D.R.; Ghosh, A.; Pramanik, P.; Das, T.K.; Das, S.; Kumar, S.; Krishnan, P.; Bhattacharyya, R. Zero Tillage and Residue Retention Impact on Soil Aggregation and Carbon Stabilization within Aggregates in Subtropical India. Soil Tillage Res. 2020, 202, 104649. [Google Scholar] [CrossRef]
  91. Yadav, G.S.; Das, A.; Babu, S.; Mohapatra, K.P.; Lal, R.; Rajkhowa, D. Potential of Conservation Tillage and Altered Land Configuration to Improve Soil Properties, Carbon Sequestration and Productivity of Maize Based Cropping System in Eastern Himalayas, India. Int. Soil Water Conserv. Res. 2021, 9, 279–290. [Google Scholar] [CrossRef]
  92. Yadav, G.; Datta, R.; Imran Pathan, S.; Lal, R.; Meena, R.; Babu, S.; Das, A.; Bhowmik, S.; Datta, M.; Saha, P.; et al. Effects of Conservation Tillage and Nutrient Management Practices on Soil Fertility and Productivity of Rice (Oryza Sativa L.)–Rice System in North Eastern Region of India. Sustainability 2017, 9, 1816. [Google Scholar] [CrossRef] [Green Version]
  93. Lenka, S.; Lenka, N.K.; Singh, R.C.; Manna, M.C.; Misra, A.K.; Rautaray, S.K. Tillage and Manure Induced Changes in Carbon Storage and Carbon Management Index in Soybean–Wheat Cropping System in the Vertisols of Central India. Natl. Acad. Sci. Lett. 2015, 38, 461–464. [Google Scholar] [CrossRef]
  94. Ghosh, A.; Bhattacharyya, R.; Meena, M.C.; Dwivedi, B.S.; Singh, G.; Agnihotri, R.; Sharma, C. Long-Term Fertilization Effects on Soil Organic Carbon Sequestration in an Inceptisol. Soil Tillage Res. 2018, 177, 134–144. [Google Scholar] [CrossRef]
  95. Verma, B.C.; Datta, S.P.; Rattan, R.K.; Singh, A.K. Monitoring Changes in Soil Organic Carbon Pools, Nitrogen, Phosphorus, and Sulfur under Different Agricultural Management Practices in the Tropics. Environ. Monit. Assess. 2010, 171, 579–593. [Google Scholar] [CrossRef]
Figure 1. Increases in SOC (g kg−1) relative to control soils (∆SOC) from different fertilization management treatments (min = mineral fertilization; FYM = farmyard manure; complementary = min and FYM added up to the total recommended N dose for the specific crop; added = combination of total recommended N mineral fertilization with additional FYM) in maize and finger millet cropping systems in India using data provided from the studies described in Table A2. Different letters represent significant differences between the treatments after analyses of variance, and asterisks represent significant differences from zero after individual one-sample t tests (p < 0.05).
Sustainability 14 05775 g001
Figure 2. Relationships between finger millet grain yields and SOC concentrations (r = 0.82; p < 0.001) with data from different fertilization treatments, including controls. Data obtained from Sathish et al. [48] and Prasad et al. [77].
Sustainability 14 05775 g002
Figure 3. Percent of crops irrigated by crop category by farm households in the northern and southern transects of Bangalore (N = 1091; crop level).
Sustainability 14 05775 g003
Figure 4. Percentage of crops fertilized by fertilizer type by crop category by farm households in the northern and southern transects of Bangalore (N = 1091; crop level).
Sustainability 14 05775 g004
Table 1. Input additions in ranges and calculated means for N, P, K, and farmyard manure, corresponding to fertilization treatments for finger millet and maize cropping systems in India from selected individual studies *; number of experiments per crop; and percentage of total studies with significant treatment effect on SOC content compared to control soils.
Treatment 1Input Range (kg ha−1)Mean Input (kg ha−1)No. of ExperimentsStudies (%) with Treatment Effect on SOC Content
F. MilletMaizeF. MilletMaizeF. MilletMaizeF. MilletMaize
Mineral fertilization (Min)50 N
50 P
25 K
60–120 N
26–60 P
40–50 K
50 N
50 P
25 K
100 N
39 P
45 K
5460%50%
Farmyard manure (FYM)50 N31 N50 N31 N31100%0%
Complementary
Min and FYM
25 N (Min) + 25 N (FYM)25–90 N (Min) +
25–30 N (FYM)
25 N (Min) + 25 N (FYM)41 N (Min) + 28 N (FYM)12100%100%
Added
Min and FYM
50 N (Min) +
50 N (FYM)
100–120 N (Min) + 25–31 N (FYM)50 N (Min) +
50 N (FYM)
110 N (Min) +
28 N (FYM)
32100%100%
* Fertilization practices, crop types, soils, environmental factors, locations, study periods, and references of the selected individual studies are provided in Table A2. 1 Complementary Min and FYM = mineral fertilization and FYM added up to the total recommended N dose for the specific crop; added Min and FYM = combination of total recommended N mineral fertilization with additional FYM.
Table 2. Summary statistics of dependent variables with respect to the adoption of farm management practices used in analysis (N = 362; household level).
MeanStd. dev.MinMax
Irrigation (1 = yes)0.3650.48201
Conservation Practices
Minimum/no tillage (1 = yes)0.4830.50001
Mulching/crop residues/cover crops (1 = yes)0.1600.36701
Farmyard manure (1 = yes)0.6600.47401
Crop Choice
Cereals (1 = yes)0.8560.35101
Pulses (1 = yes)0.4720.50001
Vegetables (1 = yes)0.1490.35701
Fruits (1 = yes)0.1910.39301
Flowers (1 = yes)0.0410.20001
Herbs and spices (1 = yes)0.0720.25901
Non-food commercial (1 = yes)0.1600.36701
Fodder (1 = yes)0.1460.35401
Lawn/turf grass (1 = yes)0.0190.13801
Note: All variables are dummy variables that are equal to 1 if the farmer used the respective practice in 2019 and 0 if not. The column ‘mean’ indicates the share of farmers in the sample who were adopters. ‘Std. dev.’ stands for standard deviation. ‘Min’ stands for minimum; ‘max’ stands for maximum.
Table 3. Summary statistics of decision-maker, household, and farm characteristics and the SSI included as independent variables in the analysis (N = 362; household level).
MeanStd. dev.MinMax
Decision-maker Characteristics
Female (1 = yes)0.2350.42401
Education (years)5.8785.057020
Age (years)50.02813.1602290
Household Characteristics
No. of adults (HH members ≥ 15 years)3.8541.841119
Non-marginal caste (1 = yes)0.7900.40801
Durable assets owned (count)11.9926.026048
Off-farm income (1 = yes)0.5880.49301
Farm Characteristics
Farm size (ha)
0.8811.293013
Dairy (1 = yes)0.6960.46101
Livestock (1 = yes)0.4030.49101
Owned borewell (1 = yes)0.2290.42101
Market integration (1 = yes)0.4200.49401
Location
Rural–urban index (SSI) 10.7120.14801
Northern transect (1 = yes)0.5410.49901
Note: The column ‘mean’ indicates the share of farmers in the sample in case of dummy variables. ‘Std. dev.’ stands for standard deviation. ‘Min’ stands for minimum; ‘max’ stands for maximum. 1 The SSI takes a value between 0 and 1. The value 1 stands for most rural and 0 indicates most urban.
Table 4. Fertilizer types used by farm households in the northern and southern transects of Bangalore (N = 388; household level).
MeanStd. dev.MinMax
Mineral0.3710.48401
Mineral and FYM0.3300.47101
Mineral and organic0.1960.39701
Mineral, organic, and FYM0.0770.26701
FYM0.0080.08801
Notes: In all, 98% of the farmers in the sample used at least one type of fertilizer. All variables are dummy variables that are equal to 1 if the farmer used the respective (combination of) fertilizer in 2019 and 0 if not. The column ‘mean’ indicates the share of farmers in the sample who were adopters. ‘Std. dev.’ stands for standard deviation. ‘Min’ stands for minimum; ‘max’ stands for maximum.
Table 5. Association between the independent variables and farmers’ crop choices in the northern and southern transects of Bangalore (N = 362; household level).
CerealsPulsesVegetablesFruitsFlowersHerbs and SpicesNon-Food CommercialFodder
Decision-Maker Characteristics
Female (1 = yes)−0.030 (0.044)0.061 (0.066)0.016 (0.043)0.067 (0.046) 0.066 ** (0.028)−0.057 (0.048)−0.052 (0.047)
Age (years)−0.001 (0.002)0.001 (0.002)−0.002 (0.001)0.003 ** (0.002)−0.000 (0.001)0.001 (0.001)−0.002 (0.002)0.001 (0.001)
Education (years)−0.003 (0.004)−0.003 (0.006)0.006 (0.004)0.010 ** (0.004)−0.005 ** (0.002)−0.001 (0.003)−0.006 (0.004)−0.004 (0.004)
Household Characteristics
Non-marginal caste (1 = yes)−0.053 (0.048)−0.059 (0.067)−0.011 (0.041)0.042 (0.047)−0.030 (0.023)−0.082 *** (0.028)0.157 *** (0.060)0.052(0.048)
No. of adults (HH members ≥ 15 years)0.011 (0.011)−0.014 (0.016)−0.010 (0.010)−0.019 * (0.010)−0.002 (0.003)0.000 (0.005)0.000 (0.010)−0.014 (0.009)
Durable assets owned (count)0.002 (0.003)0.005 (0.005)0.002 (0.003)0.008 *** (0.003)0.003 * (0.001)0.001 (0.002)−0.002 (0.003)0.002 (0.003)
Off-farm income (1 = yes)−0.013 (0.034)0.034 (0.055)−0.031 (0.031)−0.069 * (0.037)−0.003 (0.017)0.018 (0.027)0.019 (0.035)−0.025 (0.032)
Farm Characteristics
Farm size (ha)0.089 *** (0.034)0.021 (0.021)0.023 *** (0.009)0.012 (0.012)−0.005 (0.007)0.019 ** (0.008)0.025 * (0.014)0.004 (0.012)
Dairy (1 = yes)−0.025 (0.041)0.168 *** (0.057)0.066 * (0.038)0.017 (0.041)−0.013 (0.023)0.016 (0.027)0.058 (0.044)
Livestock (1 = yes)0.036 (0.036)0.070 (0.054)0.004 (0.032)0.001 (0.035)0.008 (0.018)0.014 (0.029)0.036 (0.036)0.071 ** (0.036)
Market integration (1 = yes)−0.158 *** (0.036)−0.064 (0.057)0.199 *** (0.036)0.128 *** (0.036)0.101 *** (0.030)0.051 * (0.027)0.166 *** (0.037)0.031 (0.038)
Owned borewell (1 = yes)−0.151 *** (0.039)−0.170 *** (0.066)0.105 *** (0.034)0.185 *** (0.036)0.040 ** (0.020)0.001 (0.030)−0.002 (0.041)0.148 *** (0.037)
Location
Rural–urban index (SSI) 10.002 (0.126)−0.191 (0.187)−0.244 ** (0.121)0.051 (0.134)0.030 (0.060)−0.047 (0.084)0.042 (0.128)0.065 (0.153)
Northern transect (1 = yes)0.087 ** (0.035)0.106 ** (0.053)−0.107 *** (0.032)−0.147 *** (0.034)0.075 *** (0.025)−0.121 *** (0.030)0.081 ** (0.036)−0.181 *** (0.036)
N362362362362362362362362
Pseudo R20.1940.06520.3510.3130.3380.2320.1740.215
Wald chi254.6127.5886.6183.4747.5742.0560.8550.26
Log pseudolikelihood−120.0−234.0−98.95−121.1−41.33−71.79−131.6−118.3
Note: Results of probit models. Average marginal effects reported with robust standard errors in parentheses; significance levels reported with * had a p < 0.1, ** had a p < 0.05, and *** had a p < 0.01. HH stands for household. For flowers, the variable female HH head perfectly predicted failure and was therefore dropped from the model. For fodder, cows perfectly predicted success and the variable was therefore dropped from the model. 1 The SSI takes a value between 0 and 1; 1 stands for most rural and 0 indicates most urban.
Table 6. Association between the independent variables and crop choice and farmers’ use of irrigation in the northern and southern transects of Bangalore (N = 362; household level).
Decision-Maker Characteristics
Female (1 = yes)−0.046 (0.029)
Age (years)−0.001 (0.001)
Education (years)−0.004 (0.003)
Household Characteristics
Non-marginal caste (1 = yes)−0.051 (0.035)
No. of adults (HH members ≥ 15 years)−0.004 (0.005)
Durable assets owned (count)0.004 (0.002)
Off-farm income (1 = yes)−0.080 *** (0.027)
Farm Characteristics
Farm size (ha)0.027 ** (0.011)
Dairy (1 = yes)0.130 *** (0.031)
Livestock (1 = yes)0.059 ** (0.026)
Market integration (1 = yes)0.119 *** (0.027)
Owned borewell (1 = yes)0.203 *** (0.035)
Cereals (1 = yes)−0.154 *** (0.039)
Pulses (1 = yes)−0.101 *** (0.026)
Fruit (1 = yes)0.053 * (0.027)
Vegetables (1 = yes)0.114 *** (0.036)
Herbs and spices (1 = yes)−0.126 *** (0.049)
Non-food commercial (1 = yes)0.010 (0.032)
Fodder (1 = yes)0.151 *** (0.045)
Location
Rural–urban index (SSI) 1−0.054 (0.082)
Northern transect (1 = yes)−0.126 *** (0.030)
N362
Pseudo R20.755
Wald chi2103.0
Log pseudolikelihood−58.19
Note: Result of probit model. Average marginal effects reported with robust standard errors in parentheses; significance levels reported with * had a p < 0.1, ** had a p < 0.05, and *** had a p < 0.01. HH stands for household. Growing flowers predicted success perfectly, and therefore, the variable was dropped from the model. 1 The SSI takes a value between 0 and 1; 1 stands for most rural and 0 indicates most urban.
Table 7. Association between the independent variables and farmers’ crop choices and adoption of soil conservation practices in the northern and southern transects of Bangalore (N = 362; household level).
Mulching/Crop Residues/Cover CropsFarmyard ManureMinimum/No Tillage
Decision-Maker Characteristics
Female (1 = yes)−0.014 (0.047)−0.113 ** (0.057)−0.047 (0.066)
Age (years)−0.004 ** (0.002)−0.002 (0.002)0.001 (0.002)
Education (years)−0.003 (0.005)−0.007 (0.006)−0.012 ** (0.006)
Household Characteristics
Non-marginal caste (1 = yes)−0.026 (0.047)0.045 (0.060)−0.107 (0.066)
No. of adults (HH members ≥ 15 years)−0.004 (0.012)−0.009 (0.013)−0.033 ** (0.016)
Durable assets owned (count)−0.002 (0.003)0.004 (0.004)0.020 *** (0.005)
Off-farm income (1 = yes)0.092 ** (0.037)0.054 (0.049)0.039 (0.054)
Farm Characteristics
Farm size (ha)0.017 (0.010)−0.016 (0.022)0.035 * (0.021)
Dairy (1 = yes)−0.006 (0.042)0.192 *** (0.048)0.057 (0.059)
Livestock (1 = yes)0.032 (0.035)0.099 ** (0.050)0.044 (0.055)
Market integration (1 = yes)0.135 *** (0.044)0.017 (0.058)−0.020 (0.062)
Owned borewell (1 = yes)0.064 (0.043)0.075 (0.070)0.118 (0.073)
Cereals (1 = yes)0.043 (0.057)0.203 *** (0.079)0.086 (0.083)
Pulses (1 = yes)0.142 *** (0.035)0.027 (0.049)−0.093 * (0.053)
Vegetables (1 = yes)0.084 * (0.049)0.144 * (0.082)−0.086 (0.085)
Fruit (1 = yes)0.106 ** (0.045)0.099 (0.076)0.071 (0.074)
Flowers (1 = yes) 0.011 (0.151)0.014 (0.136)
Herbs and spices (1 = yes)−0.134 * (0.077)0.078 (0.092)−0.129 (0.106)
Non-food commercial (1 = yes)0.046 (0.046)0.112 (0.071)−0.111 (0.073)
Fodder (1 = yes)−0.080 (0.057)0.123 (0.084)−0.123 (0.084)
Location
Rural–urban index (SSI) 10.162 (0.121)−0.055 (0.165)0.387 ** (0.175)
Northern transect (1 = yes)0.014 (0.038)0.090 * (0.055)0.060 (0.059)
N362362362
Pseudo R20.2140.1580.0939
Wald-chi269.3570.0747.38
Log pseudolikelihood−125.2−195.3−227.2
Note: Results of probit models. Average marginal effects reported with robust standard errors in parentheses; significance levels reported with * had a p < 0.1, ** had a p < 0.05, and *** had a p < 0.01. HH stands for household. Growing flowers predicted failure of using mulching perfectly; therefore, the variable was dropped from the model. 1 The SSI takes a value between 0 and 1; 1 stands for most rural and 0 indicates most urban.
Publisher’s Note: MDPI stays neutral with regard to jurisdictional claims in published maps and institutional affiliations.

