
A Landslide Susceptibility Evaluation of Highway Disasters Based on the Frequency Ratio Coupling Model

 ,
,
Abstract
:1. Introduction
2. Methodology
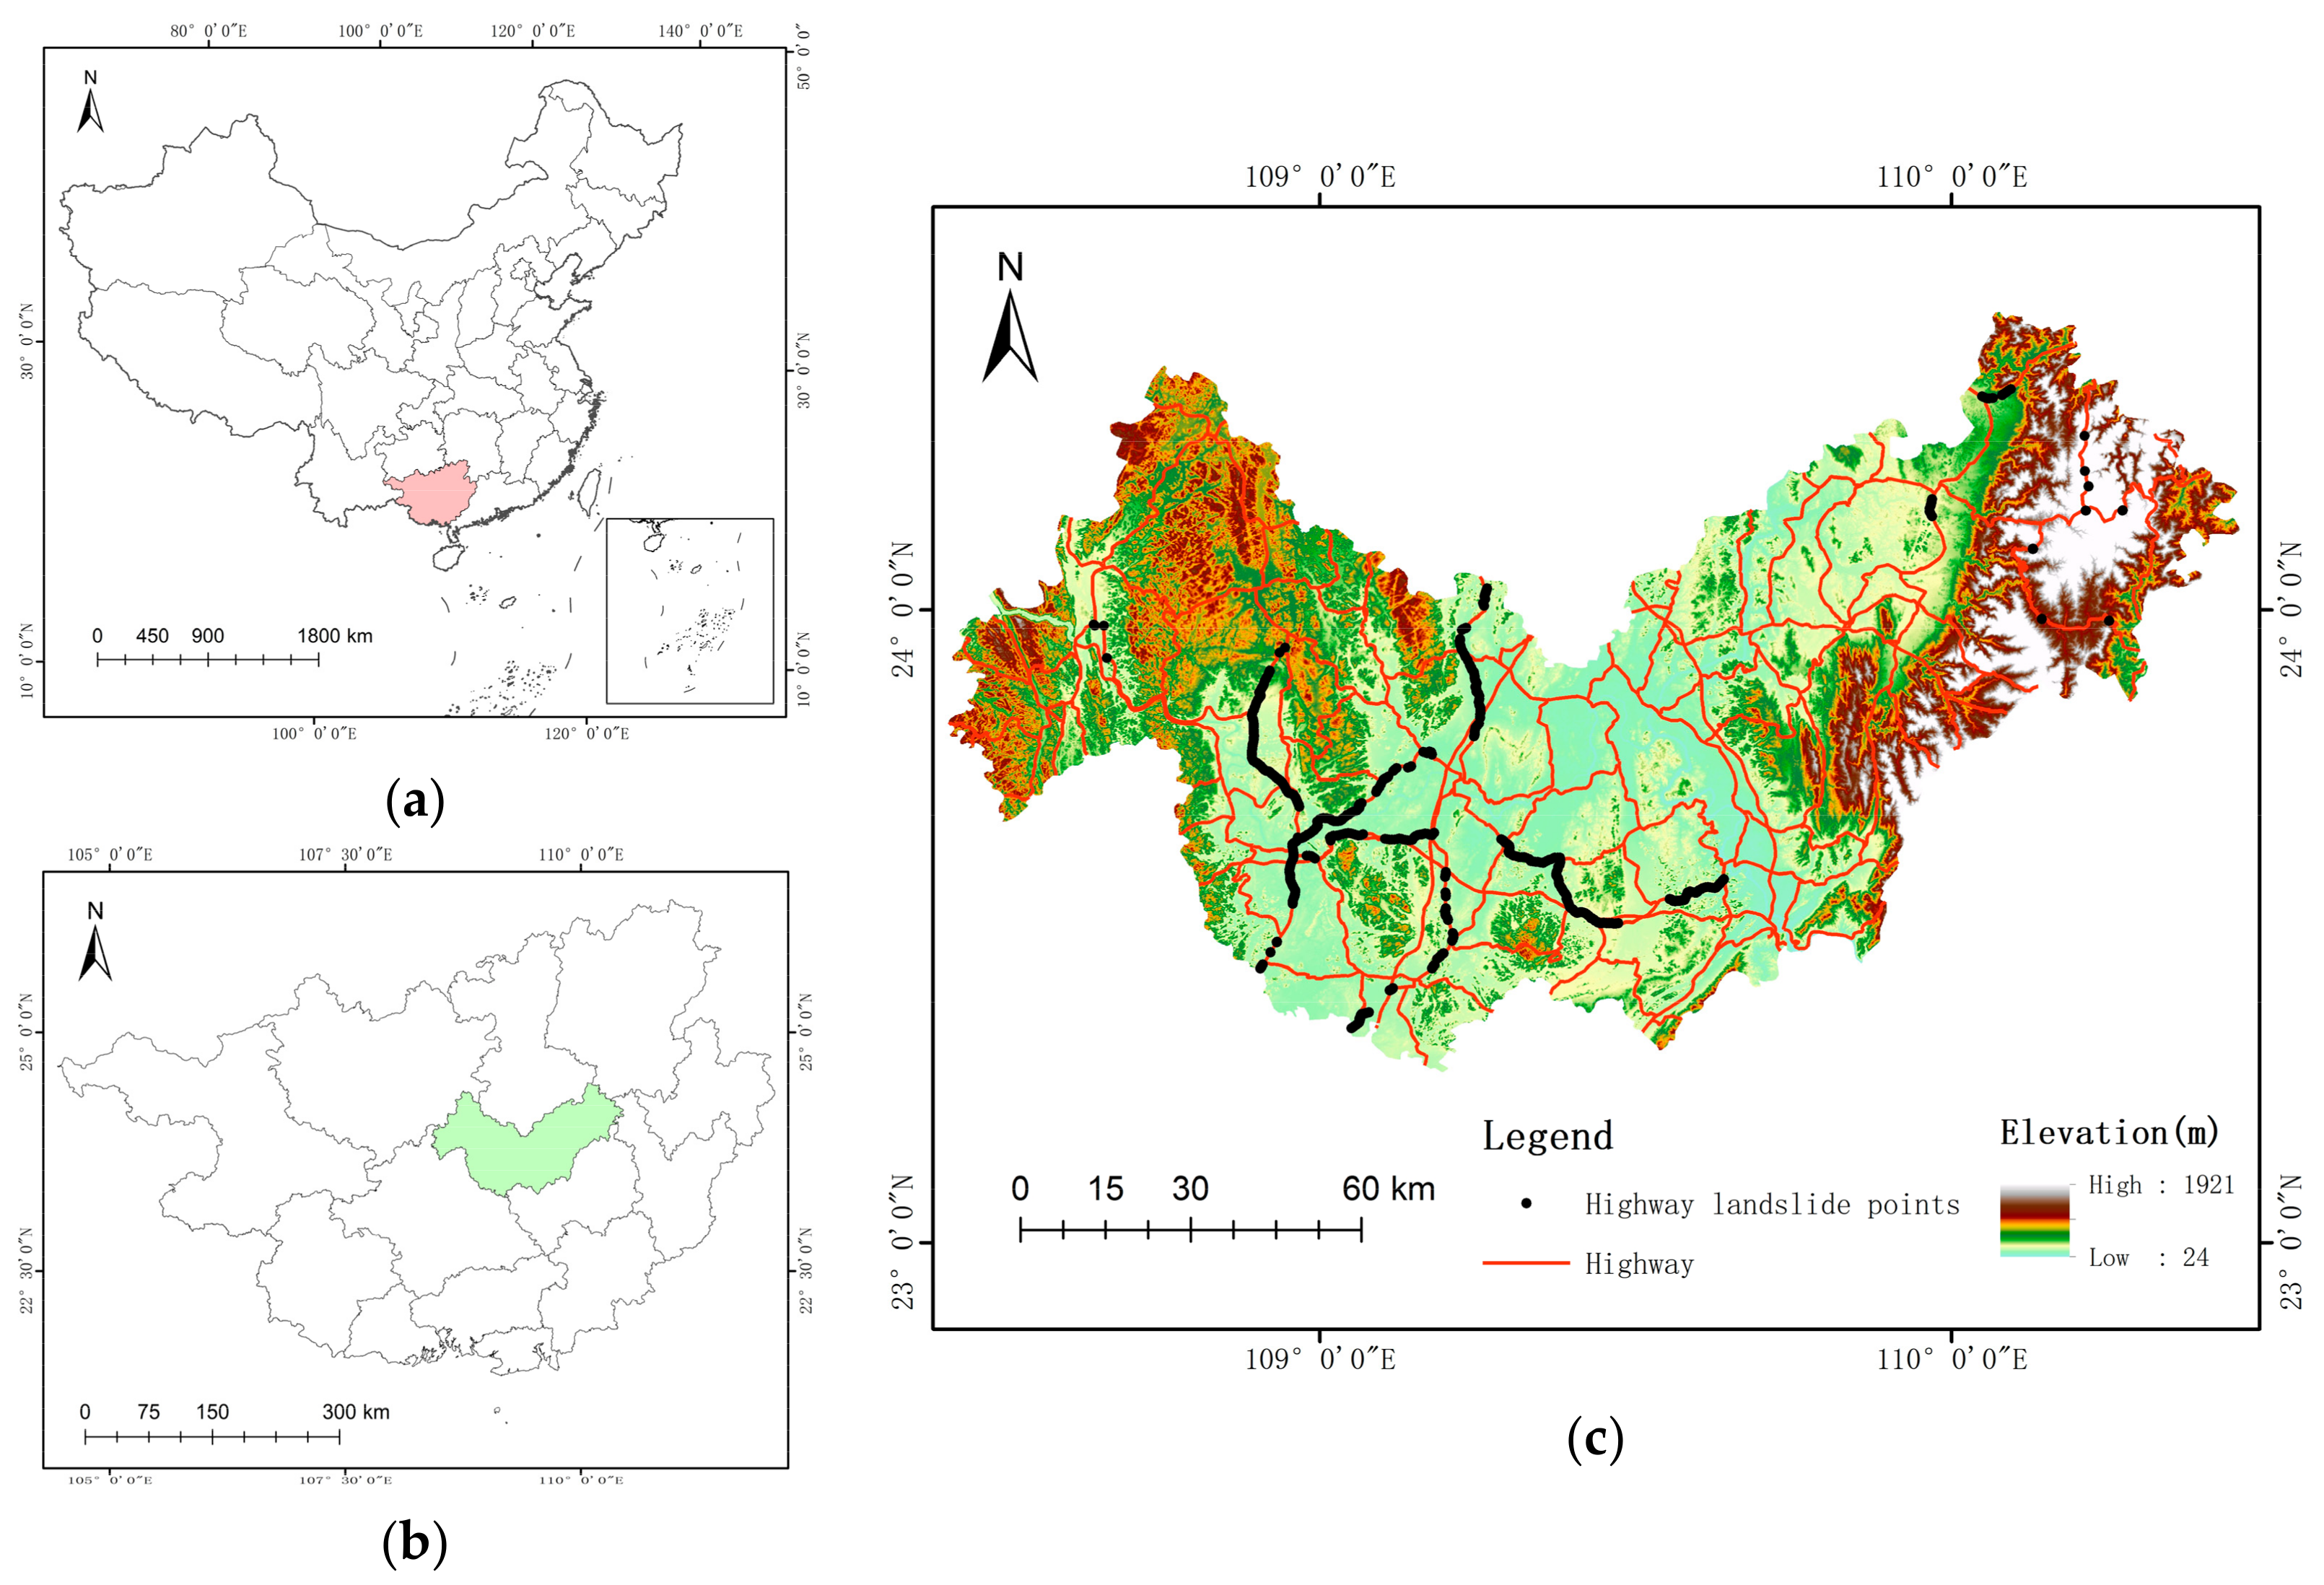
2.1. Study Region
2.2. Data Sources
2.3. Research Technique
2.3.1. Variable Statistics Method
2.3.2. Data-Driven Models
- AHP
- 2.
- LR
- 3.
- BPNN
- 4.
- SVM
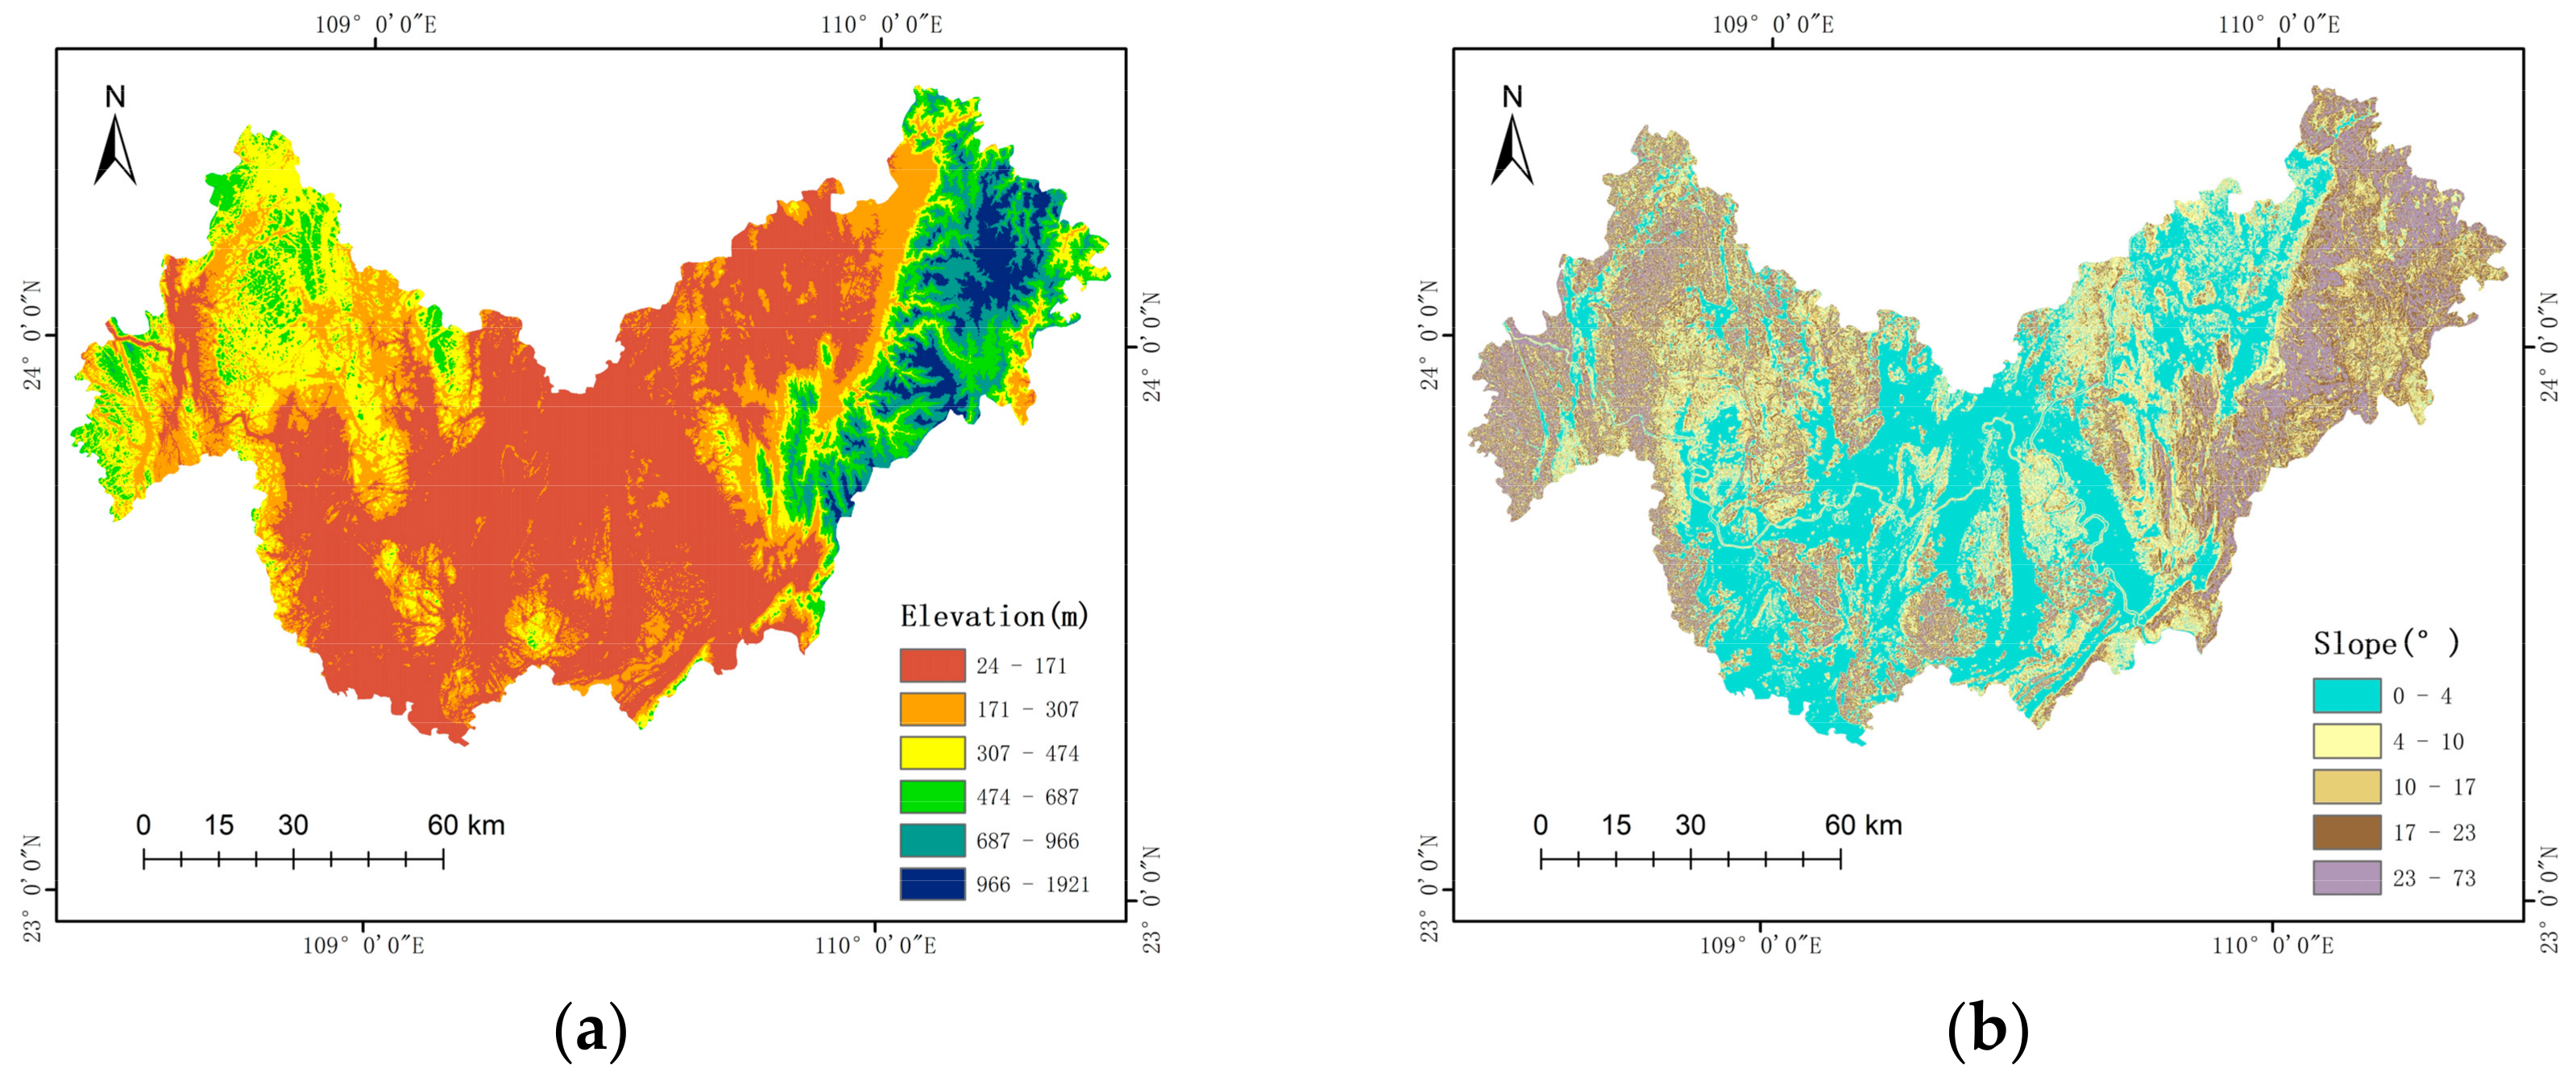
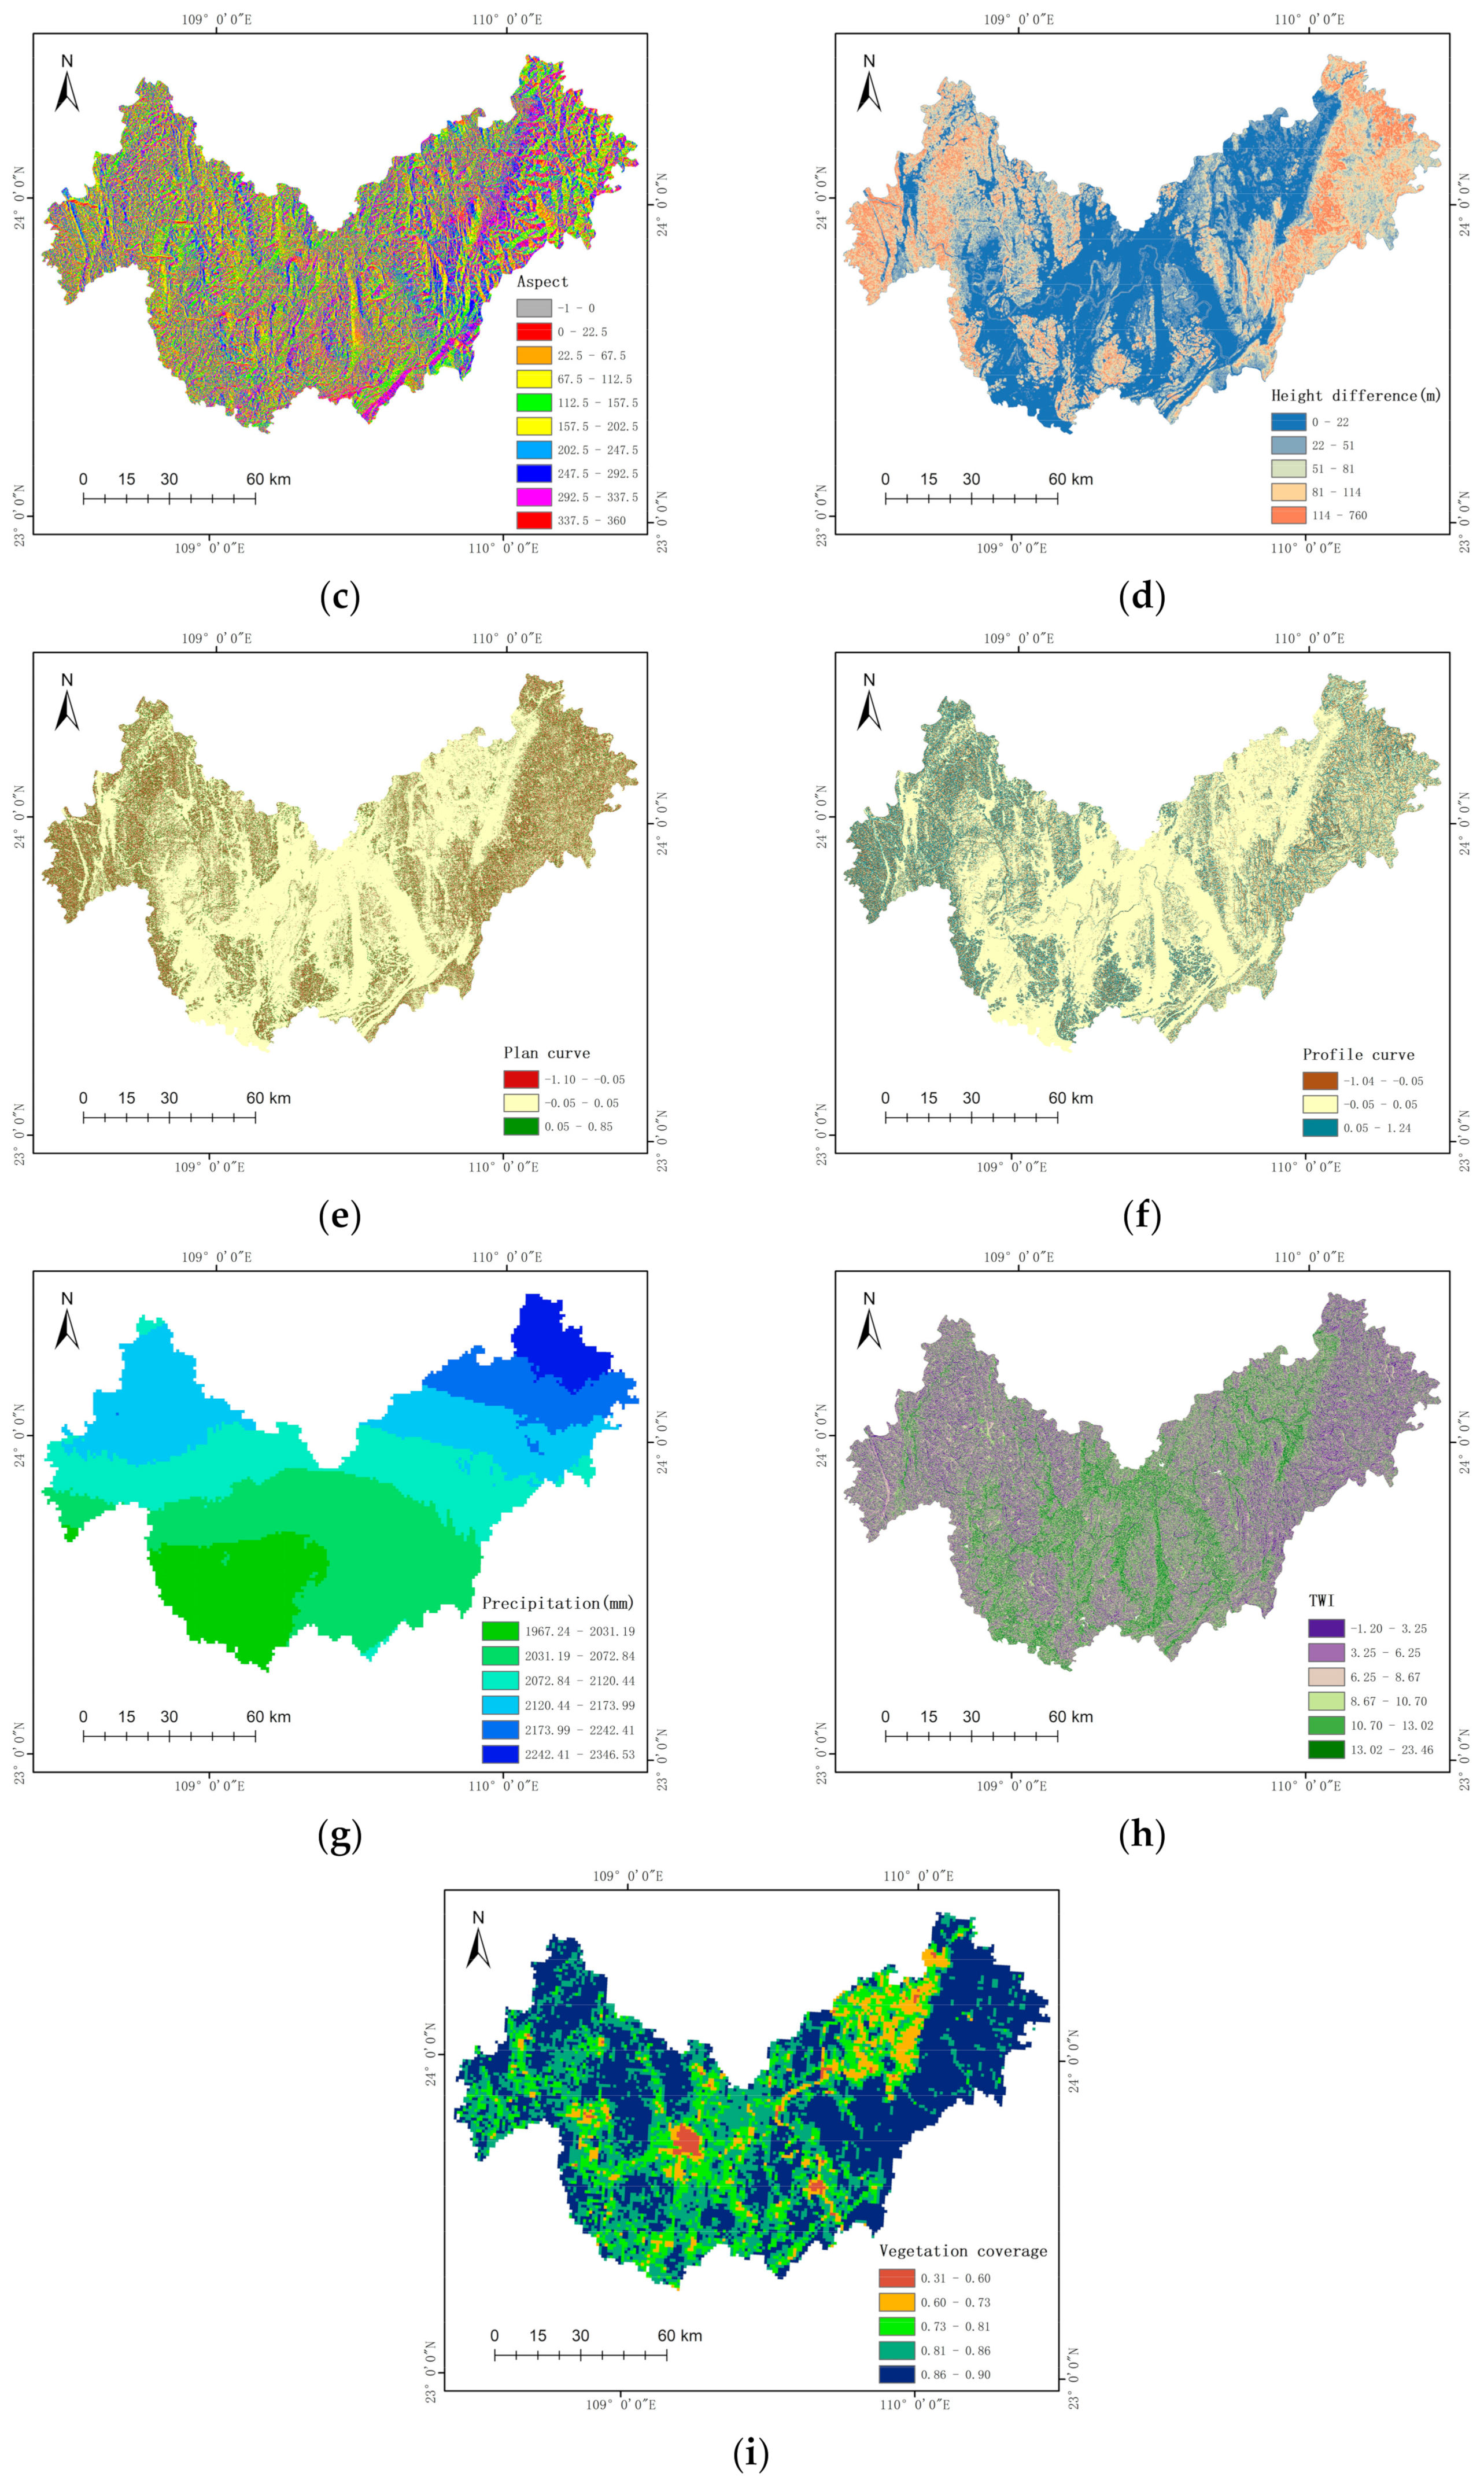
2.4. Selection of Evaluation Factors
- Elevation
- 2.
- Slope
- 3.
- Aspect
- 4.
- Height difference
- 5.
- Plan and profile curves
- 6.
- Precipitation
- 7.
- TWI
- 8.
- Vegetation coverage
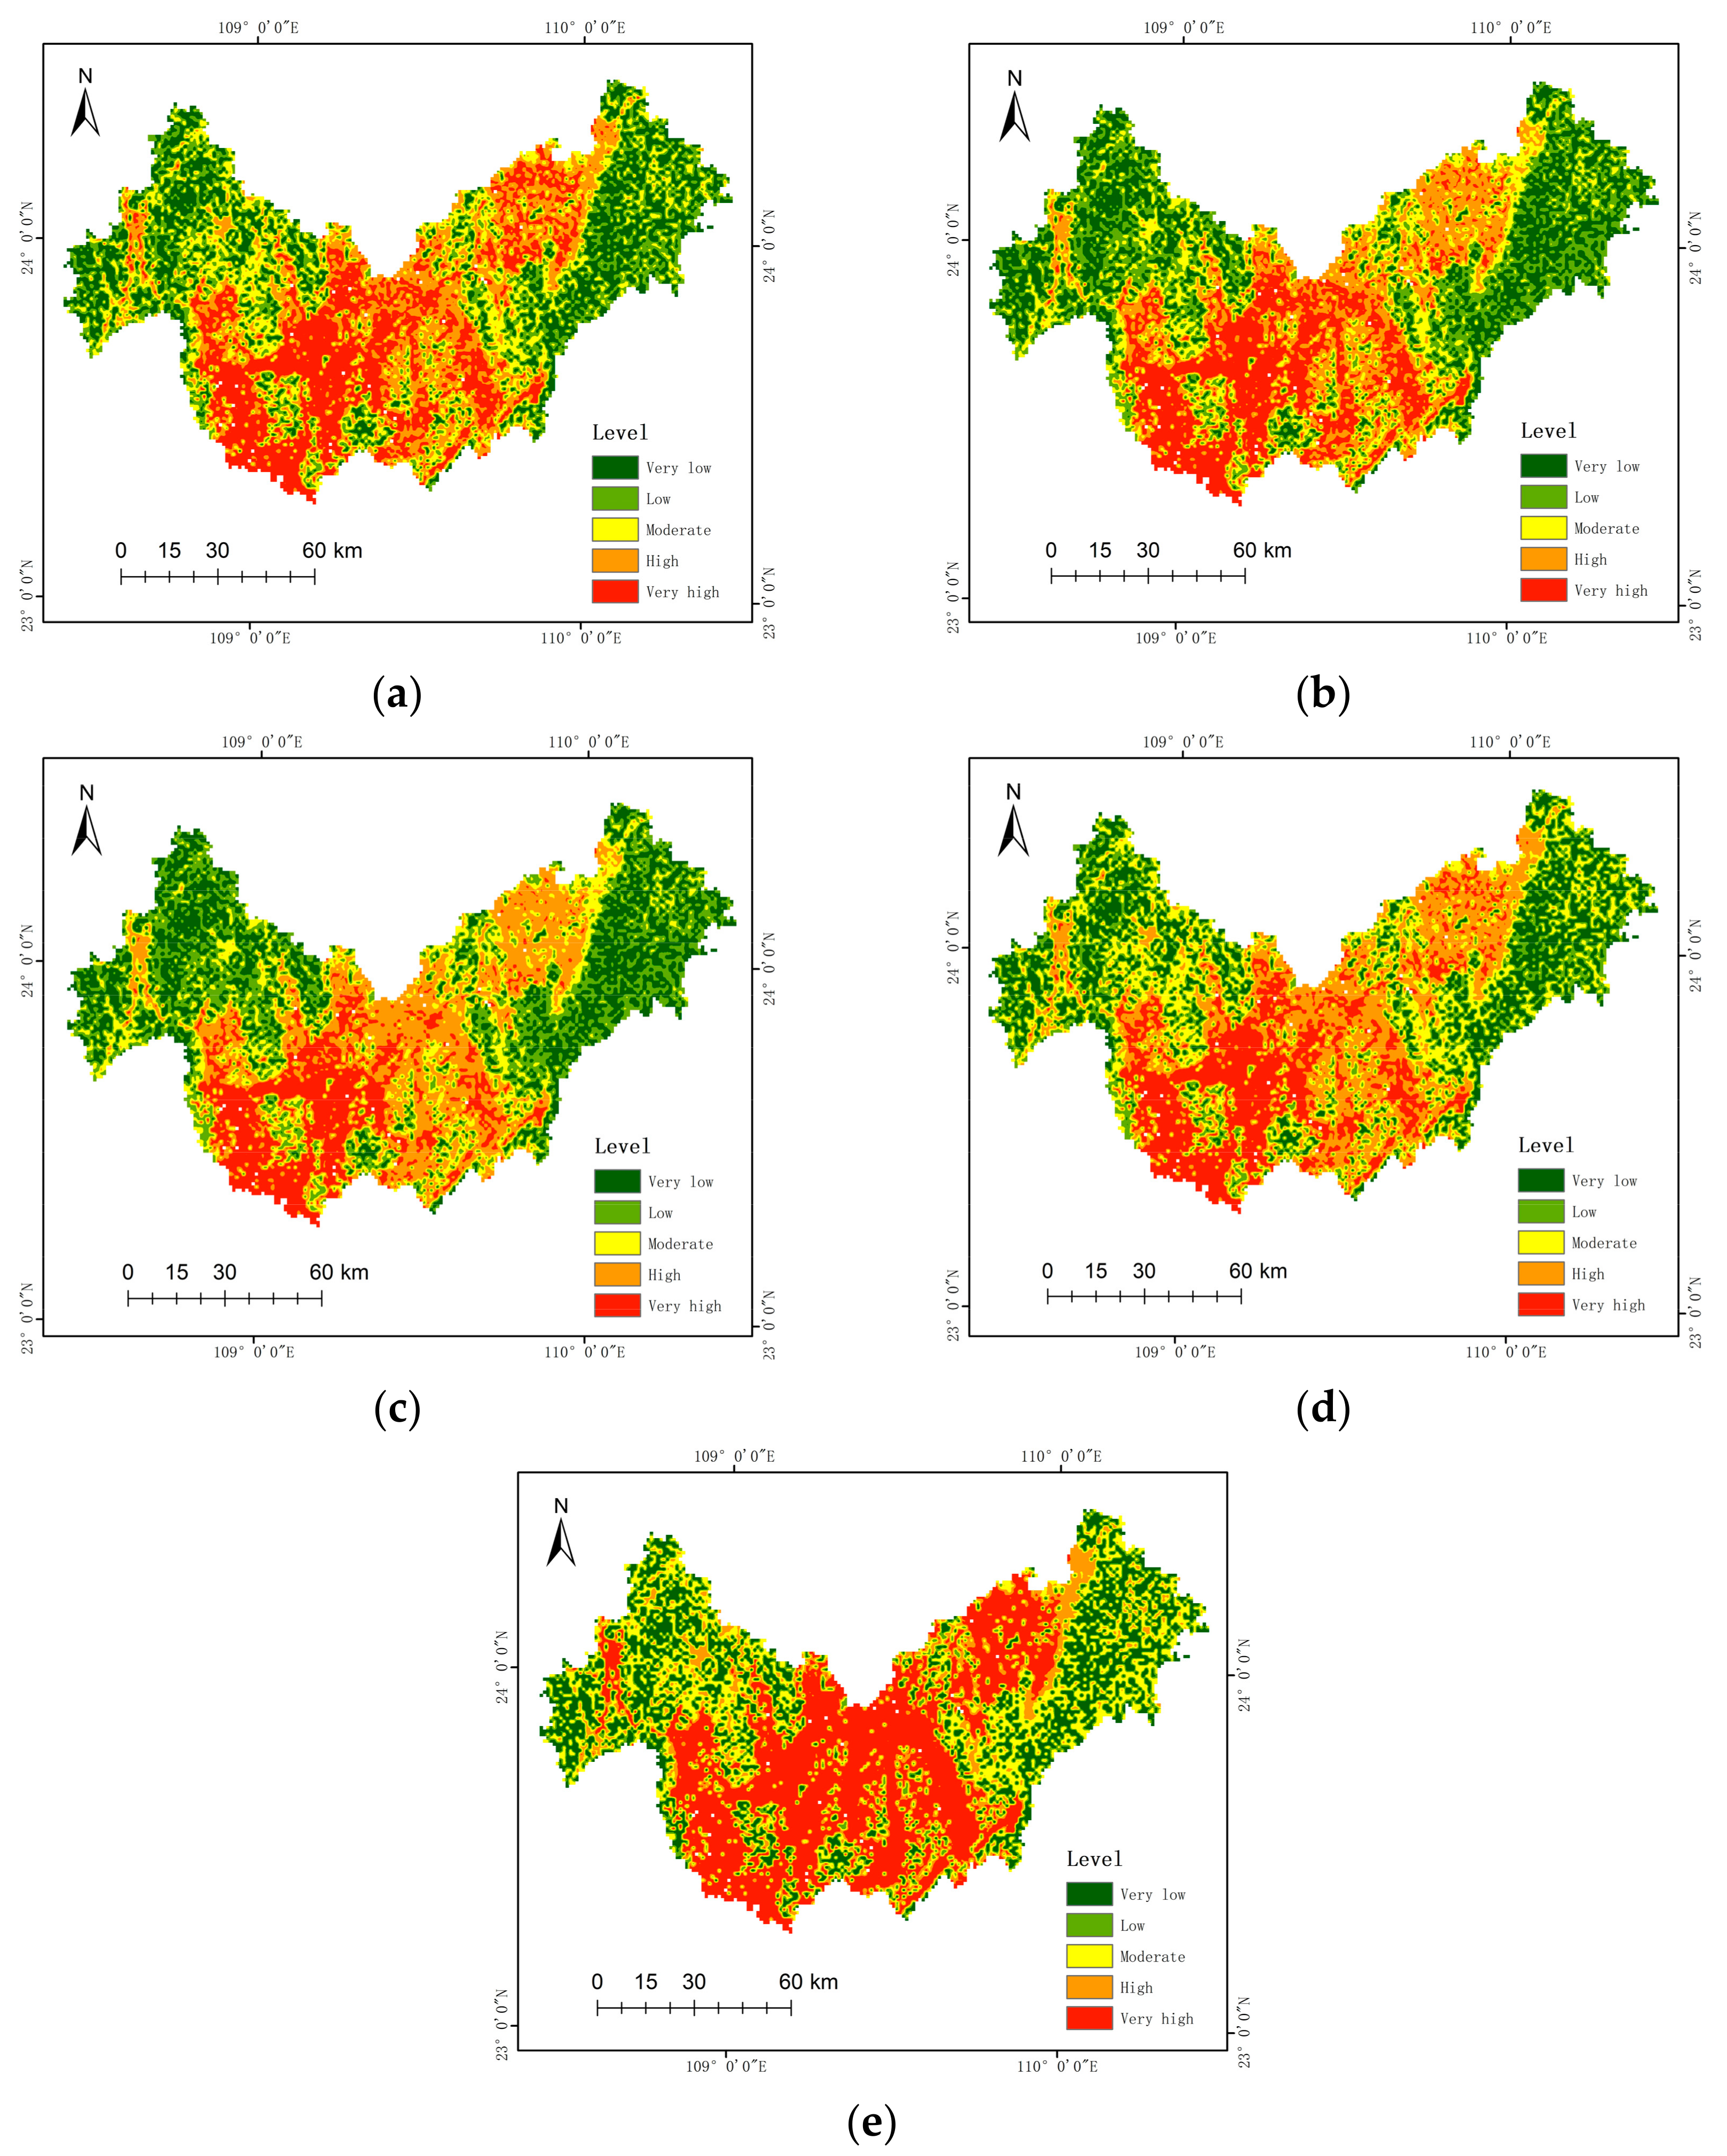
3. Results
3.1. FR Model
3.2. FR-AHP Model
3.3. FR-LR Model
3.4. FR-BPNN Model
3.5. FR-SVM Model
4. Discussion
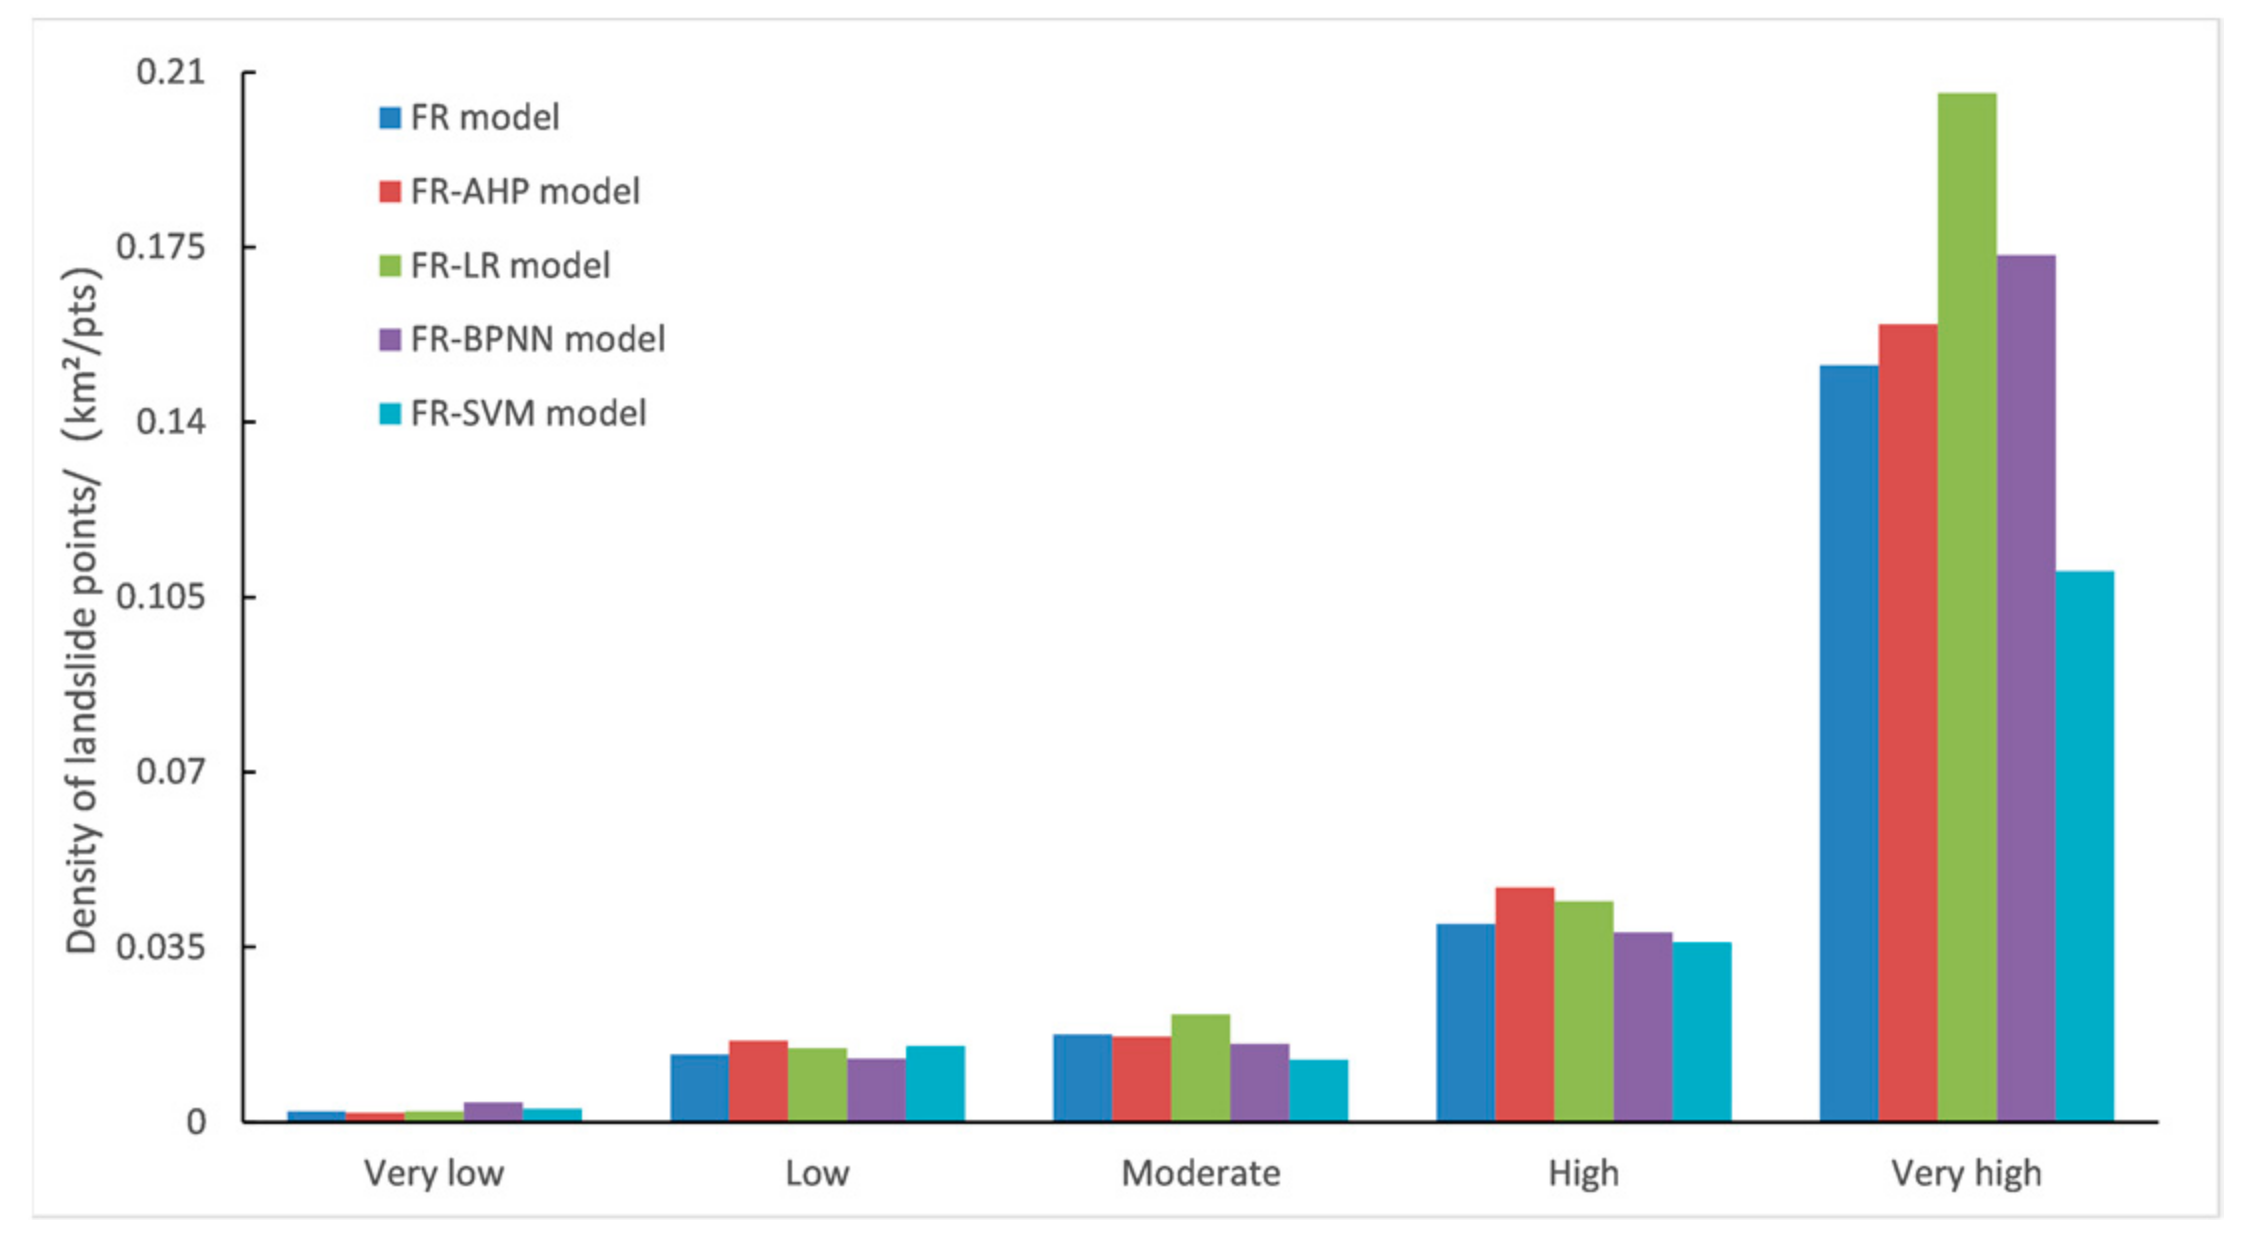
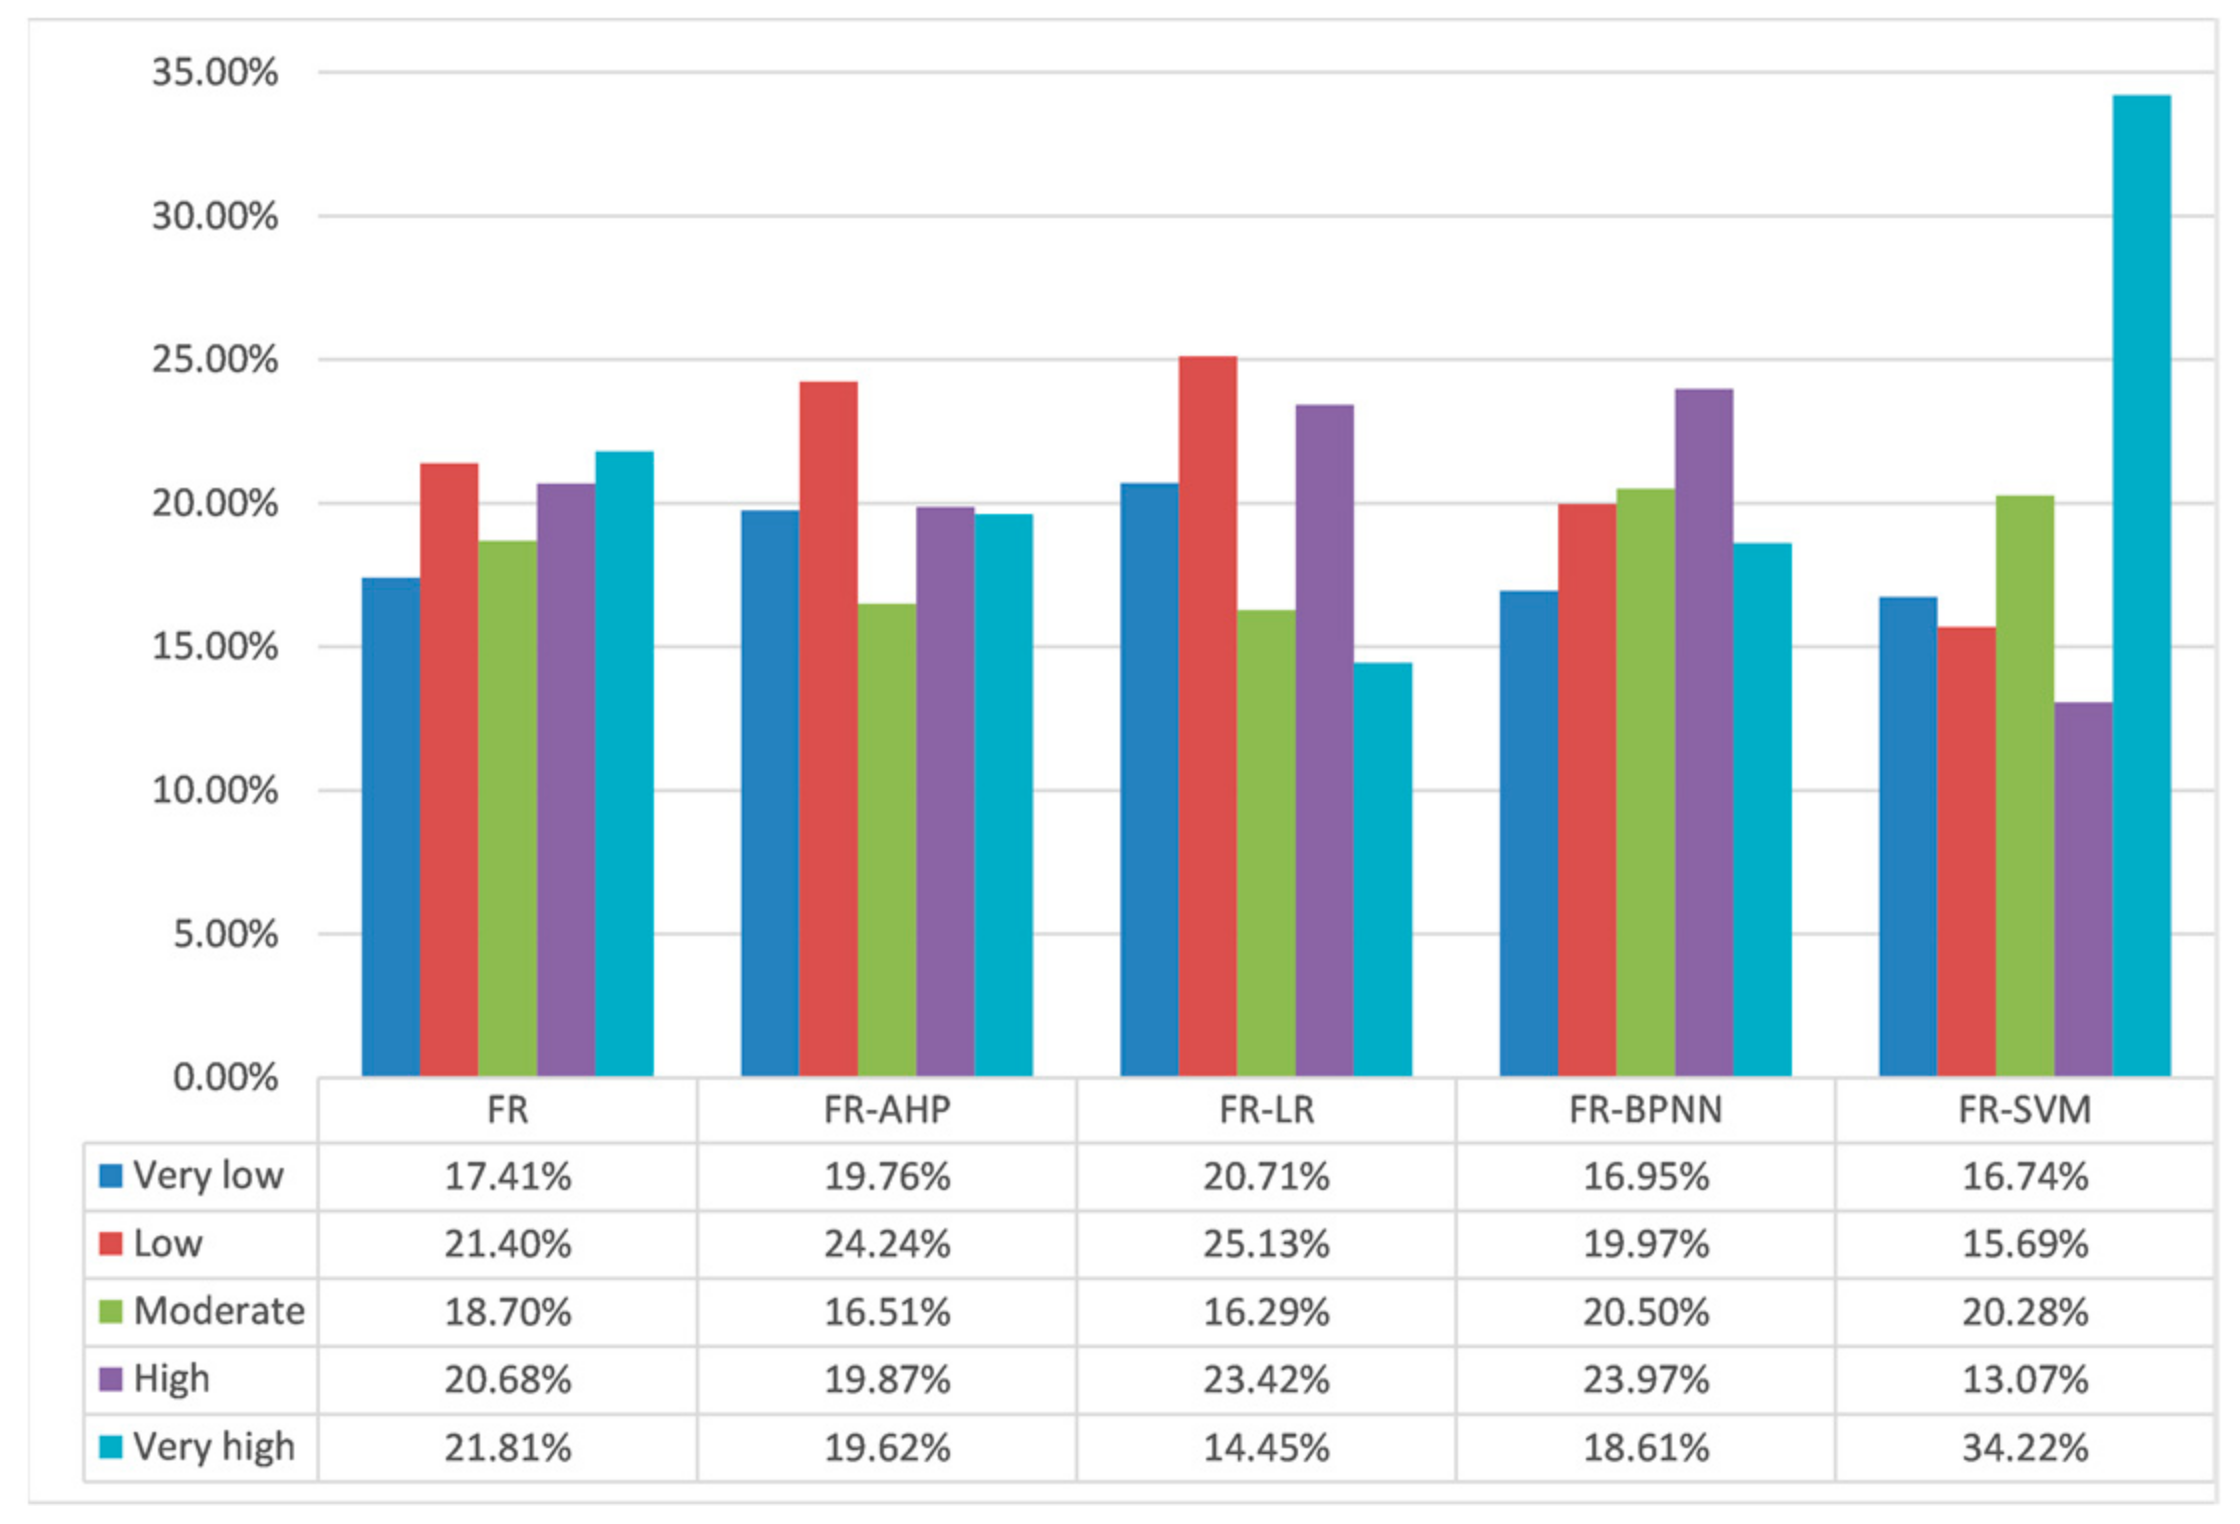
4.1. Distribution of Landslides
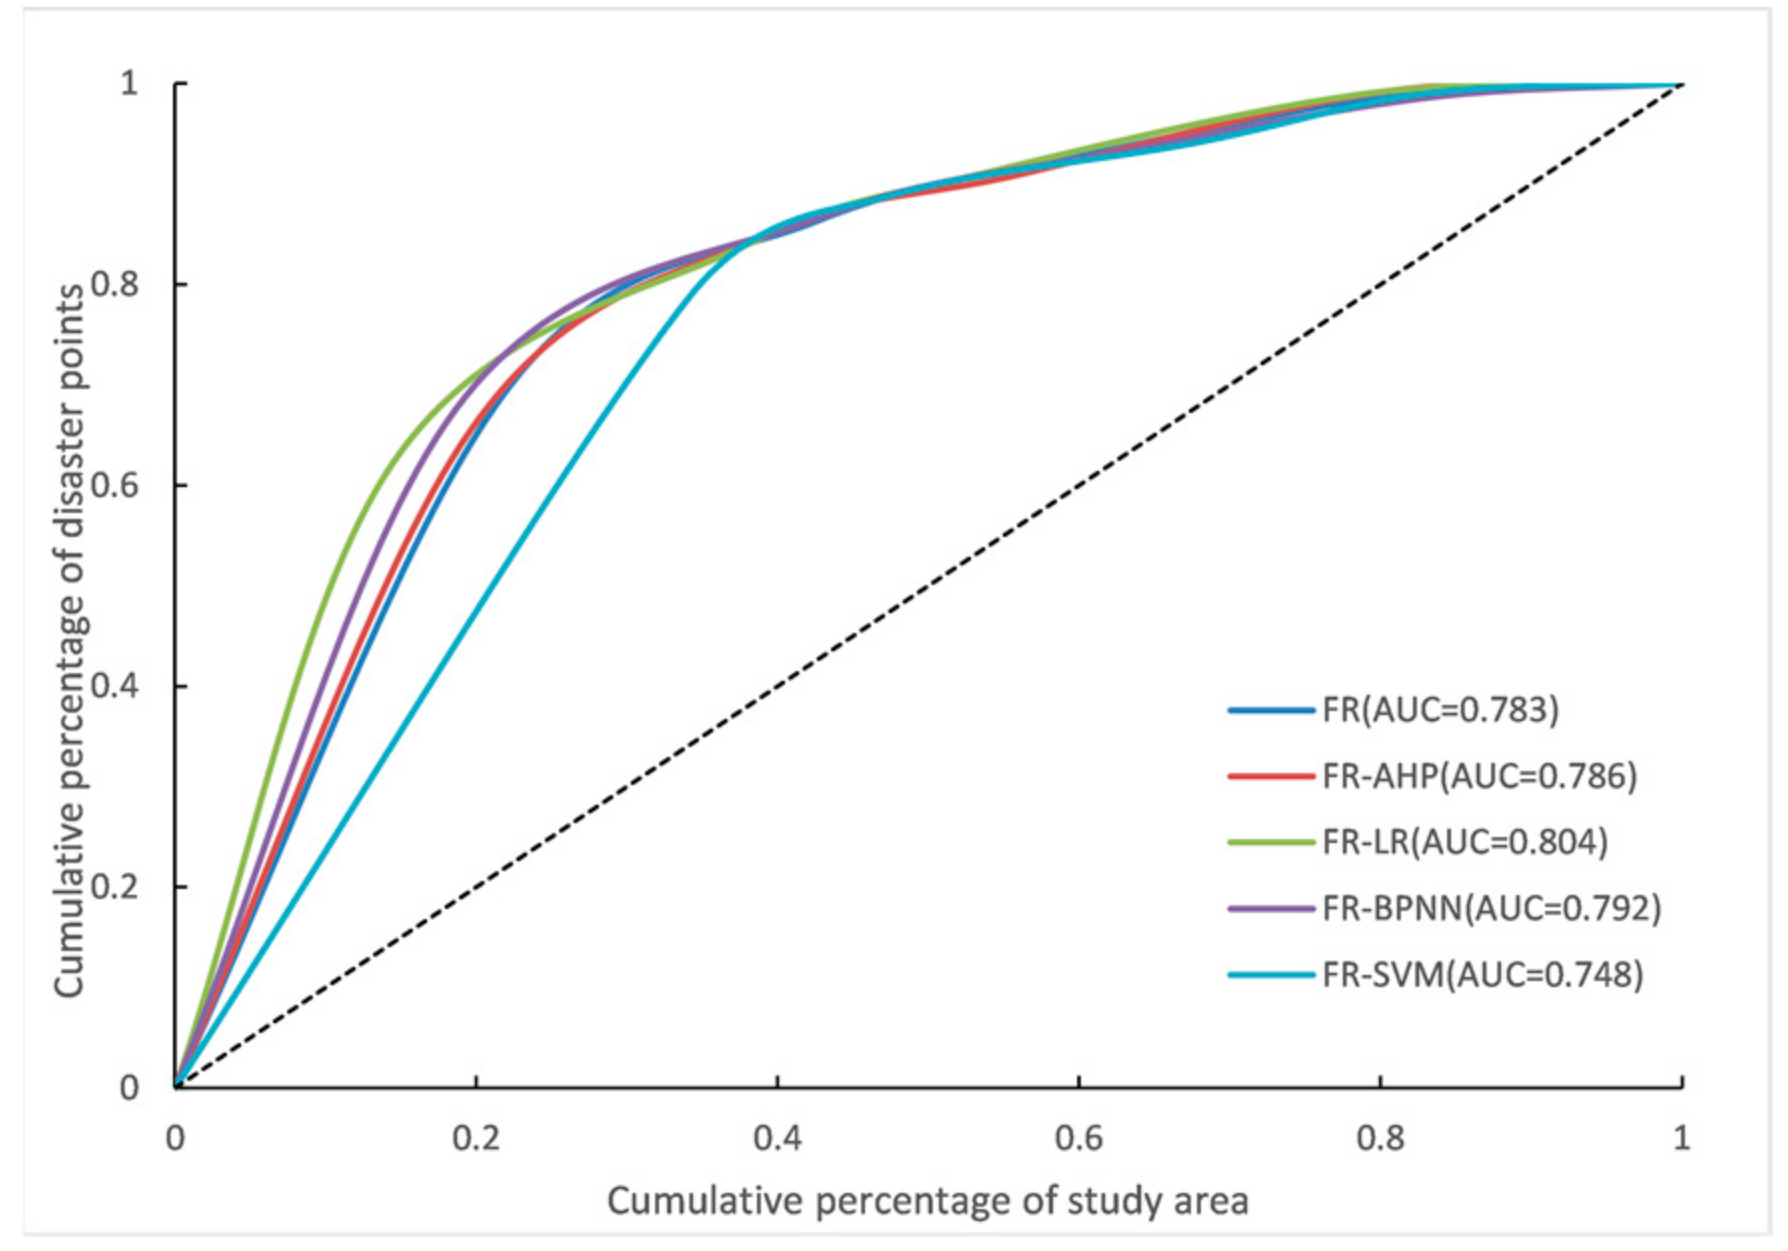
4.2. ROC Curve
4.3. Uncertainty Analysis
4.4. Comparison of Several Models
5. Conclusions
- Summary and key findings
- 2.
- Managerial and policy implications
- 3.
- Insights for future research and limitations
Author Contributions
Funding
Institutional Review Board Statement
Informed Consent Statement
Data Availability Statement
Acknowledgments
Conflicts of Interest
References
- Zhong, Z. Characteristics and Stability Zones of the Three Rivers of Sichuan-Tibet Railway. Master’s Thesis, Southwest JiaoTong University, Chengdu, China, 2015. [Google Scholar]
- Xu, C.; Dai, F.; Xu, S.; Xu, X.; He, H.; Wu, X.; Shi, F. Risk assessment and test of Wenchuan earthquake landslide based on logistic regression model. Hydrogeol. Eng. Geol. 2013, 40, 98–104. [Google Scholar]
- Li, Z. Evaluation of landslide susceptibility in Dingcheng District, Hunan Province based on BP artificial neural network and GIS. Master’s Thesis, Hebei University of Geosciences, Shijiazhuang, China, 2020. [Google Scholar]
- Lee, S.; Pradhan, B. Landslide hazard mapping at Selangor, Malaysia using frequency ratio and logistic regression models. Landslides 2007, 4, 33–41. [Google Scholar] [CrossRef]
- Hu, M.; Liu, Q.; Liu, P. Susceptibility Assessment of Landslides in Alpine-Canyon Region Using Multiple GIS-Based Models. Wuhan Univ. J. Nat. Sci. 2019, 24, 257–270. [Google Scholar] [CrossRef]
- Mandal, S.; Mondal, S. Machine Learning Models and Spatial Distribution of Landslide Susceptibility, Geoinformatics and Modelling of Landslide Susceptibility and Risk. Environ. Sci. Eng. 2019, 165–175. [Google Scholar] [CrossRef]
- Ge, Y.; Chen, H.; Zhao, B.; Tang, H.; Lin, Z.; Xie, Z.; Lv, L.; Zhong, P. A comparison of five methods in landslide susceptibility assessment: A case study from the 330-kV transmission line in Gansu Region, China. Environ. Earth Sci. 2018, 77, 662. [Google Scholar] [CrossRef]
- Fan, W.; Wei, X.; Cao, Y.; Zheng, B. Landslide susceptibility assessment using the certainty factor and analytic hierarchy process. J. Mt. Sci. 2017, 14, 906–925. [Google Scholar] [CrossRef]
- Tekin, S. Completeness of landslide inventory and landslide susceptibility mapping using logistic regression method in Ceyhan Watershed (southern Turkey). Arab. J. Geosci. 2021, 14, 1706. [Google Scholar] [CrossRef]
- Sheng, M.; Liu, Z.; Zhang, X.; Hu, S.; Guo, Z.; Huang, F. Landslide susceptibility prediction based on frequency ratio linkage method and support vector machine. Sci. Technol. Eng. 2021, 21, 10620–10628. [Google Scholar]
- Du, G.; Yang, Z.; Yuan, Y.; Ren, S.; Ren, T. Evaluation of landslide susceptibility in Sichuan-Tibet traffic corridor based on logistic regression information. Hydrogeol. Eng. Geol. 2021, 48, 102–111. [Google Scholar]
- Shen, H.; Dong, Y.; Yang, M.; Shi, C.; Yang, X. Assessment of landslide susceptibility in Gansu Province based on AHP and information measurement method. Res. Soil Water Conserv. 2021, 28, 412–419. [Google Scholar]
- Qin, Y.; Yang, G.; Lu, K.; Sun, Q.; Xie, J.; Wu, Y. Performance evaluation of five GIS-based models for landslide susceptibility prediction and mapping: A case study of Kaiyang County, China. Sustainability 2021, 13, 6441. [Google Scholar] [CrossRef]
- Pal, S.C.; Chowdhuri, I. GIS-based spatial prediction of landslide susceptibility using frequency ratio model of Lachung River basin, North Sikkim, India. SN Appl. Sci. 2019, 1, 1–25. [Google Scholar] [CrossRef] [Green Version]
- Wu, C.; Jue, Y.; Wang, J.; Xu, H.; Zhang, H.; Xu, Q. Evaluation of landslide susceptibility in Shuangbai County based on frequency ratio-logistic regression coupling model. J. Nat. Disasters 2021, 30, 213–224. [Google Scholar]
- Huang, F.; Ye, Z.; Yao, C.; Li, Y.; Yin, K.; Huang, J.; Jiang, Q. Uncertainty of landslide susceptibility prediction: The division of different attribute intervals of environmental factors and the influence of different data-driven models. Earth Sci. 2020, 45, 4535–4549. [Google Scholar]
- Yang, X. Risk Assessment of Geological Hazards Based on GIS. Master’s Thesis, Lanzhou University, Lanzhou, China, 2008. [Google Scholar]
- Li, J. Study on the Risk Assessment of Landslide Disasters in Fangshan District Based on GIS. Master’s Thesis, China University of Geosciences, Beijing, China, 2018. [Google Scholar]
- Liu, X. Risk Assessment of Rainfall-Type Landslide Disaster Based on GIS. Master’s Thesis, Yanbian University, Yanbian, China, 2018. [Google Scholar]
- Zhang, Z.; Deng, M.; Xu, S.; Zhang, Y.; Fu, H.; Li, Z. Comparative study on the evaluation model of landslide susceptibility in Zhenkang County. Chin. J. Rock Mech. Eng. 2022, 41, 157–171. [Google Scholar]
- Luo, L.; Pei, X.; Huang, R.; Pei, Z.; Zhu, L. Evaluation of landslide susceptibility in Jiuzhaigou scenic area coupled with CF and Logistic regression model supported by GIS. J. Eng. Geol. 2021, 29, 526–535. [Google Scholar]
- Zhu, C. Study on the Risk Assessment Method of Regional Landslide in Sichuan Province Based on BP Neural Network and Its Optimization Algorithm. Master’s Thesis, Southwest JiaoTong University, Chengdu, China, 2020. [Google Scholar]
- Zhang, X. Study on Geological Disaster Risk Assessment in Yanchi County, Ningxia Based on Remote Sensing and GIS. Ph.D. Thesis, China University of Geosciences, Beijing, China, 2018. [Google Scholar]
- Zhao, X. Comprehensive Evaluation of Multi-Model in Maerkang City. Master’s Thesis, Chengdu University of Technology, Chengdu, China, 2020. [Google Scholar]
- Guan, X. Study on Risk Assessment of landslide disasters in Yunnan Province. Ph.D. Thesis, China University of Mining and Technology, Beijing, China, 2018. [Google Scholar]
- Wang, N.; Guo, Y.; Liu, T.; Zhu, Q. Landslide hazard evaluation based on SVM model. Sci. Technol. Eng. 2019, 19, 70–78. [Google Scholar]
- Wei, A.; Yu, K.; Dai, F.; Gu, F.; Zhang, W.; Liu, Y. Application of Tree-Based Ensemble Models to Landslide Susceptibility Mapping: A Comparative Study. Sustainability 2022, 14, 6330. [Google Scholar] [CrossRef]
- Tang, R.; Yan, E.; Wen, T.; Yin, X.; Tang, W. Comparison of Logistic Regression, Information Value, and Comprehensive Evaluating Model for Landslide Susceptibility Mapping. Sustainability 2021, 13, 3803. [Google Scholar] [CrossRef]
- Che, W.; Qin, S.; Miao, Q.; Su, G.; Chen, Y.; Yao, J. Study on Factor Classification Method in the Evaluation of landslide sensitivity. In Proceedings of the 11th National Engineering Geology Conference, Wuhan, China, 16–18 October 2020; pp. 121–129. [Google Scholar]
- Vasu, N.N.; Lee, S.-R. A hybrid feature selection algorithm integrating an extreme learning machine for landslide susceptibility modeling of Mt. Woomyeon, South Korea. Geomorphology 2016, 263, 50–70. [Google Scholar] [CrossRef]
- Pham, B.T.; Bui, D.T.; Dholakia, M.B.; Prakash, I.; Pham, H.V.; Mehmood, K.; Le, H.Q. A novel ensemble classifier of rotation forest and Naïve Bayer for landslide susceptibility assessment at the Luc Yen district, Yen Bai Province (Viet Nam) using GIS. Geomat. Nat. Hazards Risk 2017, 8, 649–671. [Google Scholar] [CrossRef] [Green Version]
- Bui, D.T.; Hoang, N.-D.; Martínez-Álvarez, F.; Ngo, P.-T.T.; Hoa, P.V.; Pham, T.D.; Samui, P.; Costache, R. A novel deep learning neural network approach for predicting flash flood susceptibility: A case study at a high frequency tropical storm area. Sci. Total Environ. 2020, 701, 134413. [Google Scholar]
- Ercanoglu, M.; Gokceoglu, C. Assessment of landslide susceptibility for a landslide-prone area (north of Yenice, NW Turkey) by fuzzy approach. Environ. Geol. 2002, 41, 720–730. [Google Scholar]
- Bui, D.T.; Ho, T.-C.; Pradhan, B.; Pham, B.-T.; Nhu, V.-H.; Revhaug, I. GIS-based modeling of rainfall-induced landslides using data mining-based functional trees classifier with AdaBoost, Bagging, and MultiBoost ensemble frameworks. Environ. Earth Sci. 2016, 75, 1–22. [Google Scholar]
- Pham, B.T.; Prakash, I.; Chen, W.; Ly, H.-B.; Ho, L.S.; Omidvar, E.; Tran, V.P.; Bui, D.T. A novel intelligence approach of a sequential minimal optimization-based support vector machine for landslide susceptibility mapping. Sustainability 2019, 11, 6323. [Google Scholar] [CrossRef] [Green Version]
- Lee, J.-H.; Sameen, M.I.; Pradhan, B.; Park, H.-J. Modeling landslide susceptibility in data-scarce environments using optimized data mining and statistical methods. Geomorphology 2018, 303, 284–298. [Google Scholar] [CrossRef]
- Pham, B.T.; Bui, D.T.; Prakash, I.; Dholakia, M.B. Hybrid integration of Multilayer Perceptron Neural Networks and machine learning ensembles for landslide susceptibility assessment at Himalayan area (India) using GIS. Catena 2017, 149, 52–63. [Google Scholar] [CrossRef]
- Bragagnolo, L.; Silva, R.V.D.; Grzybowski, J.M.V. Artificial neural network ensembles applied to the mapping of landslide susceptibility. Catena 2020, 184, 104240. [Google Scholar] [CrossRef]
- Huang, F.; Ye, Z.; Jiang, S.; Huang, J.; Chang, Z.; Chen, J. Uncertainty study of landslide susceptibility prediction considering the different attribute interval numbers of environmental factors and different data-based models. Catena 2021, 202, 105250. [Google Scholar] [CrossRef]
- Sonker, I.; Tripathi, J.N.; Singh, A.K. Landslide susceptibility zonation using geospatial technique and analytical hierarchy process in Sikkim Himalaya. Quat. Sci. Adv. 2021, 4, 100039. [Google Scholar] [CrossRef]
- Tang, R.; Kulatilake, P.H.S.W.; Yan, E.; Cai, J. Evaluating landslide susceptibility based on cluster analysis, probabilistic methods, and artificial neural networks. Bull. Eng. Geol. Environ. 2020, 79, 2235–2254. [Google Scholar] [CrossRef]
- Ayalew, L.; Yamagishi, H.; Marui, H.; Kanno, T. Landslides in Sado Island of Japan: Part II. GIS-based susceptibility mapping with comparisons of results from two methods and verifications. Eng. Geol. 2005, 81, 432–445. [Google Scholar] [CrossRef]
- Zare, N.; Hosseini, S.A.O.; Hafizi, M.K.; Najaf, A.; Majnounian, B.; Geertsema, M. A Comparison of an Adaptive Neuro-Fuzzy and Frequency Ratio Model to Landslide-Susceptibility Mapping along Forest Road Networks. Forests 2021, 12, 1087. [Google Scholar] [CrossRef]
- Shu, H.; Guo, Z.; Qi, S.; Song, D.; Pourghasemi, H.R.; Ma, J. Integrating Landslide Typology with Weighted Frequency Ratio Model for Landslide Susceptibility Mapping: A Case Study from Lanzhou City of Northwestern China. Remote Sens. 2021, 13, 3623. [Google Scholar] [CrossRef]
- Yu, C.; Liu, K.; Yin, J.; Yu, B. A Grid-Scale Division Method Applicable to Logistic Regression Models for Evaluating the Susceptibility of Shallow Landslides—Taking the 2019 Cluster of Shallow Landslides in Sanming City, Fujian as Example. Mt. Res. 2022, 40, 106–119. [Google Scholar]
- Huang, F.; Hu, S.; Yan, X.; Li, M.; Wang, J.; Li, W.; Guo, Z.; Fan, W. Landslide susceptibility prediction and identification of its main environmental factors based on machine learning models. Bull. Geol. Sci. Technol. 2022, 41, 79–90. [Google Scholar]


| n | 1 | 2 | 3 | 4 | 5 | 6 | 7 | 8 | 9 | 10 |
|---|---|---|---|---|---|---|---|---|---|---|
| RI | 0 | 0 | 0.58 | 0.90 | 1.12 | 1.24 | 1.32 | 1.41 | 1.45 | 1.49 |
| Landslide Evaluation Factors | Classification | Number of Landslide Points/pts | Classified Area/km2 | FR |
|---|---|---|---|---|
| Elevation (m) | [24, 171] | 589 | 6239 | 1.97518 |
| (171, 307] | 22 | 2694 | 0.17086 | |
| (307, 474] | 3 | 2162 | 0.02903 | |
| (474, 687] | 3 | 1178 | 0.05329 | |
| (687, 966] | 10 | 756 | 0.27678 | |
| (966, 1921] | 14 | 382 | 0.76607 | |
| Slope (°) | [0, 4] | 522 | 4939 | 2.21118 |
| (4, 10] | 77 | 2726 | 0.59089 | |
| (10, 17] | 21 | 2189 | 0.20075 | |
| (17, 23] | 14 | 1868 | 0.15679 | |
| (23, 73] | 7 | 1689 | 0.08673 | |
| Aspect | [–1, 0] | 12 | 99 | 2.52719 |
| (337.5, 22.5] | 48 | 1428 | 0.70312 | |
| (22.5, 67.5] | 69 | 1554 | 0.92900 | |
| (67.5, 112.5] | 98 | 1762 | 1.16389 | |
| (112.5, 157.5] | 109 | 1690 | 1.34979 | |
| (157.5, 202.5] | 69 | 1552 | 0.93024 | |
| (202.5, 247.5] | 67 | 1673 | 0.83789 | |
| (247.5, 292.5] | 80 | 1895 | 0.88322 | |
| (292.5, 337.5] | 89 | 1758 | 1.05899 | |
| Height difference (m) | [0, 22] | 535 | 11464 | 0.97638 |
| (22, 51] | 68 | 659 | 2.15842 | |
| (51, 81] | 21 | 575 | 0.76390 | |
| (81, 114] | 10 | 432 | 0.48470 | |
| (114, 760] | 7 | 281 | 0.52118 | |
| Plan curve | [−1.10, −0.05] | 6 | 4577 | 0.02742 |
| (−0.05, 0.05] | 629 | 2583 | 5.09579 | |
| (0.05, 0.85] | 6 | 6251 | 0.02008 | |
| Profile curve | [−1.04, −0.05] | 1 | 1755 | 0.01192 |
| (−0.05, 0.05] | 584 | 9175 | 1.33168 | |
| (0.05, 1.24] | 56 | 2481 | 0.47224 | |
| Precipitation (mm) | [1967.24, 2031.19] | 257 | 1883 | 2.85587 |
| (2031.19, 2072.84] | 231 | 3949 | 1.22385 | |
| (2072.84, 2120.44] | 90 | 2972 | 0.63346 | |
| (2120.44, 2173.99] | 9 | 2869 | 0.06563 | |
| (2173.99, 2242.41] | 21 | 1080 | 0.40692 | |
| (2242.41, 2346.53] | 33 | 658 | 1.04981 | |
| TWI | [−1.20, 3.25] | 31 | 1941 | 0.33410 |
| (3.25, 6.25] | 128 | 2866 | 0.93445 | |
| (6.25, 8.67] | 111 | 2886 | 0.80479 | |
| (8.67, 10.70] | 129 | 1938 | 1.39286 | |
| (10.70, 13.02] | 120 | 2641 | 0.95057 | |
| (13.02, 23.46] | 122 | 1139 | 2.24033 | |
| Vegetation coverage | [0.31, 0.60] | 12 | 128 | 1.96509 |
| (0.60, 0.73] | 104 | 885 | 2.45785 | |
| (0.73, 0.81] | 274 | 2314 | 2.47758 | |
| (0.81, 0.86] | 191 | 3839 | 1.04095 | |
| (0.86, 0.90] | 60 | 6245 | 0.20100 |
| Models | Susceptibility Level | Classified Area/km2 | Proportion of Classified Area/% | Number of Landslide Points/pts | Proportion of the Number of Landslide Points/% | Density of Landslide Points/(pts/km2) |
|---|---|---|---|---|---|---|
| FR | Very low | 2335 | 17.41 | 5 | 0.78 | 0.00214 |
| Low | 2870 | 21.40 | 39 | 6.08 | 0.01359 | |
| Moderate | 2508 | 18.70 | 44 | 6.87 | 0.01754 | |
| High | 2773 | 20.68 | 110 | 17.16 | 0.03967 | |
| Very high | 2925 | 21.81 | 443 | 69.11 | 0.15145 | |
| FR-AHP | Very low | 2650 | 19.76 | 5 | 0.78 | 0.00189 |
| Low | 3251 | 24.24 | 53 | 8.27 | 0.01630 | |
| Moderate | 2214 | 16.51 | 38 | 5.93 | 0.01716 | |
| High | 2665 | 19.87 | 125 | 19.50 | 0.04690 | |
| Very high | 2631 | 19.62 | 420 | 65.52 | 0.15964 | |
| FR-LR | Very low | 2777 | 20.71 | 6 | 0.94 | 0.00216 |
| Low | 3370 | 25.13 | 50 | 7.80 | 0.01484 | |
| Moderate | 2185 | 16.29 | 47 | 7.33 | 0.02151 | |
| High | 3141 | 23.42 | 139 | 21.68 | 0.04425 | |
| Very high | 1938 | 14.45 | 399 | 62.25 | 0.20588 | |
| FR-BPNN | Very low | 2273 | 16.95 | 9 | 1.40 | 0.00396 |
| Low | 2678 | 19.97 | 34 | 5.31 | 0.01270 | |
| Moderate | 2749 | 20.50 | 43 | 6.71 | 0.01564 | |
| High | 3215 | 23.97 | 122 | 19.03 | 0.03795 | |
| Very high | 2496 | 18.61 | 433 | 67.55 | 0.17348 | |
| FR-SVM | Very low | 2245 | 16.74 | 6 | 0.94 | 0.00267 |
| Low | 2104 | 15.69 | 32 | 4.99 | 0.01521 | |
| Moderate | 2720 | 20.28 | 34 | 5.30 | 0.01250 | |
| High | 1753 | 13.07 | 63 | 9.83 | 0.03594 | |
| Very high | 4589 | 34.22 | 506 | 78.94 | 0.11026 |
| Evaluation | Elevation | Slope | Aspect | Height Difference | Plan Curve | Profile Curve | Precipitation | TWI | Vegetation Coverage | Weight |
|---|---|---|---|---|---|---|---|---|---|---|
| Elevation | 1 | 3 | 2 | 5 | 1 | 6 | 1 | 2 | 3 | 0.20970 |
| Slope | 1 | 2 | 2 | 2 | 6 | 1 | 2 | 4 | 0.16710 | |
| Aspect | 1 | 4 | 1 | 4 | 1/2 | 2 | 2 | 0.11630 | ||
| Height difference | 1 | 1/2 | 1 | 1/3 | 1/4 | 1/3 | 0.04030 | |||
| Plan curve | 1 | 4 | 1/2 | 2 | 2 | 0.11880 | ||||
| Profile curve | 1 | 1/2 | 1/4 | 1/2 | 0.03460 | |||||
| Precipitation | 1 | 2 | 2 | 0.15730 | ||||||
| TWI | 1 | 1 | 0.08770 | |||||||
| Vegetation coverage | 1 | 0.06830 |
Publisher’s Note: MDPI stays neutral with regard to jurisdictional claims in published maps and institutional affiliations. |
© 2022 by the authors. Licensee MDPI, Basel, Switzerland. This article is an open access article distributed under the terms and conditions of the Creative Commons Attribution (CC BY) license (https://creativecommons.org/licenses/by/4.0/).
Share and Cite
Fan, H.; Lu, Y.; Hu, Y.; Fang, J.; Lv, C.; Xu, C.; Feng, X.; Liu, Y. A Landslide Susceptibility Evaluation of Highway Disasters Based on the Frequency Ratio Coupling Model. Sustainability 2022, 14, 7740. https://0-doi-org.brum.beds.ac.uk/10.3390/su14137740
Fan H, Lu Y, Hu Y, Fang J, Lv C, Xu C, Feng X, Liu Y. A Landslide Susceptibility Evaluation of Highway Disasters Based on the Frequency Ratio Coupling Model. Sustainability. 2022; 14(13):7740. https://0-doi-org.brum.beds.ac.uk/10.3390/su14137740
Chicago/Turabian StyleFan, Huadan, Yuefeng Lu, Yulong Hu, Jun Fang, Chengzhe Lv, Changqing Xu, Xinyi Feng, and Yanru Liu. 2022. "A Landslide Susceptibility Evaluation of Highway Disasters Based on the Frequency Ratio Coupling Model" Sustainability 14, no. 13: 7740. https://0-doi-org.brum.beds.ac.uk/10.3390/su14137740