
Smart Waste Management and Classification Systems Using Cutting Edge Approach


1
Department of Computer Science, University of Management and Technology, Sialkot 51310, Pakistan
2
Instituto de Telecomunicações, Universidade da Beira Interior, 6200-001 Covilhã, Portugal
*
Authors to whom correspondence should be addressed.
†
These authors contributed equally to this work.
Sustainability 2022, 14(16), 10226; https://0-doi-org.brum.beds.ac.uk/10.3390/su141610226
Submission received: 6 July 2022
/
Revised: 10 August 2022
/
Accepted: 12 August 2022
/
Published: 17 August 2022
(This article belongs to the Special Issue Sustainable Smart Cities and Societies Using Emerging Technologies)
Abstract
:With a rapid increase in population, many problems arise in relation to waste dumps. These emits hazardous gases, which have negative effects on human health. The main issue is the domestic solid waste collection, management, and classification. According to studies, in America, nearly 75% of waste can be recycled, but there is a lack of a proper real-time waste-segregating mechanism, due to which only 30% of waste is being recycled at present. To maintain a clean and green environment, we need a smart waste management and classification system. To tackle the above-highlighted issue, we propose a real-time smart waste management and classification mechanism using a cutting-edge approach (SWMACM-CA). It uses the Internet of Things (IoT), deep learning (DL), and cutting-edge techniques to classify and segregate waste items in a dump area. Moreover, we propose a waste grid segmentation mechanism, which maps the pile at the waste yard into grid-like segments. A camera captures the waste yard image and sends it to an edge node to create a waste grid. The grid cell image segments act as a test image for trained deep learning, which can make a particular waste item prediction. The deep-learning algorithm used for this specific project is Visual Geometry Group with 16 layers (VGG16). The model is trained on a cloud server deployed at the edge node to minimize overall latency. By adopting hybrid and decentralized computing models, we can reduce the delay factor and efficiently use computational resources. The overall accuracy of the trained algorithm is over 90%, which is quite effective. Therefore, our proposed (SWMACM-CA) system provides more accurate results than existing state-of-the-art solutions, which is the core objective of this work.
1. Introduction
Waste management requires necessary processes and activities to dominate from its inception to demolition. Waste comes in solid, liquid, or gaseous form, and every type of waste demands a different method of classification, disposal, and management. Waste management deals with every waste category, including household, organic, industrial, municipal, biomedical, organic, biological, and radioactive waste. Any unnecessary substance or substance with no use is called “waste”. Waste management involves the collection of the waste [1] and its transport and disposal to appropriate locations [2]. In the European Union (EUROPA), 423 million tons or 56% of domestic waste was recycled in 2016. Reports reflect the need for proper household waste management for the recycling process [3]. According to [4], most of the Earth’s population will emigrate from rural to urban areas in the coming years. Therefore, bigger cities will require a highly sustainable infrastructure and smart waste management system to fulfill the fundamental needs of its citizens and provide them with a good service for the future [5,6].
Traditional recycling processes segregate waste objects manually or by applying a sequence of filters. If modern technology and waste management could be bound together, the results would be immeasurable and would lead to a positive biological environment [7]. With the rapid increase in computing power, there has been a lot of advancement in image processing [8] and computer vision [9]. A deep-learning architecture named convolutional neural network (CNN) has played a pivotal role in this regard [8]. By applying deep learning, waste objects can be identified and classified more efficiently, reducing the cost in terms of both time and human resources, and impacting the environment positively [10,11].
According to an estimation by FUSON [12], 127 new devices are connected to public networks every second. Given this speedy growth, 328 million new devices are added monthly. According to STATISTA, at the end of 2023, the IoT market will be projected to be worth $1.1 trillion [13]. These statistics suggest that IoT is becoming a significant element in modern computing techniques. In the modern web, the Internet of Things (IoT) [14], Machine-Learning (ML) [15], and Deep-Learning (DL) [14] phenomena are being enabled in various systems such as Wireless Sensor Networks (WSNs), Radio Frequency Identification (RFID) [16], sensors, and actuators. Prediction methods such as clustering and classification [17] are also used to create the most accurate results instead of individuals. This project has had a major significance on people’s daily lifestyle, because if a city’s waste is well collected, managed, and classified, the city will enjoy better living standards and a healthy lifestyle. Our research provides a deeper exploration, solution, and answers to the following research questions:
RQ1: How can we perform waste segmentation for the dump area?
RQ2: How can we classify waste items into different categories directly by developing a smart system?
The problem is not only to gather the waste from door to door; there is also a need for a proper plan to collect the waste, transport waste to a specific location, monitor the waste, and prepare and recycle waste. Therefore, to solve the huge waste collection, management, and classification problem, we proposed and implemented smart waste management and classification system using cutting-edge technology (cloud computing, edge computing, fog computing) where necessary actions can be taken in waste management. A system was employed with the Internet of Things (IoT), Global Positioning System (GPS), Wireless sensor, camera, and Deep Learning algorithms to segment and classify waste objects.
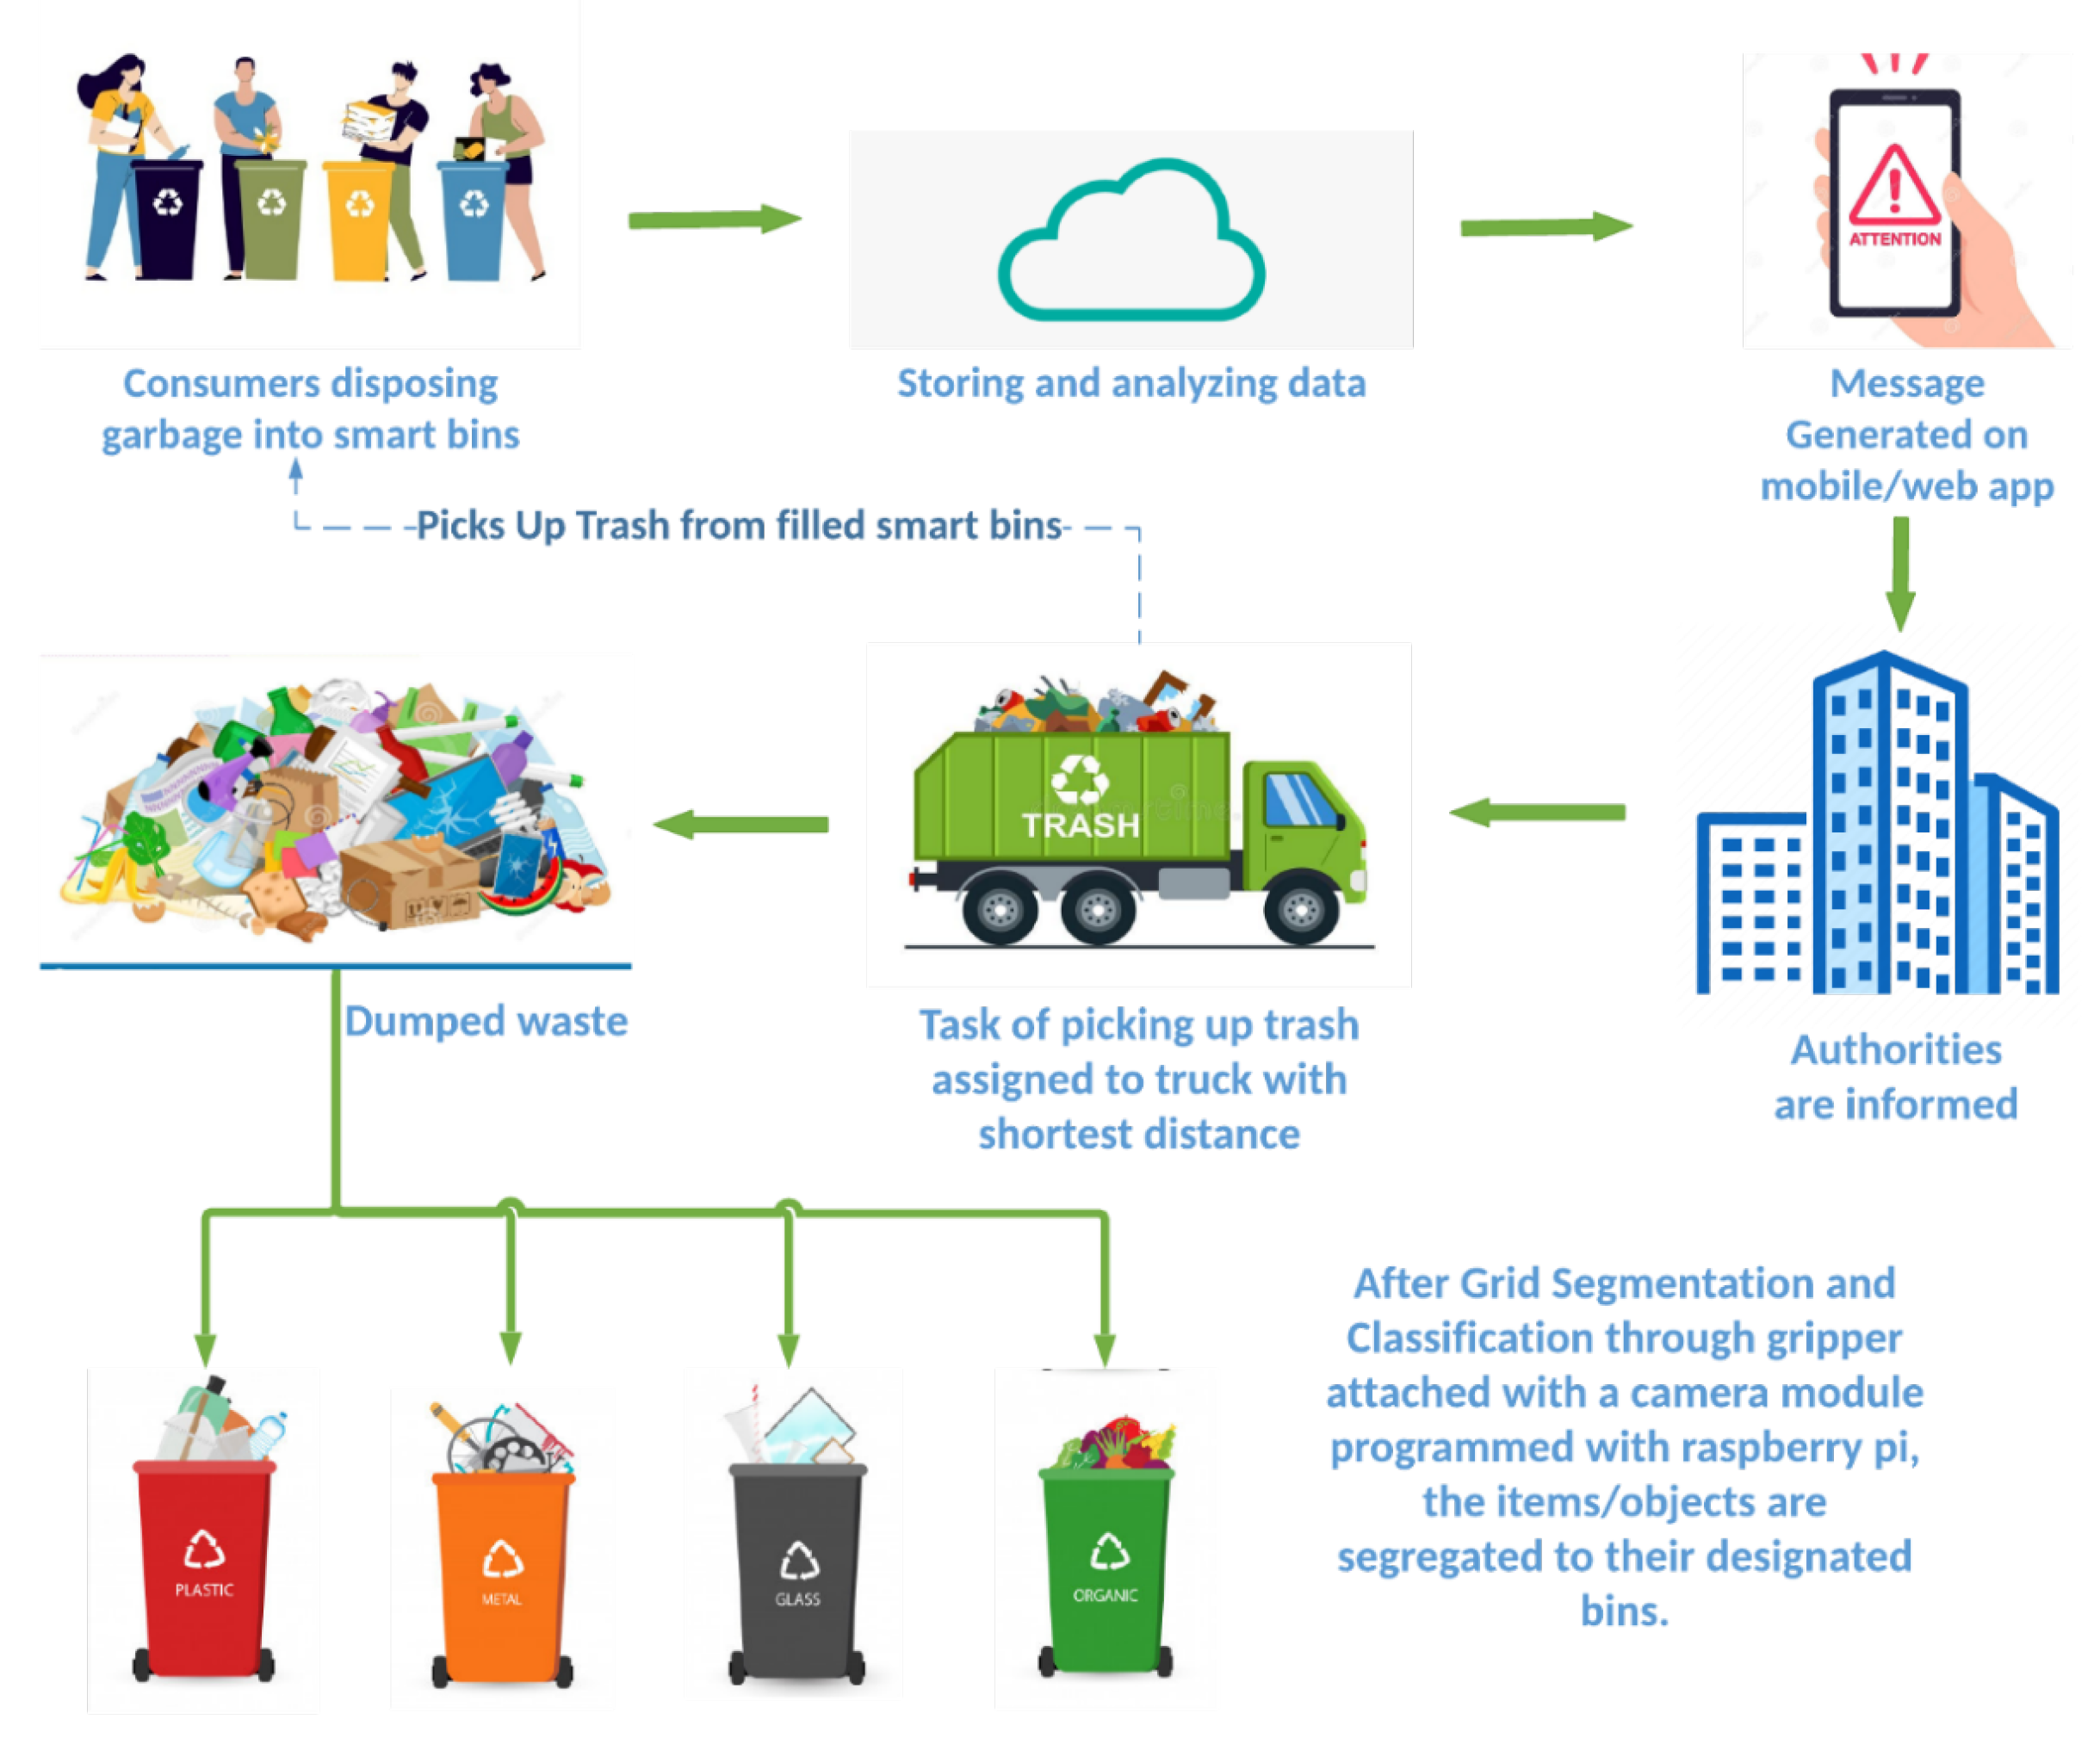
Numerous types of sensors are used in this project. Their purpose is to gather information about waste material and thus enhance the city’s infrastructure by successfully implementing waste management and classification tasks. The physical infrastructure of our system consists of waste bins, a fleet of vehicles, gripper, dump, etc. First, the household waste is collected in our smart waste bin, whose data are stored on the cloud, and a message on the web/mobile application is generated when the bin gets full. Afterward, the authorities assign a waste collection truck to collect the waste from the waste bin and take it to the dumping area of the waste, where the segmentation and classification of waste are performed as shown in Figure 1.
We focus on a specific application domain, segmentation, and waste management classification. For the waste segmentation, we use a grid segmentation mechanism that makes segments of waste. Then, a gripper with a camera connected with raspberry Pi starts picking waste items. After performing the classification, it places that specific item in the designated bin. In this way, firstly, waste is classified into bio and non-bio waste, and then in the case of non-bio waste, it is categorized into three sub-types, i.e., plastic, glass, and metal. We implemented this system in a controlled environment with a predefined dump area. Our research contributions are summarized as follows:
- We combine IoT and deep learning paradigms to ensure an optimal solution for waste management.
- We design a waste classification model (WCM) that classifies the waste into biodegradable and non-biodegradable items, such as plastic, metal, glass, etc., using the image classification technique.
- We implement an architectural development process of smart waste dump using the segmented grid image captured by a camera mounted on the raspberry pie.
- We develop a smart way to monitor the waste dump in real time using a cutting-edge approach that decreases the overall latency and improves energy utilization.
- We combine the cloud and edge processing mechanism as a hybrid computing phenomenon which improves the overall performance of the proposed system.
- We perform a performance analysis of the proposed system results.
2. Literature Review
With the rapid modernization of every sector of society, nowadays, people rely on technology for everything. In this growing age, human lives have changed a lot, and modern technology has taken its place in the heart of every human being. Undoubtedly, there is no field in our surroundings where technology does not play a vital role. People prefer to live in cities with the latest facilities and technology. As a result, the population in cities is increasing daily, which has many disadvantages and advantages [18,19]. Individuals working in cities have a positive effect on the economy of the country [20,21]. Still, as societies become increasingly congested, many problems related to health, safety, and the environment arise [22,23,24,25]. These problems include medical facilities, security, privacy, and transportation [26,27].
Another huge problem in cities nowadays is waste management, which involves the collection, transportation, and classification of waste, and also helps with recycling waste items [27,28]. Intensive usage of natural resources has become unavoidable [29]. In contrast, due to increasing consumption trends, waste objects have reached levels that endanger human health and the environment in quantity and harmful content. Chemical, manufacturing, physical, and consumption properties are the considerations used to classify waste items [30,31]. Most of the population of growing cities is educated and well aware of the environmental effects of waste, but they dispose of their waste without classifying it. Everything in this universe has two aspects; one is good, and one is bad. Man feels this when it happens to him, or his belongings [3]. Several countries have placed bins with separate compartments for different waste categories. Still, the dwellers are not following the rules, which makes waste management and classification a complex task that needs a specific system to be designed to perform waste classification automatically [32,33].
According to [34,35,36,37], it has been proved that nearly 0.75% of solid domestic waste can be recycled. Therefore, it will be costly to dump it and not recycle it. If these waste items are classified, it will boost the recycling process, which will positively affect the economic boost of the country [38]. It will also provide a much greener environment for future generations to live in [39]. In short, failing to prioritize recycling can cause wastage of natural resources, and financial loss [40,41]. Recycling is a viable solution, though it can be daunting to classify waste accurately. The efficient management of waste has a significant impact on people’s quality of life. The reason is that waste disposal has a clear connection with adverse effects on the environment, and thus, people’s health. Therefore, there is a need for a proper plan for a waste management system for the betterment of the people who want to live in a healthy environment [42,43].
Various countries such as America, Canada, Russia, Italy, Malaysia, the Kingdom of Saudi Arabia, Qatar, etc., and many other countries are working to develop a smart waste management system. In previous work, the waste management technique which was implemented in St. Petersburg, Russia, used Wireless Sensor Networks (WSNs), Radio Frequency Identification (RFID) [44], sensors, and actuators. St. Petersburg is a city of 5 million individuals [45]. On average, 1.7 million tons of solid waste is produced in the city annually. Whereas, in Canada [46] the k-means and linear regression are used for waste management systems, in which multiple beats are involved to regulate the cycle.
In [47], single waste image classification was performed using SVM with SIFT and CNN. They manually collected a total of 2527 waste images. SVM and CNN models were trained on the collected dataset and achieved 63% and 22% accuracy, respectively. Their research classifies waste into six categories; paper, metal, cardboard, plastic, glass, and trash [48]. Municipal solid waste can be classified into either six or four categories. In six-class systems [49,50,51,52] researchers focus on recyclable waste classes: paper, metal, glass, cardboard, plastic, and trash. In four-class systems [53,54,55,56,57] waste classes are wet waste, i.e., probably kitchen waste, dry garbage, recyclable and hazardous garbage. A ResNet-5013 model and SVM-based intelligent system was proposed in [58]. The system was tested on a single waste images dataset [53] and gained 87% accuracy in classification. In public places for automatic detection of recyclable wastes, a multilayered hybrid deep-learning-based system was proposed [59]. The system was employed with CNN for image features extraction and a multilayered perceptron used for consolidating only relevant features of the image. Their proposed technique outperforms and achieves an accuracy of 90% for classification. A CNN-based system was developed to classify plastic wastes [60].
For Municipal Solid Waste (MSW), derived classifier models [61] were proposed based on transfer learning. Models were retrained on 9200 MSW images by pertained classifiers of CNN (VGG16, MobileNetV2, ResNet50, and DenseNet121) to classify the waste into four predefined groups (recyclable waste, hazardous waste, compostable waste, and general waste). In [62], the authors proposed an image classifier to identify the waste item and classify its category. In their research, four classifiers of CNN (VGG16, DenseNet169, ResNet50, and AlexNet) trained on the ImageNet dataset were used for feature extraction from waste images to classify them into six categories: paper, metal, cardboard, plastic, glass, and trash. Their results reflect that ResNet50 performs better, and its performance is closer to DenseNet169. The flaw in their proposed mechanism is that it misclassifies glass. Since the ILSVRC Competition, different image classification methods based on CNN architectures have developed [63,64,65]. In image classification of computer vision, VGG16 and VGG19 (also known as VGGNet) are two representatives of CNN architectures, achieving the best performance in the ILSVRC Competition. For large-scale image recognition, these models use 3 × 3 tiny convolutional filters in every layer and push the depth of the network from 16–19 layers.
Recent studies reported that deep learning (DL) models are more effective for object detection and classification than traditional techniques. Due to rapid urbanization, smart cities are being designed with smart and automated waste management using the internet of things (IoT) technologies that lead to an increase in efficiency and flexibility, saving energy and time and keeping the environment sustainable [8,66,67,68,69,70,71]. IoT-based solutions provide real-time monitoring, collecting, and management of garbage. In [72], the authors developed IoT-based smart bins using deep learning (DL) and machine learning (ML) models to monitor, collect, manage waste, and forecast air pollutants present in the surrounding environment. An IoT stationed smart waste segregation and management system was developed by Shamin et al. [73] employed with an ultrasonic sensor, a moisture sensor, a metal sensor, and a camera. Image processing and machine learning algorithms were used to identify degradable waste items and segregate them into different dustbins.
Before proposing a solution of our own, our research covered a wide range of previously proposed models, papers, and studies. All the research and studies were thoroughly read and understood, considering their domain of interest, their architecture, the pros and cons, the features added in their studies, and the accuracy of the architecture proposed. After critically evaluating many studies on waste management and classification, some crucial information about these studies is provided in Table 1 and Table 2. So, the readers can have an overview of the previous work carried out by researchers, practitioners, authors, and technologists related to the subject mentioned.
Previous studies have their benefits and limitations, and having their results in mind helped us propose a system that can overcome all the limitations. Previous research studies solved the issue of waste classification and management to some extent, but all of them lag one way or the other. Some have combined multiple approaches to propose a hybrid solution. The best-known accuracy has been achieved through the hybrid approach of Deep Learning algorithms: Inception and ResNet. The accuracy achieved was over 88% in classifying waste items.
Similarly, many proposed systems have a hybrid solution consisting of “machine learning and deep learning”. Still, the search for a more accurate and reliable system continues. Our research aims to focus on observing and understanding traditional methods for automatic waste classification systems, which can further help in the recycling process of waste items. Currently, many techniques for waste classification exist, but many require human involvement. If a fully automatic system is deployed in any society, it will be a win–win situation for the government, societies, and industrialists. The underlying purpose of this research is to provide an automated waste management system that can perform classification quickly and provide better and more accurate results at a low cost.
3. Proposed Methodology
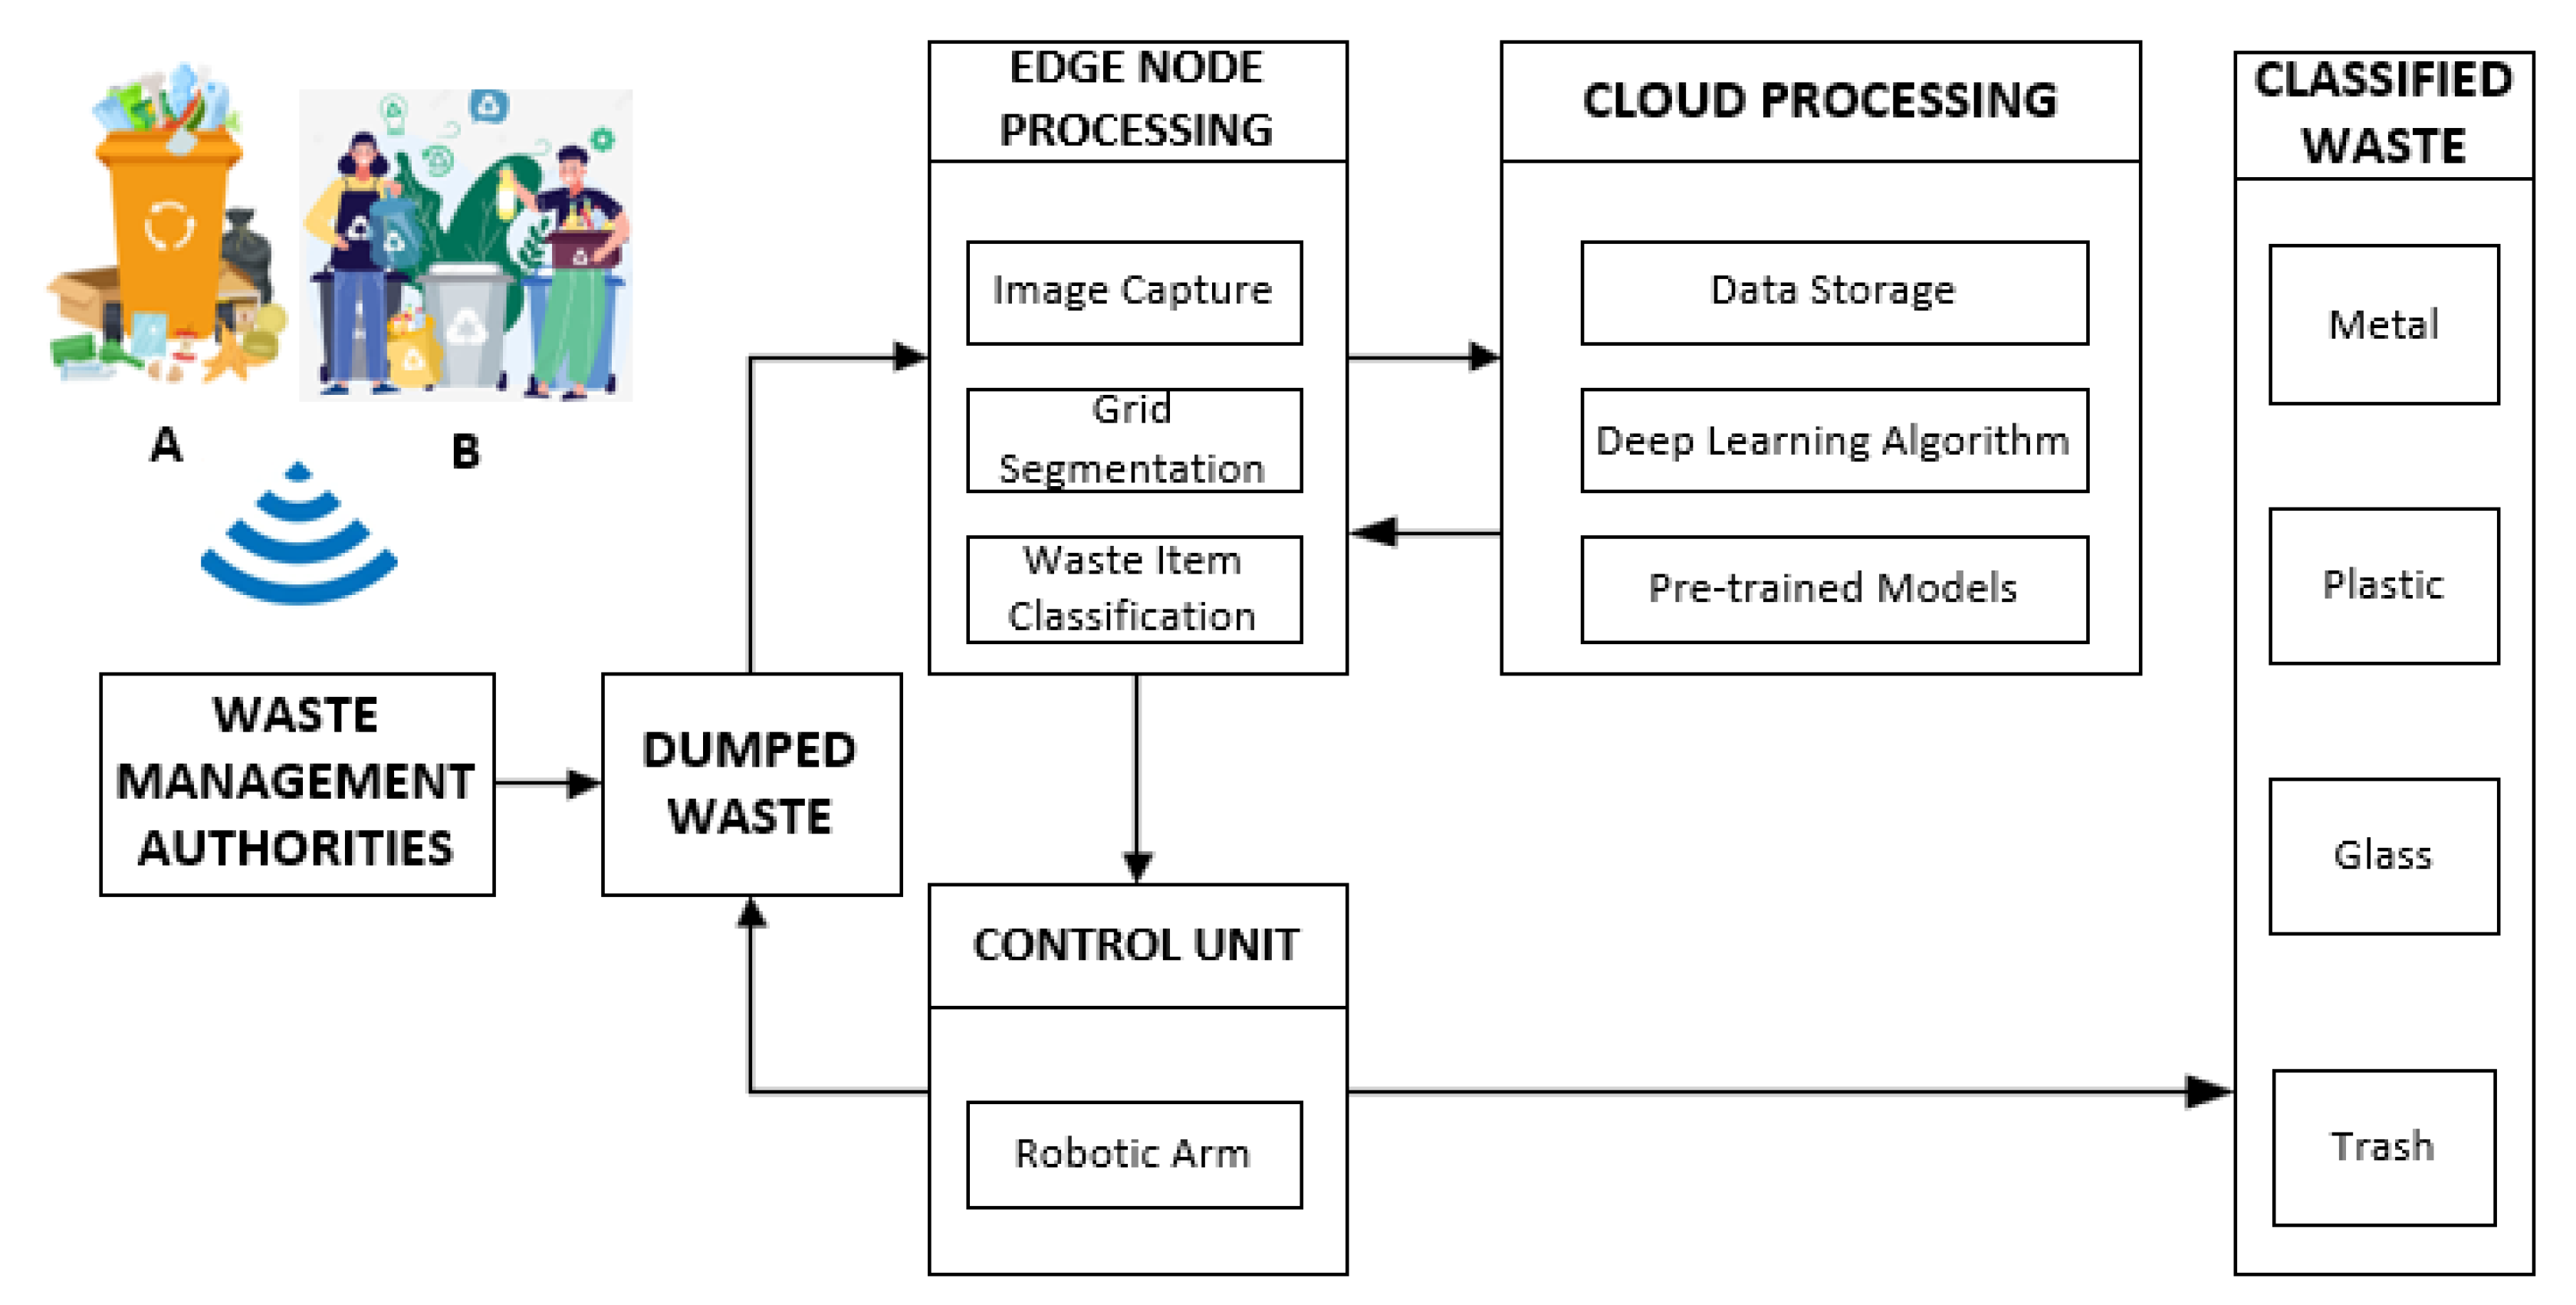
The main focus of this research is to develop a system for the segregation of solid waste, mainly recyclables, as our proposed model is not a simple system for classifying waste. It is proposed by carefully understanding all aspects and constraints of waste classifications. All the functional and non-functional requirements for waste classification will be achieved throughout the implementation of the system. Figure 2 shows a simplified system approach in which, firstly, the waste bins are equipped with sensors to keep the level of waste in the bins. Waste management authorities collect waste from all commercial and domestic locations. Secondly, a camera is used to capture the image of the waste dump. A grid segmentation approach is applied to the image to divide it into grids. This image is fed into a trained deep learning algorithm named VGG-16, which performs identification. A classifier further determines the class of every waste object and segregates it to the corresponding waste container using a robotic arm or gripper. Edge computing is used along with cloud computing to decrease the overall latency. The proposed waste classification model’s whole system is divided into three main modules, i.e., Edge Node Processing, Cloud Processing, and Control Unit. It is further divided into multiple sub-stages shown in Figure 2, discussed below:
3.1. Edge Node Processing
The edge node becomes the fundamental unit of the proposed system. It minimizes the overall response time of the system, as it is close to the source of data and efficiently uses computational resources to accomplish the desired tasks. We used raspberry pi 4 as an edge node to make it more effective in a real-time application. This stage is accomplished in three phases, i.e., image capturing, grid segmentation, and waste item classification.
3.1.1. Image Capture
The pie-cam is mounted on the edge node to captures a waste-dumped area image. In the center of the pie cam sensor focus, the image size should be 1440 × 1080 pixels from a 5 mega-pixels pie cam. The captured image is further processed in the later phases to recognize the waste items effectively.
3.1.2. Grid Segmentation
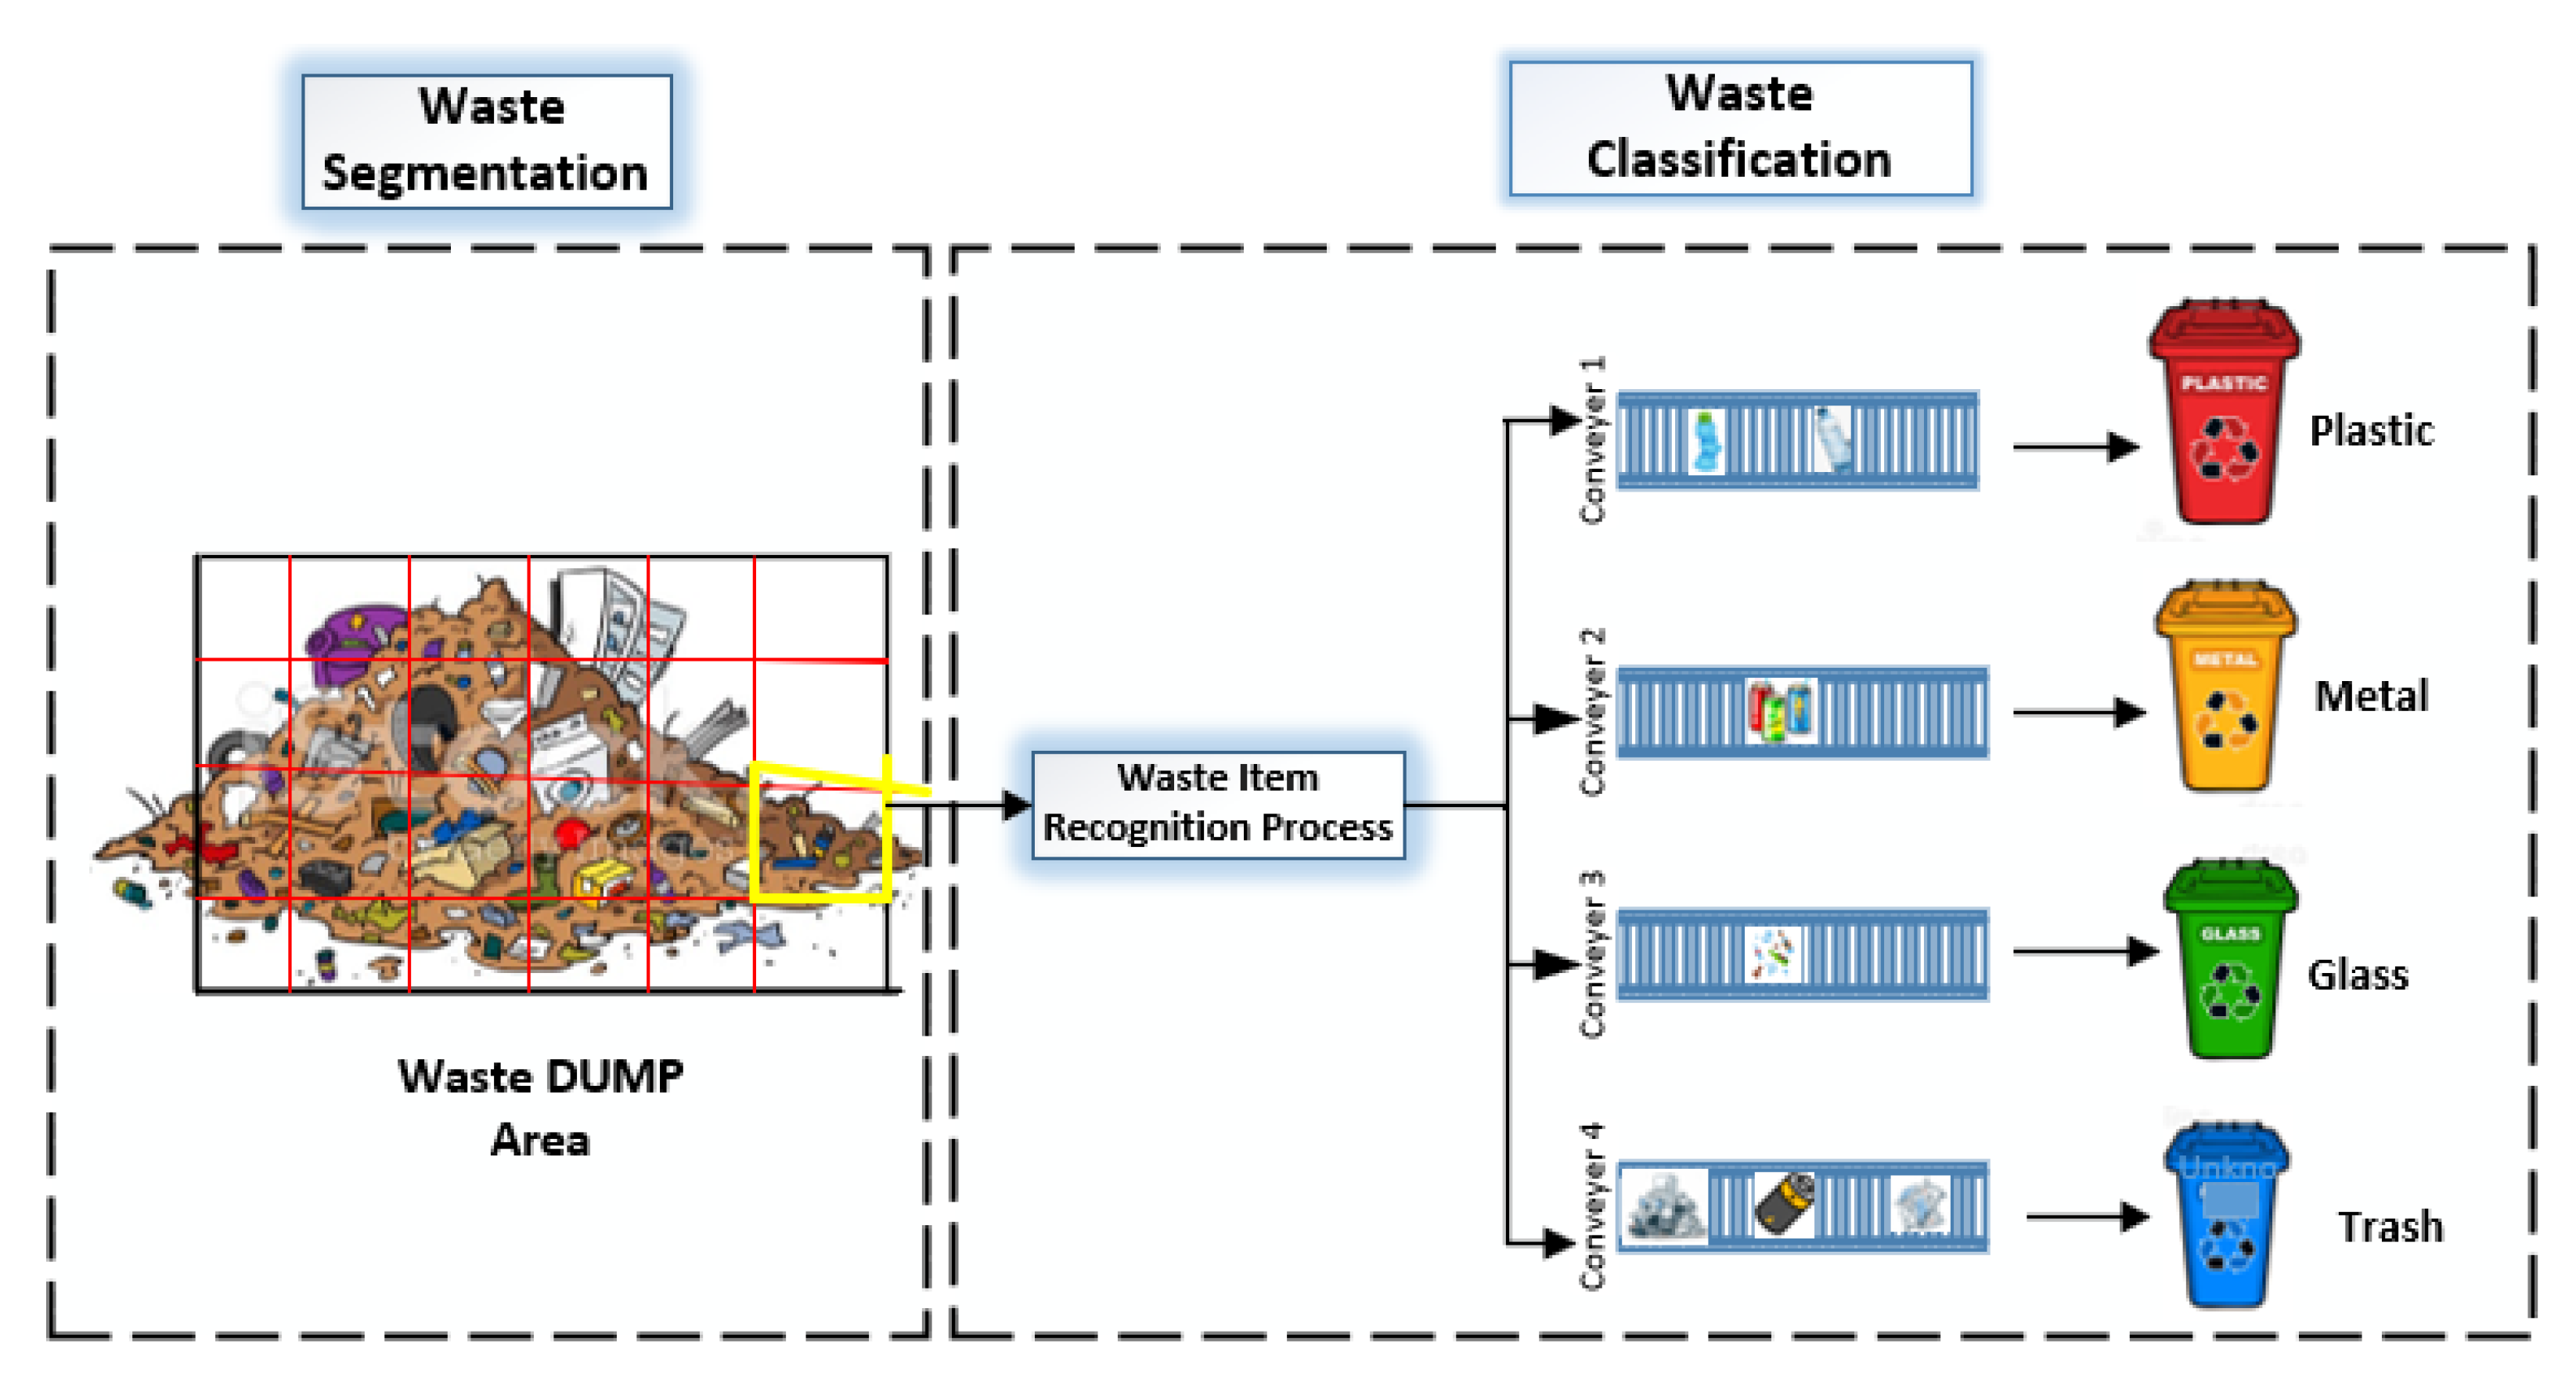
Grid segmentation strategy is used to split the whole test image into grid-like cell structures. We took the test image from the pile of a waste dump in a controlled environment; as shown in Figure 3, it contains a lot of waste objects in a single test image. Thus, it is difficult to segregate the waste items in real time. To make the proposed waste classification mechanism more effective, we divide the test image into grid-like cell structures. It has a meager computational cost and better performance overall. We apply the grid-like cell process in two phases:
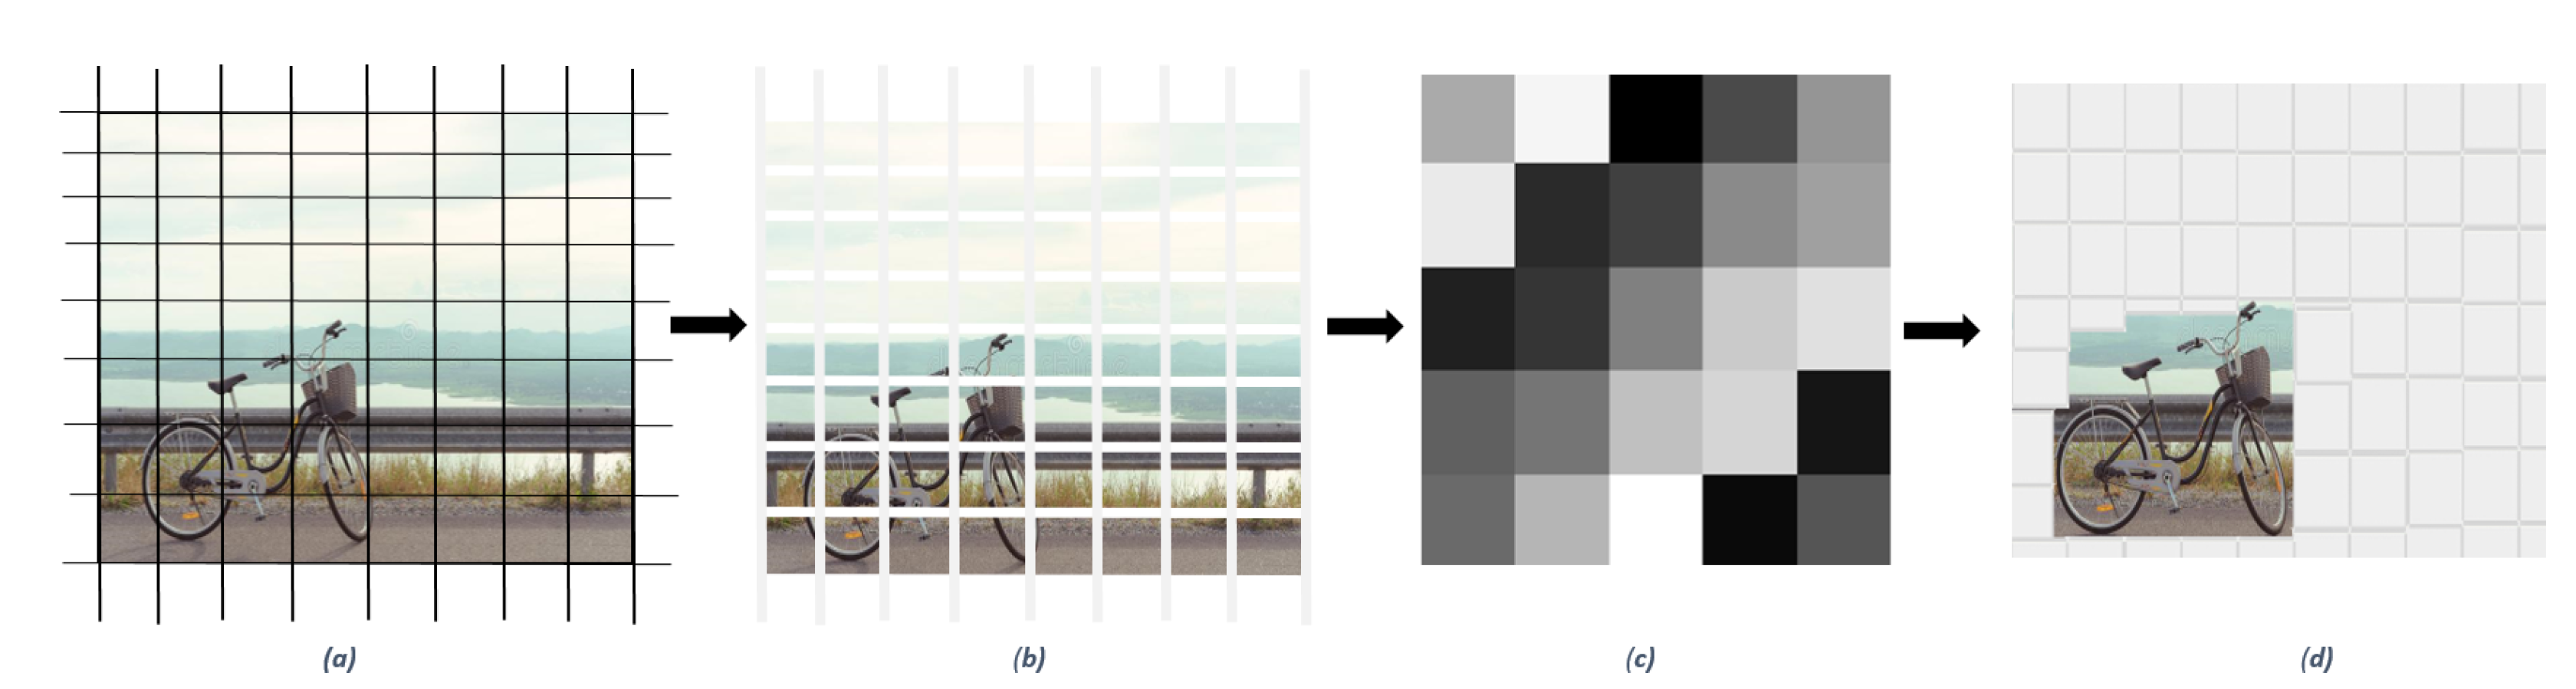
- Phase 1: In the first step, we map the captured image of a waste dump on a grid-like cell structure, i.e., 5 × 6 matrix, of the same resolutions, and convert it into grayscale. The size of the grid and the total number of cells depend on the test image size.
- Phase 2: In the second step, initial classification is performed, and labels are applied based on the texture, color, and position features of each segment by the VGG-16 algorithm as dicussed in Section 3.3.2. Each cell segment is processed separately to recognize the waste items appropriately. After that, we move from one segment to another column-wise to the VGG16 algorithm to recognize the waste item effectively. Each cell contains one waste object at a time, which is ultimately picked by the robotic arm and placed in a respective bin. This process continues until the whole test image has been processed. Incorrect segments are put back, and final labeling or classification consists of the union of only correct segments.
Further, limitations in the training data set are as follows: we have items in a segregated form, i.e., a single object in each image. So, for a time, we conduct our experiment under a single object in each grid cell and under control conditions, as the training data set was acquired with proper luminance and related parameters. However, chipping the test image makes it easier to recognize the waste item from the waste dump. It does not chip the single waste item; in fact, it chips the overall test image which contains multiple waste items into a grid-like cell structure. The resolution of the test image cell after the grid segmentation technique is being set according to the trained image size in the pre-processing stage. Finally, we obtain the results with a minute difference in terms of accuracy due to the similar environment (as in the training dataset) provided during the experimental setup, discussed in Section 4.
For example, an image is shown in Figure 4-a) is divided into grids, i.e., the division of the image into rows and columns. Figure 4-b) represents the grids split into segments and forwarded into the next part one by one to get the best result. In Figure 4-c), each segment is converted into grayscale. The image is again merged into its original shape shown in Figure 4-d) to make sure the test image is complete.
3.1.3. Waste Item Classification
Once the waste dumped image is converted into the grid-like structure, each grid cell is processed to recognize the appropriate waste item, as shown in Figure 3. We use the VGG16, a deep learning-based classification mechanism, to identify the waste item. The segregated waste item is managed with the help of the control unit, as discussed in the control unit module.
3.2. Control Unit
The control unit is the core part of the whole system. It can generate control signals based on the input received from the edge processing module. It controls the robotic arm movement according to its degree of freedom (DOF) specification. We use the four DOF robotic arm gripper to pick the recognized waste item to place it into the segregated waste bin as per the recognized waste item category, i.e., metal, plastic, glass, and trash, received from the edge processing module.
3.3. Cloud Processing
The cloud processing platform assists in computing heavy processing processes and algorithms. It can also facilitate managing and storing large datasets on which the whole system can be trained. The major processes of this module are data storage, deep learning algorithm, and pre-trained model, as shown below:
3.3.1. Data Storage
We use the “trashnet” waste items dataset. It comprises 2527 waste item images; details are mentioned in Section 4.1. To compute this dataset, we need to store it on a dedicated storage resource, as the edge node cannot handle this vast dataset. So, we use cloud storage resources to place this dataset, which was ultimately processed by the Google AI module for deep-learning model computations on the cloud.
3.3.2. Deep Learning Algorithm
In computer vision, the trend is to design more complicated and deeper networks to achieve higher accuracy. However, deeper networks also reflect some trade-off of speed and size. Intuitively, deeper networks should not perform worse than shallower ones, but in practice, the deeper networks perform worse than shallower. In short, deeper networks are harder to optimize. In real time smart applications, such as in our Internet of Things (IoT)-based system, the object detection and recognition tasks must be able to be performed with computationally limited cost and time. VGG16 alternative networks are computationally costly. The VGG16 network is characterized by its simplicity and deeper architecture with smaller kernel sizes; thus, it is suitable for our real-time smart waste classification process with greater efficiency and speed. We train multiple deep-learning classification models such as Fast-RCNN, MobileNetV2, and VGG16 on trashnet dataset to recognize the appropriate waste item from the waste dump image. We find VGG16 performs best for the proposed smart waste classification system. After that, the trained file is imported into the edge node to recognize the appropriate waste item based on the test waste dump image in real time. It also generates the proper input for the control unit to effectively control the robotic arm movements, as discussed in Section 4.
4. Experimental Setup
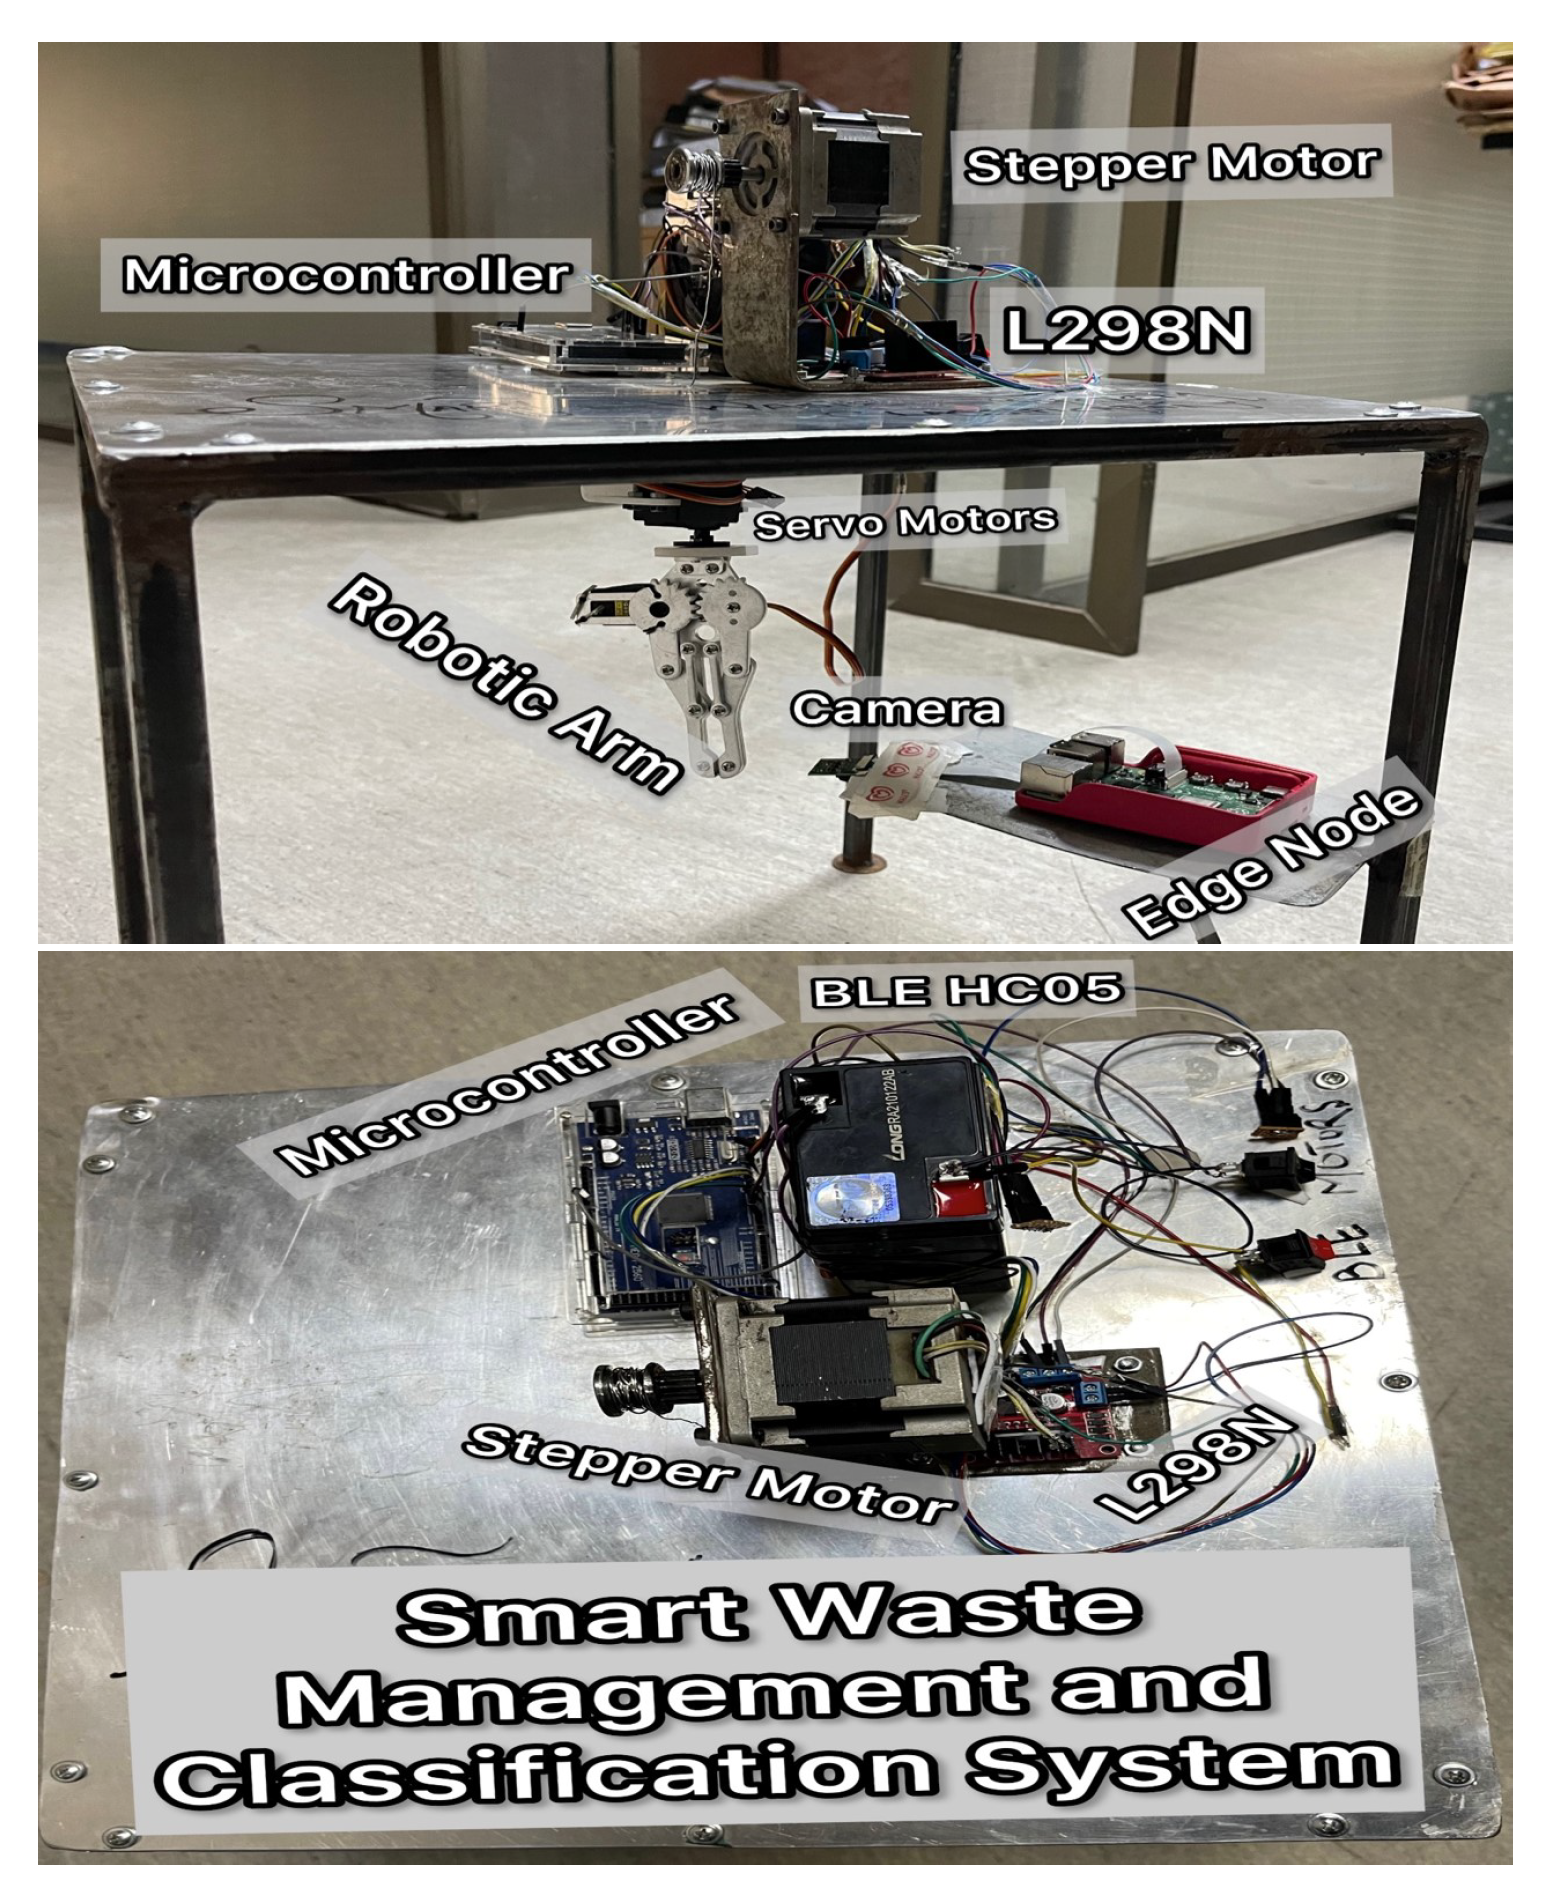
In the proposed smart waste classification mechanism, we aim to classify the waste items, i.e., plastic, glass, metal, and trash, from the waste dump in real time. To accomplish this task, we develop three modules, i.e., Edge node processing, Cloud processing, Control unit, and Power source, as discussed in Section 3. The edge node takes inputs from the pie cam and the cloud platform, which ultimately controls the robotic arm through the control unit, respectively. The training of the classification model is entirely carried out on the cloud AI module, which is being tested on the edge node in real-time. The hardware components of each module of the proposed system are elaborated in the Table 3, respectively.
The components are interconnected and embedded in a single module to make it a smart waste classification system. The waste items are picked from the dump and dropped in a specified bin by a 4-DOF gripper, which operates on the inputs received from raspberry pi. Arduino controls the gripper’s movement and the movement of all motors associated with it, and the edge node (Raspberry pi) performs all the computation and classification based on the pie cam input image in a real-time environment. Figure 5 represented the visual assembly of the proposed system components. As for the experimental setup, pie cam mounted with edge node hanging at the distance of 45 cm. The overall waste dump area is cm2, and the gripper is hanging in the middle of the mechanical assembly at a distance of 60 cm from the surface. It can move up and down through the steel string folded on the moveable pulley attached to the stepper motor. The waste dump is inside the mechanical model on the surface. It is picked after the grid segmentation technique and classification output, as discussed in Section 3.
4.1. Dataset Description
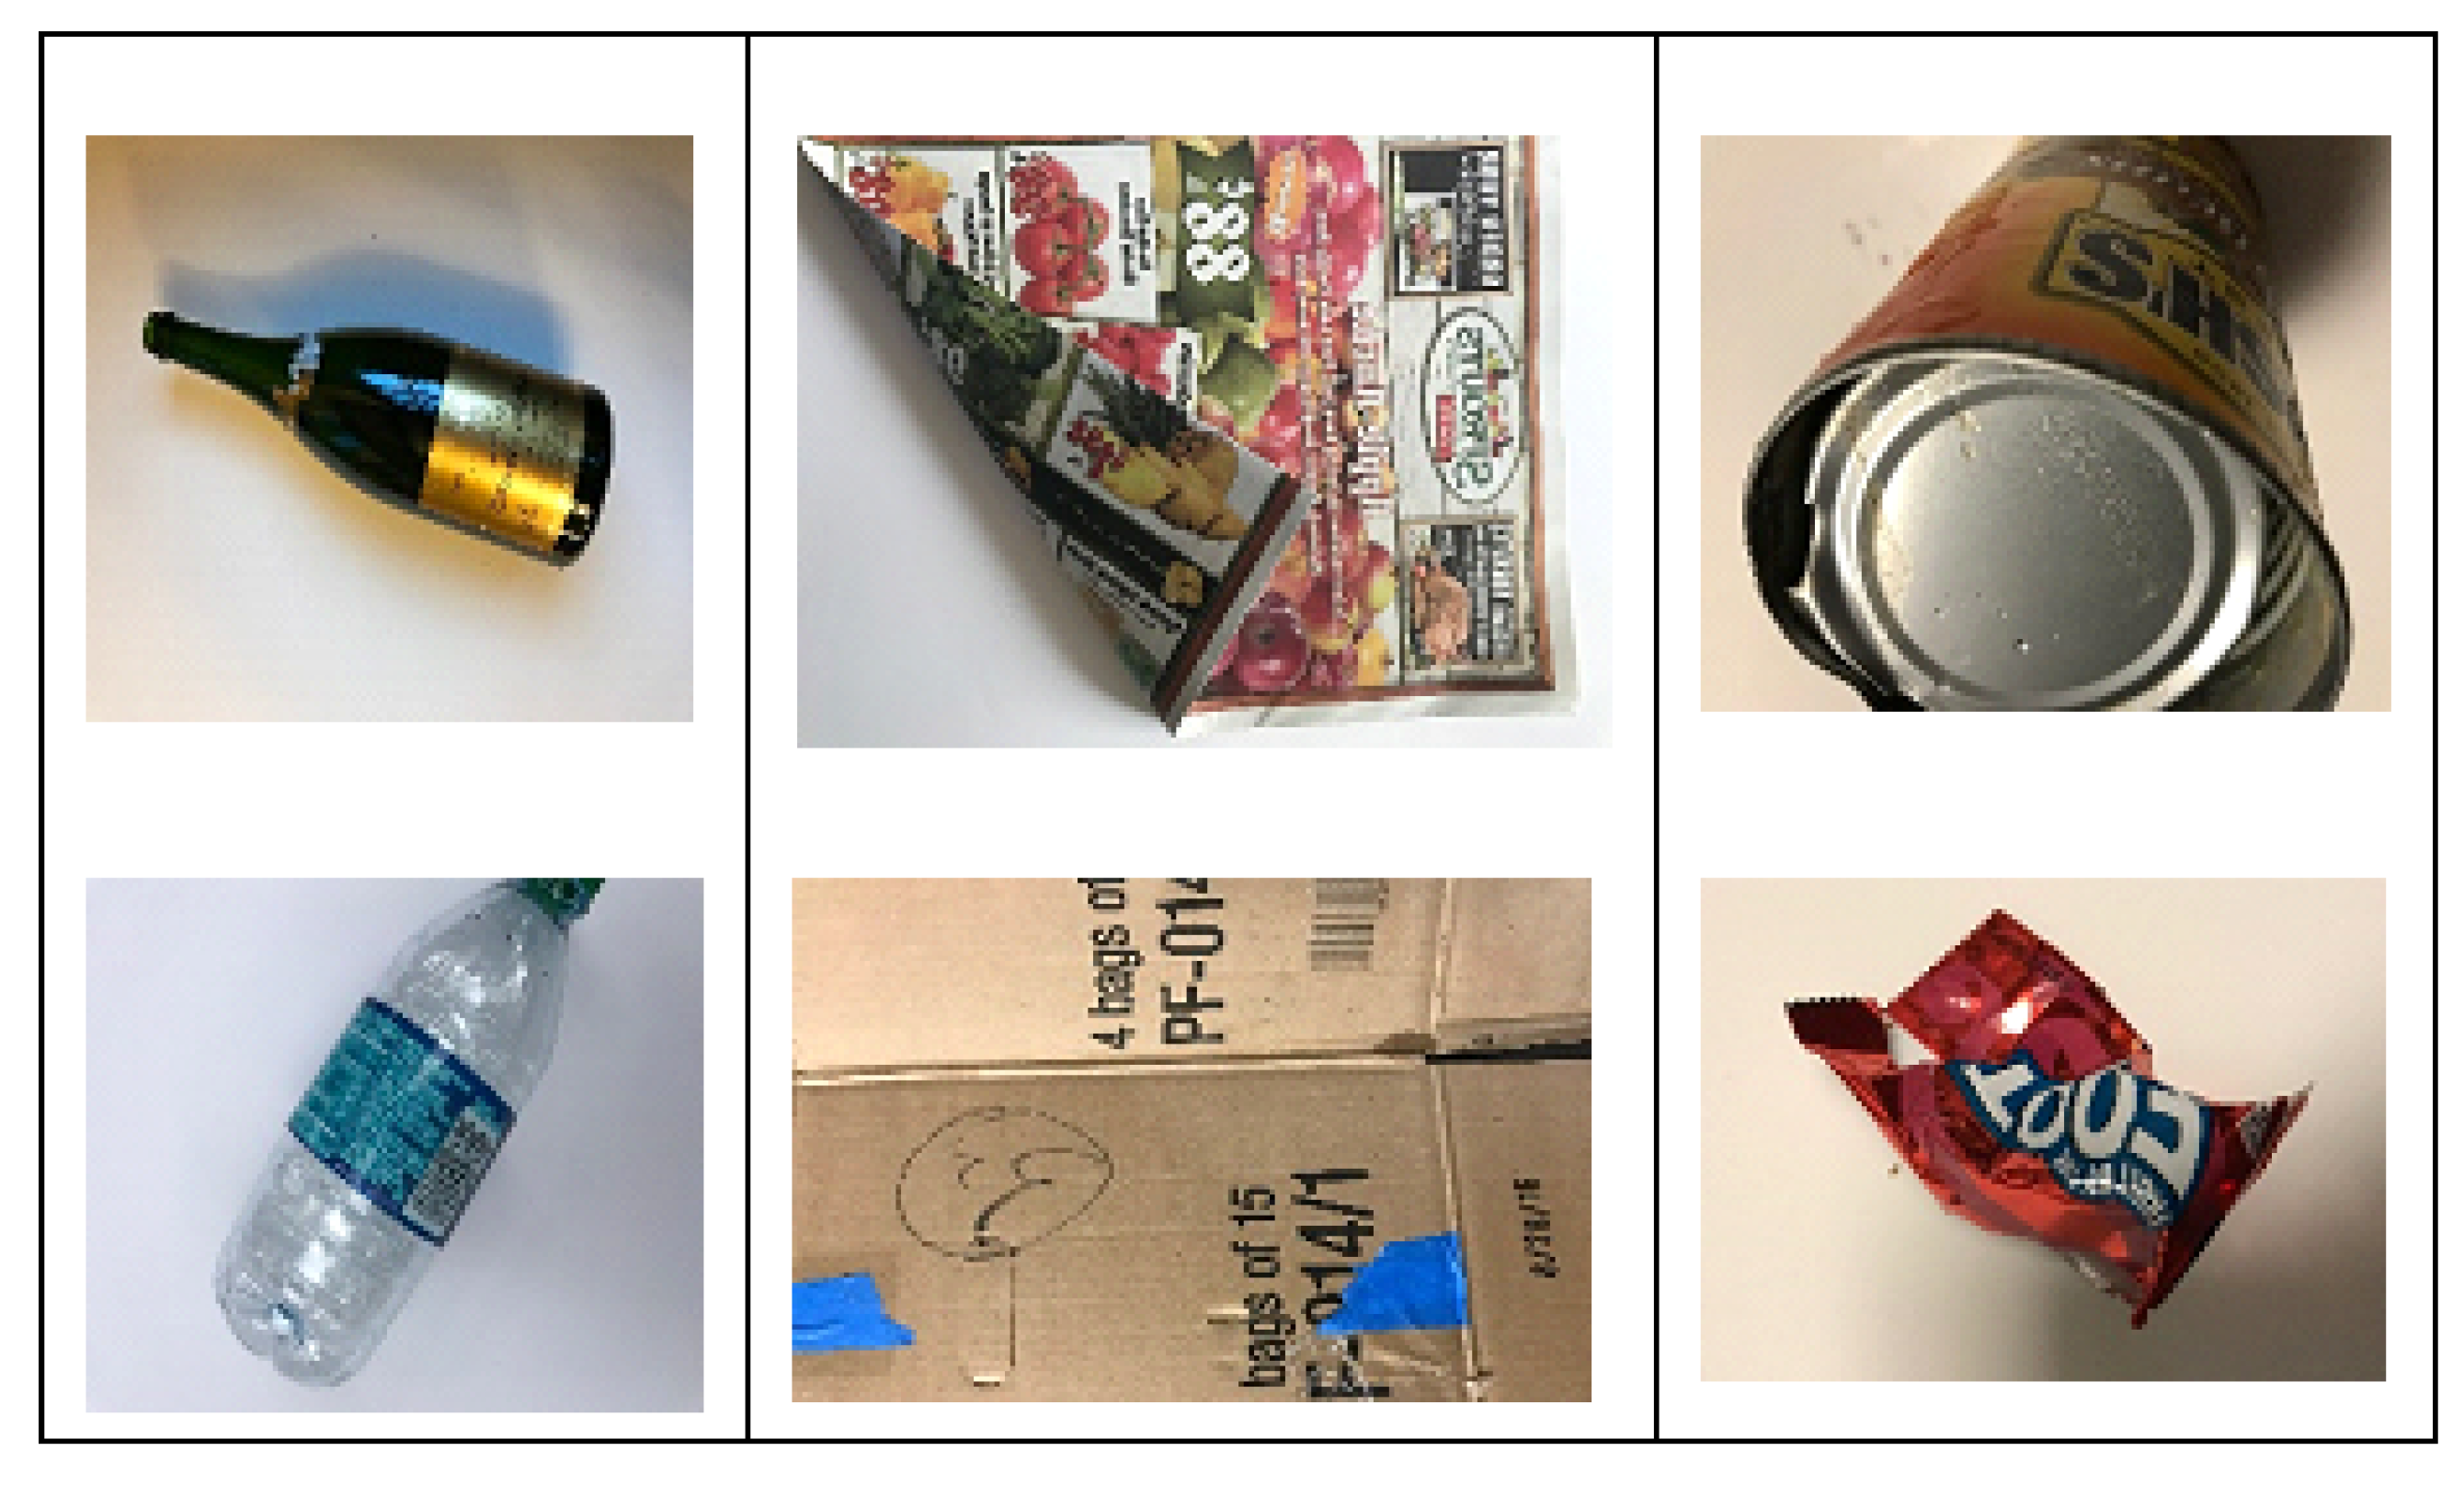
In this study, the TrashNet dataset is used, which is publicly available on Github [85]. It is a hand-collected dataset of a size of approximately 3.5GB. The dataset spans six classes: metal, paper, glass, cardboard, and trash. Together, these classes account for 99% of recycled material. Currently, this repository contains 2527 waste images. The dimensions of each image are 512 × 384, which can be changed or resized in the data. These images are captured by placing the object on a white poster board as a background using room lighting or sunlight. Figure 6 illustrates samples picked from each class of dataset.
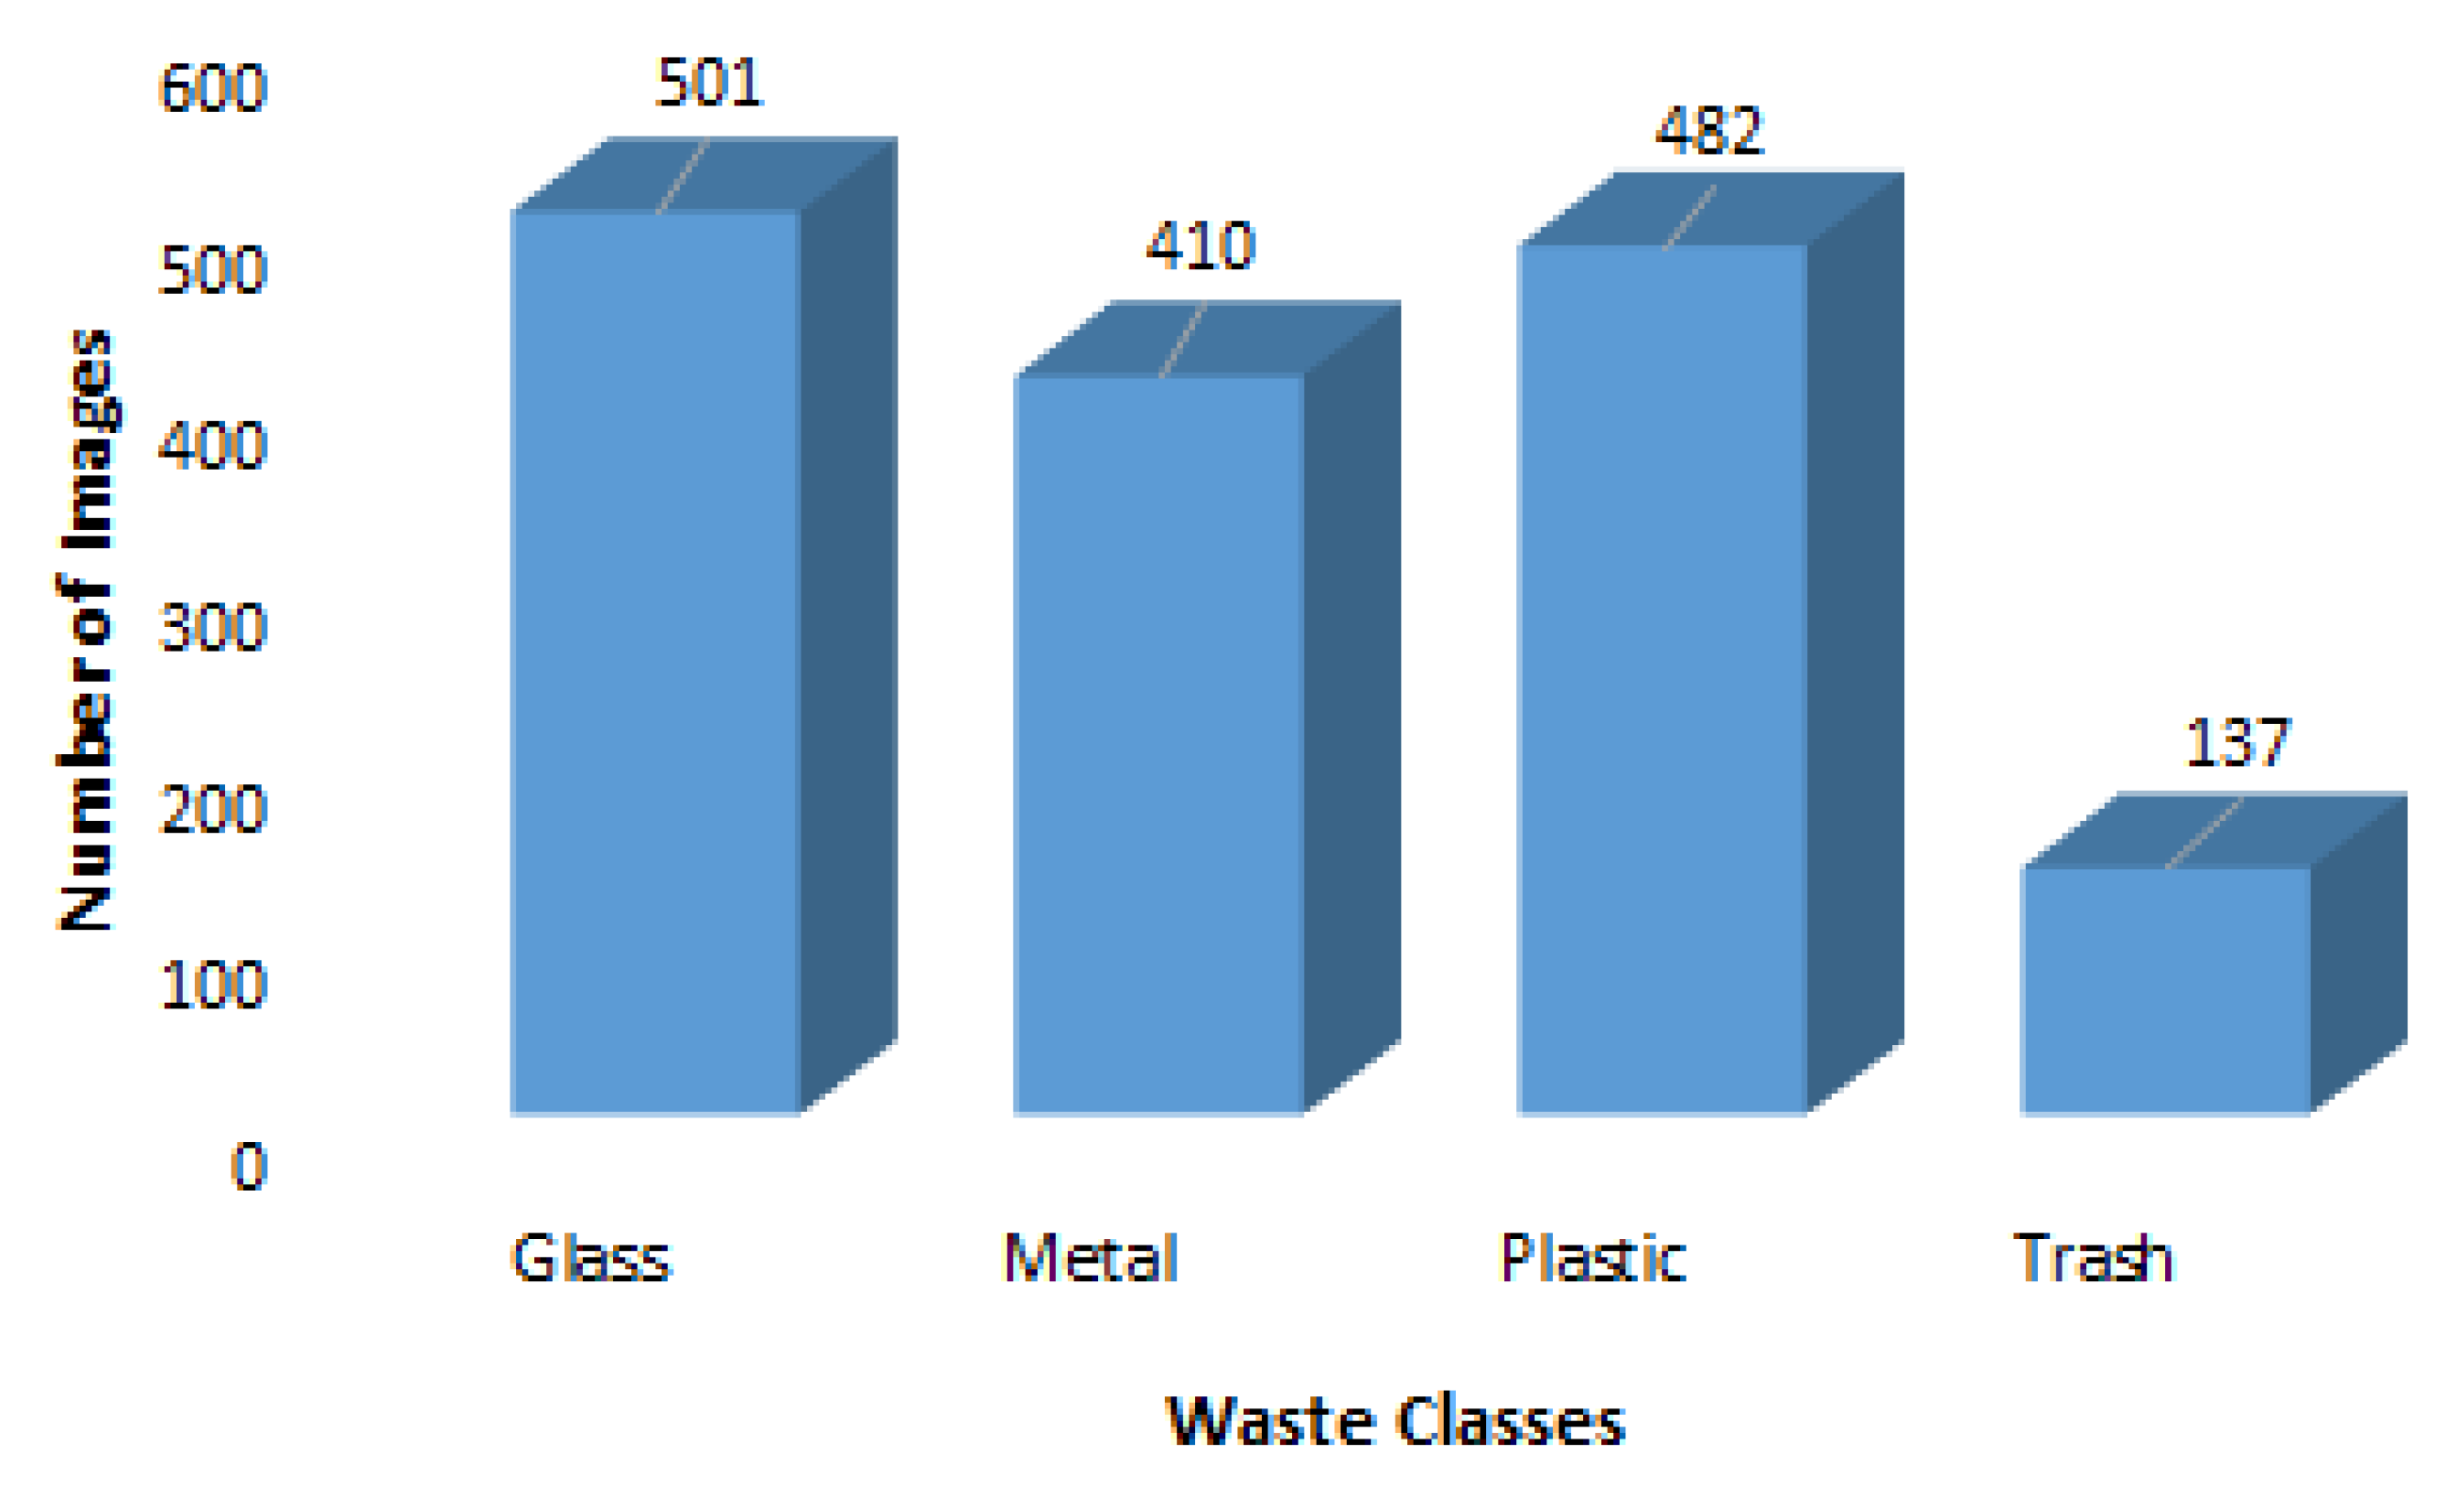
For this study, we use a subset of this dataset for four categories of waste: plastic, metal, glass, and trash, and we split it into two sets: training and testing, with ratios 80% and 20%, respectively. However, for real-time proposed model testing, we trained the whole data-set and test images captured in real-time particularly. Table 4 reflects the sample distribution of classes for each subset. It can be noticed that the number of samples per class is not balanced. Figure 7 represents the dataset’s number of samples among each label class.
4.2. Performance Metrics
Performance metrics are part of every machine-learning pipeline. Statistical validation of our proposed system and evaluation parameters used for the proposed waste classification architecture are as follows:
4.2.1. Accuracy
The performance of the system can be measured by calculating the accuracy of the system. The system accuracy (AC) is the ratio of true positive predictions for the complete dataset. Mathematically, it is represented in Equation (1)
Here, TP is true positive, TN is true negative, FN is false negative, and FP is false positive.
4.2.2. Latency Overhead
Latency is a measure of delay or the time it takes to transfer data to get to its destination between cloud and edge node. For our system, we use the hybrid technique for the minimal latency overhead. The cloud latency overhead (CLO) parameter needs to calculate the cloud latency. Similarly, the edge latency overhead (ELO) parameter needs to calculate the edge node processing latency. However, we used both cloud and edge node processing for training and testing purposes due to the computational and storage differences. Therefore, we calculate the hybrid latency overhead (HLO) parameter to ensure the overall latency of the proposed system. Mathematically, it is represented in the Equations (2)–(4) shown below:
where n is the number of attempts, Lc is cloud latency, and Le is edge latency.
4.2.3. Resource Energy Utilization
Energy is a system’s capacity to carry out work. It is represented as the product of power, and the length of time it is consumed, mathematically represented in Equation (5). So, if we know how much power (in Watts), is being consumed and the time (in seconds) for which it is used, we can find the total energy consumed in watt-seconds or joules. Power is the product of current multiplied by voltage represented in Equation (6). Thus, energy consumed can be measured by current, voltage, and time, as depicted in Equation (7). In our proposed system, this parameter refers to the Figure 13. The more computational and memory resources used, the more energy is needed to operate the devices. As in a smart system, the overall energy consumption requirement reflects the performance of the whole system.
Here, I is current, V is voltage, and t is time in seconds.
4.3. Performance Analysis
The performance system analysis parameters are thoroughly analyzed and illustrated in this section.
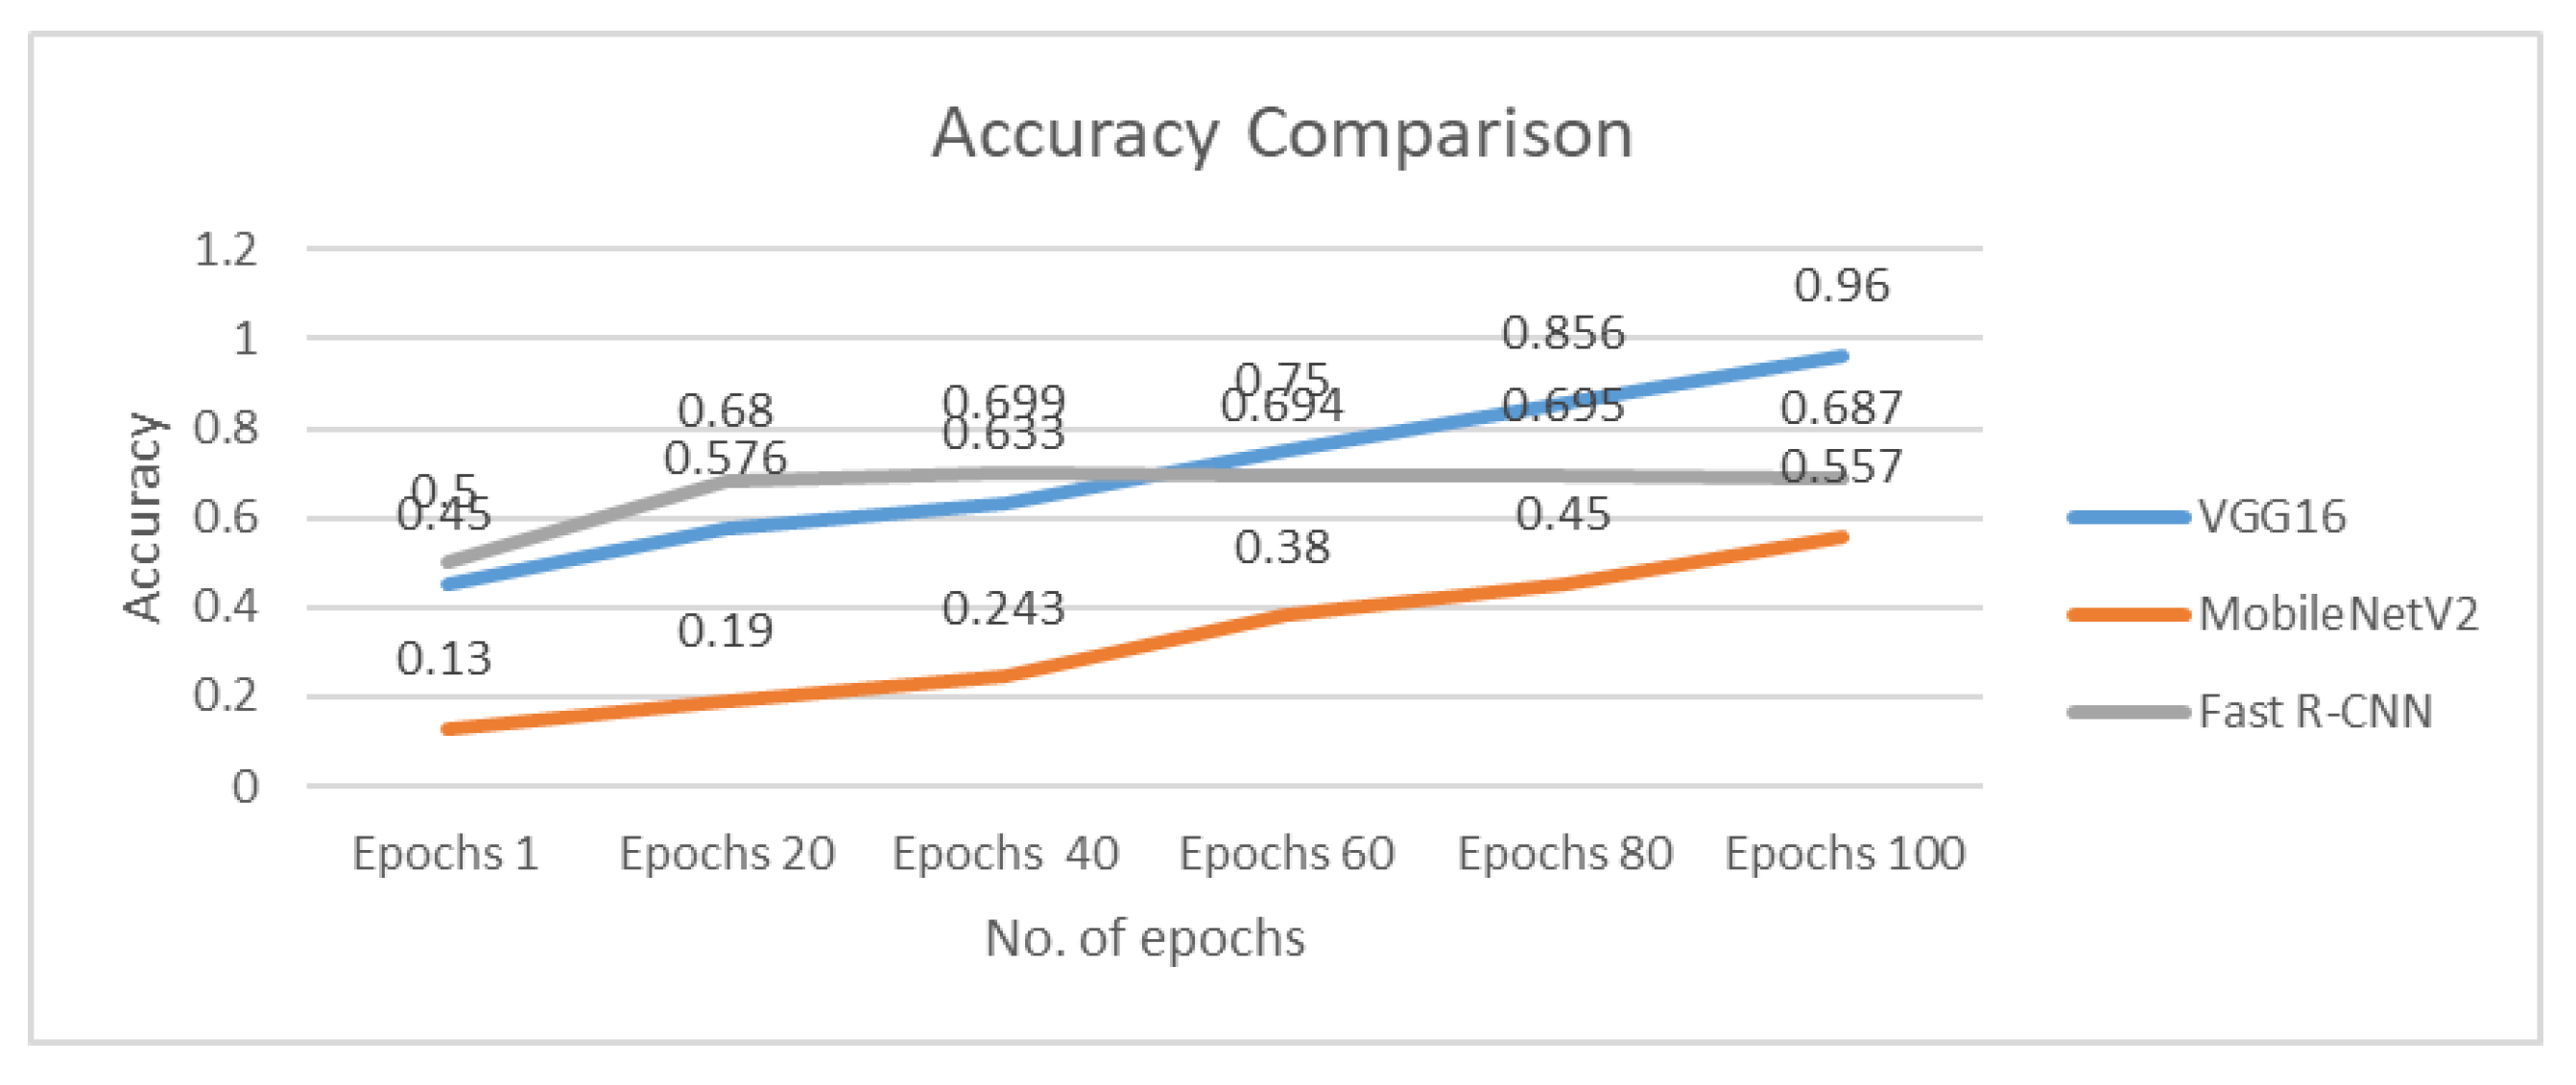
Accuracy Comparison
The trend is shown in Figure 8. It is clearly visible that in the beginning, the accuracy of Fast R-CNN is the highest at 0.5. It is because of the fast-learning rate of this algorithm. The algorithm we use in our proposed system learns gradually with the increased number of epochs. The learning rate of MobileNetV2 is the lowest. The reason is not that this algorithm is slow in general, but it is because of the large block size used by the previous research. The same behavior can be seen by Fast R-CNN, where the block size of 128 is used, which starts well, but with the increase in the number of epochs, the curve nearly becomes flat. The other two algorithms follow a gradual increase in the accuracy with the increase in epochs, but VGG-16 achieves higher accuracy because the block size we use is 10. The accuracy of MobileNetV2 after 100 epochs is around 0.557. That is why the number of epochs used in the previous study was 20,000, which gives far better accuracy than what is achieved at 100 epochs in our proposed system. Moreover, the increased number of epochs also requires more computational resources, which is the critical factor in the energy constraint smart systems.
4.4. System Latency Comparison
The system’s latency can be measured by the time taken to complete one round of classification. For instance, this includes the time the system takes to capture an image using the camera, make segments of it, perform classification, and pass the prediction results to the micro-controller and robotic arm picking that item. All this time taken by the Edge node is calculated, which is the total latency of the system when the prediction is made on Edge Node. In the Figure 9, we compare the latency of the Edge Node with the scenario, to carry out all the work entirely on a cloud platform. It is quite evident in the Figure 9, the latency overhead of the cloud is much more than the edge node.The reason for this is that as the cloud server is far away, more time will be taken to deploy every captured image to the cloud, where predictions will be made, and then to get the results back from the cloud and pass them to the edge node. However, we train our data-set entirely on the cloud, as it has more computational and storage resources compared to the edge node, irrespective of its latency overhead, and test the model on the edge node to achieve better resource utilization.
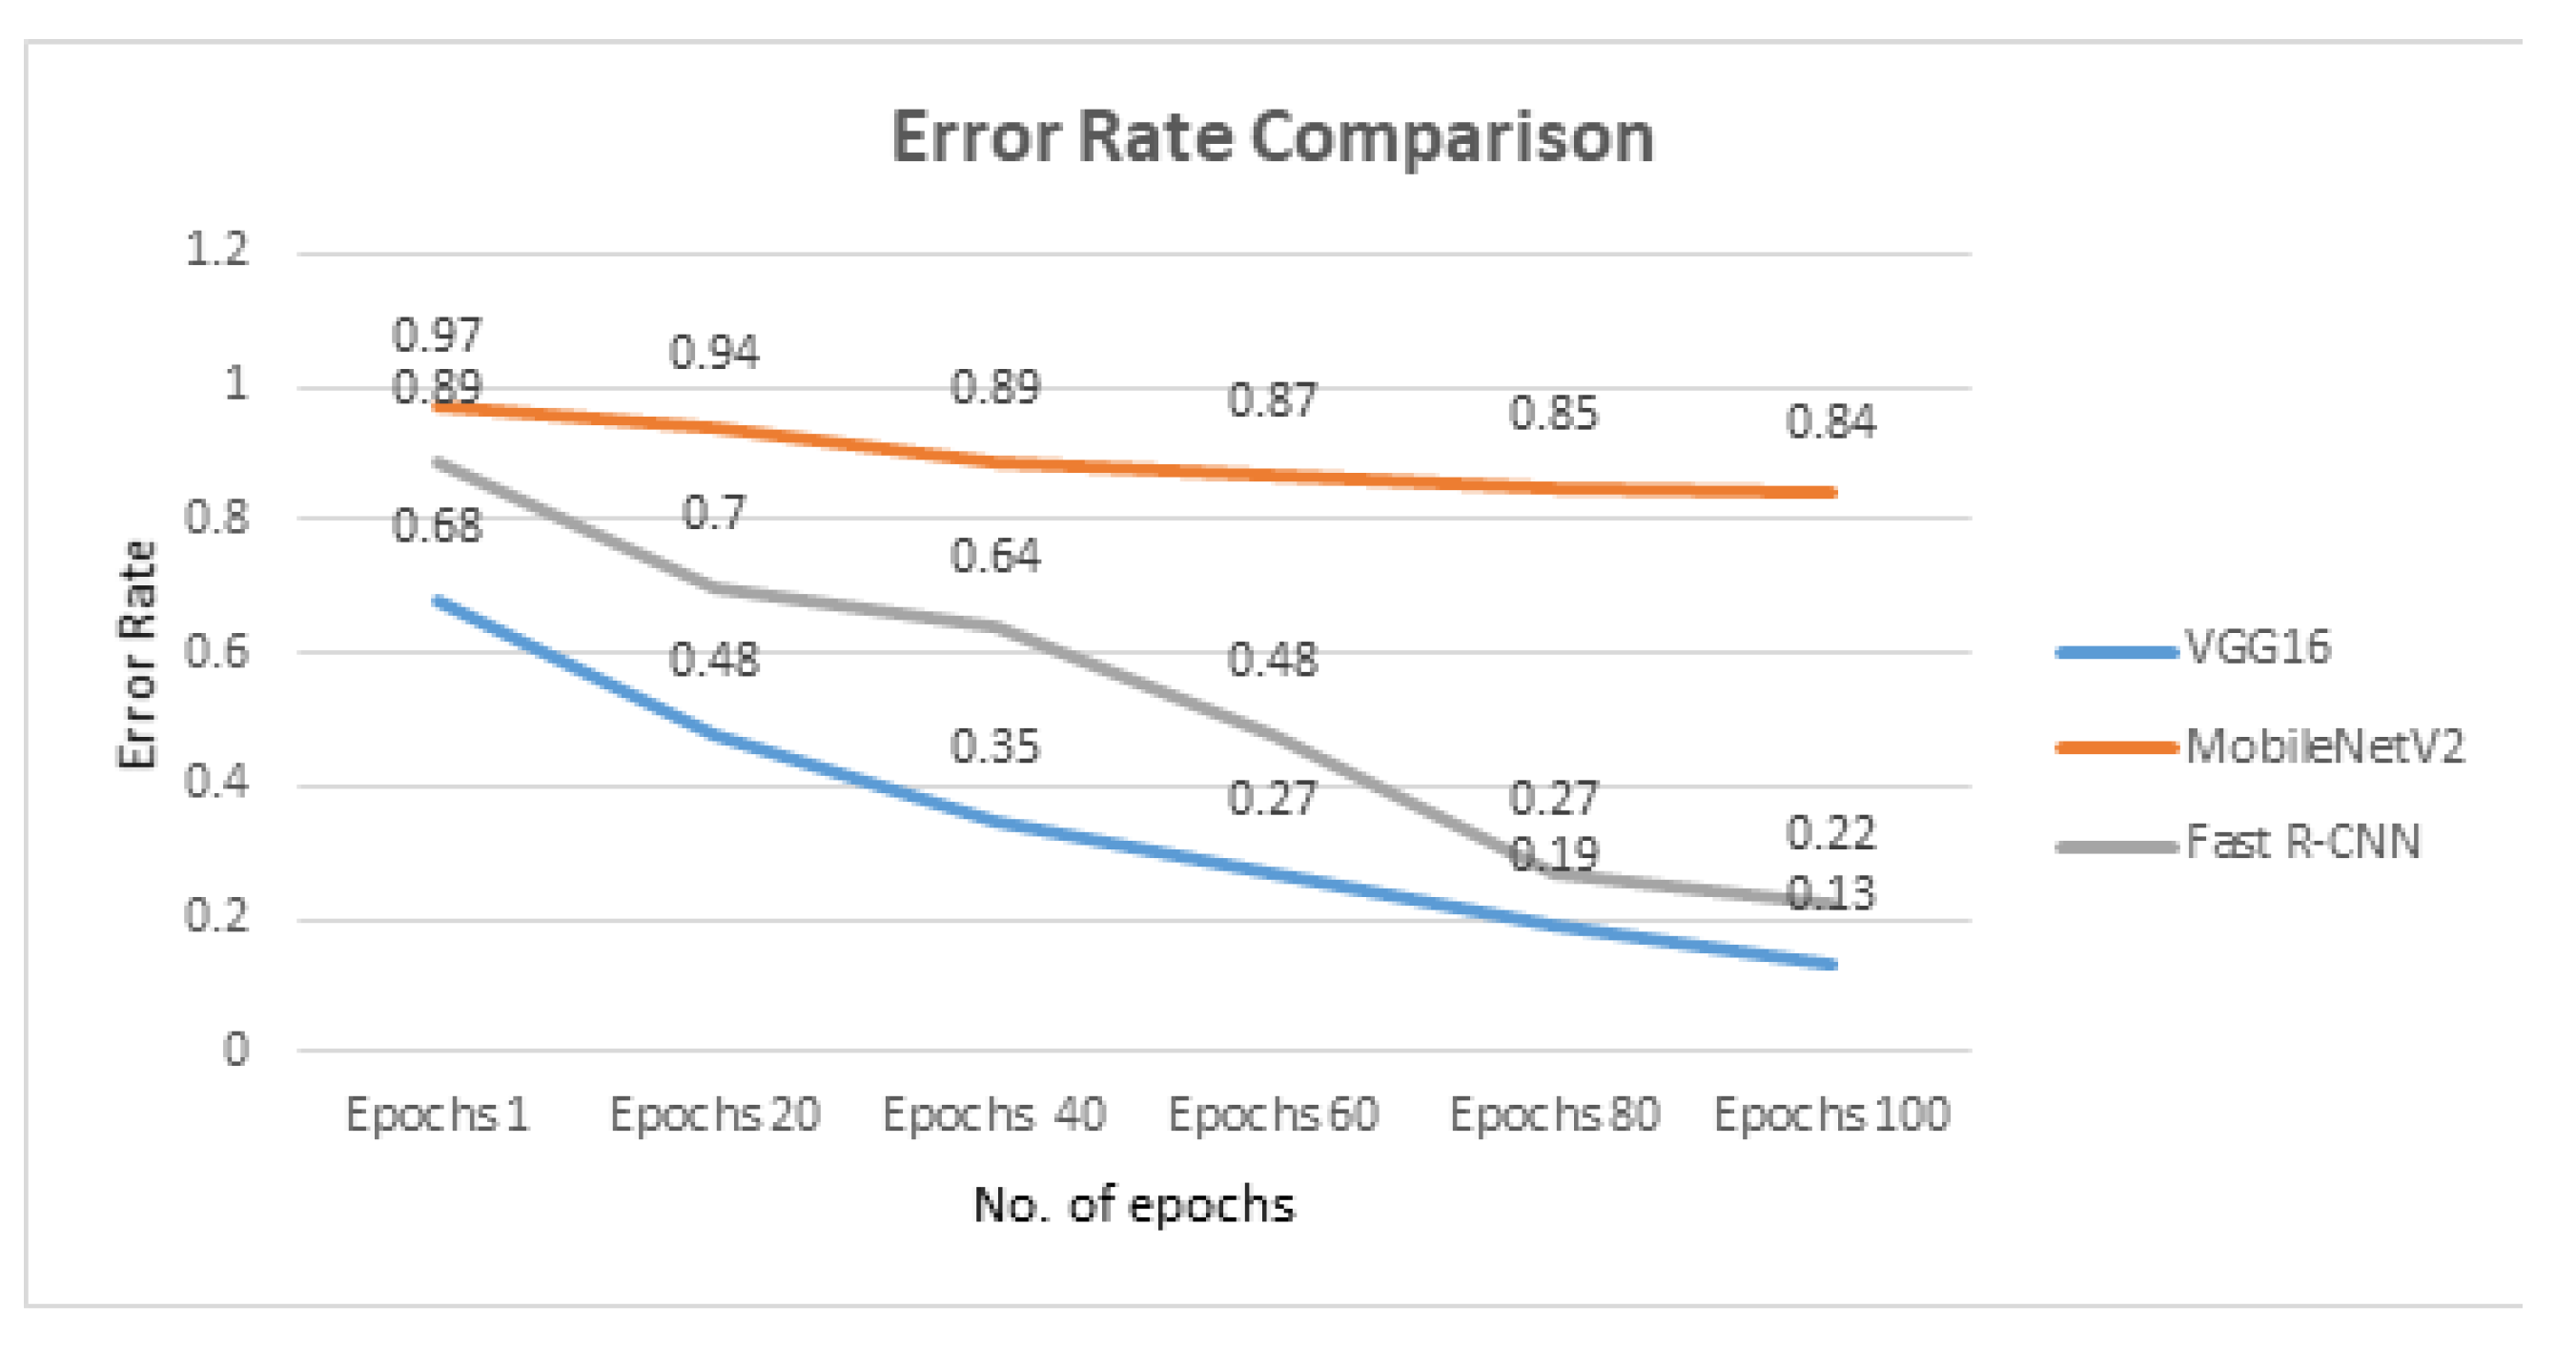
4.5. Error Rate Comparison
The Figure 10 shows the comparison of the total error rate incurred during the training of VGG-16, which is the algorithm used in our proposed system. The total error rate at the start (after 1 epoch) is around 0.68, which gradually decreases with the increase in the number of epochs, falling to approximately 0.48 after first 20 epochs. After that, it follows a similar downward trend, and the total error rate drops to 0.13 after 100 epochs. On the other hand, the total error rate of the previous state-of-the-art solution with MobileNetV2 is around 0.97 at the start, and a minimal decrease is observed in the error rate, which is the opposite of the prominent decrease observed with VGG16, and after 100 epochs it is still at 0.84, which is far behind the algorithm (VGG16) we used in our proposed model. Furthermore, if we look at the trend followed by the Fast R-CNN algorithm, its error rate curve is quite close to that of VGG16, with 0.89 after the first epoch and 0.22 after 100 epochs, which is still more than the VGG-16. Therefore, seeing the trends of these three algorithms, it is obvious that VGG16 performs better than all others for proposed system in terms of total error rate incurred during the training. The reason is that the 16 convolutional layers and over 138 million parameters of the VGG16 significantly reduce the error rate and increase the accuracy of the overall system.
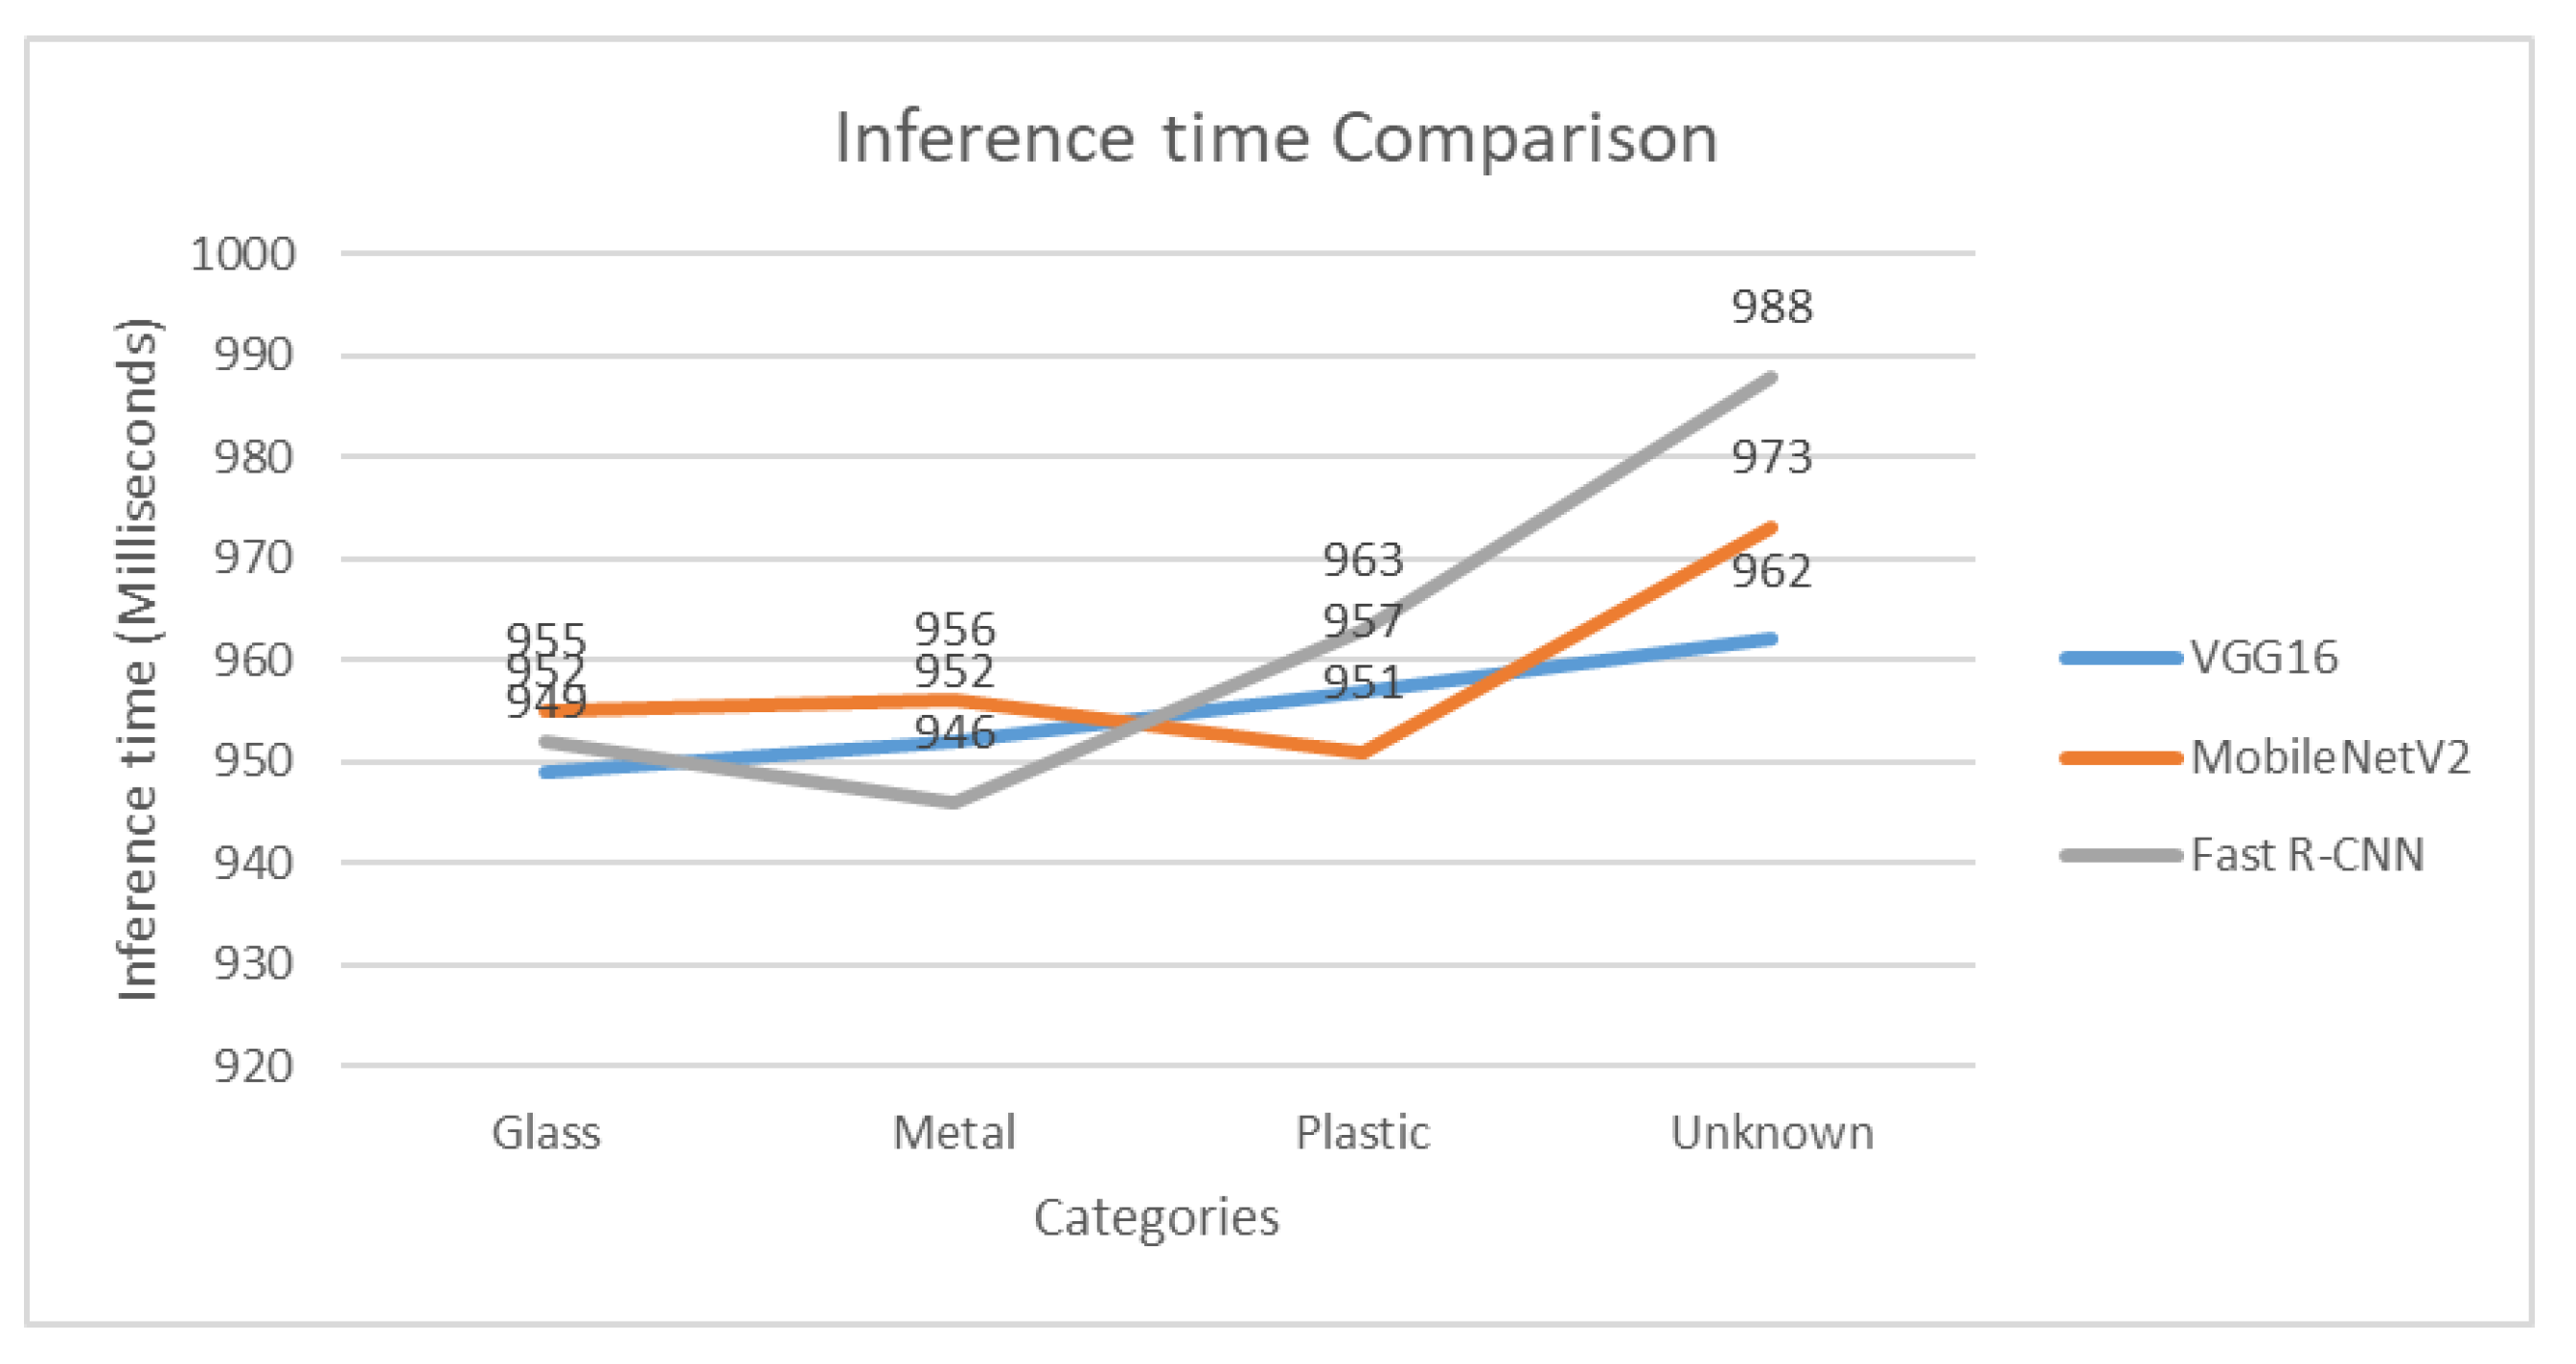
4.6. Inference Time Comparison
The inference time is the total time a model takes to take a real-life input and deliver an actionable output. All three algorithms show optimal performance, as shown in Figure 11. Minimal difference is observed in the algorithms, i.e., Fast R-CNN, VGG16, and Mobile NetV2. This is due to the quality of the test picture, which is passed to the algorithm and also depends on the type of system on which you are testing your algorithm. For instance, as we used raspberry pi 4B as a edge node to test our algorithm, it performs better in some cases compared to MobileNetV2 and Fast R-CNN. Particularly, VGG-16 performs better in the case of glass and unknown category; Fast R-CNN performs better to recognize the metal category; and MobileNetV2 takes the lead in the case of plastic. However, the results vary because of the quality of test data, the number of epochs used in training, and the processor specs.
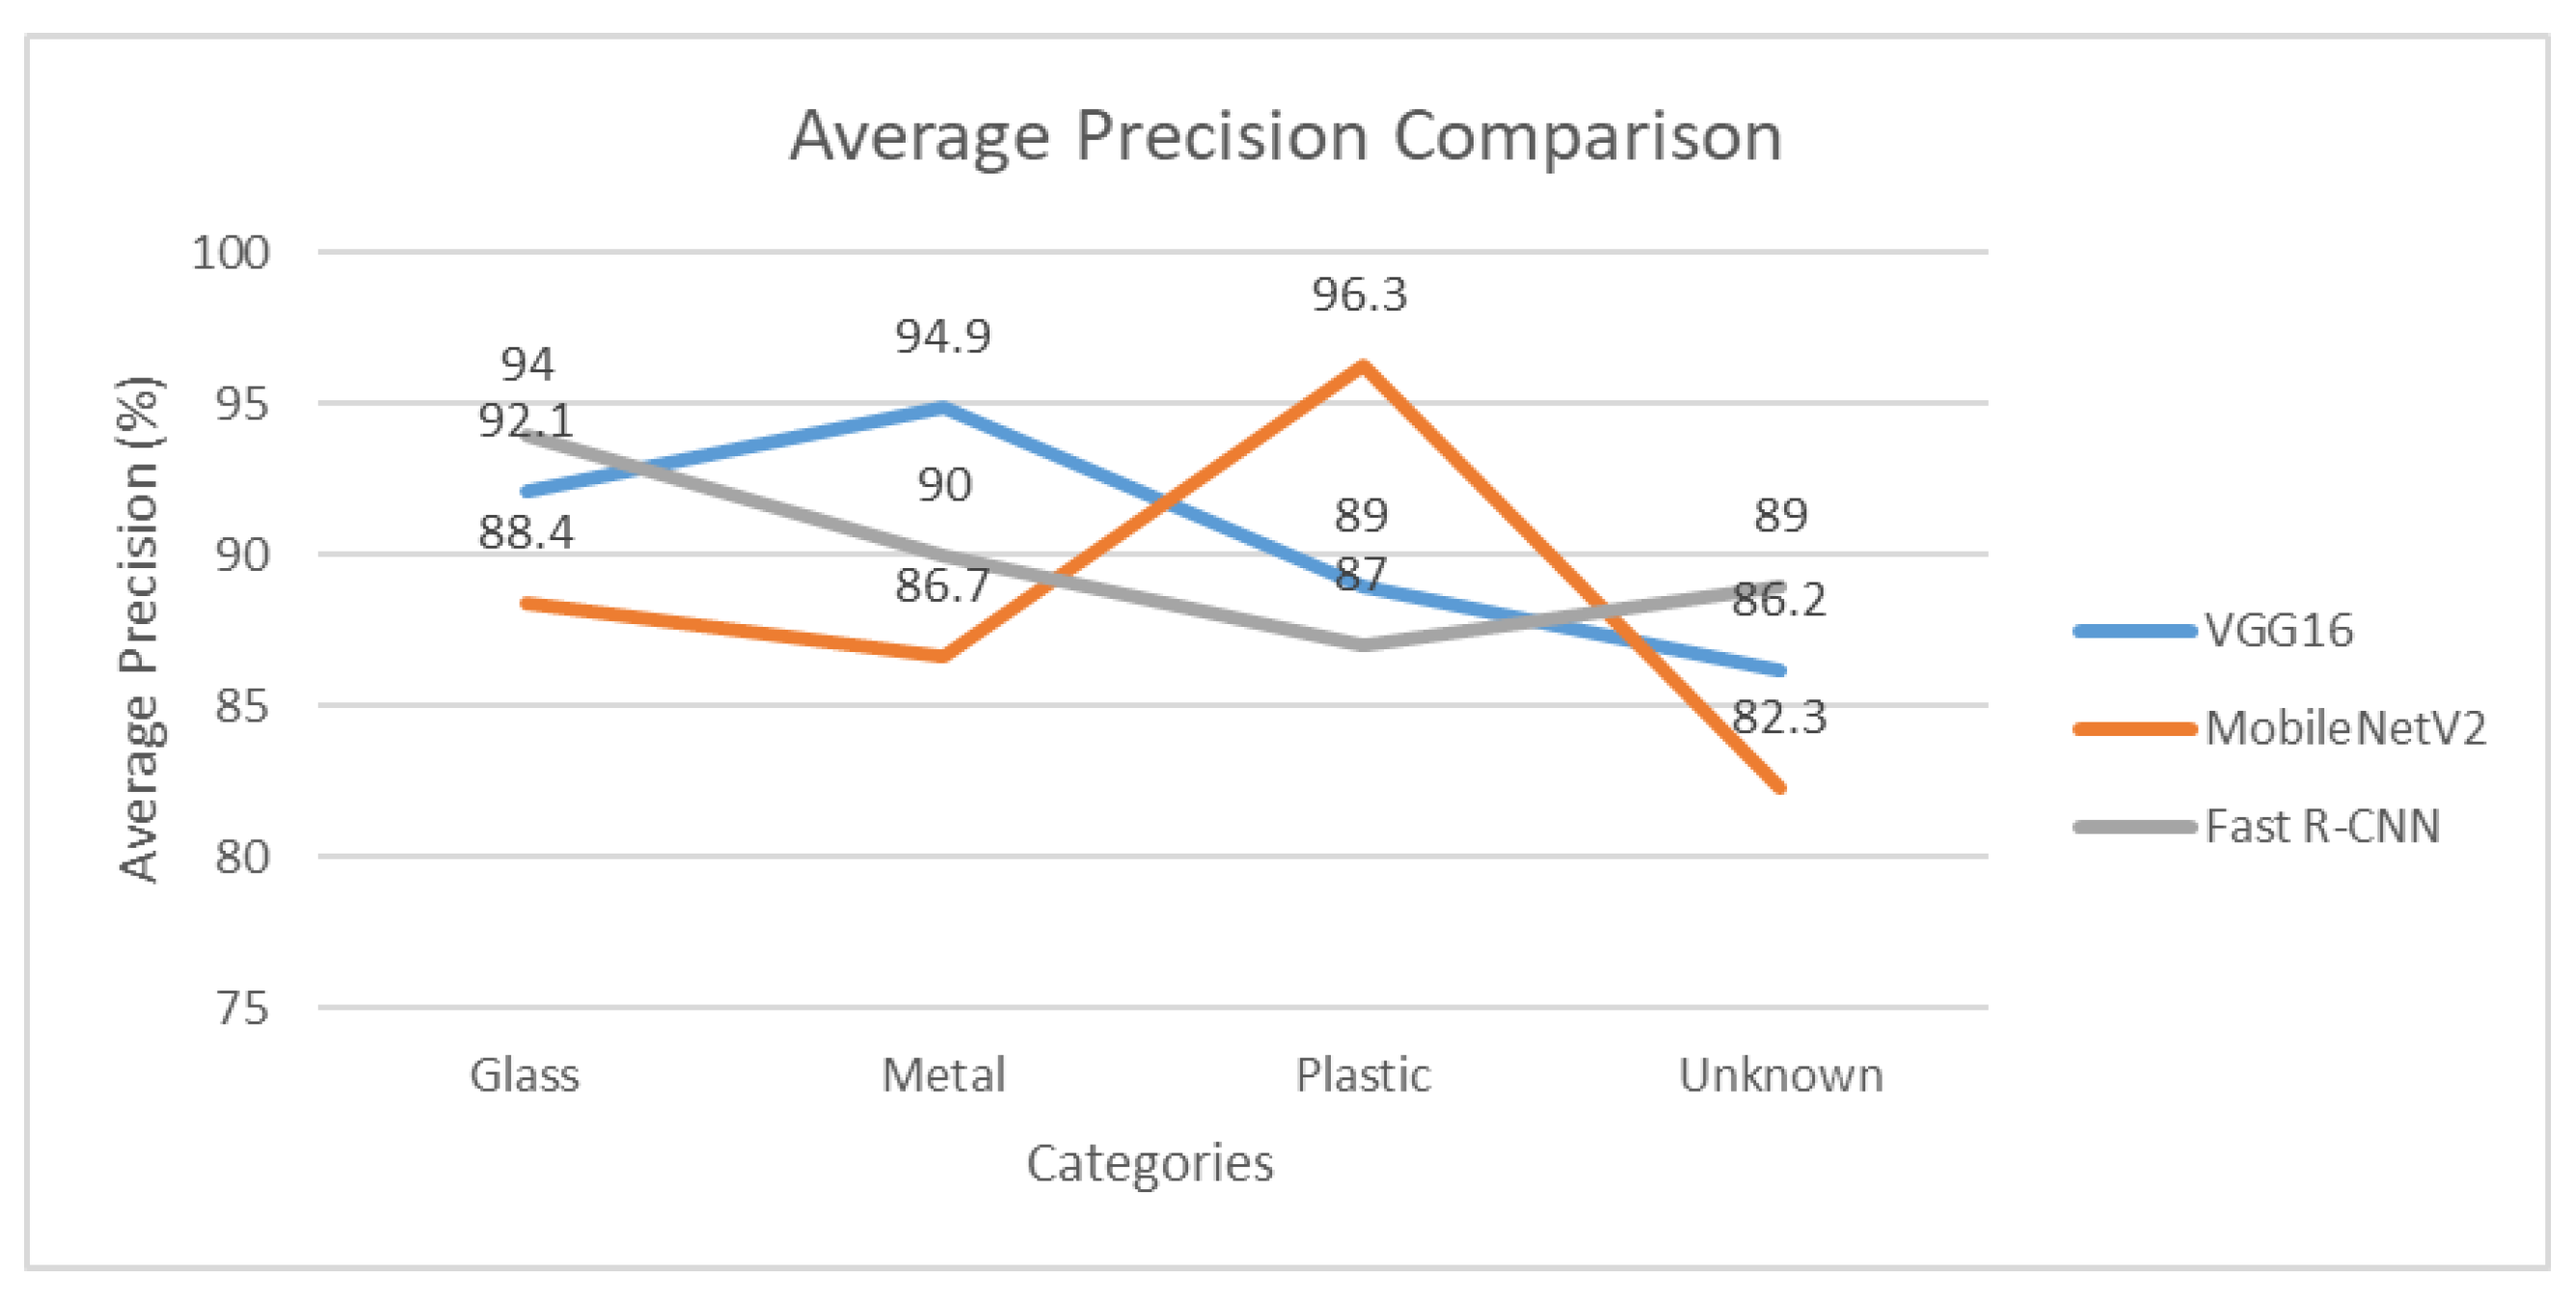
4.7. Average Precision Comparison
Precision generally means the reproducibility of similar results by an algorithm. For example, Figure 12 illustrates the precision of the algorithm we use for classification by providing samples of each of four categories. It achieves over 90% precision in the case of glass and metal, but the average precision for plastic and the unknown category is between 85–90%. The reason is the shuffling of training data or the high accuracy for predicting items of glass and metal compared to plastic and unknown materials. Correspondingly, MobileNetV2 achieves higher precision in the case of plastic, while Fast R-CNN achieves the highest precision in the glass category compared to both MObileNetV2 and VGG16, because all the test data used in previous research were taken from the dataset on which the model was trained.
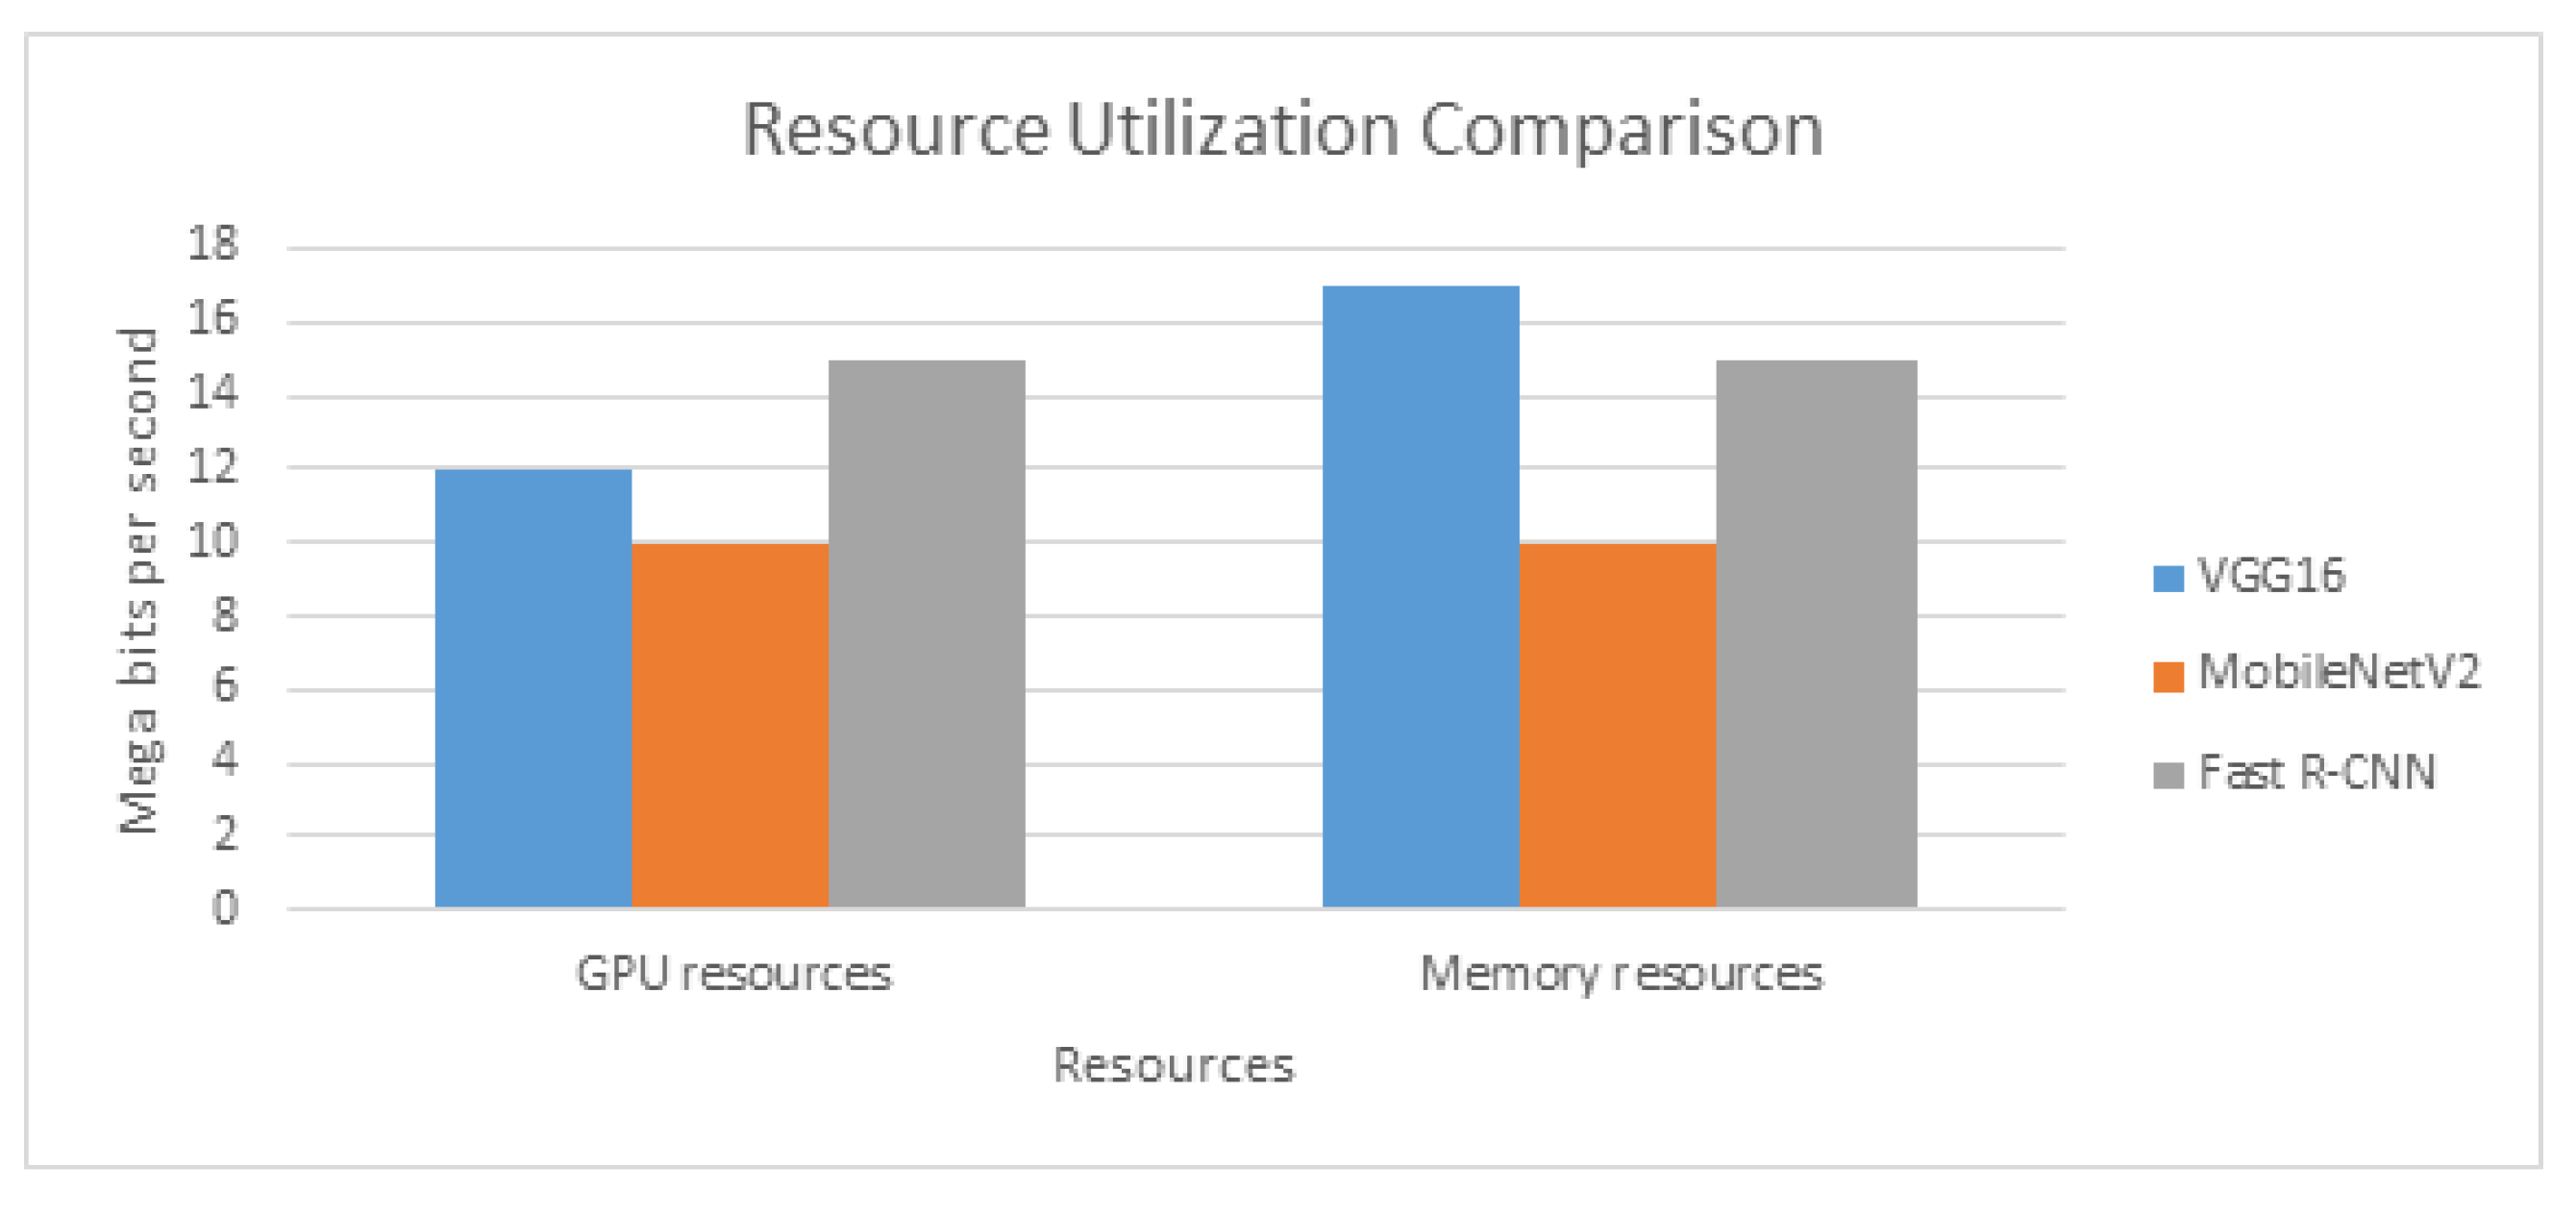
4.8. Resource Utilization Comparison
The Figure 13 shows the comparison of resource utilization between VGG16, MobileNetV2, and Fast R-CNN. The GPU resources are used by Fast R-CNN much more than the the other two models for training because of the large size of the model and fast training. Furthermore, as all the model training is performed on the cloud and only the saved model is deployed on raspberry pi (edge Node), it takes less memory on raspberry pi. Still, the model’s training in the case of VGG16 on the cloud requires much more space than MobileNetV2, because its 16 layers and 138 million trainable parameters take up much space in the memory. On the other hand, MobileNetV2 takes the minimum GPU and memory resources because it is a lightweight model with less trainable parameters than VGG16 and Fast R-CNN, as shown in Figure 13. Additionally, as a lightweight model, it cannot be used to train large and complex datasets.
5. Critical Analysis
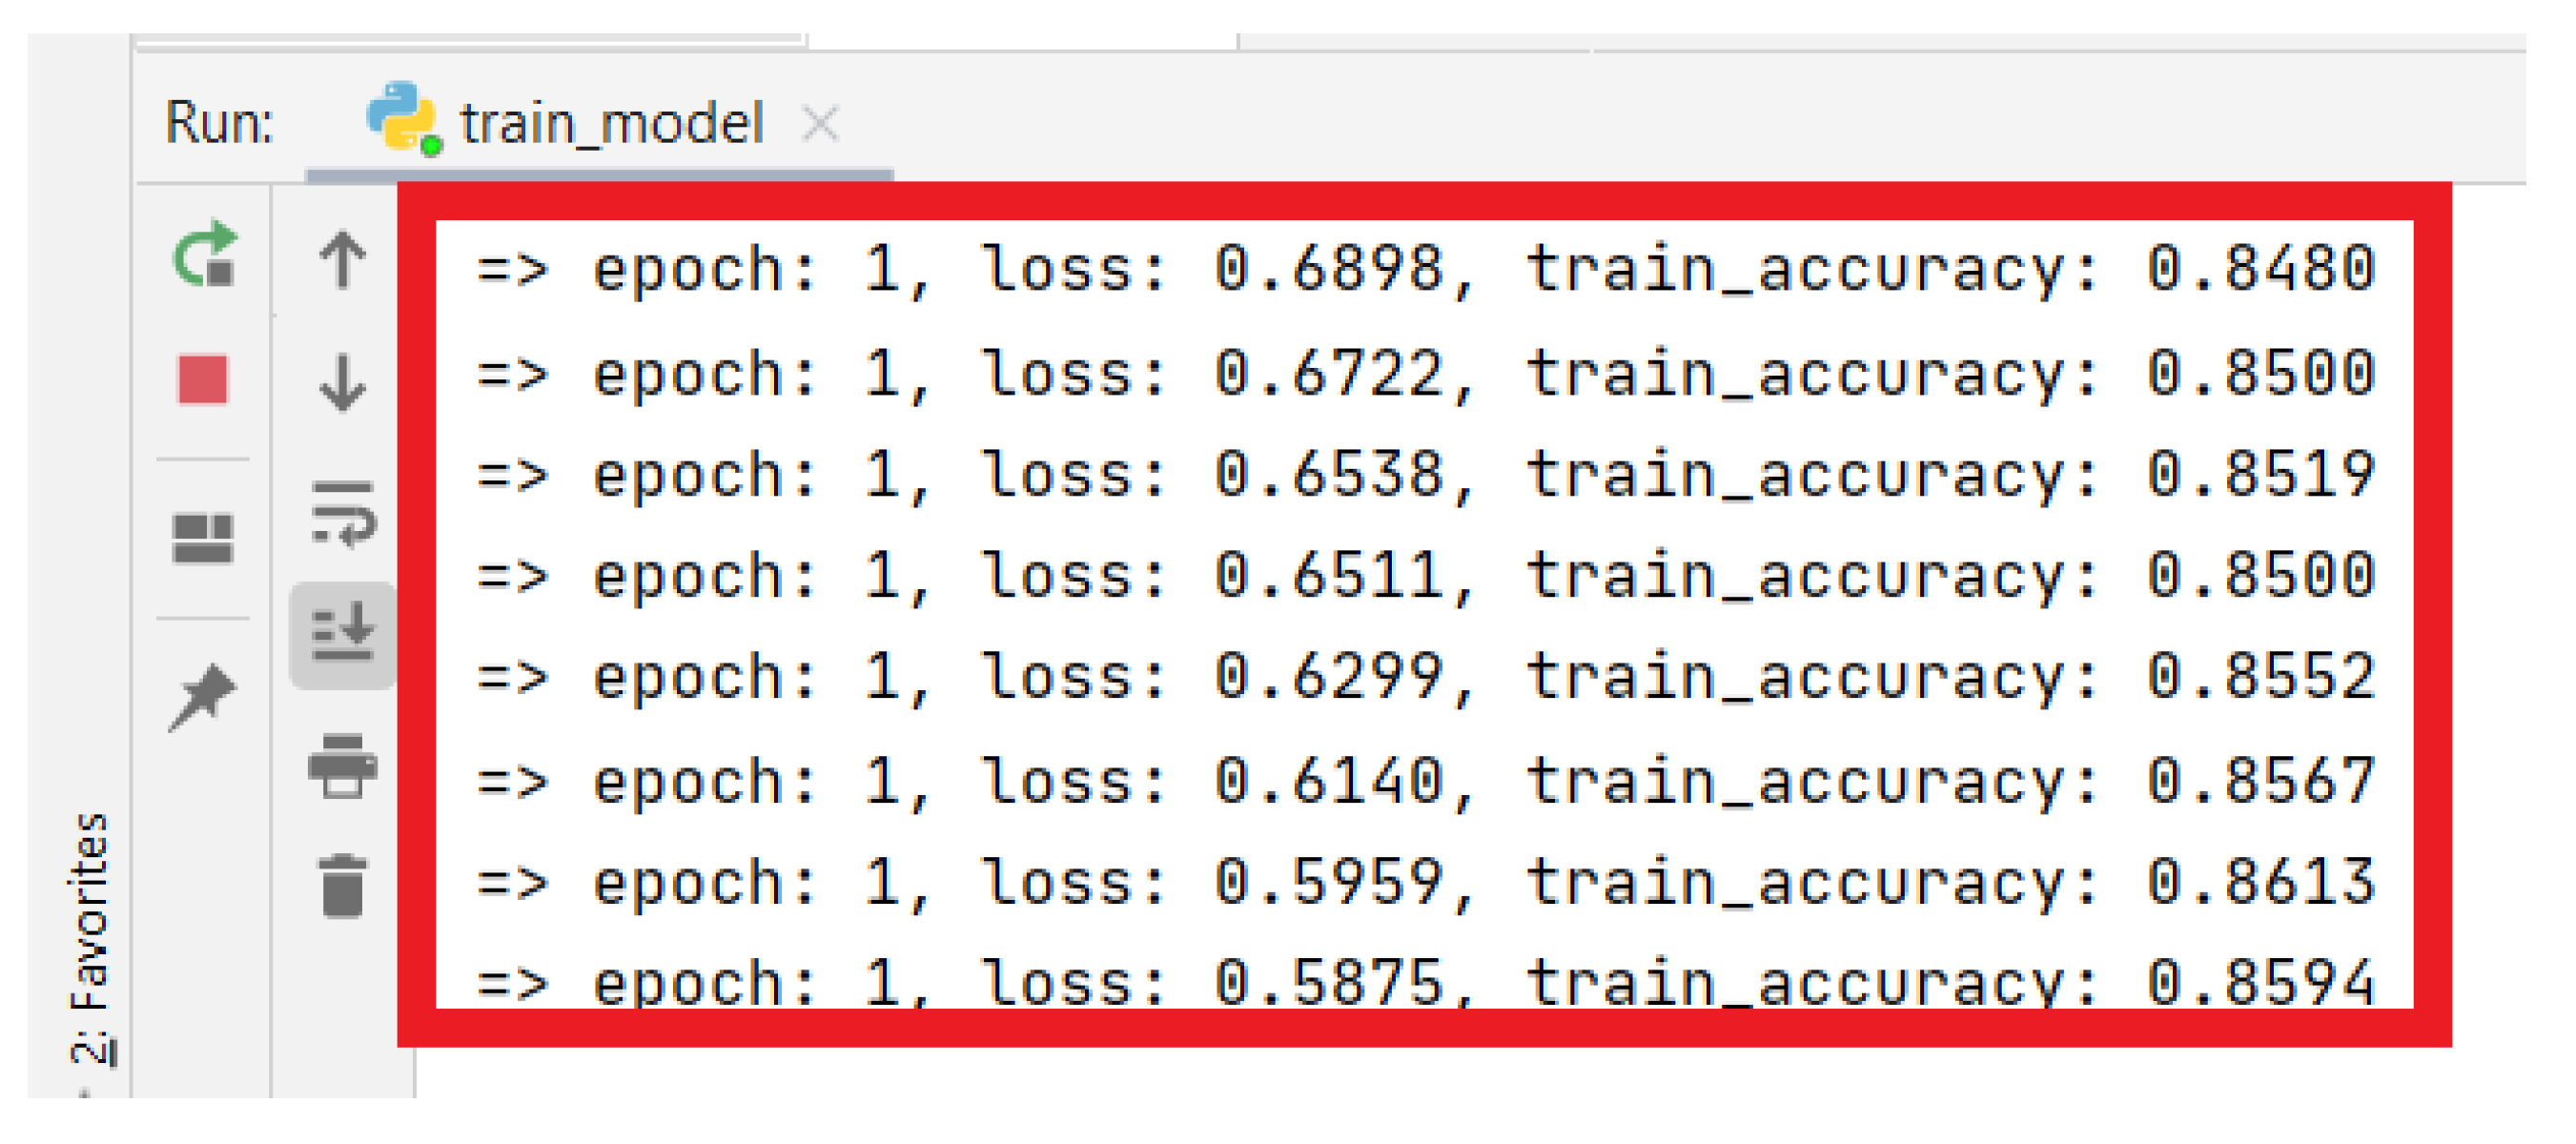
To achieve better results compared to the state-of-the-art techniques shown in Table 5, we use the VGG16 algorithm. It is the most appropriate algorithm in terms of computation and accuracy for the object detection and classification process. It has 16 convolutional layers and some flattening layers at the end. These convolutional layers are computed to determine the valuable features on the basis of weights assigned to each feature via a deep learning algorithm at the flattening output layer in order to calculate the overall performance metrics of the proposed system. The dataset is trained by the VGG16 deep learning algorithm up to 100 epochs. The epochs are basically referred to as the total number of times the model is trained. The accuracy achieved after a single epoch is 85%, as shown in Figure 14.
As now our model is already trained and saved, we do not have to train the entire model up to 100 epochs. Figure 14 is shown for demonstration purposes only. However, training the model on higher epochs can increase the accuracy, but it also has the disadvantage of over-training the model. Therefore, epochs should be chosen wisely. In our proposed system, we critically train the model by providing a different number of epochs, and we get the highest accuracy, i.e., 96% by providing the test data in a real-time environment where the number of epochs was around 100. Similarly, the variations in the accuracy of the proposed system on the basis of epoch hyper-parameter reflects the more trainable features as the epoch values increase.
Test Predictions
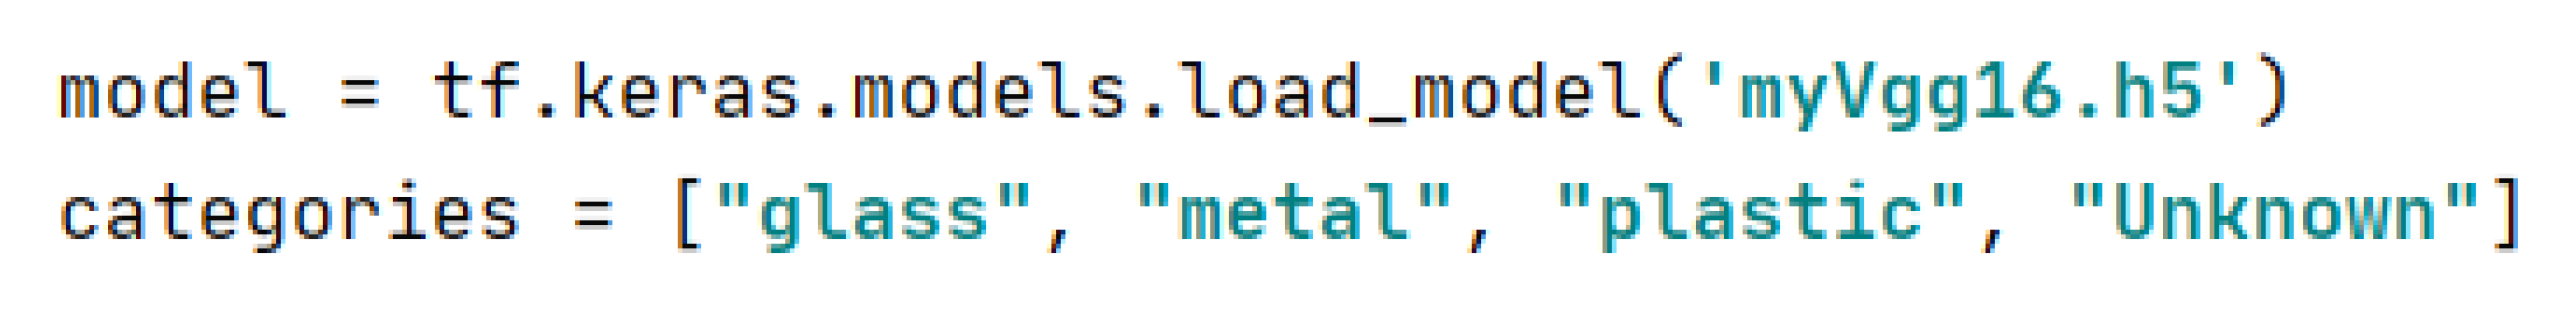
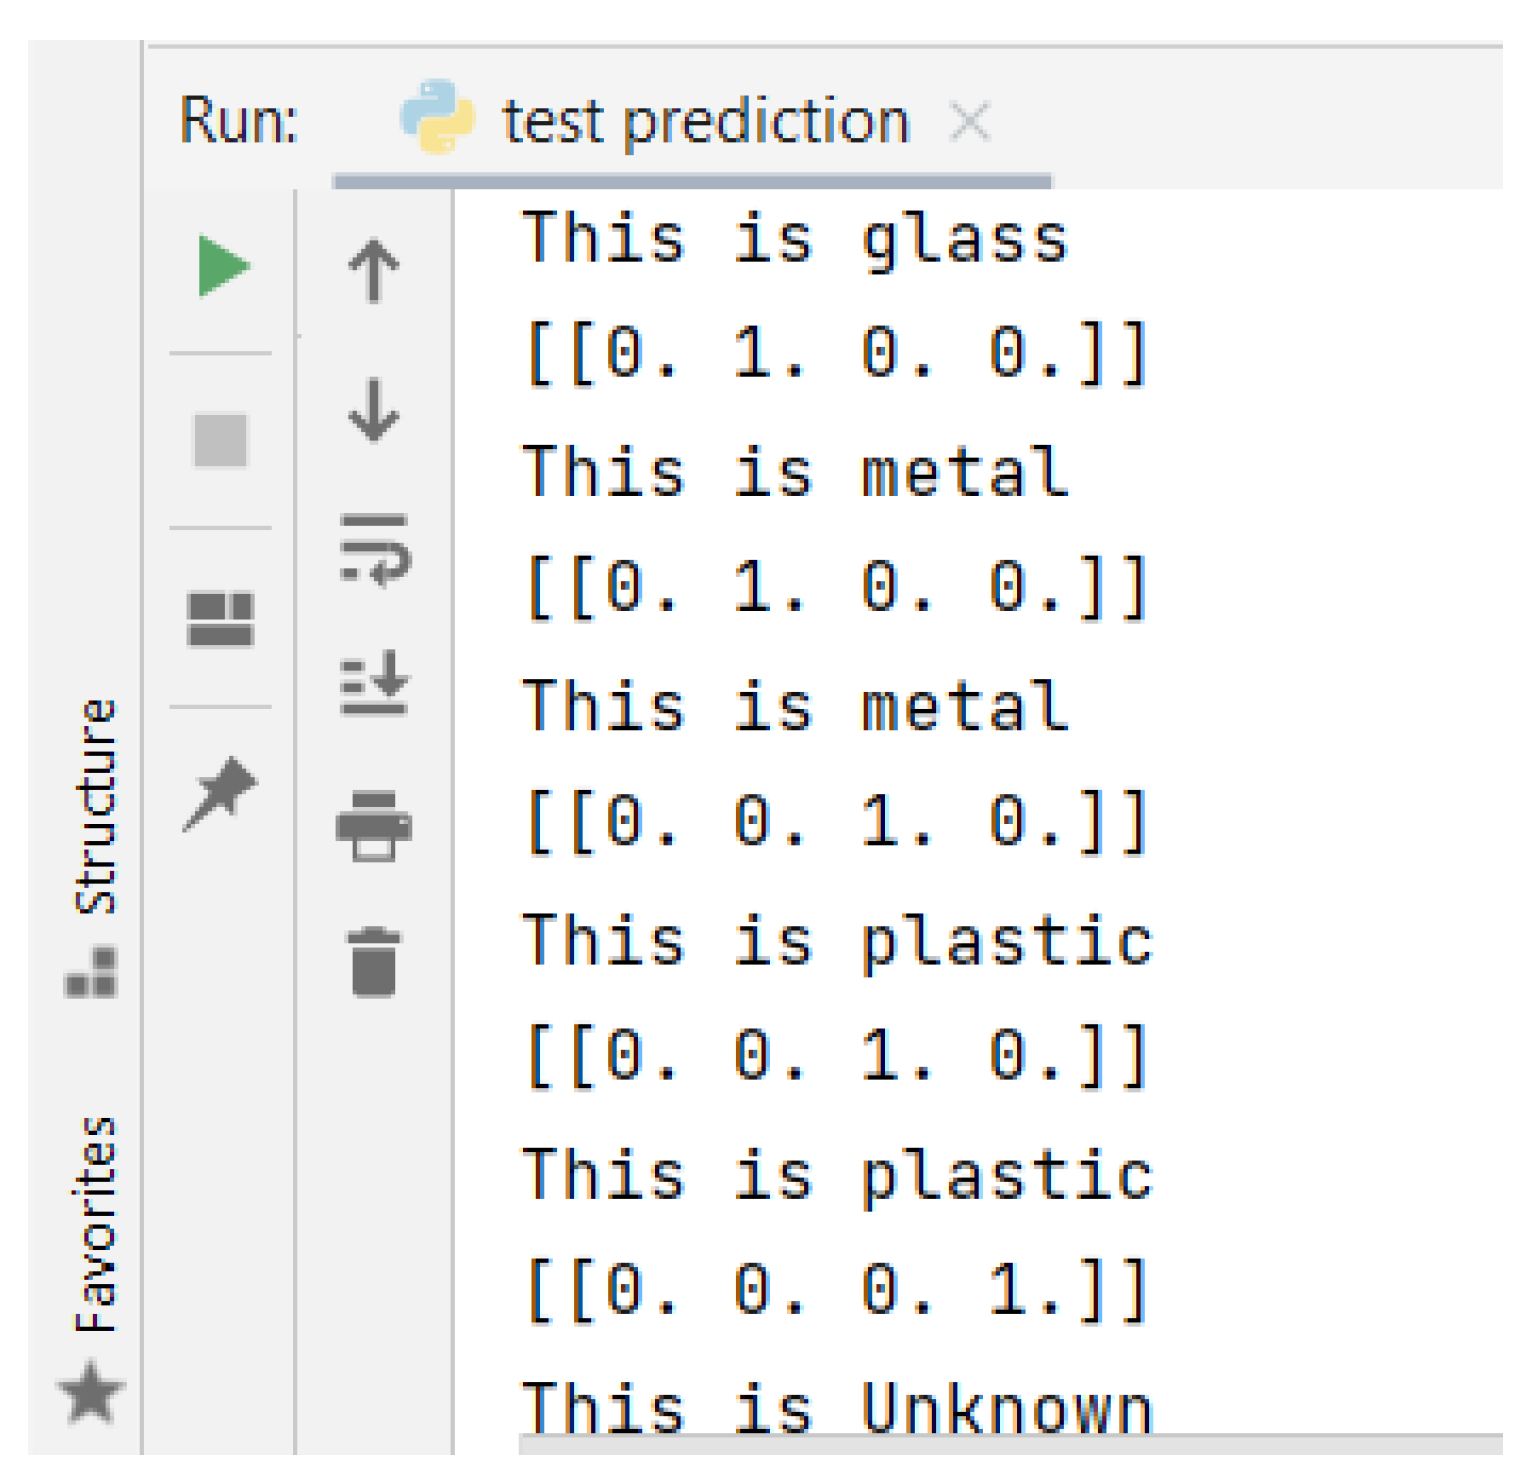
Further, after running the test predictions in a real-time environment, it can be seen that our categories are in the sequence of (glass, metal, plastic, unknown), as shown in Figure 15. Therefore, an output array (1.0.0.0) means that the item is a glass, (0.1.0.0) means that the classified item is a metal, and so on. What we are doing in our classification system is performing some actions based on these outputs. For instance, if the output is glass, it generates a specific number (say one) on the serial monitor of the controller. If the output is metal, it generates a specific number (say two) on the serial monitor of the controller, and so on. Against each number, there is a loop programmed on which the gripper will move and pick the classified item, as shown in Figure 16.
6. Conclusions
The proposed grid-like segmentation system provides awe-inspiring segmentation results. The deep-learning algorithm, a popular choice for image classification VGG16, gives us accurate results of 96% compared to the previously used Inception and ResNet algorithms, which achieved accuracy of 85%-88%. The overall IoT communication is also effective, as we use a personal area network (PAN) to make communication between the edge node and the controller more reliable in a real-time environment. The output from the edge node is instantly generated on the controller’s serial monitor, decreasing the proposed system’s overall latency. Moreover, the low processing resources of the edge node are overcome by training the model on a cloud system. So, we only deploy the trained model on the edge node to get fruitful results.
Author Contributions
Conceptualization, S.M.C. and A.H.; methodology, S.M.C. and A.H.; formal analysis, S.M.C. and A.H.; investigation, S.M.C. and A.H.; writing—original draft preparation, S.M.C., A.H. and I.M.P.; writing—review and editing, S.M.C., A.H. and I.M.P.; funding acquisition, I.M.P. All authors have read and agreed to the published version of the manuscript.
Funding
This work is funded by FCT/MEC through national funds and, when applicable, co-funded by the FEDER-PT2020 partnership agreement under the project UIDB/50008/2020.
Institutional Review Board Statement
Not applicable.
Informed Consent Statement
Not applicable.
Data Availability Statement
Not applicable.
Acknowledgments
This article is based upon work from COST Action IC1303-AAPELE—Architectures, Algorithms, and Protocols for Enhanced Living Environments and COST Action CA16226–SHELD-ON—Indoor living space improvement: Smart Habitat for the Elderly, supported by COST (European Cooperation in Science and Technology). COST is a funding agency for research and innovation networks. Our actions help connect research initiatives across Europe and enable scientists to grow their ideas by sharing them with their peers. This boosts their research, career, and innovation. More information can be found at www.cost.eu (accessed on 30 July 2022).
Conflicts of Interest
The authors declare no conflict of interest.
References
- Pires, I.; Souza, G.; Junior, J. An Analysis of the Relation between Garbage Pickers and Women’s Health Risk. Acta Sci. Agric. 2020, 4, 12–16. [Google Scholar]
- Liu, J.; Balatti, P.; Ellis, K.; Hadjivelichkov, D.; Stoyanov, D.; Ajoudani, A.; Kanoulas, D. Garbage collection and sorting with a mobile manipulator using deep learning and whole-body control. In Proceedings of the 2020 IEEE-RAS 20th International Conference on Humanoid Robots (Humanoids), Munich, Germany, 19–21 July 2021; pp. 408–414. [Google Scholar]
- Waste Management Indicators. Available online: https://ec.europa.eu/eurostat/statistics-explained/index.php?title=Waste_management_indicators (accessed on 5 July 2022).
- Lagakos, D. Urban-rural gaps in the developing world: Does internal migration offer opportunities? J. Econ. Perspect. 2020, 34, 174–192. [Google Scholar] [CrossRef]
- Nañez Alonso, S.L.; Reier Forradellas, R.F.; Pi Morell, O.; Jorge-Vazquez, J. Digitalization, circular economy and environmental sustainability: The application of Artificial Intelligence in the efficient self-management of waste. Sustainability 2021, 13, 2092. [Google Scholar] [CrossRef]
- Bagri, V.; Sharma, L.; Patil, B.; Dhage, S.N. Survey of Automated Waste Segregation Methods. In Advances in Computer, Communication and Computational Sciences; Springer: Berlin/Heidelberg, Germany, 2021; pp. 953–964. [Google Scholar]
- Zhang, Q.; Zhang, X.; Mu, X.; Wang, Z.; Tian, R.; Wang, X.; Liu, X. Recyclable waste image recognition based on deep learning. Resour. Conserv. Recycl. 2021, 171, 105636. [Google Scholar] [CrossRef]
- Rahman, M.W.; Islam, R.; Hasan, A.; Bithi, N.I.; Hasan, M.M.; Rahman, M.M. Intelligent waste management system using deep learning with IoT. J. King Saud Univ.-Comput. Inf. Sci. 2020, 34, 2072–2087. [Google Scholar] [CrossRef]
- Ramsurrun, N.; Suddul, G.; Armoogum, S.; Foogooa, R. Recyclable Waste Classification Using Computer Vision And Deep Learning. In Proceedings of the 2021 Zooming Innovation in Consumer Technologies Conference (ZINC), Novi Sad, Serbia, 26–27 May 2021; pp. 11–15. [Google Scholar]
- Mao, W.L.; Chen, W.C.; Wang, C.T.; Lin, Y.H. Recycling waste classification using optimized convolutional neural network. Resour. Conserv. Recycl. 2021, 164, 105132. [Google Scholar] [CrossRef]
- Altikat, A.; Gulbe, A.; Altikat, S. Intelligent solid waste classification using deep convolutional neural networks. Int. J. Environ. Sci. Technol. 2022, 19, 1285–1292. [Google Scholar] [CrossRef]
- The FUSON Website. Available online: https://www.fuzon.io/insight/top-iotstatistics/ (accessed on 5 July 2022).
- The STATISTA Website. Available online: https://0-www-statista-com.brum.beds.ac.uk/topics/2637/internet-of-things/ (accessed on 5 July 2022).
- Sheng, T.J.; Islam, M.S.; Misran, N.; Baharuddin, M.H.; Arshad, H.; Islam, M.R.; Chowdhury, M.E.; Rmili, H.; Islam, M.T. An internet of things based smart waste management system using LoRa and tensorflow deep learning model. IEEE Access 2020, 8, 148793–148811. [Google Scholar] [CrossRef]
- Esmaeilian, B.; Wang, B.; Lewis, K.; Duarte, F.; Ratti, C.; Behdad, S. The future of waste management in smart and sustainable cities: A review and concept paper. Waste Manag. 2018, 81, 177–195. [Google Scholar] [CrossRef]
- Catarinucci, L.; Colella, R.; Consalvo, S.I.; Patrono, L.; Rollo, C.; Sergi, I. IoT-aware waste management system based on cloud services and ultra-low-power RFID sensor-tags. IEEE Sens. J. 2020, 20, 14873–14881. [Google Scholar] [CrossRef]
- Livani, E.; Nguyen, R.; Denzinger, J.; Ruhe, G.; Banack, S. A hybrid machine learning method and its application in municipal waste prediction. In Industrial Conference on Data Mining; Springer: Berlin/Heidelberg, Germany, 2013; pp. 166–180. [Google Scholar]
- Yigitcanlar, T.; Cugurullo, F. The sustainability of artificial intelligence: An urbanistic viewpoint from the lens of smart and sustainable cities. Sustainability 2020, 12, 8548. [Google Scholar] [CrossRef]
- Belli, L.; Cilfone, A.; Davoli, L.; Ferrari, G.; Adorni, P.; Di Nocera, F.; Dall’Olio, A.; Pellegrini, C.; Mordacci, M.; Bertolotti, E. IoT-enabled smart sustainable cities: Challenges and approaches. Smart Cities 2020, 3, 1039–1071. [Google Scholar] [CrossRef]
- Davis, D.R.; Dingel, J.I. A spatial knowledge economy. Am. Econ. Rev. 2019, 109, 153–170. [Google Scholar] [CrossRef]
- Davis, D.R.; Dingel, J.I. The comparative advantage of cities. J. Int. Econ. 2020, 123, 103291. [Google Scholar] [CrossRef]
- Klimanova, O.; Illarionova, O.; Grunewald, K.; Bukvareva, E. Green infrastructure, urbanization, and ecosystem services: The main challenges for Russia’s largest cities. Land 2021, 10, 1292. [Google Scholar] [CrossRef]
- Kuddus, M.A.; Tynan, E.; McBryde, E. Urbanization: A problem for the rich and the poor? Public Health Rev. 2020, 41, 1–4. [Google Scholar] [CrossRef]
- Anierobi, C.; Obasi, C.O. Urbanization and Rural-Urban Migration: Toward Involving the Church in Addressing Pro-Poor Urban Housing Challenges in Enugu, Nigeria. SAGE Open 2021, 11, 21582440211040123. [Google Scholar] [CrossRef]
- Blair, J.; Mataraarachchi, S. A Review of Landfills, Waste and the Nearly Forgotten Nexus with Climate Change. Environments 2021, 8, 73. [Google Scholar] [CrossRef]
- Wang, Y.S. The challenges and strategies of food security under rapid urbanization in China. Sustainability 2019, 11, 542. [Google Scholar] [CrossRef]
- Arfanuzzaman, M.; Dahiya, B. Sustainable urbanization in Southeast Asia and beyond: Challenges of population growth, land use change, and environmental health. Growth Chang. 2019, 50, 725–744. [Google Scholar] [CrossRef]
- Ravichandran, C.; Venkatesan, G. Toward sustainable solid waste management–challenges and opportunities. Handb. Adv. Approaches Towards Pollut. Prev. Control 2021, 2, 67–103. [Google Scholar]
- Niinimäki, K.; Peters, G.; Dahlbo, H.; Perry, P.; Rissanen, T.; Gwilt, A. The environmental price of fast fashion. Nat. Rev. Earth Environ. 2020, 1, 189–200. [Google Scholar] [CrossRef]
- Rahimi, A.; García, J.M. Chemical recycling of waste plastics for new materials production. Nat. Rev. Chem. 2017, 1, 1–11. [Google Scholar] [CrossRef]
- Gelan, E. Municipal Solid waste management practices for achieving green architecture concepts in Addis Ababa, Ethiopia. Technologies 2021, 9, 48. [Google Scholar] [CrossRef]
- Abuga, D.; Raghava, N. Real-time smart garbage bin mechanism for solid waste management in smart cities. Sustain. Cities Soc. 2021, 75, 103347. [Google Scholar] [CrossRef]
- Srivastav, A.L.; Kumar, A. An endeavor to achieve sustainable development goals through floral waste management: A short review. J. Clean. Prod. 2021, 283, 124669. [Google Scholar] [CrossRef]
- Wen, Z.; Xie, Y.; Chen, M.; Dinga, C.D. China’s plastic import ban increases prospects of environmental impact mitigation of plastic waste trade flow worldwide. Nat. Commun. 2021, 12, 1–9. [Google Scholar] [CrossRef] [PubMed]
- Lam, S.S.; Alstrup, A.K.; Sonne, C. Denmark recycling plan will cut waste by two-thirds. Nature 2020, 584, 192–193. [Google Scholar] [CrossRef]
- Li, J.; Xiao, F.; Zhang, L.; Amirkhanian, S.N. Life cycle assessment and life cycle cost analysis of recycled solid waste materials in highway pavement: A review. J. Clean. Prod. 2019, 233, 1182–1206. [Google Scholar] [CrossRef]
- Chen, Y.C. Evaluating greenhouse gas emissions and energy recovery from municipal and industrial solid waste using waste-to-energy technology. J. Clean. Prod. 2018, 192, 262–269. [Google Scholar] [CrossRef]
- Abdollahbeigi, M. An overview of the paper recycling process in Iran. J. Chem. Rev. 2020, 3, 1–19. [Google Scholar]
- Radwan, N.; Khan, N.A.; Elmanfaloty, R.A.G. Optimization of solid waste collection using RSM approach, and strategies delivering sustainable development goals (SDG’s) in Jeddah, Saudi Arabia. Sci. Rep. 2021, 11, 1–12. [Google Scholar] [CrossRef] [PubMed]
- Ahmed, Z.; Asghar, M.M.; Malik, M.N.; Nawaz, K. Moving towards a sustainable environment: The dynamic linkage between natural resources, human capital, urbanization, economic growth, and ecological footprint in China. Resour. Policy 2020, 67, 101677. [Google Scholar] [CrossRef]
- Rehman, A.; Khan, K.A.; Hamid, T.; Nasir, H.; Ahmad, I.; Alam, M. Effective utilization of municipal solid waste as substitute for natural resources in cement industry. Civ. Eng. J. 2020, 6, 238–257. [Google Scholar] [CrossRef]
- Sarc, R.; Curtis, A.; Kandlbauer, L.; Khodier, K.; Lorber, K.E.; Pomberger, R. Digitalisation and intelligent robotics in value chain of circular economy oriented waste management—A review. Waste Manag. 2019, 95, 476–492. [Google Scholar] [CrossRef]
- Chen, D.M.C.; Bodirsky, B.L.; Krueger, T.; Mishra, A.; Popp, A. The world’s growing municipal solid waste: Trends and impacts. Environ. Res. Lett. 2020, 15, 074021. [Google Scholar] [CrossRef]
- Glouche, Y.; Couderc, P. A smart waste management with self-describing objects. In Proceedings of the Second International Conference on Smart Systems, Devices and Technologies (SMART’13), Rome, Italy, 23–28 June 2013. [Google Scholar]
- Anagnostopoulos, T.; Zaslavsky, A.; Kolomvatsos, K.; Medvedev, A.; Amirian, P.; Morley, J.; Hadjieftymiades, S. Challenges and opportunities of waste management in IoT-enabled smart cities: A survey. IEEE Trans. Sustain. Comput. 2017, 2, 275–289. [Google Scholar] [CrossRef]
- Omara, A.; Gulen, D.; Kantarci, B.; Oktug, S.F. Trajectory-assisted municipal agent mobility: A sensor-driven smart waste management system. J. Sens. Actuator Netw. 2018, 7, 29. [Google Scholar] [CrossRef]
- Cai, X.; Niu, Y.; Geng, S.; Zhang, J.; Cui, Z.; Li, J.; Chen, J. An under-sampled software defect prediction method based on hybrid multi-objective cuckoo search. Concurr. Comput. Pract. Exp. 2020, 32, e5478. [Google Scholar] [CrossRef]
- Yang, M.; Thung, G. Classification of trash for recyclability status. CS229 Proj. Rep. 2016, 2016, 3. [Google Scholar]
- Wang, H. Garbage recognition and classification system based on convolutional neural network VGG16. In Proceedings of the 2020 3rd International Conference on Advanced Electronic Materials, Computers and Software Engineering (AEMCSE), Shenzhen, China, 24–26 April 2020; pp. 252–255. [Google Scholar]
- Cao, L.; Xiang, W. Application of convolutional neural network based on transfer learning for garbage classification. In Proceedings of the 2020 IEEE 5th Information Technology and Mechatronics Engineering Conference (ITOEC), Chongqing, China, 12–14 June 2020; pp. 1032–1036. [Google Scholar]
- Vo, A.H.; Son, L.H.; Vo, M.T.; Le, T. A novel framework for trash classification using deep transfer learning. IEEE Access 2019, 7, 178631–178639. [Google Scholar] [CrossRef]
- Liao, Y. A Web-Based Dataset for Garbage Classification Based on Shanghai’s Rule. Int. J. Mach. Learn. Comput. 2020, 10, 18–24. [Google Scholar] [CrossRef]
- Huang, G.L.; He, J.; Xu, Z.; Huang, G. A combination model based on transfer learning for waste classification. Concurr. Comput. Pract. Exp. 2020, 32, e5751. [Google Scholar] [CrossRef]
- Aral, R.A.; Keskin, Ş.R.; Kaya, M.; Hacıömeroğlu, M. Classification of trashnet dataset based on deep learning models. In Proceedings of the 2018 IEEE International Conference on Big Data (Big Data), Seattle, WA, USA, 10–13 December 2018; pp. 2058–2062. [Google Scholar]
- Rabano, S.L.; Cabatuan, M.K.; Sybingco, E.; Dadios, E.P.; Calilung, E.J. Common garbage classification using mobilenet. In Proceedings of the 2018 IEEE 10th International Conference on Humanoid, Nanotechnology, Information Technology, Communication and Control, Environment and Management (HNICEM), Baguio City, Philippines, 29 November–2 December 2018; pp. 1–4. [Google Scholar]
- Ozkaya, U.; Seyfi, L. Fine-tuning models comparisons on garbage classification for recyclability. arXiv 2019, arXiv:1908.04393. [Google Scholar]
- Sidharth, R.; Rohit, P.; Vishagan, S.; Karthika, R.; Ganesan, M. Deep learning based smart garbage classifier for effective waste management. In Proceedings of the 2020 5th International Conference on Communication and Electronics Systems (ICCES), Coimbatore, India, 10–12 June 2020; pp. 1086–1089. [Google Scholar]
- Adedeji, O.; Wang, Z. Intelligent waste classification system using deep learning convolutional neural network. Procedia Manuf. 2019, 35, 607–612. [Google Scholar] [CrossRef]
- Chu, Y.; Huang, C.; Xie, X.; Tan, B.; Kamal, S.; Xiong, X. Multilayer hybrid deep-learning method for waste classification and recycling. Comput. Intell. Neurosci. 2018, 2018, 5060857. [Google Scholar] [CrossRef]
- Bobulski, J.; Kubanek, M. Waste classification system using image processing and convolutional neural networks. In International Work-Conference on Artificial Neural Networks; Springer: Cham, Switerland, 2019; pp. 350–361. [Google Scholar]
- Srinilta, C.; Kanharattanachai, S. Municipal solid waste segregation with CNN. In Proceedings of the 2019 5th International Conference on Engineering, Applied Sciences and Technology (ICEAST), Luang Prabang, Laos, 2–5 July 2019; pp. 1–4. [Google Scholar]
- Susanth, G.S.; Livingston, L.J.; Livingston, L.A. Garbage Waste Segregation Using Deep Learning Techniques. In IOP Conference Series: Materials Science and Engineering; IOP Publishing: Bristol, UK, 2021; Volume 1012, p. 012040. [Google Scholar]
- Simonyan, K.; Zisserman, A. Very deep convolutional networks for large-scale image recognition. arXiv 2014, arXiv:1409.1556. [Google Scholar]
- Zeiler, M.D.; Fergus, R. Visualizing and understanding convolutional networks. In European Conference on Computer Vision; Springer: Cham, Switerland, 2014; pp. 818–833. [Google Scholar]
- Wang, J.; Yang, Y.; Mao, J.; Huang, Z.; Huang, C.; Xu, W. Cnn-rnn: A unified framework for multi-label image classification. In Proceedings of the IEEE Conference on Computer Vision and Pattern Recognition, Las Vegas, NV, USA, 27–30 June 2016; pp. 2285–2294. [Google Scholar]
- Alsubaei, F.S.; Al-Wesabi, F.N.; Hilal, A.M. Deep Learning-Based Small Object Detection and Classification Model for Garbage Waste Management in Smart Cities and IoT Environment. Appl. Sci. 2022, 12, 2281. [Google Scholar] [CrossRef]
- Akkad, M.Z.; Haidar, S.; Bányai, T. Design of Cyber-Physical Waste Management Systems Focusing on Energy Efficiency and Sustainability. Designs 2022, 6, 39. [Google Scholar] [CrossRef]
- Ijemaru, G.K.; Ang, L.M.; Seng, K.P. Transformation from IoT to IoV for waste management in smart cities. J. Netw. Comput. Appl. 2022, 204, 103393. [Google Scholar] [CrossRef]
- Abdullah, N.; Al-Wesabi, O.A.; Mohammed, B.A.; Al-Mekhlafi, Z.G.; Alazmi, M.; Alsaffar, M.; Anbar, M.; Sumari, P. Integrated Approach to Achieve a Sustainable Organic Waste Management System in Saudi Arabia. Foods 2022, 11, 1214. [Google Scholar] [CrossRef]
- Fawwaz, D.Z.; Chung, S.H.; Ahn, C.W.; Kim, W.S. Optimal Distributed MQTT Broker and Services Placement for SDN-Edge Based Smart City Architecture. Sensors 2022, 22, 3431. [Google Scholar] [CrossRef] [PubMed]
- Namoun, A.; Hussein, B.R.; Tufail, A.; Alrehaili, A.; Syed, T.A.; BenRhouma, O. An Ensemble Learning Based Classification Approach for the Prediction of Household Solid Waste Generation. Sensors 2022, 22, 3506. [Google Scholar] [CrossRef] [PubMed]
- Hussain, A.; Draz, U.; Ali, T.; Tariq, S.; Irfan, M.; Glowacz, A.; Antonino Daviu, J.A.; Yasin, S.; Rahman, S. Waste management and prediction of air pollutants using IoT and machine learning approach. Energies 2020, 13, 3930. [Google Scholar] [CrossRef]
- Shamin, N.; Fathimal, P.M.; Raghavendran, R.; Prakash, K. Smart garbage segregation & management system using Internet of Things (IoT) & Machine Learning (ML). In Proceedings of the 2019 1st International Conference on Innovations in Information and Communication Technology (ICIICT), Chennai, India, 25–26 April 2019; pp. 1–6. [Google Scholar]
- Koyanaka, S.; Kobayashi, K. Automatic sorting of lightweight metal scrap by sensing apparent density and three-dimensional shape. Resour. Conserv. Recycl. 2010, 54, 571–578. [Google Scholar] [CrossRef]
- Koyanaka, S.; Kobayashi, K. Incorporation of neural network analysis into a technique for automatically sorting lightweight metal scrap generated by ELV shredder facilities. Resour. Conserv. Recycl. 2011, 55, 515–523. [Google Scholar] [CrossRef]
- Rahman, M.O.; Hussain, A.; Scavino, E.; Basri, H.; Hannan, M. Intelligent computer vision system for segregating recyclable waste papers. Expert Syst. Appl. 2011, 38, 10398–10407. [Google Scholar] [CrossRef]
- Omar, L.G.; Oscar, R.A.; Andres, T.G.; Francisco, S.G. Multimedia inorganic waste separator. In Proceedings of the 2013 IEEE International Conference on Multimedia and Expo Workshops (ICMEW), San Jose, CA, USA, 15–19 July 2013; pp. 1–4. [Google Scholar]
- Rahman, M.O.; Hussain, A.; Scavino, E.; Hannan, M.; Basri, H. DNA computer based algorithm for recyclable waste paper segregation. Appl. Soft Comput. 2015, 31, 223–240. [Google Scholar] [CrossRef]
- Sakr, G.E.; Mokbel, M.; Darwich, A.; Khneisser, M.N.; Hadi, A. Comparing deep learning and support vector machines for autonomous waste sorting. In Proceedings of the 2016 IEEE International Multidisciplinary Conference on Engineering Technology (IMCET), Beirut, Lebanon, 2–4 November 2016; pp. 207–212. [Google Scholar]
- Zhihong, C.; Hebin, Z.; Yanbo, W.; Binyan, L.; Yu, L. A vision-based robotic grasping system using deep learning for garbage sorting. In Proceedings of the 2017 36th Chinese Control Conference (CCC), Dalian, China, 26–28 July 2017; pp. 11223–11226. [Google Scholar]
- Setiawan, W.; Wahyudin, A.; Widianto, G. The use of scale invariant feature transform (SIFT) algorithms to identification garbage images based on product label. In Proceedings of the 2017 3rd International Conference on Science in Information Technology (ICSITech), Bandung, Indonesia, 25–26 October 2017; pp. 336–341. [Google Scholar]
- Kumar, S.; Yadav, D.; Gupta, H.; Verma, O.P.; Ansari, I.A.; Ahn, C.W. A novel yolov3 algorithm-based deep learning approach for waste segregation: Towards smart waste management. Electronics 2020, 10, 14. [Google Scholar] [CrossRef]
- Yang, Z.; Li, D. Wasnet: A neural network-based garbage collection management system. IEEE Access 2020, 8, 103984–103993. [Google Scholar] [CrossRef]
- Bobulski, J.; Kubanek, M. Deep learning for plastic waste classification system. Appl. Comput. Intell. Soft Comput. 2021, 2021, 6626948. [Google Scholar] [CrossRef]
- Trashnet Waste Categries Dataset Github Link. Available online: https://github.com/garythung/trashnet (accessed on 10 August 2022).
Figure 1.
Smart Waste Classification Mechanism.

Figure 2.
Block Diagram of SWMACM-CA.

Figure 3.
Segmentation and Classification Mechanism.

Figure 4.
Grid Segmentation. (a) presents the image divided in grids. (b) epresents the grids split into segments. (c) presents the segments converted to grayscale. (d) presents the final image.
Figure 4.
Grid Segmentation. (a) presents the image divided in grids. (b) epresents the grids split into segments. (c) presents the segments converted to grayscale. (d) presents the final image.

Figure 5.
Experimental Setup.

Figure 6.
Sample images from Dataset (Adapted with permission from [85]).
Figure 6.
Sample images from Dataset (Adapted with permission from [85]).

Figure 7.
Number of Samples among each class of dataset.

Figure 8.
Accuracy Comparison.

Figure 9.
Latency Comparison.

Figure 10.
Error Rate Comparison.

Figure 11.
Inference Time.

Figure 12.
Precision Comparison.

Figure 13.
Resource Utilization Comparison.

Figure 14.
Accuracy of trained model after 01 epochs.

Figure 15.
Categories of waste items.

Figure 16.
Prediction results.


Table 1.
Summary of Related Research Efforts 1A.
| Study | Architecture | For IoT | Waste Category | Hardware Category | Accuracy (%) | Dataset | Remarks |
|---|---|---|---|---|---|---|---|
| [74,75] | Multivariate analysis with neural network | NA | Light Weight Metals | Weight sensor, linear laser, 3D camera | 85% | NA | Cannot classify other materials |
| [76] | KNN | NA | Recyclable Paper | Camera | 93% | NA | Require consistent lightening during identification phase |
| [77] | Hu’s image invariant moments with KNN | NA | Inorganic material such as bottles, cutlery, Cans | Camera | 98% | NA | Unreliable results due to small dataset |
| [78] | DNA Computing Algorithms (RGBI) | NA | Paper | Camera | 95.1% | NA | Require consistent lightening during identification phase |
| [79] | SVM and CNN | NA | Paper, Metal and Plastic | Camera | SVM: 94.8% CNN: 83% | NA | Dataset is less versatile due to Low GPU memory images scaled down from 256 × 256 to 32 × 32 |
| [80] | Fast-R CNN | NA | Plastic Bottles | Robotic Arm, KUKA, Camera | 91% | NA | Segregate only plastic. Output reliant on lighting |
| [81] | Scale Invariant Feature Transform (SIFT) | NA | Organic and inorganic items with product labels | Camera | 89.9% | Self-made dataset of 192 images | Most waste items do not have product labels; hence, the scope is limited |
Table 2.
Summary of Related Research Efforts 1B.
| Study | Architecture | For IoT | Waste Category | Hardware Category | Accuracy (%) | Dataset | Remarks |
|---|---|---|---|---|---|---|---|
| [52] | VGG16, CNN, ResNet50 | NA | Household food waste, recyclable waste, hazardous waste, residual waste | NA | VGG16: 37% CNN: 37% ResNet-50: 47% | Self-made | Not integrated with a decision support or classification system. Accuracy is not properly calculated |
| [82] | YOLOv3, Darknet neural network | NA | Glass, paper, metal, plastic, cardboard, organic waste | NA | Glass: 97% paper: 85% metal: 99% plastic: 91% cardboard: 97% org-waste: 98% mAP: 94% | Self-made | Takes more time to detect an object. |
| [83] | WasNet, Lightweight neural network | NA | NA | Camera | ImageNet: 64.5% Garbage Classification: 82.5% TrashNet: 96.10% | ImageNet, Garbage Classification dataset, TrashNet | Implementation and results are unreliable. |
| [73] | SURF algo., KNN | Yes | Metal, Plastic | Ultrasonic sensor, Moister sensor, metal sensor, Camera | 95% | Self Made | Only one waste item can be put in dustbin at a time. If image of waste material captured in low light then results may vary. |
| [57] | CNN, Self-Learning Neural Network | NA | Plastic, Paper, Cardboard, Metal | NA | 76% | Trash Net | Less accuracy due to limited dataset. Not integrated with a decision support or classification system. |
| [84] | CNN, Image Processing Algo. | NA | Plastic and its four categorical: PS, PP, PE-HD, PET | Camera, Airjet | 74% | WaDaBa | Less effective as compared to other CNNs. |
| [62] | ResNet50, DenseNet169, VGG16, AlexNet | NA | Glass, paper, metal, plastic, cardboard, Trash | NA | ResNet50: 89.7% DenseNet169: 92.6% VGG16: 86.9% AlexNet: 83.7% | ImageNet | System misclassify ‘glass’. Not integrated with a decision support or classification system. |
Table 3.
Specification of Each Component.
| Module Name | Hardware Requirement | Component Specs |
|---|---|---|
| Edge Node | Raspberry Pi 4B Pi-CAM | 4GB (RAM) 5MP |
| Cloud Processing | Artificial Intelligence Module | — |
| Pre-trained Deep Learning Model | — | |
| Control Unit | Micro-controller Bluetooth Module Gripper Stepper Motor | Arduino Mega 2560 HC 05 (Slave Mode) 4 Degree of Freedom (DOF) 1.8 deg/step, 2.4 V |
| Power Source | DC Battery | 6V, 4.5AH |
Table 4.
Sample Distributions for training and testing subsets.
| Class Label | Training | Testing | Total |
|---|---|---|---|
| Metal | 328 | 82 | 410 |
| Metal | 328 | 82 | 410 |
| Glass | 400 | 101 | 501 |
| Plastic | 385 | 97 | 482 |
| Trash | 109 | 28 | 137 |
| Total | 1222 | 308 | 1530 |
Table 5.
Analytical Comparison with state of the techniques.
| Study | Architecture | Waste Category | Accuracy |
|---|---|---|---|
| [52] | VGG16, CNN, ResNet50 | Household food waste, recyclable waste, hazardous waste, residual waste | VGG16:37% CNN: 37% ResNet-50: 47% |
| [83] | WasNet, Lightweight neural network | Not Available | ImageNet: 64.5% Garbage classification: 82.5% TrashNet: 96.10% |
| [57] | CNN, Self-Learning Neural Network | Plastic, Paper, Cardboard, Metal | 76% |
| [84] | CNN, Image-Processing Algorithm | Plastic and its four categories PS, PP, PE-HD PET | 74% |
| [62] | ResNet, DenseNet VGG-16, AlexNet | Glass, paper metal, plastic cardboard, trash | ResNet: 89.7% DenseNet169: 92.6% VGG16: 86.9% AlexNet: 83.7% |
| Proposed | VGG-16, Fast R-CNN, MobileNetV2 | Glass, plastic metal, trash | VGG16: 96.1% Fast RCNN: 88% MobileNet V2: 85% |
Publisher’s Note: MDPI stays neutral with regard to jurisdictional claims in published maps and institutional affiliations. |
© 2022 by the authors. Licensee MDPI, Basel, Switzerland. This article is an open access article distributed under the terms and conditions of the Creative Commons Attribution (CC BY) license (https://creativecommons.org/licenses/by/4.0/).
Share and Cite
MDPI and ACS Style
Cheema, S.M.; Hannan, A.; Pires, I.M. Smart Waste Management and Classification Systems Using Cutting Edge Approach. Sustainability 2022, 14, 10226. https://0-doi-org.brum.beds.ac.uk/10.3390/su141610226
AMA Style
Cheema SM, Hannan A, Pires IM. Smart Waste Management and Classification Systems Using Cutting Edge Approach. Sustainability. 2022; 14(16):10226. https://0-doi-org.brum.beds.ac.uk/10.3390/su141610226
Chicago/Turabian StyleCheema, Sehrish Munawar, Abdul Hannan, and Ivan Miguel Pires. 2022. "Smart Waste Management and Classification Systems Using Cutting Edge Approach" Sustainability 14, no. 16: 10226. https://0-doi-org.brum.beds.ac.uk/10.3390/su141610226
Note that from the first issue of 2016, this journal uses article numbers instead of page numbers. See further details here.