1. Introduction
Following rapid urbanization and the increase in the population of cities, motorized transportation and car dependency has increased sharply, especially in developing countries. Environmental pollution is one of the most apparent consequences of the overuse of private vehicles. Still, this issue is not limited to the destructive effects of motorized transport in major cities worldwide. Other consequences include road fatalities, reduced physical activity, over-consumption of non-renewable energy, and high travel costs.
The lack of suitable infrastructure for non-motorized transportation, especially in urban centers, directly affects the reduction of quality of life and the health of citizens [
1]. Due to such a growing crisis, one of the goals of the sustainability approach is to develop resilient and healthy societies by providing a safe transportation system that is affordable and accessible for all groups, especially the disabled and marginal groups. The role of transport in sustainable development was first discussed at the Earth Summit in 1992, and its importance in developing countries was discussed at international conferences [
1].
The impact of sustainable transportation on the health of citizens became even more critical after the coronavirus pandemic. Average road transport use halved in early 2020, and cycling and pedestrian use increased sharply [
1]. According to the United Nations (UN) report [
1], cycling and walking are among the most stable active modes. Therefore, planners, researchers, and policymakers are increasingly considering pedestrian-friendly design and planning in sustainable transportation. In this approach, the needs and preferences of individuals for walking are the basis of decision making [
2]. Implementing walkability policies in developed countries has been proposed as one of the solutions to combat the destructive effects of motor vehicles [
3]. Research by Davis and Boundy [
4] has shown that the growth rate of private cars in selected developing countries is almost five times that of selected developed countries. Therefore, sustainable transportation is even more important in these countries because the social and economic problems caused by the rapid growth of urbanization and the need for equal and affordable access to emergency services and facilities are much more severe. One of the goals of development plans in developing countries is to use all capacities for improving sustainable transport [
5]. This goal includes several axes, including reducing the use of motor vehicles. The approach that policymakers and urban planners in these countries take is moving towards creating walkable communities and following the principles of walkability in cities.
One of these principles is improving active transport. There is a strong relation between walkability and active transport since this approach provides a great range of transport mode choices for residents [
6]. As recent research has shown, providing suitable infrastructures and facilities, such as P&R parking, and bike-sharing systems, has been assessed as successful methods by increasing the accessibility to public transport [
7]. A shared E-Scooters system is the other method regarding active transport in the walkability approach [
8]. Improving smart pedestrian networks is another measurement, which can be taken in order to develop active transport [
9]. Although these methods have been investigated in recent research, this paper is only focused on the policies that are tangible for the Iranian people, because some of these methods are not feasible regarding the geographical, social, and political conditions of Iran.
These policies were relatively successful in developed countries. Numerous studies were conducted on the importance of walkable communities in increasing the quality of life in individuals’ socio-economic dimensions, health, and safety [
3]. However, some developing communities have faced challenges and obstacles in developing pedestrian-friendly policies and designing walkable neighborhoods. There are several reasons for these policies’ failures or slow implementation because the walkability approach is highly context-based. What is important in implementing this approach to increase citizens’ quality of life is to know precisely the characteristics of the target community and consider the economic, social conditions, and urban policy approaches in that field.
Developing countries do not have enough experience in the implementation of this policy. Research has shown that these countries’ social and economic context has led to different priorities in sustainable transportation [
10]. This indicates that the types of policies and how they are implemented in these countries cannot follow the used models in developed countries. One of the reasons for the failure of sustainable transport policies, such as creating walkable communities, is the lack of attention to citizens’ real needs and preferences that directly affect citizen participation in the decision-making and implementation process [
11]. Given the importance of citizen participation in implementing urban policies, participatory methods in sustainable transport planning have been widely used at various stages [
1,
3,
12].
In Iran, as in other developing countries, the widespread use of motor vehicles has had irreparable consequences; the need to reduce energy consumption and carbon production in transportation and ensure the safety and health of travel is emphasized in the international discussions [
1]. The importance of these matters is also mentioned in the Sixth Development Plan of Iran [
13]. In this program, an annual reduction of 31% of road casualties has been proposed as one of the critical goals, but this has not been fully achieved during the last five years [
14,
15]. The walkability approach has been considered one of the aspects of sustainable transportation by city managers. Several programs have been prepared in this regard, and some have been implemented. What is not considered in preparing these plans is the adaptation of policies and planning priorities for walkable communities commensurate with the target community’s characteristics and expectations. Participatory approaches that designers and planners have used in developing countries, including Iran, are assumed to be citizens’ full awareness of walkability, and prioritization has been limited to commenting on the current state of sidewalks or surveying behaviors [
10,
16,
17,
18,
19]. What has been less studied is the willingness of citizens to implement these policies. The concept of willingness to pay can evaluate non-market concepts, such as public policy, especially about measures that increase individuals’ quality of life, health, and safety. Therefore, the present study uses the concept of WTP to measure how much citizens in developing countries are willing to pay extra to implement walkability policies, and what their priorities are. Furthermore, what are the factors leading to these priorities? By answering these questions, the study will then compare the results for Iran to those of other studies, in both developing and developed countries. Another purpose of this study is to investigate to what extent the factors influencing walkability and people’s priorities are similar among developing countries and different from developed countries. According to the previous studies, which will be discussed in the Review of the Literature section, income level does not influence WTP for walkability policies (H1) in developing countries, while age (H2), car ownership (H3), cost (H4), and gender (H5) do. Furthermore, spatial (H6), social (H7), access (H8), and safety (H9) factors positively influence WTP for walkability policies.
In the following: first, the literature review will be discussed; this section includes assessing the current state of the walkability policies and the context of these policies in developing countries and in the case study. It will be followed by describing the research method, analyzing the findings, and, at the end, based on the results, recommendations and suggestions will be provided.
2. Review of the Literature
Because of a paradigm shift in planning approaches, accessibility has become more important than mobility. Since then, planners have focused on “people” and their needs rather than transport vehicles [
20]. From the middle of the twentieth century, scholars and researchers turned to human-centered approaches and preferred the pedestrian’s needs to automobiles [
21,
22,
23]. Concepts such as the right to the city, spatial justice, and the quality of urban life [
24,
25] were also discussed. The walkability approach attempts to bring all of these dimensions together in one context; by building walkable communities. Walkable communities’ development requires policies that address all of its dimensions. Three aspects of sustainability, including social, economic, and environmental dimensions, are considered in this approach, and each is divided into several sections. The research conducted so far on evaluating walkability policies or developing design patterns, and guidelines has examined different dimensions of a walkable city. The term “eyes on the street” was first introduced by Jane Jacobs [
26], which was used as the element of a safe city and attracted the attention of urban designers and planners. Oscar Newman [
27] claimed that a suitable light design could make cities safer for pedestrians. Many scholars and planners used these factors to assess walkable communities [
28,
29,
30].
Research has shown that people are likelier to walk and cycle in a healthy and attractive environment [
29,
30,
31,
32]. According to Lucchesi et al. [
33] increasing the quality of the physical environment is one of the priorities to improve walkability in Brazilian cities; it is also proven to be effective in Canadian cities [
6]. In addition, in a walkable community, people have a sense of place [
25,
28] and have social interactions [
32,
34]. Sustainable transportation planning plays a crucial role in building a walkable community.
To provide affordable and fair access for all citizens to jobs, facilities, leisure areas, etc. [
28,
35], a variety of travel methods, such as public transport, pedestrians, and bicycles, should be provided [
32,
34], with the least amount of pollutants and energy consumption. The importance of accessibility to public transport has been proven in cities on Global South [
33]. Many studies have shown that the design of the transportation network in a walkable community should be such that its connection and integrity are maintained, and its geometric characteristics provide sufficient comfort and safety for all types of travel methods, especially bicycles and pedestrians [
28,
29,
30,
32,
34]. These articles also addressed access to network amenities as a critical element of walkability policies.
Citizen participation plays a vital role in implementing walkability policies. Public preferences and priorities vary between different socioeconomic contexts. Hence, the factors that affect people’s willingness to pay for public policies depend on their socioeconomic situation. Policymakers and planners should pay attention to the characteristics of individuals’ contexts and their relationship to their willingness to pay to implement various programs. As for the concept of WTP, different demographic indicators so far have been introduced, some of which are being used to assess sustainable transportation in developing countries.
These criteria include economic dimensions, such as income, car ownership, and occupation, and social dimensions, such as age and gender [
19,
36]. Given the broad dimensions of the walkable community and its effects on increasing health and reducing household costs, it is also essential to consider some contextual criteria, such as healthcare costs [
30].
The use of other sustainable modes of transportation, even in developed countries, faces challenges due to the novelty of the methods; these obstacles and limitations have been investigated in recent studies [
7,
8,
9,
37]. Considering that there are social and physical infrastructures, such as laws prohibiting the use of bicycles by women and the lack of sufficient technology to use digital systems for the pedestrian network and sharing systems, and the lack of specific lines for active modes, the implementation of these methods is not possible in the near future in Iran. Therefore, in this research, pedestrian moving, which is more feasible in Iran, has been discussed.
Sustainable transportation and pedestrian-centric planning are essential in developed and developing countries [
1]. Research on walkability in developing countries so far has shown that the indicators studied in developed countries and their results need to be customized and cannot be used precisely in developing countries [
17,
18,
38,
39,
40,
41], especially in Middle Eastern countries due to particular geographical and cultural features [
10].
Sustainable transport planning has received more attention from governments, planners, and international institutions in the last two decades. Sustainable transportation is a growing approach in developing countries, especially in the Middle East [
1,
10,
17,
42,
43]. However, little research has been done in this area due to economic and social barriers and political crises in recent decades. Therefore, it is necessary to study further the indicators of walkable communities and the factors affecting them according to the context of these countries.
Previous research has shown that in low-income countries, factors affecting people’s willingness to implement policies, which support active modes of transport, are different from high-income ones. For example, income and willingness to walk positively correlate in the United States, while there is no such relationship in Latin American countries [
40]. Some international standards, such as accessibility and quality of urban services, can be used only in developed countries and need to be revised in developing countries [
39]. In addition, factors such as the quality of public transportation in the Middle East, including in Iran, affect the willingness of people to walk more strongly than in developed countries [
18]. Due to the prevailing economic and social conditions in Middle Eastern countries, sustainability goals are considered with different priorities. For example, economic and social development is more important than the climate change crisis [
10].
For several reasons, the walkability approach in developing countries is limited to specific dimensions that can be easily implemented with a low budget, such as improving the quality of sidewalks [
17]. Most of the studies conducted in these countries have examined the barriers to walking, characteristics, and demographic, social, and economic structure of the studied communities and have provided suggestions for improving the design of traffic routes and design guidelines at the community level [
17].
In some developing countries, walkability policies have been limited to improving the quality of sidewalks [
10]. However, the results of some studies have shown that the successful implementation of sustainable transportation requires a macro view and holistic approach to include items such as quality of services and urban infrastructure, public transport, and related technologies in urban development plans and comprehensive transport plans [
10,
16]. Although some studies have examined the rate of active modes and the factors affecting them, less has been done to investigate the willingness of citizens to implement walkability policies.
To assess the citizens’ willingness to pay for more sustainable transportation in developing countries, Iran is considered in this research as the case study. It represents a middle eastern country with over 50% share of car ownership [
44]. Statistics show that more than half of Iran’s population is not physically active enough and injuries caused by road accidents in this country are one of the five leading causes of death [
15]. According to the National Cycling and Pedestrian Development Consultant, less than 25% of daily commutes in Iran are done on foot. In comparison, 80 to 90% of trips in most cities of Iran are less than 5 km and can be done through movement modes, such as walking and cycling [
44].
Table 1 shows the criteria of the walkable community and its evaluation indicators, along with the contextual indicators affecting the willingness of citizens to pay for the implementation of walkability policies.
Therefore, reviewing recent research reveals that several factors affect people’s willingness to use active transport, but the intensity and type of these factors in developing countries are significantly different from developed countries. However, there seems to be a gap in the previous studies, since they were limited to the economic and social characteristics of the target society in addition to their limited geographical scale. The lack of investigation of citizens’ willingness to participate in the implementation of policies through paying taxes is another gap that this paper intends to deal with and provide the possibility of comparing the results with previous studies.
4. Methodology
In the present article, a questionnaire that is attached as an
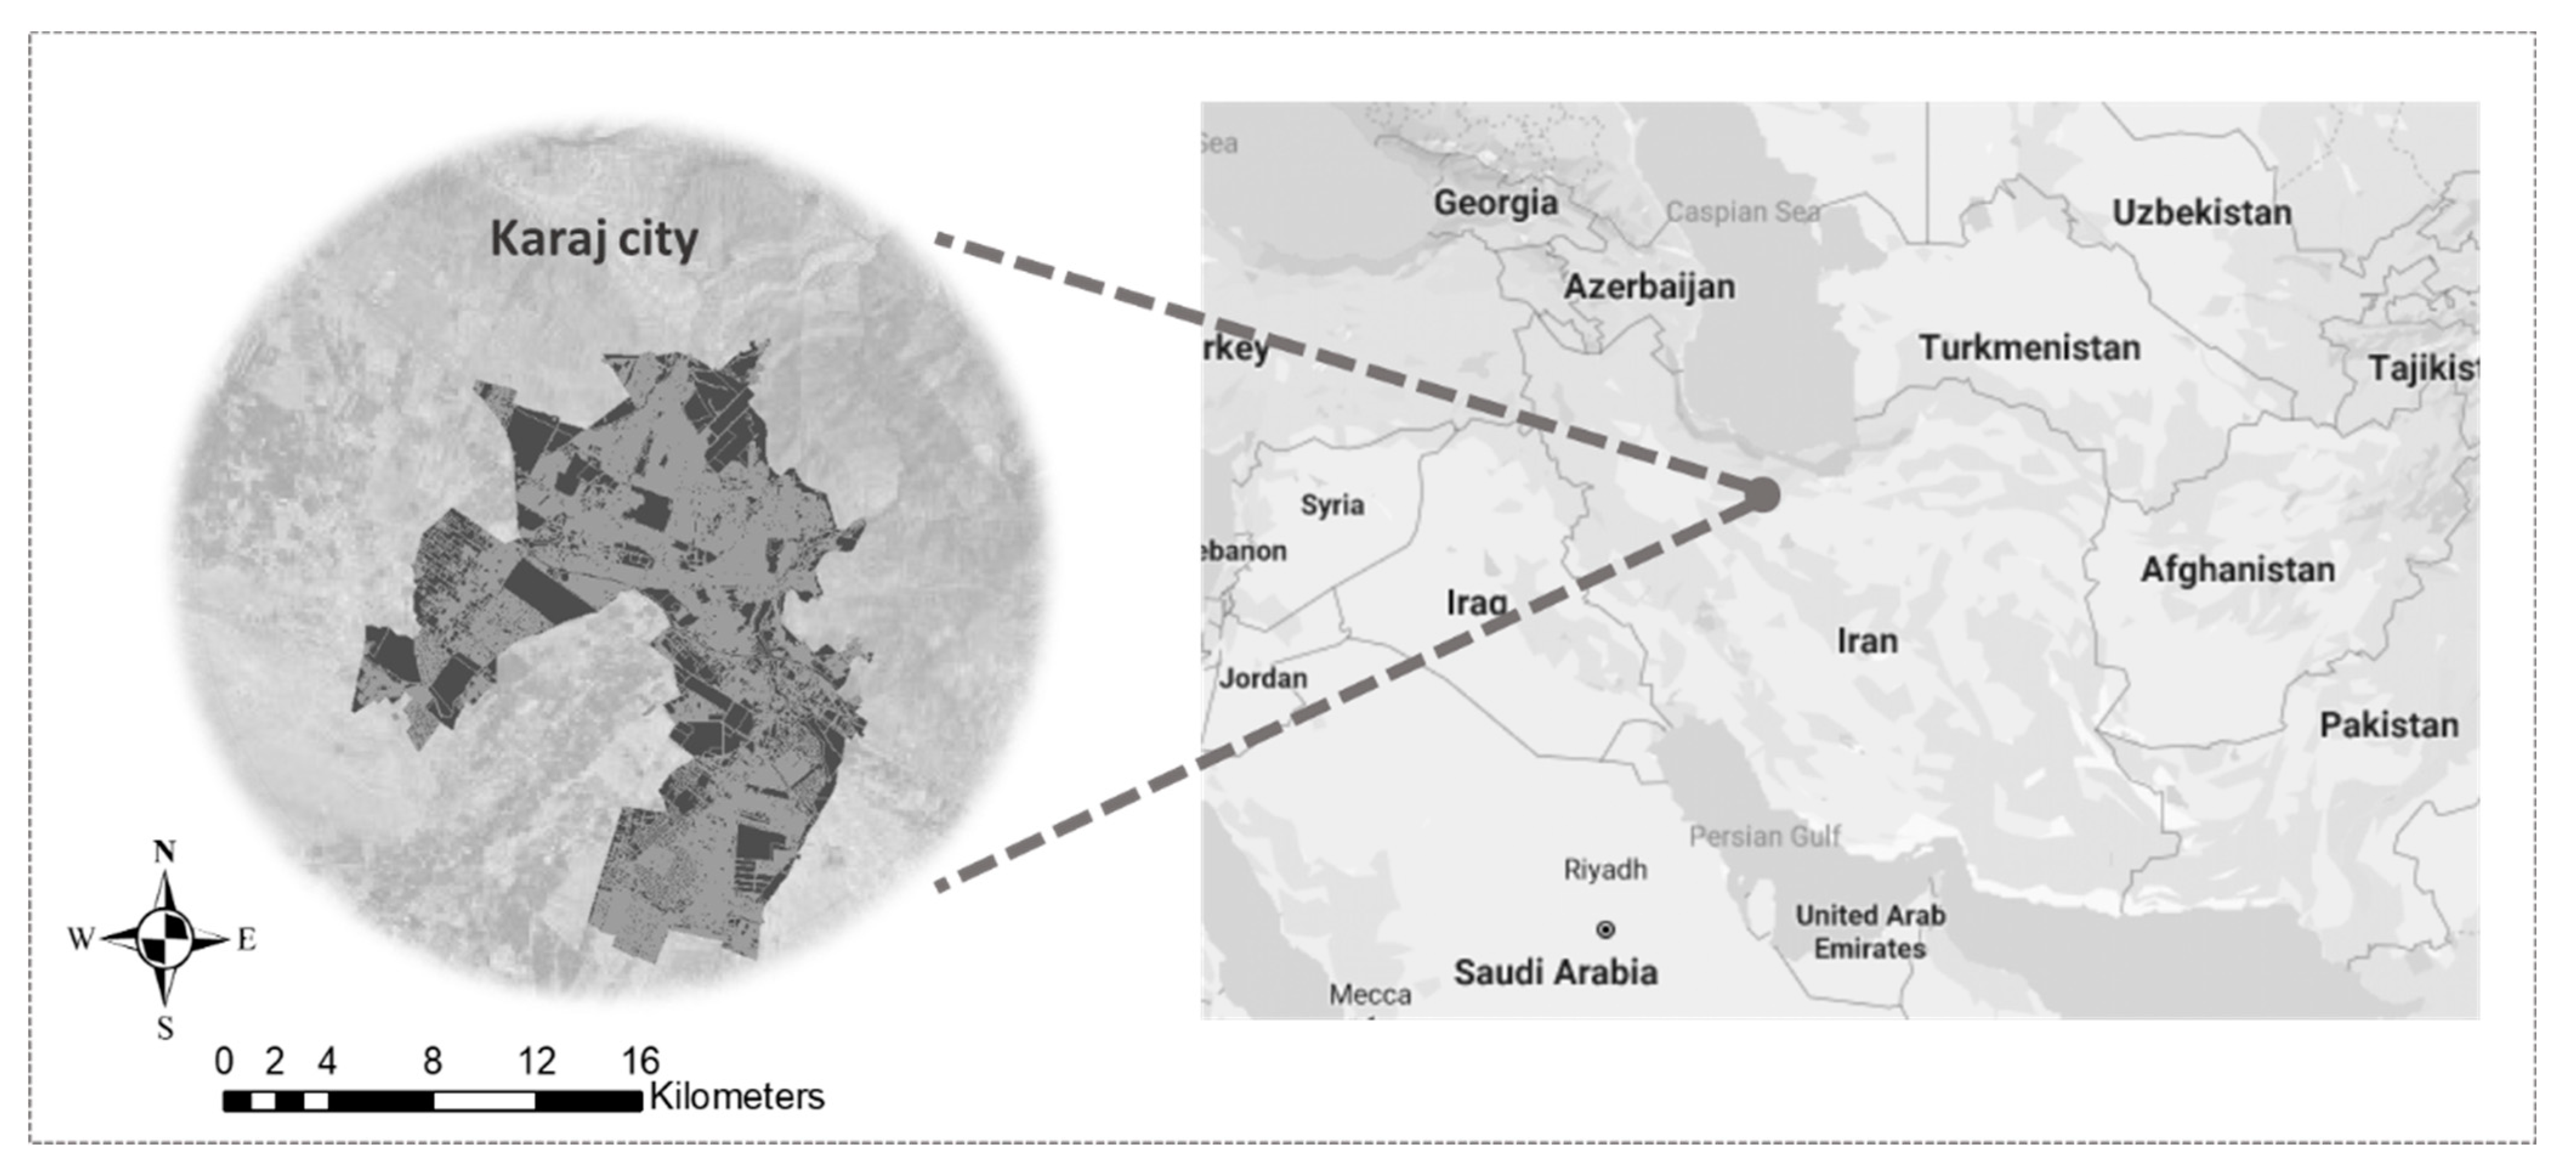
Appendix A, was used to examine the relationship between the importance of different walkability dimensions and the target community’s contextual characteristics and their willingness to pay for the implementation of walkability policies in their city. Due to the prevalence of the coronavirus pandemic, the citizens of Karaj completed the questionnaire online. The city of Karaj has ten districts and about 120 neighborhoods. To distribute the questionnaires according to the population of each neighborhood, several questionnaires were provided to the local public institutions of Karaj city, and those institutions randomly sent the questionnaire link to the households based on the code of each parcel. If the selected household did not respond, another parcel was replaced. It should be noted that after preparing the criteria for the article, they were provided to experts for scoring. In this process, several other variables that could be added to the article, according to the context of Iran and the city of Karaj, were collected and scored again using the opinion of experts that the two variables of travel cost and car maintenance cost gained the most points and added to article variables. The confirmatory factor analysis (CFA) technique is used in this research to examine the construct validity. Because of the social, topographical, and climate conditions in Karaj city, the only modes of transport which are used are walking, biking, private cars, and public transport. Therefore, the questions included these modes. The questions are divided into three general categories: the first part contains contextual questions that examine the contextual characteristics of the target community and are based on information obtained from the text of the review of the literature [
19,
30]. It includes gender, age, household income, car ownership, and household expenses. The last question is divided into three separate questions, including travel expenses, car maintenance costs, and treatment costs, and the answer to each is based on a 5-point Likert scale.
To collect data, 384 questionnaires were completed according to Cochran’s formula (with a confidence interval = 0.95% p = q = 0.05, d = 0.05) [
51,
52]; it is also recommended by Yamane [
53]. As shown in
Table 2, 58.3% of the respondents are women, and the rest are men. Among the respondents, 5.2% of them were aged equal to or less than 20, 62% were aged between 20 and 30, 24.2% were aged between 30 and 40, 4.4% were aged between 40 and 50, and 4.2% were aged equal to or higher than 50. A total of 25.1% of the respondents have a monthly income of less than 5 million tomans, 42% have a monthly income of 5 to 10 million tomans, and 32.9% have more than 10 million tomans. A total of 86.2% of the respondents have a private motor vehicle, and 13.8% do not. In the sample of Karaj city, 26.4% of the respondents consider the share of travel expenses in the monthly household expenses to be very high, 35% high, 28.1% medium, 8.1% low, and 2.5% very low. Furthermore, regarding the share of car maintenance costs in monthly household expenses, 25.4% considered this share to be very high, 34% high, 30.8% medium, 7.1% low, and 2.7% very low.
The second part examined the importance of four main dimensions of walkability policy, including social, spatial, accessibility, and safety dimensions, using the Likert scale (1 = very low, 5 = very high). In the third section, the willingness of citizens to pay was questioned. The conditional valuation method (CVM) was used to design this question. In this method, the respondents chose one of the four scenarios given to them after studying the explanations about walkability policies, their dimensions, application, and importance in increasing citizens’ quality of life. The first one is if they are unwilling to pay extra taxes to implement walkability policies in their city on any scale. The second one is if they pay 150,000 tomans (USD 6) to implement these policies only in major city centers. The third and fourth ones are for regions and neighborhoods for 350,000 tomans (USD 12) and 450,000 tomans (USD 16) per year. Research hypotheses have been developed based on how the independent and dependent variables of willingness to pay correlate.
There seems to be a significant relationship between three variables: gender, household income, and the WTP. Furthermore, age and car ownership have an inverse relationship with the WTP. In addition, travel and car maintenance cost in the monthly household expenses, sense of place, social interaction, network design, accessibility, and pedestrian safety seems to be directly related to WTP. Four walkability indicators, their related variables, and several contextual variables were used to design the structural model. One of the contextual indicators in this study is the monthly household cost, which consists of three variables: car maintenance, healthcare, and travel.
In this model, five indicators, including cost, car ownership, income, gender, and age, were examined as part of the structure and observed variables. All five indicators except income were evaluated as control variables. The contextual and walkability indicators together form the structural model of the present study, which is supposed to respond to the research hypotheses. Researchers have increasingly been conducting structural equation modeling (SEM) methods. Two popular methods dominate SEM in practice. One of them is partial least squares SEM (PLS-SEM), which focuses on explaining the variance in the model’s dependent variables. Several articles have been focusing on this methodology recently. In this article, regression analysis has been performed by applying partial least squares (PLS), a component-based structural equation modeling (SEM), with 1000 resamples through the R package “SEMinR”.
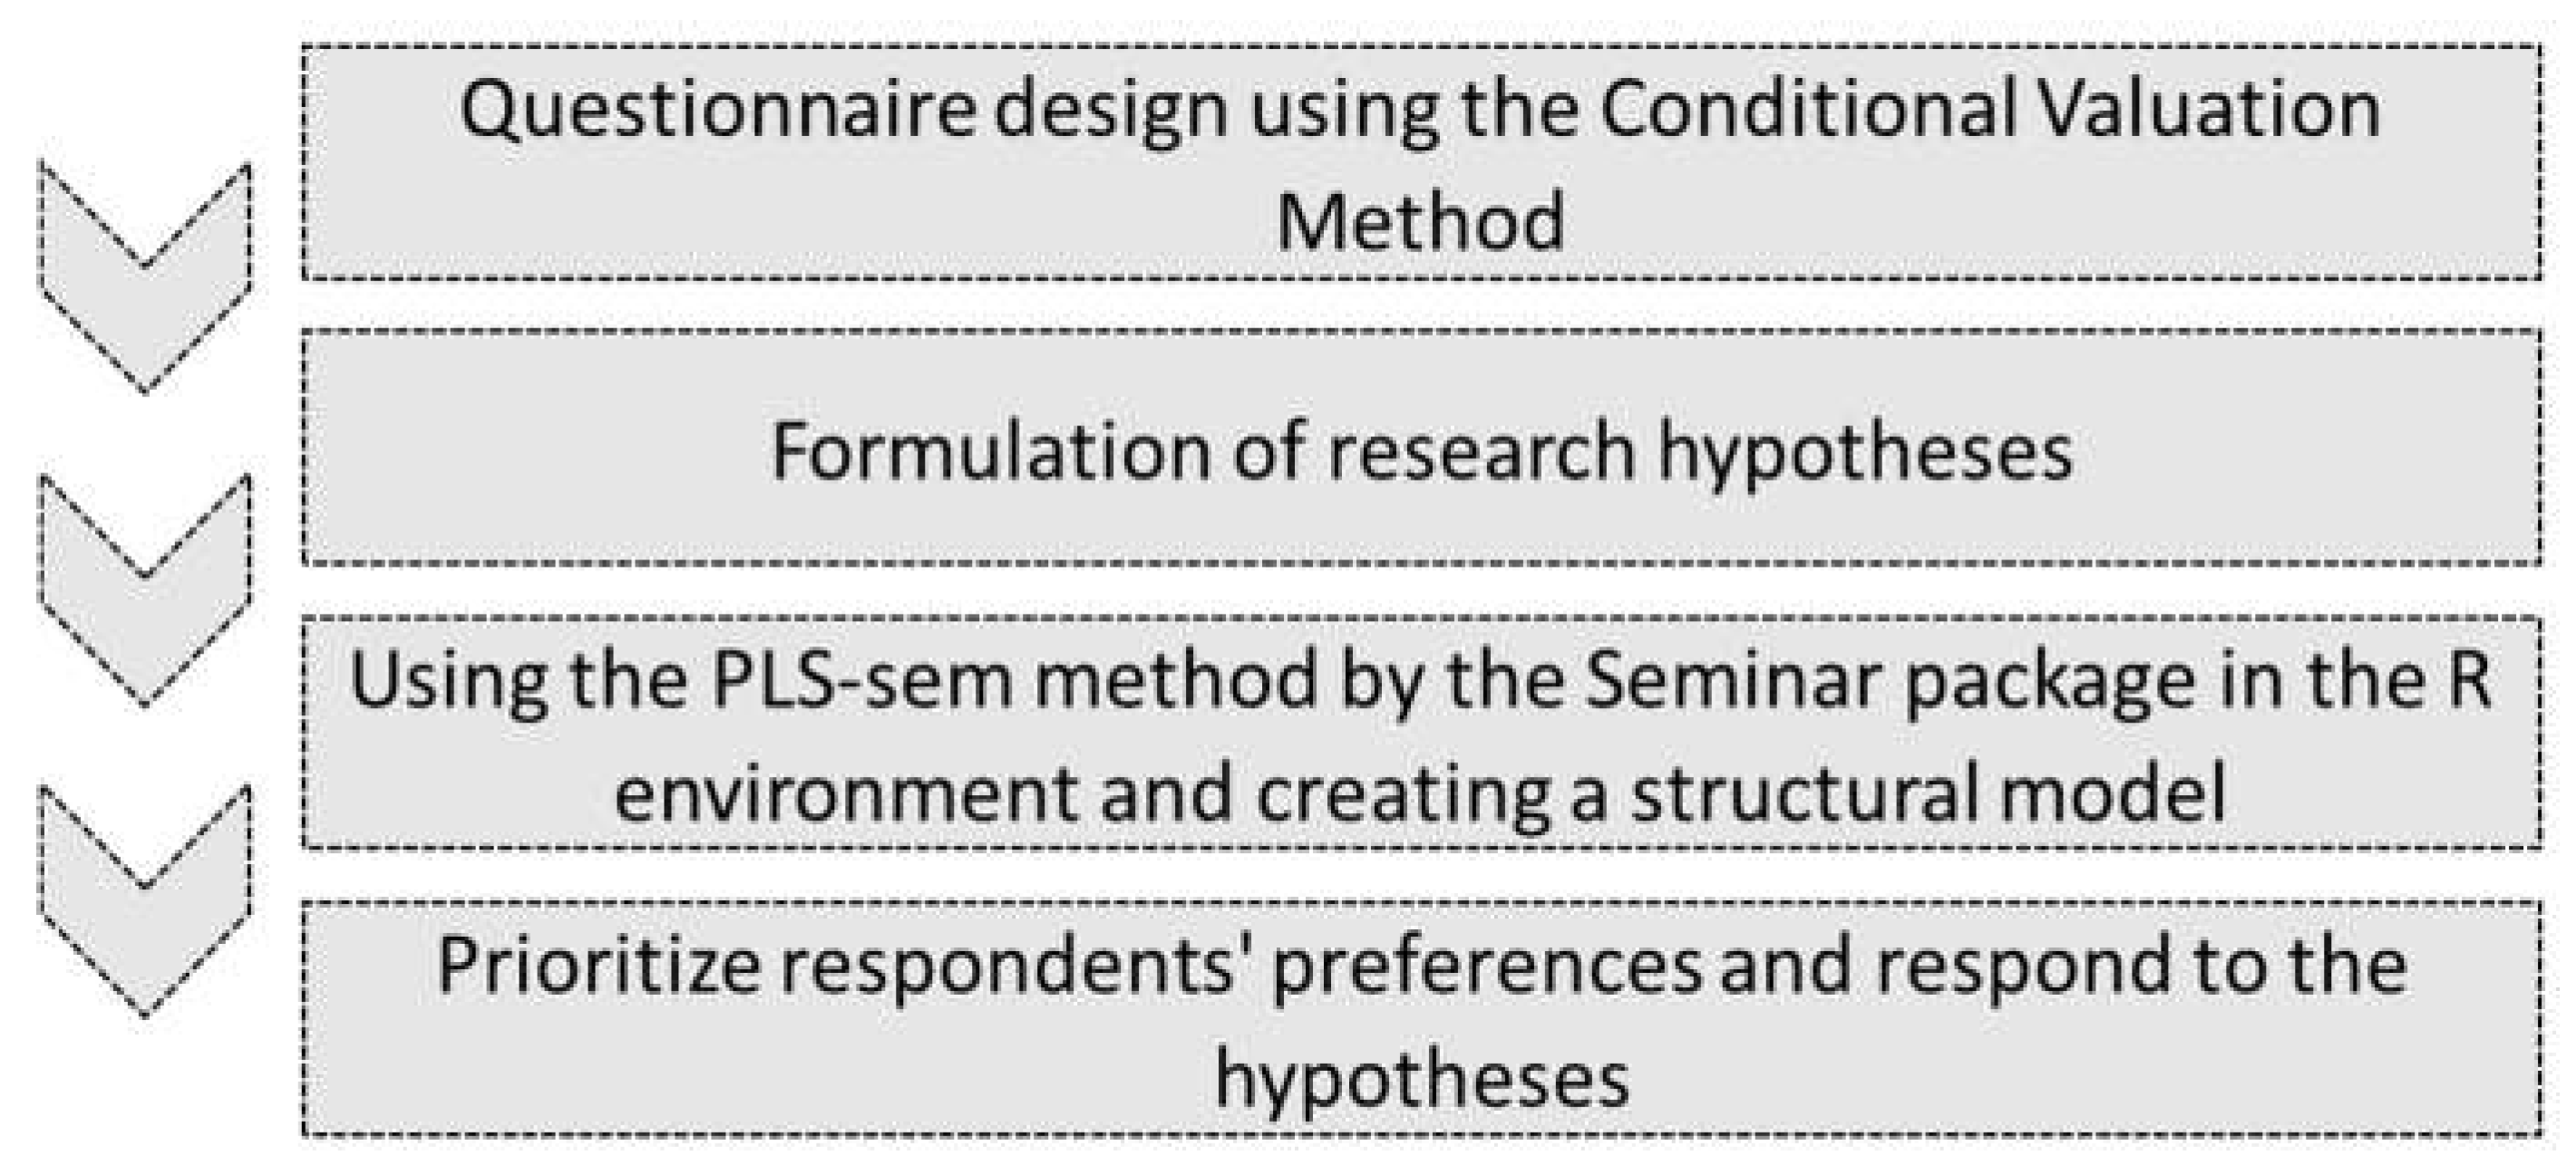
Figure 2 shows the research process.
To examine the relationship between walkability and people’s willingness to pay, the concept of walkability has been discussed in four dimensions: social, spatial, accessibility, and safety, each defined by several variables. In the first step, the structural model’s internal consistency reliability was evaluated using the PLS-SEM method to ensure the accuracy of the variables used in the statistical model.
Table 3 shows the variables of the mentioned dimensions.
5. Results
The questionnaire results show that 54% of the citizens were unwilling to pay extra taxes annually to implement walkability policies in Karaj. A total of 46% of citizens were willing to pay an additional amount as taxes annually. Among these, 27% were willing to pay 150,000 tomans (USD 6), 11% were willing to pay 300,000 tomans (USD 12), and 8% were willing to pay 405,000 tomans (USD 16) annually.
According to Hair et al. [
54], indicators with less than 0.4 loading, which is the bivariate correlations between a construct and the indicators, should be removed from the model; therefore, the AC5 and CO3 variables, which are the healthcare cost and access to leisure areas, respectively, were removed from the model due to loading of less than 0.4. The loading of all indicators, except for access to shops (AC3), which is close to 0.5, is above 0.7 or closer to this value. Because removing this variable did not increase the internal validity of the model, this variable was not removed from the model.
There are three measurements to evaluate the reliability of the structure, namely, the amount of composite reliability index (CR) and the amount of average variance extracted (AVE), and Cronbach’s alpha [
54] that were calculated. Given that the CR and Cronbach’s alpha index for all variables is above 0.6 and the AVE value is above 0.5, the reliability of the structure is acceptable. According to Hair et al. [
54], since the composite reliability index (CR) in all cases was higher than the extracted variance (AVE), all values of the variance inflation factor were less than three, indicating multiple correlations between variables will not be a problem.
As shown in
Table 4, among the latent variables of spatial dimension, geometric design (SP1) and attractiveness and environmental health (0.872, 0.883) constitute this structure’s most important variable. Regarding social structure, sense of place with a loading of 0.97 is the most important variable, and the eyes on the street (SO1) has the least effect (0.23) on the observed variable of social. Access to a job (AC1) and public transportation (AC2) had the most impact (0.93 and 0.84) on the observed variable of accessibility, respectively, and access to shops (AC3) had the least (0.77). The most crucial variable of the cost dimension is travel cost (CO1) with a loading of 0.968, while lighting (SA1) and eyes on the street (SA2), with a slight difference (0.89 and 0.84, respectively), strongly affect the structure of the safety dimension.
As shown in
Table 5, the contextual characteristics of the target community are significantly related to only two walkability indicators, so their structure is predicted in the statistical model. The gender of respondents (β: 0.083,
p = 0.0125) and their age (β: 0.075,
p = 0.0440) as a control variable affect the structure of the safety dimension, while car ownership (β: 0.052,
p = 0.0710) and cost (β: 0.133,
p = 0.0038) affect the structure of the access dimension.
As shown in
Table 6, the coefficient of determination for the WTP in the PLS-SEM model is 0.13, higher than the acceptable limit of 0.1. Therefore, the model prediction percentage is acceptable [
55]. Although this value is relatively low, in social science-related subjects [
56], lower values of this index are often considered acceptable, especially when human behaviors and tendencies are examined. In this article, the conditional valuation method is used to examine the question related to the WTP. This variable is not calculated like the questions related to the sidewalk dimensions using the Likert scale, which effectively reduces the coefficient of determination.
According to
Table 6, as assumed, safety (β: 0.262,
p < 0.00001), social (β: 0.107,
p = 0.0112), spatial (β: 0.105,
p = 0.0399), and accessibility (β: 0.101,
p = 0.066) predict the WTP in a positive direction. Thus, H6, H7, H8, and H9 were supported. Gender (β: −0.100,
p = 0.0689) and cost (β: −0.099,
p = 0.0755) also predict the WTP in a negative direction. Age (β: −0.001,
p = 0.9920), car ownership (β: 0.044,
p = 0.4141), and household income (β: 0.029,
p = 0.5460) were not significant due to the invalidity of
p-value. Thus, H1, H4, and H5 were supported, while H2 and H3 were rejected. The safety dimension and then the social dimension had the greatest impact on the dependent variable.
6. Discussion and Conclusions
The concept of walkability has become a pervasive concept, especially in developing countries. Due to the background of this concept and differences in the needs and preferences of individuals in different contexts, there are differences between the policies adopted in developed and developing countries. In this article, the PLS-SEM method has been used to investigate the impact of different dimensions of walkability on the willingness of citizens to pay for the implementation of walkability policies on different scales from an unwillingness to pay to implementation in every neighborhood in Iran.
The results of this article show that the needs, preferences, and priorities of citizens in Iran regarding the willingness to implement walkability policies are different from other countries. Therefore, urban planners and decision-makers should use different priorities than other developed and developing countries. This study showed that the most important factors affecting people’s willingness to pay are safety, social, and spatial in the first place, and at the next level, with less intensity, are access, gender, and cost. However, according to studies in other developing countries, such as Poland, the most important factor in people’s willingness to walk has been neighborhood access to services and, after that, safety [
41]. Spatial and safety factors are addressed as first priorities in other studies on developing countries [
16,
18,
33,
39]. This study’s results support the findings obtained by other studies in developing countries as they addressed access as the other factor that is considered as first or second priority [
39,
41]. These findings also support those obtained in research on developed countries; however, the indicators of each factor vary in different countries. Examples of spatial factors in developed countries, including linkage with other modes [
29,
38], connectivity [
29], and access, mostly means access to different modes of transport as well as facilities, while for developing countries it is limited to the quality of the sidewalks [
16,
18,
39] and access to public transport and facilities [
33,
39]. The social factor was not mentioned as an important factor in findings obtained by other studies on developing countries, while it was in research on developed countries; although its priority was not as high as it is in this paper. The demographic factor of age affected people’s intention for walkability in some developed and developing countries [
6,
35], but our findings do not support it. According to the results, income level seems not to have an important effect on people’s willingness to pay. This result supports the findings obtained by studies on other developing countries [
40].
City administrators in Iran should pay sufficient attention to the cultural and socioeconomic aspects of the residents in order to develop and implement walkability projects. The results of this study indicate that women are less likely to choose walking. Likewise, the gender latent variable is effective in the observed safety variable. Consequently, additional emphasis should be placed on ensuring the protection of vulnerable populations, such as women.
In addition, the data revealed an apparent distinction between the priorities of Iranian and non-Iranian citizens. Due to the cultural, social, and political aspects of Iranian culture, the sense of place and the opportunity for social interaction have a considerable influence on people’s willingness to pay for the success of policies that promote walkability. These include the nostalgic tendency in Iranian culture, as well as some societal limitations. On the other hand, the low willingness to pay can be ascribed to the structure of Iran’s large cities and the lack of transparency in how taxes are being spent. In terms of spatial factors, it can be said that, since the initial designs of cities such as Karaj and Tehran were inspired by the American and car-based models, the lifestyle of citizens has been formed based on cars. In the present study, the role of the spatial dimension in raising people’s willingness to walk supports the contention that spatial qualities of Iranian cities should be evaluated in order to increase people’s willingness to walk. Furthermore, raising the level of transparency in the urban cost management system can increase citizens’ willingness to pay for the implementation of walkable policies.
In this research, the focus was on public policies regarding walkability using tax resources in Karaj city. Therefore, future studies need to be conducted in other cities, such as Tehran (the capital of Iran), to make a comprehensive comparison possible. In addition, other methods, which were assessed in previous research, such as private sector investment to improve walkability and active transport [
33], and evaluating the possibility of implementing new methods, such as P&R parking, bike-sharing system, and E-Scooters [
7,
8,
57], should be investigated for Iran.
It should also be noted that in Iran, economic topics, such as increases in tax, are considered political and controversial. Therefore, it was difficult to receive an unbiased opinion and perception of people, and the scenarios provided in the questionnaire needed to be written very clearly with additional explanation. The lack of information to support the background was another limitation that this study faced.

 ,
, 

