
Early Wildfire Detection Technologies in Practice—A Review

Computer Engineering Program, California State University, Fullerton, CA 92831, USA
*
Author to whom correspondence should be addressed.
Sustainability 2022, 14(19), 12270; https://0-doi-org.brum.beds.ac.uk/10.3390/su141912270
Submission received: 31 July 2022
/
Revised: 15 September 2022
/
Accepted: 16 September 2022
/
Published: 27 September 2022
(This article belongs to the Special Issue Climate Change and Wildfires Risk Assessment)
Abstract
:As fires grow in intensity and frequency each year, so has the resistance from their anthropic victims in the form of firefighting technology and research. Although it is impossible to completely prevent wildfires, the potential devastation can be minimized if fires are detected and precisely geolocated while still in their nascent phases. Furthermore, automated approaches without human involvement are comparatively more efficient, accurate and capable of monitoring extremely remote and vast areas. With this specific intention, many research groups have proposed numerous approaches in the last several years, which can be grouped broadly into these four distinct categories: sensor nodes, unmanned aerial vehicles, camera networks and satellite surveillance. This review paper discusses notable advancements and trends in these categories, with subsequent shortcomings and challenges. We also describe a technical overview of common prototypes and several analysis models used to diagnose a fire from the raw input data. By writing this paper, we hoped to create a synopsis of the current state of technology in this emergent research area and provide a reference for further developments to other interested researchers.
1. Introduction
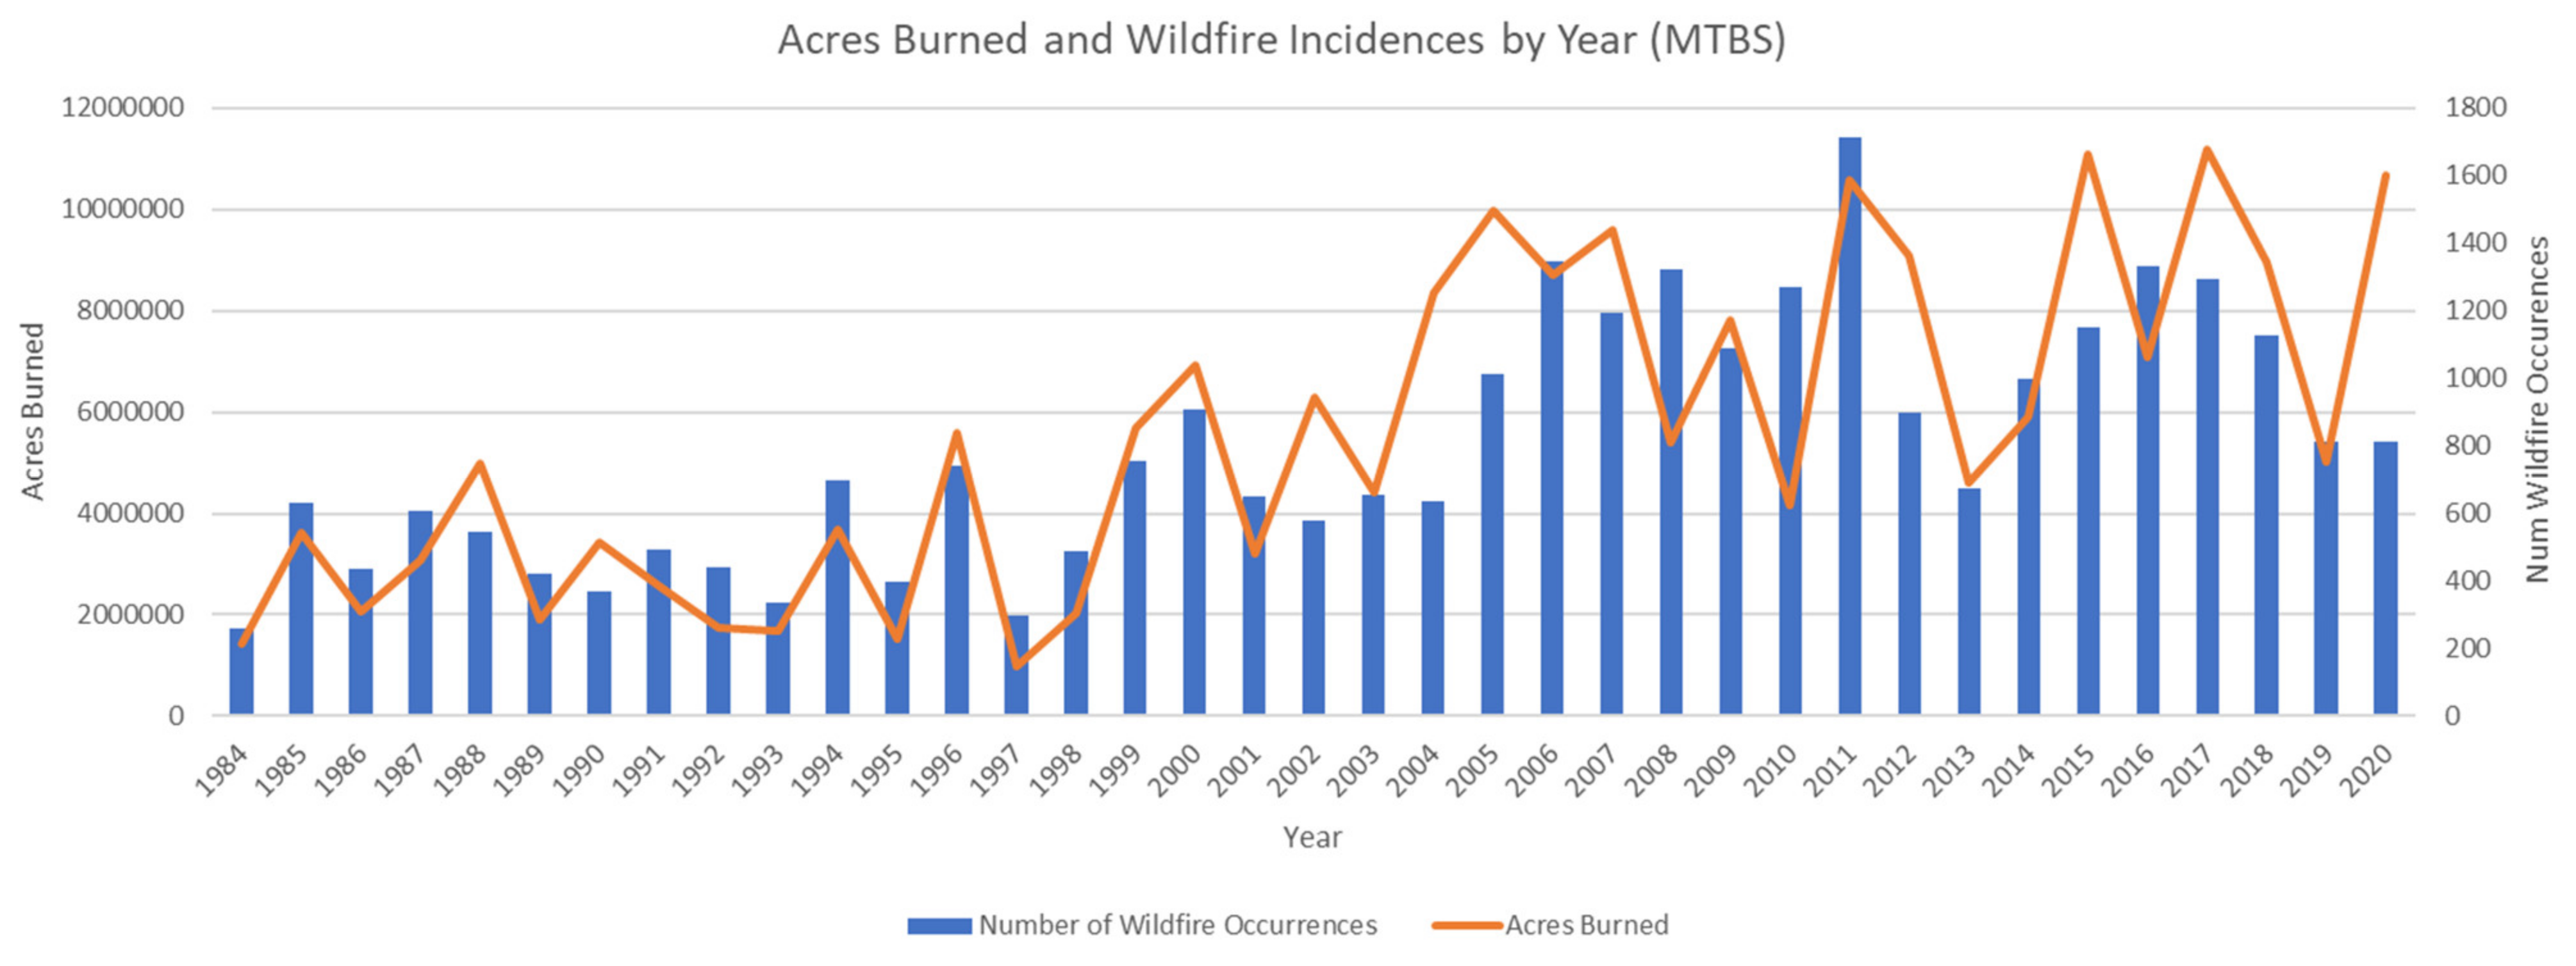
Wildfires are a necessary natural phenomenon and have been a critical part of many ecosystems for years [1]. However, the last decade has witnessed a higher-than-normal frequency and magnitude of wildfires affecting thousands of people in various continents (Figure 1). Besides causing damage to life and property, wildfires negatively impact the climate and air quality of the surrounding region. The European Space Agency estimates that approximately four million square kilometers of land are affected globally due to wildfires [2]. In the US, the National Interagency Fire Center reports 50 major wildfire events in 2022 recorded between January 1 and June 29—a number that surpasses the 10-year average—with about 192,016 acres burnt [3].
In the Northern Hemisphere, the fire season was typically marked as July to September. However, due to shifting climate patterns and expanding drought areas, the fire season has lengthened by several months in many countries. CalFire reports that the fire season in the Sierras in California has increased by 75 days each year [4]. Furthermore, 75% of the deadliest wildfires in the state have occurred since 2000 [5]. A scaled extrapolation for similar impacts on other states and countries places wildfires as one of the most urgent climate crises of this century.
The global impacts of wildfires are discussed in the following four categories.
1.1. Environmental Impact
Although pyrodiversity is essential for maintaining biodiversity and biome distribution, the balance is delicate and dependent on the intensity, size and season of the wildfire [6]. The recent trends in climate changes and severity of wildfires have tipped the scales negatively against the sustenance of floral and faunal diversity. Studies have documented the adverse effects of wildfires on critically endangered species like Bornean orangutans in Indonesia [7] and Palethorpe’s pinwheel snails, koalas and native vegetation groups in Australia [8,9], among countless other species that have been pushed to the brink of extinction by such fire events. Additionally, wildfires release copious amounts of greenhouse gases, contributing to global warming and drought conditions that trigger new fires—a never-ending positive feedback loop. To put the wildfire emission into perspective, the California Air Resources Board estimated that the state’s 2020 wildfires emitted about 112 million metric tons of carbon dioxide, the highest recorded in the past decade [10]. This number is about three times higher than the second-highest emission value recorded in 2008 and is equivalent to the amount of greenhouse gases released by all the passenger vehicles in California annually. The European Union’s Copernicus Atmosphere Monitoring Service estimated that 1.76 billion tons of carbon were generated by wildfires globally in 2021, with the emissions projected to increase significantly in the future.
1.2. Health Impact
The destructive nature of fires may cause immediate bodily harm, but its emissions, some largely unseen, also bring danger to those outside of the surrounding area. For example, Oregon’s Bootleg Fire had its smoke carried over three thousand miles from its origin, bringing health effects to people in distant cities who may not have been aware of the fire. It is a well-established fact that wildfires increase the concentration of particulate matter and harmful gases in the air [11], which are directly linked to various diseases, such as asthma, bronchitis, reduced lung volume, etc. [12,13]. Although the effect on cardiovascular events are mixed, sufficient studies indicate that exposure to fire smoke leads to respiratory morbidity [14]. Emerging research also hints at a possible correlation between exposure to particulate matter and higher neurophysiological irregularities like ADHD, autism, decline in memory, etc., in children [15]. Prenatal exposure to polycyclic aromatic hydrocarbons, one of the constituents of fire, has been associated with childhood obesity [16], while exposure to PM2.5 in the prenatal stage could possibly lead to higher blood pressure in children [17]. Johnston et al., estimate that between 1997 to 2006, the average annual mortality attributed to fire smoke was 339,000, with Southeast Asia and Africa experiencing the maximum brunt of the crisis [18]. Even short exposure to wildfire smoke increases risk of premature death through lasting damages to the respiratory and cardiovascular system.
1.3. Sociological Impact
Disadvantaged, low-income communities, people of color and elderly people face an increased risk to wildfire. They are also disproportionately affected by the aftermath of wildfire events, like smoke-related morbidity and mortality, homelessness, displacement, psychological stress, etc. [19,20]. The 2017 and 2018 wildfires in northern California killed more than a hundred people, displaced thousands more and annihilated an entire city, exacerbating the homelessness crisis in the area [21]. Wildfires also cause power outages [22] and deplete long-term water supplies for the community [23].
1.4. Economic Impact
Firefighting efforts and subsequent rehabilitation are excessively costly, and the costs of mitigating wildfires are increasing exponentially each year. At a total loss of $12.5 billion, California’s 2018 Camp Fire was the most expensive disaster globally in that year. Wildfires incurred similar financial burdens on other countries, with state expenditures increasing by millions of dollars [24]. Along with the immediate property damage and recovery expenses, each fire disrupts the surrounding economy and workforce, causing a ripple effect throughout the communities [25].
There are several ongoing global efforts to mitigate wildfires. As highlighted in Figure 1, the frequency and impact of wildfires have escalated significantly in the past few years, and this has prompted numerous research groups to propose their unique solutions to combat this issue. An ideal wildfire monitoring system should be able to survey a large area (spatial coverage) with reasonable frequency (temporal coverage).
Two popular approaches are predicting the likelihood of a fire in an area and detecting wildfires still in early stages from the associated emission of gases, aerosols, temperature rise, etc. Fires at young stages are simpler to control and mitigate. This paper discusses many such efforts, with their merits and shortcomings. We hope to create a substantial resource for the research community about the state of current technology and motivate advancements needed to further reduce the losses from this disaster.
2. Literature Review
2.1. Review Methods
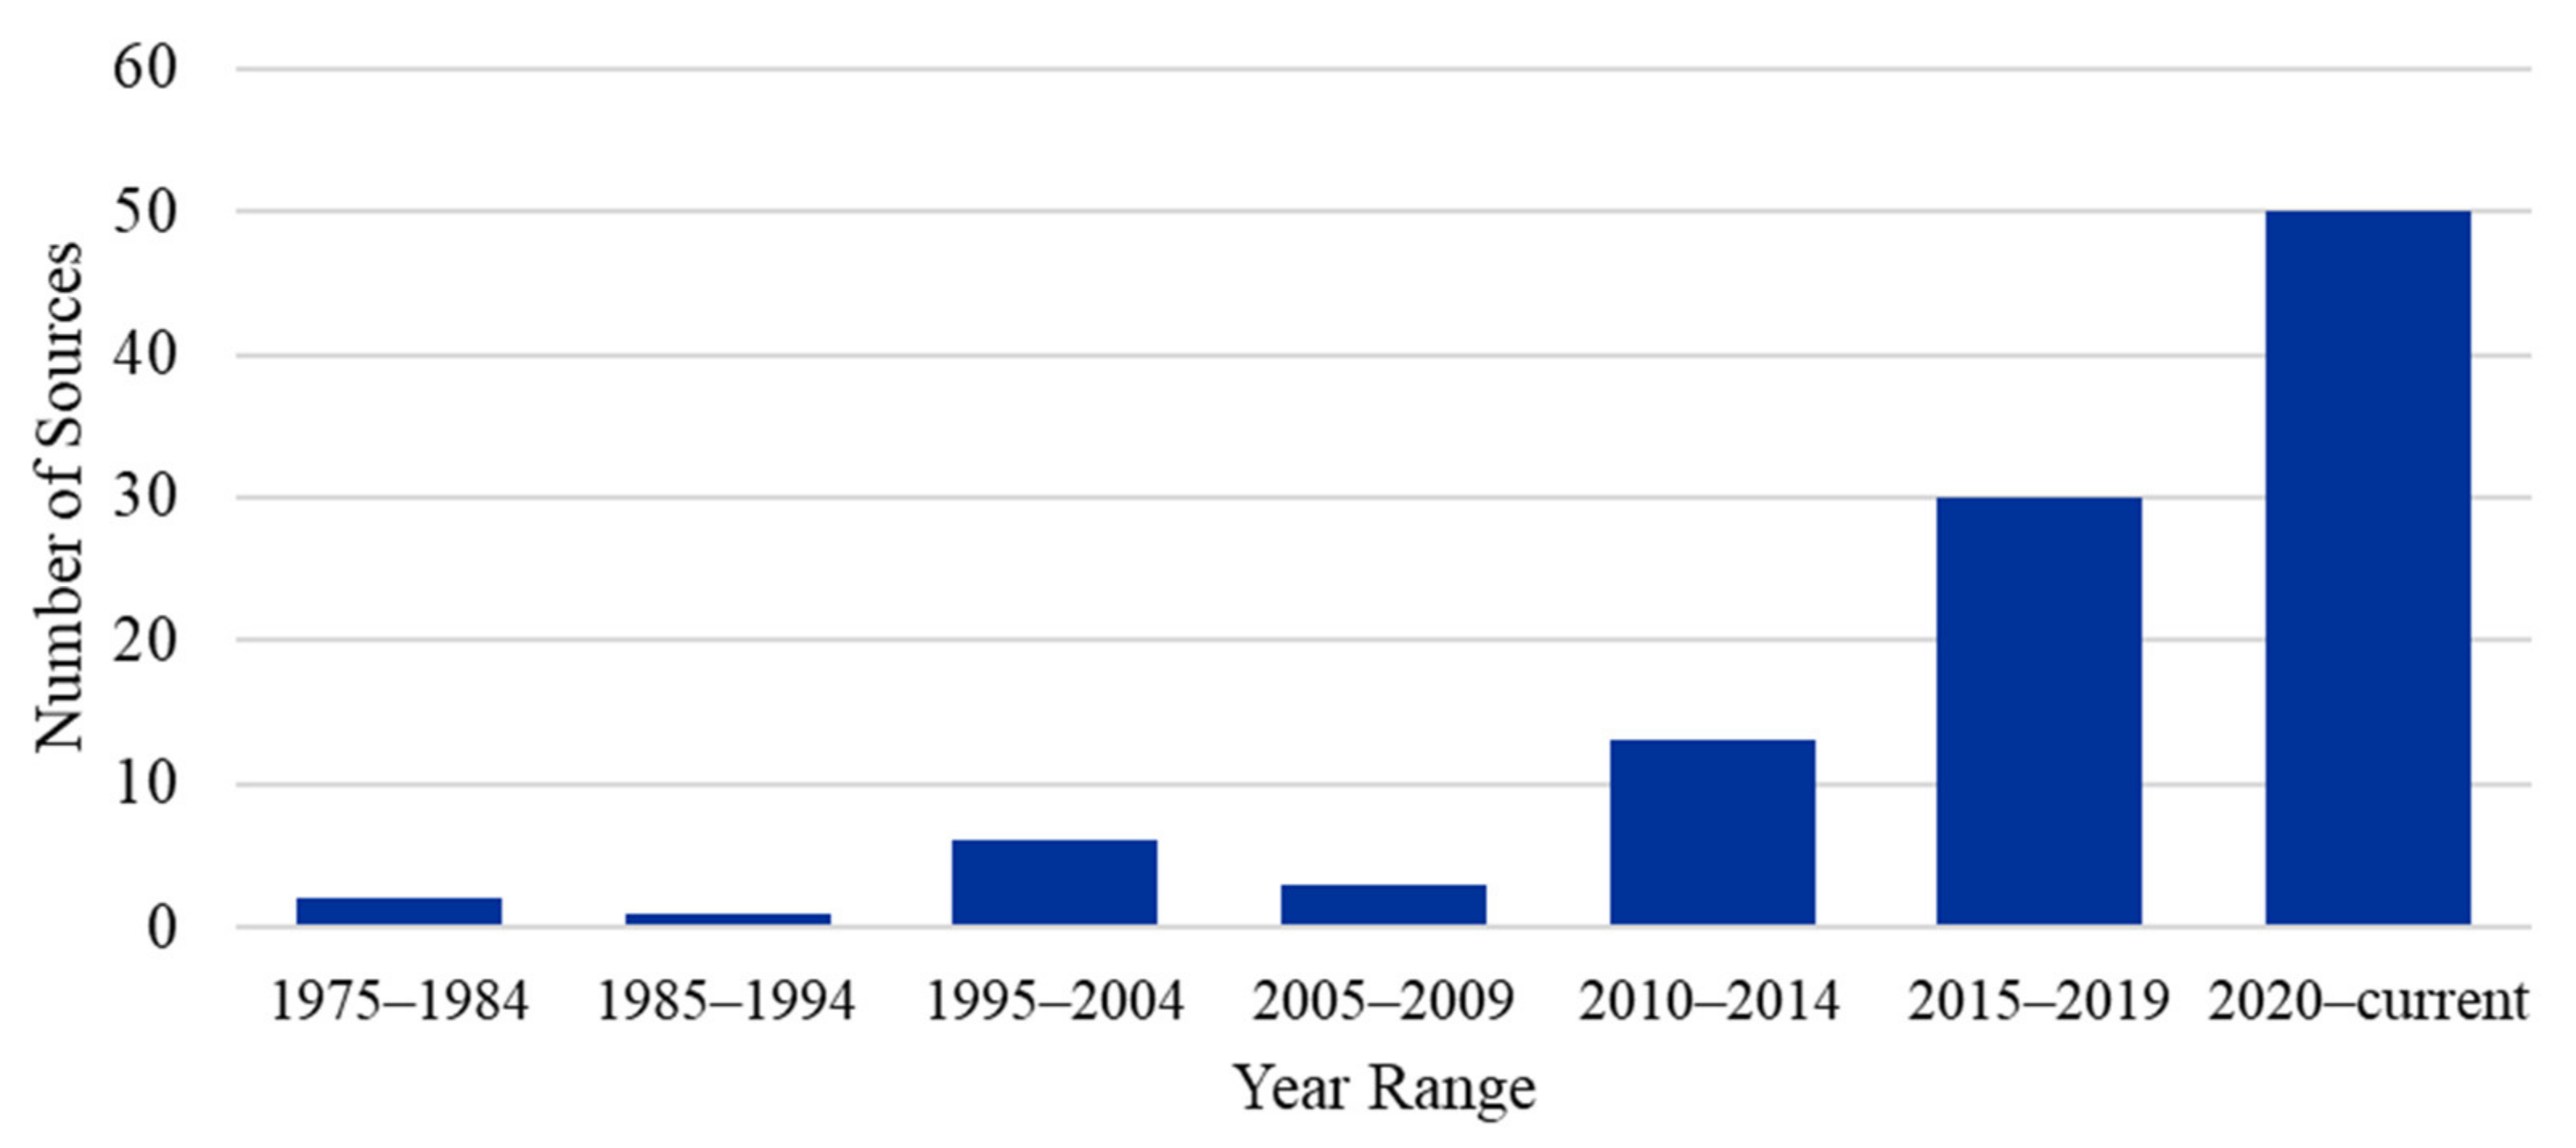
For this review, we chose published conferences and journal articles that are peer reviewed. We have also presented a summary of the pivotal accomplishments in this area of research, including those by companies that have contributed to the wildfire detection technologies focused on in this review. A comprehensive review of all articles published in this area is impossible, but we believe the selection of work in this review is an adequate representation of the fundamental research trends. Figure 2 shows a distribution of the papers and articles we selected for this paper, in 5-year incremental periods. Satellites were one of the first to be utilized for wildfire detection, with a notable surge in other methods observed in the last couple of decades. This pattern correlates with the rising frequency of fires shown in Figure 1.
2.2. Discussion
Many methods have been proposed for wildfire detection in the past. The first organized fire alert networks in the US came in the form of fire lookout towers built in the early 1900s, after the Great Fire of 1910. These towers were built on top of high mountains and staffed by “fire spotters”. The spotters would inspect the surroundings for signs of fire and communicated using heliographs. As better technologies were made available, fire towers were retired from service by the end of the 20th century. In this paper, we focus on the advanced mechanisms currently utilized for early wildfire detection, which can be broadly classified into the following main groups: Section 2.2.1. Sensor Nodes; Section 2.2.2. Unmanned Aerial Vehicles (UAV); Section 2.2.3. Camera Networks; Section 2.2.4. Satellite Surveillance.
2.2.1. Sensor Nodes
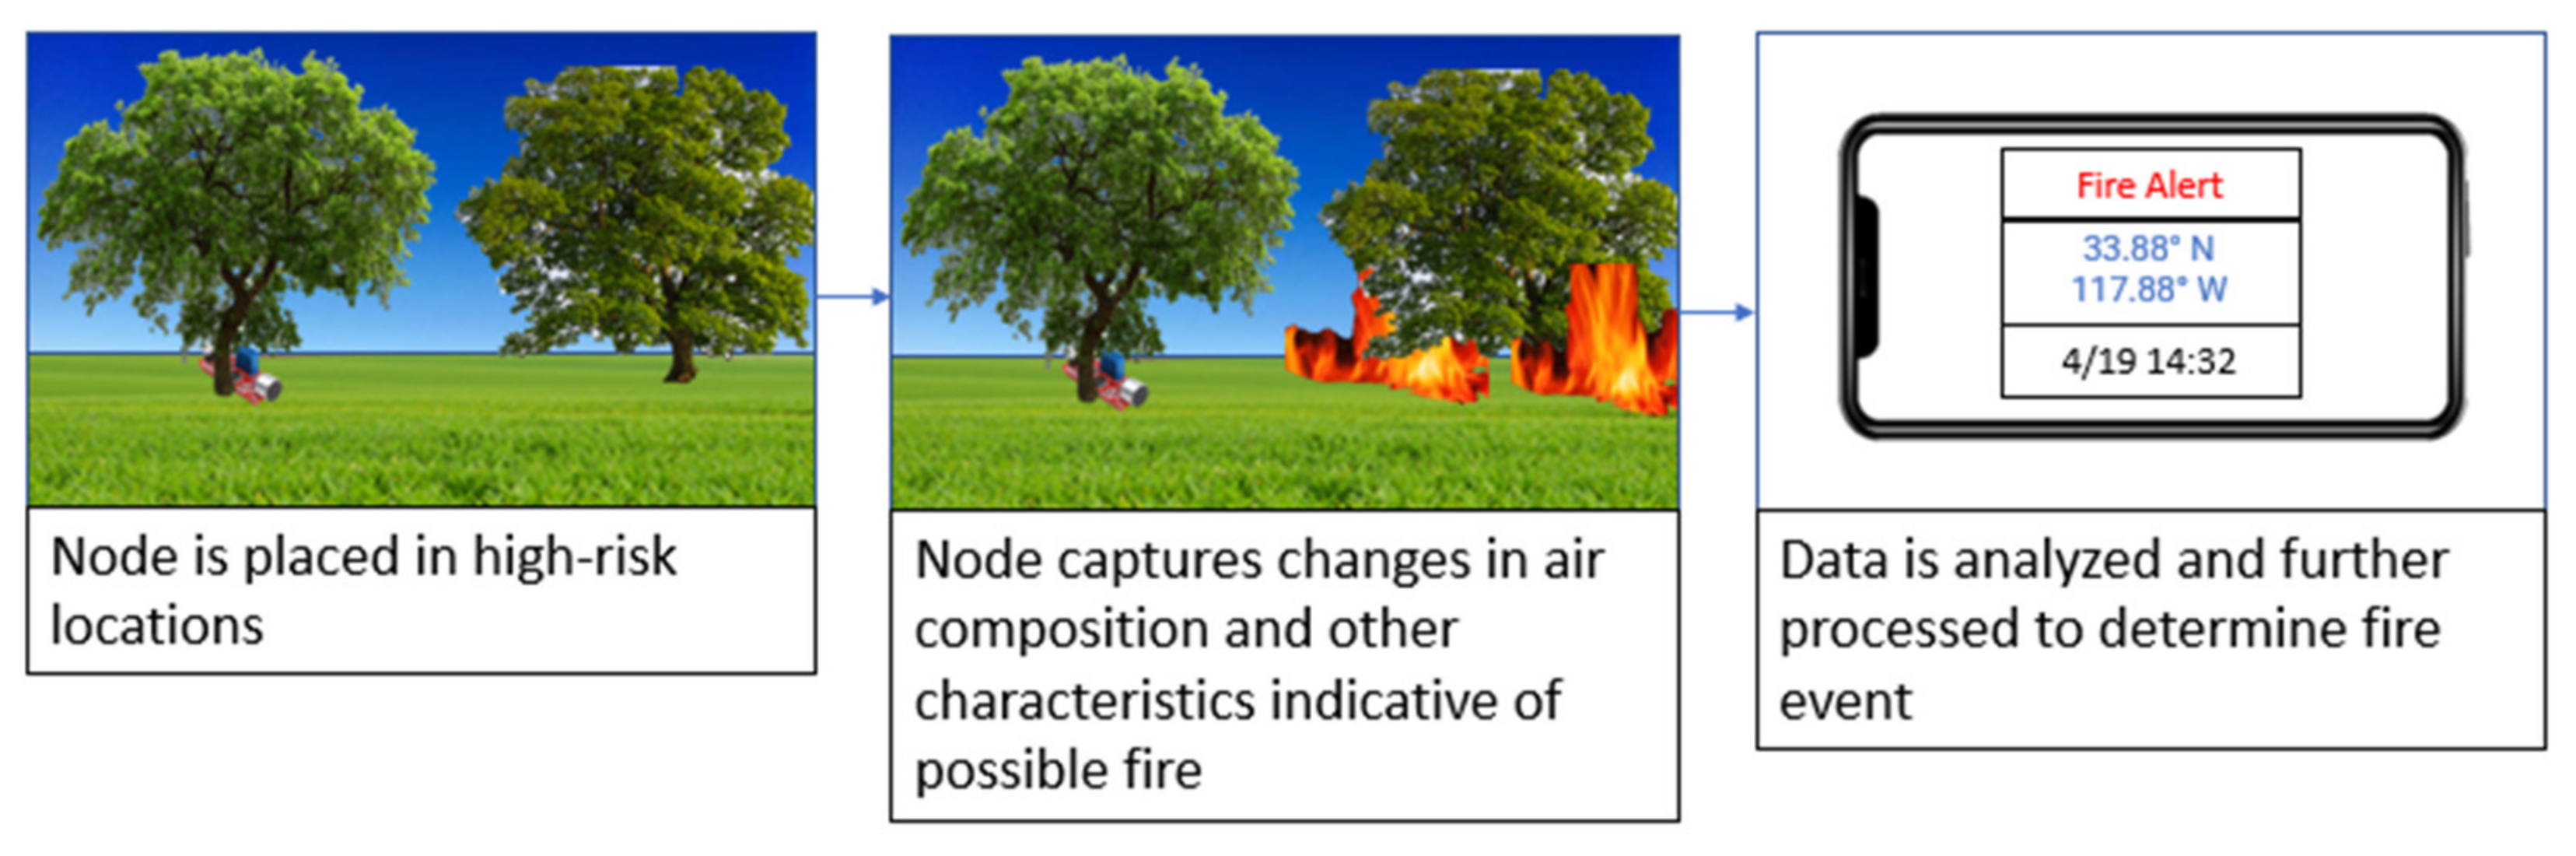
Sensor nodes typically consist of low-power sensors like humidity, temperature and gases to monitor the surrounding area for fire and generate alerts (Figure 3). When multiple sensor nodes are arranged as a network distributed throughout an area of interest and capable of communicating wirelessly, they are referred to as a wireless sensor network (WSN).
In Table 1, we have summarized the salient features and capabilities of several such kinds of nodes designed by different research groups. Each node is operated by a microcontroller, typically powered by solar energy and rechargeable batteries for long-term operability. In the event of a fire, the rate of change in environmental variables is considerably different from their normal daily variation. For example, the daily temperature is characterized by a gradual change within a predictable range, whereas the temperature differential during a fire can quickly surpass several hundred degrees Celsius. Several algorithms have been developed to distinguish between wildfire and non-wildfire conditions from sensor data behavior. Varela et al., proposed a low-complexity algorithm using only temperature and humidity [27]. They created two base functions using regression analysis with temperature and humidity as dependent variables, and time as an independent variable. The base functions were modeled to represent the behavior of the dependent variables in a fire event. The data received from the sensor nodes can then be compared with these base functions to determine the occurrence of an actual fire. Other researchers have also proposed more sophisticated algorithms like cellular automata and machine learning to detect wildfire. Khalid et al., logged flame, smoke, temperature, humidity and light intensity sensors at a central station, and used a Bayesian classifier to categorize fire events from non-fire events with an accuracy of 97.2% [28]. Ammar and Souissi fed temperature, humidity and wind speed to a fuzzy logic controller. In the first step, the data was subjected to trapezoidal and triangular fuzzification functions, then compared to presets to infer estimated fire risk levels as Very Low, Low, Medium, High and Very High for each month [29]. Bolourchi and Uysal used a similar approach with temperature, smoke, light, humidity and distance as inputs to a five-membership function-based fuzzy logic system to determine the probability of fire. They also studied the dependency of fire on each of these inputs as isolated variables [30]. Dampage et al., collected temperature, relative humidity, light intensity and CO level from sensors under different climate conditions and at various times of the day, and then calculated the threshold ratio RTH between current data values and the values recorded 30 s ago. This further strengthened the model with a machine learning algorithm to reduce false alarms. A dataset of 7000 sensor data samples was collected during no-fire and fire conditions to train the algorithm, which was then used to corroborate the presence or absence of fire after threshold analysis [31]. Yan et al., used an artificial neural network (ANN) to identify the phase of combustion in real-time using CO2, air temperature and smoke sensors [32]. Their model considered three combustion phases: no fire, smoldering combustion and flaming combustion, and was able to obtain a consistent accuracy of >82% when multiple sensor input data were considered. Abbassi et al., implemented a multiple-level alert using a combination of KNN classifier and fuzzy logic [33]. In the first level, a cluster of neighboring nodes generates an alert using K-means clustering. The second level adopts a fuzzy inference system to evaluate the scale of fire and its direction of propagation. This two-layer system was demonstrated to be more efficient than simple fuzzy logic systems and generated fewer incorrect alarms.
These sensor nodes can also be used to predict the likelihood of a future wildfire using algorithms such as the 30-30-30 rule of thumb [34] or the fire weather index (FWI), besides the machine learning or regression methods described above. The 30-30-30 rule states that a temperature above 30 °C, humidity less than 30% and wind speed above 30 kmph is indicative of extreme fire risk. The FWI is a more elaborate indexing system that predicts fire behavior from moisture content in the organic matter on the forest floor, availability of combustible fuel, fire intensity and rate of fire spread. The fuel moisture content is categorized into three numeric fuel moisture codes, which are determined from temperature, relative humidity, wind and precipitation readings [35].
To analyze and log sensor data at a central node, numerous wireless transmission methods such as long-range radio (LoRa), Bluetooth, Zigbee, XBee, cellular networks, etc., have been explored. Cellular networks provide higher bandwidth and lower latencies but are power hungry and extremely complicated to setup in remote areas without prior LTE connectivity. Bluetooth range extends to only a few meters; therefore, it is unsuitable for supporting data transmission in vast networks. LoRa and Zigbee have been the most popular choices for communication, as they can be easily used in remote areas without any cellular connectivity or Wi-Fi. Both are capable of transmitting data over longer ranges compared to Bluetooth, with LoRa surpassing Zigbee’s typical transmission range for two devices connected directly. LoRa network architectures are arranged in a star pattern, with a gateway node at the center that must be in line of sight of the sensor nodes to exchange data. In contrast, Zigbee networks that are set up in a mesh pattern can bypass the need for line of sight, as intermediary sensor nodes with Zigbee can be used for relaying data. The Zigbee network can also be set up to be self-healing and re-route the data pathway through healthy nodes if any node in the normal pathway is damaged. Although Zigbee has higher bandwidth than LoRa, LoRa is more suited for outdoor low-power IoT applications that also require longer communication range with fewer nodes and simple encryption methods at a lower cost. Researchers have also proposed direct communication of sensor nodes with geostationary and low orbit satellite networks using a novel collaborative beamforming (CB) technique [36]. In CB, neighboring nodes form a virtual antenna array and transmit the shared data synchronously. Doing so increases the transmission range significantly without the need of a signal booster or gateway, while still operating under low power consumption restrictions on the sensor nodes. In a hybrid approach, unmanned aerial vehicles (UAVs) sweep over the sensor node networks to facilitate data collection from sensor nodes, feasibly solving the transmission issues faced by WSNs spread over large areas, data latency or interruption due to damaged nodes. Such methods have been thoroughly reviewed by Nguyen et al. [37].
- Advantages:
Among the four technologies considered in this paper, sensor nodes are the simplest and least expensive to design and implement. The resources required to build such a node are widely available and supported by an extensive collection of open-source codes, drivers, libraries, etc. These factors allow for a high degree of personalization and customization, hence attracting relatively more users from diverse backgrounds and promoting discoveries. Sensor nodes also consume significantly lesser amount of energy, compared to their counterparts, for the same surveillance duration, therefore decreasing the demands on design complexity for power supply and storage solutions. A well-planned sensor node network can easily achieve the finest spatial coverage and temporal frequency for monitoring an area for wildfires. In the last few years, this category has received the most attention, with many large-scale projects funded by governments. For example, in 2021 USA’s Department of Homeland Security (DHS) Science and Technology directorate collaborated with four industry partners—Ai4 Technologies (San Francisco, CA, USA), Breeze Technologies (Hamburg, Germany), N5 Technologies (Rockville, MD, USA) and Valor Fire Safety of Londonderry (Londonderry, NH, USA)—to find innovative solutions for early wildfire detection [38].
- Challenges:
Despite its advantages, a sensor node network faces the crippling challenge of needing human power or elaborate methods like autonomous helicopters for initial deployment. This challenge can quickly devolve into an insurmountable hurdle when the target terrain is remote, vast and hostile. However, once deployed, sensor nodes can function independently for several years. The obvious physical proximity of the nodes to fires presents another hurdle. Some nodes are likely to be damaged in the intense heat generated by fires. Retrieving and replacing these non-functional nodes are additional maintenance issues that will need to be accounted for during planning and resource allocation. Additionally, many wilderness zones are protected by laws or ordinances against introduction of unnatural/non-native objects, which can complicate the installation of these nodes.

Table 1.
Summary of sensor nodes designed for early wildfire detection.
| Name of Prototype/Reference | Location | Sensor Types | Range | Communication Type | Processing | Power Source | Year |
|---|---|---|---|---|---|---|---|
| FireWxNet [39] | USA | Temperature, relative humidity, wind speed and direction | 138–393 m | 900–930 MHz radio | ATmega128 | Solar (two panel, 24 V and 12 V) and four batteries (12 V) | 2006 |
| Bayo et al. [40] | Spain | Temperature (NTC), relative humidity (H25K5A, SHT11), pressure (MS5540B), soil moisture (Decagon EC5), light intensity (S8265) | 100 m (comm) | XBee/LR-WPAN | ATmega1281 | Two AA batteries | 2010 |
| Firoxio [41] | Lebanon | Relative humidity and temperature (SHT10), smoke, carbon monoxide (MQ-5) | Unknown | Zigbee | PIC16F877A | Solar (17.26 V), 700 mAh lithium-ion battery | 2014 |
| Yan et al. [32] | China | Relative humidity and temperature (SHT11), smoke (MS5100), carbon monoxide (EC805-CO), carbon dioxide (S-100) | 20 m | Zigbee | 8051 (included in CC2430) | Solar (12 V 7 W) | 2016 |
| Molina-Pico et al. [42] | Spain | Relative humidity and temperature (SHT75), gas (carbon monoxide, carbon dioxide) | 25 m (SN), 1.6 km (CN) | 433 MHz ISM between SN and GW, 868–870 MHz and GSM/GPRS between GW and CN | PIC24FJ256GB110 for CN, MSP430 for SN | 600 mAh Lithium coin battery | 2016 |
| Lutakamale and Kaijage [43] | Tanzania | Temperature (LM35DZ), smoke (MQ-2), relative humidity and temperature (DHT22) | 100–120 m (SN to GW) | Zigbee between SN and GW, GSM/GPS between GW and CN | Arduino Uno | Two 3.7 V rechargeable batteries | 2017 |
| SISVIA Vigilancia y Sequimiento Ambiental [44] | Spain | Waspmote gas board (temperature, humidity, light intensity, carbon monoxide, carbon dioxide) | 70 m | ZigBee | ATmega1281 | Rechargeable AA and solar panel | 2017 |
| Smart Forests [45] | Brazil | Temperature, relative humidity | 100 m | WPAN, Bluetooth Low Energy | N/A | Batteries | 2018 |
| Kadir [46] | Indonesia | Temperature, humidity, smoke, carbon dioxide | Unknown | ZigBee | Unknown | Direct power supply | 2018 |
| LADSensors [47] | Portugal | Temperature, humidity, air pressure, carbon dioxide | 300 m (SN) | LoRa | Unknown | Solar | 2018 |
| Silvanet (Dryad) [48] | Germany | Temperature, humidity, air pressure, gases (hydrogen, carbon monoxide, etc.) (BME 688) | 100 m | LoRaWAN | STM microcontroller | Solar and supercapacitors for energy storage | 2019 |
| Khalid [28] | Turkey | IR flame (760–1100 nm), smoke (MQ-2), light, temperature and humidity (DHT-22) | 250 m | NRF24L01+ (2.4 GHz RF) | ATmega328p | Two Iithium-ion cells (3.7 V) | 2019 |
| Knotifire [49] | Canada | Unknown | Surface fire | Internet | Unknown | Energy harvested from fire | 2020 |
| BurnMonitor [50] | France and US | Humidity, temperature | 50 m | 3G | Unknown | Unknown | 2020 |
| Benzekri et al. [51] | Morocco | Temperature, humidity, air pressure (BME280), particulates (Nova SDS011), carbon dioxide (MH-Z14A-CO2), carbon monoxide (ZE07-CO) | Unknown | LoRa | Lora32u4 (ATmega32u4-based) | Solar, lithium-polymer and lithium-ion batteries | 2020 |
| U. Dampage et al. [31] | Sri Lanka | Temperature, humidity (DHT22), light intensity (LDR), carbon monoxide (MQ9) | 5 m | 2.4–2.5 GHz ISM | Arduino Nano | Solar panel and rechargeable lithium-ion cell | 2022 |
| N5 sensors [52] | USA | Proprietary nanowire-based gas sensor array, IR camera, particulate matter detector | Unknown | LoRa | Unknown | Solar panel and rechargeable 30,000 mAh battery | 2022 |
SN: sensor node; GW: gateway, CN: control node.
2.2.2. Unmanned Aerial Vehicles (UAV)
UAVs commonly refer to vehicles or systems that are remotely operated and travel by flight. The data gathered by UAVs are often in real-time, accurate and provide unique vantage points that would otherwise be inaccessible, dangerous or time-consuming to obtain by emergency responders. This is attributed to the mobility of the UAVs, which allows rapid and continuous visual monitoring throughout the fire’s progression and movement. While UAVs may define any unmanned aerial vehicle such as military drones, the majority of them that were first designed for wildfire fighting purposes were comparable to consumer or hobby drones, operating within 1000–4000 feet, as shown in Figure 4 [53]. This range has increased to 30,000 ft as drone technology has commendably progressed in the past years [54]. The data collected commonly take the forms of GPS location, images, video feeds or readings from sensor nodes such as those described in the previous section [55]. These systems may be remotely controlled by humans or automated systems. Automated systems are easily adaptable by users with little to no experience compared to a system that requires human pilots. For example, Fotokite Sigma can follow a programmed flight path set through an application on a mobile device [56]. This is particularly useful for applications such as detecting wildfires, where the autonomy is a necessity to support persistent vigilance. A few years ago, autonomous UAV were limited to low-complexity surveillance tasks but have now been vastly improved by researchers. Chi Yuan et al. discuss a system where fleets of different types of semi-autonomous drones are deployed in stages to search, confirm and observe fires [57]. Although each drone may not handle dynamic and complex tasks such as those with dedicated pilots, the autonomy allows for quick commanding and organization within a fleet regardless of its size. With general usages laid, a UAV system’s main limitation is summarized by its relatively low-capacity power source. This is due to the structural constraints limiting usage of heavy energy-dense batteries. UAVs are usually outfitted with various cameras (videos, IR and imaging) but may contain many other features depending on the designer [55]. For example, some systems are capable of controlling a fleet of UAVs. Others may have additional devices onboard, such as a specialized fire sensor or a tank of water [58]. The IGNIS system by Drone Amplified is an example of an advanced drone that utilizes several of these features [59]. It combats wildfires by initializing backfires through chemical payloads, and can be actively controlled by both remote controller and/or by preset instructions sent by a mobile app.
Several data processing algorithms have been proposed to process the video feed from the UAV and swiftly detect the presence of active wildfires, intensity of the fire and rate of spread. Lin et al., employed a Kalman filter-based approach that uses only the UAV position and temperature recorded at each sampling point to identify a wildfire and predict the fire-spread behavior [60]. The performance of this model with multiple vehicles was observed to be comparable to the results obtained with the FARSITE benchmarks, with less computational cost. Bushnaq et al., proposed a combined UAV–IoT system as a more cost-effective solution than satellite surveillance. In a fire event, the ground-based IoT devices in the vicinity of the wildfire generate alarms to the UAVs nearby, which then verify the fire probability to avoid misdetections [61]. The authors designed an algorithm to optimize the IoT density and number of UAVs to minimize the cost of resources while also maximizing the fire detection probability. Lewicki and Liu designed a Fire Perception Box (FPB) with RGB/IR cameras and an ARM microcontroller that can be installed on UAVs in a plug-and-play manner [62]. At a suspected fire scene, the RGB image is first fed to a convolutional neural network (CNN) classifier to calculate an RGB fire score, followed by the IR image being fed to its corresponding pipeline to calculate an IR fire score. Both scores are combined to establish the presence of fire, and subsequently find the fire localization hotspots and RGB + IR heatmaps. Researchers have also demonstrated a large-scale YOLOv3- and YOLOv5-based deep-learning network for fire identification from images and video feeds captured by UAVs [63,64]. After training the YOLO network on annotated fire images, the researchers were able to obtain high fire detection accuracies in real-time analysis of UAV video feeds. The only disadvantage of this method is that the YOLO model needs to be implemented on a ground-based high-performance computer, therefore the performance of this system is contingent on an uninterrupted data transmission between base station and UAVs. Besides these methods, other deep-learning methods such as recurrent neural networks (RNN), long short-term memory neural network (LSTM), generative adversarial network (GAN), deep belief network (DBN), etc., have also been shown to have good accuracy with identifying wildfires [65,66].
Another active avenue of research is building efficient algorithms for coordinating the communication between multiple UAVs and controlling their flight patterns, with the aim of optimizing coverage of the area within the expected flight endurance period. The methods vary from classic linear controllers such as proportional–integral–derivative (PID), H∞ and linear quadratic regulators to complicated non-linear implementations, such as neural networks, genetic algorithms, etc. [67]. La et al., designed a control framework by incorporating the following multiple objectives into the cost function: deployment of UAVs to the first location of fire detection, avoiding in-flight collision with other UAVs by maintaining a minimum separation distance, maximizing coverage of the wildfire and tracking progression of the fire front [68]. Mawanza et al., discussed a real-time cooperative and adaptive fire monitoring method for multiple UAVs [69]. They trained a radial basis function neural network (RBFNN) to counteract system uncertainties, aerodynamic drag, etc. and a non-singular fast terminal sliding mode control (NFTSMC) function to dynamically track the fire. A similar evolutionary multi-objective algorithm was also formulated for dynamically tracking fire boundary with minimal resources, and the algorithm was able to achieve 100% fire coverage with 15 UAVs in the FARSITE-simulated model [70]. There have been numerous examples of detailed control strategies for quadrotors, but the detailed review of these methods is beyond the scope of this review paper. The reader is encouraged to review the papers by Kim et al. [71] and Kangunde et al. [72] for a study of such techniques.
UAVs have limited flight endurance, as the size of the power source on board is constrained by the payload capacity of the UAV. To extend the flight time of UAVs, solar panels have been carefully integrated into the design. Airbus’ Zephyr and Titan Aerospace’s Solara set the record for longest flight times, with several days of autonomous flight. Both are equipped with solar panels and are intended to be used as high-altitude long-endurance (HALE) UAVs for atmospheric monitoring [54]. HALEs fly at altitudes of about 30,000 feet and cost millions of dollars. In contrast, solar-powered low-altitude low-endurance (LALE) UAVs have been able to achieve maximum flight times of a few days at an altitude of only <10,000 ft, with the record set by ETH Zurich’s AtlantikSolar at 81 h of continuous flight [73]. In theory, the flight time increases proportionally with flight altitude, explaining the stark difference in maximum flight times achieved in HALEs vs LALEs. However, HALEs have expansive wingspans and require a runway, which make them impractical for many applications. Using an ATmega328 microcontroller-based photovoltaic power management system, researchers were able to achieve a continuous surveillance of about 6 h using a swarm of six LALE UAVs [74]. XSun’s SolarXOne claims to be able to fly continuously for 12 h, powered by solar cells [75]. It can support a payload of 5 kg, and provides customizable options including RGB or IR cameras, and other sensors which can be used to detect wildfires. Zhao et al., proposed a thoroughly detailed method for designing a solar-powered, hand-launched UAV considering payload capacity, expected solar irradiance, aerodynamic efficiency considerations at proposed flight altitude and flight control [54]. Using their model, they were able to achieve flight endurance durations of several hours at an altitude of 15,000 ft.
- Advantages:
The biggest advantage of UAVs is flexibility in repositioning, which allows dynamic readjustment of areas surveyed as deemed necessary. UAVs can also be programmed to provide high temporal and spatial resolution over areas determined to be at high risk. Unlike static nodes or camera networks, UAVs’ usage often extends past the initial detection, as they can follow the spreading patterns of fires from a safe distance. Using a limited number of UAVs to scan an area through multiple passes can be more efficient than installing a vast sensor node network. They are less expensive to implement than satellites and may also be more capable of identifying smaller wildfires than the latter technology.
- Challenges:
Most UAVs still need some form of human involvement in and throughout their operation. The major hurdle for this technology is distance and duration of flight. Despite the advancements in assimilating solar panels into the device, the flight times are practically limited to a few days for hand-launched LALEs. Therefore, this technology is likely to be unsuitable when uninterrupted surveillance is needed in wildfire-prone areas. The technology is also relatively new; therefore, the costs of operating and maintaining a UAV fleet can add up exponentially. UAVs are also mired in frequent software and hardware issues that have impeded their adoption as a widespread firefighting solution.
2.2.3. Stationary Camera Networks
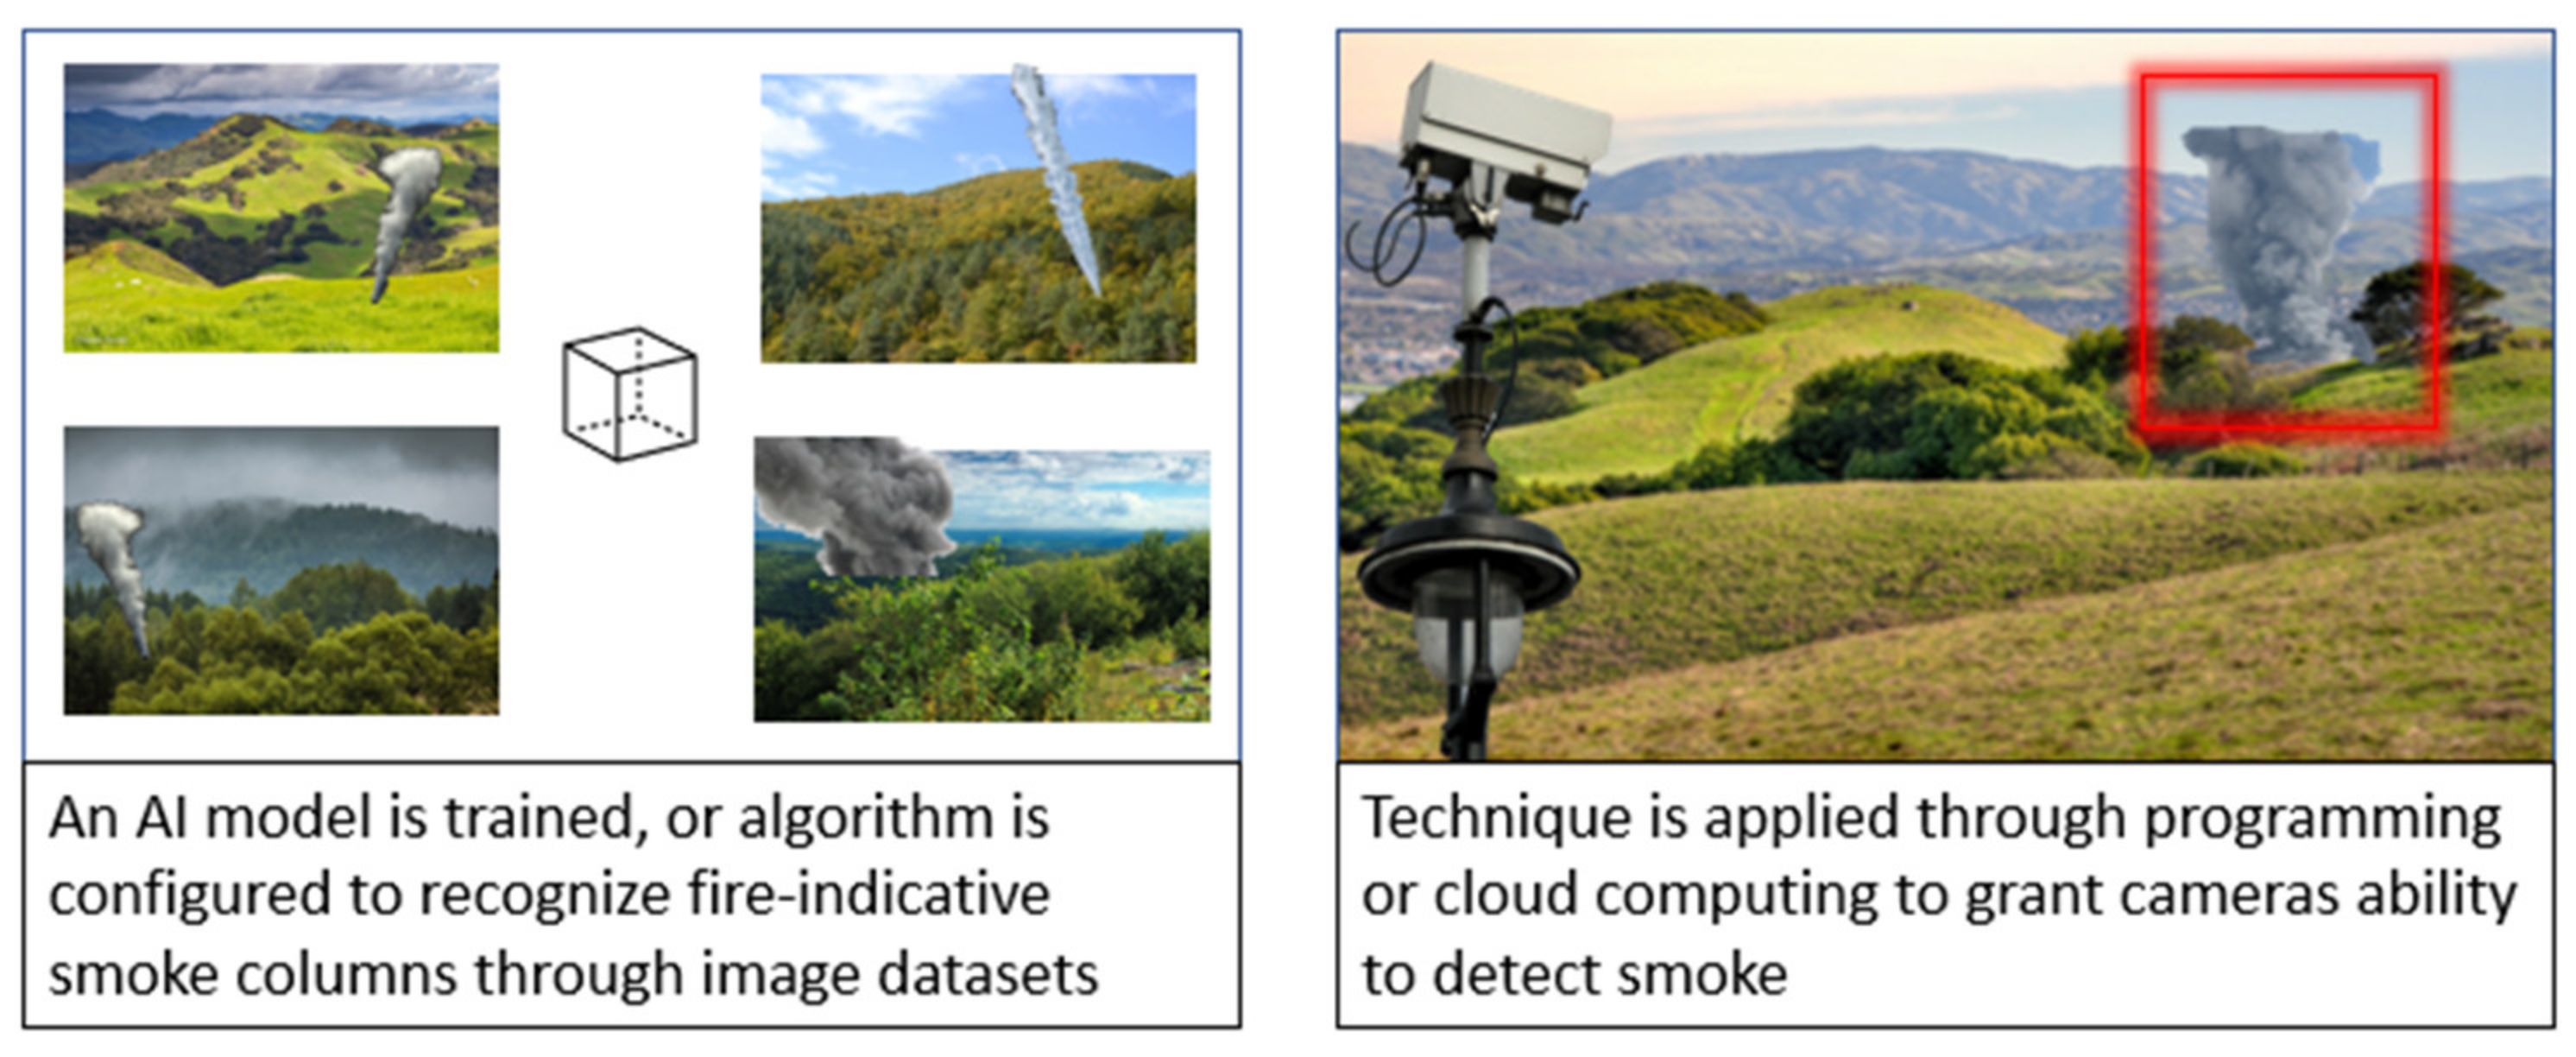
Camera networks consist of advanced and feature-rich, interconnected cameras that monitor a vast area for fires (Figure 5). Early camera networks consisted of live camera images or videos streamed to a control room, where an operator would manually scan the feeds for signs of fire. In modern camera networks, the cameras are still the main drivers of the system, but are often partnered with other systems, such as AI and communication servers, to fully optimize the camera to the desired area. Some may also begin as a single, standalone camera with the option of expansion through additional cameras. They can be stationed both in urban and remote areas and combat fires through early detection and prediction. While stationary, the cameras are usually free to pan in wide or complete 360° angles, significantly increasing coverage zone per camera and limiting blind spots. In addition to video feed, the cameras may also include different types of IR and thermal to enhance detection ability by broadening the features captured. The integration of AI enables them to be autonomous, allowing them to succeed the bulkier, man-powered and more intrusive watch towers [76]. This allows the cameras to not only capture images of the surroundings, but to independently identify if the captures are indicative of a fire. The inclusion of internet access grants the system the ability to communicate, allowing them to broadcast their feeds to a network which directly notifies specified users of notable events. For example, a camera may capture a column of smoke an abnormality that its AI programming classifies as a probable fire. It then relays the information to a central processor, the component that notifies authorities through an app [77]. A widely implemented example of camera networks is ALERTWildfire, a collaborative effort between The University of Nevada (Reno), University of California San Diego and the University of Oregon [78]. Hundreds of ALERTWildfire cameras have been installed in the southwest and west United States and assisted with real-time monitoring of fires. In 2021, Pacific Gas and Electric (PG&E) installed AI-equipped ALERTWildfire cameras in northern and central California, in collaboration with the AI company Alchera [79]. A San Francisco company founded in 2019, Pano AI, also uses AI on HD camera video feeds to automatically detect wildfires and reduce the response time to fire events [80]. IQ-Firewatch, a Portuguese company, employs AI as well, but also provides customization and scalability to serve a variety of settings [81]. Their cameras, commercially sold, are optionally attached with sensors like monochrome, RGB, near-IR, or thermal IR and can smoothly work with cameras added in the future. Its method of wildfire prevention revolves around capturing high-quality raw images with cameras and processing them in real-time using smoke detecting algorithms [81]. Detecting fires at the earliest signs of smoke may be sufficient in many cases, but IQ-Firewatch and similar systems directly compete with ground level technologies such as sensor nodes, which may detect fires even before they emit visible amounts of smoke due to their sensors and proximity to the fire [82]. Furthermore, while camera systems are not directly constrained by the need to conserve power, they are tethered to the nearest power source, requiring users to consider optimal placements. By the same token, they benefit from stable power, eliminating problems with power sources such as batteries, allowing them to utilize more power-intensive tasks such as real-time data processing.
Although each designer’s techniques are trade secrets and often undisclosed, popular methods often involve smoke detection and machine learning, including the usual feature extraction from raw captures and applying various classifiers. Jie Shi et al., have reviewed such algorithms and listed their common extracted features: color, motion, texture, shape and energy [76]. Each provides unique attributes of a smoke image that enhances the classification process. The next steps involve choosing classifiers, which can be of many typical sorts such as: k-nearest-neighbor, neural networks, support vector machines, etc. [76]. The models programmed in the cameras are trained and tested before deployment. The decoupling of the capturing and processing provides the advantage of continuous improvement and integration as researchers can update the models and analyze past performance without having to alter any of the physical components or interrupt its ongoing operation. For example, by basing their project on cloud computation [83], Darko Stipaničev et al., have continued to release improvements to their iForestFire semi-automatic monitoring system after its commercial deployment and operations in various regions.
Many techniques have successfully utilized smoke detection in early wildfire detection prototypes; yet, researchers continue to refine and improve the process. A common weakness in smoke detection and image-based detection is deterioration of image quality at night and by the presence of haze. Haze is defined as an “an obscurity occurring due to smoke, dust, or other particles suspended in the atmosphere” [83]. This causes images and colors to become fuzzy or blurry, decreasing contrast between elements of the image and therefore increasing the difficulty of identifying smoke. Some examples of haze are fog and air pollution. To address this, Darko Stipaničev et al., utilized a de-hazing technique known as “dark channel prior”. It reconstructs haze-reduced images with equations generated, with the knowledge that (1) most haze-free non-sky patches of an image have low or zero intensity in at least one color channel, and (2), that the intensity of these patches is increased by the presence of haze [84]. Like haze, the lack of light significantly diminishes the usability of captures taken at night. Inadequate lighting prevents distinguishing of colors and behaves like noise, often causing fire misclassification with other light sources such as car lights or lanterns. To combat this, Ahmet Agirman et al., extract smoke temporal features and motion in addition to spatial features, considering factors such as flickering and flaring [85]. With the extra information, their process uses two machine-learning stages: the GoogLeNet CNN first extracts spatial features to then pass onto a bidirectional long short-term memory network (BLSTM), which learns the temporal relationships in the data [85]. The models’ decisions are then congregated and ultimately decided through majority voting [85].
- Advantages:
Camera networks are largely autonomous and positioned farther away from the site of potential fires, unlike sensor networks and some UAVs. Therefore, there are little opportunities for them to receive any sort of damage from fires. Although considerations still need to be taken in the camera’s placement, it is simplified by the longer range and more straightforward operation when compared to sensor nodes, whose low coverage and various short-range sensors necessitate more planning.
- Challenges:
The relatively large coverage of a stationary camera partially alleviates, but does not eliminate, the constraint of a required continuous power source, as video feeds or frequent captures are power consuming. Consequently, it may be impossible to use these systems in an extremely remote area. The setup of the camera towers also needs an initial investment of resources and manpower for building the towers, and, therefore, might not be economically feasible in many geographical locations. Due to this positioning of the camera, any sensors considered for inclusion in the camera system may also need to have similar range or function as the cameras, limiting possible additions. For example, it would be ineffective to outfit cameras with temperature or gas sensors, as cameras are designed to be distant from the target area.
2.2.4. Satellite Surveillance
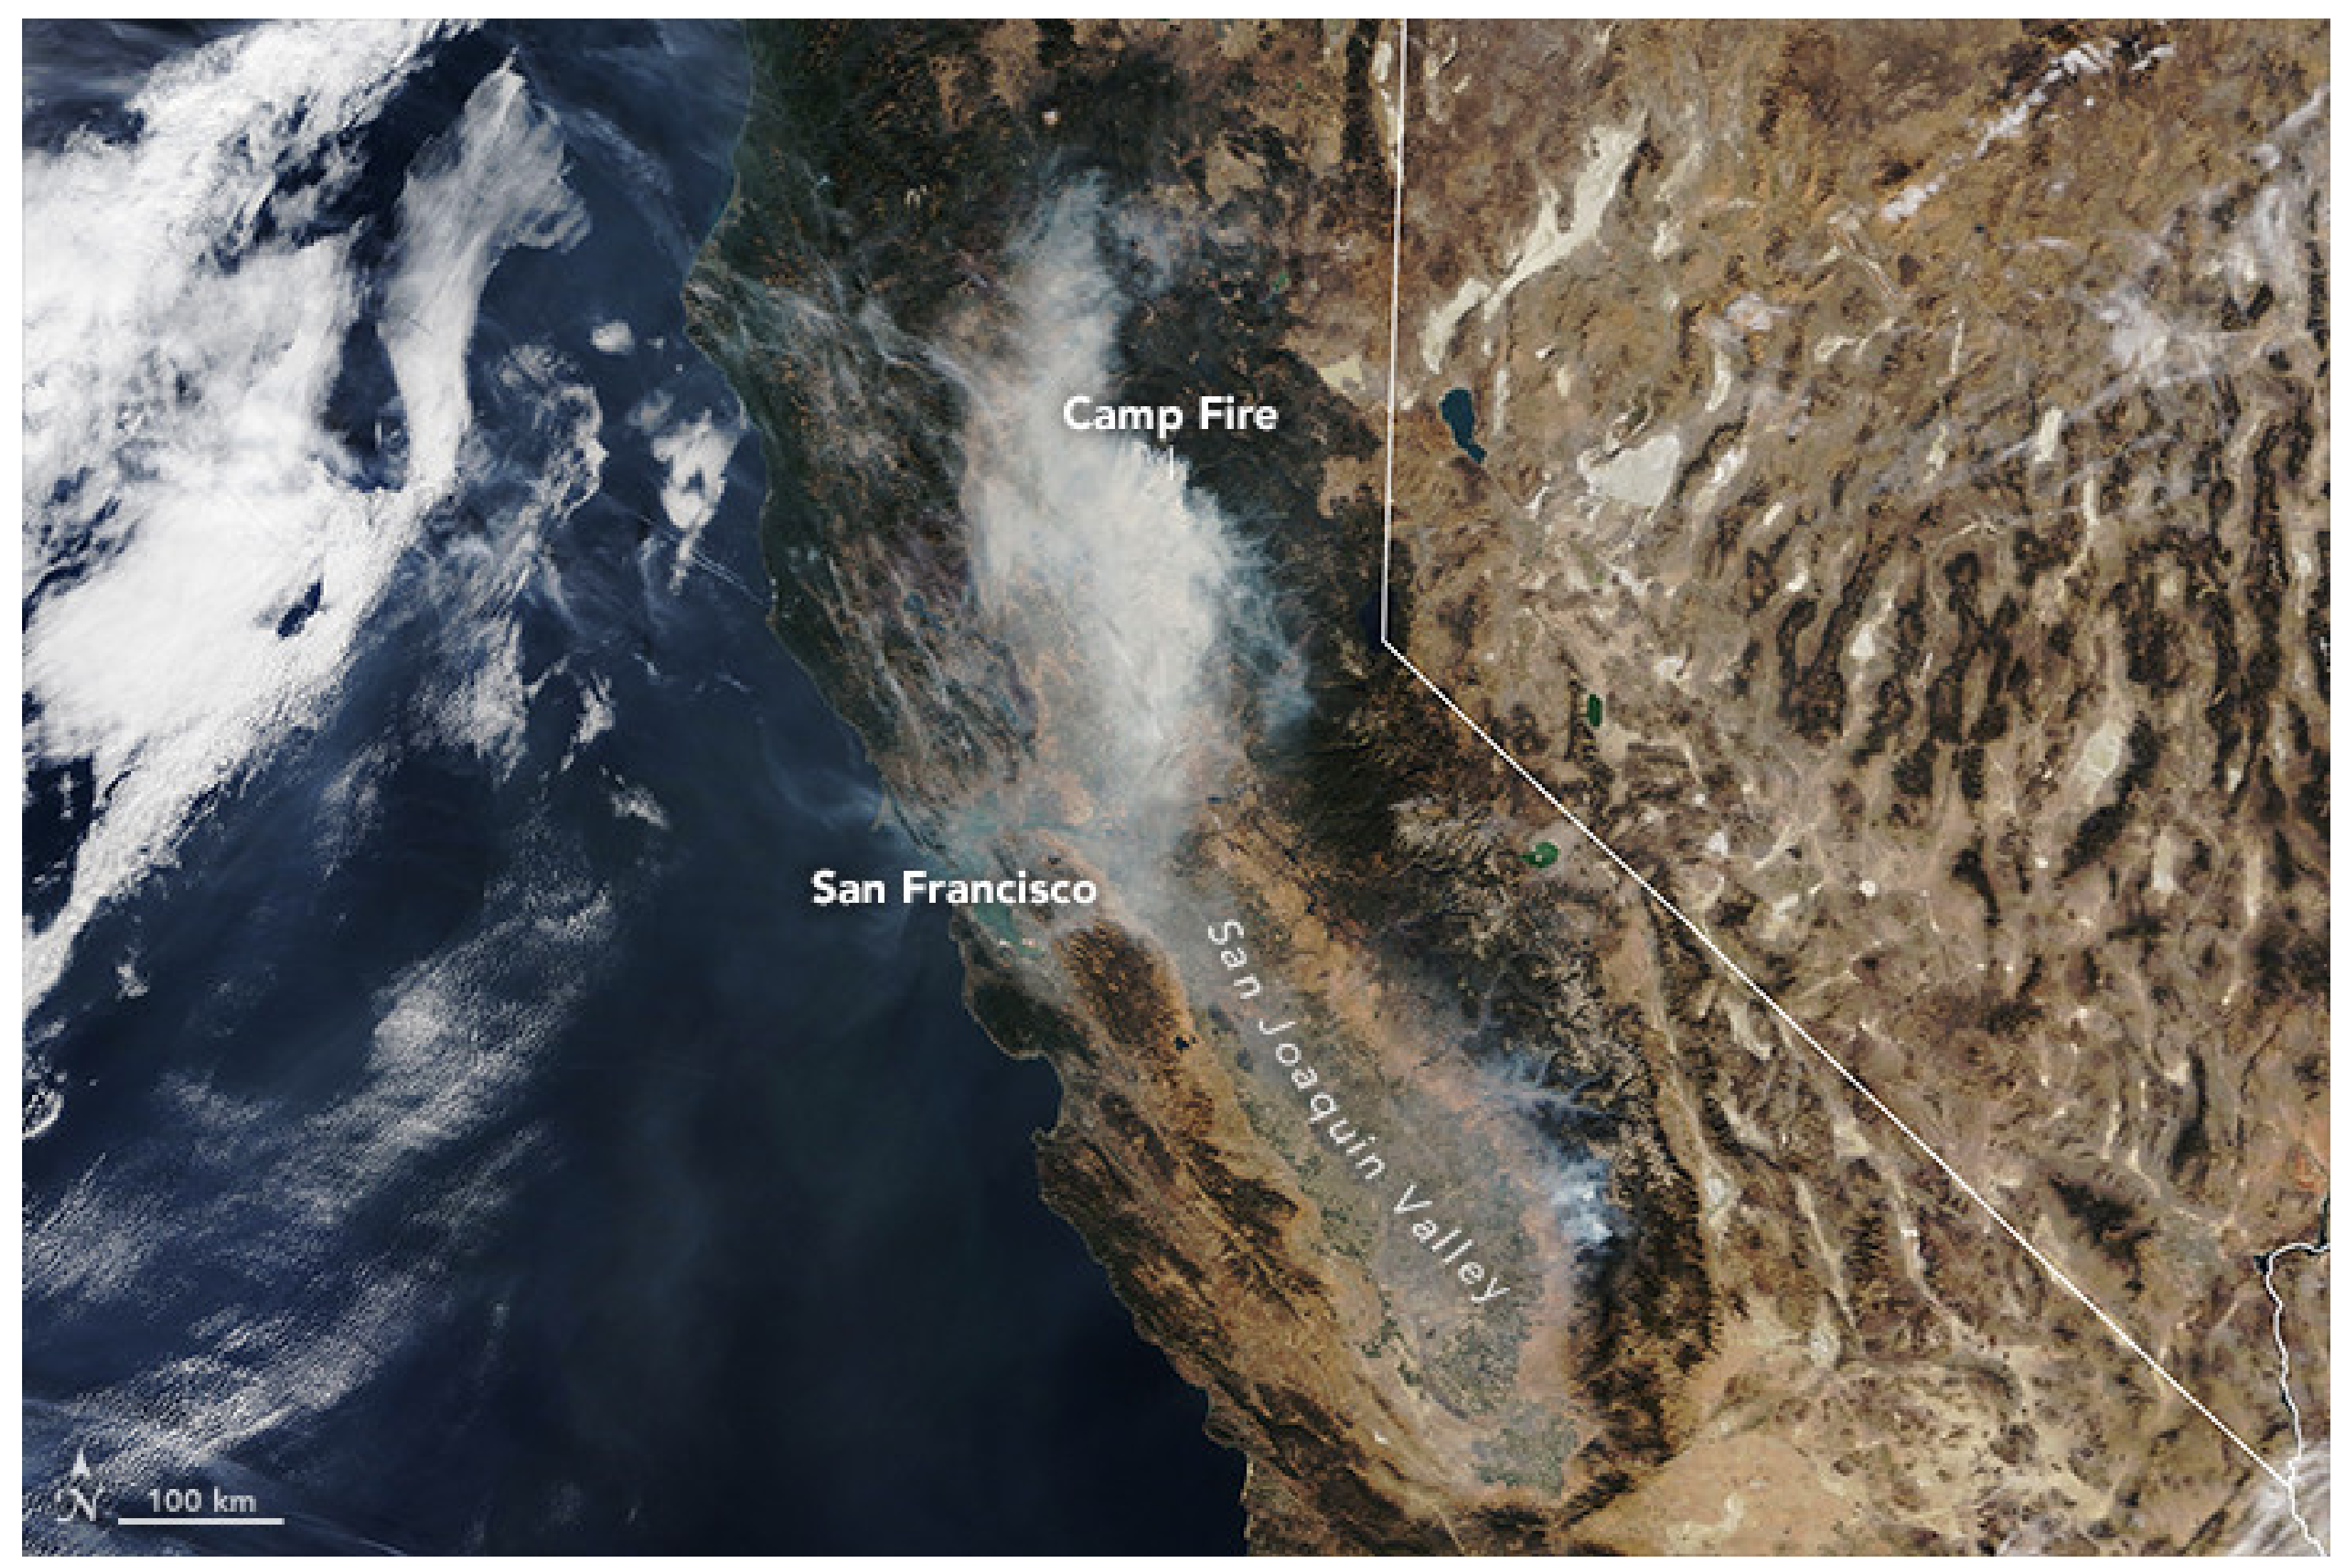
NASA and NOAA were two of the first organizations to observe wildfires using an extensive network of polar orbiting (Terra, Aqua) and geostationary (GOES) satellites. Polar satellites scan the entire Earth a few times each day and can monitor the entire planet for fires (Figure 6). However, each consecutive scan over the same geolocation is spaced several hours apart and, therefore, the temporal sampling rate for such satellites is low. On the other hand, geostationary satellites provide much higher temporal data for a specific area but cannot monitor other global environmental developments. The instruments on board these satellites monitor several different kinds of data, some of which are actively analyzed to detect/observe wildfires, global transport of pollutants and long-term climate impacts of fire (Table 1, [86]). Processing this data for wildfire anomalies, especially small fires, poses a challenge due to the lower spatial resolution of satellite images. In addition, smoke can easily appear identical to clouds, as shown in Figure 6 of the Camp Fire, imaged by moderate resolution imaging spectroradiometer (MODIS) on Terra.
Most environment observational satellites have visible and infrared detectors on board. Among the infrared bands, the 3.8/4 µm (middle infrared) and 10.8/11 µm (long-wave infrared) wavelengths are used to identify active fires (Table 2). The relative brightness temperatures of fire pixels on these two bands are different from each other, with the 4 µm channel (T4) registering a significantly increased radiance for high-temperature sources than the 11 µm channel (T11). The difference in brightness (δT = T4 − T11) of pixels between these two channels is compared with a pre-determined threshold to detect fires and map affected areas. This simple and intuitive approach was first proposed by Matson and Dozier in 1981 on AVHRR data [88]. Additional IR channels are often used to improve detection, by helping reject false alarms caused by clouds, bright surfaces, sun glints, water vapor, etc. [89]. A similar approach was applied to data from MODIS, ASTER and GOES, with many iterations proposing improved sensitivity to smaller and lower-temperature fires [89,90]. One of the major challenges of the earlier algorithms was that the threshold levels for comparing δT were empirically determined, and therefore varied across different kinds of biomes on Earth. In a modified approach (version 4), Giglio et al., proposed subsequent steps after the basic absolute threshold test has identified a fire pixel by comparing T3 or T4 to a certain numeric value [89]. In the following step, the pixels neighboring the pixel under consideration are used to estimate the radiance of the fire pixel in the absence of a fire. The pixel window is started at 3 × 3 and gradually increased until sufficient ground-based, non-fire pixels without clouds have been registered to compute the background signature. If this step is successful, a third step uses this background signature to calculate threshold values that hold contextual relevance to the specific area being investigated. δT is now compared to this threshold for identifying a tentative fire. In the last step, further tests using another set of different threshold formulae help in rejecting false alarms due to sun glints, deserts and coastal boundaries, water bodies, clouds and other sources of abrupt radiance transition.
In a radically alternate approach compared to the above method, deep-learning techniques were proposed for active fire identification. To facilitate this, Pereira et al., generated a publicly available dataset of image patches from Landsat-8 satellite covering global fire events in 2021 [91]. The database also included annotated fire pixels and is available on GitHub. The Landsat-8 was launched in 2013 and provides data in visible, SWIR, NIR and thermal IR spectrums (Table 2). The Operational Land Imagers (OLI) channels 1, 5, 6 and 7 are typically used for fire detection [92]. Using the Pereira dataset [91] for training, Rostami et al., developed a convolutional neural network (CNN)-based architecture called “MultiScale-Net” for finding fires [93]. To accommodate for fires of different sizes and patterns, the CNN used multiple sized kernels for feature extraction and changing dilation rates for the dilated convolution layer. SWIR bands and blue channel data were used as inputs to the CNN.
As an attempt to make satellite technology accessible to the general academic community, the CubeSat project was started in 1999 by a collaborative effort between California Polytechnic state University (San Luis Obispo) and Stanford University. The objective of this project was to boost research exploration and invention at affordable budgets. CubeSats have a standardized design and are launched as part of the payload on other satellite launches [94]. Gangestad et al., used the images from 1U AeroCube-4 equipped with three 2 MP cameras to demonstrate CubeSats as a viable option for wildfire detection [95]. However, downloading the images to a ground station usually takes hours. To mitigate this challenge, Azami et al., proposed k-nearest and CNN deep-learning (DL) models for image classification implemented on a Raspberry Pi [96]. The runtime for this RPi unit was optimized to minimize the power consumption and was integrated on to a KITSUNE 6U CubeSAT. The KITSUNE uses a Sony IMX342 color sensor that generates the images fed into the DL model for classification. Using this setup, the group was able to achieve classification accuracy of above 95% using networks like ShallowNet and LeNet [96,97]. Another recent example is Orora Technologies, which specifically designs 3U CubeSats furnished with IR cameras for finding and monitoring wildfires from space [98]. They claim to be currently protecting 302,588,843 hectares of forests spread over six continents. The Orora CubeSats have onboard GPUs to assist with wildfire detection without needing to download the data to the ground station for analysis.
- Advantages:
Satellites can survey large expanses of land in a single sweep and provide an expansive perspective of fire behavior. They are also built to last for several decades and serve multiple purposes beyond fire detection. For example, the NASA and NOAA meteorological satellites also track oceanic currents, upper atmospheric climate changes, drought risks and patterns, etc. They are adept at generating a comprehensive view of the biosphere and environmental processes, of which wildfires are only a contributing factor. The extensive data generated are available for public use and have spurred many discoveries and breakthroughs in many diverse disciplines.
- Challenges:
Aside from the cost aspects, the obvious bottleneck of wildfire observation using satellite technology is optimizing the area covered with the frequency of data collection. The high-flying altitudes limit the resolving power of fires smaller than a pixel in the images, which can make identification of young fires extremely difficult. Dense clouds and smoke cover can severely reduce ground visibility to even IR and, therefore, adversely impact their utility for tracking active fires under such conditions. Until the end of the 20th century, this technology was available only to a few niche organizations, due to high mission cost and limited capacity for onboard systems. Although CubeSats project have largely addressed this issue, launching a CubeSat network is still expensive compared to other methods discussed in this paper. Currently, the cheapest option is Interorbital Systems (IOS) TubeSat satellite kits, at about USD 16,000 (academic pricing) and USD 32,000 (commercial pricing) for a 1U kit, including launch. The price for a single 3U kit with inclusive launch services is USD 36,480 (academic pricing) and USD 72,960 (commercial pricing) [99].
Table 2.
NOAA and NASA satellites that help in wildfire detection, tracking and for studying its global impacts on climate and pollution.
Table 2.
NOAA and NASA satellites that help in wildfire detection, tracking and for studying its global impacts on climate and pollution.
| Instrument | Notes | Launch Date |
|---|---|---|
| Airborne Visible/Infrared Imaging Spectrometer (AVIRIS) [100] |
| 1987 |
| Advanced Very High-Resolution Radiometer (AVHRR) (NOAA) [101] |
| 1978–1994 |
| Advanced Spaceborne Thermal Emission and Reflection Radiometer (ASTER) [102] |
| 18 December 1999 |
| Moderate Resolution Imaging Spectroradiometer (MODIS) [103] |
| Dec 1999 (Terra); May 2002 (Aqua) |
| Multi-angle Imaging SpectroRadiometer (MISR) [104] |
| 18 December 1999 |
| Measurement of Pollution in the Troposphere (MOPITT) [105] |
| 18 December 1999 |
| Atmospheric Infrared Sounder (AIRS) [106] |
| 4 May 2002 |
| Cloud Aerosol Lidar with Orthogonal Polarization (CALIOP) [107] |
| 28 April 2006 |
| Visible Infrared Imaging Radiometer Suite (VIIRS) [108] |
| 28 October 2011 |
| Hyperspectual Thermal Emission Spectrometer (HyTES) [109] |
| July 2012 |
| Landsat 8 [110] |
| 2013 |
| ECOsystem Spaceborne Thermal Radiometer Experiment on Space Station (ECOSTRESS) [111] |
| 29 June 2018 |
3. Conclusions
In this review paper, we emphasized the impact of wildfires on human life and global ecosystems, and the current climate research indicates worsening fire seasons in the future. Advanced technologies like satellites, drones, ground-based sensor nodes and camera systems have been proposed to supplement traditional firefighting techniques. We discussed the stages and current state of research in these four main methodologies, specifically focusing on detecting wildfires at early stages, predicting hot spots at high risk and monitoring the spread. The paper highlights the technical aspects of the front end of the device, along with the algorithms used in the back end for processing the data and identifying an actual fire. Each category has its own shortcomings and limitations, but also excels at its own niche applications, and under different circumstances one technology will outperform the other. For example, satellites have the capability of scanning a considerable area in a short period of time, which is either impossible or time-consuming using the other methods. However, satellites have very low resolving power and typically sweep the same area once in several hours, making them unsuitable for real-time fire detection. Stationary camera networks address these issues but are immobile and need to be tethered to a power source. UAVs are characterized by flexible flight paths that can be used to adapt to the changes in fire patterns and survey different areas as required. However, they are also power hungry, and are inadequate for long-term continuous monitoring. In comparison to the above, sensor nodes are the most low-power units that can be placed to monitor very remote locations continuously, are relatively inexpensive to produce on a large scale and do not need intensive data processing like those for analyzing images from UAVs, satellites or cameras. On the other hand, nodes face the highest risk of damage due to their proximity to fires on the ground. Ultimately, none of these methods can fully substitute the usefulness of the others, but all four can be unified for a robust firewatch system that together can exhaustively detect wildfires around the clock. The shortcomings and gaps in research in each area were underlined, which we hope will be addressed in the future through rigorous research.
Author Contributions
A.M.—conceptualization and layout of the paper, literature survey, analysis of various methods and deriving their comparative performance and usability. A.M. focused on satellites and wireless sensing nodes. T.T.—making the graphics and figures, literature survey, analysis of various methods, summarizing salient points of each technology. T.T. focused most on UAVs and stationary camera networks. The introductory passages were written by both A.M. and T.T. All authors have read and agreed to the published version of the manuscript.
Funding
This research received no external funding.
Conflicts of Interest
The authors declare no conflict of interest.
References
- Pausas, J.G.; Keeley, J.E. Wildfires as an ecosystem service. Front. Ecol. Environ. 2019, 17, 289–295. [Google Scholar] [CrossRef]
- The European Space Agency. New Long-Term Dataset to Analyse Global Fire Trends; The European Space Agency: Paris, France, 2021. [Google Scholar]
- National Fire News: National Preparedness Level 2; National Interagency Fire Center: Boise, ID, USA, 2022.
- Available online: https://www.fire.ca.gov/incidents/ (accessed on 25 July 2022).
- California Department of Fish and Wildlife. 2022. Available online: https://wildlife.ca.gov/Science-Institute/Wildfire-Impacts (accessed on 29 June 2022).
- Steel, Z.L.; Collins, B.M.; Sapsis, D.B.; Stephens, S.L. Quantifying pyrodiversity and its drivers. R. Soc. Publ. 2021, 288, 20203202. [Google Scholar] [CrossRef] [PubMed]
- Erb, W.M.; Barrow, E.J.; Hofner, A.N.; Utami-Atmoko, S.S.; Vogel, E.R. Wildfire smoke impacts activity and energetics of wild Bornean orangutans. Sci. Rep. 2018, 8, 7606. [Google Scholar] [CrossRef] [PubMed]
- Wintle, B.A.; Legge, S.; Woinarski, J.C.Z. After the Megafires: What Next for Australian Wildlife? Trends Ecol. Evol. 2020, 35, 753–757. [Google Scholar] [CrossRef] [PubMed]
- Godfree, R.C.; Knerr, N.; Encinas-Viso, F.; Albrecht, D.; Bush, D.; Cargill, D.C.; Clements, M.; Gueidan, C.; Guja, L.K.; Harwood, T.; et al. Implications of the 2019–2020 megafires for the biogeography and conservation of Australian vegetation. Nat. Commun. 2021, 1023, 12. [Google Scholar] [CrossRef] [PubMed]
- California Air Resources Board. 2020. Available online: https://ww2.arb.ca.gov/ghg-inventory-data (accessed on 29 July 2022).
- Geng, G.; Murray, N.L.; Tong, D.; Fu, J.S.; Hu, X.; Lee, P.; Meng, X.; Chang, H.H.; Liu, Y. Satellite-Based Daily PM2.5 Estimates During Fire Seasons in Colorado. JGR Atmos. 2018, 123, 8159–8171. [Google Scholar] [CrossRef]
- Stowell, J.D.; Yang, C.-E.; Fu, J.S.; Scovronick, N.C.; Strickland, M.J.; Liu, Y. Asthma exacerbation due to climate change-induced wildfire smoke in the Western US. Environ. Res. Lett. 2021, 17, 014023. [Google Scholar] [CrossRef]
- Stowell, J.D.; Geng, G.; Saikawa, E.; Chang, H.H.; Fu, J.; Yang, C.-E.; Zhu, Q.; Liu, Y.; Strickland, M.J. Associations of wildfire smoke PM2.5 exposure with cardiorespiratory events in Colorado 2011–2014. Environ. Int. 2019, 133, 105151. [Google Scholar] [CrossRef]
- Reid, C.E.; Brauer, M.; Johnston, F.H.; Jerrett, M.; Balmes, J.R.; Elliott, C.T. Critical Review of Health Impacts of Wildfire Smoke Exposure. Env. Health Perspect 2016, 124, 1334–1343. [Google Scholar] [CrossRef]
- Holm, S.M.; Miller, M.D.; Balmes, J.R. Health effects of wildfire smoke in children and public health tools: A narrative review. J. Expo. Sci. Environ. Epidemiol. 2021, 31, 1–20. [Google Scholar] [CrossRef]
- Rundle, A.; Hoepner, L.; Hassoun, A.; Oberfield, S.; Freyer, G.; Holmes, D.; Reyes, M.; Quinn, J.; Camann, D.; Perera, F.; et al. Association of Childhood Obesity With Maternal Exposure to Ambient Air Polycyclic Aromatic Hydrocarbons During Pregnancy. Am. J. Epidemiol. 2012, 175, 1163–1172. [Google Scholar] [CrossRef]
- Rosa, M.J.; Hair, G.M.; Just, A.C.; Kloog, I.; Svensson, K.; Pizano-Zárate, M.L.; Pantic, I.; Schnaas, L.; Tamayo-Ortiz, M.; Baccarelli, A.A.; et al. Identifying critical windows of prenatal particulate matter (PM 2.5) exposure and early childhood blood pressure. Environ. Res. 2020, 182, 109073. [Google Scholar]
- Johnston, F.H.; Henderson, S.B.; Chen, Y.; Randerson, J.T.; Marlier, M.; Defries, R.S.; Kinney, P.; Bowman, D.M.J.S.; Brauer, M. Estimated Global Mortality Attributable to Smoke from Landscape Fires. Environ. Health Perspect 2012, 120, 695–701. [Google Scholar] [CrossRef]
- US Fire Administration. Administration, Socioeconomic Factors and the Incidence of Fire; National Fire Data Center: Washington, DC, USA, 2017.
- Masri, S.; Scaduto, E.; Jin, Y.; Wu, J. Disproportionate Impacts of Wildfires among Elderly and Low-Income Communities in California from 2000–2020. Int. J. Environ. Res. Public Health 2021, 18, 3921. [Google Scholar] [CrossRef]
- Gin, J.L.; Balut, M.D.; Der-Martirosian, C.; Dobalian, A. Managing the unexpected: The role of homeless service providers during the 2017–2018 California wildfires. J. Community Psychol. 2021, 49, 2532–2547. [Google Scholar] [CrossRef]
- Ma, A.L.; Loughland, M.E.D.; Lapcharoensap, W.; Dukhovny, D.; Lee, H.C. California and Oregon NICU Wildfire Disaster Preparedness Tools. Children 2021, 8, 465. [Google Scholar] [CrossRef]
- Robinne, F.-N.; Hallem, D.W.; Bladon, K.D.; Flannigan, M.D.; Boisramé, G.; Bréthaut, C.M.; Doerr, S.H.; Baldassarre, G.D.; Gallagher, L.A.; Hohner, A.K.; et al. Scientists’ warning on extreme wildfire risks to water supply. Hydrol. Process. 2021, 35, e14086. [Google Scholar] [CrossRef]
- Barbosa, J.V.; Nunes, R.A.O.; Alvim-Ferraz, M.C.M.; Martins, F.G.; Sousa, S.I.V. Health and Economic Burden of the 2017 Portuguese Extreme Wildland Fires on Children. Int. J. Environ. Res. Public Health 2022, 1, 19. [Google Scholar] [CrossRef]
- Reiff, N. How Fire Season Affects the Economy, Investopedia, 28 February 2022. Available online: https://www.investopedia.com/how-fire-season-affects-the-economy-5194059#:~:text=As%20wildfires%20become%20a%20more,about%200.04%25%20over%20two%20years (accessed on 5 July 2022).
- Creative Commons Legal Code. Available online: https://creativecommons.org/licenses/by/3.0/legalcode (accessed on 21 July 2022).
- Varela, N.; Diaz-Martinez, L.J.; Ospino, A.; Zelaya, N.A.L. Wireless Sensor Network for Forest Fire Detection. Procedia Comput. Sci. 2020, 175, 435–440. [Google Scholar] [CrossRef]
- Khalid, W.; Sattar, A.; Qureshi, M.; Amin, A.; Malik, M.A.; Memon, K.H. A smart wireless sensor network mode for fire detection. Turk. J. Electr. Eng. Comput. Sci. 2019, 27, 2541–2556. [Google Scholar] [CrossRef]
- Ammar, M.B.; Souissi, R. A New Approach based on Wireless Sensor Network and Fuzzy Logic for Forest Fire Detection. Int. J. Comput. Appl. 2014, 89, 0975–8887. [Google Scholar]
- Bolourchi, P.; Uysal, S. Forest Fire Detection in Wireless Sensor Network Using Fuzzy Logic. In Proceedings of the Fifth International Conference on Computational Intelligence, Communication Systems and Networks, Riga, Latvia, 3–5 June 2013. [Google Scholar]
- Dampage, U.; Bandaranayake; Wanasinghe, R.; Kottahachchi, K.; Jayasanka, B. Fire detection system using wireless sensor networks and machine learning. Sci. Rep. 2022, 12, 46. [Google Scholar] [CrossRef]
- Yan, X.; Cheng, H.; Zhao, Y.; Yu, W.; Huang, H.; Zheng, X. Real-Time Identification of Smoldering and Flaming Combustion Phases in Forest Using a Wireless Sensor Network-Based Multi-Sensor System and Artificial Neural Network. Sensors 2016, 16, 1228. [Google Scholar] [CrossRef]
- Abbassi, M.A.E.; Jilbab, A.; Bourouhou, A. Efficient Forest Fire Detection System Based on Data Fusion Applied in Wireless Sensor Networks. Int. J. Electr. Eng. Inform. 2020, 12, 1–18. [Google Scholar] [CrossRef]
- Cruz, M.G.; Alexander, M.E. The 10% wind speed rule of thumb for estimating a wildfire’s forward rate of spread in forests and shrublands. Ann. For. Sci. 2019, 76, 44. [Google Scholar] [CrossRef]
- Natural Resources Canada. Canadian Forest Fire Weather Index (FWI) System. Available online: https://cwfis.cfs.nrcan.gc.ca/background/summary/fwi (accessed on 9 July 2022).
- Poulakis, M.I.; Vassaki, S.; Panagopoulos, A.D. Satellite-Based Wireless Sensor Networks: Radio Communication Link Design. In Proceedings of the 2013 7th European Conference on Antennas and Propagation (EuCAP), Gothenburg, Sweden, 8–12 April 2013. [Google Scholar]
- Nguyen, M.T.; Nguyen, C.V.; Do, H.T.; Hua, H.T.; Tran, T.A.; Nguyen, A.D.; Ala, G.; Viola, F. UAV-Assisted Data Collection in Wireless Sensor Networks: A Comprehensive Survey. Electronics 2021, 10, 2603. [Google Scholar] [CrossRef]
- News Release: DHS S&T Successfully Evaluates Wildfire Sensors with California Emergency Responders, 10 Jun 2021. Available online: https://www.dhs.gov/science-and-technology/news/2021/06/10/news-release-st-successfully-evaluates-wildfire-sensors (accessed on 28 July 2022).
- Hartung, C.; Han, R.; Seielstad, C.; Holbrook, S. FireWxNet: A multi-tiered portable wireless system for monitoring weather conditions in wildland fire environments. In Proceedings of the 4th International Conference on Mobile Systems, Applications, and Services (MobiSys 2006), Uppsala, Sweden, 19–22 June 2006. [Google Scholar]
- Bayo, A.; Antolin, D.; Medrano, N.; Calvo, B.; Celma, S. Development of a Wireless Sensor Network System for Early Forest Fire Detection. In Proceedings of the ITG-Fachbericht 224-RFID Systech, Ciudad, Spain, 15–16 June 2010. [Google Scholar]
- Owayjan, M.; Freiha, G.; Achkar, R.; Abdo, E.; Mallah, S. Firoxio: Forest Fire Detection and Alerting System. In Proceedings of the 17th IEEE Mediterranean Electrotechnical Conference, Beirut, Lebanon, 13–16 April 2014. [Google Scholar]
- Molina-Pico, A.; Cuesta-Frau, D.; Araujo, A.; Alejandre, J.; Rozas, A. Forest Monitoring and Wildland Early Fire Detection by a Heirarchical Wireless Sensor Network. J. Sens. 2016, 2016, 8325845. [Google Scholar] [CrossRef]
- Lutakamale, A.S.; Kaijage, S. Wildfire Monitoring and Detection System Using Wireless Sensor Network: A Case Study of Tanzania. Wirel. Sens. Netw. 2017, 9, 274–289. [Google Scholar] [CrossRef]
- Teixeira, J. Wireless Sensor Network for Forest Fire Detection; Universidade Do Porto: Porto, Portugal, 2017. [Google Scholar]
- Neumann, G.B.; de Almeida, V.P.; Endler, M. Smart Forests: Fire Detection Service. In Proceedings of the IEEE Symposium on Computers and Communications, Natal, Brazil, 25–28 June 2018. [Google Scholar]
- Kadir, E.A.; Rosa, S.L.; Yulianti, A. Application of WSNs for Detection Land and Forest Fire in Riau Province Indonesia. In Proceedings of the International Conference on Electrical Engineering and Computer Science, Pangkal, Indonesia, 2–4 October 2018. [Google Scholar]
- LADSensors—Firest Supervisor Early Wildfire Detection System. 2018. Available online: https://www.ladsensors.com/ (accessed on 23 July 2022).
- Silvanet Wildfire Detection. 2019. Available online: https://www.dryad.net/silvanet (accessed on 28 July 2022).
- Knotifire. 2020. Available online: https://www.knotifire.com/ (accessed on 28 July 2022).
- BurnMonitor: An Early Wildfire Detection IoT Solution, Inria. 2020. Available online: https://project.inria.fr/siliconvalley/2021/05/04/burnmonitor-an-early-wildfire-detection-iot-solution/ (accessed on 28 July 2022).
- Benzekri, W.; Moussati, A.E.; Moussaoui, O.; Berrajaa, M. Early Forest Fire Detection System using Wireless Sensor Network and Deep Learning. Int. J. Adv. Comput. Sci. Appl. 2020, 11, 5. [Google Scholar] [CrossRef]
- ChemNode—N5 Sensors. 2022. Available online: https://secureservercdn.net/166.62.114.250/3xl.d5a.myftpupload.com/wp-content/uploads/2022/02/N5-ChemNode-Data-Sheet.pdf (accessed on 28 July 2022).
- National Wildfire Coordinating Group. NWCG Standards for Fire Unmanned Aircraft Systems Operations; National Wildfire Coordinating Group: Washington, DC, USA, 2019.
- Zhao, X.; Zhou, Z.; Zhu, X.; Guo, A. Design of a Hand-Launched Solar-Powered Unmanned Aerial Vehicle (UAV) System for Plateau. Appl. Sci. 2020, 10, 1300. [Google Scholar] [CrossRef]
- Allison, R.S.; Johnston, J.M.; Craig, G.; Jennings, S. Airborne Optical and Thermal Remote Sensing for Wildfire Detection and Monitoring. Sensors 2016, 16, 1310. [Google Scholar]
- FOTOKITE, The Fotokite Sigma. A Situational Awareness System for First Responders, Perspective Robotics AG. 2022. Available online: https://fotokite.com/situational-awareness-system/ (accessed on 9 July 2022).
- Yuan, C.; Liu, Z.; Zhang, Y. UAV-based forest fire detection and tracking using image processing techniques. In Proceedings of the 2015 International Conference on Unmanned Aircraft Systems (ICUAS), Denver, CO, USA, 9–12 June 2015; p. 640. [Google Scholar]
- Ball, M. Forest Fire Monitoring with Drones and Wind Sensors, Unmanned Systems Technology, 25 January 2021. Available online: https://www.unmannedsystemstechnology.com/2021/01/forest-fire-monitoring-with-drones-and-wind-sensors/ (accessed on 9 July 2022).
- Drone Amplified, Fight Fire with Fire, Drone Amplified. Available online: https://droneamplified.com/ignis/?v=7516fd43adaa (accessed on 9 July 2022).
- Lin, Z.; Liu, H.H.T.; Wotton, M. Kalman Filter-Based Large-Scale Wildfire Monitoring With a System of UAVs. IEEE Trans. Ind. Electron. 2019, 66, 606–615. [Google Scholar] [CrossRef]
- Bushnaq, O.M.; Chaaban, A.; Al-Naffouri, T.Y. The Role of UAV-IoT Networks in Future Wildfire Detection. IEEE Internet Things J. 2021, 8, 16984–16999. [Google Scholar] [CrossRef]
- Lewicki, T.; Liu, K. Multimodal Wildfire Surveillance with UAV. In Proceedings of the IEEE Global Communications Conference, Madrid, Spain, 7–11 December 2021. [Google Scholar]
- Jiao, Z.; Zhang, Y.; Mu, L.; Xin, J.; Jiao, S.; Liu, H.; Liu, D. A YOLOv3-based Learning Strategy for Real-time UAV-based Forest Fire Detection. In Proceedings of the IEEE Chinese Control and Decision Conference, Changsha, China, 22–24 August 2020. [Google Scholar]
- Tahir, H.U.A.; Waqar, A.; Khalid, S.; Usman, S.M. Wildfire Detection in Aerial Images Using Deep Learning. In Proceedings of the 2nd International Conference on Digital Futures and Transformative Technlogies, Rawalpindi, Pakistan, 24–26 May 2022. [Google Scholar]
- Bouguettaya, A.; Zarzour, H.; Taberkit, A.M.; Kechida, A. A review on early wildfire detection from unmanned aerial vehicles using deep learning-based computer vision algorithms. Signal Processing 2020, 190, 108309. [Google Scholar] [CrossRef]
- Barmputis, P.; Papaioanou, P.; Dimitropoulos, K.; Grammalidis, N. A Review on Early Forest Fire Detection Systems Using Optical Remote Sensing. Sensors 2020, 20, 6442. [Google Scholar] [CrossRef]
- Han, B.; Zhou, Y.; Deveerasetty, K.K.; Hu, C. A Review of Control Algorithms for Quadrotor. In Proceedings of the International Conference on Information and Automation, Wuyishan, China, 11–13 August 2018. [Google Scholar]
- Pham, H.X.; La, H.M.; Feil-Seifer, D.; Deans, M.C. A Distributed Control Framework of Multiple Unmanned Aerial Vehicles for Dynamic Wildfire Tracking. IEEE Trans. Syst. Man Cybern. 2020, 50, 1537–1548. [Google Scholar] [CrossRef]
- Mawanza, J.T.; Agee, J.T.; Bhero, E. Adaptive Finite-Time Time-Varying Elliptical Formation Control for a Group of Quadrotors UAVs for Cooperative Wildfire Monitoring. In Proceedings of the 30th Southern African Universities Power Engineering, Durban, South Africa, 25–27 January 2022. [Google Scholar]
- Shrestha, K.; Dubey, R.; Singandhupe, A.; Louis, S.; La, H. Multi Objective UAV Network Deployment for Dynamic Fire Coverage. In Proceedings of the IEEE Congress on Evolutionary Computation, Kraków, Poland, 28 June–1 July 2021. [Google Scholar]
- Kim, J.; Gadsden, A.A.; Wilkerson, S.A. A Comprehensive Survey of Control Strategies for Autonomous Quadrotors. Can. J. Electr. Comput. Eng. 2020, 43, 3–16. [Google Scholar] [CrossRef]
- Kangunde, V.; Jamisola, R.S., Jr.; Theophilus, E.K. A review on drones controlled in real-time. Int. J. Dyn. Control. 2021, 9, 1832–1846. [Google Scholar] [CrossRef]
- Oettershagen, P.; Melzer, A.; Mantel, T.A.; Rudin, K.; Lotz, R.; Siebenmann, D.; Leutenegger, S.; Alexis, K.; Siegwart, R. A solar-powered hand-launchable UAV for low-altitude multi-day continuous flight. In Proceedings of the IEEE International Conference on Robotics and Automation, Seattle, WA, USA, 26 May 2015; pp. 3986–3993. [Google Scholar]
- Jung, S.; Jo, Y.; Kim, Y. Aerial Surveillance with Low-Altitude Long-Endurance Tethered Multirotor UAVs Using Photovoltaic Power Management System. Energies 2019, 12, 1323. [Google Scholar] [CrossRef]
- SolarXOne: Autonomous, Long Range and Solar Drone, XSun. 2019. Available online: https://xsun.fr/autonomous-drone/ (accessed on 22 July 2022).
- Shi, J.; Wang, W.; Gao, Y.; Yu, N. Optimal Placement and Intelligent Smoke Detection Algorithm for Wildfire-Monitoring Cameras; IEEE: Piscataway, NJ, USA, 2020; Volume 8, pp. 3–4. [Google Scholar]
- SmokeD, Automatic Fire and Smoke Detection System, SmokeD. Available online: https://smokedsystem.com/ (accessed on 10 July 2022).
- Alert Wildfire. 2014. Available online: https://www.alertwildfire.org/ (accessed on 27 July 2022).
- News Releases, Pacific Gas and Electric, 18 November 2021. Available online: https://www.pge.com/en_US/about-pge/media-newsroom/news-details.page?pageID=0553327b-df9e-4321-9b19-92b9297ec2d4&ts=1642273313274 (accessed on 27 July 2022).
- Pano AI. 2019. Available online: https://www.pano.ai/ (accessed on 27 July 2022).
- IQ FireWatch, IQ FireWatch Technology, IQ Firewatch. Available online: https://www.iq-firewatch.com/technology#arg3 (accessed on 10 July 2022).
- Planet, Linking Ground and Space Systems to Autonomously Assess Wildfires, Planet, 25 August 2020. Available online: https://learn.planet.com/rs/997-CHH-265/images/2020-08-25_Moore_MOFD_Case%20Study_Letter.pdf (accessed on 10 July 2022).
- Stipaničev, D.; Šerić, L.; Braović, M.; Krstinić, D.; Jakovčević, T.; Štula, M.; Bugarić, M.; Maras, J. Vision Based Wildfire and Natural Risk Observers; IEEE: Piscataway, NJ, USA, 2012; p. 6. [Google Scholar]
- He, K. Single Image Haze Removal Using Dark Channel Prior; IEEE: Piscataway, NJ, USA, 2009. [Google Scholar]
- Agirman, K.T.A.K. BLSTM based night-time wildfire detection from video. PLoS ONE 2022, 17, e0269161. [Google Scholar] [CrossRef]
- Gutro, R. NASA Covers Wildfires Using Many Sources, NASA Goddard Space Flight Center, 9 December 2021. Available online: https://www.nasa.gov/mission_pages/fires/main/missions/index.html (accessed on 10 July 2022).
- Stevens, J. Smoke from Camp Fire Billows Across California, 14 November 2018. Available online: https://earthobservatory.nasa.gov/images/144252/smoke-from-camp-fire-billows-across-california (accessed on 13 July 2022).
- Matson, M.; Dozier, J. Identification of Subresolution High Temperature Sources Using a Thermal IR Sensor. Photogramm. Eng. Remote Sens. 1981, 47, 1311–1318. [Google Scholar]
- Giglio, L.; Descloitres, J.; Justice, C.O.; Kaufman, Y. An Enhanced Contextual Fire Detection Algorithm for MODIS. Remote Sens. Environ. 2003, 87, 273–282. [Google Scholar]
- Giglio, L.; Schroeder, W.; Justice, C.O. The collection 6 MODIS active fire detection algorithm and fire products. Remote Sens. Environ. 2016, 1789, 31–41. [Google Scholar] [CrossRef]
- Pereira, G.H.A.; Fusioka, A.M.; Nassu, B.T.; Minetto, R. Active Fire Detection in Landsat-8 Imagery: A Large-Scale Dataset and a Deep-Learning Study. J. Photogramm. Remote Sens. 2021, 178, 171–186. [Google Scholar] [CrossRef]
- Schroeder, W.; Oliva, P.; Giglio, L.; Quayle, B.; Lorenz, E.; Morelli, F. Active fire detection using Landsat-8/OLI data. Remote Sens. Environ. 2016, 185, 210–220. [Google Scholar] [CrossRef] [Green Version]
- Rostami, A.; Shah-Hosseini, R.; Asgari, S.; Zarei, A.; Adhdami-Nia, M.; Homayouni, S. Acrive Fire Detection from Landsat-8 Imagery Using Multiple Kernel Learning. Remote Sens. 2022, 14, 992. [Google Scholar] [CrossRef]
- Johnstone, A. CubeSat Design Specification (1U-12U) rev 14.1, February 2022. Available online: https://static1.squarespace.com/static/5418c831e4b0fa4ecac1bacd/t/5f24997b6deea10cc52bb016/1596234122437/CDS+REV14+2020-07-31+DRAFT.pdf (accessed on 24 July 2022).
- Gangestad, J.W.; Rowen, D.W.; Hardy, B.S. Forest fires, sunglint, and a solar eclipse: Responsive remote sensing with AeroCube-4. In Proceedings of the IEEE Geoscience and Remote Sensing Symposium, Kuala Lumpur, Malaysia, 17–22 July 2014; pp. 3622–3625. [Google Scholar]
- Azami, M.H.; Orger, N.C.; Schulz, V.H.; Cho, M. Demonstration of Wildfire Detection Using Image Classification Onboard CubeSat. In Proceedings of the International Symposium on Geoscience and Remote Sensing, Brussels, Belgium, 11–16 July 2021. [Google Scholar]
- Azami, M.H.; Orger, N.C.; Schulz, V.H.; Oshiro, T.; Cho, M. Earth Observation Mission of a 6U CubeSat with a 5-meter Resolution for Wildfire Image Classification Using Convolutional Neural Network Approach. Remote Sens. 2022, 14, 1874. [Google Scholar] [CrossRef]
- OroraTech Home Page. 2018. Available online: https://ororatech.com/ (accessed on 24 July 2022).
- Interorbital Systems. 2022. Available online: https://www.interorbital.com/ (accessed on 24 July 2022).
- AVIRIS Airborne Visible/Infrared Imaging Spectrometer. Available online: https://aviris.jpl.nasa.gov/ (accessed on 28 July 2022).
- Advanced Very High Resolution Radiometer. Available online: https://www.eumetsat.int/avhrr (accessed on 28 July 2022).
- NASA. ASTER|Terra. Available online: https://terra.nasa.gov/about/terra-instruments/aster (accessed on 28 July 2022).
- NASA. MODIS Web. Available online: https://modis.gsfc.nasa.gov/ (accessed on 28 July 2022).
- NASA. Multi-Angle Imaging SpectroRadiometer. Available online: https://www.jpl.nasa.gov/missions/multi-angle-imaging-spectroradiometer-misr (accessed on 28 July 2022).
- NASA. MOPITT|Terra. Available online: https://terra.nasa.gov/about/terra-instruments/mopitt (accessed on 28 July 2022).
- NASA. AIRS. Available online: https://airs.jpl.nasa.gov/ (accessed on 28 July 2022).
- NASA. CALIPSO. Available online: https://www-calipso.larc.nasa.gov/about/payload.php#CALIOP (accessed on 28 June 2022).
- NOAA. Visible Infrared Imaging Radiometer Suite (VIIRS). Available online: https://www.nesdis.noaa.gov/current-satellite-missions/currently-flying/joint-polar-satellite-system/jpss-mission-and-2 (accessed on 28 June 2022).
- NASA. Welcome to Hyperspectral Thermal Emission Spectrometer Website. Available online: https://hytes.jpl.nasa.gov/ (accessed on 28 June 2022).
- NASA. Landsat 8|Landsat Science. Available online: https://landsat.gsfc.nasa.gov/satellites/landsat-8/ (accessed on 28 June 2022).
- NASA. Welcome to ECOSTRESS. Available online: https://ecostress.jpl.nasa.gov/ (accessed on 28 June 2022).
Figure 1.
Plot of acres burned from 1984–2020 in the United States shows an overall increase in the burn severity and impact over the years. Data was obtained from the Monitoring Trends in Burn Severity (MTBS) program by US Geological Survey Center for Earth Resources Observation and Science (EROS) and USDA Forest Service Geospatial Technology and Applications Center (GTAC).

Figure 2.
Frequency of papers and articles selected for review from each 5-year span.

Figure 3.
Basic sequence of operation for the majority of WSNs. Many may not share the exact steps but will follow these core functions. (Images sourced from Creative Commons, following the guidelines on Attribution 3.0 Unported, CC By 3.0 [26]. The only modifications to the images are cropping and resizing).

Figure 4.
Possible roles of UAVs. (Images sourced from Creative Commons, following the guidelines on Attribution 3.0 Unported, CC By 3.0 [26]. The only modifications to the images are cropping and resizing).
Figure 4.
Possible roles of UAVs. (Images sourced from Creative Commons, following the guidelines on Attribution 3.0 Unported, CC By 3.0 [26]. The only modifications to the images are cropping and resizing).

Figure 5.
Typical application of camera networks paired with AI. (Images sourced from Creative Commons, following the guidelines on Attribution 3.0 Unported, CC By 3.0 [26]. The only modifications to the images are cropping and resizing).
Figure 5.
Typical application of camera networks paired with AI. (Images sourced from Creative Commons, following the guidelines on Attribution 3.0 Unported, CC By 3.0 [26]. The only modifications to the images are cropping and resizing).

Figure 6.
MODIS image of the Camp Fire in northern California on Nov 14, 2018 [87]. Image by NASA Earth Observatory.
Figure 6.
MODIS image of the Camp Fire in northern California on Nov 14, 2018 [87]. Image by NASA Earth Observatory.

Publisher’s Note: MDPI stays neutral with regard to jurisdictional claims in published maps and institutional affiliations. |
© 2022 by the authors. Licensee MDPI, Basel, Switzerland. This article is an open access article distributed under the terms and conditions of the Creative Commons Attribution (CC BY) license (https://creativecommons.org/licenses/by/4.0/).
Share and Cite
MDPI and ACS Style
Mohapatra, A.; Trinh, T. Early Wildfire Detection Technologies in Practice—A Review. Sustainability 2022, 14, 12270. https://0-doi-org.brum.beds.ac.uk/10.3390/su141912270
AMA Style
Mohapatra A, Trinh T. Early Wildfire Detection Technologies in Practice—A Review. Sustainability. 2022; 14(19):12270. https://0-doi-org.brum.beds.ac.uk/10.3390/su141912270
Chicago/Turabian StyleMohapatra, Ankita, and Timothy Trinh. 2022. "Early Wildfire Detection Technologies in Practice—A Review" Sustainability 14, no. 19: 12270. https://0-doi-org.brum.beds.ac.uk/10.3390/su141912270
Note that from the first issue of 2016, this journal uses article numbers instead of page numbers. See further details here.