


Early Detection of Bacterial Blight in Hyperspectral Images Based on Random Forest and Adaptive Coherence Estimator

1
Department of Information and Technology, Nanjing Forest Police College, Nanjing 210023, China
2
College of Engineering, Nanjing Agricultural University, Nanjing 210095, China
3
College of Artificial Intelligence, Nanjing Agricultural University, Nanjing 210095, China
*
Authors to whom correspondence should be addressed.
Sustainability 2022, 14(20), 13168; https://0-doi-org.brum.beds.ac.uk/10.3390/su142013168
Submission received: 19 August 2022
/
Revised: 27 September 2022
/
Accepted: 8 October 2022
/
Published: 13 October 2022
(This article belongs to the Topic Emerging Agricultural Engineering Sciences, Technologies, and Applications)
Abstract
:Rice disease detection is of great significance to rice disease management. It is difficult to identify the rice leaves with different colors in different disease periods by RGB image and without aided eyes. Traditional equipment and methods are relatively inefficient in meeting the needs of current disease detection. The accurate and efficient detection the infected areas from hyperspectral images has become a primary concern in current research. However, current spectral target detection research pays less attention to the time and computing resources consumed by detection. A disease detection method based on random forest (RF) and adaptive coherence estimator (ACE) is proposed here. Firstly, based on the spectral differences between diseased and healthy leaves, 18 characteristic spectral wavelengths with the highest importance were selected by an RF algorithm, and the spectral images of those characteristic wavelengths were synthesized. Then, the ACE model was established for the disease recognition of full wavelength spectral images, characteristic wavelength spectral images, and RGB images. At the same time, three other familiar target detection methods were selected as the control experiments. The detection results showed a similarity between the detection performance of the four detection methods for full wavelength spectral image and characteristic wavelength spectral image. This detection performance was higher than that of the RGB image, indicating that characteristic wavelength spectral image can replace full wavelength spectral image for disease detection. The detection performance of the ACE algorithm was better than other algorithms. The detection accuracy of 18 characteristic wavelengths was 97.41%. Compared with the hyperspectral full wavelength image detection results, the accuracy decreased by 1.12%, and the detection time decreased by 2/3, which greatly reduced the detection time. Based on these results, the target detection method combining the RF algorithm and the ACE algorithm can effectively and accurately detect rice bacterial blight disease, which provides a new method for automatic detection of plant disease in the field.
1. Introduction
The detection of diseases in rice protection and breeding fields is of significant research value [1,2]. Given the growth of sensor technology and data acquisition technology, the identification of rice diseases has grown immensely. Bacterial blight, one of the three primary rice diseases, has occurred in all rice-planting regions in China, adversely affecting rice production. The disease has caused losses of 20–30% and 50–60% of the yield in several occurrences. In the most severe cases, the loss is so intense that there is no harvest, consequently posing a great threat to the country’s food security [3]. The rapid spreading of bacterial blight in rice and the distinct colors of the impacted areas makes it difficult to spot the disease using RGB images and unaided eyes. Presently, the technique that can accurately and effectively detect bacterial blight in rice does not exist. Further, in existing research, the reports on rice bacterial blight detection are rather few [4,5]. The key to taking effective control and preventive measures and achieving correct pesticide application lies in the accurate and real-time determination of distribution areas and the extent of rice bacterial blight damage [6,7]. The most commonly utilized technique for rice bacterial blight detection is the reliance on experienced farmers or plant protection experts for disease detection. This method requires human observation in the field to understand the degree of disease damage and distribution, which is laborious, time-consuming and challenging to carry out on a large scale. More notably, it is easy to misjudge because of the observer’s experience limitations [8]. There is therefore an urgency to develop new techniques that can overcome the challenges of traditional detection methods and efficiently and precisely diagnose rice bacterial blight.
Hyperspectral imaging technology is a new testing technology that is non-destructive and integrates traditional imaging technology and spectral technology. This technology records an image through every wavelength in the spectrum to show the spectral information of every spatial pixel, making up for technology’s limitations in imaging and traditional spectral analysis [9,10]. This study presents that hyperspectral imaging may obtain the research object’s spectral and spatial distribution information simultaneously and can fleetly and accurately carry out non-destructive detection of plant diseases. This fully shows the advantage of hyperspectral imaging technology [11,12]. Numerous scholars and experts have carried out meaningful research reports regarding how to fleetly and accurately detect plant diseases from hyperspectral images [13,14,15]. Remarkably, the high dimensionality of hyperspectral images brings a huge challenge to computational complexity, which is an urgent problem to be solved in detecting of plant diseases using hyperspectral images [16]. The characteristic spectral wavelength and characteristic index combined with the machine learning method are utilized to detect plant diseases [17]. Zheng et al. [18] used hyperspectral technology to gather the hyperspectral data of the wheat canopy at distinct stages of development. They screened out the sensitive spectral index of yellow rust at different stages of growth. The study showed that the three wavelengths’ photochemical reflection indices and anthocyanin reflection indices had excellent monitoring effects on yellow rust at the early-mid and mid-late growth stages. Yuan et al. [19] made use of the random forest algorithm to screen out the top 12 hyperspectral characteristic wavelengths that significantly affect the bacterial streak of rice. They carried out the detection of the bacterial streak and saw favorable detection outcomes. Huang et al. [20] implemented a technique involving monitoring the rice leaf roller disease based on hyperspectral data. The findings were that 38 leaf-level spectral indicators and 29 canopy-level spectral indicators were linked to the rice leaf roller disease. Guo et al. [21] developed a partial least squares regression prediction model through the spectral index, spectral ratio index, and normalized difference spectral index of hyperspectral images to inverse the disease index of winter wheat take-all and accurately monitor wheat take-all in a large region. Vincent et al. [22] utilized the ACE algorithm to recognize houses and vegetation in hyperspectral images of ground objects and achieved good outcomes. Zhao et al. [23] proposed an ensemble based constrained energy minimization (E-CEM) method to recognize targets in remote sensing hyperspectral images with strong nonlinearity and non-Gaussianity. The outcomes show that this method has higher detection accuracy and better robustness. Li et al. [24] suggested extended spectral angle mapping (ESAM) algorithm to detect citrus HLB disease, and compared its performance to those of the Mahalanobis distance method and K-means algorithm. The results show that the ESAM algorithm performs better.
Most current studies focus on the correlation of spectral parameters constructed by varied crop diseases and other band algebraic combinations. To identify rice diseases, they cannot fully use the spectral differences between hyperspectral images of rice leaf disease regions and healthy regions. They also do not consider the computational time and resources consumed in detection. This paper proposes a hyperspectral disease detection technique that combines a random forest algorithm and adaptive coherence estimator, using the spectral differences of distinct disease spots to identify diseases. Using the hyperspectral image of rice leaves infected with bacterial blight as the research object, the full-optical spectral wavelength hyperspectral image, the characteristic wavelength hyperspectral image selected based on the RF algorithm (starting now referred to as the characteristic wavelength spectral image), and the RGB wavelength spectral image were constructed to compare the effects of the spectral information contained in different spectral wavelengths on the detection performance of bacterial blight, which will provide a time-saving and efficient method for the detection of plant disease in the field.
2. Materials and Methods
2.1. Test Material
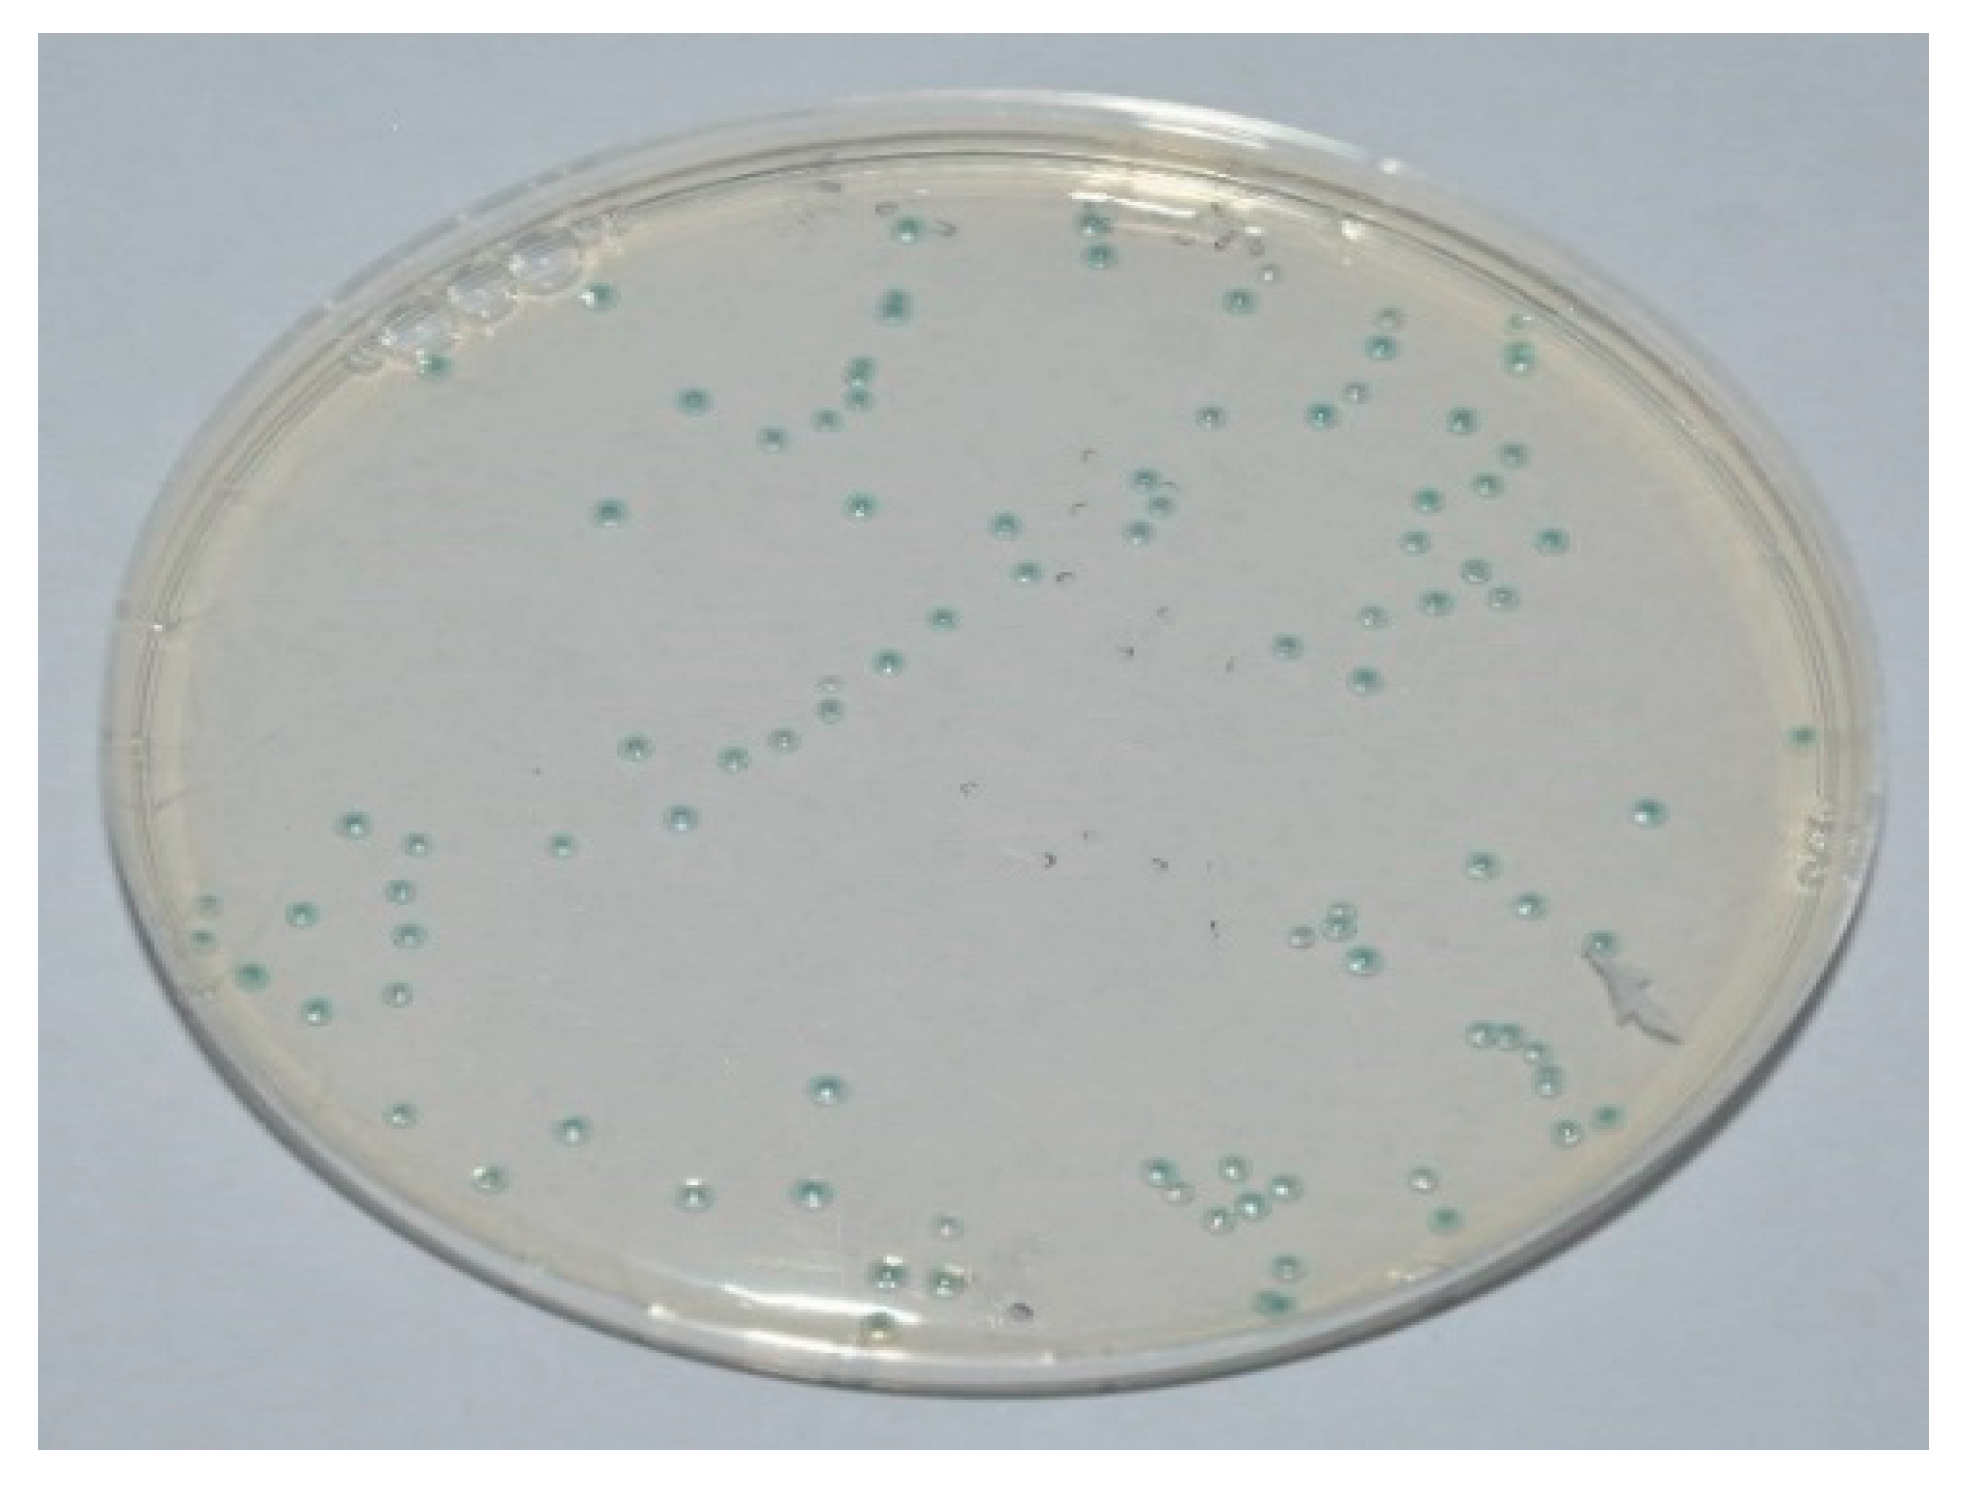
In this experiment, rice variety Nanjing 9108 was used (Nanjing, China). It was rated a super rice variety by the Ministry of Agriculture in 2015. Whole seeds were picked, soaked, and germinated before being planted and sown in the College of Plant Protection of Nanjing Agricultural University greenhouse on 17 August 2020. Each cup containing 3–5 seeds was implanted evenly. There were a total of 100 cups managed in a similar environment. After germination, rice is transported outdoors and grown under natural conditions. The strain of bacterial blight selected in the test was provided by the Institute of Plant Protection, Jiangsu Academy of Agricultural Sciences, a highly pathogenic Xanthomonas strain. The cultivation diagram of the bacterial blight pathogen is demonstrated in Figure 1.
After the rice seedlings grew the fifth leaf, they were injected with bacterial blight. Whilst being injected, the leaves of the rice plants with similar plant height were selected for treatment. The leaf-cutting technique for inoculation was assumed; scissors dipped in the bacterial solution were used to cut the top of healthy rice leaves by around 1 cm and managed them usually until the appearance of disease symptoms.
2.2. Hyperspectral Imaging System
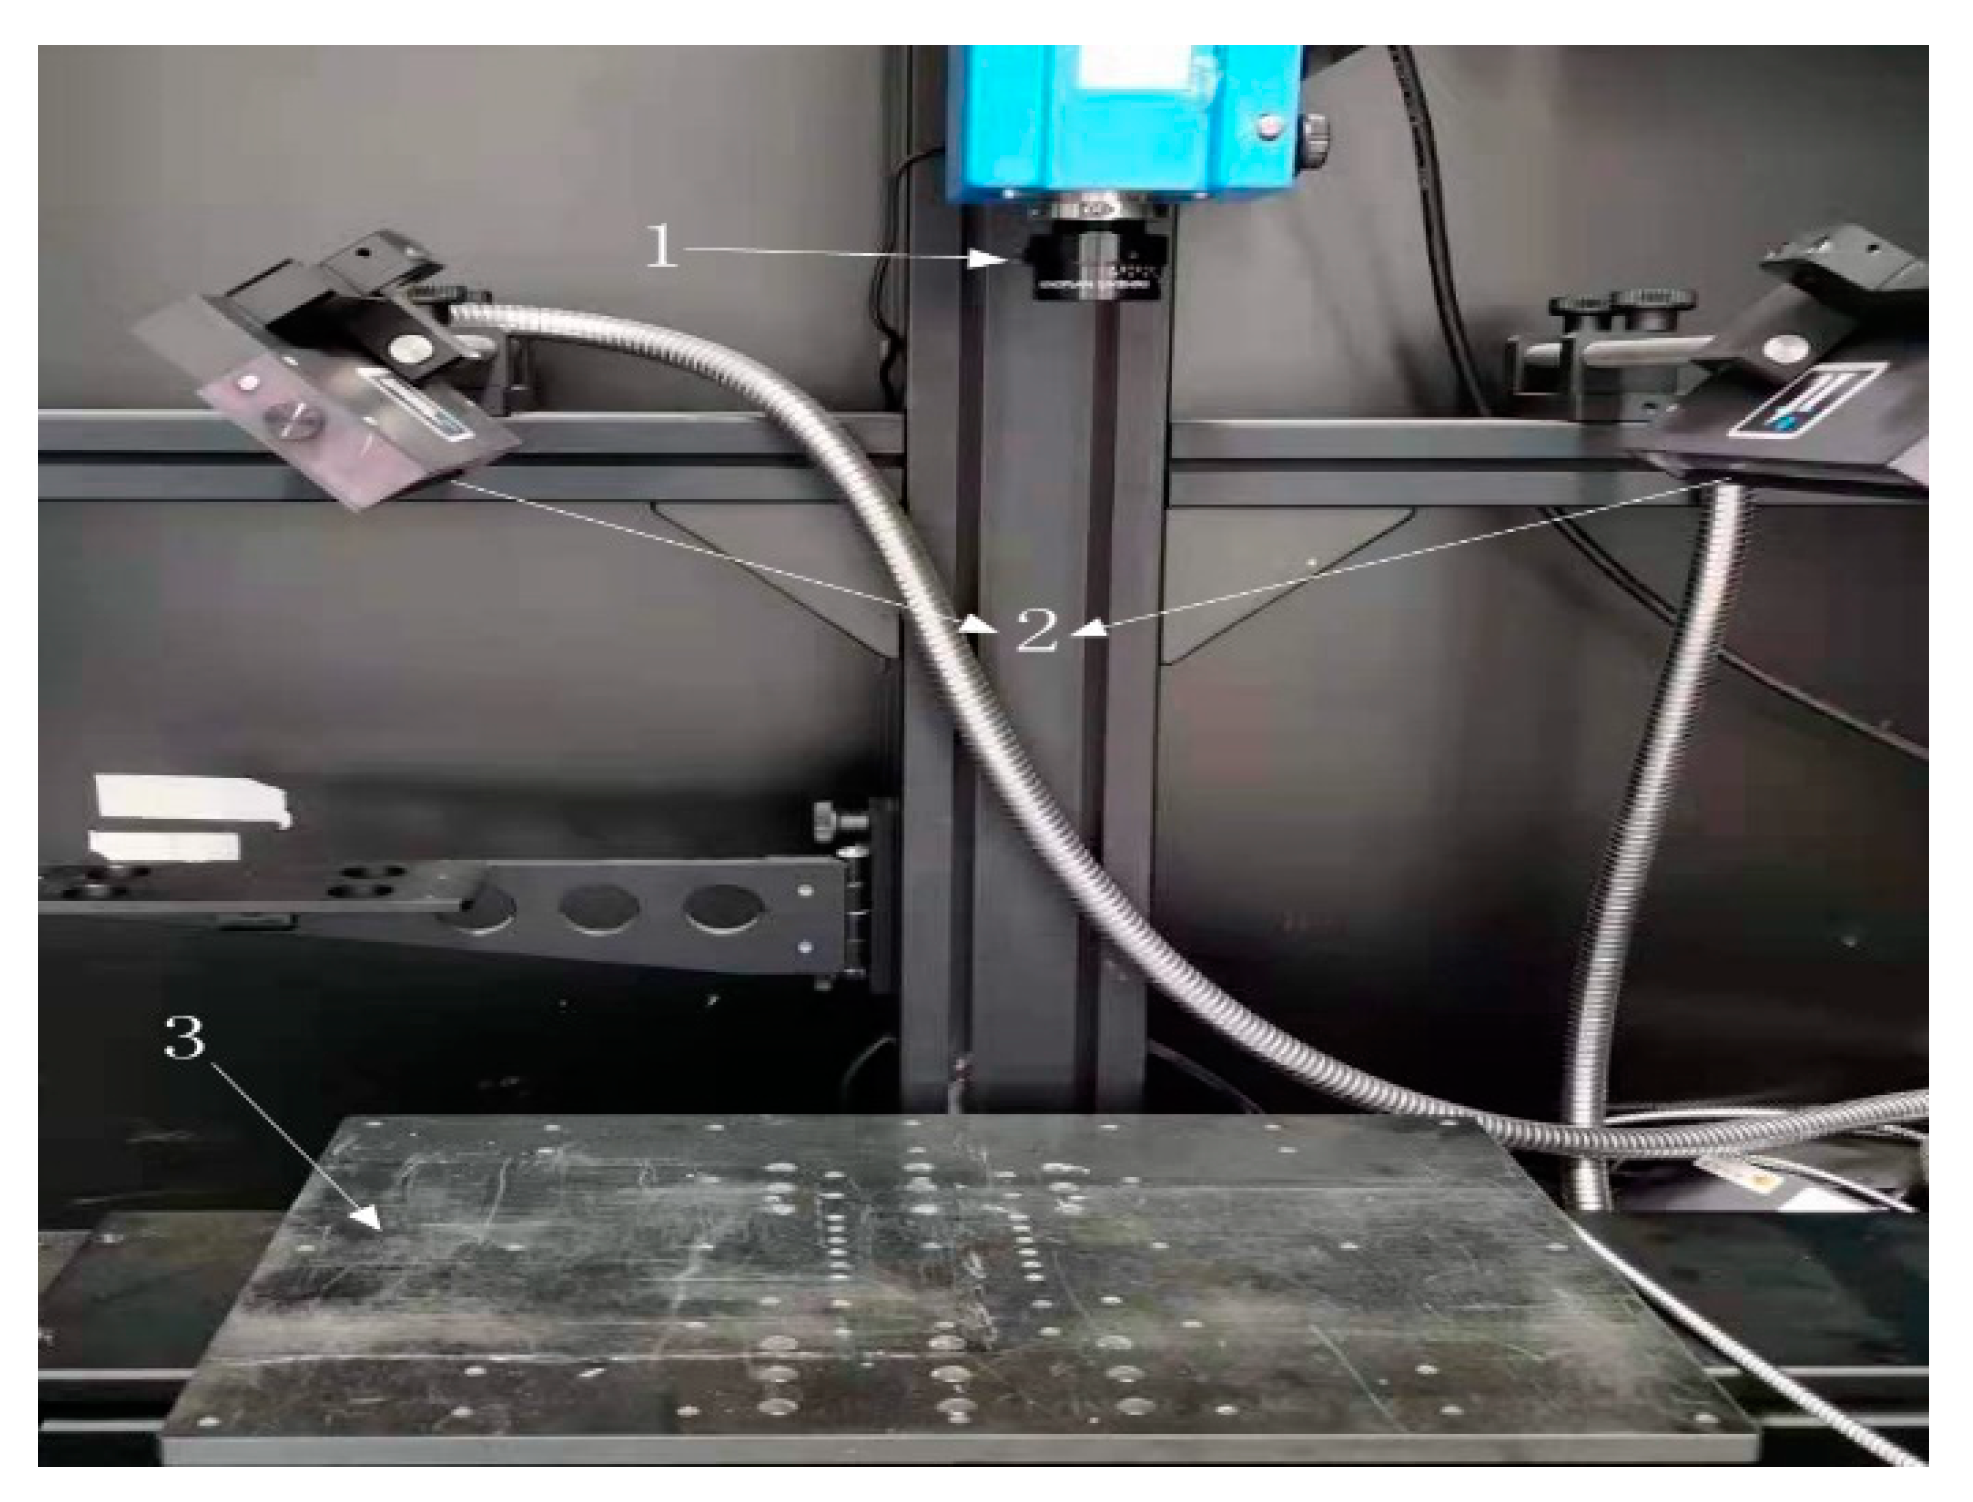
The push-broom hyperspectral imaging system (HSI-VNIR-0001, Shanghai ISUZU Optics Co., Ltd., Shanghai, China) used in this test is shown in Figure 2. The acquisition software consists of the spectral image imaging software and HSI Analyzer software. The spectral wavelength range of rice leaves collected by this hyperspectral system is 378~1033 nm, with a total of 306 wavelengths. 35 mm imaging lens is selected, the object distance is 27 cm, and the light source value is 100 lx.
2.3. Hyperspectral Data Acquisition and Correction
The bacterial blight incubation period was 3 days, and the outbreak period was 3–7 days. Bacterial blight spreads rapidly. Since the rice leaves were thin strips, hyperspectral image acquisition was carried out on the 7th day after inoculation to take a complete picture of all leaves. All the leaves of the spectrum to be measured were cut from the rice plant, and 6–8 isolated rice leaf samples were placed on a linear translation table for imaging. A total of 200 hyperspectral images of rice disease leaves were gathered.
To decrease the impact of noise information on the quality of hyperspectral curves and enhance the accuracy and stability of qualitative analysis models of spectral curves, black-and-white correction was performed for hyperspectral curves [16], and the image correction formula is as follows (1):
where:
- —the relative reflectance of the corrected image;
- —reflectivity of the original image of the test spectrum;
- —bright current spectral reflectance after whiteboard correction;
- —dark current spectral reflectance after blackboard correction.
2.4. Data Analysis and Processing Methods
The test platform was Windows 10 operating system of 16 GB RAM, 256 GB SSD, 1TBHD, Intel Quadcore i7-8700, 4.2 GHz. Python 3.7 (Vilmington, DE, USA), Matlab 7.1 (Natick, MA, USA) and scikit-learn 2.2 were used to implement the algorithm, and the hyperspectral image processing was completed on the HSI Analyzer and Envi 5.3 software platform (Boulder, CO, USA).
2.4.1. Spectral Image Preprocessing
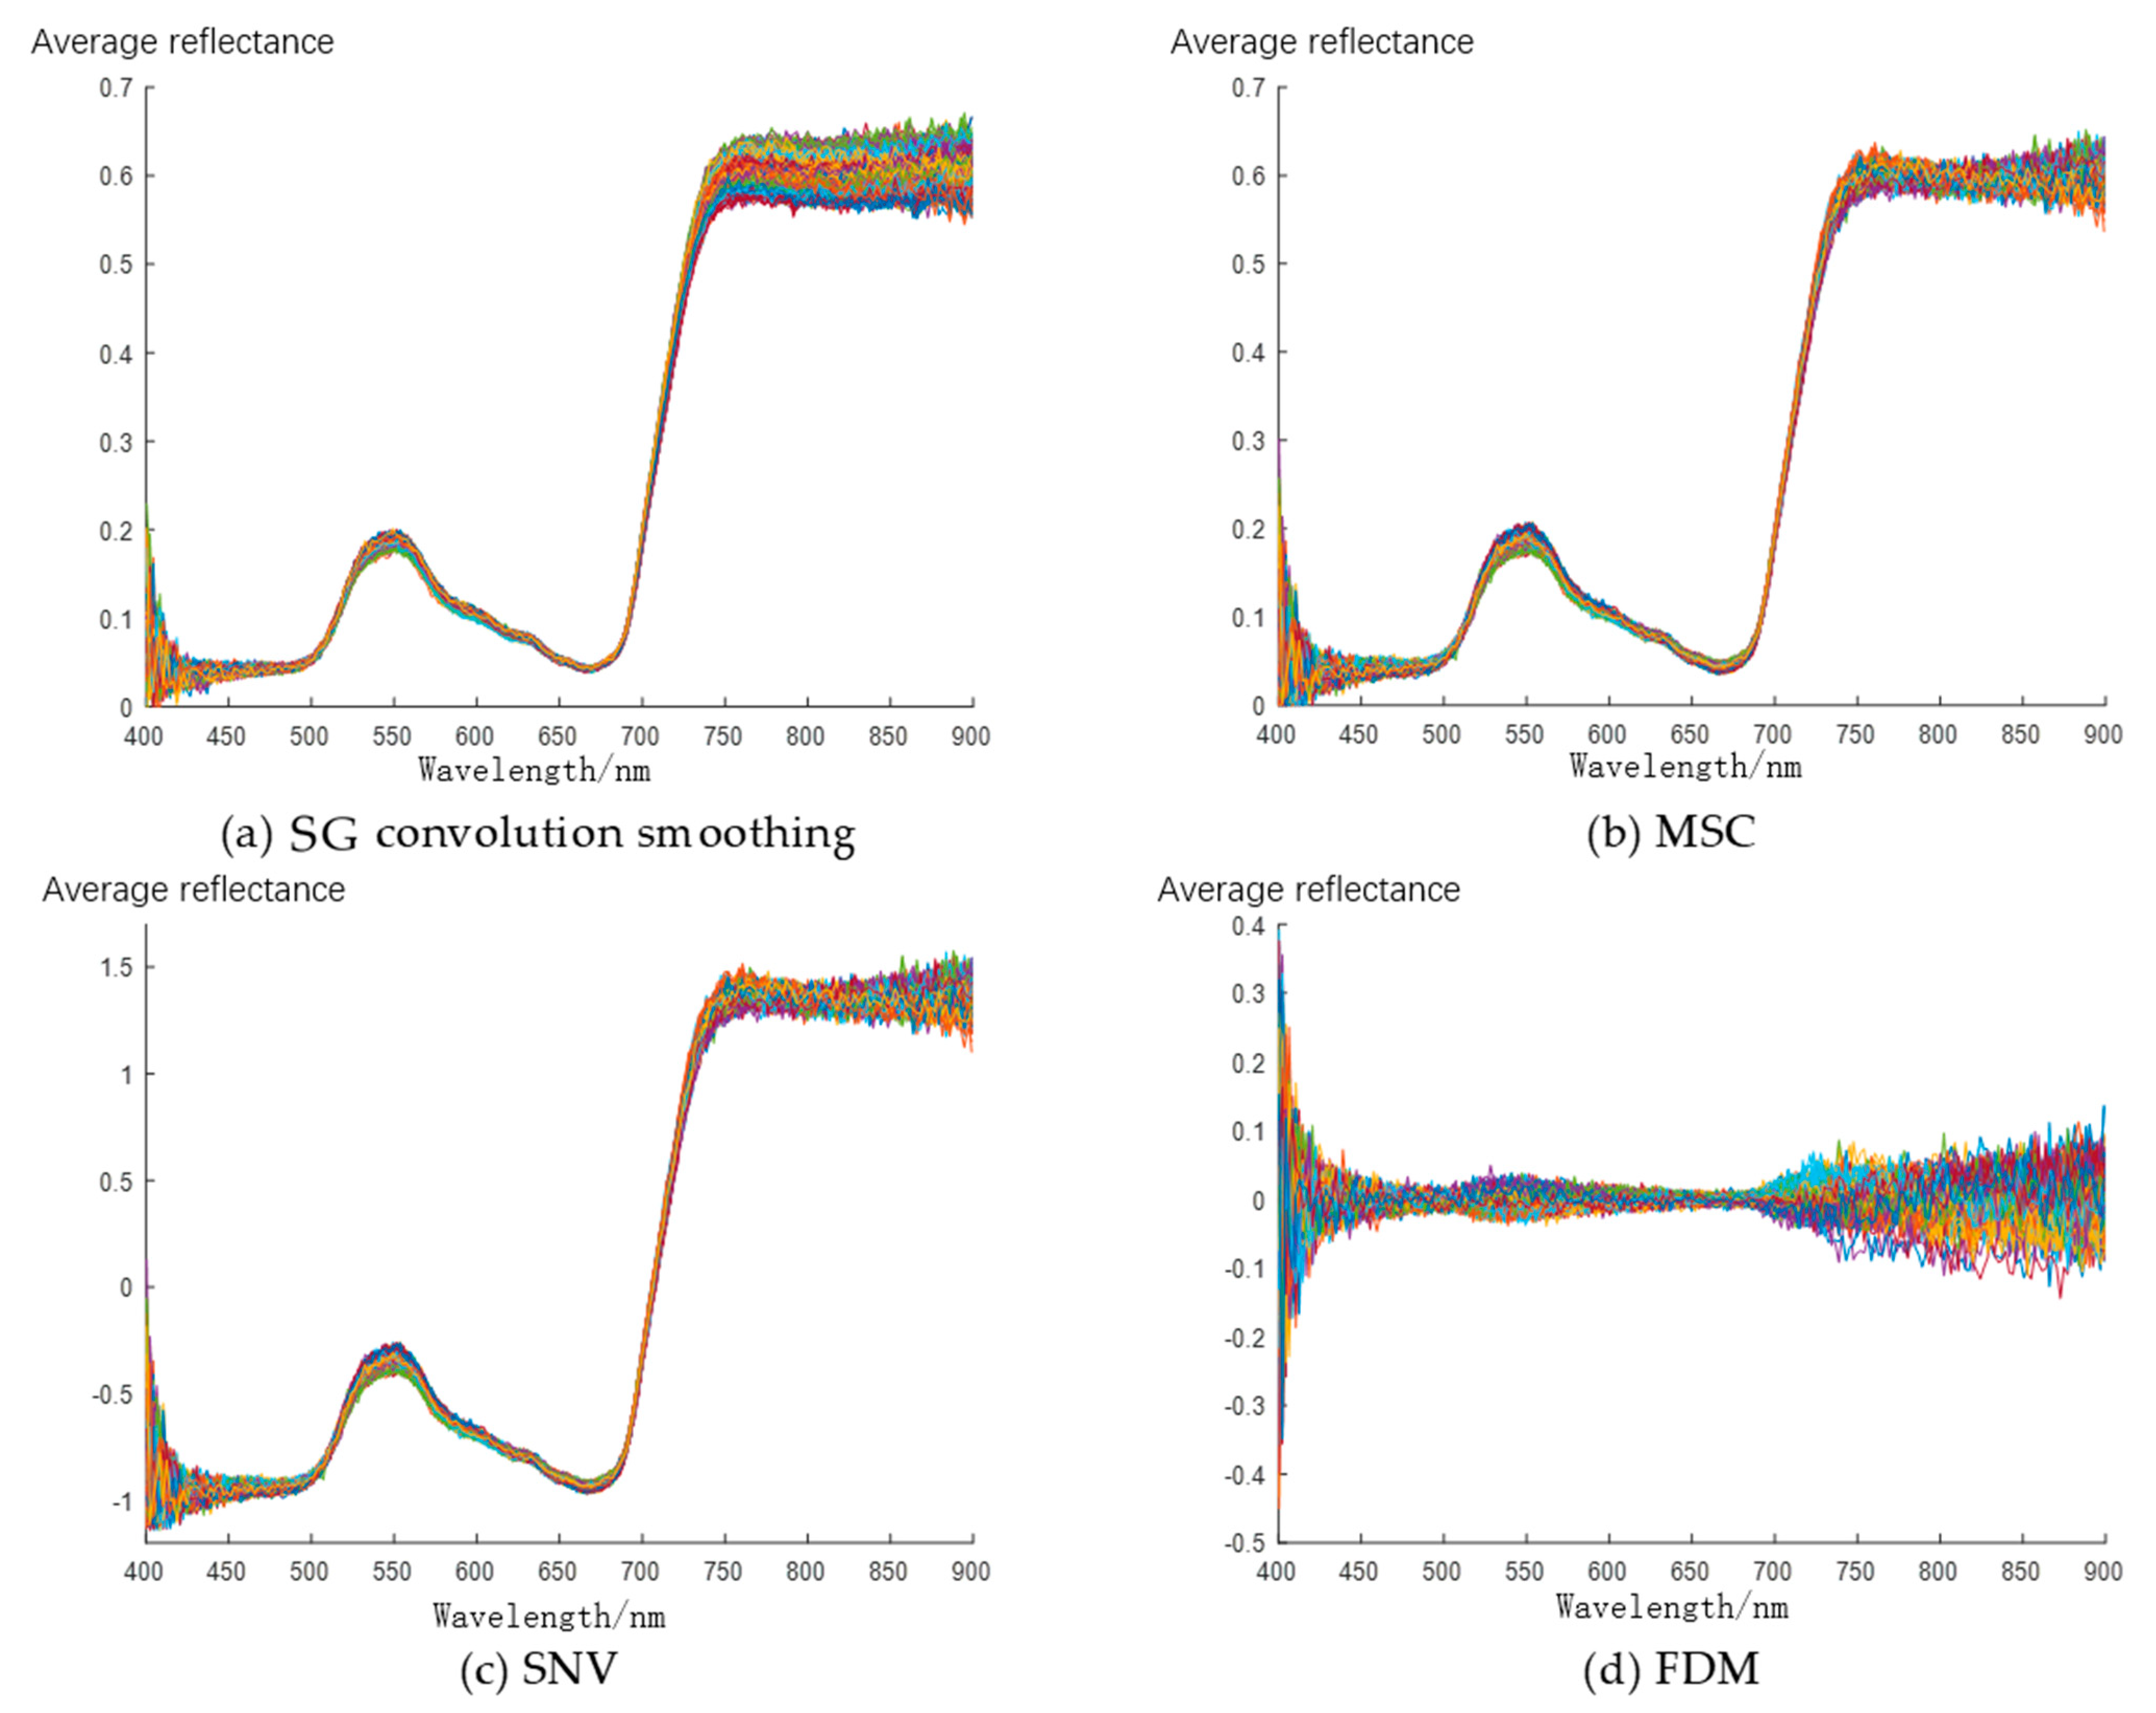
Four preprocessing methods were chosen for this experiment, including SG convolution smoothing [10], multiple scattering sorrection (MSC) [14], standard normal variate (SNV) transformation [15], and first derivative method (FDM) [17].
Figure 3 shows the preprocessing results of the 400~900 nm wavelength spectrum by the above methods. The spectral curve after SG convolution smoothing is shown in Figure 3a. The smoothed spectral curve becomes smooth. After 760 nm, the reflectivity difference between spectral curves was widened, and the curves were not concentrated. The spectral curve after MSC processing is shown in Figure 3b, and the reflectivity remained in the range of 0~0.6, with concentrated curves and obvious contours. The spectral curve after SNV treatment is shown in Figure 3c and was smooth and concentrated. However, the spectral reflectance was expanded to −1.5~1.5, which was beyond the range of 0~0.6 of the original spectral curve inconsistent with the actual situation. The spectral curve processed by the first derivative method was shown in Figure 3d. After smoothing, not only was the trend of the original spectral curve changed, but also the range of spectral reflectance was altered, which was inconsistent with the actual situation.
By comparing the results of the above four methods to preprocess the spectral curve of rice leaves, it can be seen that MSC preprocessing was the best. Therefore, this paper used MSC to pre-process the hyperspectral image of rice leaves.
2.4.2. Preparing of Spectral Image Data Set
The biggest problem in hyperspectral image analysis was extracting practical information from spectral images and reducing the consumption of computing time and resources. Thus, for not losing the effective characteristic wavelength spectral information, it was indispensable to compress the amount of data through dimensionality reduction to reduce the cost of subsequent processing [25].
To determine the most favorable detection model, MSC was utilized to preprocess the hyperspectral images of 200 diseased leaves. On this basis, three spectral image data sets with distinct wavelengths were prepared:
- (1)
- Full wavelength spectral image
Given the existence of systematic errors, there was great noise at both ends of the sample spectral curve and the overlapping of spectral segments. Too many dimensions resulted in the surge of analysis time. Hence, the hyperspectral data with a total of 234 wavelengths between 400–900 nm were chosen as the full wavelength spectral image data set during spectral analysis.
- (2)
- Characteristic wavelength spectral image
Hyperspectral data was in a high-dimensional space. Its wavelengths each can be viewed as a feature. Consequently, hyperspectral image characteristic selection equals wavelength selection, which selected the dominant subset of wavelengths from all other wavelengths. This paper utilized the RF algorithm to choose characteristic wavelengths. This technique’s basic idea was to rearrange the order of every characteristic wavelength that consists of a random forest according to its significant score and compare the effects of varied characteristic wavelengths on the accuracy of model prediction. Characteristic wavelengths with great significance hugely impacted the accuracy of model prediction [17]. The importance of a characteristic wavelength X in a random forest was calculated as follows:
- Step 1: for each decision tree in the random forest, use the corresponding out-of-bag (OOB) data to calculate its OOB error, which was recorded as .
- Step 2: randomly add noise interference to the characteristic wavelength X of all OOB samples (you may randomly change the value of the sample at the characteristic wavelength X), and calculate its OOB error again, recorded as .
- Step 3: suppose there are trees in the random forest, then for the importance of feature , , if the accuracy of the OBB decreases significantly after adding noise to a certain characteristic wavelength , it shows that this feature has a great impact on the classification results of samples, that is to say, its importance is relatively high.
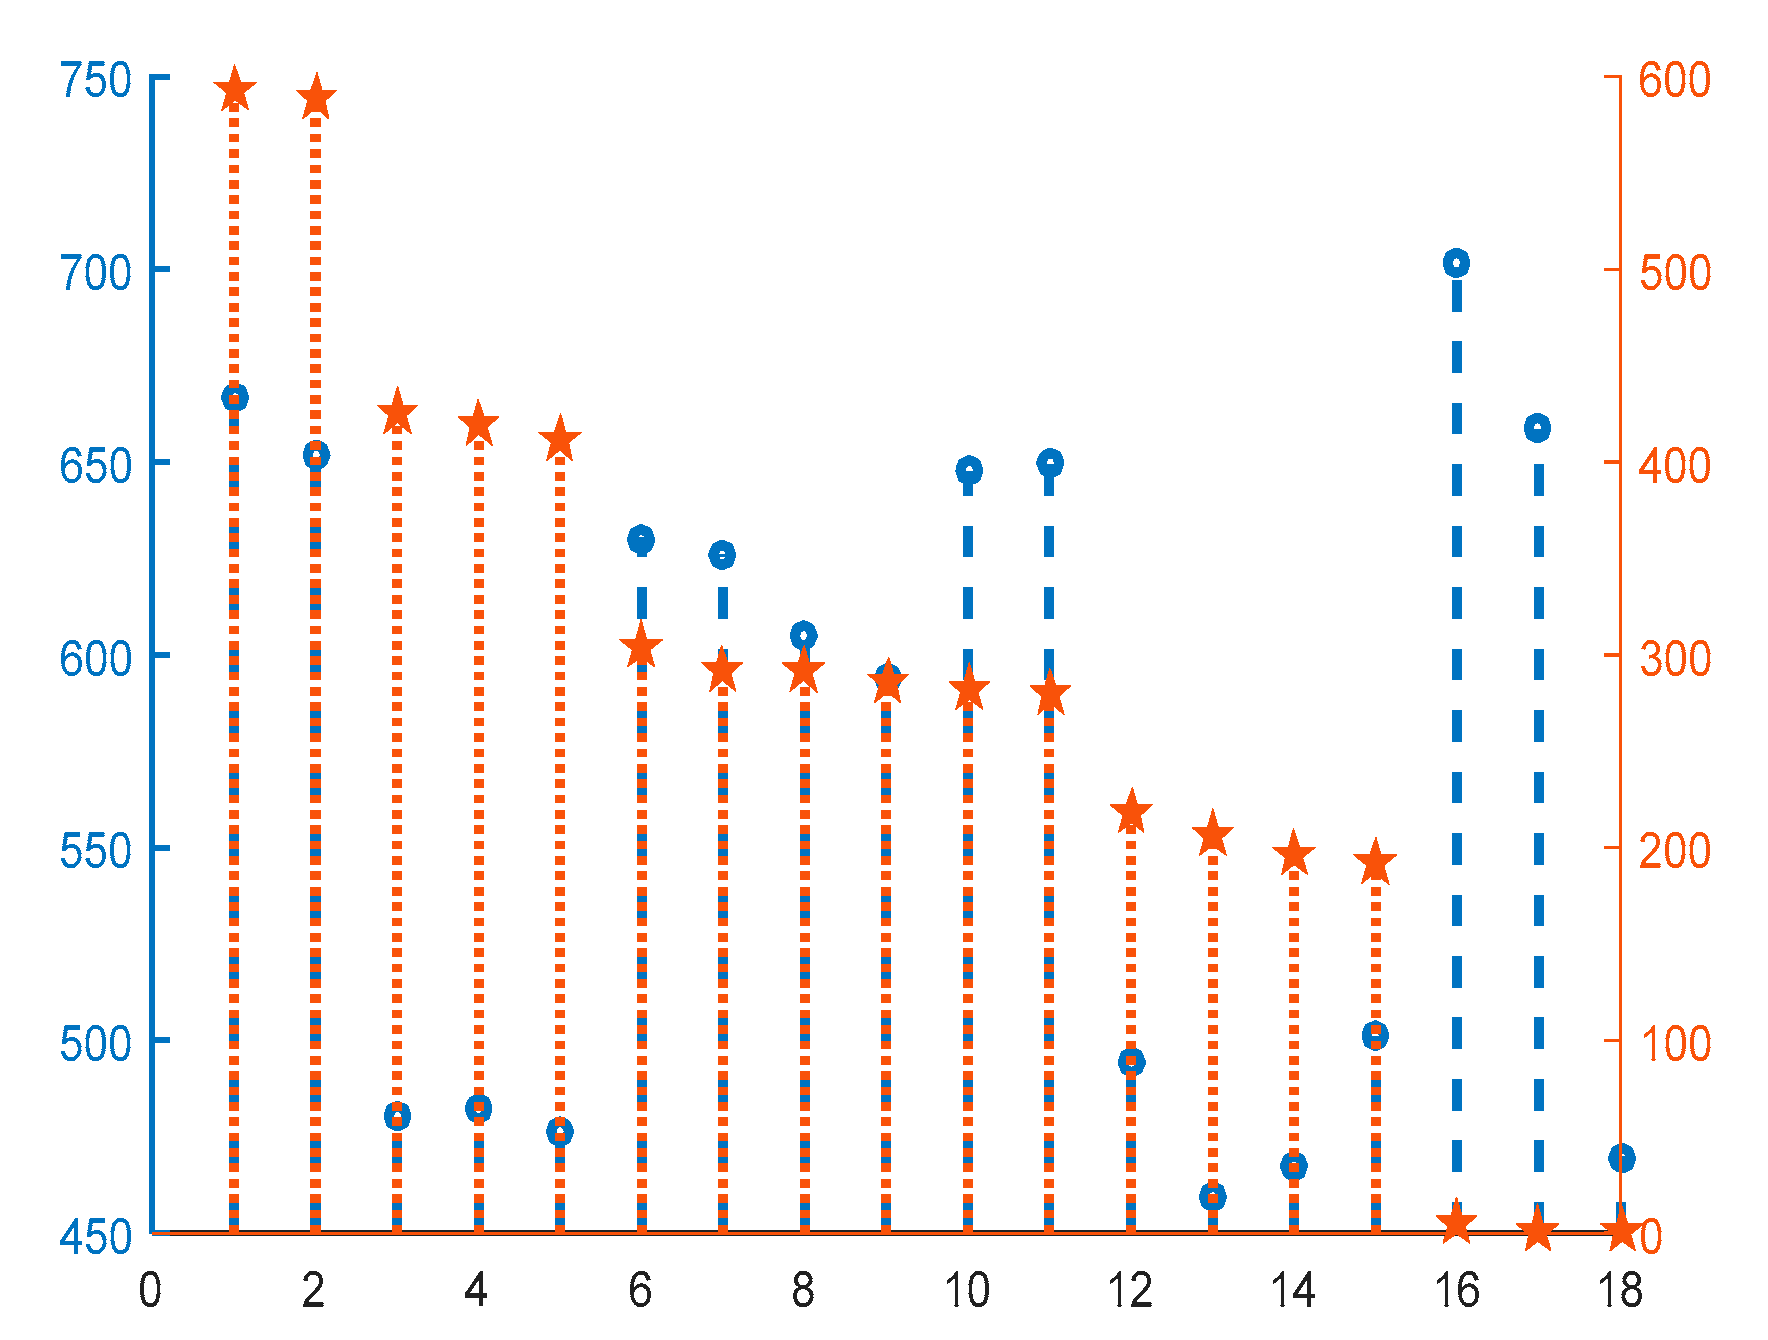
The initial spectral image size is 1280 × 1024 × 306, select 18 characteristic wavelengths with the highest importance, and the size became 1280 × 1024 × 18 spectral image subset. This not only significantly reduced the data dimension, but also retained the spectral information with strong importance. As shown in Figure 4, the diagram of characteristic wavelengths was shown. The abscissa was the order of band importance, the left ordinate was the wavelength (nm) of rice leaf spectrum, and the right ordinate was the importance score expanded by 5000 times.
- (3)
- RGB image
Hyperspectral images consist of essential spectral information. To better differentiate the disease spot region and the healthy area, the average spectra of the two areas of interest were contrasted, and the three wavelengths with the greatest difference in the red, green and blue edge ranges were obtained respectively. They were then synthesized into RGB images and made into the RGB image data set to be detected in this study.
2.4.3. Target Detection Algorithm
This part introduced four frequently used target detection algorithms that could be divided into geometric and statistical models according to the algorithm model. The ACE highlighted in this paper was an algorithm for statistical description of background patterns, which had accrued immeasurable attention because of its good target detection performance. In invariable or partially uniform environments, the ACE detector was equivalent to the generalized likelihood ratio test (GLRT).
Additionally, the three most common hyperspectral target detection algorithms were chosen to differentiate their performance with the ACE algorithm. They included constrained energy minimization (CEM) [23], orthogonal subspace projection (OSP) [26], and spectral angle mapper (SAM) [24]. CEM was homogeneous to ACE, which also statistically traced the background pattern. Moreover, two algorithms, OSP and SAM, were selected for the geometric description of the background.
The ACE is obtained from the GLRT algorithm with characteristics of constant false alarm rate (CFAR) [27]. The background covariance of the algorithm is well known and can be expressed as Formula (2):
where:
- —spectral similarity measurement;
- —target spectral matrix;
- —transpose of target spectral matrix;
- —spectral matrix of the pixel to be evaluated;
- —background covariance matrix.
In Formula (2), the ACE algorithm gauges the detection statistics in varied manners, obtaining greater severance between the target and the background. Furthermore, ACE allows for the setting of a PFA. In prior research, the ACE algorithm offers the ultimate performance when compared to other algorithms [28].
The CEM algorithm is a filter with restricted impulse response. It can divide the target and minimize the output energy produced by the background, except for the target, meaning that a filter vector is determined via hyperspectral image data and that the formerly known target and the perceived outcome can be achieved through passing the image through the filter vector. The role of the filter vector is to filter out the nontarget pixels in the image so that the target of interest can easily pass through and suppress the filter output energy presented by other signals simultaneously. Formula (3) delineates the CEM algorithm. The covariance of the correlation matric is used to distinguish the contents of the unknown background.
OSP algorithm first designs an OSP projector to filter the non targets in the response pixels. It then uses the matched filter to find the match of the desired targets in the data. The OSP algorithm may be expressed by Formula (4).
where:
- —orthogonal subspace;
- —number of wavelengths;
- —non- target spectral matrix;
- —pseudo inverse matrix of .
The OSP algorithm is an algorithm that uses structured background model to characterize spectral variability.
The SAM algorithm influences the algorithm of two spectral similarities by calculating the angle between two vectors: the target spectral vector and the pixel spectral vector to be detected. If the similarity becomes higher than the threshold, it is the target vector. Otherwise, it is not the target vector. Any pixel in the HIS has a two-dimensional vector equivalent to the number of bands in the HIS. The SAM algorithm expression is shown in Formula (5):
SAM algorithm has both low computational complexity and computational cost, and does not need any statistical information on site.
2.4.4. Performance Index of Target Detection Algorithm
The performance evaluation formula of the target detection algorithm contains numerous indicators like confusion matrix and ROC curve. In this paper, disease pixels were interpreted as positive cases and healthy pixels as negative cases. was the number of samples that were disease pixels and are divided into disease pixels by the classifier; was the number of samples that were healthy pixels but divided into disease pixels by the classifier; was the number of samples that were disease pixels but classified as healthy pixels by the classifier; was the number of samples that were healthy pixels and divided into healthy pixels by the classifier. The performance indicators of the four detection algorithms can thus be defined as follows:
Precision (P) refers to the proportion of the number of correct samples in the actual number of input samples.
Recall (R) refers to the proportion of positive samples that are predicted to be positive.
P and R fluctuate: If P is high, R will decline. To give consideration to P and R, is derived.
The comprehensive evaluation index (F1-measure) is the harmonic average of P and R. When the predicted samples are all positive, there are no true negatives and false negatives. If there are many false positives, the R is high, and the P is low. On the contrary, when the prediction is negative, and only one is positive, the P is high, and the R is poor. Therefore, the P and R simultaneously for the problem of uneven sample numbers should be considered
Accuracy () refers to the proportion of the number of samples () with correct model classification to the number of all samples. Generally, the higher the , the better the performance of the detection algorithm.
Based on the above formulae for target detection evaluation indicators, the P, R, and of the detection can be calculated.
3. Results and Discussion
3.1. Spectral Reflectance Analysis
The 18 spectral wavelengths with the highest importance were selected by the RF algorithm. The specific ranking of wavelength importance scores is shown in Table 1.
3.2. Test Performance Analysis
The four aforementioned target detection algorithms were utilized to detect disease spots in three distinct spectral images: full hyperspectral wavelength, characteristic wavelength spectral, and RGB image. The detection performance indicators were depicted in Table 2. From this table, it can be seen that the four detection algorithms contain the best detection performance for full wavelength spectral images. The ACE algorithm’s P was 95.11%, the R was 97.22%, the F1 was 96.15%, and the A was 96.11%. The CEM algorithm’s performance index was lower than the ACE algorithm’s. On the other hand, CEM’s detection time was more than that of the ACE algorithm. This showed that ACE was more fitting for hyperspectral target detection compared with CEM in the detection algorithm of statistical description of background patterns. SAM and OSP algorithms for the geometric description of the background were both lower in detection time compared with algorithms for the statistical description of the background. However, their detection performance was also lower than the background’s statistical report. Notably, the detection time of the SAM algorithm was the shortest, around 1/2 of the detection time of the former algorithm. Nevertheless, every detection performance indicator had significantly lessened, equivalent to approximately 2/3 of the precursory algorithm, and was consistent with the detection outcomes of literature [26].
For the detection performance of the RF characteristic wavelength spectral image, the RF algorithm was used to screen the characteristic wavelengths of the hyperspectral image of the rice leaves, and the number of wavelengths used for detection is reduced from 234 to 18, a great decrease in the number of wavelengths and the calculation amount. As Table 2 shows, the A of the ACE algorithm was 97.41%, R was 94.24%, F1 was 95.86%, and P was 94.25% using the image detection results of 18 characteristic wavelengths screened based on the RF algorithm. Compared with the hyperspectral full wavelength image detection results, P and A decreased by 0.92% and 1.12% and R and F1 increased by 0.09% and 0.49%, respectively. Although A was reduced, the model structure was more compact, the computational complexity was reduced, and the model accuracy could be basically maintained while the detection time was cut by half. The results showed that the characteristic wavelength spectral image can be a better alternative to the full wavelength spectral image for target detection, which can detect rice bacterial blight in a more efficient way.
Although the RGB image only had three wavelengths, which can greatly reduce the number of wavelengths and the amount of calculation, the detection effect based on RGB image was also greatly reduced. By comparing the detection results and corresponding detection time of three image datasets with different algorithms, it can be found that the combination of RF algorithm and ACE algorithm can accurately and efficiently detect rice leaf bacterial blight.
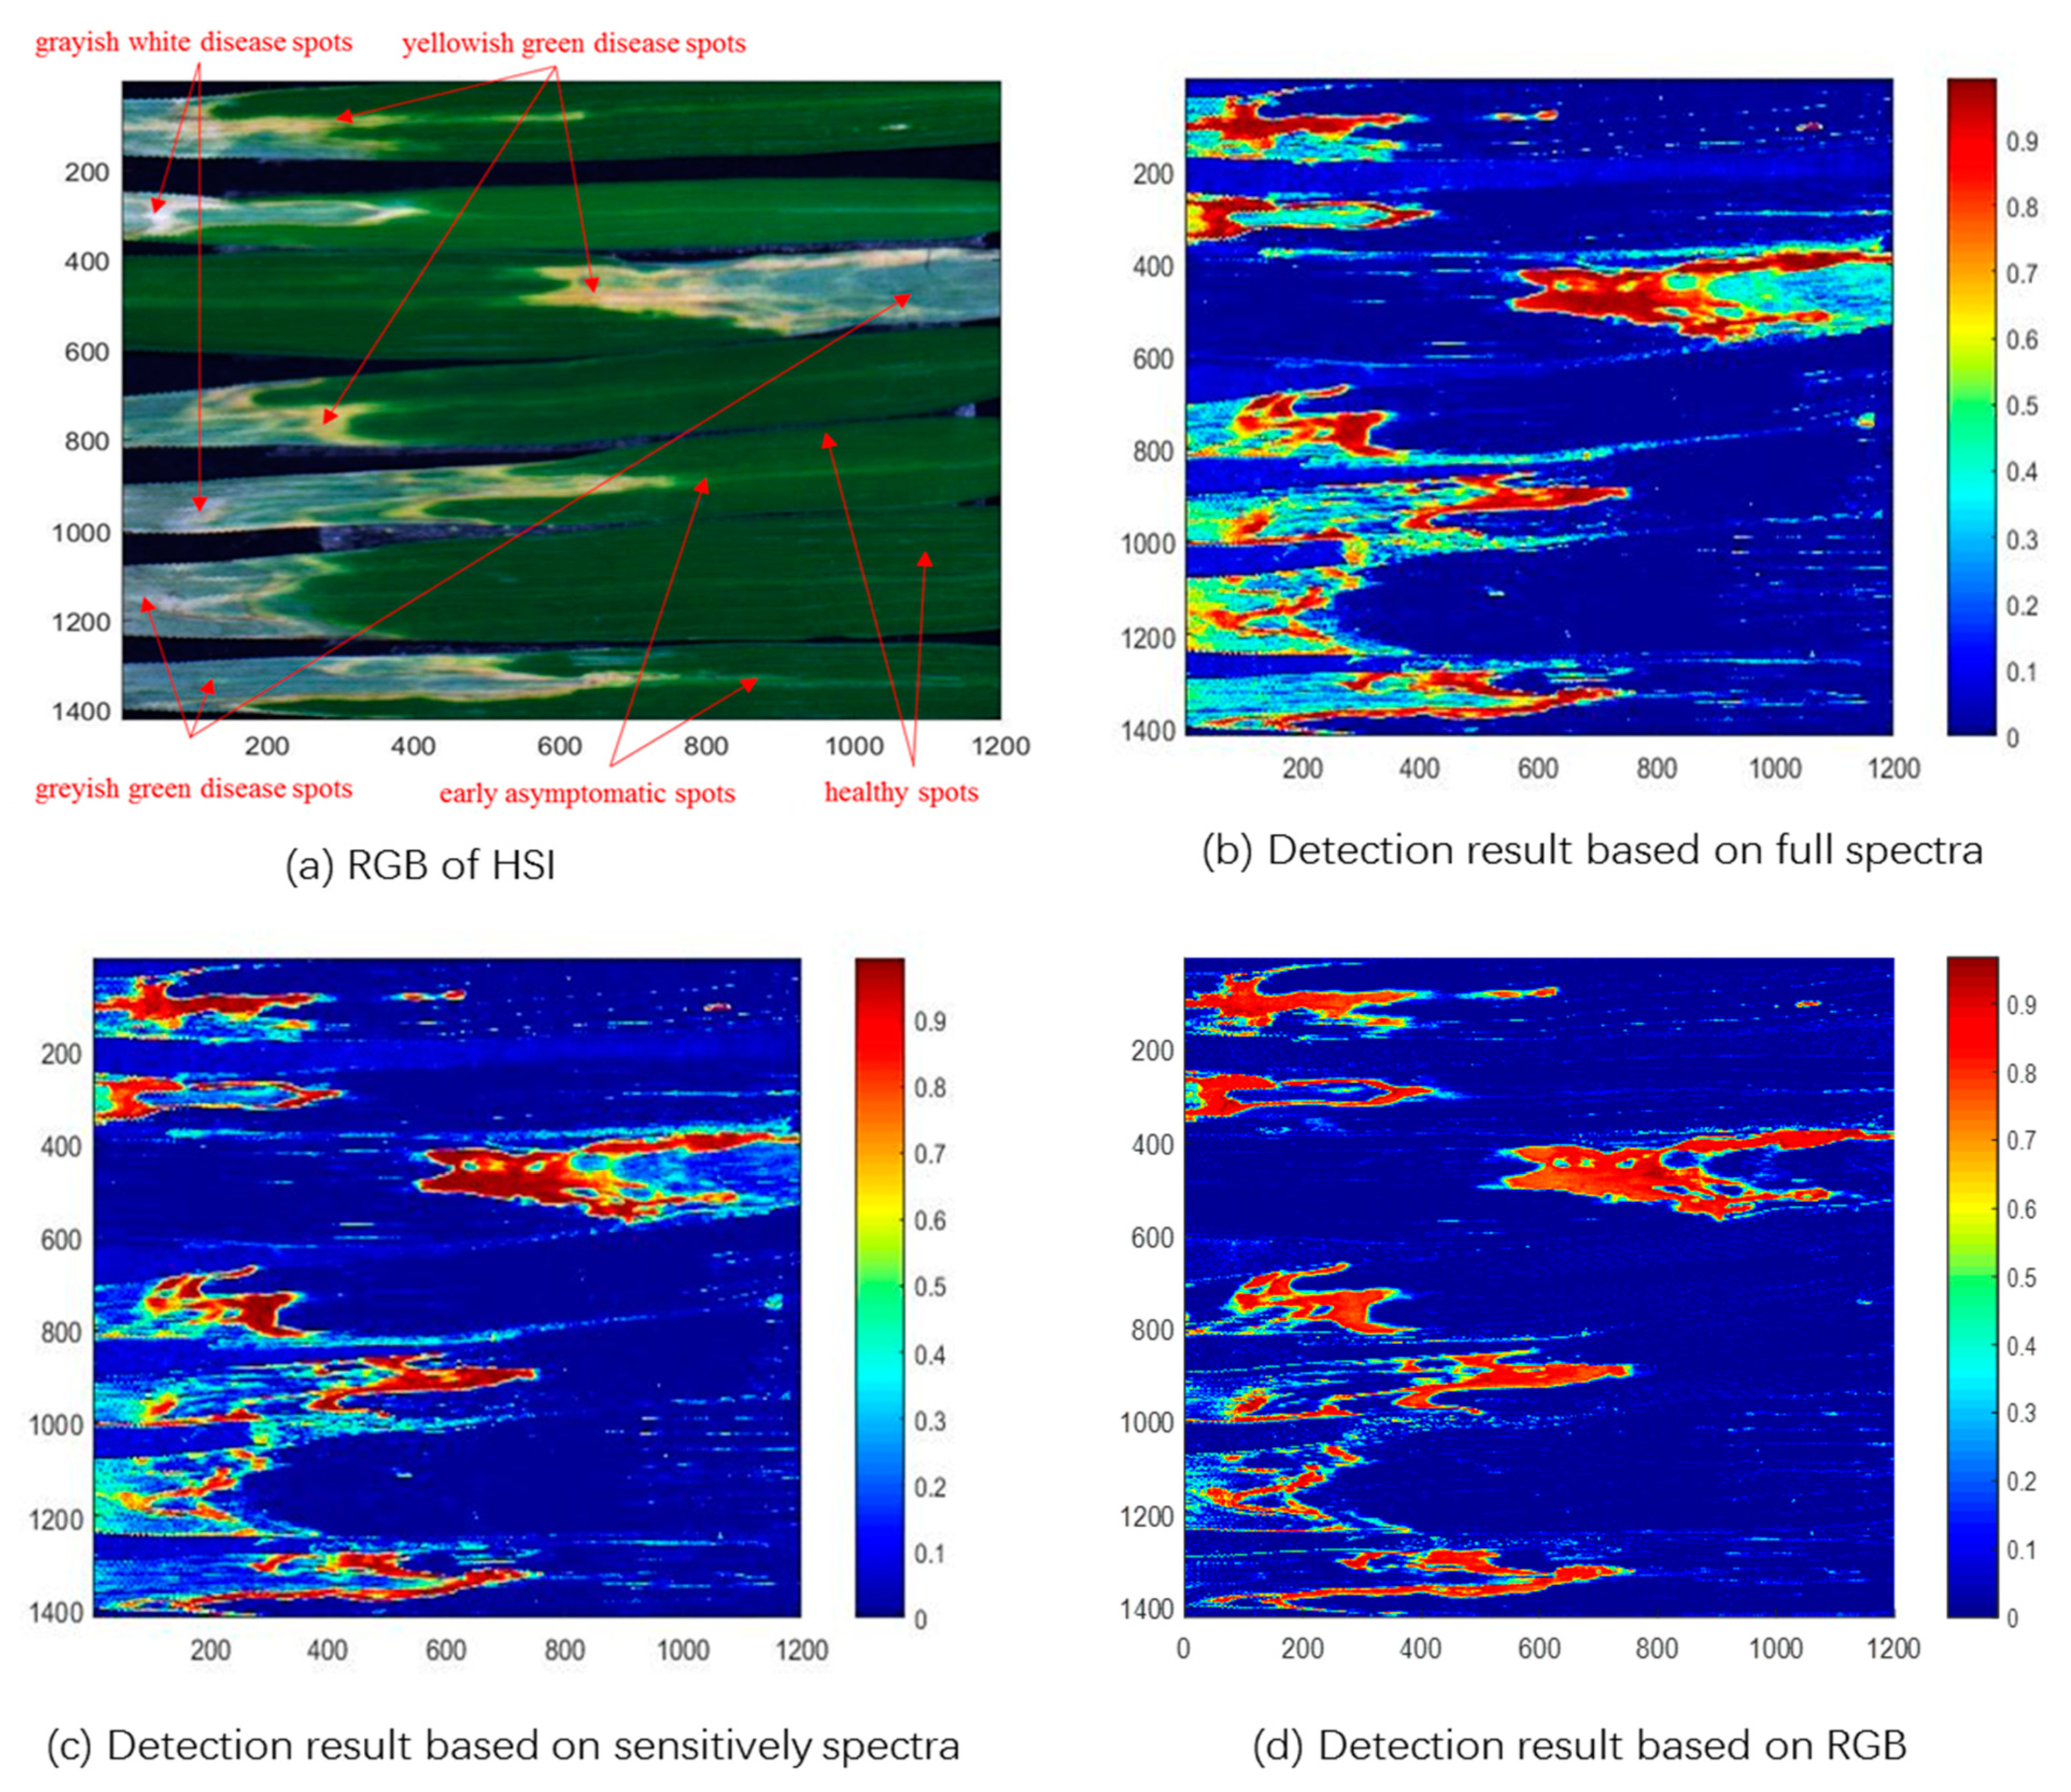
3.3. Visualization Effect of Rice Bacterial Blight Detection
To compare the ACE detection algorithm more intuitively, the detection effect of images with different wavelengths was visualized as shown in Figure 5. From the primordial HIS image of diseased leaves depicted in Figure 5a, it is evident that bacterial blight spreads along the vascular bundles of rice leaves and causes changes in the color of the leaves. In Figure 5b–d, the dark blue regions were healthy, and the rest were diseased. The redder the color, the deeper the degree of infection was. By contrasting the detection outcomes of three spectral images with distinct wavelengths, it was clear that for full spectral wavelength images, the spectral information contained was the most complete. The ACE algorithm can detect all spots of the disease, especially grayish-white and grayish-green disease spots. The effect of recognition was significantly better than spectral images based on characteristic wavelengths and RGB images. For the characteristic wavelength images screened by RF algorithm, the recognition effect of yellowish green disease spots was similar, but the recognition effect of grayish green disease spots was poor. RF only extracts the spectral information of rice leaves, which essentially weakens the background information of shading, compared with the full wavelength images. For the RGB wavelength images, only yellowish green spots with great color distinctions can be seen since they contain less spectral information.
It is especially worth noting that the detection of early asymptomatic lesions of rice leaf blight is particularly important for disease prediction and early warning. Figure 5a shows that bacterial blight spreads from the artificially inoculated wound to the bottom of the leaves. When the amount of bacteria is not enough to make the leaves have obvious color changes, we can find that there are early asymptomatic lesions by spectrum. By comparing the detection effect diagram in Figure 5b–d, it can be found that for the detection of asymptomatic areas, the detection effect based on the full spectrum and the sensitive wavelength spectrum is due to the detection effect based on RGB. Therefore, we can say that the early asymptomatic disease of bacterial blight in rice can be detected based on hyperspectral imaging.
3.4. Discussion
Our results show that hyperspectral imaging technology is better than RGB imaging in detecting bacterial blight in rice, especially for early asymptomatic lesions that cannot be detected by RGB imaging technology. Previous studies have shown that there is redundancy in the raw hyperspectral spectra, leading to increased computational complexity [24]. Therefore, feature extraction is necessary. In this study, RF can extract sensitive feature bands from raw hyperspectral data, which is the same as the results of Cao et al. [17]. The characteristic wavelength spectral image extracted based on the RF algorithm removes valuable information for disease feature recognition and eliminates redundant wavelengths. While guaranteeing high recognition accuracy, the number of wavelengths was ably decreased and the computational complexity and time were greatly reduced. Even though the RGB image contained only three wavelengths, which minimized the number of wavelengths, the detection accuracy was the lowest because the three wavelengths can provide less spectral information.
We found that the healthy, asymptomatic, and symptomatic pixels of rice leaves are sensitive to different wavelengths. According to Kaitlin [9], the invasion of bacterial blight disease will cause internal changes in pigment, cell structure, and leaf water content. The spectral reflectance of different diseased areas is mainly affected by the internal changes of leaves, which provides a theoretical basis for disease detection based on hyperspectral imaging. Compared with RGB images, hyperspectral imaging can not only obtain texture and color information but also obtain spectral information of changes in rice leaves. This early detection can guide growers to prevent and apply pesticides in advance so as to avoid the outbreak of bacterial blight disease. On the other hand, the detection method for bacterial blight disease proposed in this paper can also be ap-plied to the detection of other plant diseases.
This study used a target detection algorithm combining RF and ACE to detect bacterial blight. Taking the hyperspectral images of diseased rice leaves as the research object, the performances of ACE, CEM, OSP, and SAM algorithms were compared. The detection accuracy of the ACE algorithm and CEM algorithm based on the statistical model was higher than that of the OSP algorithm and SAM algorithm based on the geometric model. Given the ACE algorithm and CEM algorithm based on a statistical model do not necessitate the background information of the image, they only need the detected a priori spectral information (i.e., the target spectrum). The OSP algorithm needed not only a priori knowledge of the target but also a priori knowledge of the background in the image. However, the study could not obtain all the a priori information, which made the accuracy of target detection decline. The SAM algorithm regards the spectrum of each pixel in the image as a high-dimensional vector and measures the similarity between the spectra by calculating the angle between the two vectors. Since the spectrum curve of the grey-green diseased area of rice leaves was similar to that of healthy leaves, the SAM algorithm had the worst recognition effect for the disease in this region.
4. Conclusions
This is the first study to use RFand an ACE to detect the infection of rice bacterial leaf blight disease through hyperspectral imaging. In this paper, three data sets with distinct wavelengths were constructed, and four algorithms were used to detect the disease spots in hyperspectral images. The results of the study show that the sensitive wavelengths extracted by RFcan better express the information of the entire spectral; when compared with the other three disease detection algorithms, the ACE algorithm has the best comprehensive detection performance, with the highest accuracy of 98.53%. In terms of detection accuracy and detection time, the ACE algorithm based on 18 sensitive wavelengths has the best overall performance, with an accuracy of 97.41%, which is only 1 percentage point lower than the detection accuracy of the ACE algorithm based on full wavelengths, but the detection time is reduced by 2/3. Through hyperspectral imaging, combined with RF and ACE algorithms, rice bacterial blight could be detected quickly and efficiently, which provides a new method for plant disease detection in the field.
Author Contributions
Methodology, Y.W.; software, Y.W. and Y.C.; validation, Y.W. and Y.C.; formal analysis, Y.C.; data curation, Y.W.; writing, Y.W.; project administration, Y.W.; funding acquisition, Y.W.; resources, Z.Z.; supervision, Z.Z. All authors have read and agreed to the published version of the manuscript.
Funding
This research was funded by the National First-class Undergraduate Major (Network Security and Law enforcement) Construction Project and Central University Basic Scientific Research Business Fee Special Fund Project (LGYB202011).
Institutional Review Board Statement
Not applicable.
Informed Consent Statement
Not applicable.
Data Availability Statement
The data that support the findings of this study are available from the corresponding author Y.W. upon reasonable request.
Conflicts of Interest
The authors declare no conflict of interest.
References
- Lin, F.; Guo, S.; Tan, C.; Zhou, X.; Zhang, D. Identification of Rice Sheath Blight through Spectral Responses Using Hyperspectral Images. Sensors 2020, 20, 6243. [Google Scholar] [CrossRef] [PubMed]
- Tan, Y.; Sun, J.; Zhang, B.; Chen, M.; Liu, Y.; Liu, X. Sensitivity of a Ratio Vegetation Index Derived from Hyperspectral Remote Sensing to the Brown Planthopper Stress on Rice Plants. Sensors 2019, 19, 375. [Google Scholar] [CrossRef] [PubMed] [Green Version]
- Zhang, J.; Yang, Y.; Feng, X.; Xu, H.; Chen, J.; He, Y. Identification of bacterial blight resistant rice seeds using terahertz imaging and hyperspectral imaging combined with convolutional neural network. Front. Plant Sci. 2020, 11, 1253–1268. [Google Scholar] [CrossRef] [PubMed]
- Nettleton, D.F.; Katsantonis, D.; Kalaitzidis, A.; Sarafijanovic-Djukic, N.; Puigdollers, P.; Confalonieri, R. Predicting rice blast disease: Machine learning versus process-based models. Bmc Bioinform. 2019, 20, 263–275. [Google Scholar] [CrossRef] [Green Version]
- Das, P.K.; Laxman, B.; Rao, S.V.C.K.; Seshasai, M.V.R.; Dadhwal, V.K. Monitoring of bacterial leaf blight in rice using ground-based hyperspectral and LISS IV satellite data in Kurnool, Andhra Pradesh, India. Int. J. Pest. Manag. 2015, 61, 359–368. [Google Scholar] [CrossRef]
- Wu, N.; Jiang, H.; Bao, Y.; Zhang, C.; Zhang, J.; Song, W.; Zhao, Y.; Mi, C.; He, Y.; Liu, F. Practicability investigation of using near-infrared hyperspectral imaging to detect rice kernels infected with rice false smut in different conditions. Sens. Actuators B Chem. 2020, 308, 113–128. [Google Scholar] [CrossRef]
- Mishra, P.; Polder, G.; Vilfan, N. Close Range Spectral Imaging for Disease Detection in Plants Using Autonomous Platforms: A Review on Recent Studies. Curr. Robot. Rep. 2020, 1, 43–48. [Google Scholar] [CrossRef] [Green Version]
- Xie, X.; Gu, X.; Lin, L.; Yang, G.; Zhang, L. Effect of lodging stress on the ratio of visible stem, leaf and ear in rice and analysis of spectral response. Spectrosc. Spectr. Anal. 2019, 39, 2264–2270. [Google Scholar] [CrossRef]
- Kaitlin, M.G.; Philip, A.T.; Adam, C.; Ittai, H.; John, J.C.; Eric, R.L.; Amanda, J.G. Hyperspectral Measurements Enable Pre-Symptomatic Detection and Differentiation of Contrasting Physiological Effects of Late Blight and Early Blight in Potato. Remote Sens. 2020, 12, 286. [Google Scholar] [CrossRef] [Green Version]
- Bagheri, N.; Mohamadi-Monavar, H.; Azizi, A.; Ghasemi, A. Detection of Fire Blight disease in pear trees by hyperspectral data. Eur. J. Remote Sens. 2018, 51, 642–657. [Google Scholar] [CrossRef]
- Lowe, A.; Harrison, N.; French, A.P. Hyperspectral image analysis techniques for the detection and classification of the early onset of plant disease and stress. Plant Methods 2017, 13, 213–229. [Google Scholar] [CrossRef] [PubMed]
- Ali, M.M.; Bachik, N.A.; Muhadi, N.A.; Yusof, T.N.T.; Gomes, C. Non-destructive techniques of detecting plant diseases: A review. Physiol. Mol. Plant Pathol. 2019, 108, 1348–1363. [Google Scholar] [CrossRef]
- Cong, S.; Sun, J.; Mao, H.; Wu, X.; Wang, P.; Zhang, X. Non-destructive detection for mold colonies in rice based on hyperspectral and GWO-SVR. J. Sci. Food Agric. 2018, 98, 1453–1459. [Google Scholar] [CrossRef]
- Lu, J.; Ehsani, R.; Shi, Y.; Abdulridha, J.; de Castro, A.I.; Xu, Y. Field detection of anthracnose crown rot in strawberry using spectroscopy technology. Comput. Electron. Agric. 2017, 135, 289–299. [Google Scholar] [CrossRef]
- Fuentes, A.; Yoon, S.; Kim, S.; Park, D. A Robust Deep-Learning-Based Detector for Real-Time Tomato Plant Diseases and Pests Recognition. Sensors 2017, 17, 2022. [Google Scholar] [CrossRef] [Green Version]
- Sun, W.; Du, Q. Hyperspectral Band Selection: A Review. IEEE Geosci. Remote Sens. Mag. 2019, 7, 118–139. [Google Scholar] [CrossRef]
- Cao, Y.; Yuan, P.; Xu, H.; Martínez-Ortega, J.F.; Feng, J.; Zhai, Z. Detecting Asymptomatic Infections of Rice Bacterial Leaf Blight Using Hyperspectral Imaging and 3-Dimensional Convolutional Neural Network with Spectral Dilated Convolution. Front. Plant Sci. 2022, 13, 963170. [Google Scholar] [CrossRef]
- Zheng, Q.; Huang, W.; Cui, X.; Dong, Y.; Shi, Y.; Ma, H.; Liu, L. Identification of Wheat Yellow Rust Using Optimal Three-Band Spectral Indices in Different Growth Stages. Sensors 2018, 19, 35. [Google Scholar] [CrossRef] [Green Version]
- Yuan, P.; Cao, Y.; Ma, Q.; Wang, H.; Xu, H. Study on the identification method of rice bacterial stripe disease based on random forest. J. Agric. Mach. 2020, 23, 175–183. [Google Scholar] [CrossRef]
- Huang, J.; Liao, H.; Zhu, Y.; Sun, J.; Sun, Q.; Liu, X. Hyperspectral detection of rice damaged by rice leaf folder (Cnaphalocrocis medinalis). Comput. Electron. Agric. 2012, 82, 100–107. [Google Scholar] [CrossRef]
- Guo, W.; Zhu, Y.; Wang, H.; Zhang, J.; Dong, P.; Qiao, H. Study on monitoring model of winter wheat take all disease based on unmanned aerial vehicle hyperspectral image. J. Agric. Mach. 2019, 50, 162–169. [Google Scholar] [CrossRef]
- Vincent, F.; Besson, O. Non Zero Mean Adaptive Cosine Estimator and Application to Hyperspectral Imaging. IEEE Signal Process. Lett. 2020, 27, 1989–1993. [Google Scholar] [CrossRef]
- Zhao, R.; Shi, Z.; Zou, Z.; Zhang, Z. Ensemble-Based Cascaded Constrained Energy Minimization for Hyperspectral Target Detection. Remote Sens. 2019, 71, 1310. [Google Scholar] [CrossRef] [Green Version]
- Li, H.; Lee, W.S.; Wang, K.; Ehsani, R.; Yang, C. ‘Extended spectral angle mapping (ESAM)’ for citrus greening disease detection using airborne hyperspectral imaging. Precis. Agric. 2014, 15, 162–183. [Google Scholar] [CrossRef]
- Torres, R.M.; Yuen, P.W.T.; Yuan, C.; Piper, J.; McCullough, C.; Godfree, P. Spatial Spectral Band Selection for Enhanced Hyperspectral Remote Sensing Classification Applications. J. Imaging 2020, 6, 87. [Google Scholar] [CrossRef]
- Shuaibu, M.; Lee, W.S.; Schueller, J.; Gader, P.; Hong, Y.K.; Kim, S. Unsupervised hyperspectral band selection for apple Marssonina blotch detection. Comput. Electron. Agric. 2018, 148, 45–53. [Google Scholar] [CrossRef]
- Kraut, S.; Scharf, L.L.; Butler, R.W. The adaptive coherence estimator: A uniformly most-powerful-invariant adaptive detection statistic. IEEE Trans. Signal Process. 2005, 53, 427–438. [Google Scholar] [CrossRef]
- Camacho Velasco, A.; Vargas García, C.A.; Arguello Fuentes, H. A comparative study of target detection algorithms in hyperspectral imagery applied to agricultural crops in Colombia. Rev. Tecnura 2016, 20, 86–99. [Google Scholar] [CrossRef]
Figure 1.
Diagram of pathogen cultivation.

Figure 2.
Schematic diagram of high-spectral imaging system (1—Imaging lens 2—Light source 3—Stage).
Figure 2.
Schematic diagram of high-spectral imaging system (1—Imaging lens 2—Light source 3—Stage).

Figure 3.
Reflectance Curve after Pretreatment.

Figure 4.
Diagram showing the importance of wavelengths. ○ represents characteristic wavelength and ☆ represents the importance score.
Figure 4.
Diagram showing the importance of wavelengths. ○ represents characteristic wavelength and ☆ represents the importance score.

Figure 5.
Comparison of detection effects of ACE.


Table 1.
Band importance ranking.
| Wavelength Serial Number | Wavelength (nm) | Feature Importance Score × 5000 |
|---|---|---|
| 139 | 667.02 | 592.895 |
| 132 | 651.89 | 589.395 |
| 51 | 480.17 | 425.11 |
| 52 | 482.25 | 419.97 |
| 49 | 476.03 | 412.565 |
| 122 | 630.35 | 304.1 |
| 120 | 626.05 | 292.955 |
| 110 | 604.6 | 291.825 |
| 105 | 593.91 | 286.905 |
| 130 | 647.58 | 281.355 |
| 131 | 649.73 | 280.805 |
| 58 | 494.72 | 219.195 |
| 41 | 459.5 | 205.98 |
| 45 | 467.75 | 195.9 |
| 61 | 500.98 | 192.225 |
| 155 | 701.73 | 5.33 |
| 135 | 658.37 | 1.79 |
| 46 | 469.82 | 1.715 |
Table 2.
Comparison of detection effect and detection time of three kinds of data images by different detection algorithms.
Table 2.
Comparison of detection effect and detection time of three kinds of data images by different detection algorithms.
| Detection Algorithm | Full Spectrum Wavelength Image | RF Characteristic Wavelength Spectral Image | RGB Wavelength Image | ||||||||||||
|---|---|---|---|---|---|---|---|---|---|---|---|---|---|---|---|
| P/% | R/% | F1/% | A/% | T/ms | P/% | R/% | F1/% | A/% | T/ms | P/% | R/% | F1/% | A/% | T/ms | |
| ACE | 95.17 | 94.15 | 95.37 | 98.53 | 38 | 94.25 | 94.24 | 95.86 | 97.41 | 13 | 75.31 | 75.17 | 76.24 | 78.64 | 7 |
| CEM | 93.87 | 94.32 | 94.83 | 97.65 | 45 | 93.10 | 92.81 | 93.26 | 95.53 | 18 | 76.26 | 75.32 | 77.33 | 79.15 | 10 |
| OSP | 74.11 | 75.13 | 76.52 | 79.42 | 42 | 71.21 | 71.03 | 70.89 | 72.26 | 15 | 63.26 | 65.73 | 66.27 | 68.12 | 9 |
| SAM | 62.09 | 65.03 | 64.55 | 68.21 | 22 | 61.07 | 65.15 | 64.23 | 68.16 | 11 | 62.11 | 65.01 | 63.55 | 68.09 | 5 |
Publisher’s Note: MDPI stays neutral with regard to jurisdictional claims in published maps and institutional affiliations. |
© 2022 by the authors. Licensee MDPI, Basel, Switzerland. This article is an open access article distributed under the terms and conditions of the Creative Commons Attribution (CC BY) license (https://creativecommons.org/licenses/by/4.0/).
Share and Cite
MDPI and ACS Style
Wu, Y.; Cao, Y.; Zhai, Z. Early Detection of Bacterial Blight in Hyperspectral Images Based on Random Forest and Adaptive Coherence Estimator. Sustainability 2022, 14, 13168. https://0-doi-org.brum.beds.ac.uk/10.3390/su142013168
AMA Style
Wu Y, Cao Y, Zhai Z. Early Detection of Bacterial Blight in Hyperspectral Images Based on Random Forest and Adaptive Coherence Estimator. Sustainability. 2022; 14(20):13168. https://0-doi-org.brum.beds.ac.uk/10.3390/su142013168
Chicago/Turabian StyleWu, Yuqiang, Yifei Cao, and Zhaoyu Zhai. 2022. "Early Detection of Bacterial Blight in Hyperspectral Images Based on Random Forest and Adaptive Coherence Estimator" Sustainability 14, no. 20: 13168. https://0-doi-org.brum.beds.ac.uk/10.3390/su142013168
Note that from the first issue of 2016, this journal uses article numbers instead of page numbers. See further details here.