
An Energy-Saving-Oriented Approach to Urban Design—Application in the Local Conditions of Poznań Metropolitan Area (Poland)

 , , and
Abstract
:1. Introduction
1.1. Problem Highlighting
- (a)
- Economic:
- -
- Investment risk;
- -
- Investment efficiency;
- -
- Consumer preferences (residents, tenants, property owners, and users);
- -
- Public support for renewable energy sources.
- (b)
- Social and cultural:
- -
- Spatial behavior of residents and its impact on energy consumption;
- -
- Social acceptance of energy-saving solutions;
- -
- Cultural conditions;
- -
- Social potential of the area (ability to create innovative pro-environmental solutions).
- (c)
- Natural:
- -
- Environmental risks associated with energy production and transmission;
- -
- Natural stability (species diversity, spatial distribution, species dominants, stratification, etc.);
- -
- The location of tall trees in the immediate vicinity of buildings and their impact on climatic comfort in residential environments [11].
- (d)
- Structural:
- -
- Technical standard of development (thermal insulation envelope of buildings);
- -
- Energy-efficient methods of transportation (public transportation and bicycles);
- -
- Optimization of the length of technical infrastructure routes in the urban structure;
- -
- Optimization of the spatial arrangement of buildings.
- The solar rays incidence angle, which depends on the orientation of buildings towards the directions of the world;
- The degree of shading on the glazed parts of facades, which depends on the locations of the buildings and other shading objects in the surroundings [12].
1.2. State of the Art—Review of the Literature and Methodologies
- The local climatic conditions;
- The requirements of Polish construction laws and technical conditions, referring to the insolation time, distances between buildings, building envelope parameters, etc.;
- Local spatial planning constraints;
- The shape of the plot;
- The existing built environment in the direct vicinity.
2. Materials and Methods
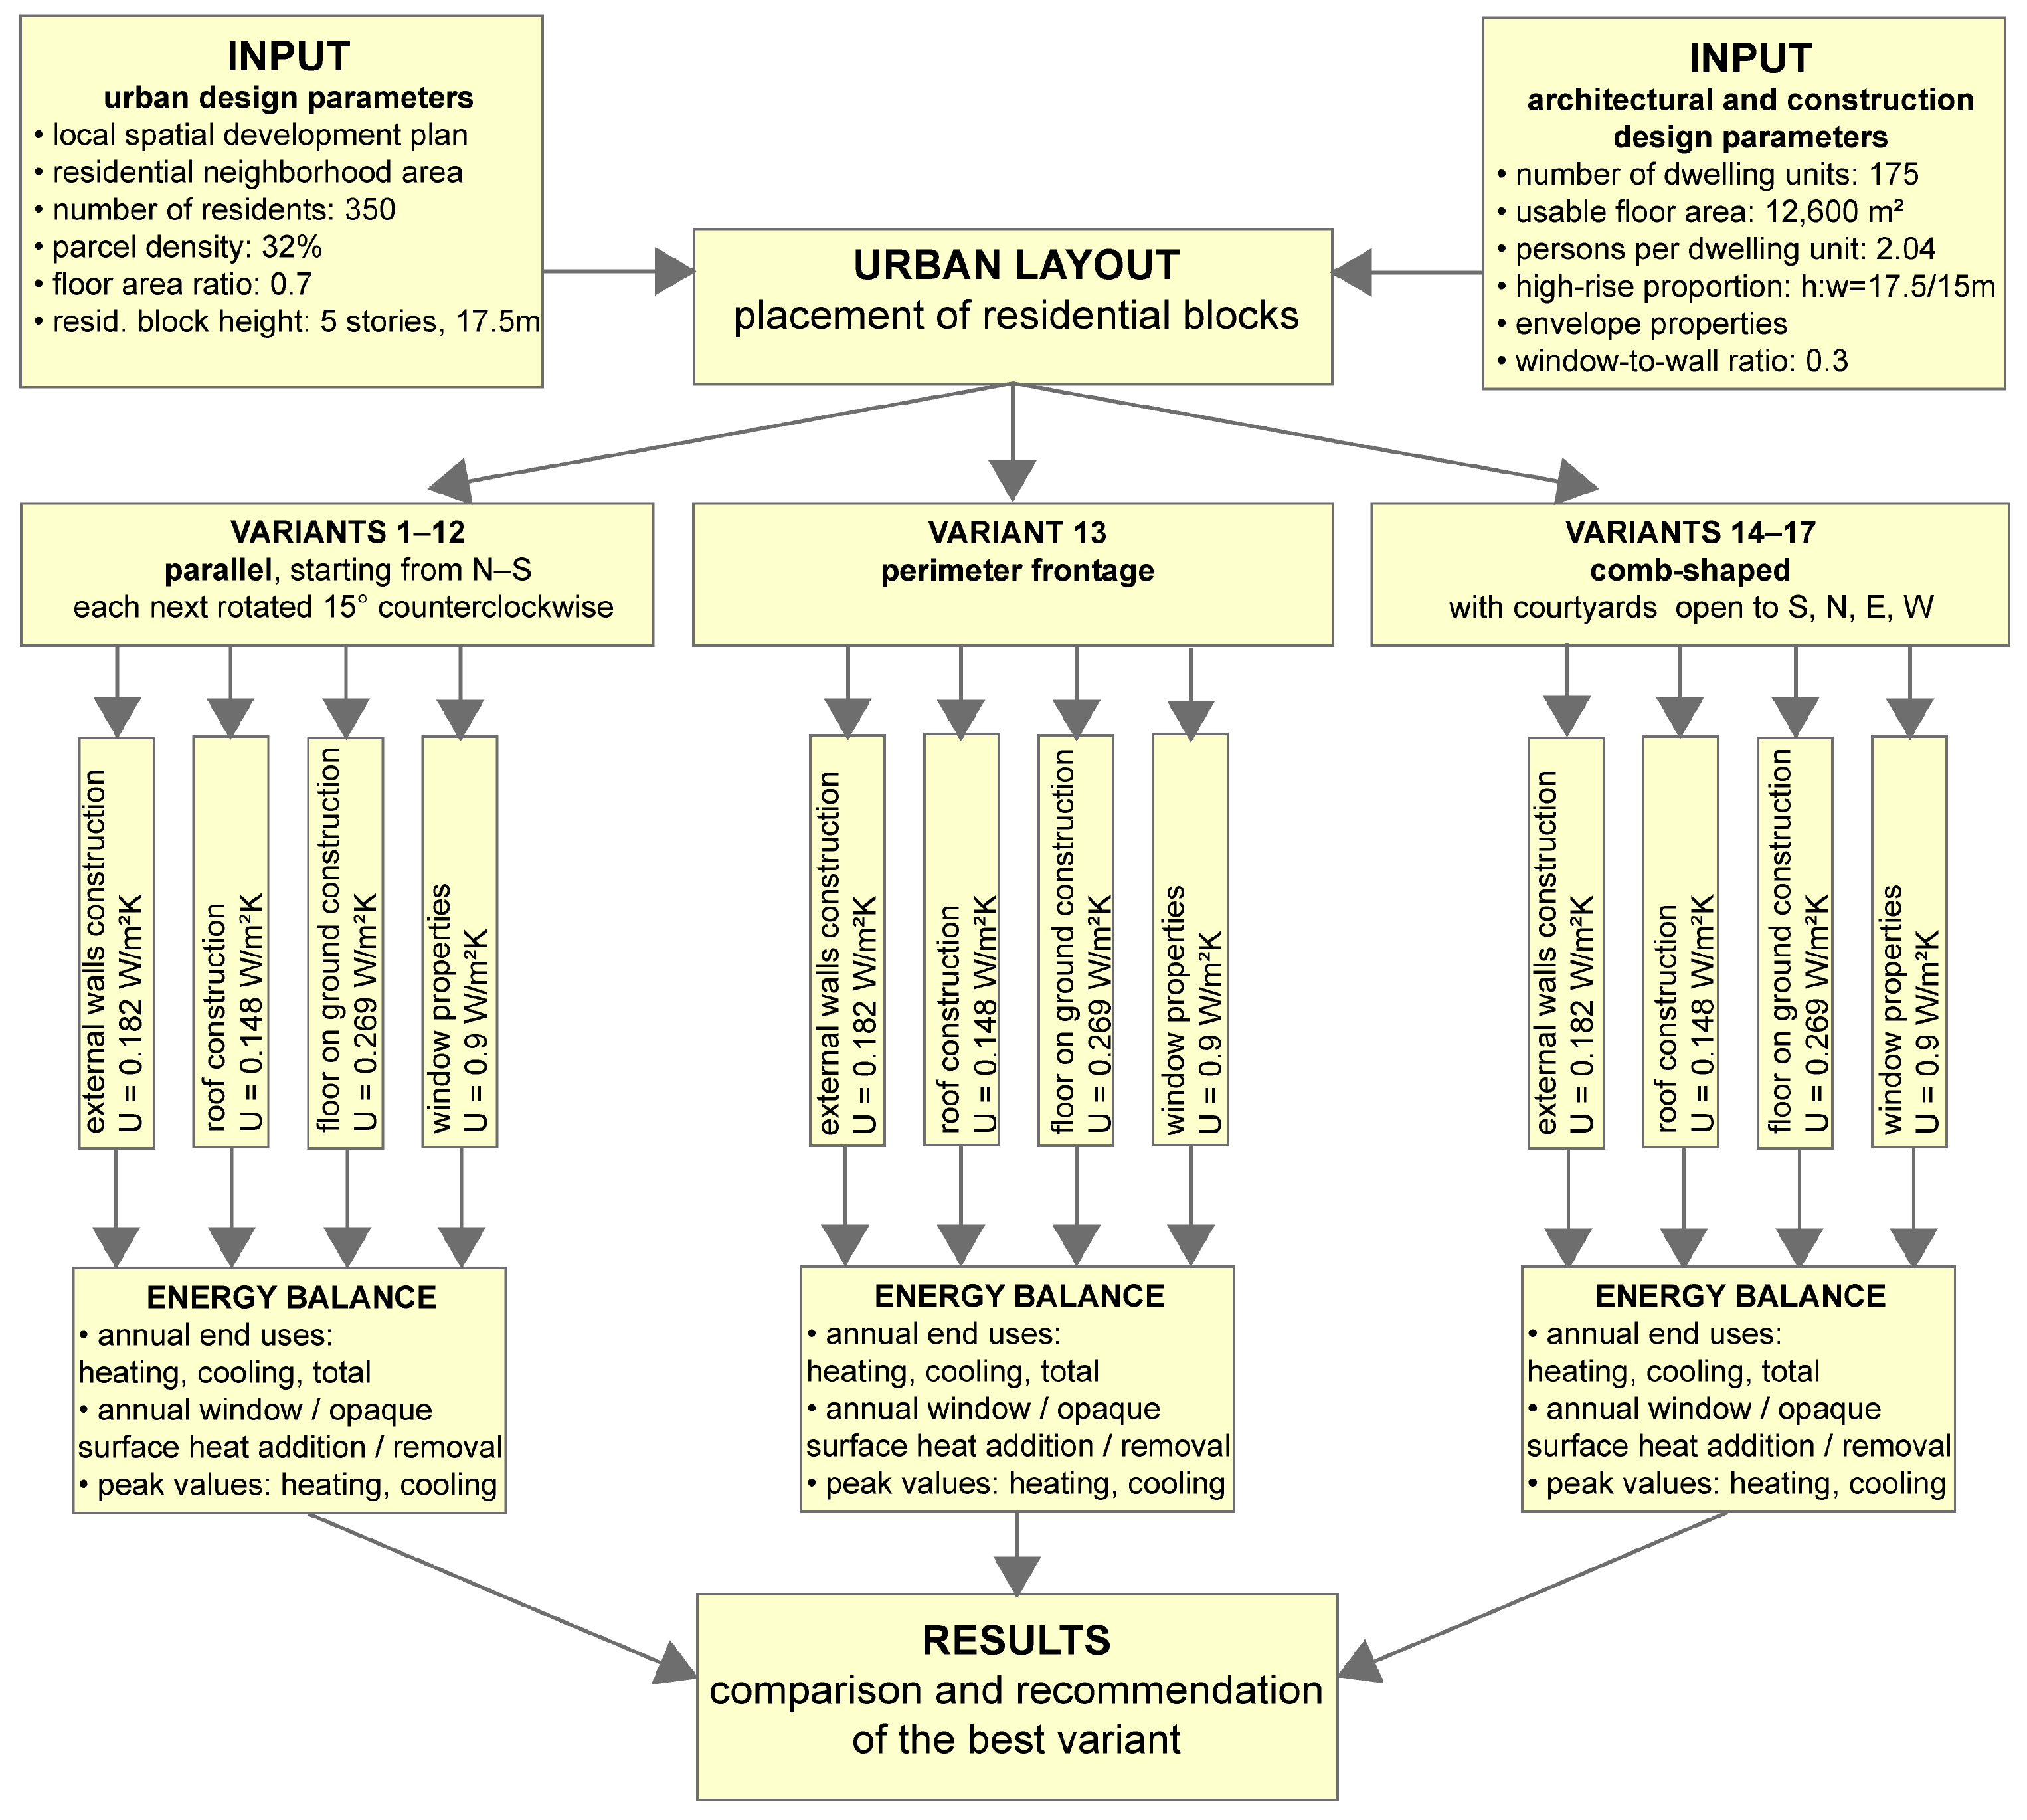
2.1. Research Objective and Overview
- The only difference between the considered variants is the spatial arrangement of the buildings.
- All variants of land development and all adopted properties of buildings have to meet the minimum requirements according to the Polish law regulations and standards.
- The rest of the adopted features and parameters of the buildings are the same in all variants to ensure that the variants are comparable and to eliminate the impact of all other variables except the spatial arrangement of the buildings.
- A built-up area of approx. 3600 m2 (except for the additional 10-story variant, with a built-up area of approx. 2400 m2), which means approx. 18,000 m2 of gross floor area and approx. 12,600 m2 of usable floor area;
- For each apartment, meeting sunlight requirements of at least 3 h on equinox days (21 March and 23 September), according to the Polish Regulation of the Minister of Infrastructure on technical specifications for buildings and their location [51].
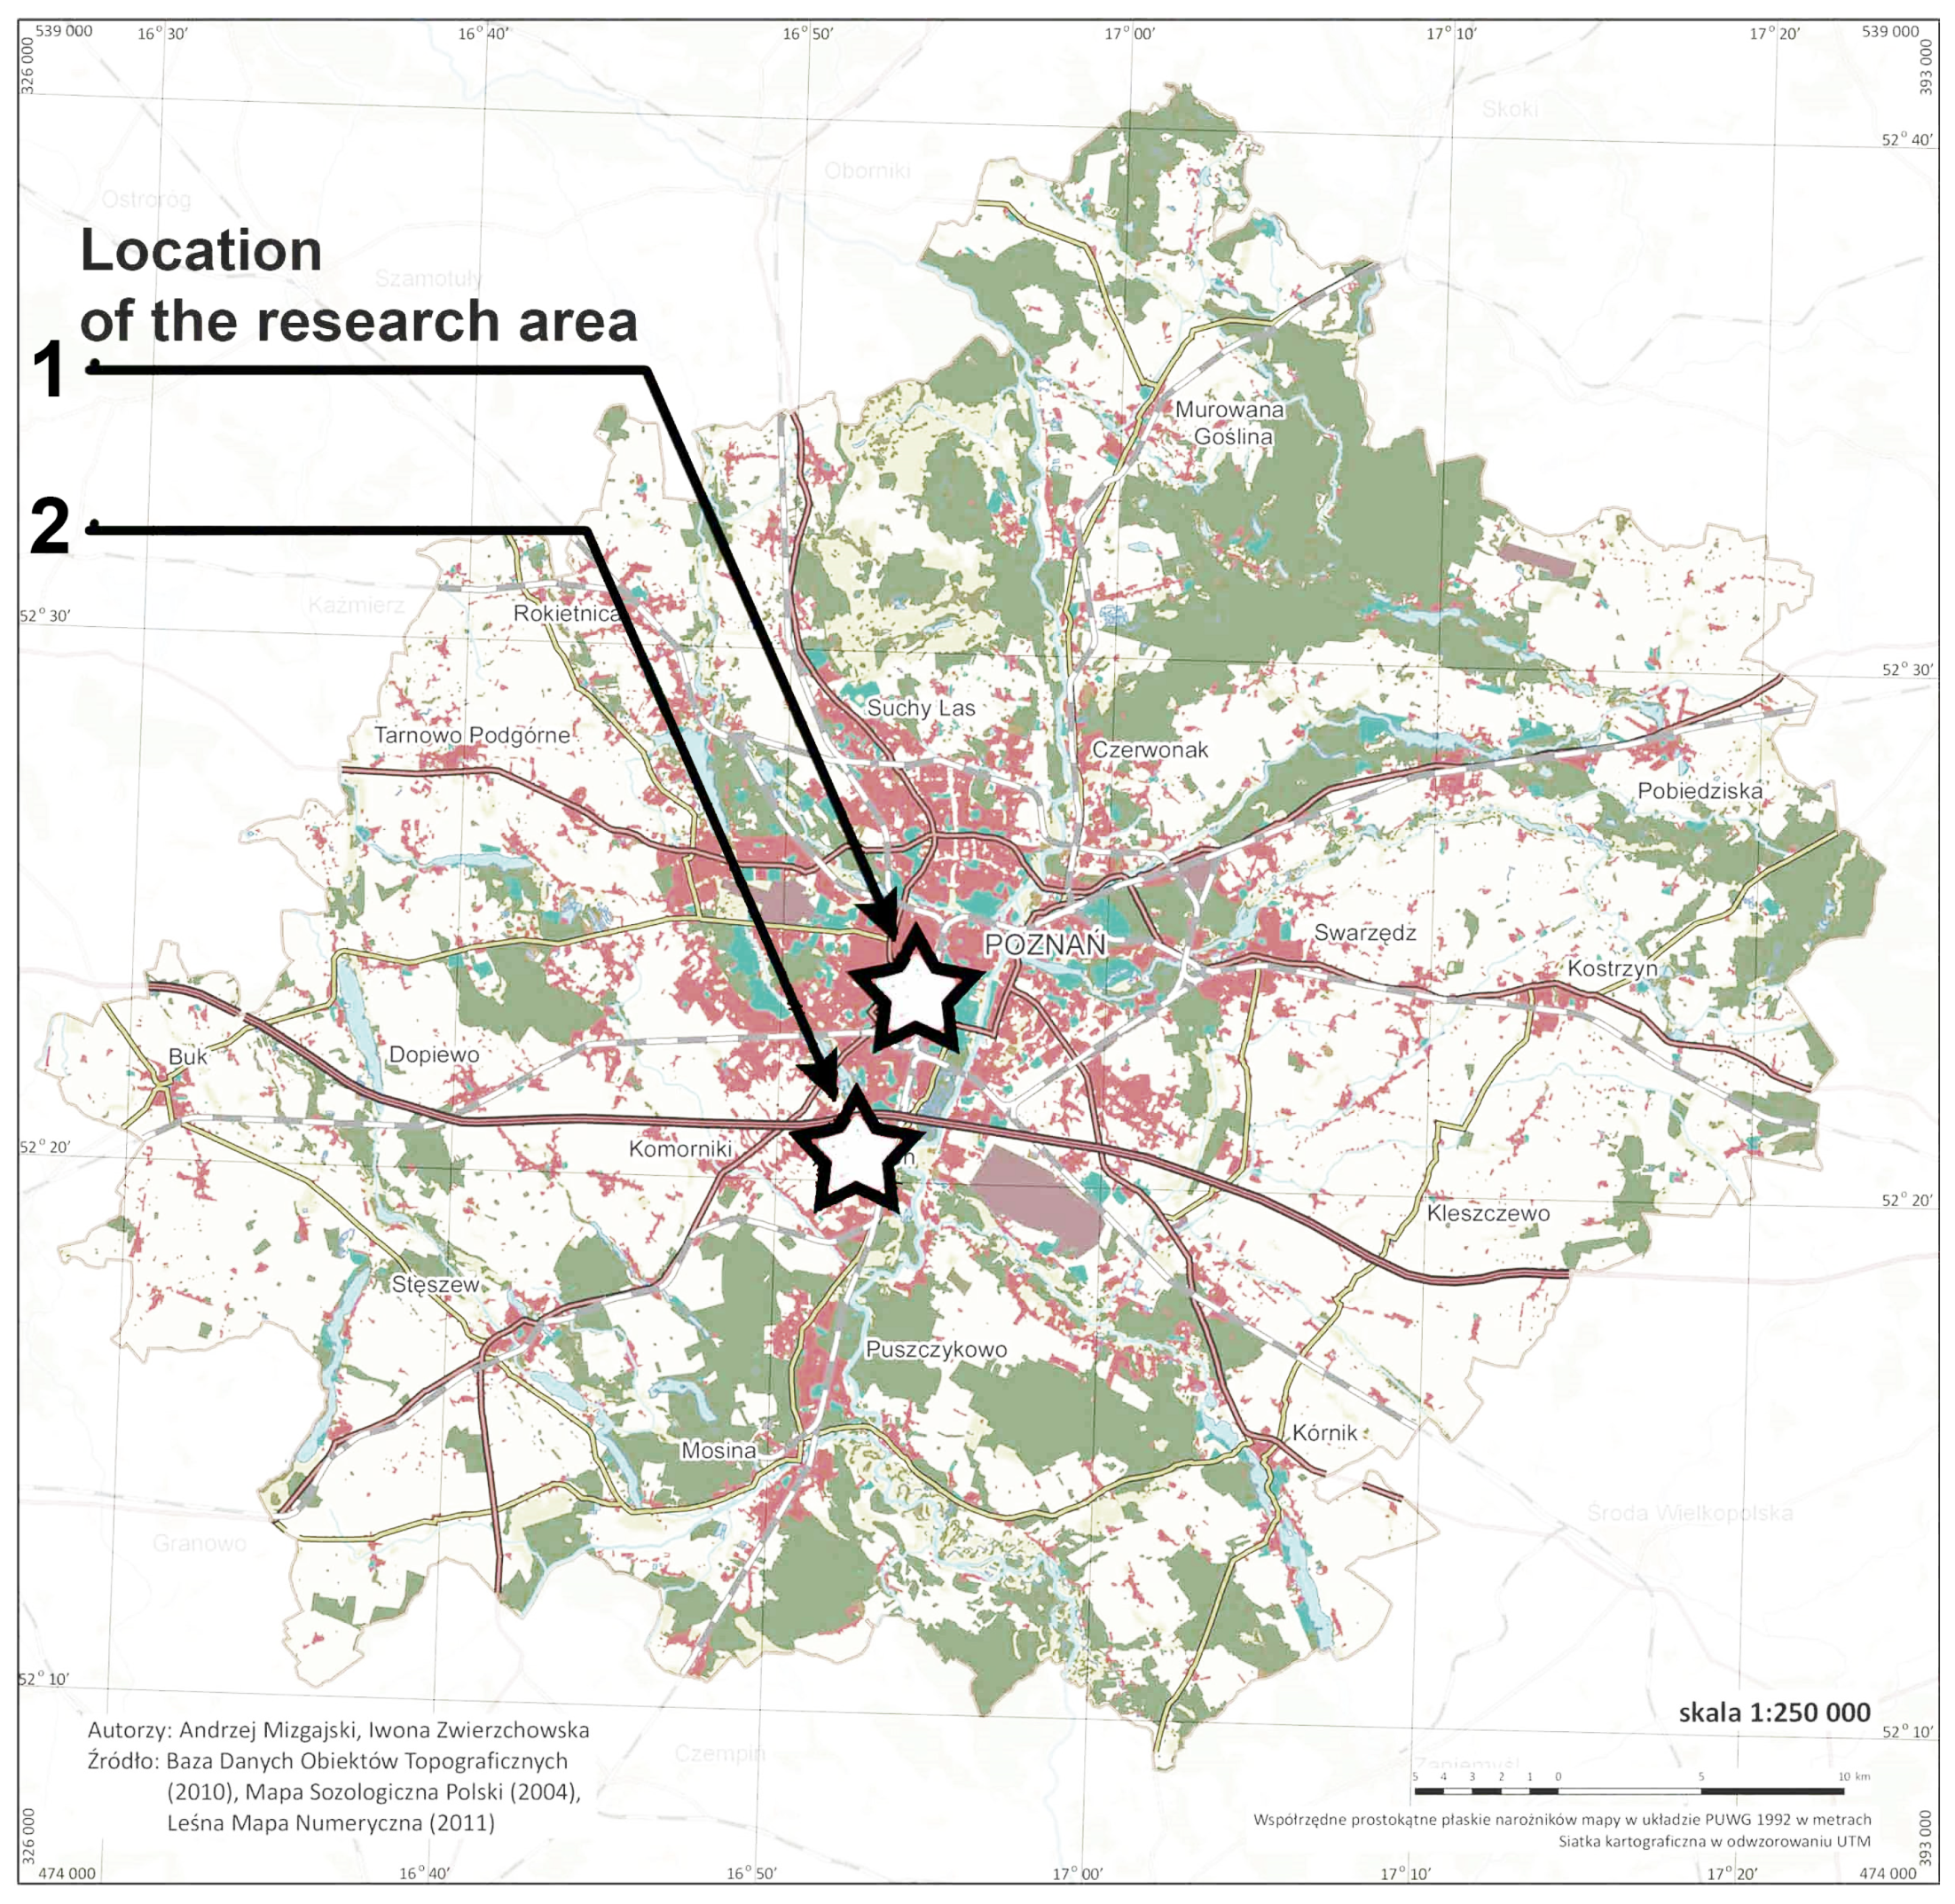
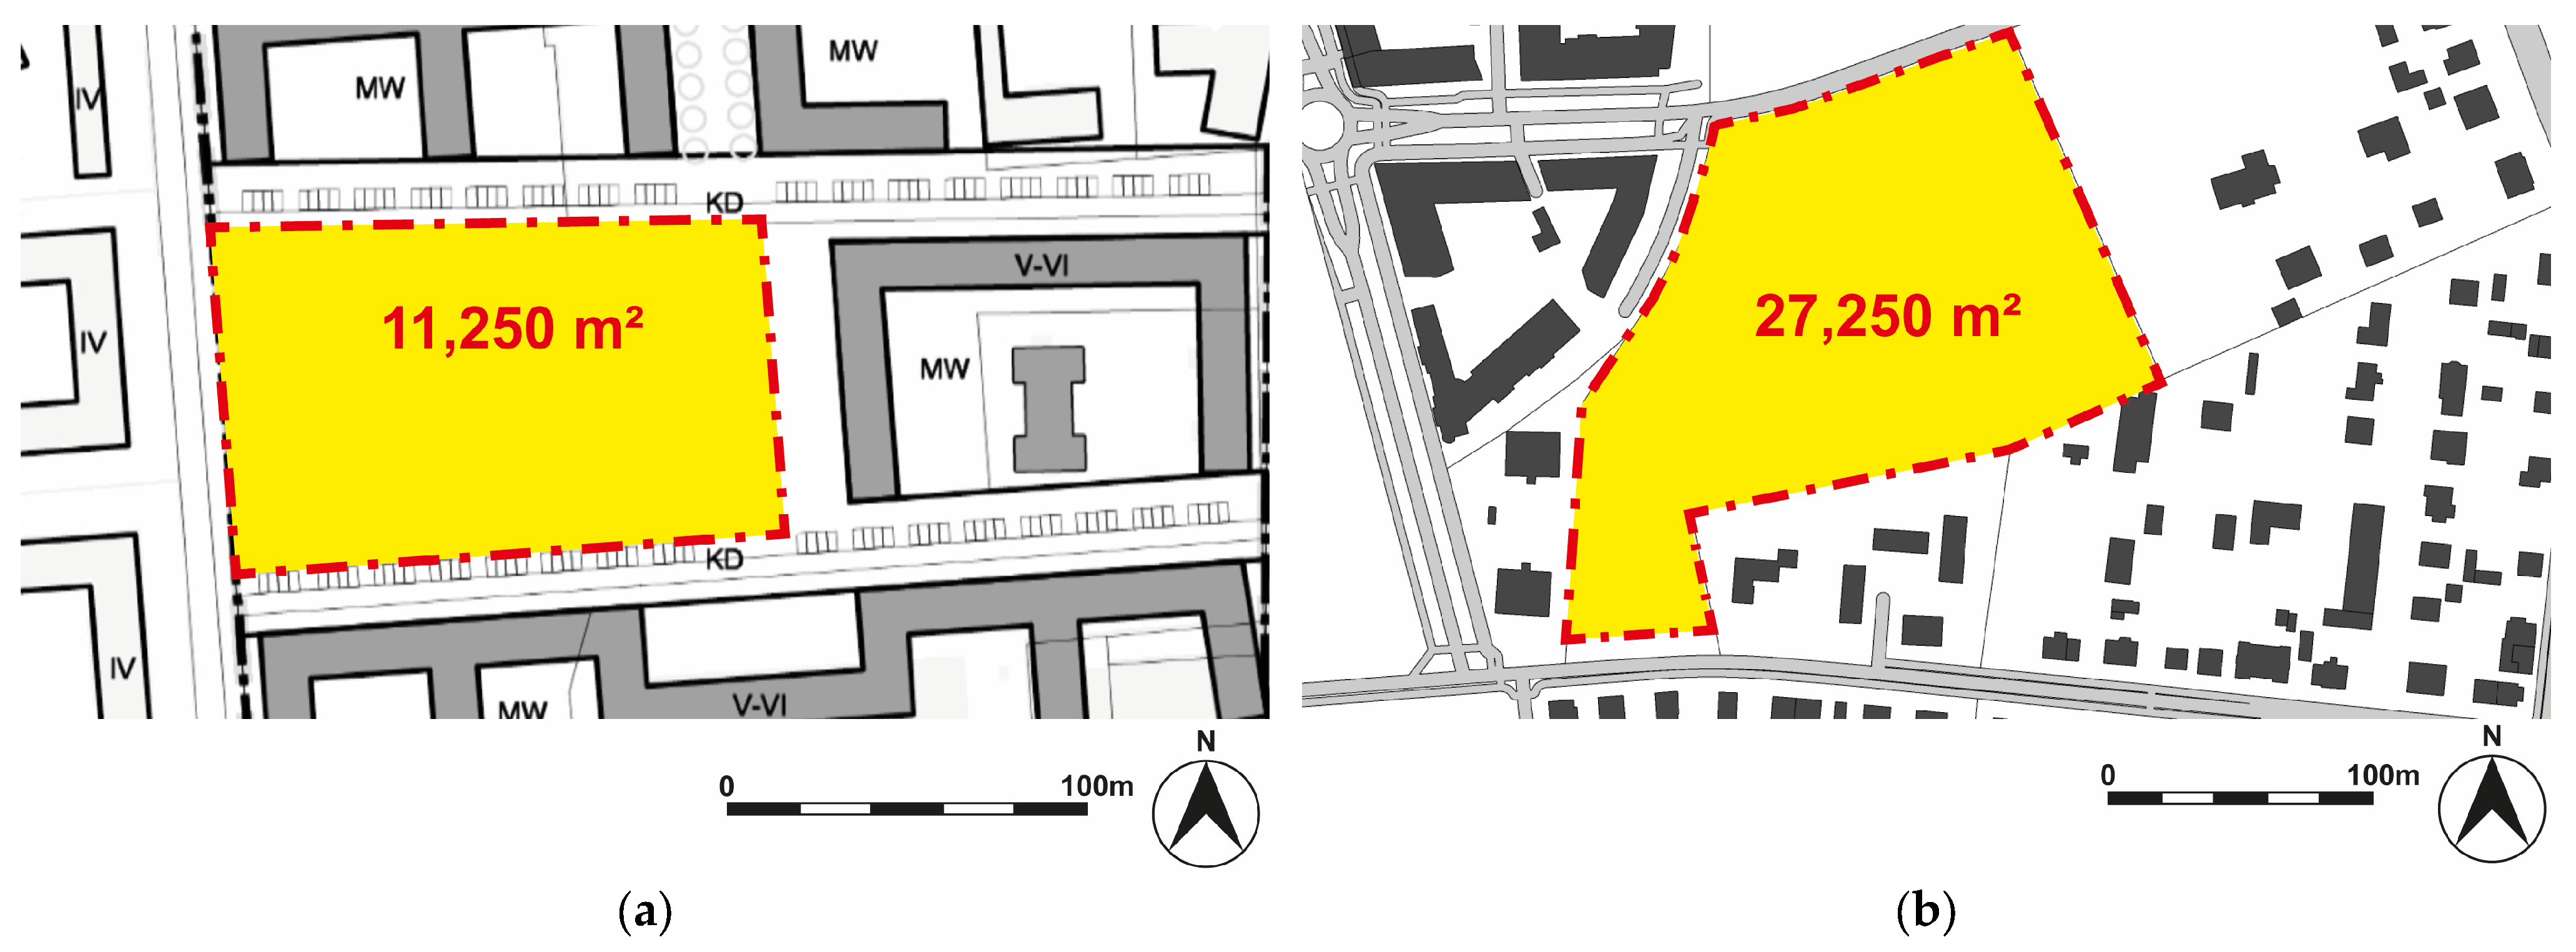
2.2. Research Material
- Research area no. 1—A proposal for the design of a local spatial development plan in Poznań, located in the neighborhood of Grunwaldzka and Ułańska Street in Poznań. One of the quarters of the designed development in this plan is taken as the material for research due to its dimensions, which allows for the placement of various layouts of buildings, and due to its location in the neighborhood of the typical development representative of central districts in Poznań. The direct surroundings of the given plot are designed as built-up with compact frontage buildings with a height of approx. 17 m and 5 stories. The selected plot of land has a shape similar to a rectangle, and the area is approx. 11,250 m2. The adopted parameters of the designed development variants: 5 stories, a floor height of 3.50 m, and a parcel density of 32%.
- Research area no. 2—A plot near Wschodnia Street in Luboń. This location was chosen as a representative of the location in the neighborhood of the typical land development of Poznań suburban area, containing mixed single-family and multi-family housing. The selected area is approx. 27,250 m2. The adopted parameters of the designed development variants: 5 stories, a floor height of 300 m, and a parcel density of 27%.
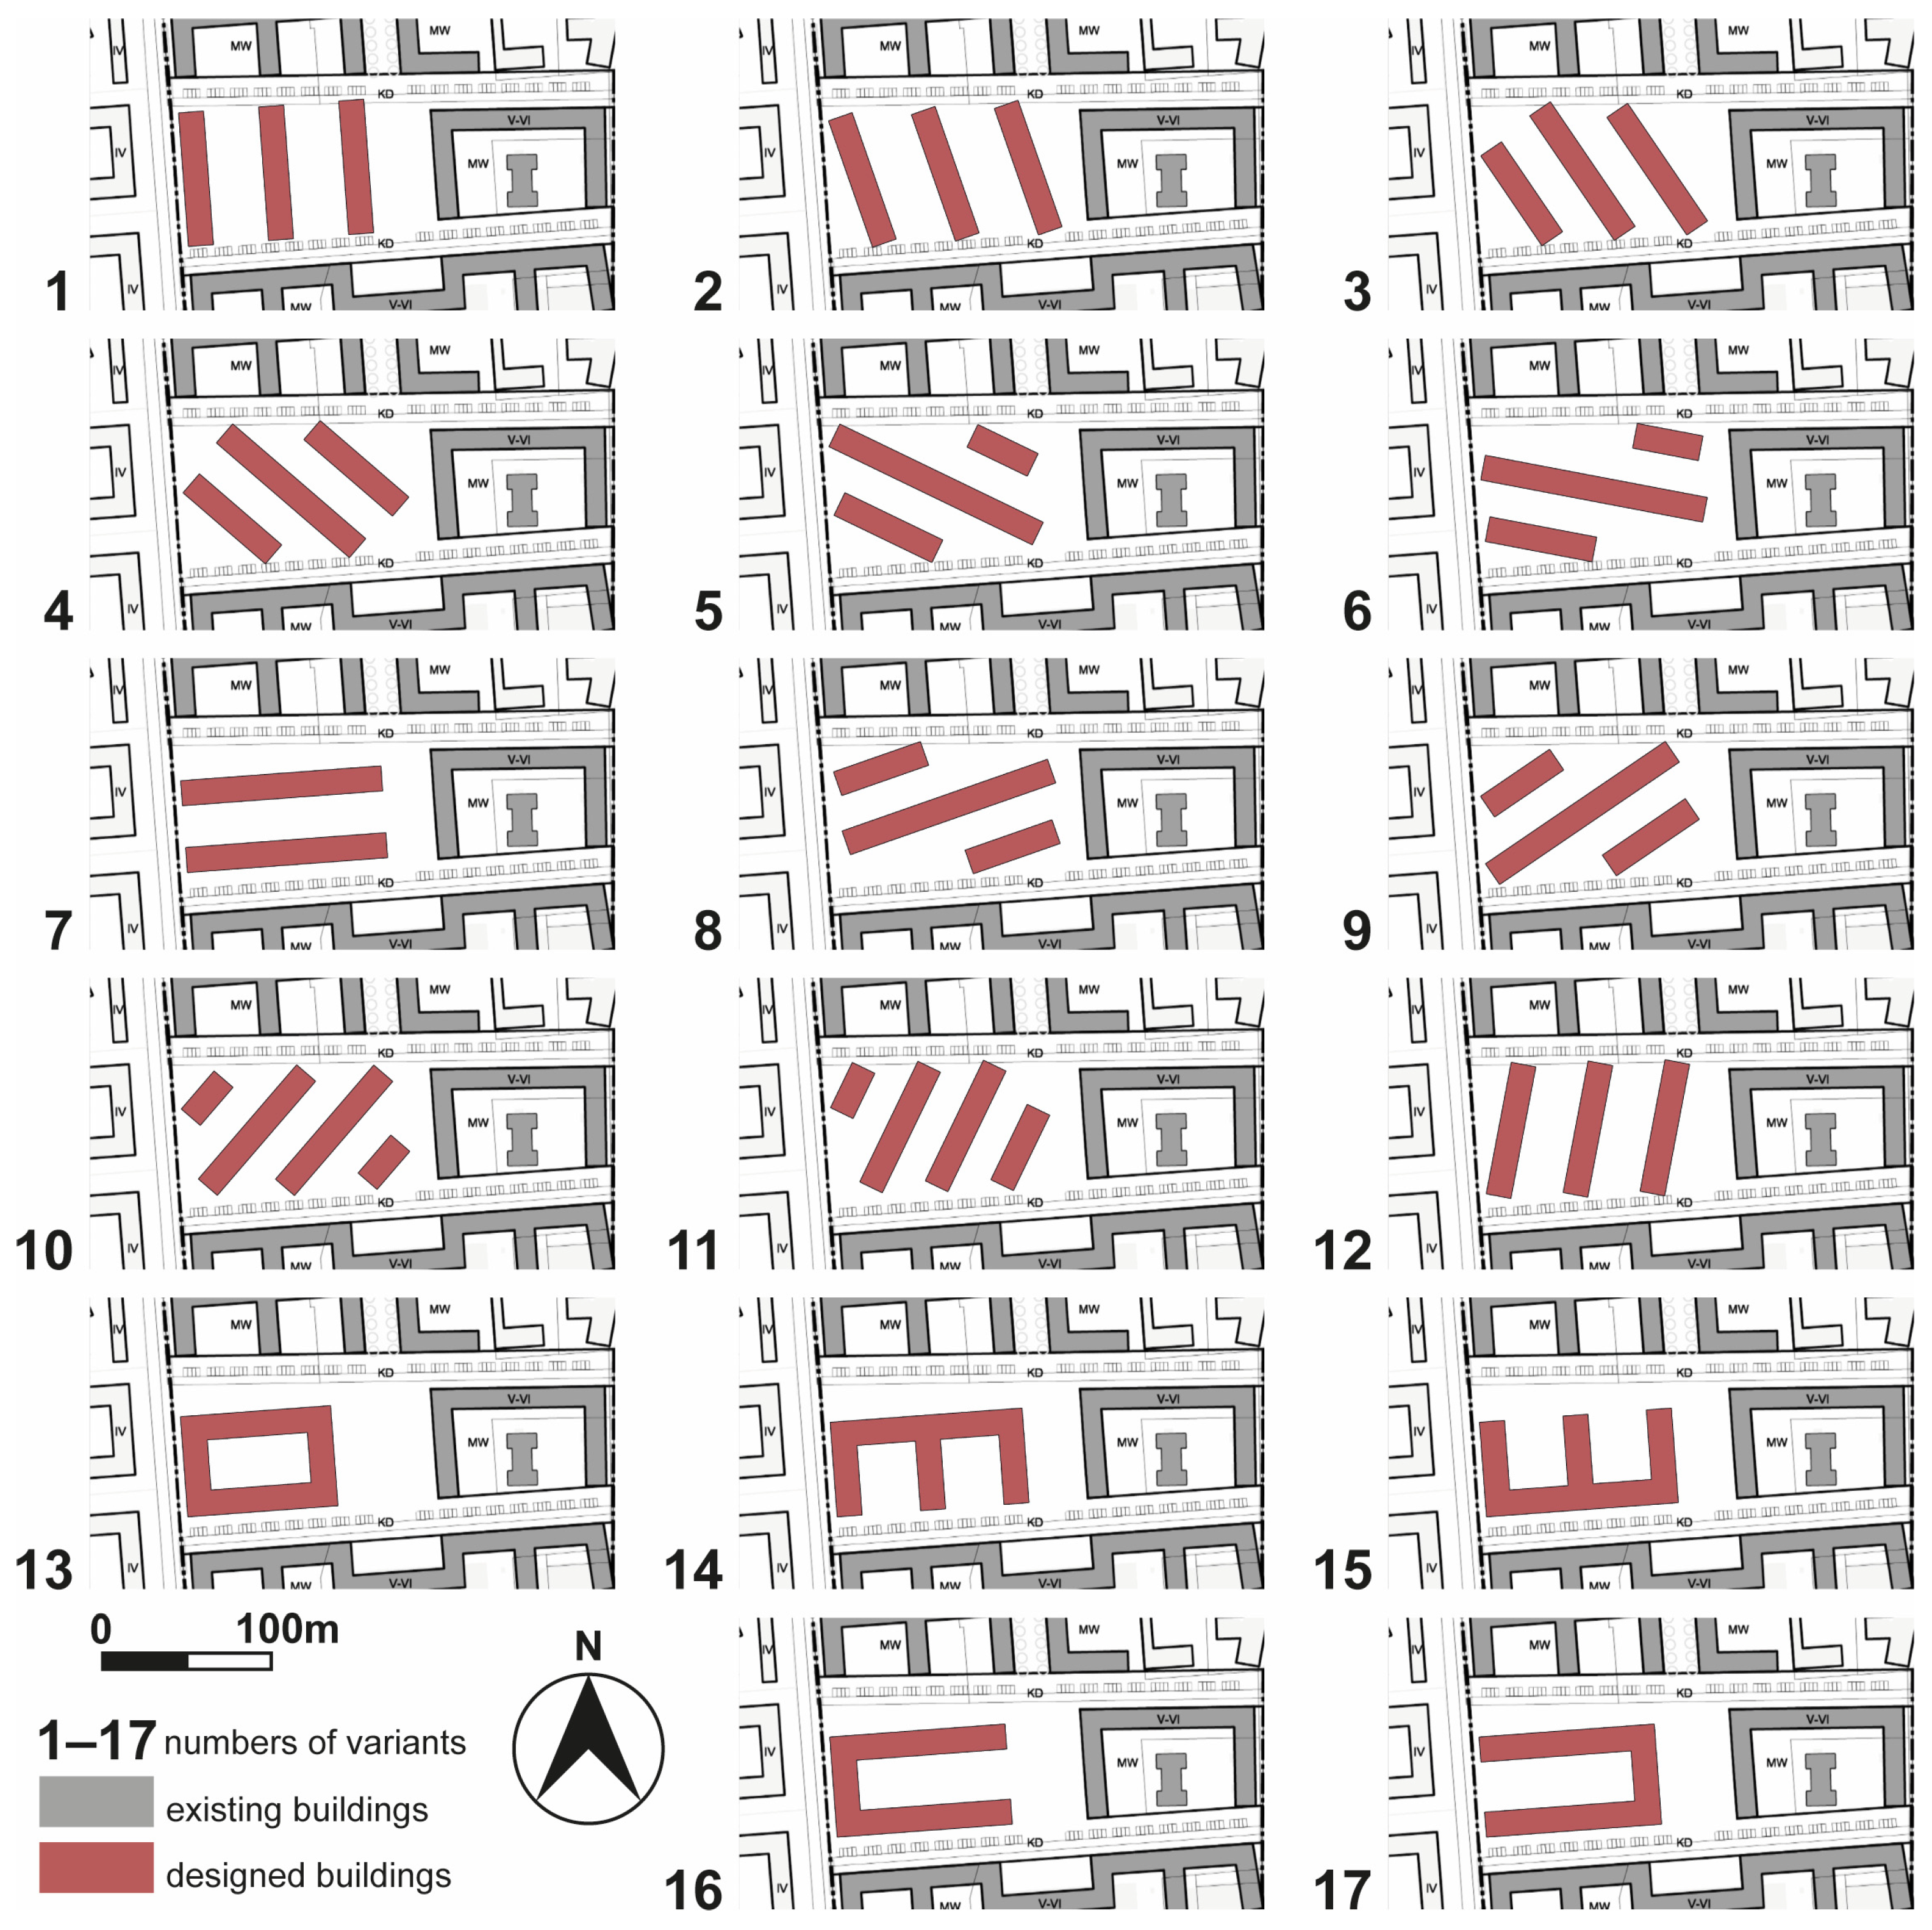
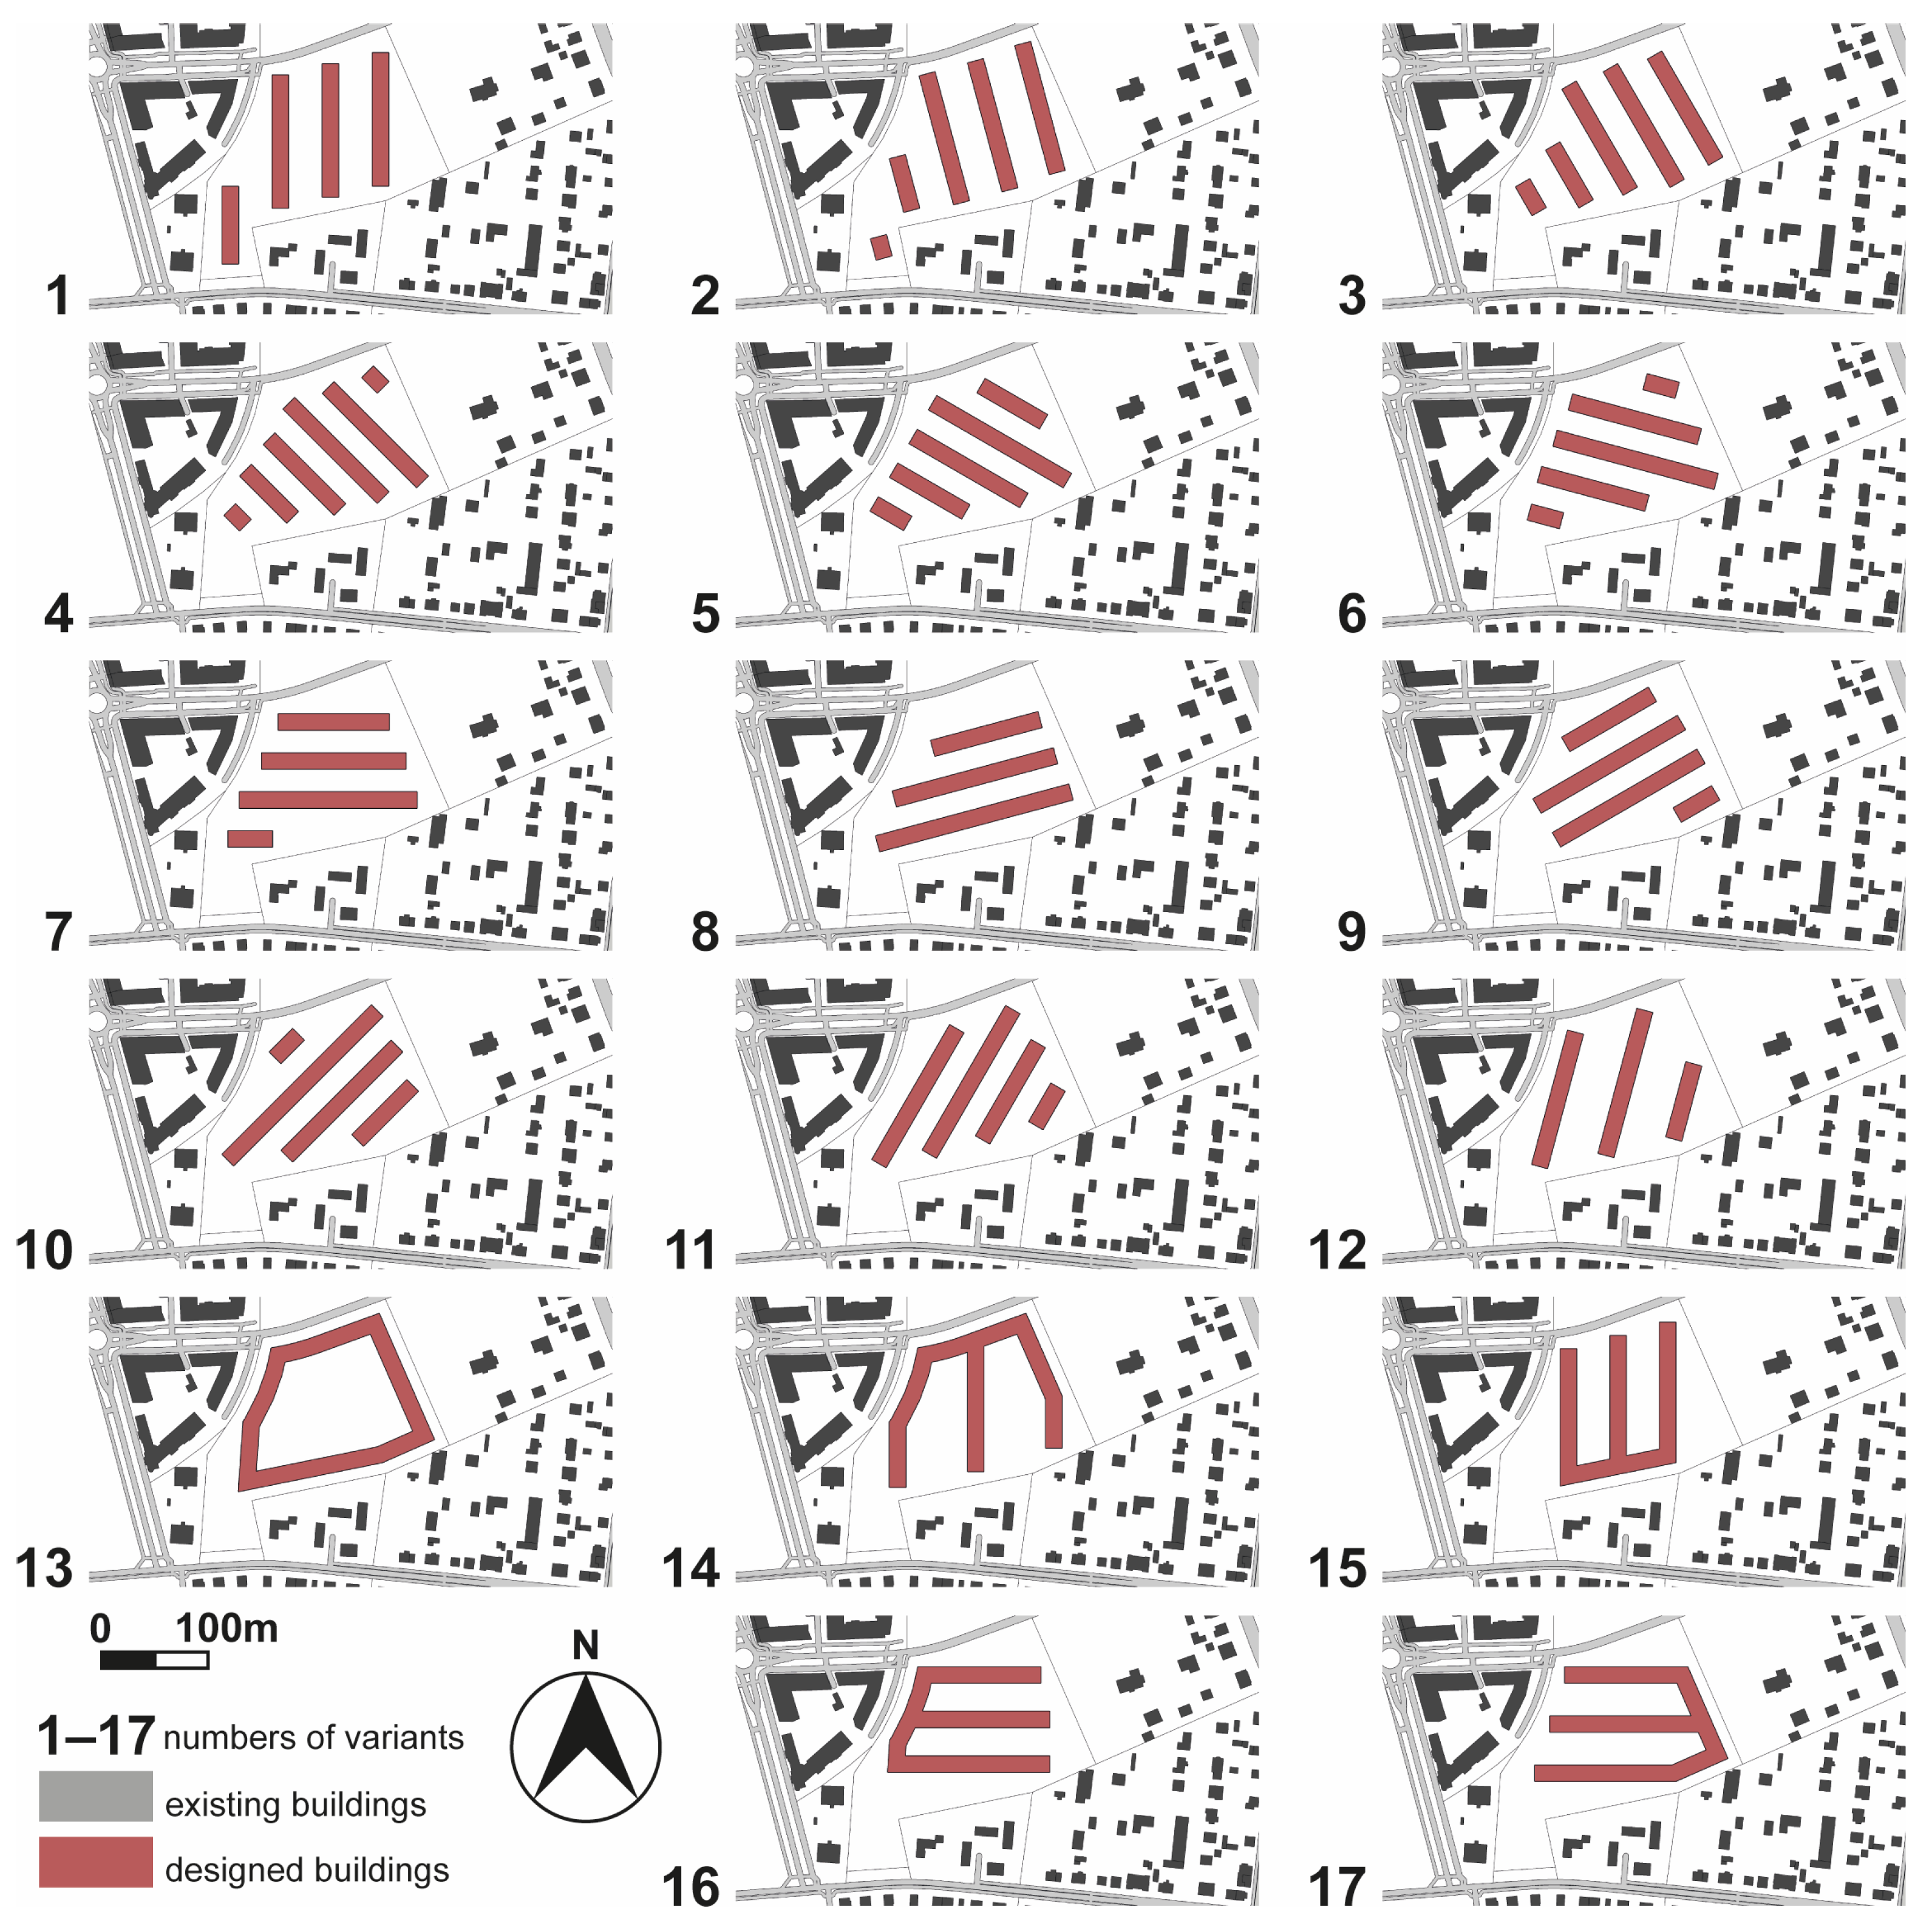
- Variants 1–12: Parallel buildings along the north–south axis;
- Variant 13: Perimeter frontage buildings along the streets, around the quarter, with one large courtyard inside;
- Variants 14–17: Comb-shaped layouts of buildings with the courtyards open to different sides of the plot: south, north, east, and west.


2.3. Research Methods and Tools
- SketchUp 2020 for 3D modeling;
- OpenStudio Application Release v. 1.2.1/OpenStudio SDK (core) Version 3.2.1 with SketchUp Plugin Version v. 1.4.0 for energy performance calculation.
- Thermal zones: type, 189.1–2009, midrise apartment, Apartment CZ4-8
- Loads: people, 0.03 people/m2; interior lights, 10.65 W/m2; electric equipment, 3.88 W/m2
- Heat transfer coefficient Uw (W/m2K) = 0.9
- Solar heat gain coefficient g = 0.55
- Visible transmittance Lt = 0.75
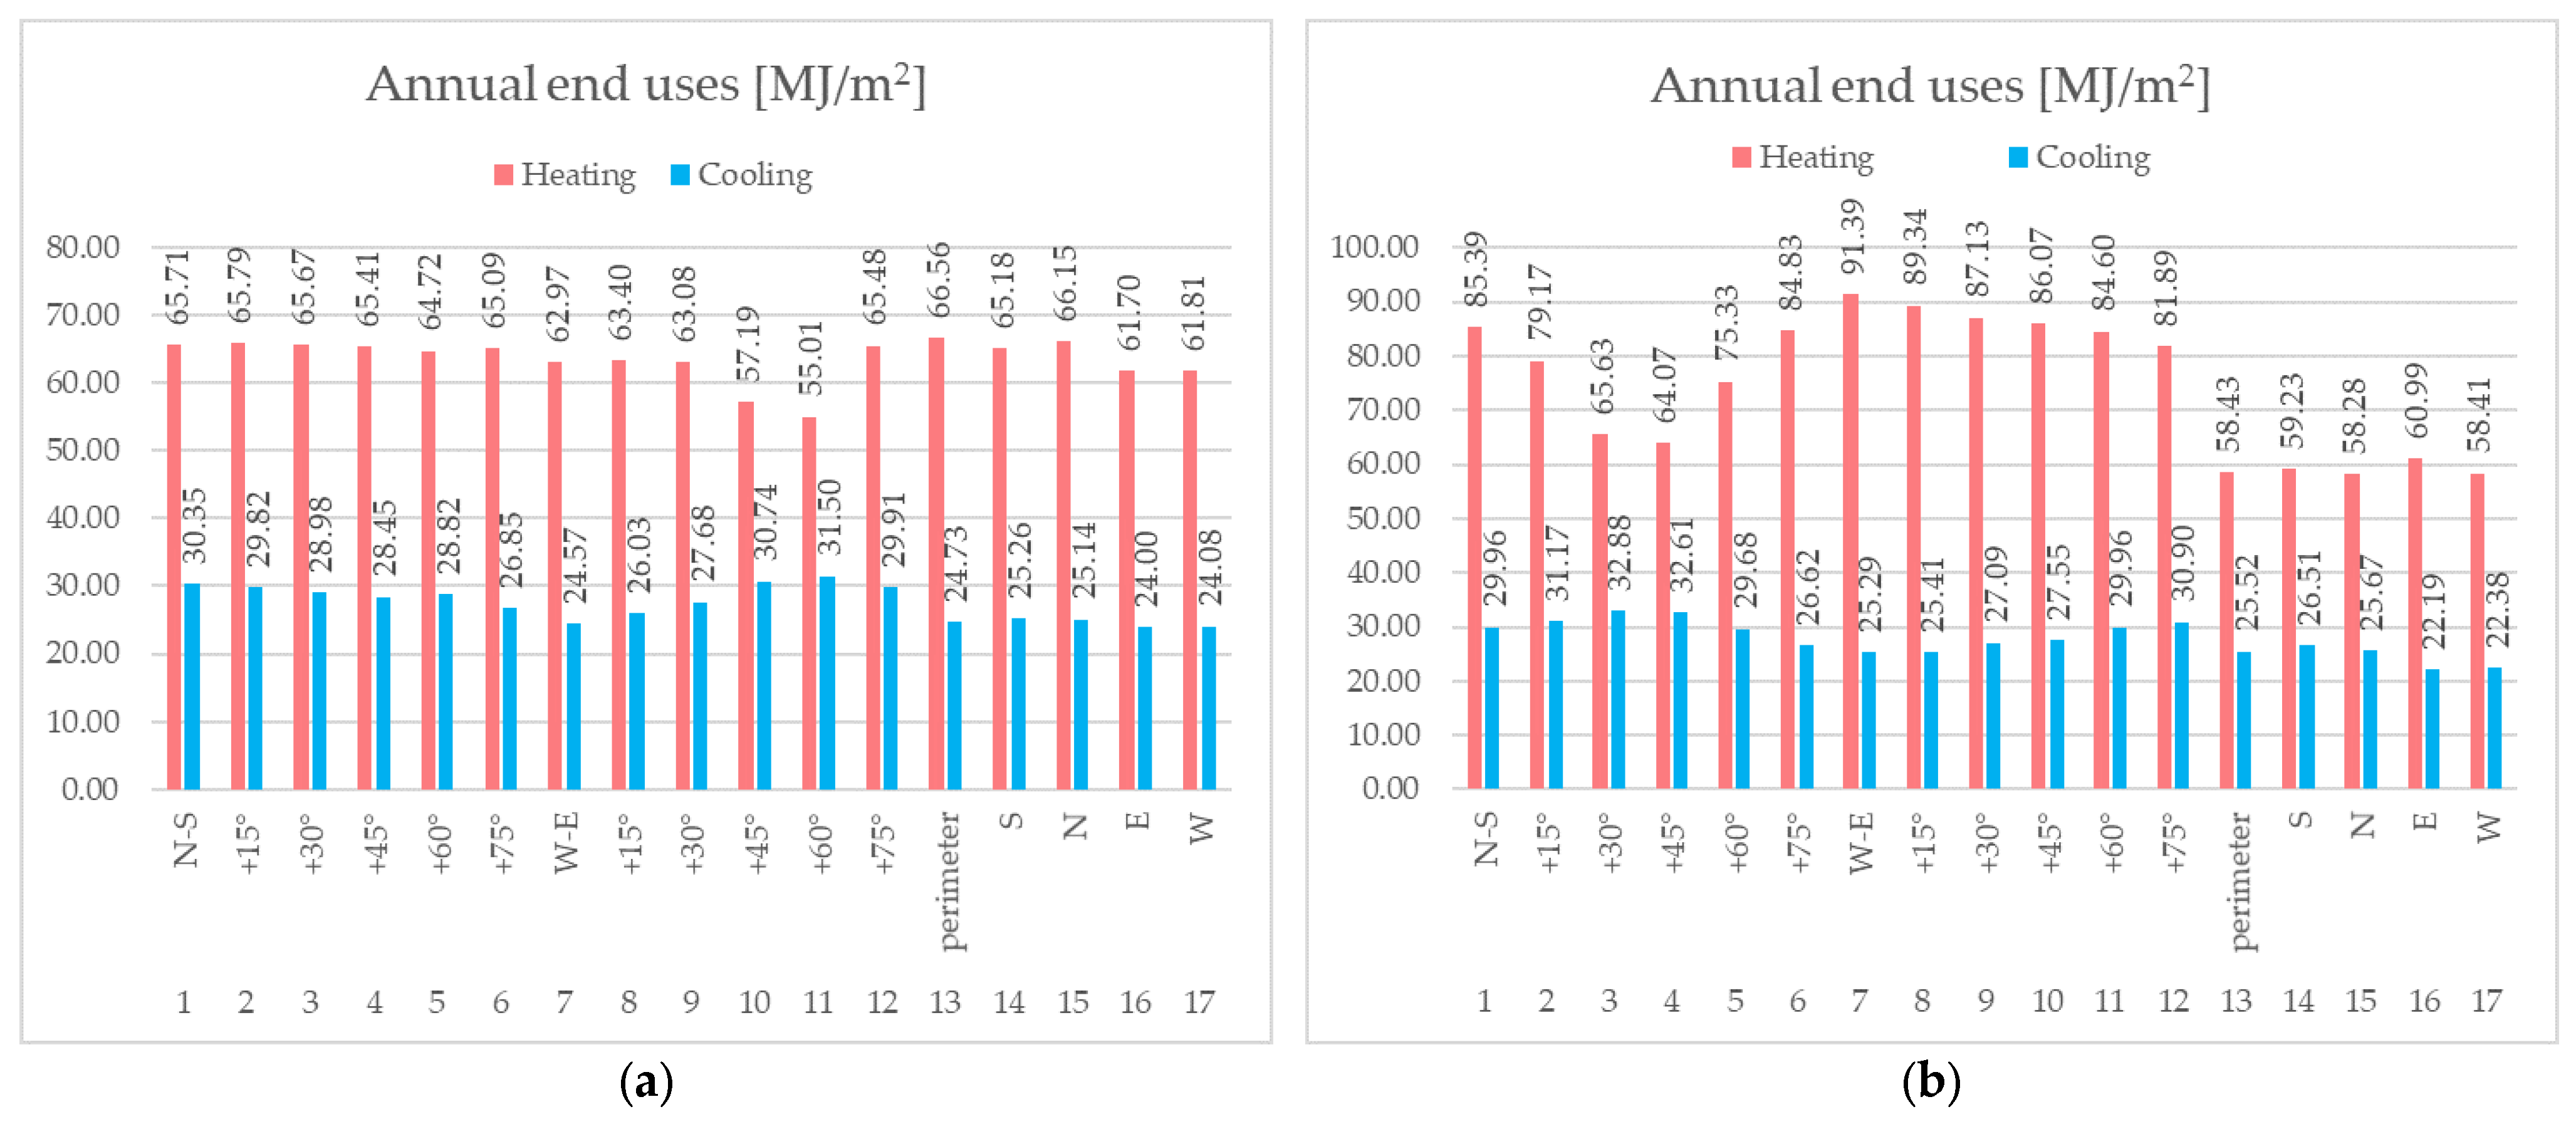
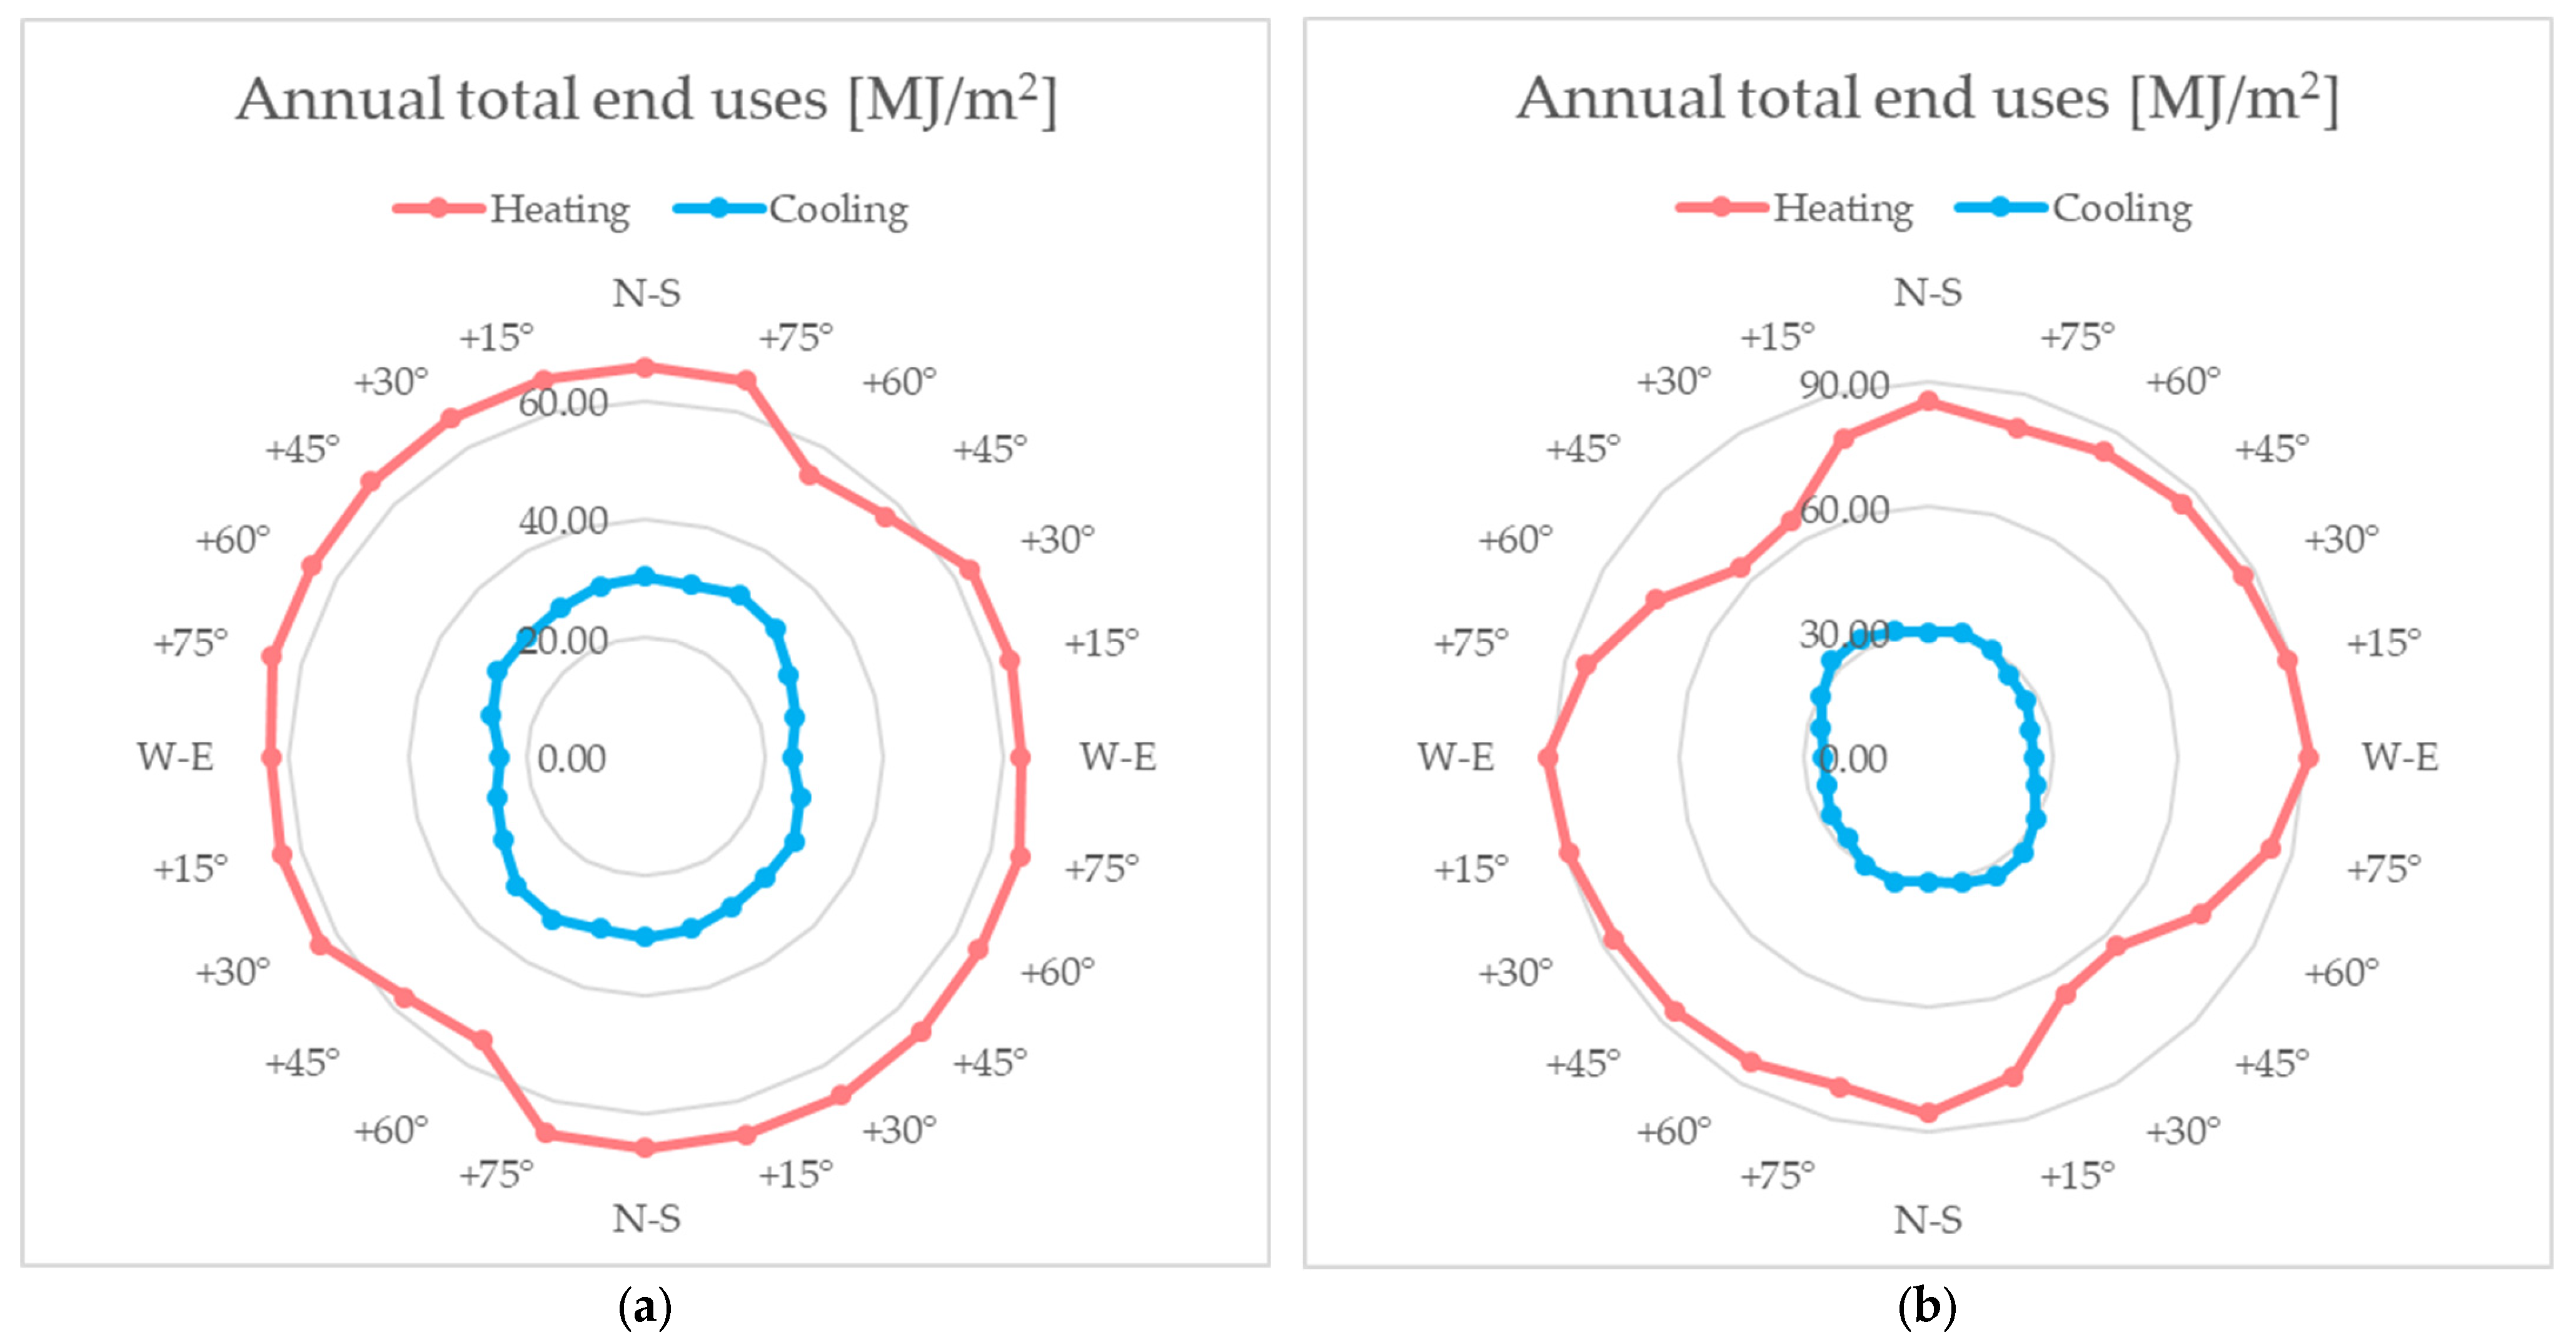
- Annual end uses:
- For the purposes of heating
- For the purposes of cooling
- Total
- Annual building sensible heat gain components:
- Window heat addition
- Window heat removal
- Opaque surface conduction and other heat removal
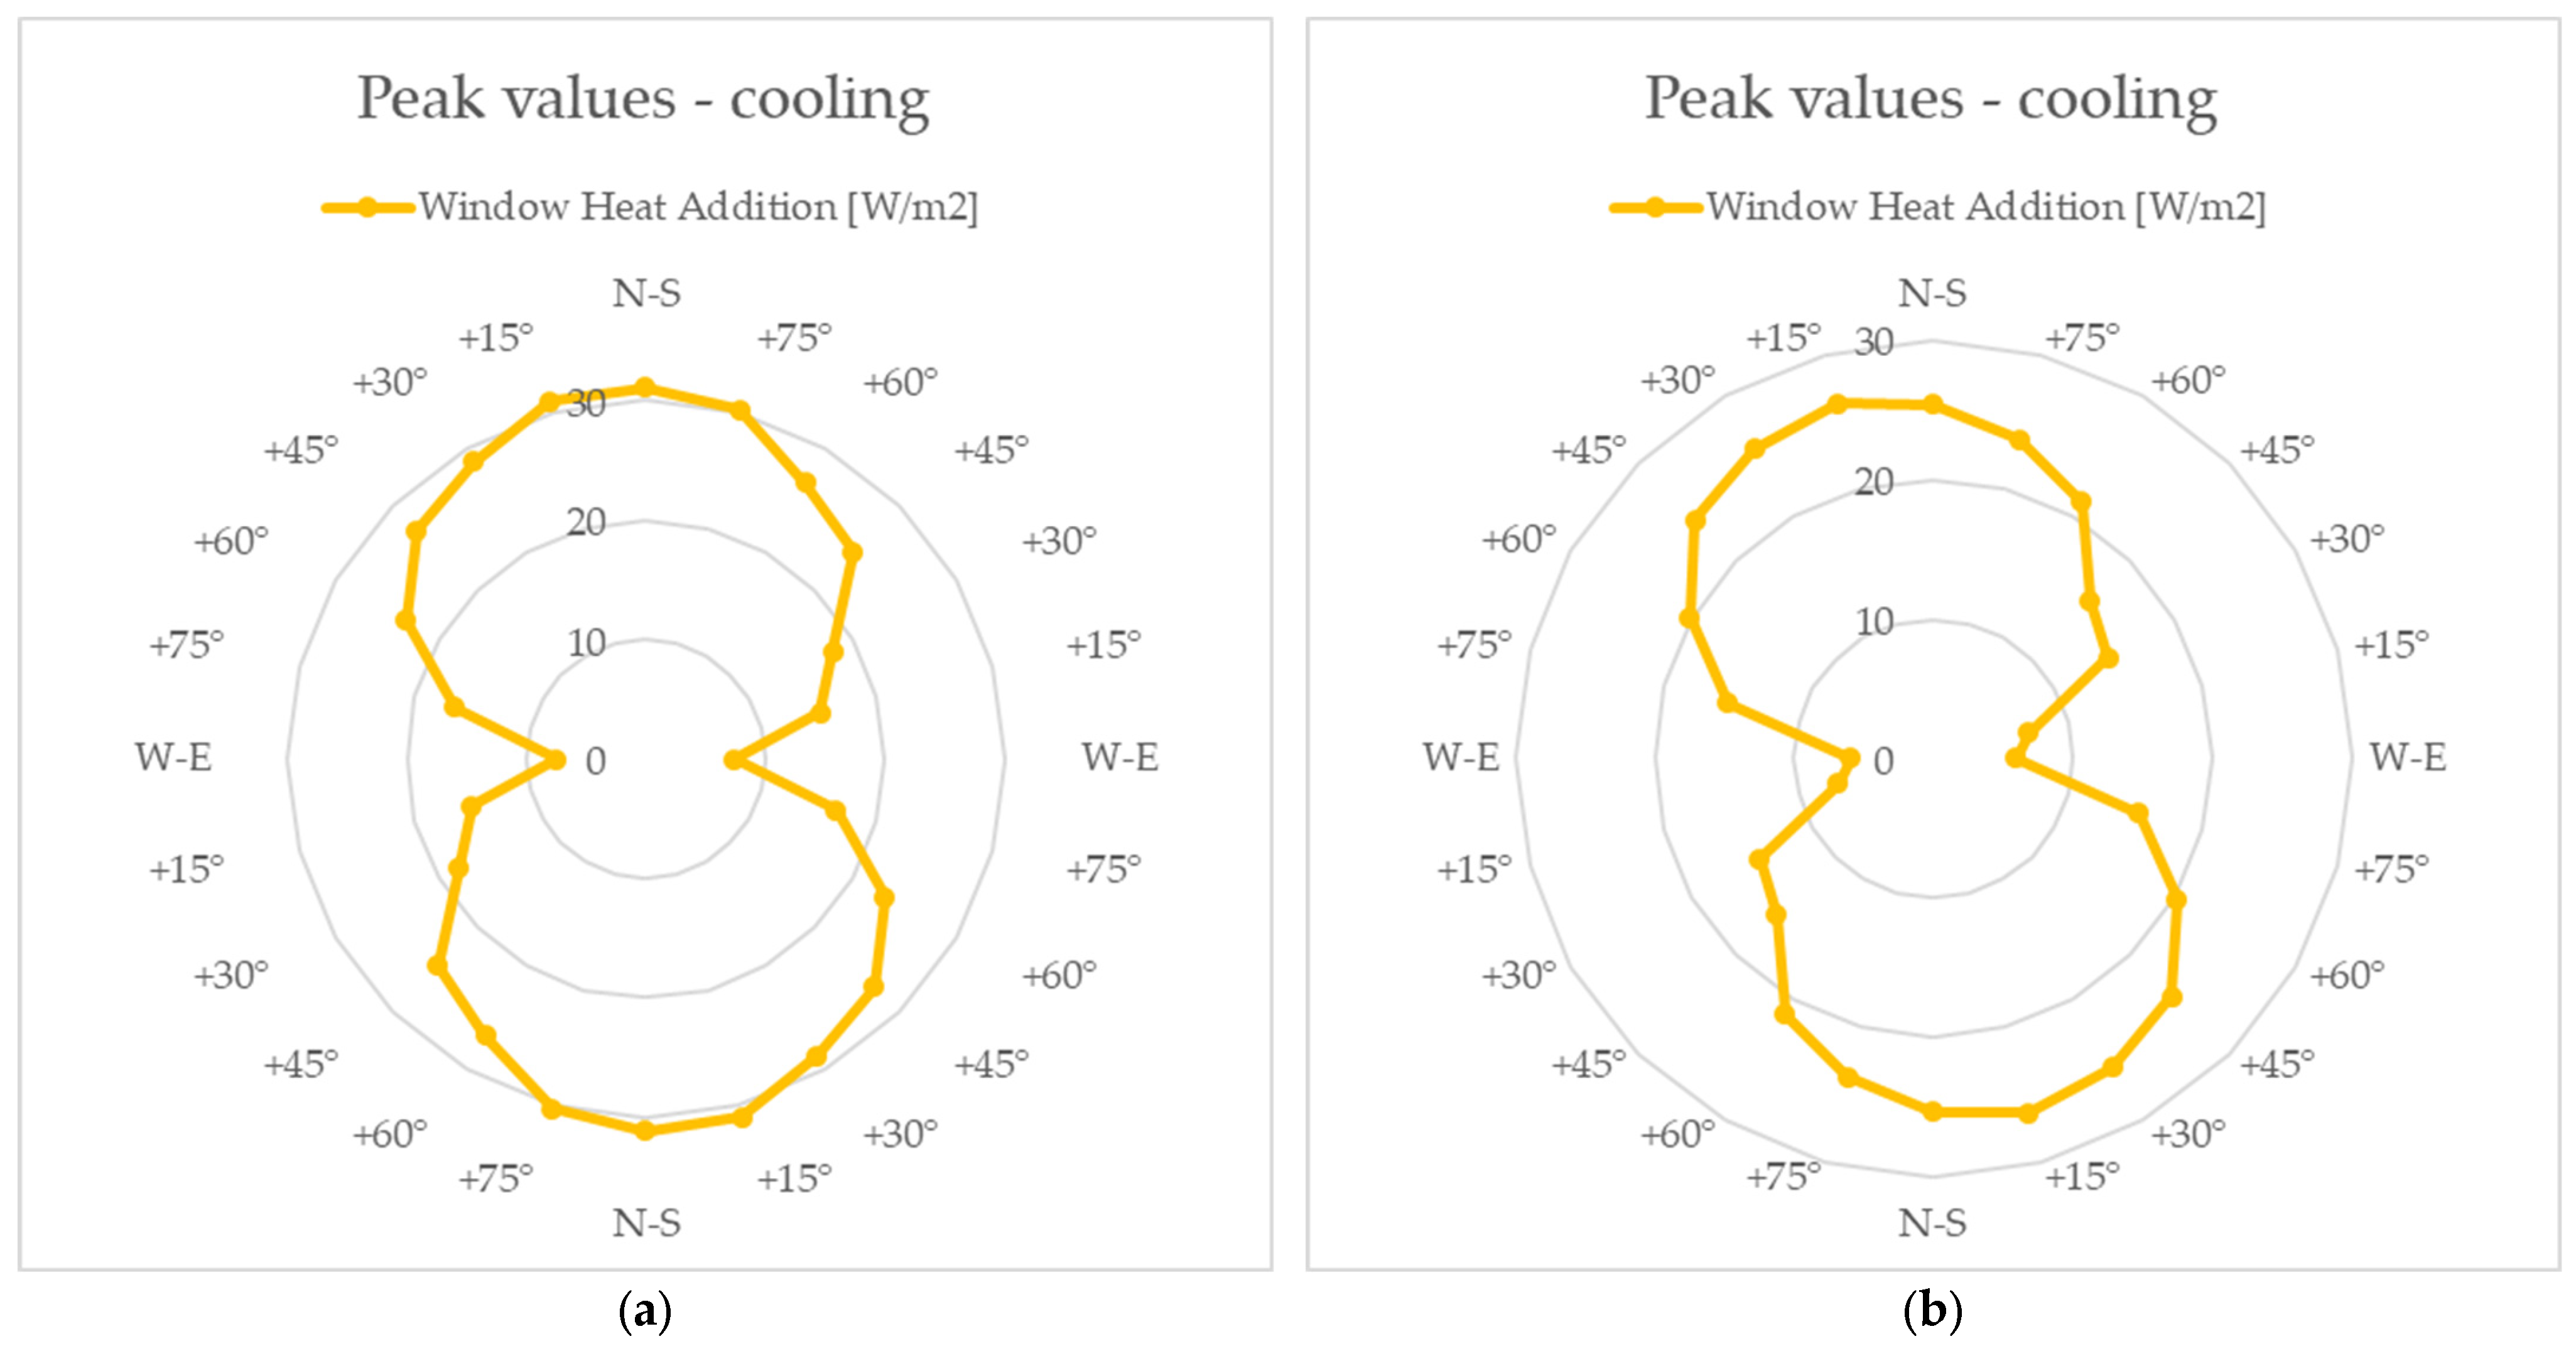
- Peak cooling sensible heat gain components:
- Window heat addition
- Peak heating sensible heat gain components:
- Window heat removal
- Opaque surface conduction and other heat removal
3. Results
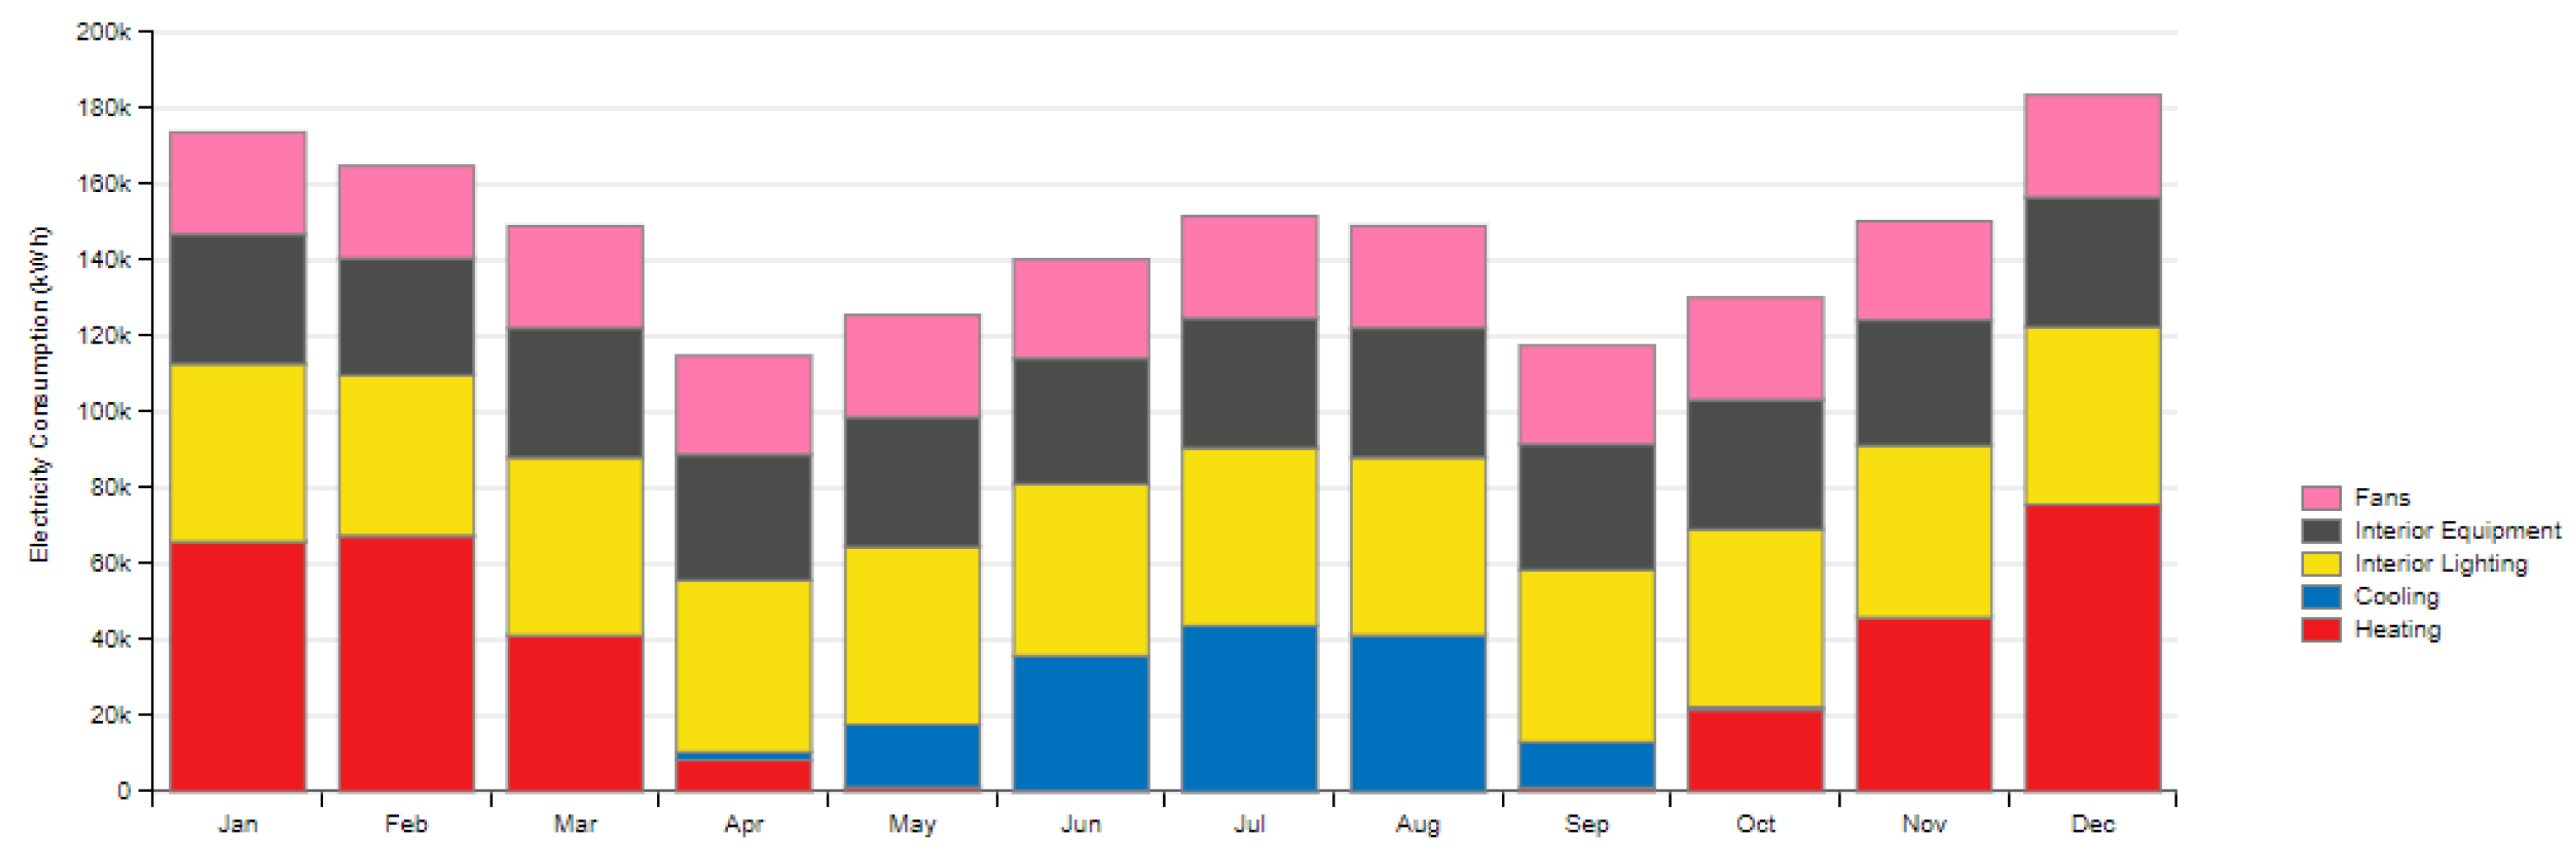
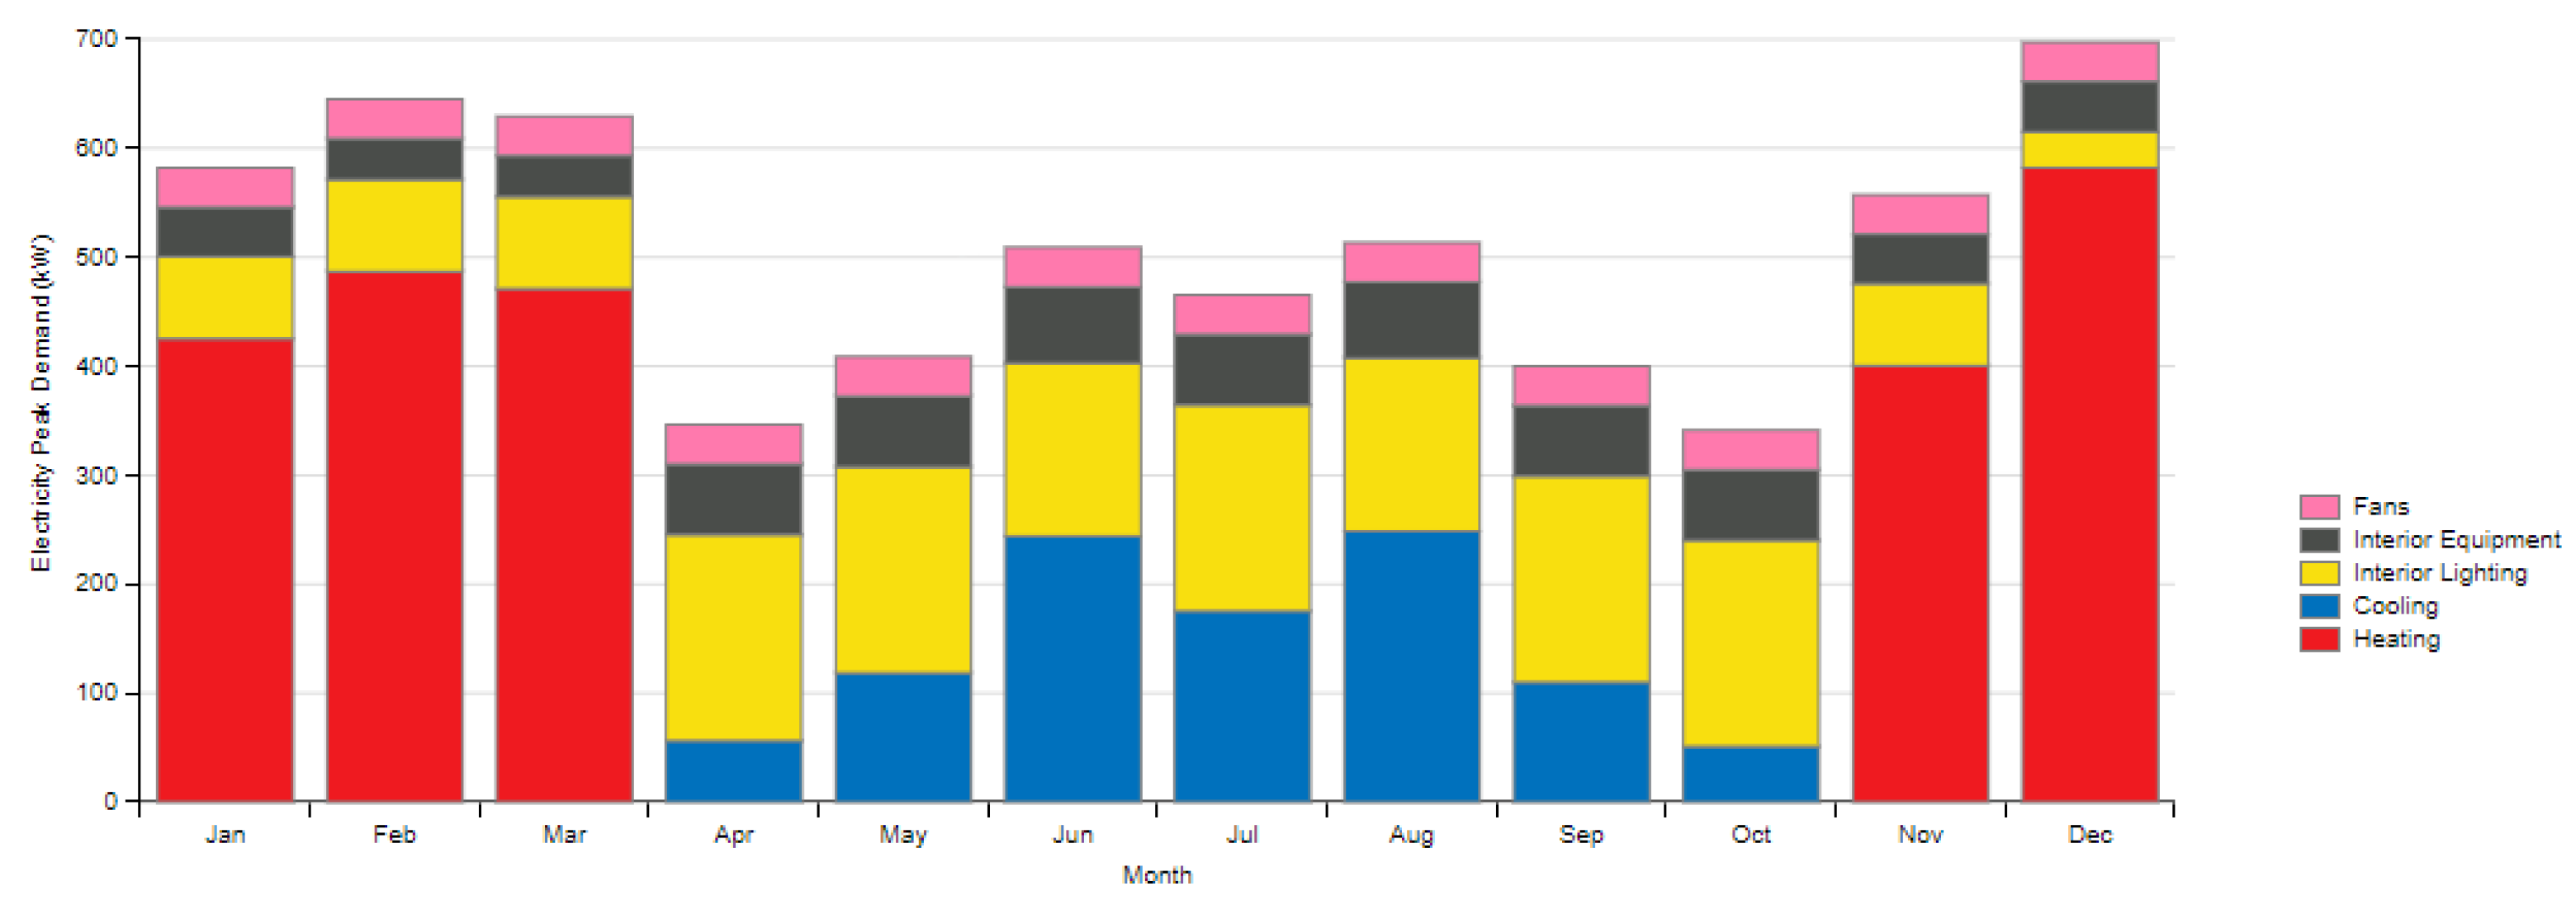
- The overall energy demand for heating, cooling, interior lighting, interior equipment, and fans, calculated annually and monthly;
- The peak energy demand for heating, cooling, interior lighting, interior equipment, and fans, calculated for the extreme values in each month.
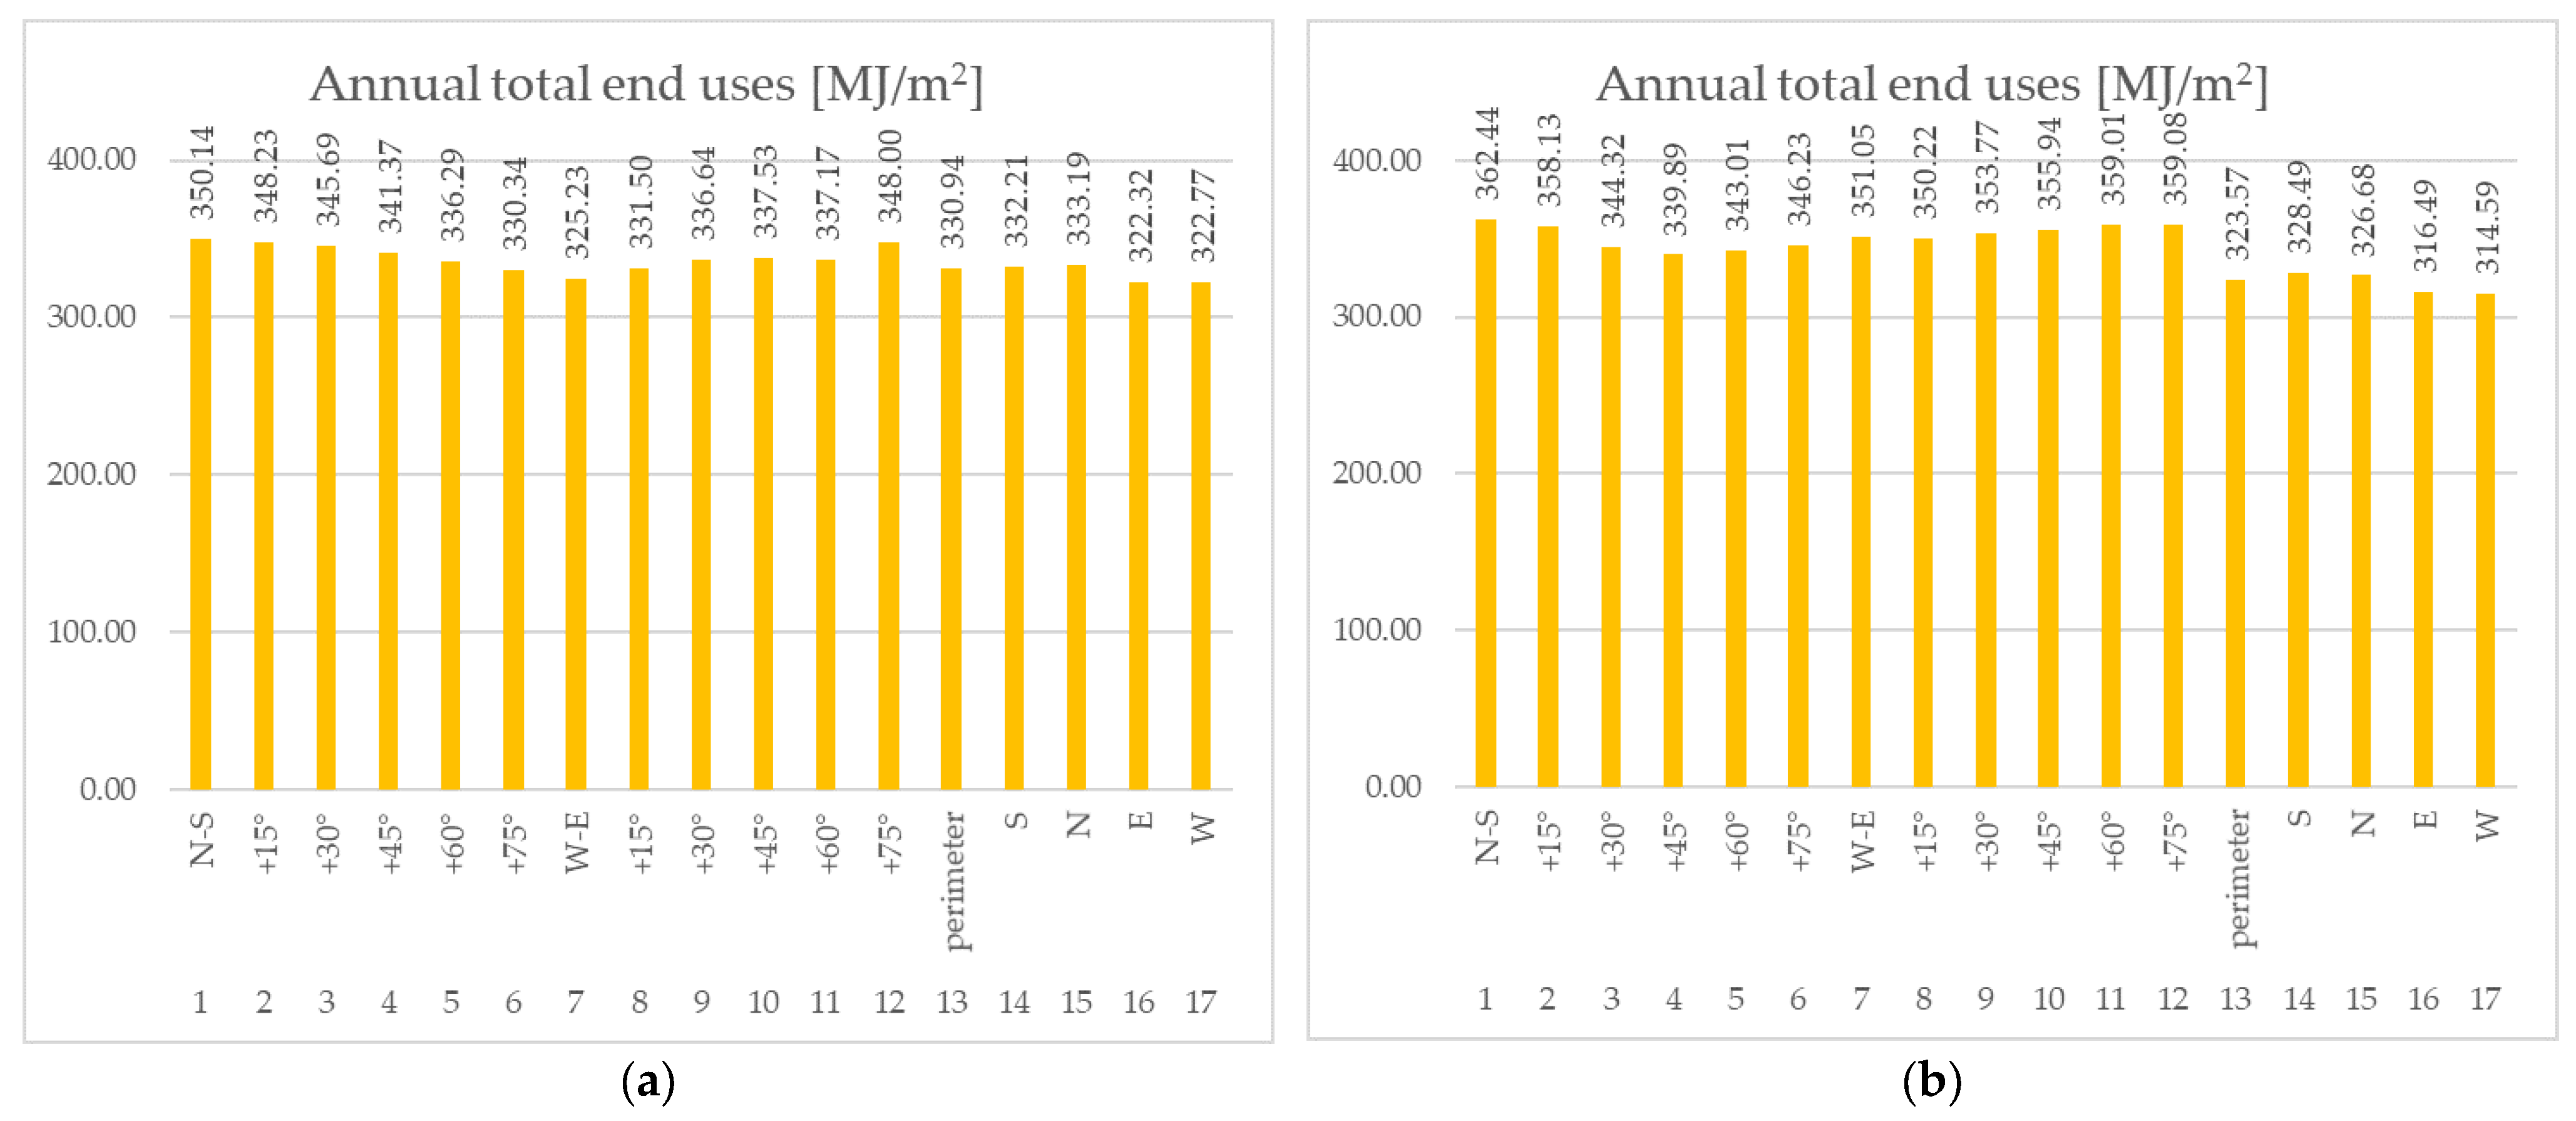
- Frontage or comb-shaped layouts result in lower energy demand than free-standing linear layouts.
- In the case of linear layouts, the orientation towards the sides of the world is crucial; orientation along the north–south axis is not recommended due to the highest risk of overheating as well as the overall energy demand. The changes in energy consumption for heating and cooling occurring with the change in direction are opposite to each other.
- East and west facades are exposed to the greatest risk of overheating.
- The best possibility to benefit from passive solar gains in winter is on facades exposed to the south; layouts with larger distances between facades located in that direction are preferred.
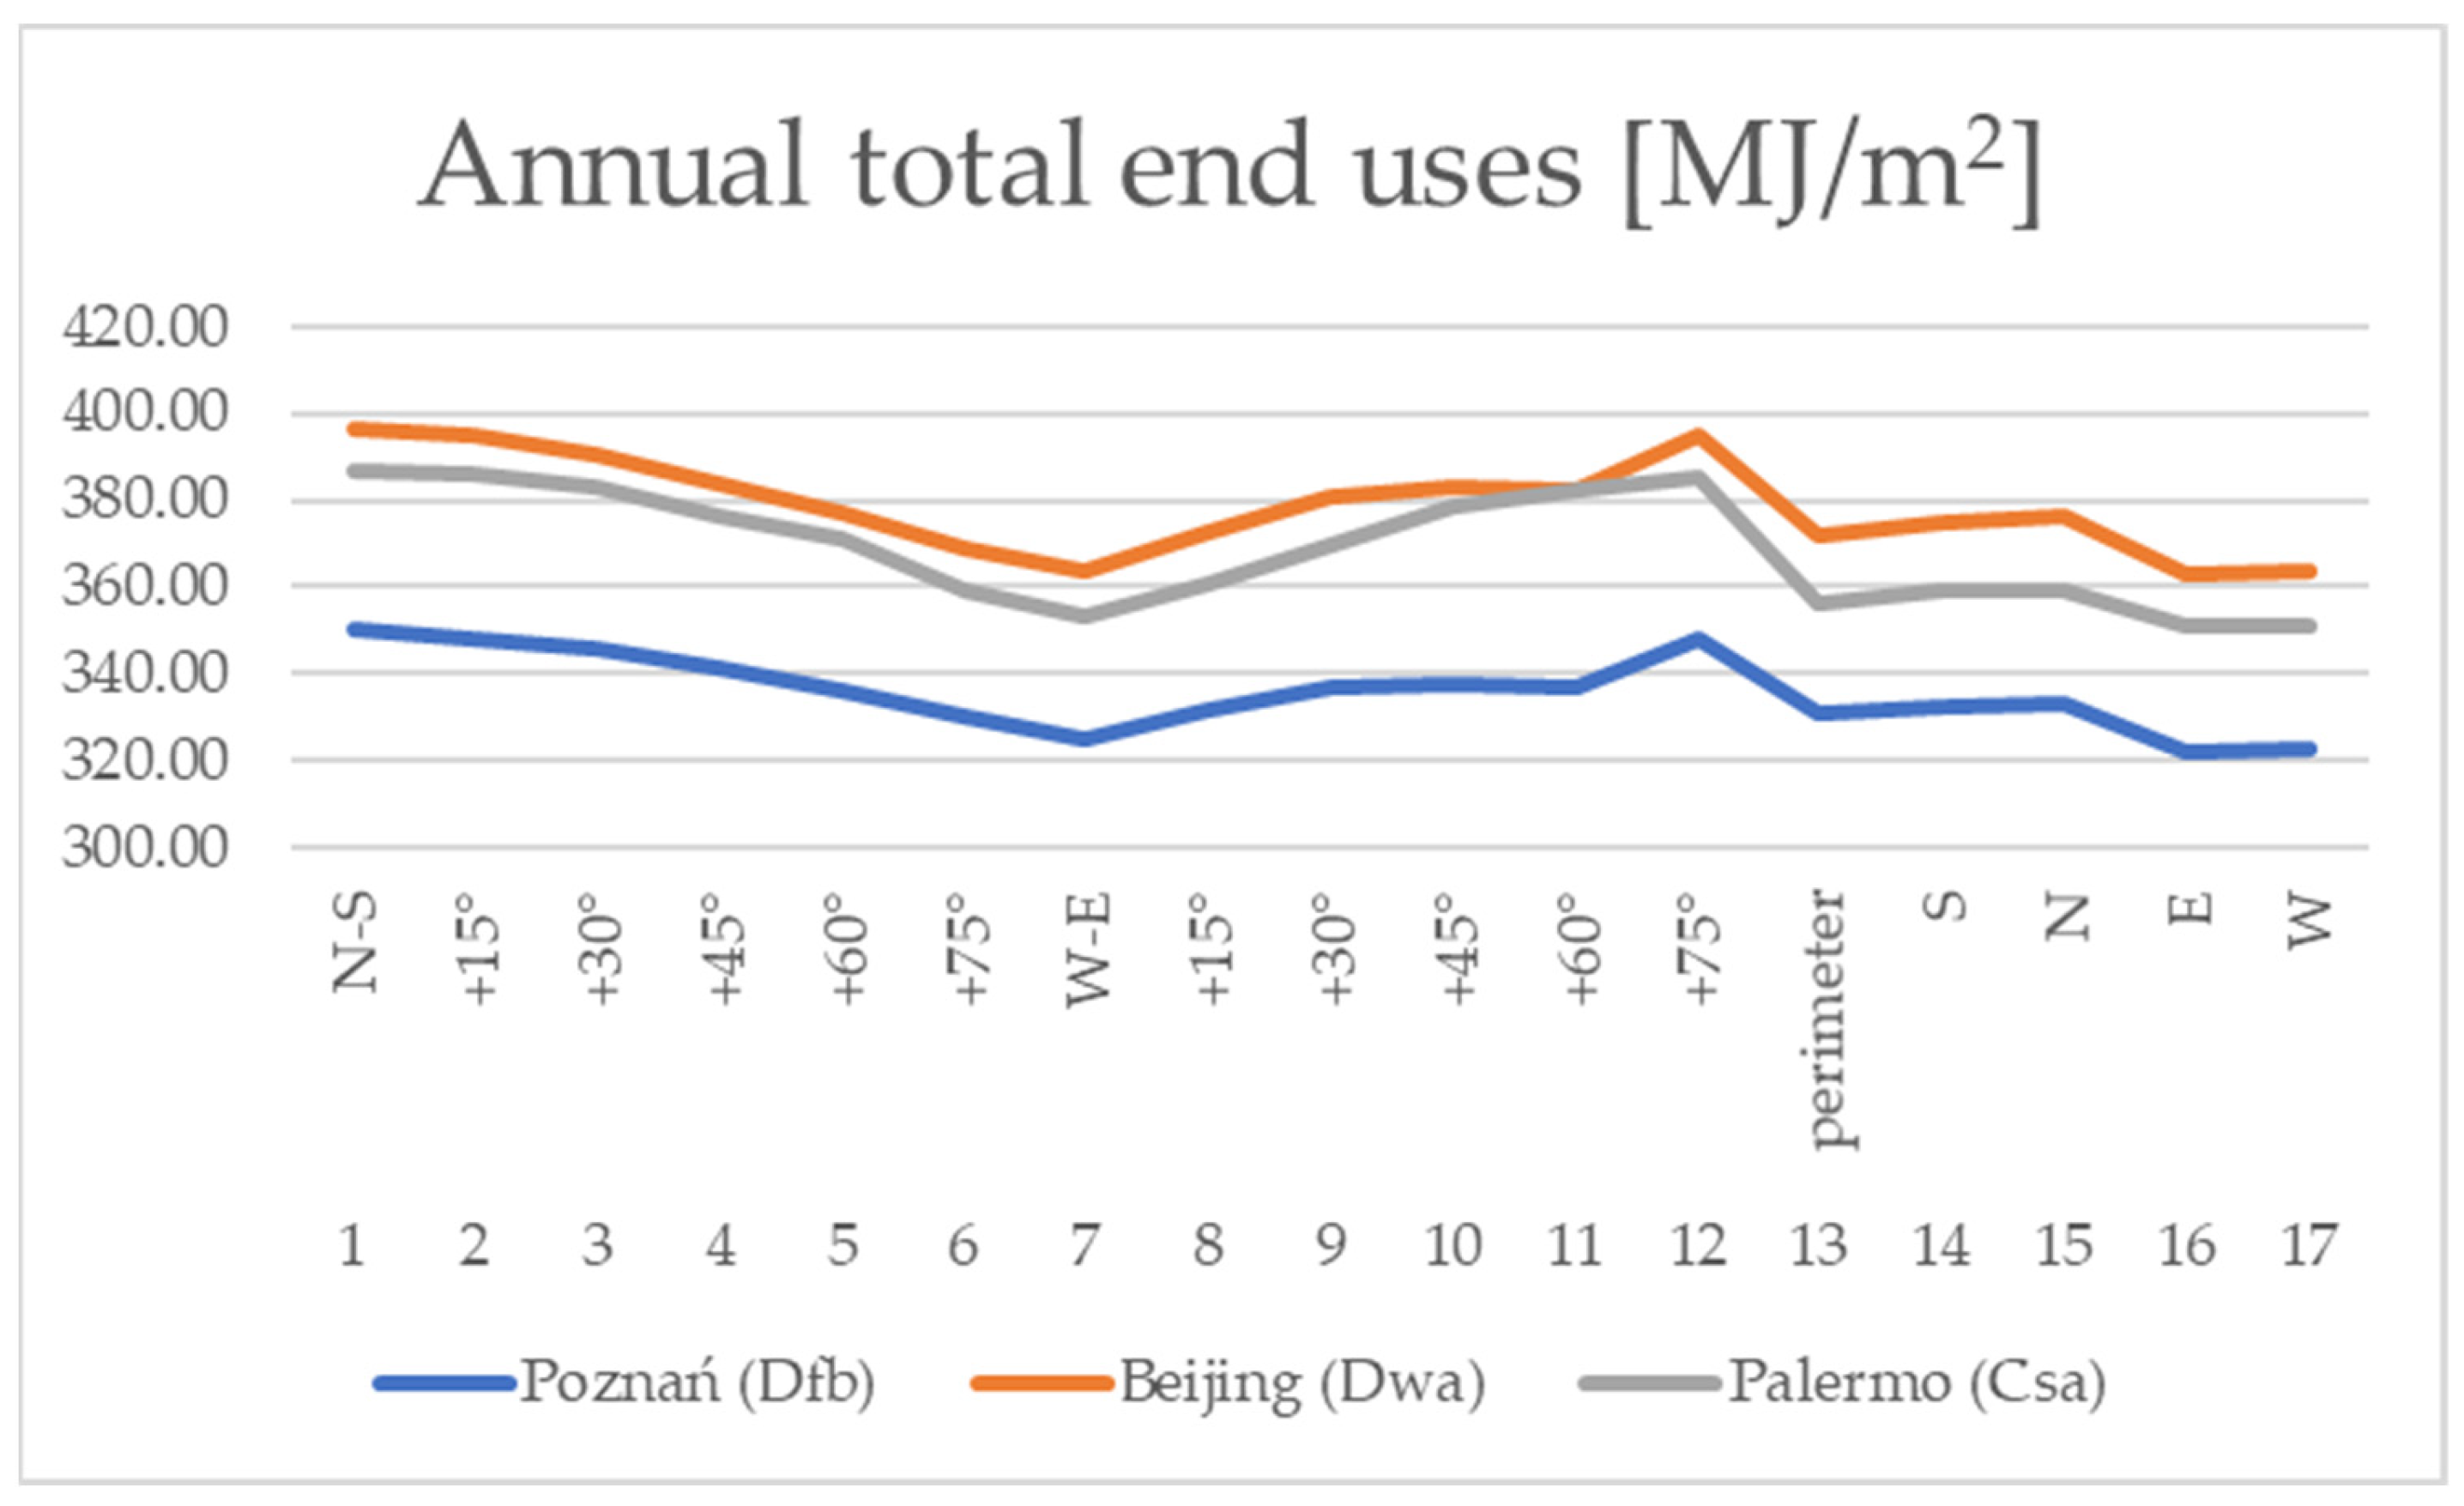
4. Discussion
- Beijing (39.9243, 116.3881)—Köppen–Geiger climate zone (Dwa)
- Palermo (38.1156, 13.3556)—Köppen–Geiger climate zone (Bdf)
5. Summary and Conclusions
- At the early stages of design, urban planning should analyze the arrangement of blocks in terms of energy efficiency on par with the aspect of composition, landscape, functionality, transportation, etc.
- Further stages of urban design should incorporate additional energy analyses of urban ventilation (wind speed), the shape and color of building facades, insulation materials, the layout of greenery, etc.
- Final approval of the urban project should come as a result of a multi-variant analysis of the space design concept, which consists of examining various layouts of the plot in terms of energy savings, in order to select the best variant.
Author Contributions
Funding
Institutional Review Board Statement
Informed Consent Statement
Data Availability Statement
Conflicts of Interest
References
- Sismanidis, P.; Bechtel, B.; Perry, M.; Ghent, D. The Seasonality of Surface Urban Heat Islands across Climates. Remote Sens. 2022, 14, 2318. [Google Scholar] [CrossRef]
- Abdollahzadeh, N.; Biloria, N. Urban microclimate and energy consumption: A multi-objective parametric urban design approach for dense subtropical cities. Front. Archit. Res. 2022, 3, 11. [Google Scholar] [CrossRef]
- Zou, Y.; Deng, Y.; Xia, D.; Guo, J.; Zhong, Z. Comprehensive analysis on the energy resilience performance of urban residential sector in hot-humid area of China under climate change. Sustain. Cities Soc. 2023, 88, 104233. [Google Scholar] [CrossRef]
- Abdollahzadeh, N.; Biloria, N. Outdoor thermal comfort: Analyzing the impact of urban configurations on the thermal performance of street canyons in the humid subtropical climate of Sydney. Front. Archit. Res. 2021, 2, 10. [Google Scholar] [CrossRef]
- Abd Elsalam, M.F. Breaking through the classical determinants in the field of hyper urban planning. Constr. Innov. 2021, 21, 818–836. [Google Scholar] [CrossRef]
- Ronchi, S.; Salata, S.; Arcidiacono, A. Which urban design parameters provide climate-proof cities? An application of the Urban Cooling InVEST Model in the city of Milan comparing historical planning morphologies. Sustain. Cities Soc. 2020, 63, 102459. [Google Scholar] [CrossRef]
- Klemm, C.; Wiese, F. Indicators for the optimization of sustainable urban energy systems based on energy system modeling. Energy Sustain. Soc. 2022, 12, 3. [Google Scholar] [CrossRef]
- Hillman, A.; Fisher, U.; Shapiro, M.A. Systematic Methodology for Design of Sustainable Urban Neighborhood Energy Infrastructure. Sustainability 2022, 14, 259. [Google Scholar] [CrossRef]
- Hachem-Vermette, C.; Singh, K. Energy Systems and Energy Sharing in Traditional and Sustainable Archetypes of Urban Developments. Sustainability 2022, 14, 1356. [Google Scholar] [CrossRef]
- Khan, K.; Szopik Depczyńska, K.; Dembińska, I.; Ioppolo, G. Most Relevant Sustainability Criteria for Urban Infrastructure Projects-AHP Analysis for the Gulf States. Sustainability 2022, 14, 14717. [Google Scholar] [CrossRef]
- Skórzewski, W. Potential of using greenery to reduce overheating of buildings in Polish climate conditions. Sci. Rev. Eng. Environ. Sci. 2019, 28, 619–631. [Google Scholar] [CrossRef] [Green Version]
- Danis, J.; Mishra, S.; Rempel, A.R. Direct heat flux sensing for window shading control in passive cooling systems. Energy Build. 2022, 261, 111950. [Google Scholar] [CrossRef]
- Feist, W.; Munzenberg, U.; Thumulla, J. Podstawy Budownictwa Pasywnego; Polski Instytut Budownictwa Pasywnego: Gdańsk, Poland, 2009. [Google Scholar]
- Dequaire, X. Passivhaus as a low-energy building standard: Contribution to a typology. Energy Effic. 2012, 5, 377–391. [Google Scholar] [CrossRef]
- Schnieders, J.; Feist, W.; Rongen, L. Passive Houses for different climate zones. Energy Build. 2015, 105, 71–87. [Google Scholar] [CrossRef]
- Huang, H.; Binti Wan Mohd Nazi, W.I.; Yu, Y.; Wang, Y. Energy performance of a high-rise residential building retrofitted to passive building standard—A case study. Appl. Therm. Eng. 2020, 181, 115902. [Google Scholar] [CrossRef]
- Fedorczak-Cisak, M.; Furtak, M.; Surówka, M. Possibilities of achieving the nZEB building standard (nearly zero energy building) and the passive building standard for newly designed buildings in Poland. IOP conference series. Mater. Sci. Eng. 2020, 960, 32095. [Google Scholar] [CrossRef]
- Schnieders, J.; Eian, T.D.; Filippi, M.; Florez, J.; Kaufmann, B.; Pallantzas, S.; Paulsen, M.; Reyes, E.; Wassouf, M.; Yeh, S. Design and realisation of the Passive House concept in different climate zones. Energy Effic. 2020, 13, 561–1604. [Google Scholar] [CrossRef]
- Zou, Y.; Xiang, K.; Zhan, Q.; Li, Z. A simulation-based method to predict the life cycle energy performance of residential buildings in different climate zones of China. Build. Environ. 2021, 193, 07663. [Google Scholar] [CrossRef]
- Ismail, K.A.R.; Lago, T.G.S.; Lino, F.A.M.; Mondlane, M.V.; Teles, M.P.R. Experimental investigation on ventilated window with reflective film and development of correlations. Sol. Energy 2021, 230, 421–434. [Google Scholar] [CrossRef]
- Amado, M.; Poggi, F. Solar Urban Planning: A Parametric Approach. Energy Procedia 2014, 48, 1539–1548. [Google Scholar] [CrossRef] [Green Version]
- Amado, M.; Poggi, F. Towards solar urban planning: A new step for better Energy performance. Energy Procedia 2012, 30, 1261–1273. [Google Scholar] [CrossRef] [Green Version]
- Strømann-Andersen, J.; Sattrup, P.A. The urban canyon and building energy use: Urban density versus daylight and passive solar gains. Energy Build. 2011, 43, 2011–2020. [Google Scholar] [CrossRef]
- Deng, J.Y.; Wong, N.H.; Zheng, X. The Study of the Effects of Building Arrangement on Microclimate and Energy Demand of CBD in Nanjing, China. Procedia Eng. 2016, 169, 44–54. [Google Scholar] [CrossRef]
- Wang, F.; Sun, B.; Zheng, X.; Ji, X. Impact of Block Spatial Optimization and Vegetation Configuration on the Reduction of PM2.5 Concentrations: A Roadmap towards Green Transformation and Sustainable Development. Sustainability 2022, 14, 11622. [Google Scholar] [CrossRef]
- Tong, S.; Wong, N.H.; Jusuf, S.K.; Tan, C.L.; Wong, H.F.; Ignatius, M.; Tan, E. Study on correlation between air temperature and urban morphology parameters in built environment in northern China. Build. Environ. 2018, 127, 239–249. [Google Scholar] [CrossRef]
- Zhao, M.; Künzel, H.M.; Antretter, F. Parameters influencing the energy performance of residential buildings in different Chinese climate zones. Energy Build. 2015, 96, 64–75. [Google Scholar] [CrossRef]
- Płoszaj-Mazurek, M. Machine Learning-Aided Architectural Design for Carbon Footprint Reduction. Builder 2020, 276, 35–39. [Google Scholar] [CrossRef]
- Skórzewski, W. Urban layout and energy savings. Acta Sci. Pol. Archit. 2020, 19, 3–10. [Google Scholar] [CrossRef]
- Czachura, A.; Gentile, N.; Kanters, J.; Wall, M. Identifying Potential Indicators of Neighbourhood Solar Access in Urban Planning. Buildings 2022, 12, 1575. [Google Scholar] [CrossRef]
- Guo, F.; Wang, Z.; Dong, J.; Zhang, H.; Lu, X.; Lau, S.S.Y.; Miao, Y. Spatial Differences in Outdoor Thermal Comfort during the Transition Season in Cold Regions of China. Buildings 2022, 12, 720. [Google Scholar] [CrossRef]
- Speroni, A.; Mainini, A.G.; Zani, A.; Paolini, R.; Pagnacco, T.; Poli, T. Experimental Assessment of the Reflection of Solar Radiation from Façades of Tall Buildings to the Pedestrian Level. Sustainability 2022, 14, 5781. [Google Scholar] [CrossRef]
- Wang, S.; Yi, Y.K.; Liu, N.X. Multi-objective optimization (MOO) for high-rise residential buildings’ layout centered on daylight, visual, and outdoor thermal metrics in China. Build. Environ. 2021, 205, 108263. [Google Scholar] [CrossRef]
- Kanters, J.; Gentile, N.; Bernardo, R. Planning for solar access in Sweden: Routines, metrics, and tools. Urban Plan. Transp. Res. 2021, 9, 347–367. [Google Scholar] [CrossRef]
- Leyla, K.; Farkhondeh, J.; Mousa, M.; Behnam, M. Design, evaluation, and optimization of an efficient solar-based multi-generation system with an energy storage option for Iran’s summer peak demand. Energy Convers. Manag. 2021, 242, 114324. [Google Scholar]
- Dwijendra, N.K.A.; Rahardja, U.; Kumar, N.B.; Patra, I.; Zahra, M.M.A.; Finogenova, Y.; Guerrero, J.W.G.; Izzat, S.E.; Alawsi, T. An Analysis of Urban Block Initiatives Influencing Energy Consumption and Solar Energy Absorption. Sustainability 2022, 14, 14273. [Google Scholar] [CrossRef]
- Veisi, O.; Shakibamanesh, A. Analysis of Solar Radiation towards Optimization and Location of the UrbanBlocks in the Neighborhood Units. Environ. Sci. Sustain. Dev. 2022, 7, 66–90. [Google Scholar] [CrossRef]
- Zeng, R.; Chini, A.; Ries, R. Innovative design for sustainability: Integrating embodied impacts and costs during the early design phase. Eng. Constr. Archit. Manag. 2021, 28, 747–764. [Google Scholar] [CrossRef]
- AboWardah, E.S. Bridging the gap between research and schematic design phases in teaching architectural graduation projects. Front. Archit. Res. 2020, 9, 82–105. [Google Scholar] [CrossRef]
- Bahgat, R.; Reffat, R.M.; Elkady, S.L. Energy Efficiency Design Guide for Optimal Urban Features of Open Spaces in Residential Complexes. ARCHive-SR 2019, 3, 136–152. [Google Scholar] [CrossRef]
- GUT LightLab; Faculty of Architecture; Gdansk University of Technology, Healthier and Environmentally Responsible Sustainable Cities and Communities. A New Design Framework and Planning Approach for Urban Illumination. Sustainability 2022, 14, 14525. [Google Scholar] [CrossRef]
- Shan, X.; Deng, Q.; Tang, Z.; Wu, Z.; Wang, W. An integrated data mining-based approach to identify key building and urban features of different energy usage levels. Sustain. Cities Soc. 2022, 77, 103576. [Google Scholar] [CrossRef]
- Natanian, J.; Aleksandrowicz, O.; Auer, T. A parametric approach to optimizing urban form, energy balance and environmental quality: The case of Mediterranean districts. Appl. Energy 2019, 254, 113637. [Google Scholar] [CrossRef]
- Giostra, S.; Masera, G.; Monteiro, R. Solar Typologies: A Comparative Analysis of Urban Form and Solar Potential. Sustainability 2022, 14, 9023. [Google Scholar] [CrossRef]
- Sattrup, P.A.; Strømann-Andersen, J. Building typologies in Northern European cities: Daylight, solar access, and building energy use. J. Archit. Plan. Res. 2013, 30, 56–76. [Google Scholar]
- Loeffler, R.; Geier, S.; Oesterreicher, D. Identification and quantification of urban planning related framework conditions on energy and resource-efficiency of urban building developments. Earth Environ. Sci. 2020, 588, 052038. [Google Scholar] [CrossRef]
- Amado, M.; Poggi, F. Solar energy integration in urban planning: GUUD model. Energy Procedia 2014, 50, 277–284. [Google Scholar] [CrossRef] [Green Version]
- Lobaccaro, G.; Frontini, F. Solar energy in urban environment: How urban densification affects existing buildings. Energy Procedia 2014, 48, 1559–1569. [Google Scholar] [CrossRef] [Green Version]
- Akrofi, M.M.; Okitasari, M. Integrating solar energy considerations into urban planning for low carbon cities: A systematic review of the state-of-the-art. Urban Gov. 2022, 2, 157–172. [Google Scholar] [CrossRef]
- Grid Report for Architecture–Fall 2021–Architecture Software. Available online: https://read.uberflip.com/i/1417145-g2-grid-report-architecture-software/0? (accessed on 2 July 2023).
- Regulation of the Minister of Infrastructure of 12, 04, 02 on technical specifications for buildings and their location. J. Laws Repub. Pol. 2002, 690, Erratum in J. Laws Repub. Pol. 2022, 1225.
- Nazarian, N.; Kleissl, J. CFD simulation of an idealized urban environment: Thermal effects of geometrical characteristics and surface materials. Urban Clim. 2015, 12, 141–159. [Google Scholar] [CrossRef]
- Naserikia, M.; Hart, M.A.; Nazarian, N.; Bechtel, B. Background climate modulates the impact of land cover on urban surface temperature. Sci. Rep. 2022, 12, 15433. [Google Scholar] [CrossRef]
- Nice, K.A.; Nazarian, N.; Lipson, M.J.; Hart, M.A.; Seneviratne, S.; Thompson, J.; Naserikia, M.; Godic, B.; Stevenson, M. Isolating the impacts of urban form and fabric from geography on urban heat and human thermal comfort. Build. Environ. 2022, 224, 109502. [Google Scholar] [CrossRef]
- Llaguno-Munitxa, M.; Shu, X.; Mistry, B. Multivariate analysis of the influence between building design and energy performance, sociodemographic metrics, and the intra-urban environment. J. Phys. 2021, 2069, 012056. [Google Scholar]
- Yeo, I.A.; Lee, E. Quantitative study on environment and energy information for land use planning scenarios in eco-city planning stage. Appl. Energy 2018, 230, 889–911. [Google Scholar] [CrossRef]
- Medeiros, E. Urban SUNstainability: A multi-dimensional policy evaluation framework proposal. Cidades 2020, 40, 117–133. [Google Scholar]
- Kanters, J.; Wall, M. Experiences from the urban planning process of a solar neighbourhood in Malmö, Sweden. Urban Plan. Transp. Res. 2018, 6, 54–80. [Google Scholar] [CrossRef] [Green Version]
- Formolli, M.; Croce, S.; Vettorato, D.; Paparella, R.; Scognamiglio, A.; Mainini, A.G.; Lobaccaro, G. Solar Energy in Urban Planning: Lesson Learned and Recommendations from Six Italian Case Studies. Appl. Sci. 2022, 12, 2950. [Google Scholar] [CrossRef]
- Negin, N.; Martilli, A.; Norford, L.; Kleissl, J. Impacts of Realistic Urban Heating. Part II: Air Quality and City Breathability. Bound.-Layer Meteorol. 2018, 168, 321–341. [Google Scholar]
- Yannas, S.; Rodríguez-Álvarez, J. Document details-Domestic overheating in a temperate climate: Feedback from London Residential Schemes. Sustain. Cities Soc. 2020, 59, 102189. [Google Scholar] [CrossRef]
- Rodriguez-Alvarez, J. Urban Energy Index for Buildings (UEIB): A new method to evaluate the effect of urban form on buildings’ energy demand. Landsc. Urban Plan. 2016, 148, 170–187. [Google Scholar] [CrossRef]
- Lopes, H.S.; Remoaldo, P.C.; Ribeiro, V.; Martín-Vide, J. A comprehensive methodology for assessing outdoor thermal comfort in touristic city of Porto (Portugal). Urban Clim. 2022, 45, 101264. [Google Scholar] [CrossRef]


| External Wall | ||
|---|---|---|
| Material | Λ (W/mK) | d (cm) |
| (Exterior, air) | ||
| Gypsum | 0.160 | 1.0 |
| Graphite Styrofoam EPS | 0.031 | 15.0 |
| Silicate blocks | 0.510 | 18.0 |
| Gypsum | 0.160 | 1.0 |
| (Interior) | ||
| Heat transfer coefficient U (W/m2K) | 0.182 | |
| External Roof | ||
|---|---|---|
| Material | λ (W/mK) | d (cm) |
| (Exterior, air) | ||
| Metal roofing | 45.006 | 0.2 |
| Graphite Styrofoam EPS | 0.031 | 20.0 |
| Concrete slab | 1.700 | 20.0 |
| Gypsum | 0.160 | 1.0 |
| (Interior) | ||
| Heat transfer coefficient U (W/m2K) | 0.148 | |
| Floor on Ground | ||
|---|---|---|
| Material | λ (W/mK) | d (cm) |
| (Interior, finishing layers) | ||
| Extruded polystyrene XPS | 0.035 | 12.0 |
| Concrete slab | 1.700 | 20.0 |
| (Exterior, ground contact) | ||
| Heat transfer coefficient U (W/m2K) | 0.269 | |
| Research Area No. 1 | Total End Uses | Sensible Heat Gain Components | |||||||
|---|---|---|---|---|---|---|---|---|---|
| Variant no. | Layout Orientation | Usable Floor Area [m2] | Heating [MJ/m2] | Cooling [MJ/m2] | Total [MJ/m2] | Window Heat Addition [MJ/m2] | Window Heat Removal [MJ/m2] | Opaque Surface Conduction and Other Heat Removal [MJ/m2] | |
| 1 | parallel | N-S | 18,000 | 65.71 | 30.35 | 350.14 | 112.10 | −42.05 | −129.65 |
| 2 | +15° | 18,000 | 65.79 | 29.82 | 348.23 | 110.26 | −42.02 | −129.23 | |
| 3 | +30° | 18,000 | 65.67 | 28.98 | 345.69 | 108.32 | −42.06 | −128.78 | |
| 4 | +45° | 18,000 | 65.41 | 28.45 | 341.37 | 108.86 | −41.99 | −128.50 | |
| 5 | +60° | 18,000 | 64.72 | 28.82 | 336.29 | 115.76 | −42.03 | −129.33 | |
| 6 | +75° | 18,000 | 65.09 | 26.85 | 330.34 | 108.09 | −41.77 | −127.65 | |
| 7 | W-E | 18,000 | 62.97 | 24.57 | 325.23 | 108.67 | −39.83 | −127.06 | |
| 8 | +15° | 18,000 | 63.40 | 26.03 | 331.50 | 111.85 | −41.85 | −128.35 | |
| 9 | +30° | 18,000 | 63.08 | 27.68 | 336.64 | 112.12 | −41.70 | −127.68 | |
| 10 | +45° | 18,000 | 57.19 | 30.74 | 337.53 | 116.40 | −44.11 | −131.86 | |
| 11 | +60° | 18,000 | 55.01 | 31.50 | 337.17 | 113.37 | −44.14 | −131.79 | |
| 12 | +75° | 18,000 | 65.48 | 29.91 | 348.00 | 111.97 | −42.01 | −129.47 | |
| 13 | perimeter | 18,000 | 66.56 | 24.73 | 330.94 | 102.45 | -40.13 | −129.39 | |
| 14 | comb-shaped | S | 18,000 | 65.18 | 25.26 | 332.21 | 97.91 | −37.96 | −127.50 |
| 15 | N | 18,000 | 66.15 | 25.14 | 333.19 | 95.16 | −38.03 | −127.69 | |
| 16 | E | 18,000 | 61.70 | 24.00 | 322.32 | 98.01 | −37.19 | −123.05 | |
| 17 | W | 18,000 | 61.81 | 24.08 | 322.77 | 97.67 | −37.21 | −123.01 | |
| Research Area No. 1 | Peak Cooling | Peak Heating | ||||||
|---|---|---|---|---|---|---|---|---|
| Variant no. | Layout Orientation | Usable Floor Area [m2] | Date | Window Heat Addition [W/m2] | Date | Window Heat Removal [W/m2] | Opaque Surface Conduction and Other Heat Removal [W/m2] | |
| 1 | parallel | N-S | 18,000 | 05-AUG | 31.11 | 12-DEC | −3.29 | −6.75 |
| 2 | +15° | 18,000 | 05-AUG | 31.04 | 12-DEC | −3.33 | −6.71 | |
| 3 | +30° | 18,000 | 05-AUG | 28.70 | 12-DEC | −3.37 | −6.65 | |
| 4 | +45° | 18,000 | 05-AUG | 27.05 | 12-DEC | −3.35 | −6.71 | |
| 5 | +60° | 18,000 | 05-AUG | 23.11 | 12-DEC | −3.28 | −6.73 | |
| 6 | +75° | 18,000 | 05-AUG | 16.54 | 12-DEC | −3.33 | −6.66 | |
| 7 | W-E | 18,000 | 29-JUN | 7.46 | 12-DEC | −3.09 | −6.44 | |
| 8 | +15° | 18,000 | 29-JUN | 15.08 | 12-DEC | −3.31 | −6.52 | |
| 9 | +30° | 18,000 | 29-JUN | 18.08 | 12-DEC | −3.29 | −6.40 | |
| 10 | +45° | 18,000 | 05-AUG | 24.55 | 12-DEC | −3.49 | −6.52 | |
| 11 | +60° | 18,000 | 05-AUG | 26.74 | 12-DEC | −3.50 | −6.46 | |
| 12 | +75° | 18,000 | 05-AUG | 30.29 | 12-DEC | −3.30 | −6.70 | |
| 13 | perimeter | 18,000 | 05-AUG | 15.60 | 12-DEC | -3.21 | −7.04 | |
| 14 | comb-shaped | S | 18,000 | 05-AUG | 20.33 | 12-DEC | −3.04 | −7.14 |
| 15 | N | 18,000 | 05-AUG | 20.10 | 12-DEC | −2.83 | −7.42 | |
| 16 | E | 18,000 | 05-AUG | 8.19 | 12-DEC | −2.94 | −6.09 | |
| 17 | W | 18,000 | 05-AUG | 8.31 | 12-DEC | −2.95 | −6.13 | |
| Research Area No. 1 | Total End Uses | Sensible Heat Gain Components | |||||||
|---|---|---|---|---|---|---|---|---|---|
| Variant No. | Layout Orientation | Usable Floor Area [m2] | Heating [MJ/m2] | Cooling [MJ/m2] | Total [MJ/m2] | Window Heat Addition [MJ/m2] | Window Heat Removal [MJ/m2] | Opaque Surface Conduction and Other Heat Removal [MJ/m2] | |
| 1 | parallel | N-S | 32,250 | 85.39 | 29.96 | 362.44 | 98.48 | −39.70 | −147.36 |
| 2 | +15° | 32,250 | 79.17 | 31.17 | 358.13 | 100.27 | −40.86 | −148.30 | |
| 3 | +30° | 32,250 | 65.63 | 32.88 | 344.32 | 96.61 | −40.83 | −148.11 | |
| 4 | +45° | 32,250 | 64.07 | 32.61 | 339.89 | 96.48 | −42.10 | −149.27 | |
| 5 | +60° | 32,250 | 75.33 | 29.68 | 343.01 | 95.96 | −40.45 | −144.83 | |
| 6 | +75° | 32,250 | 84.83 | 26.62 | 346.23 | 94.84 | −40.84 | −147.63 | |
| 7 | W-E | 32,250 | 91.39 | 25.29 | 351.05 | 92.66 | −39.57 | −145.66 | |
| 8 | +15° | 32,250 | 89.34 | 25.41 | 350.22 | 92.28 | −38.55 | −145.57 | |
| 9 | +30° | 32,250 | 87.13 | 27.09 | 353.77 | 95.34 | −39.78 | −146.71 | |
| 10 | +45° | 32,250 | 86.07 | 27.55 | 355.94 | 96.97 | −39.96 | −147.88 | |
| 11 | +60° | 32,250 | 84.60 | 29.96 | 359.01 | 98.62 | −39.67 | −145.66 | |
| 12 | +75° | 29,250 | 81.89 | 30.90 | 359.08 | 103.81 | −38.62 | −144.97 | |
| 13 | perimeter | 36,316 | 58.43 | 25.52 | 323.57 | 100.33 | −32.46 | −123.03 | |
| 14 | comb-shaped | S | 33,257 | 59.23 | 26.51 | 328.49 | 94.95 | −31.51 | −122.11 |
| 15 | N | 32,610 | 58.28 | 25.67 | 326.68 | 91.05 | −31.28 | −120.44 | |
| 16 | E | 33,389 | 60.99 | 22.19 | 316.49 | 87.93 | −31.41 | −121.12 | |
| 17 | W | 36,104 | 58.41 | 22.38 | 314.59 | 89.74 | −31.12 | −119.77 | |
| Research Area No. 1 | Peak Cooling | Peak Heating | ||||||
|---|---|---|---|---|---|---|---|---|
| Variant No. | Layout Orientation | Usable Floor Area [m2] | Date | Window Heat Addition [W/m2] | Date | Window Heat Removal [W/m2] | Opaque Surface Conduction and Other Heat Removal [W/m2] | |
| 1 | parallel | N-S | 18,000 | 05-AUG | 25.40 | 12-DEC | −4.34 | −7.39 |
| 2 | +15° | 18,000 | 05-AUG | 26.38 | 12-DEC | −4.47 | −7.36 | |
| 3 | +30° | 18,000 | 05-AUG | 25.64 | 12-DEC | −4.46 | −7.36 | |
| 4 | +45° | 18,000 | 05-AUG | 24.22 | 12-DEC | −4.59 | −7.44 | |
| 5 | +60° | 18,000 | 05-AUG | 20.18 | 12-DEC | −4.43 | −7.01 | |
| 6 | +75° | 18,000 | 05-AUG | 15.24 | 12-DEC | −4.44 | −7.08 | |
| 7 | W-E | 18,000 | 29-JUN | 5.94 | 12-DEC | −4.30 | −6.86 | |
| 8 | +15° | 18,000 | 29-JUN | 7.11 | 12-DEC | −4.19 | −6.90 | |
| 9 | +30° | 18,000 | 29-JUN | 14.44 | 12-DEC | −4.33 | −7.06 | |
| 10 | +45° | 18,000 | 29-JUN | 15.90 | 12-DEC | −4.33 | −6.86 | |
| 11 | +60° | 18,000 | 05-AUG | 21.21 | 12-DEC | −4.35 | −7.19 | |
| 12 | +75° | 18,000 | 05-AUG | 23.69 | 12-DEC | −4.24 | −6.85 | |
| 13 | perimeter | 18,000 | 29-JUN | 13.73 | 12-DEC | −2.44 | −6.51 | |
| 14 | comb-shaped | S | 18,000 | 05-AUG | 21.21 | 12-DEC | −2.41 | −6.65 |
| 15 | N | 18,000 | 05-AUG | 21.76 | 12-DEC | −2.40 | −6.08 | |
| 16 | E | 18,000 | 05-AUG | 6.54 | 12-DEC | −2.45 | −6.48 | |
| 17 | W | 18,000 | 05-AUG | 2.64 | 12-DEC | −2.39 | −6.08 | |
Disclaimer/Publisher’s Note: The statements, opinions and data contained in all publications are solely those of the individual author(s) and contributor(s) and not of MDPI and/or the editor(s). MDPI and/or the editor(s) disclaim responsibility for any injury to people or property resulting from any ideas, methods, instructions or products referred to in the content. |
© 2023 by the authors. Licensee MDPI, Basel, Switzerland. This article is an open access article distributed under the terms and conditions of the Creative Commons Attribution (CC BY) license (https://creativecommons.org/licenses/by/4.0/).
Share and Cite
Bonenberg, W.; Skórzewski, W.; Qi, L.; Han, Y.; Czekała, W.; Zhou, M. An Energy-Saving-Oriented Approach to Urban Design—Application in the Local Conditions of Poznań Metropolitan Area (Poland). Sustainability 2023, 15, 10994. https://0-doi-org.brum.beds.ac.uk/10.3390/su151410994
Bonenberg W, Skórzewski W, Qi L, Han Y, Czekała W, Zhou M. An Energy-Saving-Oriented Approach to Urban Design—Application in the Local Conditions of Poznań Metropolitan Area (Poland). Sustainability. 2023; 15(14):10994. https://0-doi-org.brum.beds.ac.uk/10.3390/su151410994
Chicago/Turabian StyleBonenberg, Wojciech, Wojciech Skórzewski, Ling Qi, Yuhong Han, Wojciech Czekała, and Mo Zhou. 2023. "An Energy-Saving-Oriented Approach to Urban Design—Application in the Local Conditions of Poznań Metropolitan Area (Poland)" Sustainability 15, no. 14: 10994. https://0-doi-org.brum.beds.ac.uk/10.3390/su151410994