Prediction of Heavy Rain Damage Using Deep Learning


1
Department of Civil Engineering, Inha University, Michuhol-Gu, Incheon 22212, Korea
2
Risk Management Office, KB Claims Survey & Adjusting, Gangnam-gu, Seoul 06212, Korea
*
Author to whom correspondence should be addressed.
Water 2020, 12(7), 1942; https://0-doi-org.brum.beds.ac.uk/10.3390/w12071942
Submission received: 2 May 2020
/
Revised: 2 July 2020
/
Accepted: 6 July 2020
/
Published: 8 July 2020
(This article belongs to the Special Issue Observation-Driven Understanding, Prediction, and Management in Hydrological/Hydraulic Hazard and Risk Studies)
Abstract
:Heavy rain damage prediction models were developed with a deep learning technique for predicting the damage to a region before heavy rain damage occurs. As a dependent variable, a damage scale comprising three categories (minor, significant, severe) was used, and meteorological data 7 days before the damage were used as independent variables. A deep neural network (DNN), convolutional neural network (CNN), and recurrent neural network (RNN), which are representative deep learning techniques, were employed for the model development. Each model was trained and tested 30 times to evaluate the predictive performance. As a result of evaluating the predicted performance, the DNN-based model and the CNN-based model showed good performance, and the RNN-based model was analyzed to have relatively low performance. For the DNN-based model, the convergence epoch of the training showed a relatively wide distribution, which may lead to difficulties in selecting an epoch suitable for practical use. Therefore, the CNN-based model would be acceptable for the heavy rain damage prediction in terms of the accuracy and robustness. These results demonstrated the applicability of deep learning in the development of the damage prediction model. The proposed prediction model can be used for disaster management as the basic data for decision making.
1. Introduction
The frequency and intensity of natural disasters are expected to increase due to climate change [1,2,3]. Therefore, there is an urge for measures to protect people and property from natural disasters [4,5,6]. Suppose the area and size of the damage can be predicted before the actual disaster then it can help to prevent and make adequate preparation for disaster management [7,8,9]. Therefore, studies were conducted to predict the damage.
To predict the damage caused by tropical cyclones, the relationship between the amount of damage in the area and the maximum wind velocity, the central pressure, and the radius of the cyclone during the damage period were presented with a statistical prediction model such as multilinear regression model and logistic regression model [10,11,12]. In some studies, individual models were developed for each size of tropical cyclone [13,14]. For the heavy rain, the prediction model was developed as a multilinear regression model and a nonlinear regression model by setting the damage amount during the damage period as a dependent variable and setting the meteorological data, such as the total rainfall and rainfall intensity during the damage period, as independent variables [15,16,17]. In addition, several studies have developed regional models using socio-economic factors such as financial independence, GRDP (Gross Regional Domestic Product), and the proportion of the vulnerable population to consider the characteristics of the region [18,19,20,21]. For heavy snow, meteorological factors such as the amount of snow, amount of fresh snow, mean temperature, and socio-economic factors including the number of people in rural areas and a total output of regions were used as independent variables of the prediction model [22,23]. Furthermore, since the damage pattern is different depending on the topographical characteristics, such as coastal area or mountainous area, a model was constructed for each topographical feature [24]. Recently, studies using machine learning techniques such as decision tree models, random forests, and support vector machines, which require relatively large amounts of data for the development of prediction models, have been conducted [25,26,27,28,29].
Most of the existing studies discussed above estimated the relationship between meteorological data and the amount of damage using a multilinear regression model, a logistic regression model, and a nonlinear regression model. Recently, efforts have been made to improve predictive performance by applying machine learning techniques. However, in most cases, since the range of the minimum and maximum values of the damage amount to be predicted is considerably large, it is difficult to improve the prediction accuracy. In addition, to predict future damage at present by running the prediction model, future meteorological data should be utilized. Since the future meteorological data is also the predicted meteorological data, uncertainty tends to compound in predicting the amount of damage. Therefore, in this study, to resolve the aforementioned two challenges, we developed the proposed model in the following manner: (1) setting the dependent variable to predict the appropriate damage range without predicting the amount of damage, and (2) using observed meteorological data in the week prior to the natural disaster as an independent variable. If the maximum and minimum values of a large range can be predicted by dividing them into several ranges of categorical dependent variables, then it would help make decisions in disaster management according to the predicted range of damage amount. Therefore, in this study, a heavy rain damage prediction model was developed using a deep learning technique known to have good performance in predicting categorical variables [30,31,32,33,34]. The model allowed evaluation of the applicability of a deep learning technique that was insignificantly applied to the existing damage prediction models.
In Section 2, the study area was selected, and the construction of the dependent and independent variables used in the model development was described. The deep learning technique used in the model development was described in Section 3. In addition, Section 4 presents the predictive performance of the developed model, and Section 5 reviews the results of this study.
2. Material
2.1. Study Area
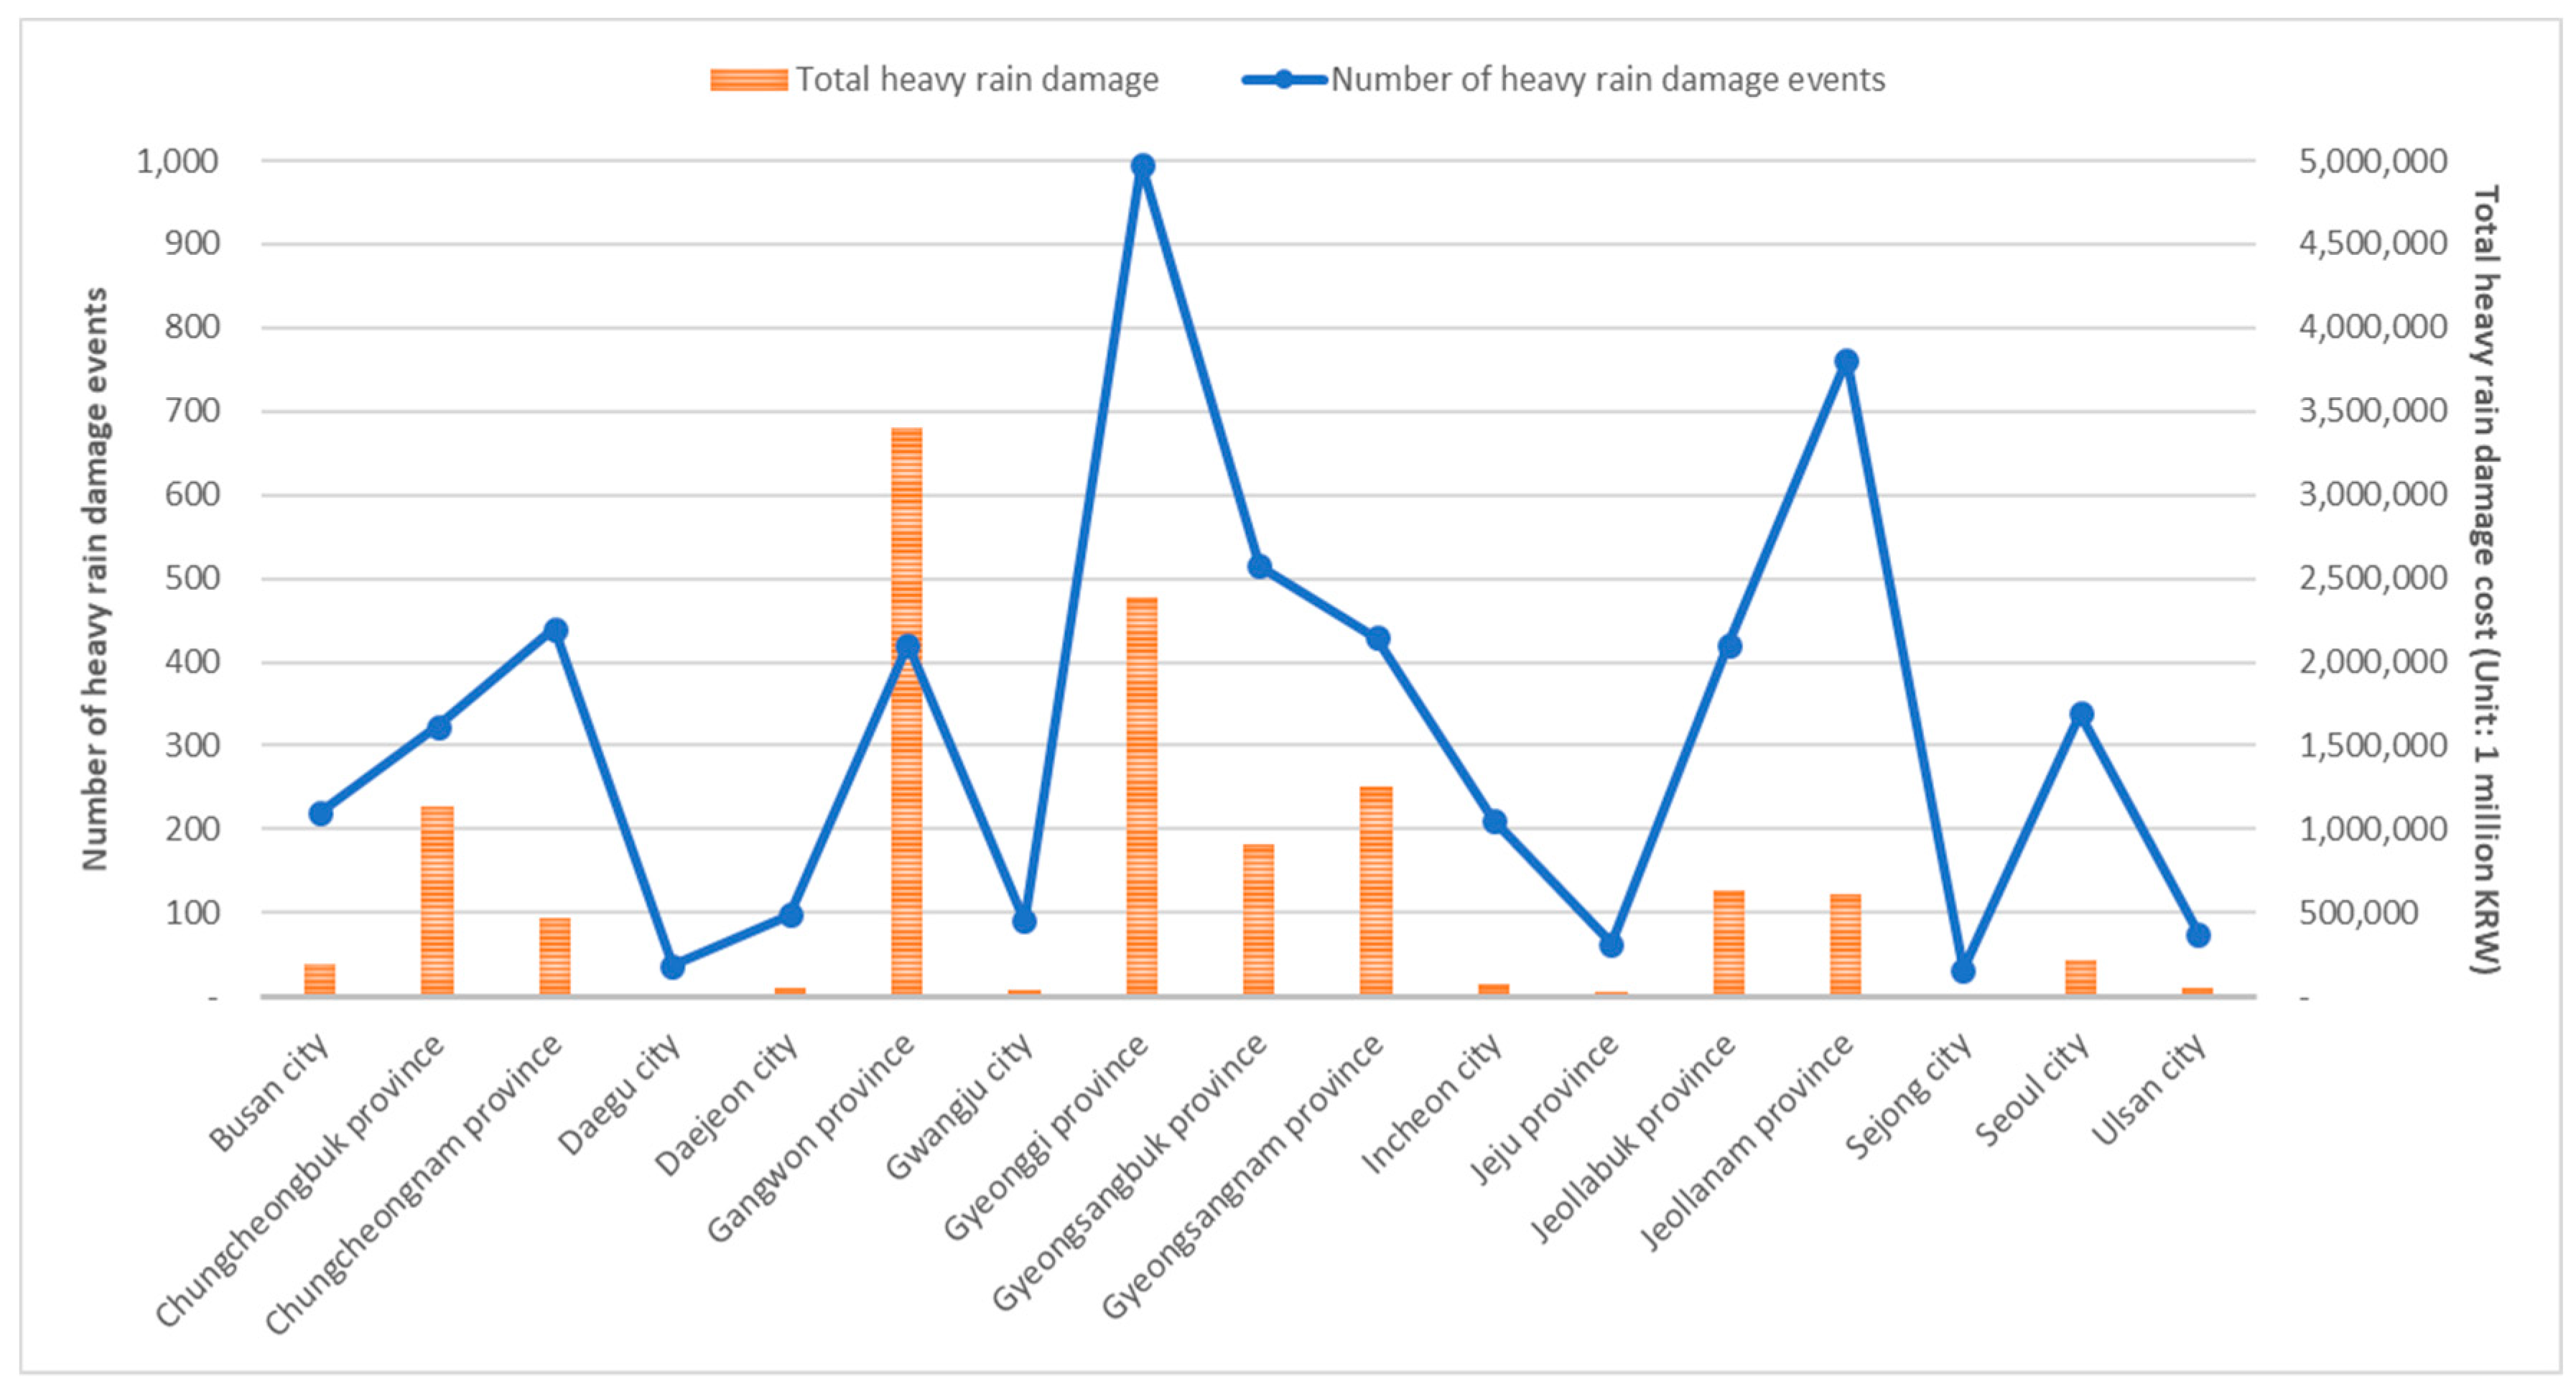
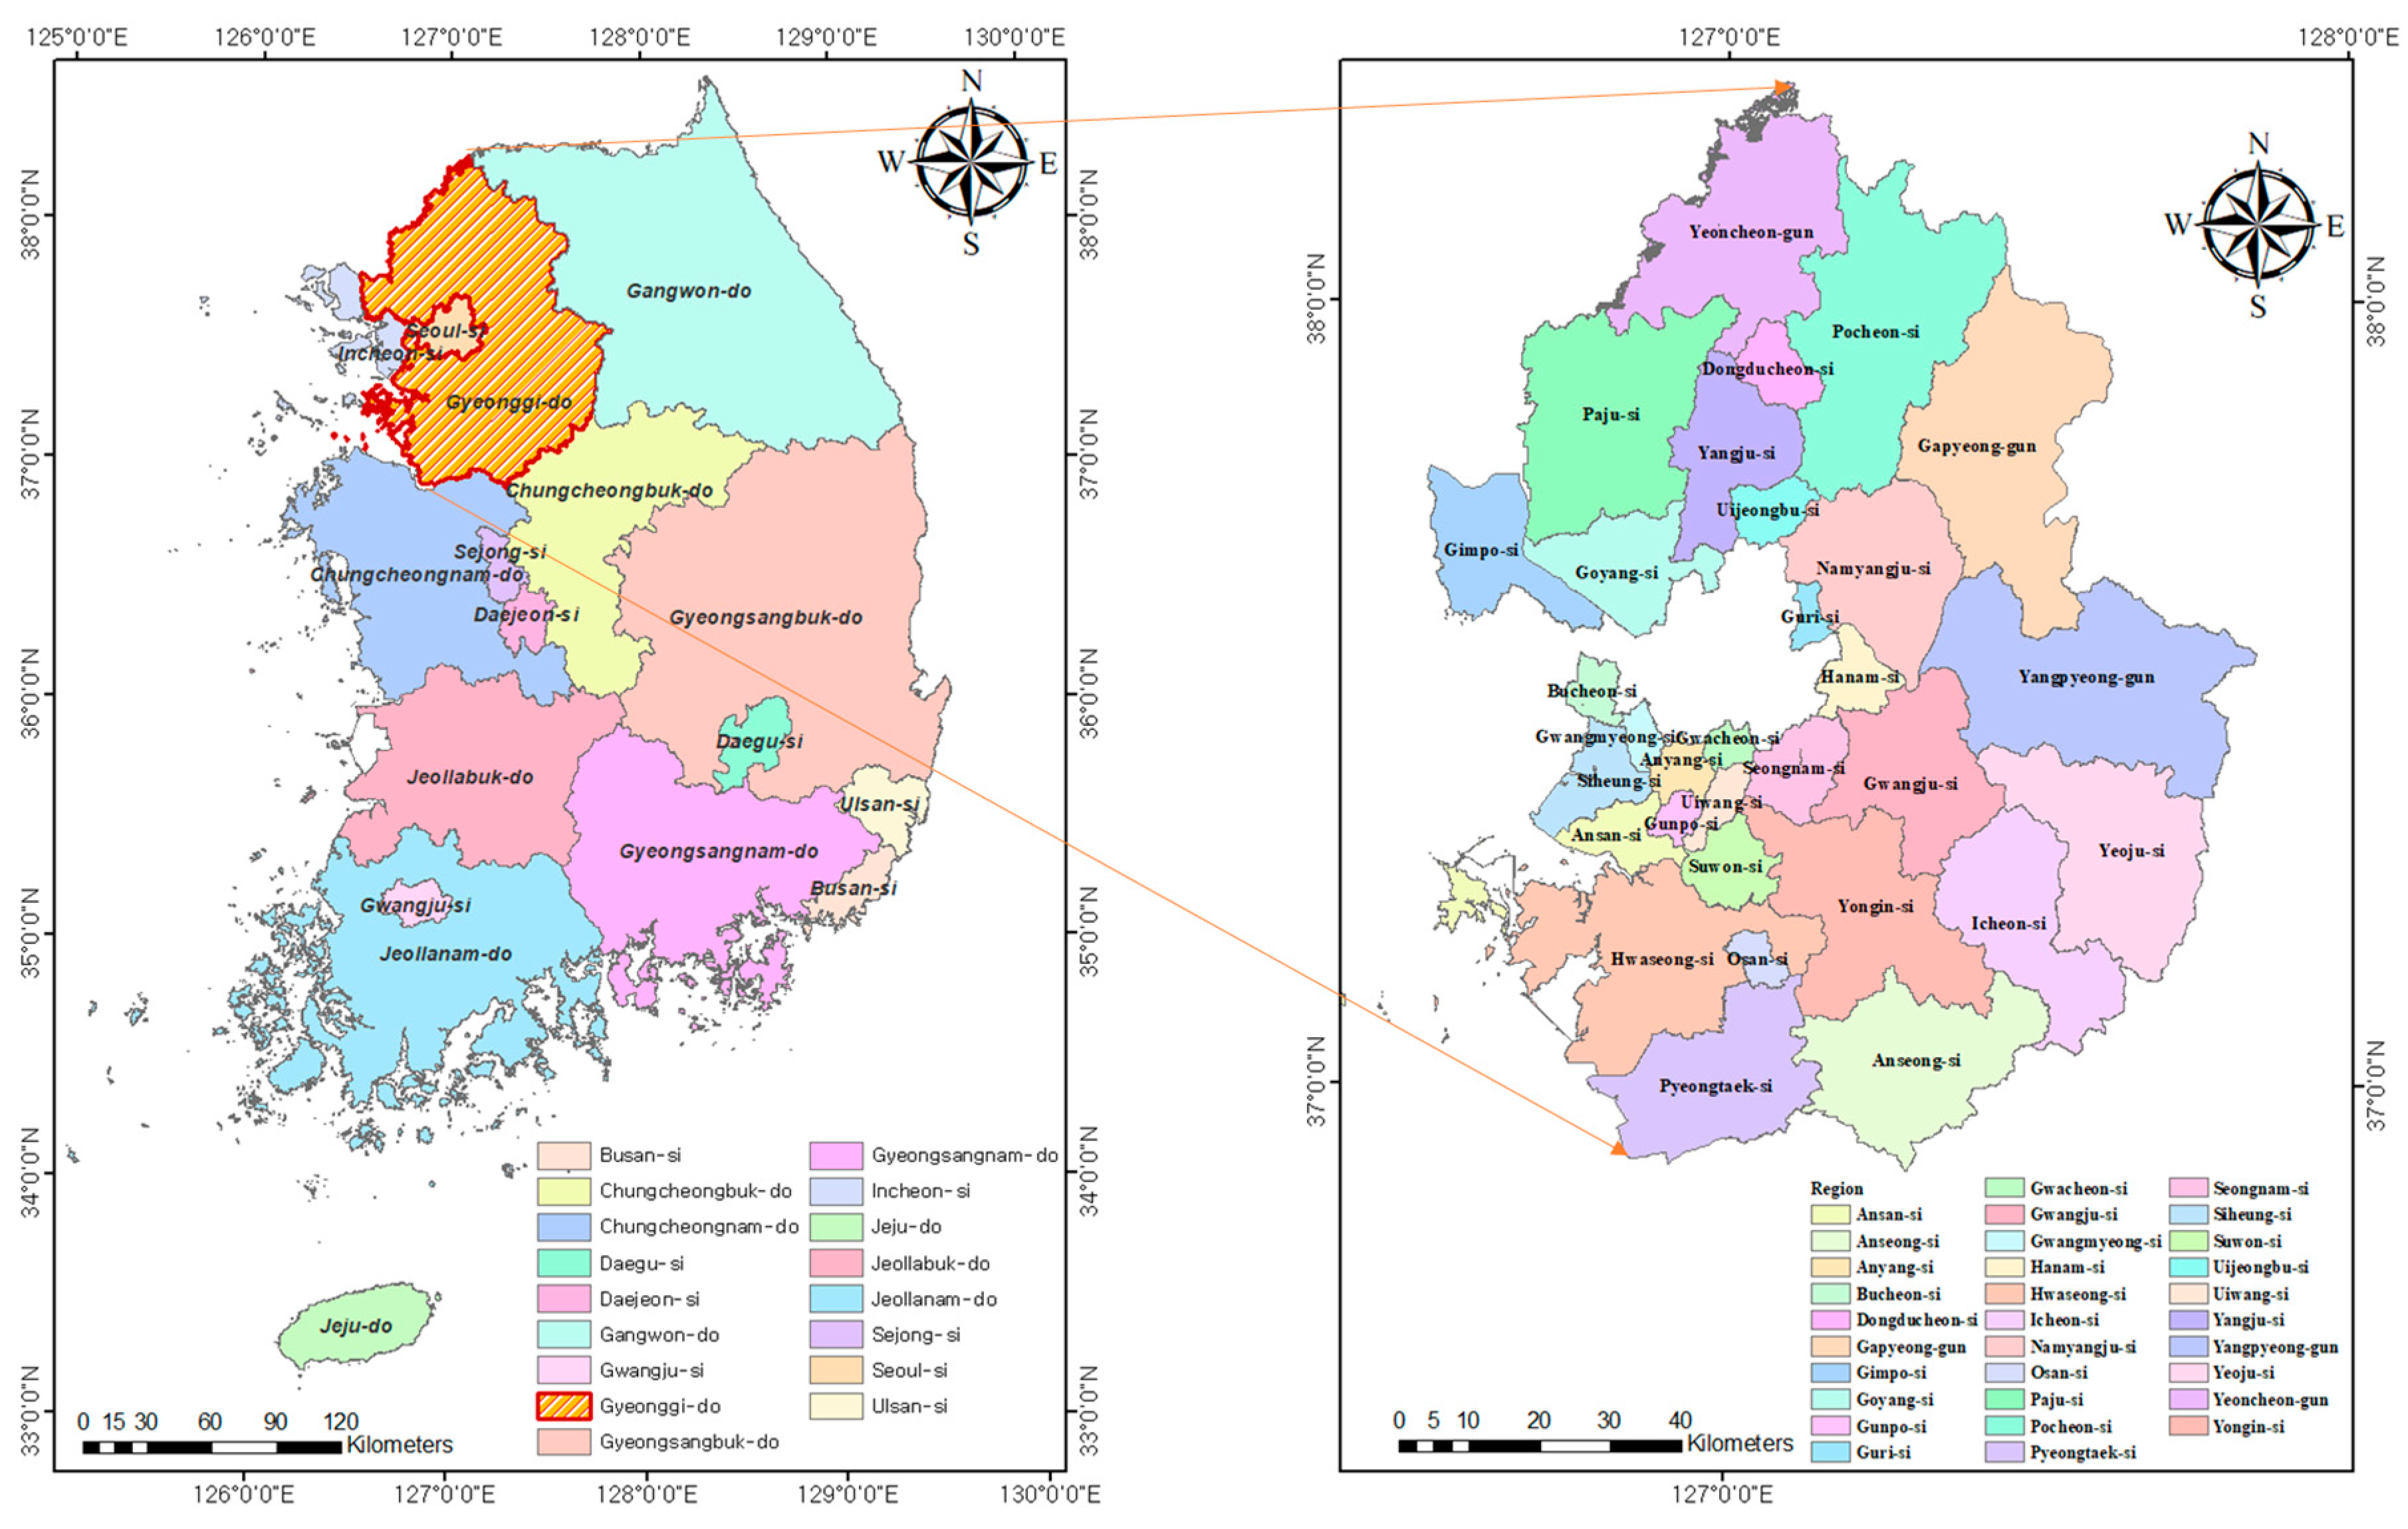
The Ministry of the Interior and Safety (MOIS), the central administrative agency in charge of disaster safety management in Korea, publishes a yearly summary of natural disasters-related records (Statistical Yearbook of Natural Disaster, SYND). In this study, SYND data were collected to select the target area, and the heavy rain damage status by region in the past 30 years (1988–2017) was investigated. Figure 1 summarizes the number of heavy rain damage events and the total amount of damage in 17 regions. Gyeonggi province, had the highest number of heavy rain damage events, and the total heavy rain damage amount was relatively high. Therefore, Gyeonggi province was selected as the study area and Figure 2 shows the location and administrative districts of study area. Gyeonggi province is composed of 31 local governments, and includes urban areas, rural areas, coastal areas, and mountainous areas.
2.2. Dependent Variables
To establish dependent variables, heavy rain damage amount data was collected for each administrative district in Gyeonggi province, and it was classified into three categories according to the damage range. Many organizations, including NOAA (National Oceanic and Atmospheric Administration), the Met Office, and MOIS, present crisis alerts as four stages (crisis signs, small damage effects, medium damage effects, large damage effects), depending on the occurrence of crisis signs and the resulting damage effects. Therefore, in this study, the magnitude of the impact of damage after the occurrence of crisis signs was used in three categories.
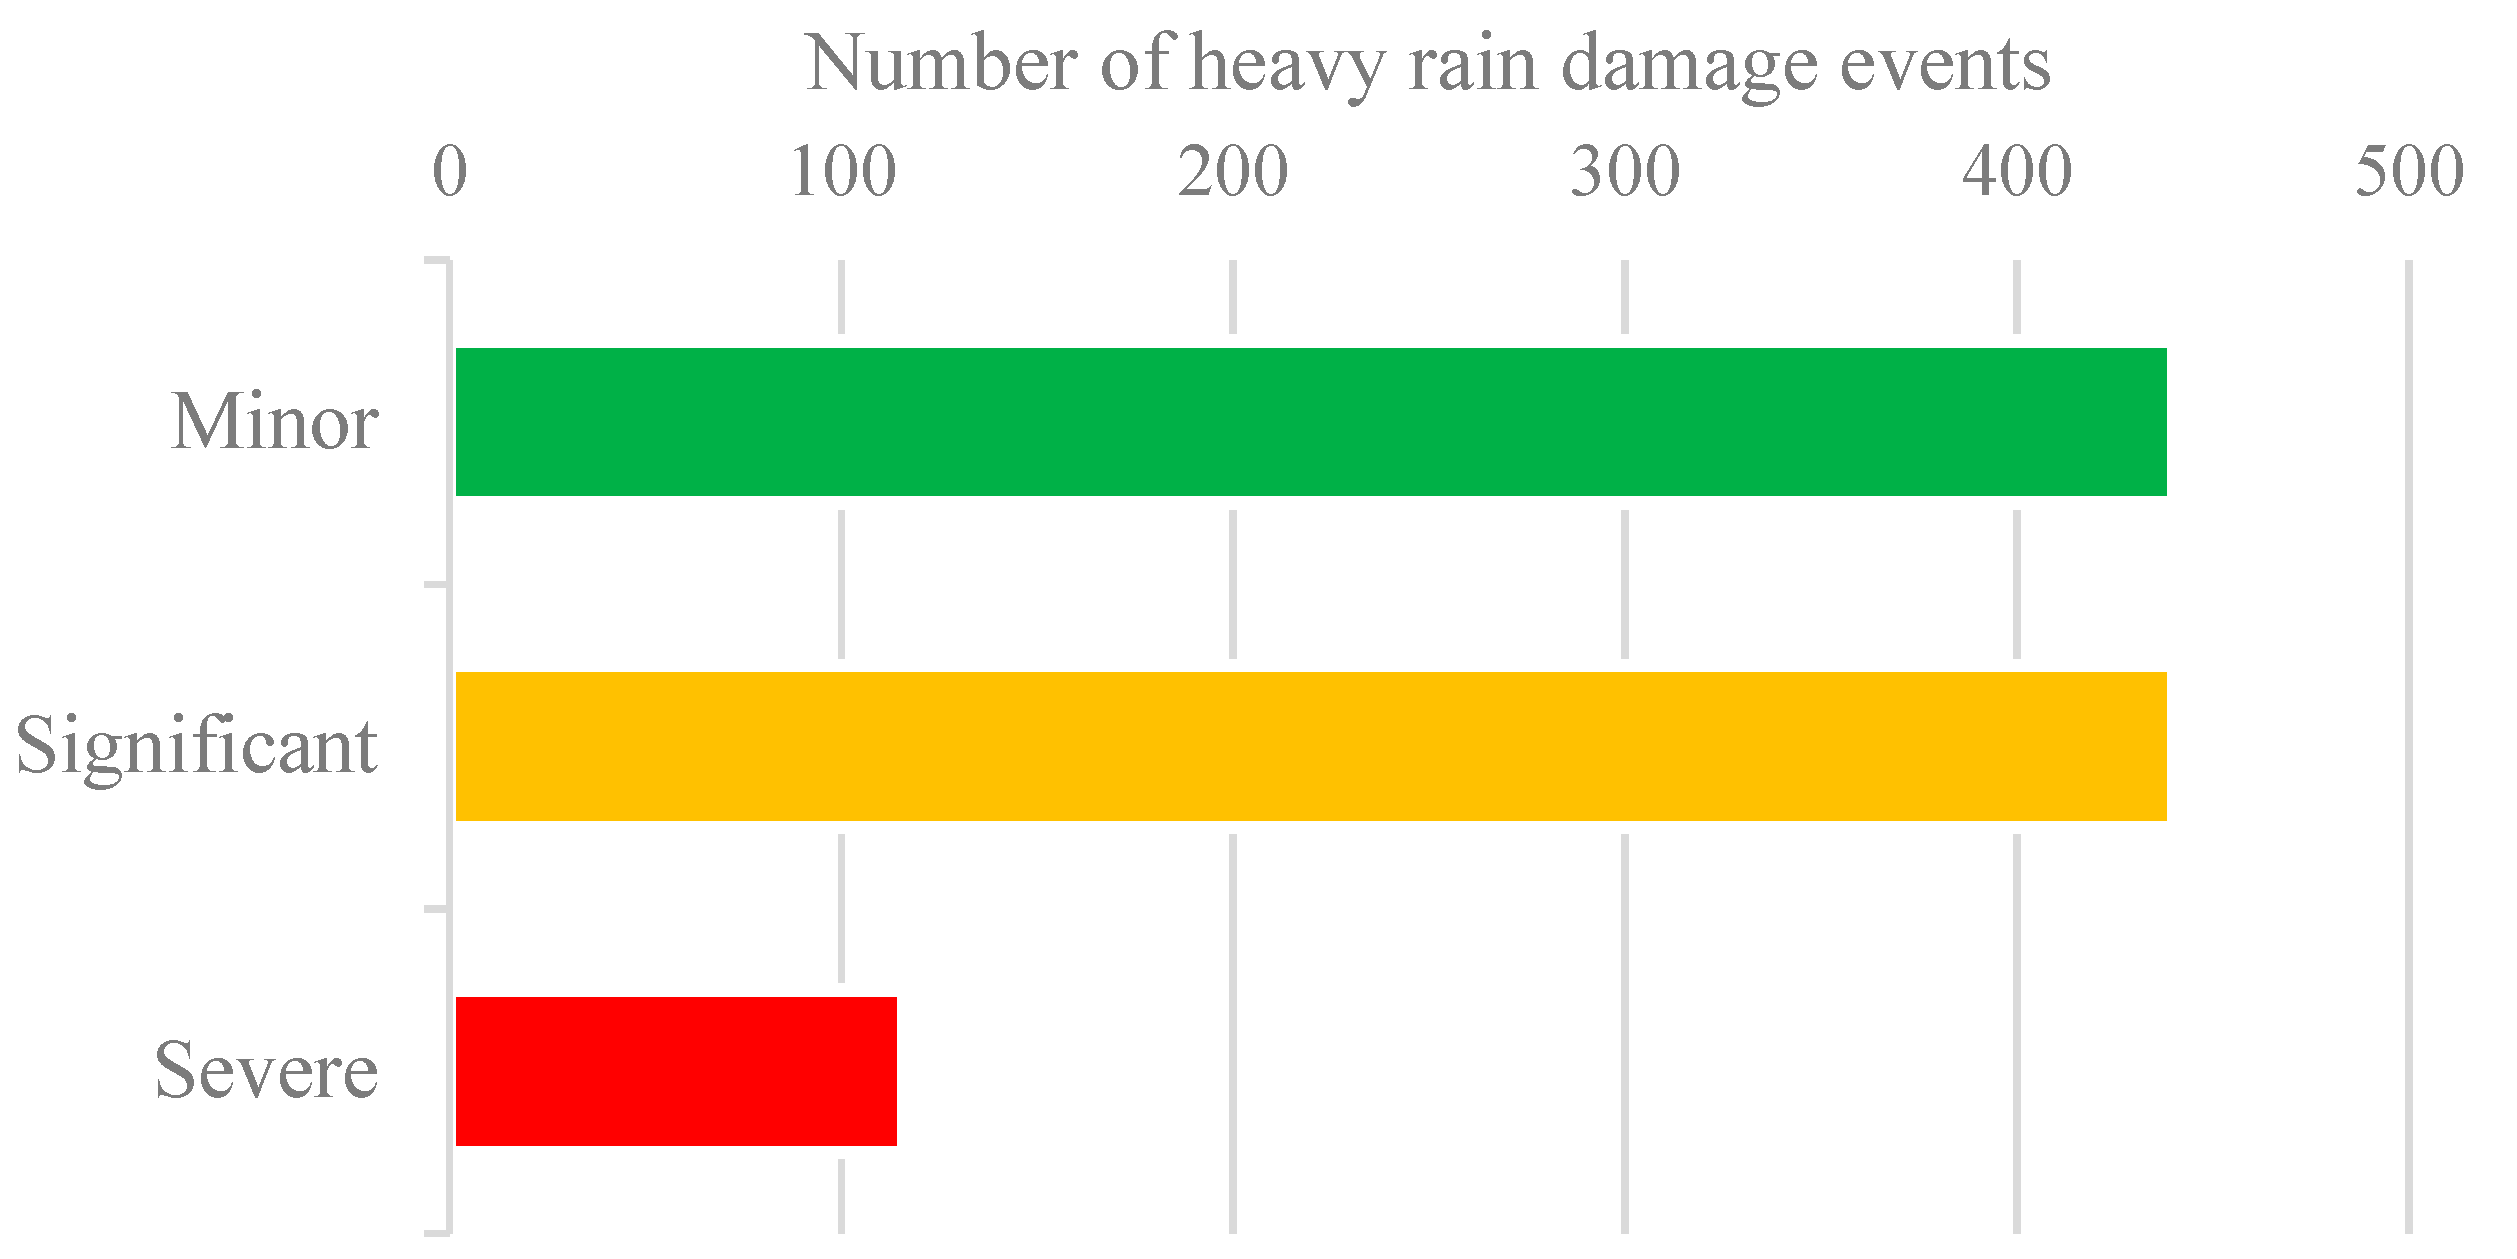
Table 1 indicates the category of damages by range, and Table 2 displays the national fiscal support standard for each administrative district in Gyeonggi province. In Korea, the average fiscal capacity index for the previous three years is utilized to set the standard of the national treasury support for each administrative district. The range of heavy rain damage amount equivalent to “severe”, which represents the large damage effects, was selected as the amount exceeding the governmental treasury support standard for each administrative area. This is thought to be a relatively objective standard, as it refers to criteria for the national treasury support when the level of damage is beyond the level that can be borne within the budget of the local governments. In order to distinguish between the “minor” category, which means small damage effects, and the “significant” category, which means medium damage effects, the median value of the data (38 million KRW (about 1 USD = 1200 KRW)), excluding the “severe” category, was used. Figure 3 displays the number of events for each damage category in the overall data, with the “minor” and “significant” categories each accounting for approximately 44%, and the “severe” category accounting for approximately 12%. To improve the predictive performance of the model, it is preferable to make all three categories identical. However, the most serious damage (large damage effects) does not occur at the same rate as small or medium damage effects in the real world. Because the most severe damage was relatively less, it was considered reasonable to configure the model at a specified rate.
2.3. Independent Variables
To use meteorological data as independent variables, hourly meteorological data were collected from the Automated Synoptic Observing System (ASOS) operated by the Korea Meteorological Administration (KMA). ASOS provides a total of 23 types of meteorological data. Some meteorological observation data, such as amount of snow and amount of fresh snow, that are not related to heavy rain damage and mostly missing meteorological observation data, such as solar radiation and amount of low and middle cloud were excluded from independent variables. Table 3 displays the list of meteorological data used as independent variables.
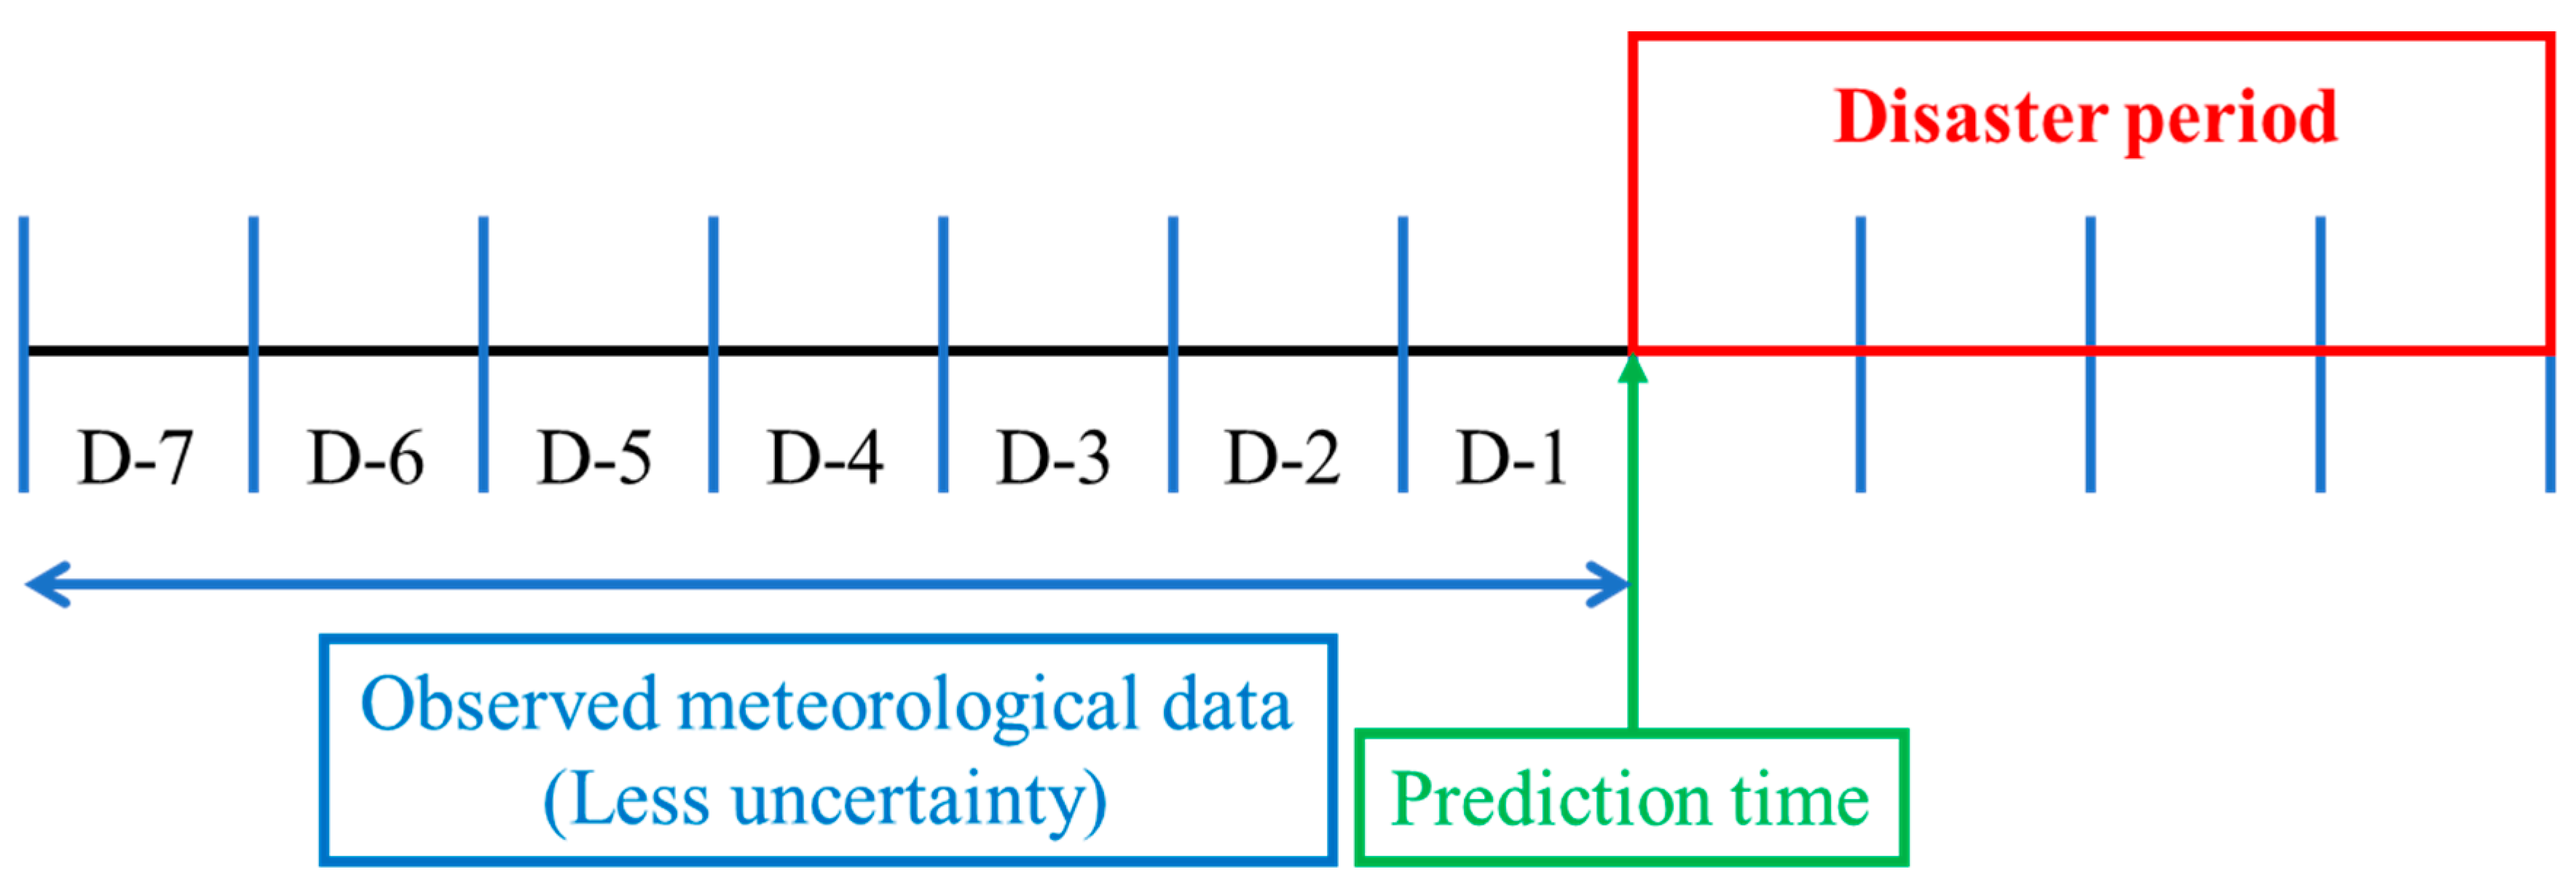
For the prediction of the damage caused by heavy rain in advance, it is necessary to estimate the magnitude of the damage based on meteorological data at an appropriate time. Many studies have predicted damage by using meteorological data during the period of damage as independent variables, which is closer to damage estimation rather than prediction [15,16,17]. In particular, when the model is applied in actual disaster management, the predicted meteorological data during the period of damage have high uncertainty. However, the predictive performance of the model varies depending on the reliability of the predicted meteorological data. Therefore, this study used a method of predicting the damage using the observed meteorological data with low uncertainty taken before the damage caused by heavy rain occurred as shown in Figure 4. It was assumed that when the meteorological data are collected one week before the damage occurred and a prediction model is developed using the data as independent variables, then the model will have adequate predictive performance regardless of the performance of the predicted meteorological data during the disaster period. In this way, the uncertainty that occurs when using predicted meteorological data is removed, and the predictive performance is evaluated by predicting the damage category of the disaster period.
In addition, the objective of the proposed model is to predict the severity of damage caused by heavy rain in each administrative region. To achieve this objective, the model must be trained with the meteorological data (listed in Table 3) as well as the administrative region’s information (listed in Table 2) as a dummy variable. This is because the damage sustained by the region could depend on regional characteristics, even with all the regions experiencing the same heavy rain. Therefore, the 12 variables, consisting of both meteorological variables and the dummy variable of the region, were used as input data for training and testing.
3. Deep Learning-Based Heavy Rain Damage Prediction Models
In this study, deep learning was used as a methodology for developing a heavy rain damage prediction model. Deep learning is one of the machine learning techniques using an artificial neural network (ANN) as a basic principle.
3.1. Overview of Deep Learning
An ANN is an algorithm created by mimicking the activity of neurons in the human brain, and the basic model of an ANN is a perceptron composed of one input layer and one output layer proposed by [35]. The perceptron was identified as an early model of artificial intelligence development because it can easily solve AND and OR problems through the concept of linear separability. However, it is not able to solve the XOR problem where linear separation is impossible [36]. Therefore, [37] proposed a multi-layer perceptron (MLP) technique using multiple layers of the perceptron, and they demonstrated that MLP can transform the problem that cannot be linearly separated into a problem that can be linearly separated. This finding indicates that, if a multi-layered network is used, it may be possible to solve more complicated problems than using a network having a small number of layers. These MLPs using multi-layered networks were improved and developed into ANNs following the structure of the brain by incorporating various techniques such as the use of the activation function and backpropagation. An ANN may indicate even better performance when using multiple layers of deep networks: according to O’Connell et al. [38], an ANN with more than two hidden layers is generally defined as deep learning. Based on these advantages, a deep neural network (DNN) using multiple hidden layers with an ANN was proposed [39]. In particular, a DNN, as in the case of an ANN, is capable of modeling nonlinear relationships in data, thus showing good performance in solving complex classification problems. Based on these advantages, deep learning is frequently utilized to resolve problems in various industries.
Depending on the field in which deep learning is used, the available data format varies widely. Therefore, an appropriate deep learning technique should be selected. For example, the DNN, the most basic deep learning technique, is used for analyzing various data types, such as audio, image, and signal, e.g., [40,41,42]. If the sequence of the acquired data is important information, a recurrent neural network (RNN) may be effective among deep learning techniques, e.g., [43,44]. For 2D image data, a convolutional neural network (CNN) is primarily used, e.g., [45,46]; however, CNNs also demonstrated good performance in analyzing signal data (sequential data), such as audio and signal data, e.g., [47,48]. Contrarily, the weekly meteorological data, which are intended to be used in this study, are measured hourly, and are time series data. Therefore, it is expected that a DNN, CNN, and RNN have the potential to detect damage due to heavy rain.
In particular, depending on the selected deep learning technique, the features that the deep learning technique can derive from the data vary. These features can be considered as an important factor in determining the performance of the deep learning model. Thus, this study analyzes the above-mentioned independent variables through three different deep learning networks (a DNN, a CNN, and an RNN) to obtain and use each feature. Furthermore, it compares the verification accuracy of each technique, aiming to present a deep learning technique with high applicability to the heavy rain damage prediction model.
3.2. Base Classification Network
In general, deep learning networks can be divided into a feature extraction network, which extracts features by analyzing input data, and a classification network that provides decisions obtained through the acquired features. Since the classification network of these deep learning models can greatly affect the accuracy, we aim to use the same classification network for all deep learning models to compare the applicability of the three deep learning techniques. Throughout the rest of the paper we refer to this classification network as the base network.
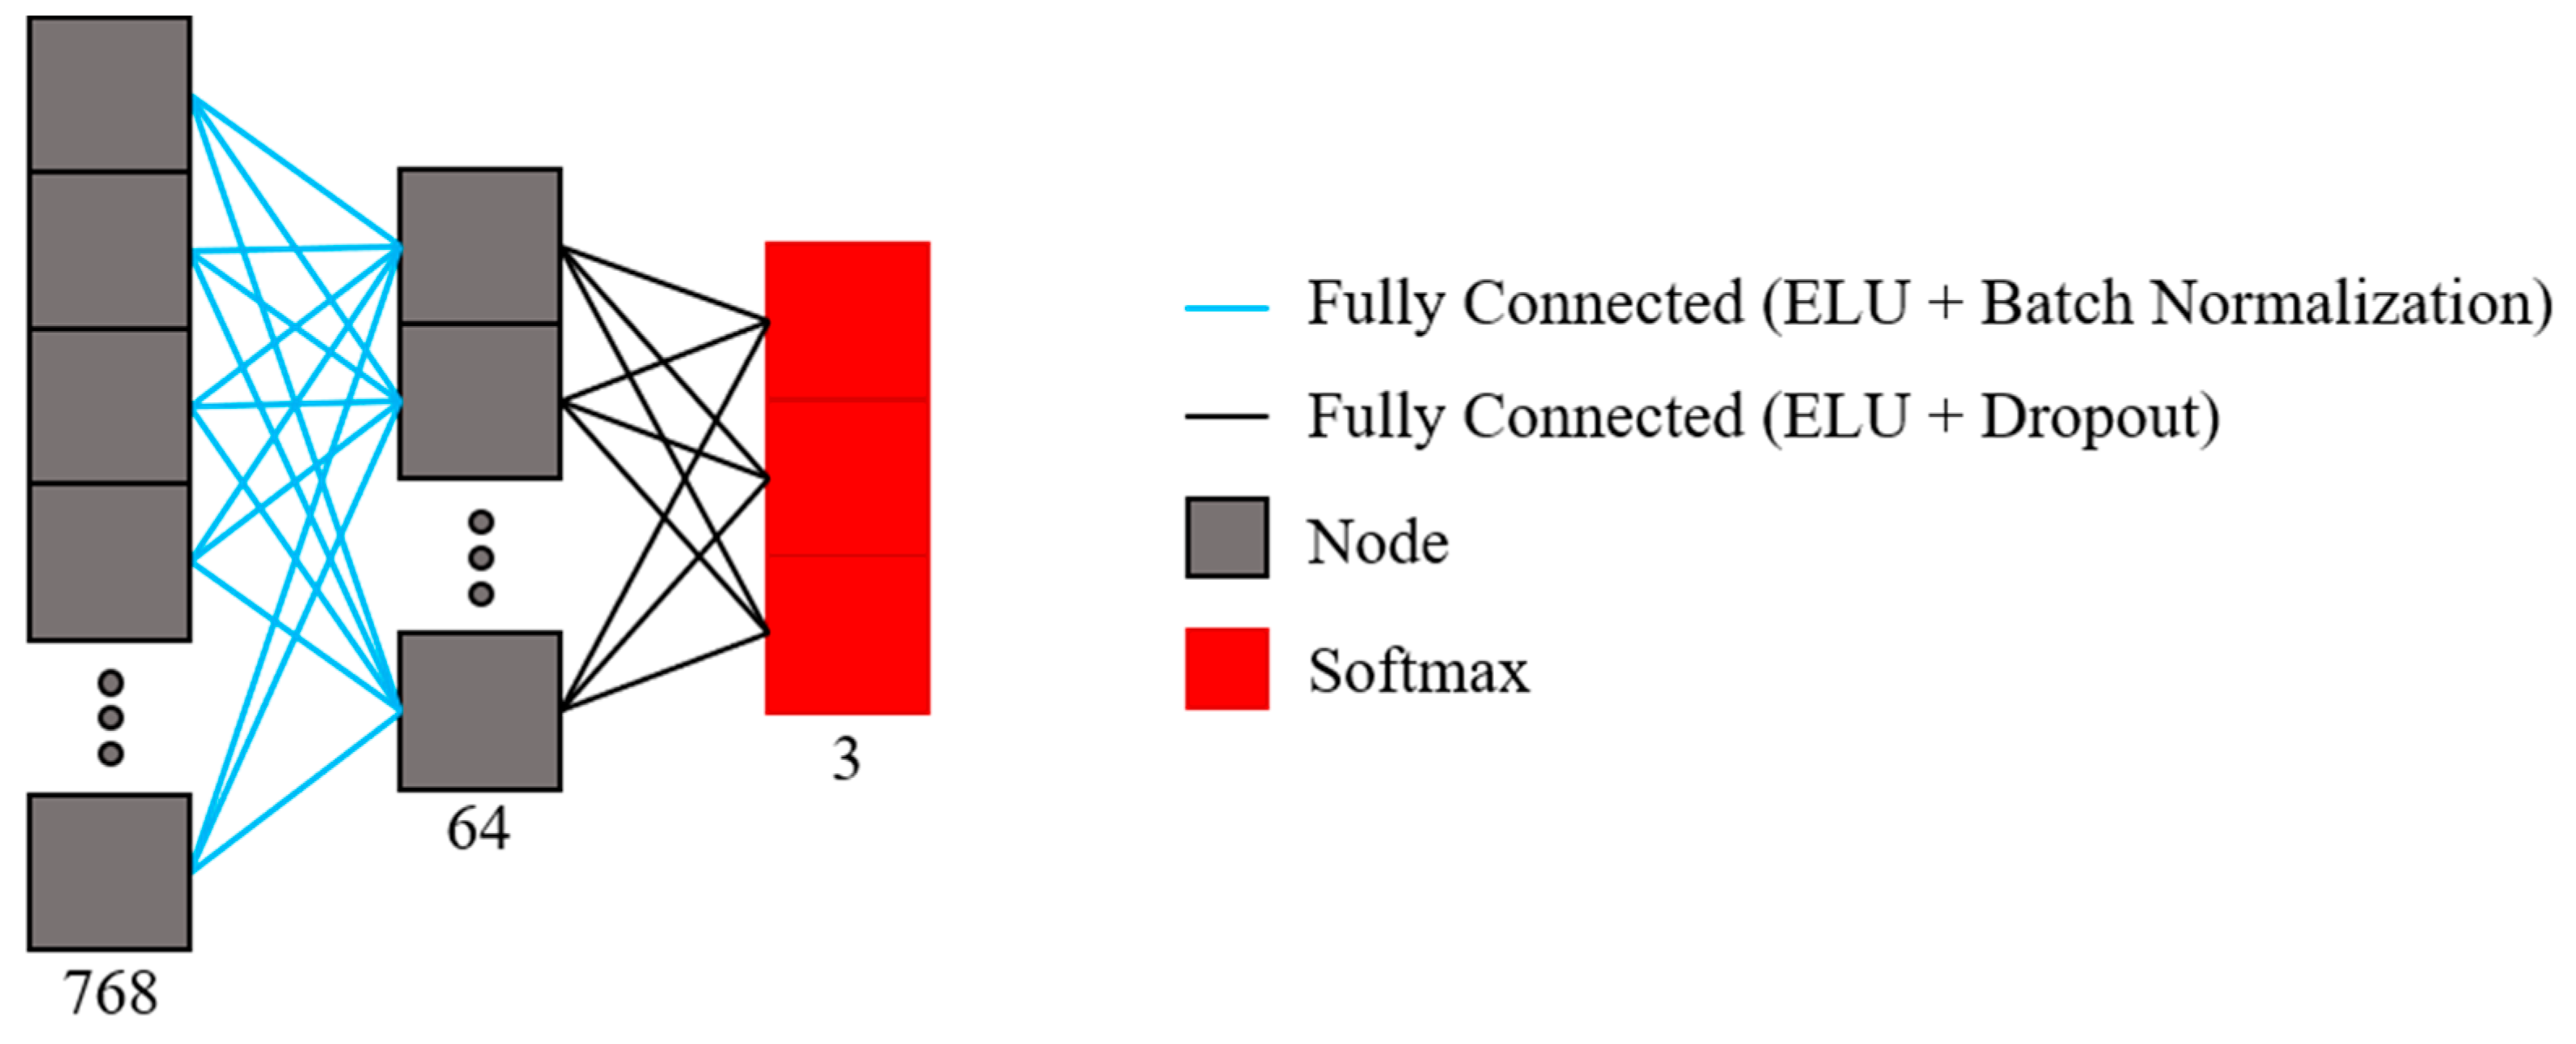
The base network of the deep learning model to be employed for the heavy rain damage prediction model was designed as shown in Figure 5. The base network was configured to have one hidden layer, and the number of nodes in the hidden layer was set to 64. All layers were used as fully connected layers, identical to those of a typical ANN. To increase the learning efficiency of the base network, batch normalization proposed by [49] was performed on the first layer where deep learning features were to be input, and the batch size was set to 16. The exponential linear unit (ELU) was used by adopting the research results presented by [50] to construct a faster network with better performance using the activation function. In addition, the He initialization technique, which is evaluated as the ideal initialization method for the linear unit-based activation function, was employed [51]. For the gradient method, root means square propagation [52], a commonly used method for deep learning, was employed, and the learning rate decay method was applied together to effectively perform learning convergence. The values of the learning rate and its decay rate in the learning rate decay method are important hyperparameters because the learning rate and its decay rate can affect the training time and accuracy. Meanwhile, the optimal values of the learning rate and its decay rate depend on the data and model used. Therefore, the learning rate and its decay rate were empirically set to 0.005 and 2% per epoch, respectively, which were the best-case values for all deep learning networks in this study. In addition, the dropout method proposed by [53] was applied to prevent over fitting of the network, and 0.25 was applied as the coefficient value. These hyperparameters were applied to the base network and all designed networks.
Meanwhile, the shuffle function with the gradient method was used at every epoch while using the training dataset to improve training performance. Because of this, even if the training was conducted with the same data and architecture, the accuracies of the trained deep learning models varied slightly during each model training. If the accuracies of the trained models with the same data and architecture are greatly different, the robustness of the model decreases, making the model unreliable. Therefore, in this study, similar training and testing were performed 30 times for each model to evaluate the verification accuracy and the robustness of the model. For the training and test of 30 times, training data (796) and test data (200) with a ratio of approximately 8:2 were employed. The 30 times of training and test of models for each deep learning were all performed using the same data. All prediction models were trained and tested in the following environments: Windows 10 64 bits, Python 3.5, Keras 2.2.2, two GPUs (NVIDIA GTX 1080Ti 11GB), intel(R) Core(TM) i7-8700K CPU 3.70GHz, 32GB RAM.
3.3. DNN-Based Model
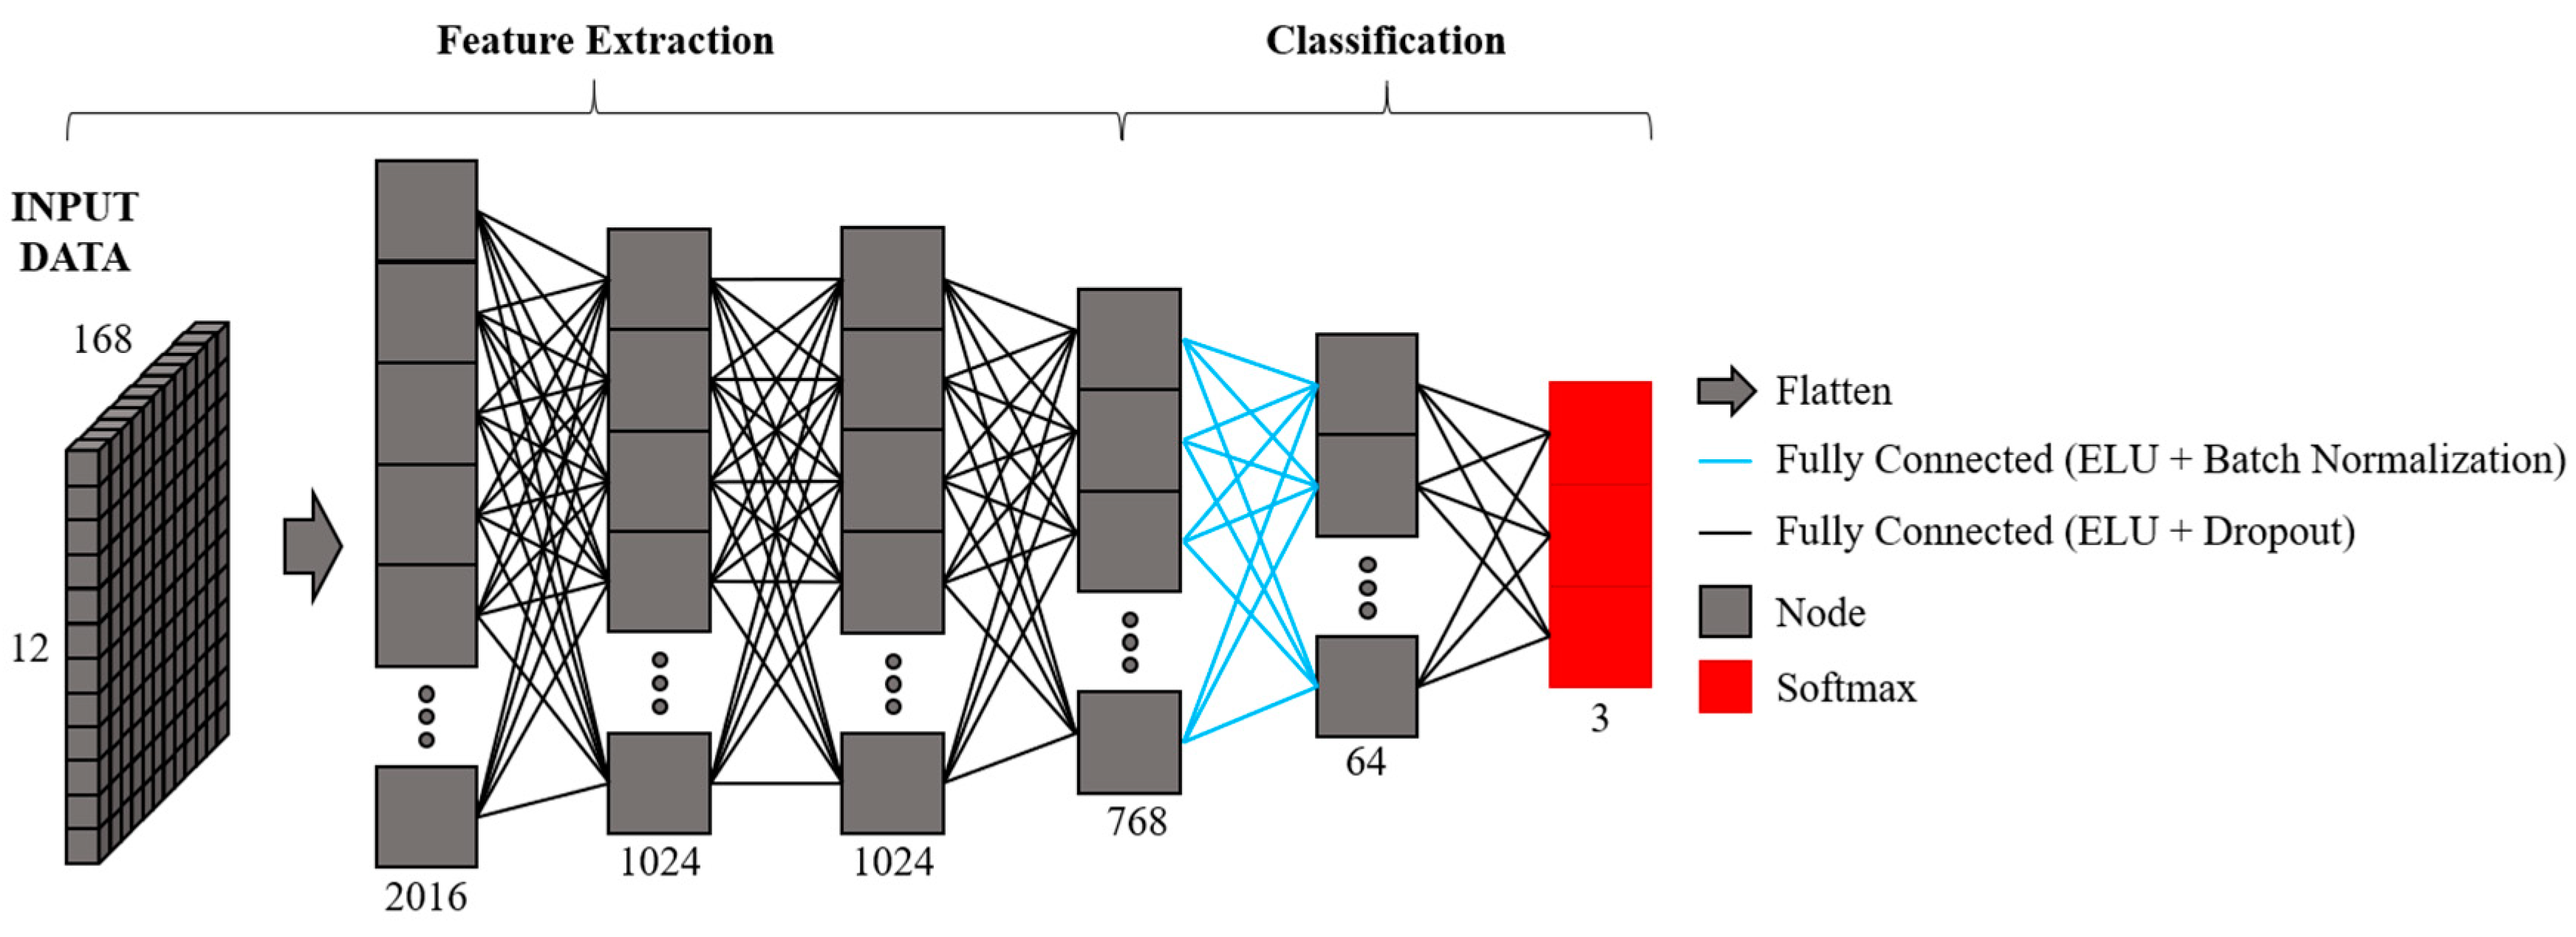
Since the learning process is performed with an ANN, the input data to the deep learning model passes the hidden layer of the ANN and becomes a feature that can represent the input data. Theoretically, the more hidden layers, the more likely that these features become sophisticated. Conversely, if the number of hidden layers becomes too large, the performance of a DNN may decline, which is caused by data overfitting or local minima problems. Meanwhile, the overfitting of a model leads to the generalization that the model performs poorly. Thus, the overfitting should be considered in model development. Therefore, the dropout and batch normalization procedures, which are the two most effective methods in the prevention of overfitting in the proposed model, were used in the base network model and in all the other models in this study. The relationship between the number of hidden layers and the local minima depends on the number and format of the data. Therefore, in determining the number of hidden layers of the DNN architecture to be used for the prediction of this study, the ideal number was found empirically and utilized for the architecture of the DNN-based model. With the exception of the base network, two to four hidden layers along with 512, 1024, and 2048 nodes for each layer were tested in all networks. This was carried out in order to empirically select the number of hidden layers. The networks with two hidden layers and 1024 nodes showed the best performance by demonstrating maximum accuracy. Therefore, the architecture was designed as shown in Figure 6.
Figure 6 displays the DNN architecture used in this study. In Figure 6, the input data matrix is composed of 168 h (7 days) × 12 variables (11 meteorological variables described in Table 3 and region listed in Table 2). In the DNN-based model, input data in the form of a matrix was converted to 2016 nodes through a flattening layer. The input data was derived from 768 features through three hidden layers in the feature extraction process. The derived 768 features were designed to perform the classification process through the base network.
3.4. CNN-Based Model
The distinct feature of a CNN is the use of a convolution layer with deep learning networks. This convolution layer can use a filter to derive image features from existing image processing. A CNN demonstrates good performance in deriving features for 2D and 3D data such as images and can perform appropriate analysis by using a 1D convolutional layer for time-series data in 1D.
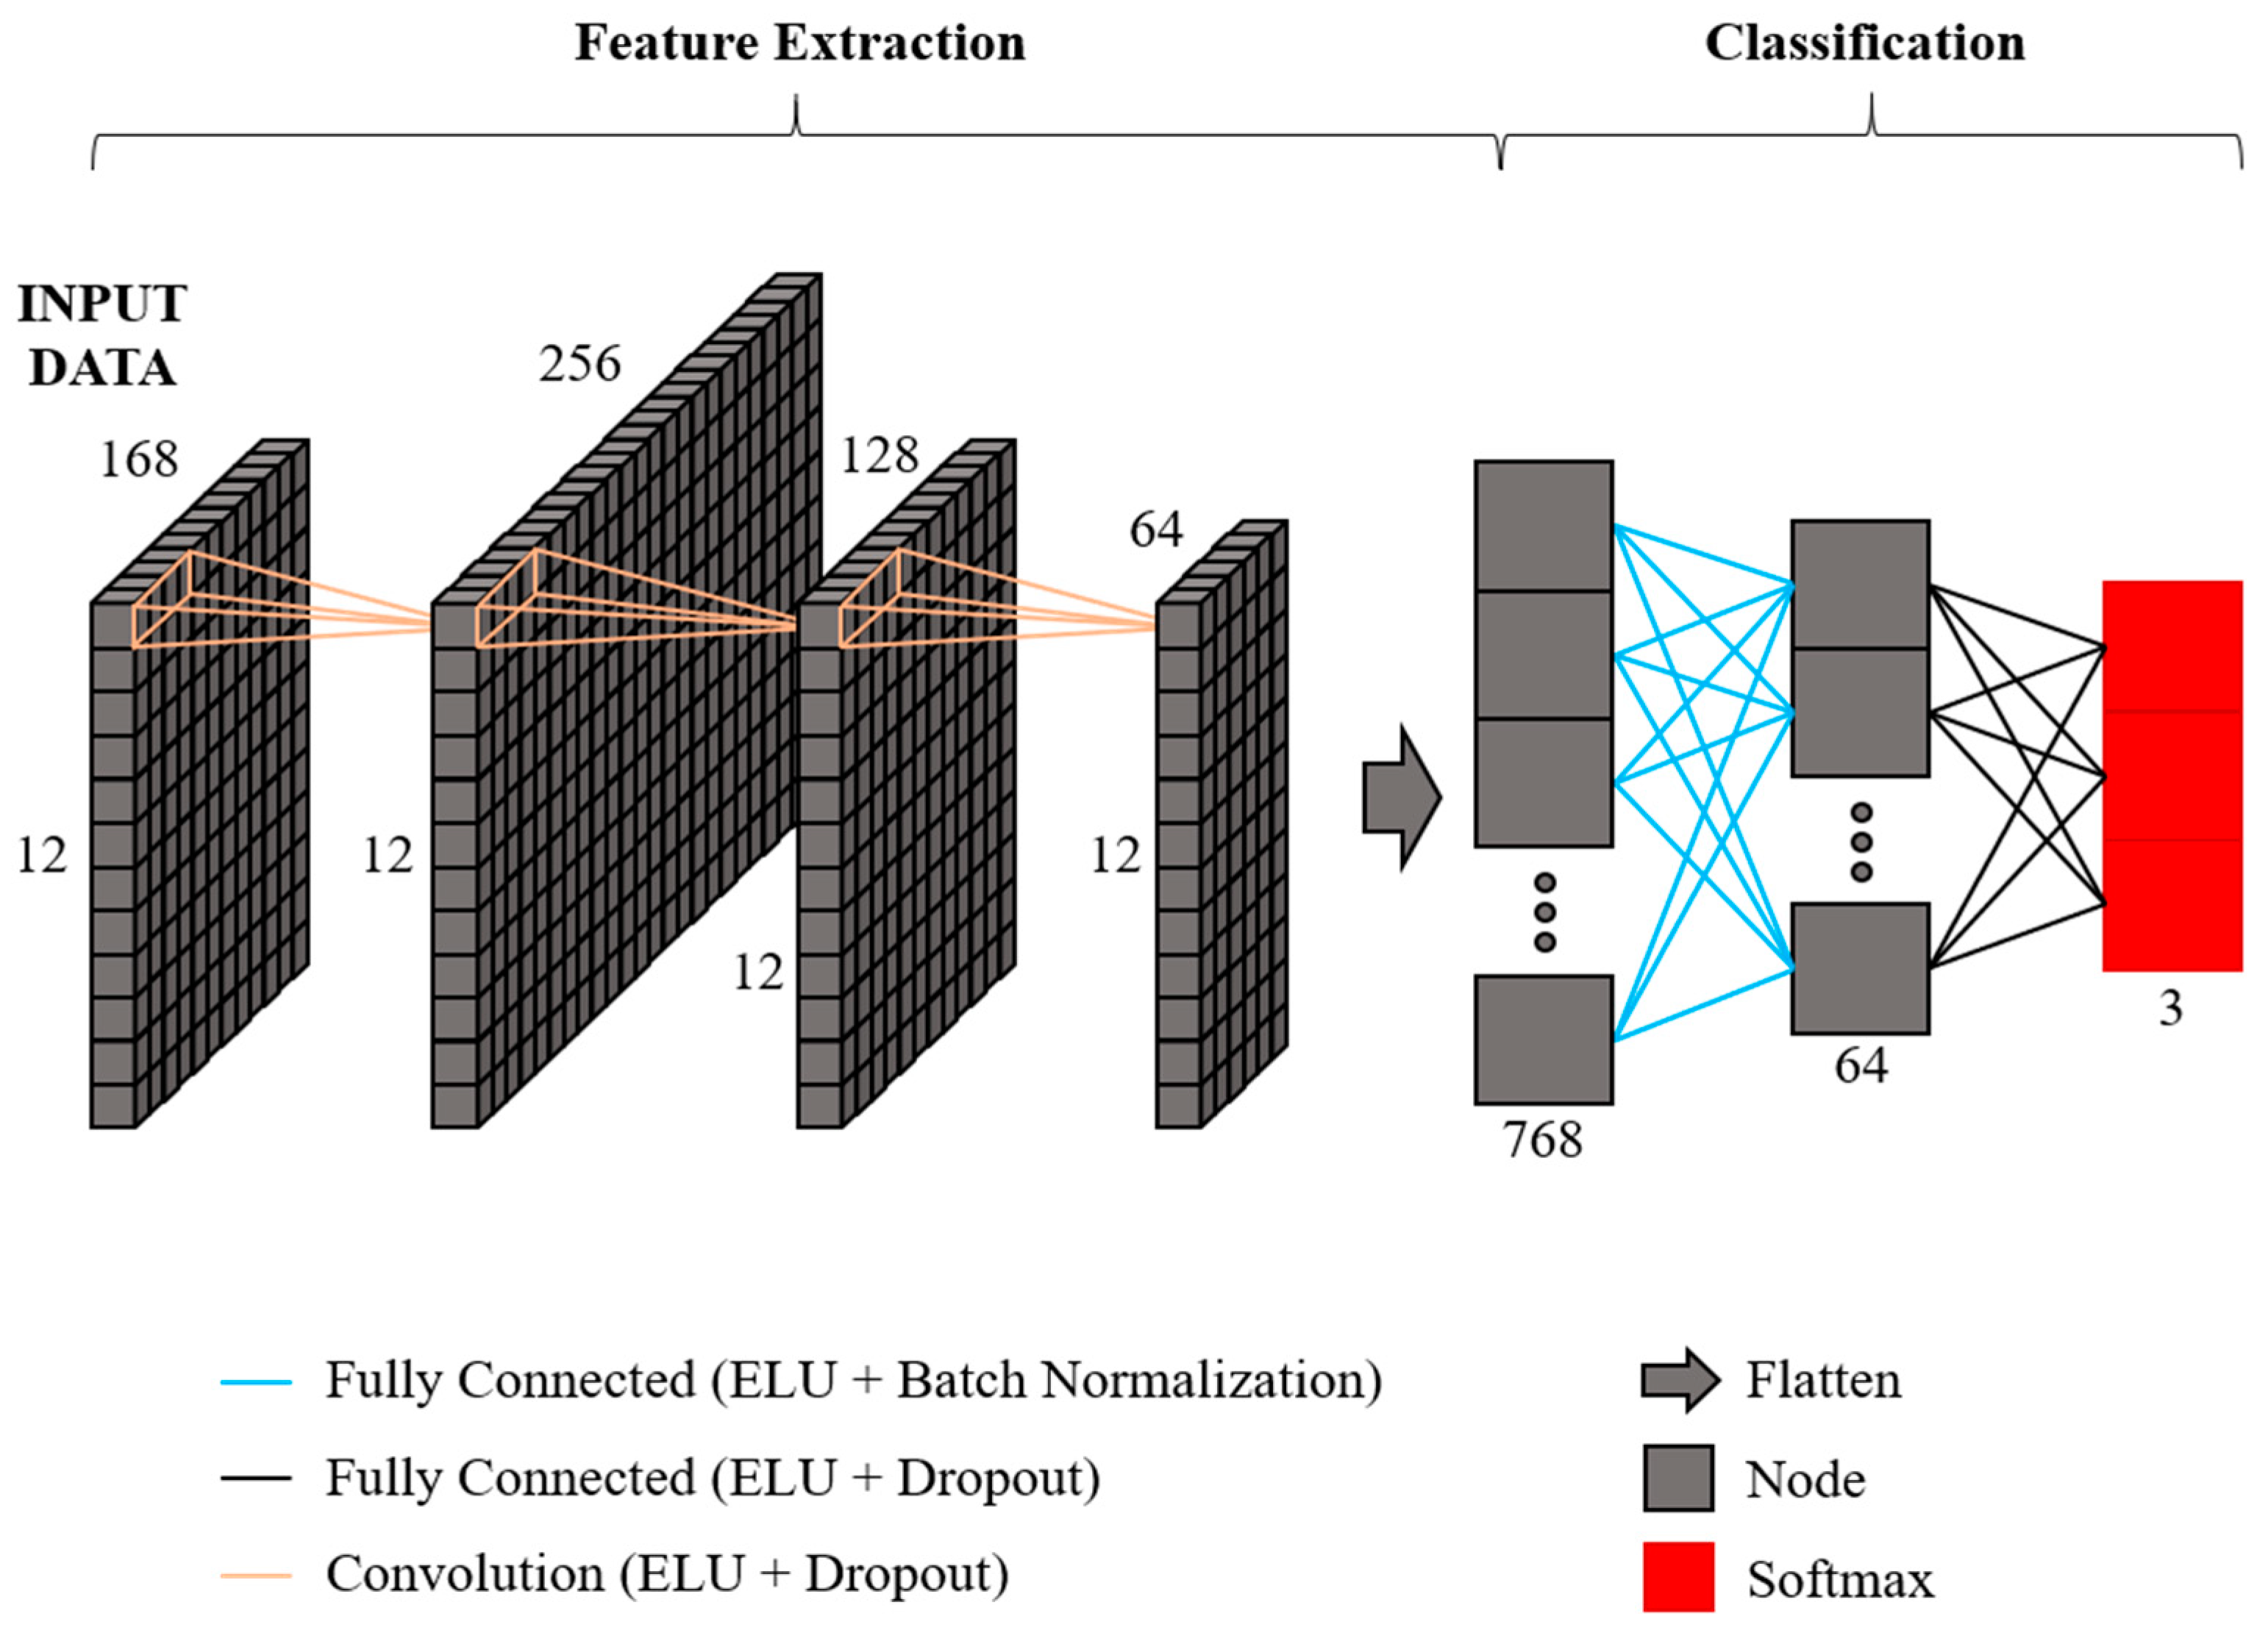
Each of the independent variables used in this study is time-series data with autocorrelation; thus, it can be analyzed using a 1D convolutional layer. Accordingly, this study constructed a CNN architecture using such 1D convolutional layers. Figure 7 shows the CNN architecture employed in this study. The proposed CNN architecture derives features using three 1D convolution layers. In particular, it was designed for the number of flattened feature nodes after the feature extraction process can be 768, the same as the number obtained through the feature extraction network of the DNN-based model architecture as shown in Figure 6. It was further designed to perform classification through the base network.
3.5. RNN-Based Model
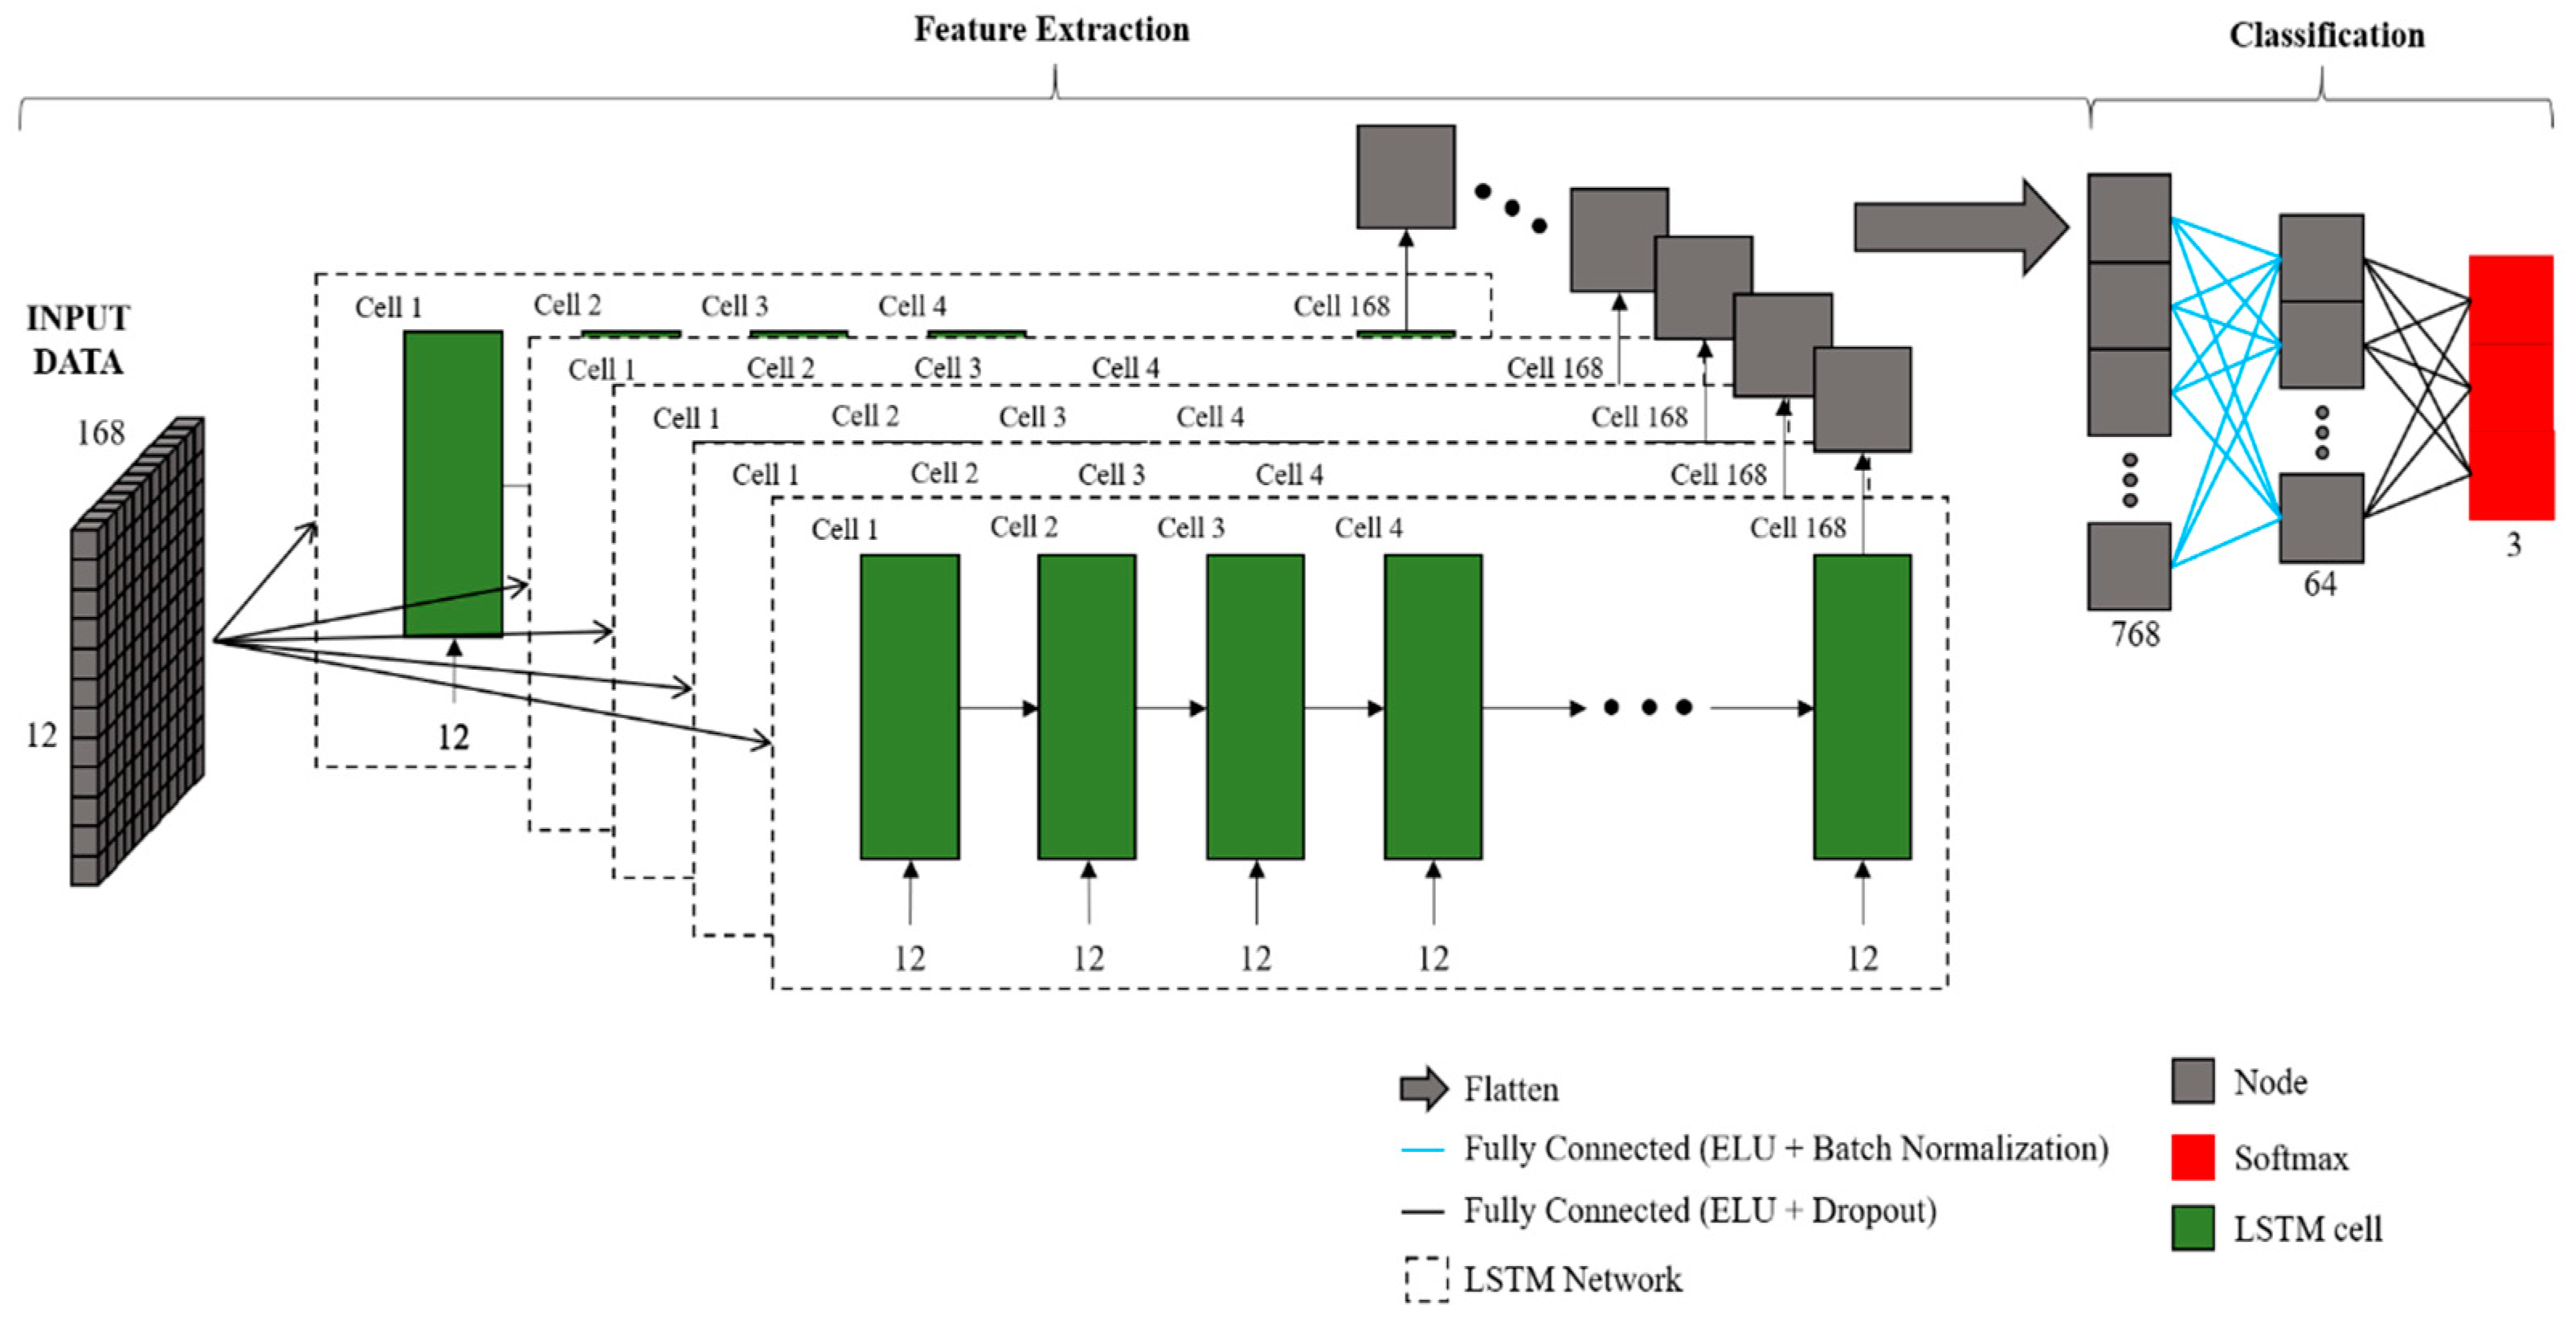
An RNN is one the of deep learning networks developed for effective learning of sequence-critical data such as time-series data. Unlike other deep learning techniques, an RNN has an internal memory storage space within the network that can store data from a previous point in time. Using this storage space, in an RNN, learning is performed to enable the output values created by the data at the previous point in time to be utilized again by the data at the current point, thereby effectively learning the information in the sequence. For an RNN, the data of the previous point and the current point have a major influence on learning, and if autocorrelation is dominant over long time interval in the data, it may adversely affect the feature derivation of the RNN [54]. To overcome the limitation of the RNN, a long short-term memory (LSTM) network was proposed by the authors of reference [55]. According to them, unlike an RNN that uses only one layer to transfer the information of the immediately preceding node to the next state, four layers are utilized in the cell of an LSTM network. These layers can efficiently transfer the immediately preceding information and the current information in a short time. Therefore, it was demonstrated that a LSTM network can resolve the limitation of an RNN since memories with long dependence time and short dependence time can exchange information through these 4 layers. In this study, due to this possibility, we constructed a deep learning architecture based on a LSTM network for the RNN-based model. The configured RNN-based architecture is displayed in Figure 8. For the DNN and CNN networks previously designed, an LSTM network was constructed that can extract a total of 768 features, and the obtained features could be connected to the base network.
4. Results and Discussions
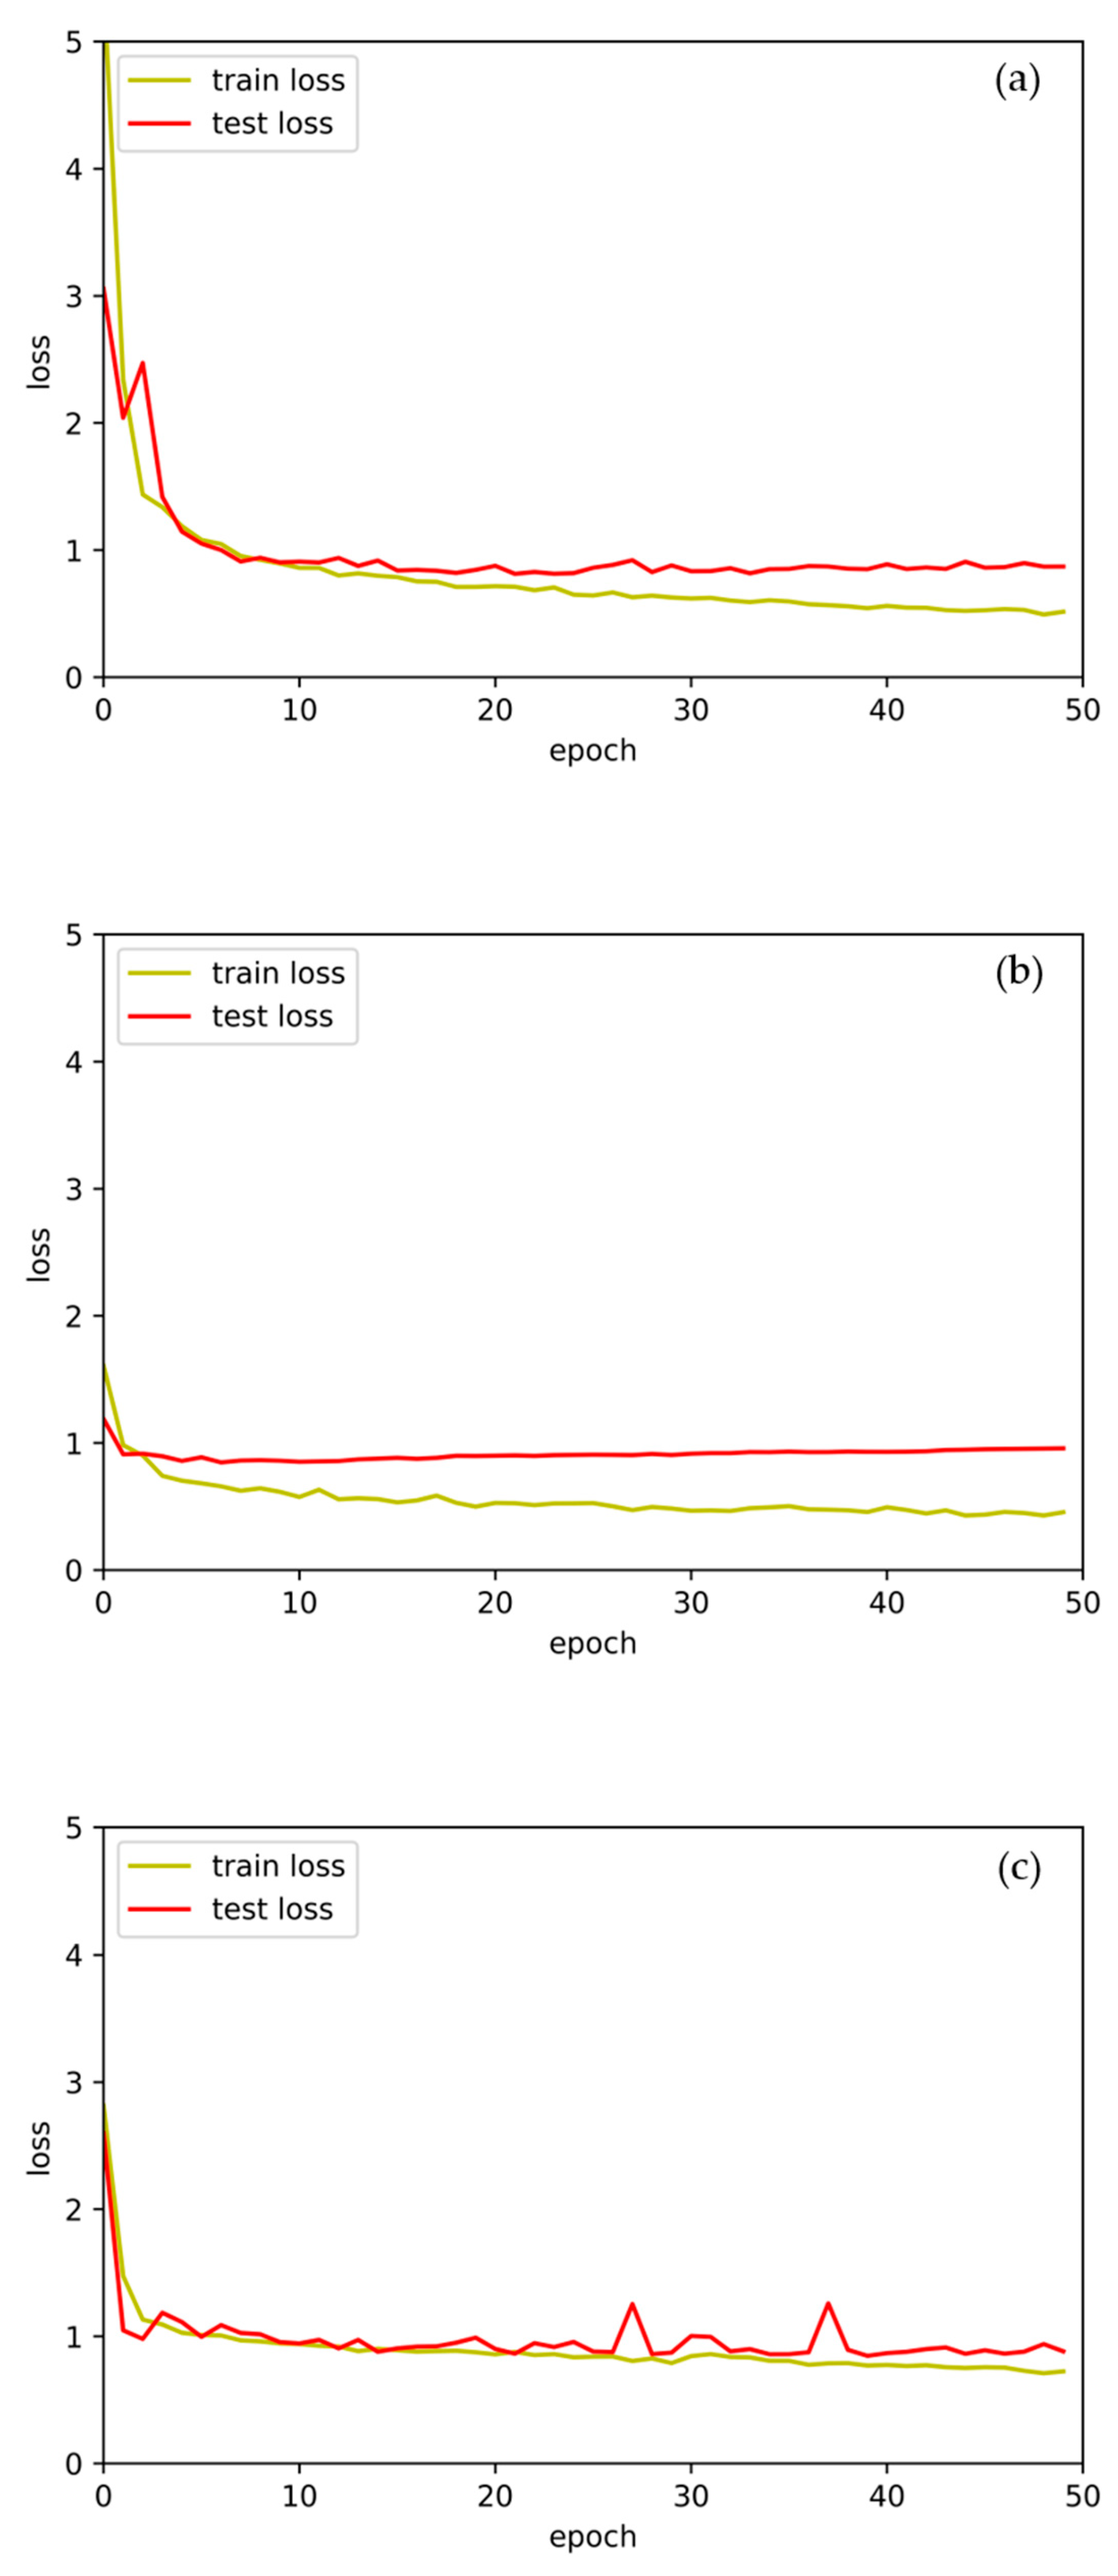
According to [48], it is possible to demonstrate whether each model was well trained with fluctuations in the losses; thus, this study confirmed the training and test losses of all models. Figure 9 illustrates examples of changes in training and test losses as each deep learning model is trained. The training loss and test loss of all models tend to decrease to a similar level in the early stage of learning. Afterward, if training continues, the training loss continues to decrease, whereas the test loss shows a tendency to converge, indicating that the gap between training loss and test loss is increasing. These changes in training loss and test loss demonstrate that training of deep learning models was adequately performed. In addition, it can be observed that the convergence of test loss starts at a relatively early stage of 10–20 epochs, which is considered to be the result of an appropriate setting of various hyperparameters in the development of the heavy rain damage prediction model.
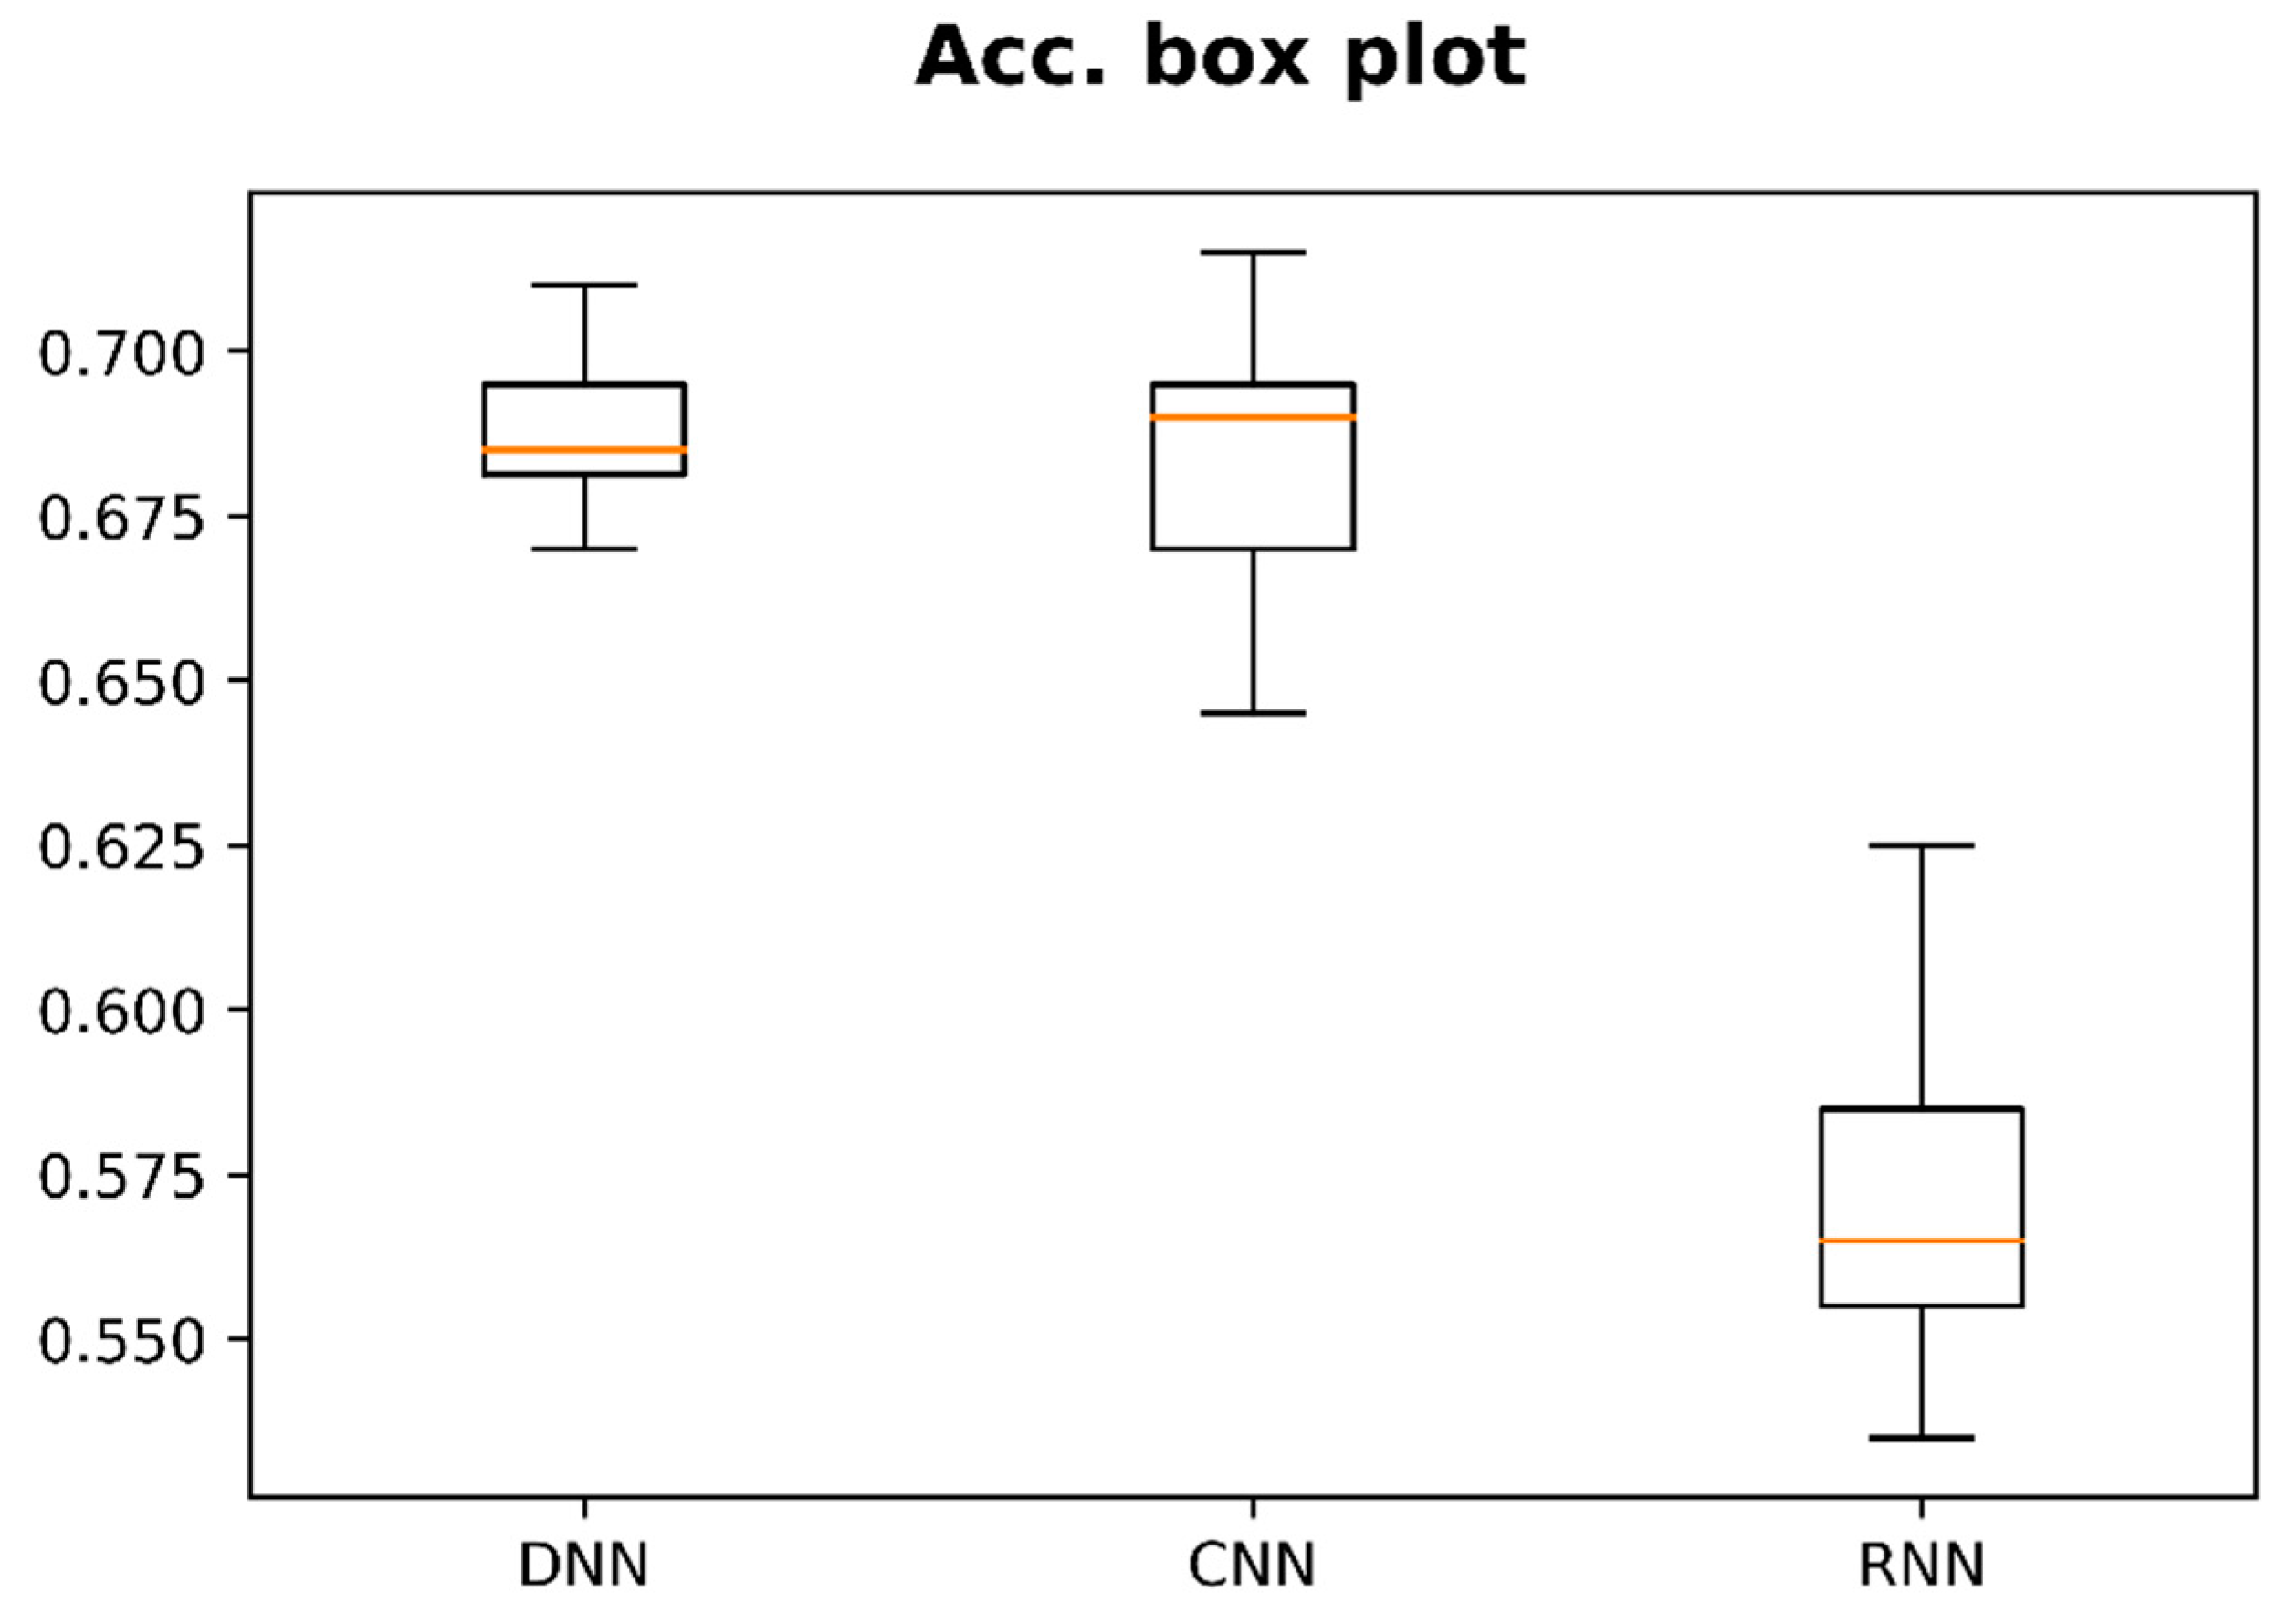
The test results of the deep learning models are displayed in Figure 10. The model with the highest maximum accuracy is the CNN-based model. As a result of 30 tests of the CNN-based model, it was confirmed that it is possible to develop a model with a maximum accuracy of 71.5% and a minimum accuracy of 64.5%, as well as a mean accuracy of 68.3%. In addition, it can be observed that the standard deviation of accuracy according to 30 times of the test is very small at 1.7%. This reveals that it is possible to develop a model with a robust level of accuracy using the CNN-based model.
The model with the second highest-accuracy is the DNN-based model. As a result of 30 tests of the DNN-based model, the maximum accuracy was 71%, with a minimum accuracy of 67.0% and a mean accuracy of 68.9%. Although the maximum accuracy was 0.5% lower than the CNN-based model, the minimum accuracy was 2.5% higher. Moreover, on average, it shows 0.6% higher accuracy than the CNN-based model; thus, it is concluded that the DNN-based model shows better performance than the CNN model. In addition, it can be observed that the standard deviation of accuracy obtained through 30 times of training and test is 1%, which is approximately 0.7% lower than that of the CNN-based model. These results reveal that the DNN-based model is more accurate and robust than the CNN-based model.
The RNN-based model, which revealed the lowest maximum accuracy, was able to obtain a maximum accuracy of 62.5%, a minimum accuracy of 53.5%, and a mean accuracy of 57.1%. With the standard deviation value at 2.1%, the robustness of the RNN-based model is relatively low compared to other models. Due to this accuracy and robustness, the RNN-based model is assumed to be a relatively less adequate deep learning model for heavy rain damage detection. The RNN-based model is generally considered as the model that demonstrates ideal performance for time series data analysis. However, this study showed a relatively low predictive performance. These results are assumed to be the results according to the characteristics shown by the data of 1 h intervals for 1 week. The corresponding data is data over time. However, due to the nature of meteorological data, it is not easy to maintain autocorrelation of the data throughout the week: Changes in meteorological phenomena can occur in a few hours before a localized heavy rainfall event. Since the case of these meteorological phenomena lasting for a week is very rare, partial autocorrelation may be more correlated than overall autocorrelation. Accordingly, the CNN-based model that uses features obtained through filters with short time intervals or the DNN-based model using the features obtained by using all data without the time-series characteristics demonstrate superior performance than the features of the RNN-based model focused on the time-series characteristics of the entire period.
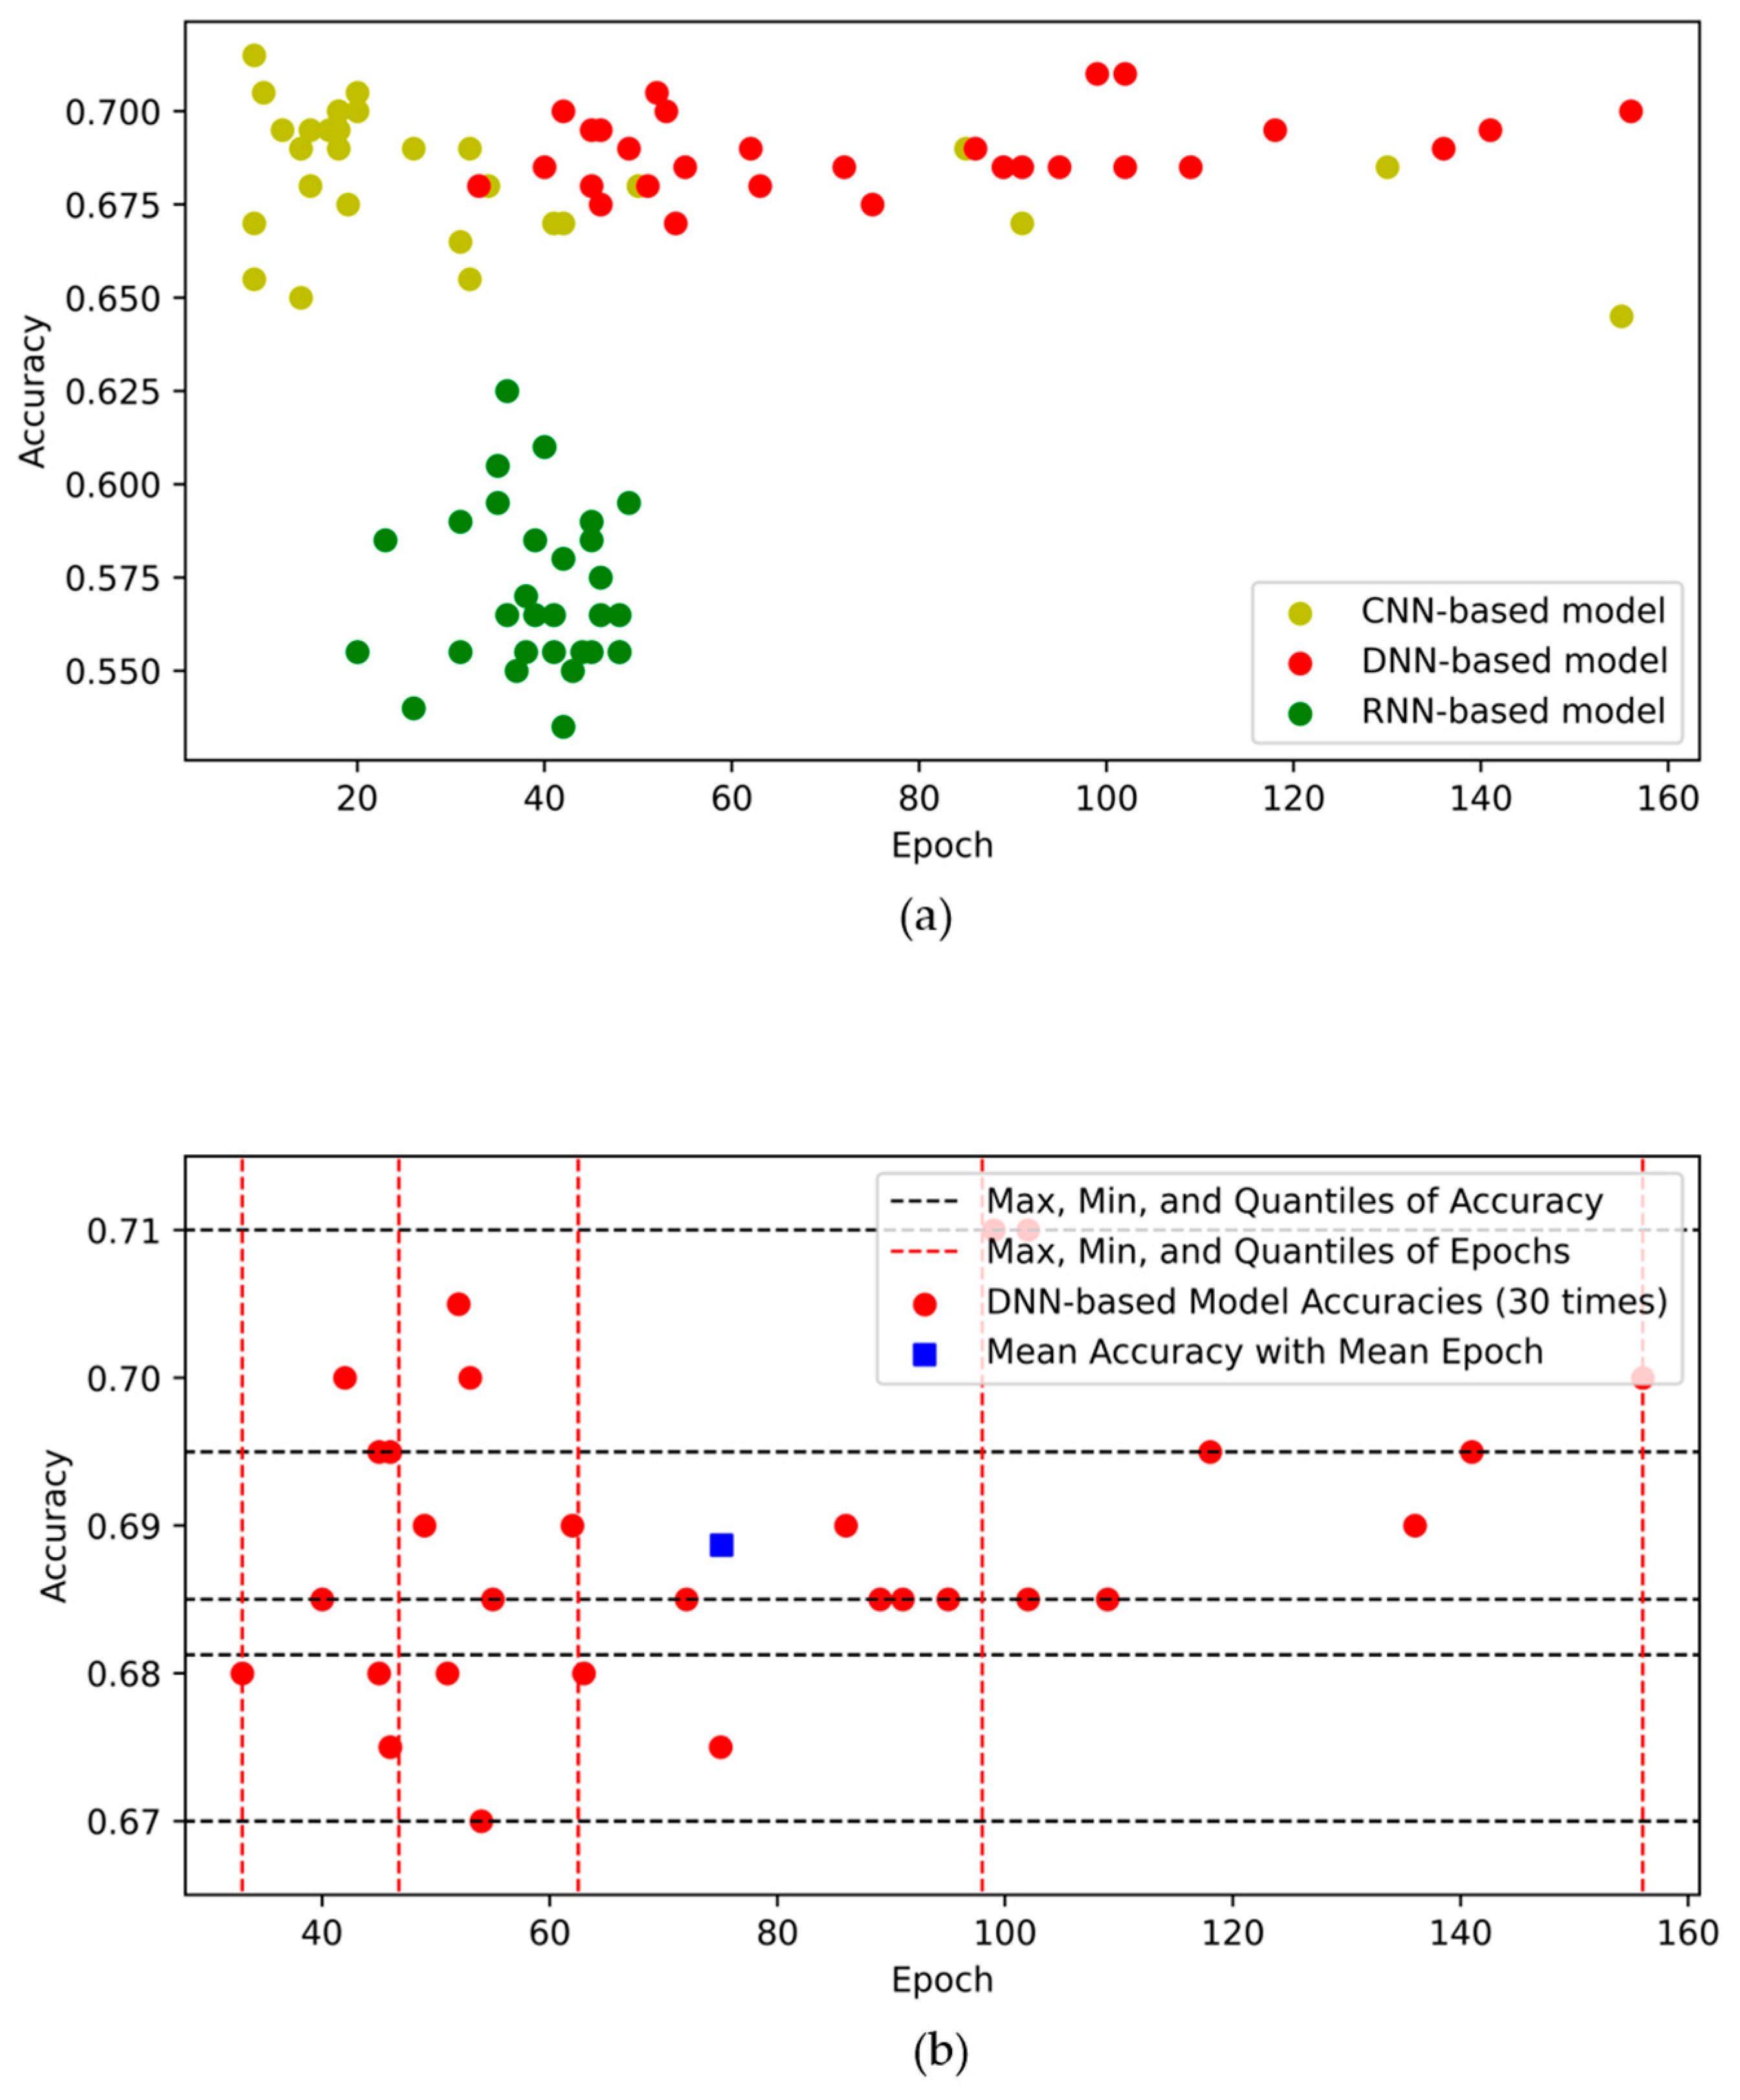
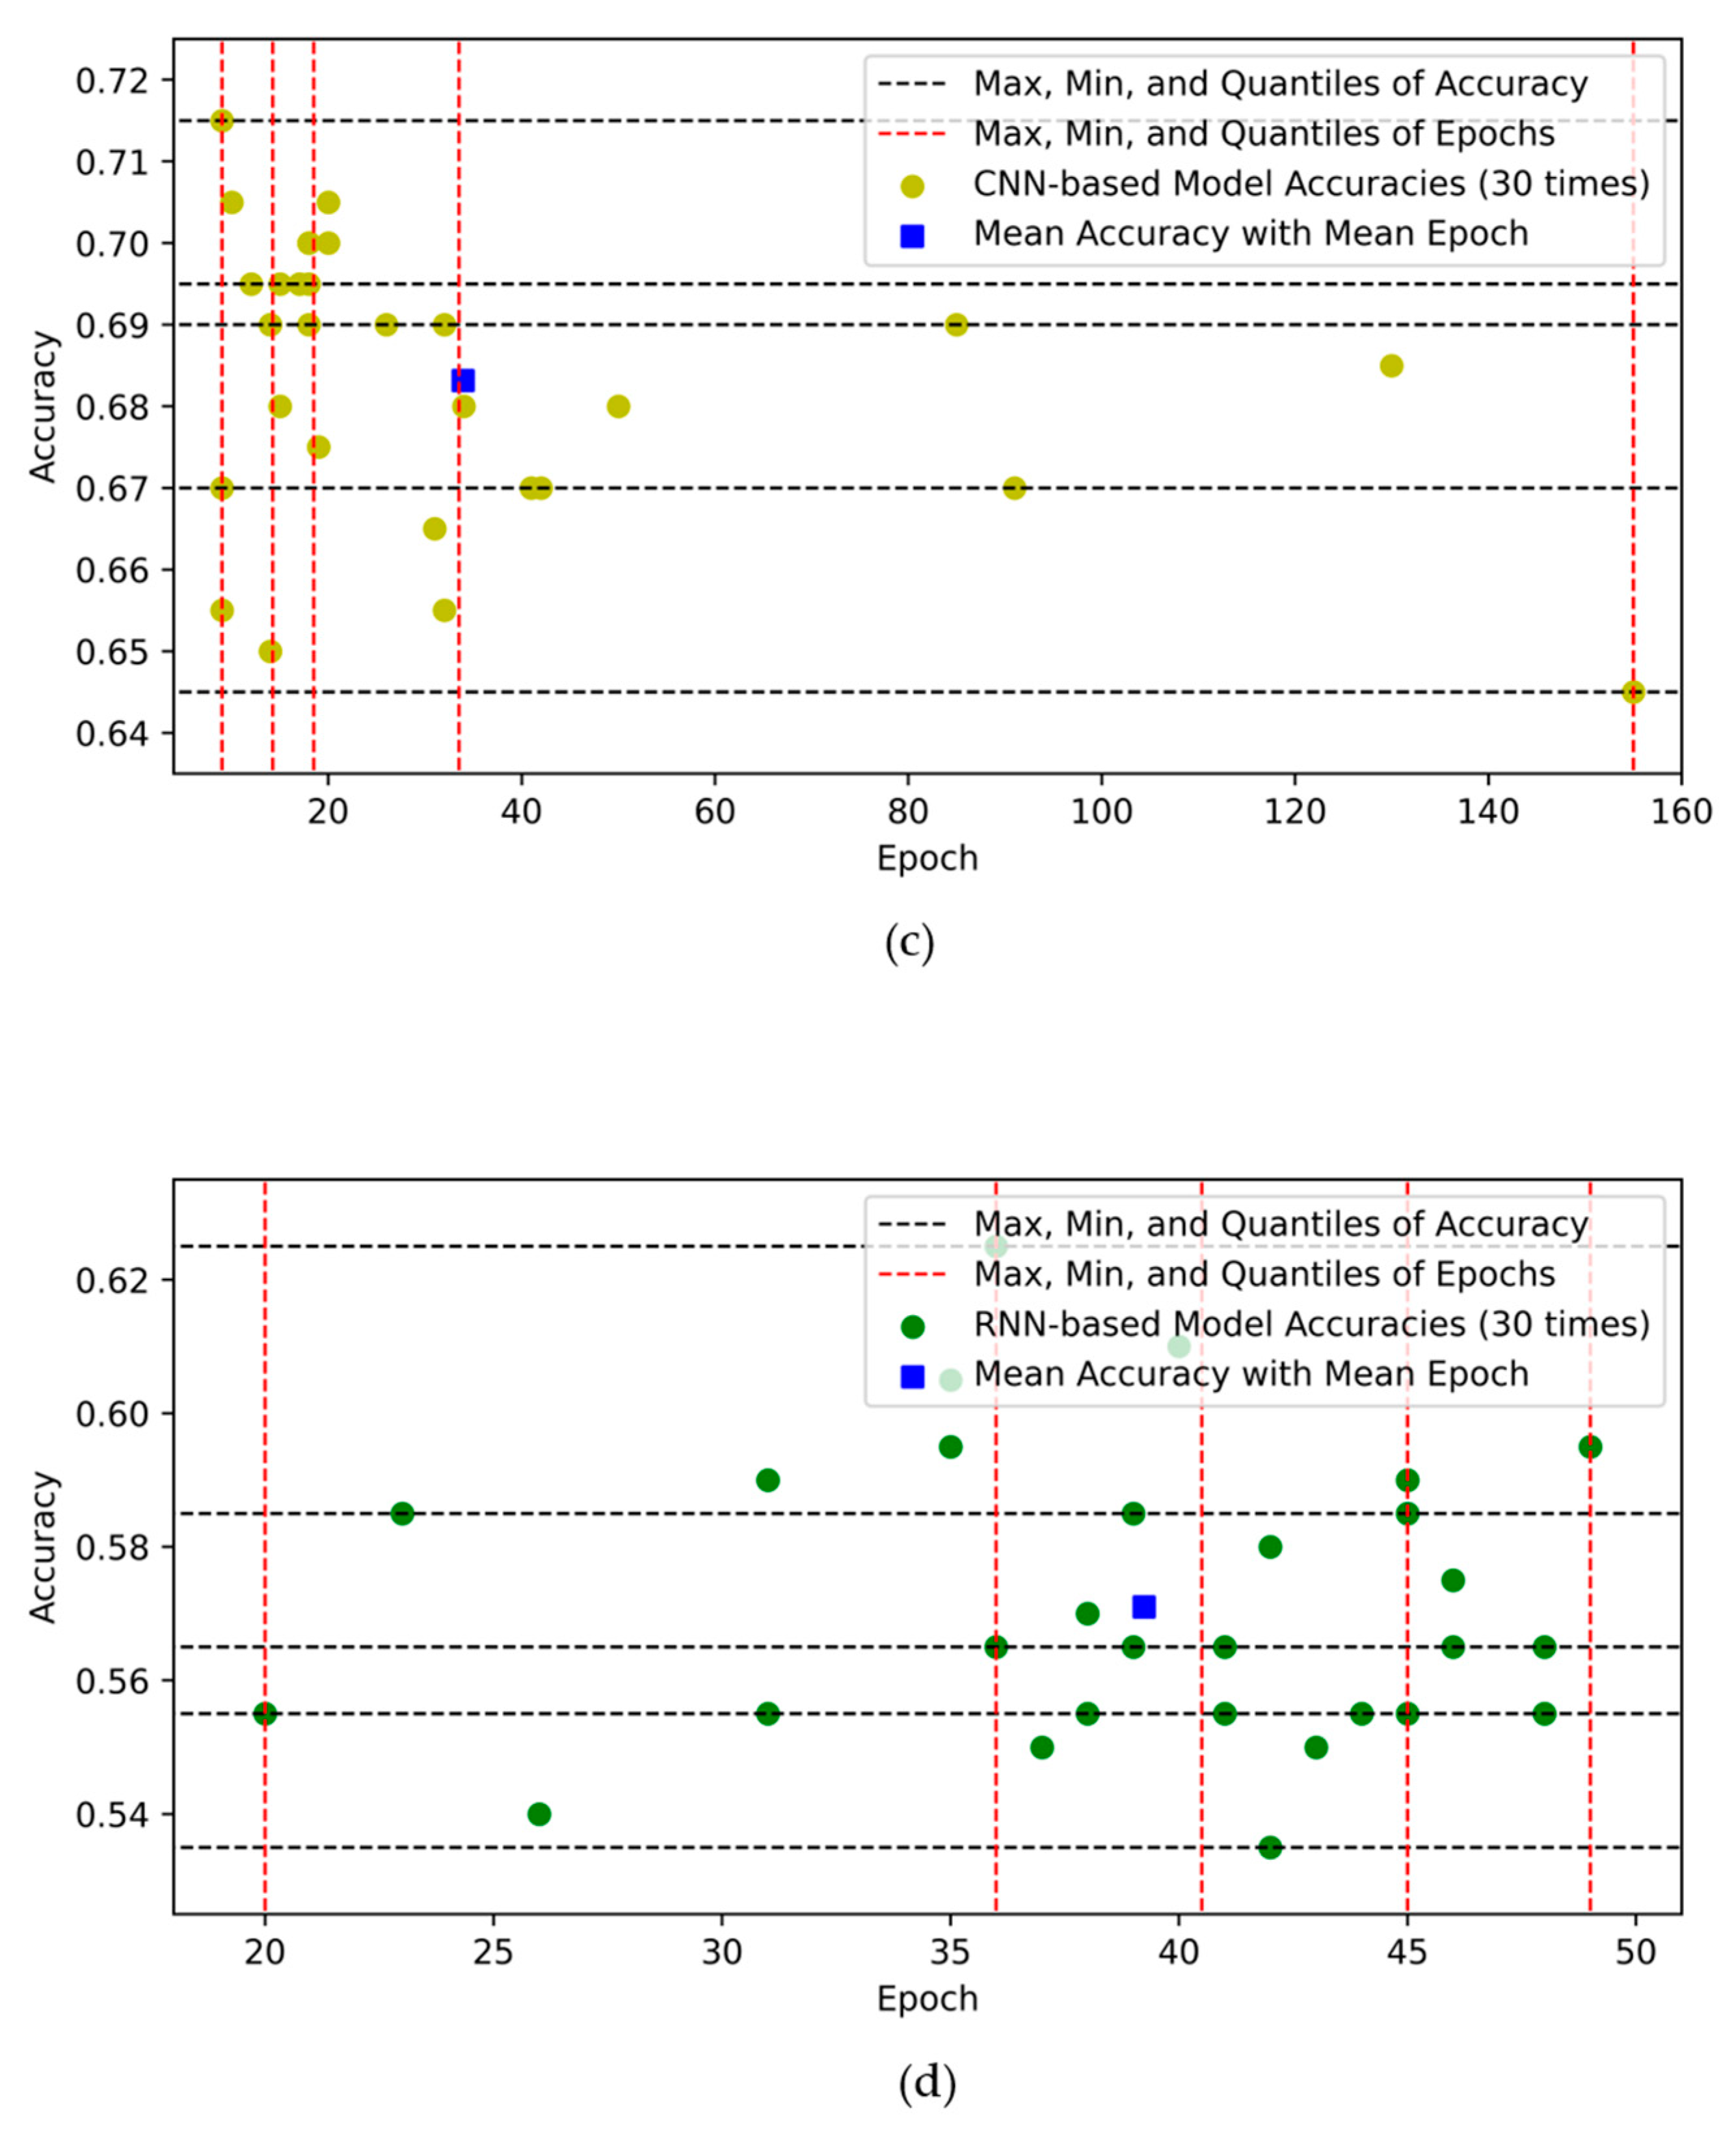
Figure 11a illustrates the maximum accuracy of 30 times for each model, and the scatter plot of the epoch at that time of maximum accuracy and Figure 11b–d show the mean, min, max, and quantiles of accuracies of each model, respectively. For the CNN-based model and the RNN-based model, it can be observed that clusters are formed in a relatively small epoch, as respectively shown in Figure 11c,d. For the DNN-based model, the distribution of the epoch showing the maximum accuracy was relatively wide as shown in Figure 11b. That is, in the actual use, it is believed that it is not easy to obtain an appropriate epoch for convergence of learning in the case of the DNN-based model compared to other models. When comprehensively analyzing all the findings obtained through these tests, it is concluded that although the model with the best accuracy is the DNN-based model, the model that can be most suitable to be used in heavy rain damage prediction is the CNN-based model.
Table 4 and Table 5 display examples of confusion matrices for the DNN and CNN models when the accuracy is 68%, which is similar to the average accuracy of both models. In particular, the false negative rate (FNR) is more important than the false positive rate (FPR) from the perspective of practical and usable damage prediction models [56]. Therefore, the FNRs and FPRs of both the DNN and CNN models were compared using confusion matrices. The false negative indicates that the model predicts the damage class as significant or severe when the actual damage class is minor and as severe when the actual damage class is significant. The false positive indicates that the model predicts the damage class as significant or minor when the actual damage class is severe and as minor when the actual damage class is significant. If the FNR is smaller than the FPR, model usability seems to be better. The FNRs of the DNN and CNN models were 15% and 13%, respectively, and it was confirmed that they were all lower than the corresponding FPRs of the other models. This finding demonstrates the practical application potential of these models.
5. Conclusions
In this study, we developed a deep learning model for heavy rain damage prediction using data collected in the week preceding heavy rain damage. The deep learning techniques used for the model development are a DNN, CNN, and RNN, and the ideal deep learning model for the heavy rain damage prediction was proposed by comparing the accuracy of each deep learning technique. To verify the deep learning prediction model proposed in this study, training and testing of the model were performed 30 times for each model. Through the process, the accuracy and the robustness of the deep learning model were evaluated. The results indicated that the mean accuracy was high in the order of the DNN-based model, CNN-based model, and RNN-based model, and the standard deviation was small in the same order. For the DNN-based model, the convergence epoch of the learnings performed 30 times showed a relatively wide distribution, which may pose difficulties in selecting an epoch suitable for practical use. Therefore, it was determined that the CNN-based deep learning model, which showed satisfactory accuracy and a low standard deviation, as did the DNN-based model, would be most suitable for heavy rain damage prediction. The heavy rain damage prediction model based on the CNN proposed in this study was analyzed to predict the damage range appropriately with a maximum prediction accuracy of 71.5%.
As the results of the study, the most suitable model was the CNN-based model, but the RNN-based model was unsatisfactory. It was confirmed that the autocorrelation of the data was not significant, even though the form of the data used in this study was time-series data. Meanwhile, if the data measured for the various periods are analyzed as input data for prediction models, it could be possible to obtain more accurate results. However, this study aims to develop a heavy rain damage detection model and to validate the three deep learning networks with a week of meteorological data. Therefore, it is expected that this study can be used as a base study for future work to improve the prediction model by applying the data measured for the various periods.
In addition, by evaluating the applicability of a deep learning model that has not been previously considered, it is possible to expect its effectiveness in the field of damage prediction. Through the heavy rain damage prediction model presented, the size of damage can be predicted before the actual occurrence of damage. Therefore, it can be of great benefit in establishing measures to reduce the damage caused by heavy rain. In particular, it is expected that the damage can be significantly reduced if an appropriate combination of the emergency working system and countermeasures can be achieved.
Author Contributions
Conceptualization, C.C.; Data curation, K.L. and C.C.; Formal analysis, K.L.; Funding acquisition, H.S.K.; Investigation, K.L. and C.C.; Methodology, K.L., C.C. and H.S.K.; Project administration, H.S.K.; Resources, C.C.; Software, K.L.; Supervision, D.H.S. and H.S.K.; Validation, K.L. and C.C.; Visualization, K.L. and C.C.; Writing–original draft, K.L. and C.C.; Writing–review & editing, K.L., C.C. and H.S.K. All authors have read and agreed to the published version of the manuscript.
Funding
This work was supported by the National Research Foundation of Korea (NRF) grant funded by the Korea government (MSIT) (No. 2017R1A2B3005695).
Conflicts of Interest
The authors declare no conflict of interest.
References
- Intergovernmental Panel on Climate Change (IPCC). Special Report on Managing the Risks of Extreme Events and Disasters to Advance Climate Change Adaptation; Intergovernmental Panel on Climate Change (IPCC): Geneva, Switzerland, 2012. [Google Scholar]
- IPCC. Special Report on the Ocean and Cryosphere in a Changing Climate; IPCC: Geneva, Switzerland, 2019. [Google Scholar]
- Chen, A.S.; Khoury, M.; Vamvakeridou-Lyroudia, L.; Stewart, D.; Wood, M.; Savic, D.A.; Djordjevic, S. 3D visualisation tool for improving the resilience to urban and coastal flooding in Torbay, UK. Procedia Eng. 2018, 212, 809–815. [Google Scholar] [CrossRef]
- Nam, S.W. A study on the effects and adaptation of climate change in insurance industry. J. Clim. Chang. Res. 2017, 8, 153–161. [Google Scholar] [CrossRef]
- Kreibich, H.; Thaler, T.; Glade, T.; Molinari, D. Preface: Damage of natural hazards: Assessment and mitigation. Nat. Hazards Earth Syst. Sci. 2019, 19, 551–554. [Google Scholar] [CrossRef] [Green Version]
- Martins, B.; Nunes, A.; Lourenço, L.; Velez-Castro, F. Flash Flood Risk Perception by the Population of Mindelo, S. Vicente (Cape Verde). Water 2019, 11, 1895. [Google Scholar] [CrossRef] [Green Version]
- Kim, J.; Choi, C.; Lee, J.; Kim, H.S. Damage Prediction Using Heavy Rain Risk Assessment: (1) Estimation of heavy rain damage risk index. J. Korean Soc. Hazard Mitig. 2017, 17, 361–370. [Google Scholar] [CrossRef]
- Lee, J.; Eo, G.; Choi, C.; Jung, J.; Kim, H.S. Development of Rainfall-Flood Damage Estimation Function using Nonlinear Regression Equation. J. Korean Soc. Disaster Inf. 2016, 12, 74–88. [Google Scholar] [CrossRef]
- Flack, D.L.; Skinner, C.J.; Hawkness-Smith, L.; O’Donnell, G.; Thompson, R.J.; Waller, J.A.; Chen, A.S.; Moloney, J.; Largeron, C.; Xia, X.; et al. Recommendations for improving integration in national end-to-end flood forecasting systems: An overview of the FFIR (Flooding From Intense Rainfall) programme. Water 2019, 11, 725. [Google Scholar] [CrossRef] [Green Version]
- Kim, J.; Woods, P.K.; Park, Y.; Kim, T.; Son, K. Predicting hurricane wind damage by claim payout based on Hurricane Ike in Texas. Geomat Nat. Hazards Risk 2016, 7, 1513–1525. [Google Scholar] [CrossRef] [Green Version]
- Kim, J.; Kim, T.; Lee, B. An analysis of typhoon damage pattern type and development of typhoon damage forecasting function. J. Korean Soc. Hazard Mitig. 2017, 17, 339–347. [Google Scholar] [CrossRef]
- Kim, J.; Choi, C.; Kim, T. Development of typhoon damage prediction function using a logistic distribution. J. Korean Soc. Hazard Mitig. 2019, 19, 105–113. [Google Scholar] [CrossRef]
- Zhai, A.R.; Jiang, J.H. Dependence of US hurricane economic loss on maximum wind speed and storm size. Environ. Res. Lett. 2014, 9, 064019. [Google Scholar] [CrossRef]
- Yang, S.; Son, K.; Lee, K.; Kim, J. Typhoon path and prediction model development for building damage ratio using multiple regression analysis. J. Korea Inst. Build. Constr. 2016, 16, 437–445. [Google Scholar] [CrossRef]
- Pielke, R.A., Jr.; Downton, M.W. Precipitation and damaging floods: Trends in the United States, 1932–1997. J. Clim. 2000, 13, 3625–3637. [Google Scholar] [CrossRef] [Green Version]
- Choi, C.; Kim, J.; Kim, J.; Kim, H.; Lee, W.; Kim, H.S. Development of heavy rain damage prediction function using statistical methodology. J. Korean Soc. Hazard Mitig. 2017, 17, 331–338. [Google Scholar] [CrossRef]
- Kim, J.; Park, J.; Choi, C.; Kim, H.S. Development of regression models resolving high-dimensional data and multicollinearity problem for heavy rain damage data. J. Korean Soc. Civ. Eng. 2018, 38, 801–808. [Google Scholar]
- Penning-Rowsell, E.; Johnson, C.; Tunstall, S.; Tapsell, S.; Morris, J.; Chatterton, J.; Green, C. The Benefits of Flood and Coastal Risk Management: A Handbook of Assessment Techniques; Middlesex University Press: London, UK, 2005; ISBN 1904750516. [Google Scholar]
- Penning-Rowsell, E.; Priest, S.; Parker, D.; Morris, J.; Tunstall, S.; Viavattene, C.; Chatterton, J.; Owen, D. Flood and Coastal Erosion Risk Management: A Manual for Economic Appraisal; Routledge: Abingdon, UK, 2014. [Google Scholar]
- Kim, J.; Choi, C.; Lee, J.; Kim, H.S. Damage prediction using heavy rain risk assessment: (2) Development of heavy rain damage prediction function. J. Korean Soc. Hazard Mitig. 2017, 17, 371–379. [Google Scholar] [CrossRef]
- Kim, D.; Choi, C.; Kim, J.; Joo, H.; Kim, J.; Kim, H.S. Development of a heavy rain damage prediction function by risk classification. J. Korean Soc. Hazard Mitig. 2018, 18, 503–512. [Google Scholar] [CrossRef]
- Jeong, J.; Lee, S. Estimating the direct economic damages from heavy snowfall in Korea. J. Clim. Res. 2014, 9, 125–139. [Google Scholar] [CrossRef]
- Choubin, B.; Borji, M.; Mosavi, A.; Sajedi-Hosseini, F.; Singh, V.P.; Shamshirband, S. Snow avalanche hazard prediction using machine learning methods. J. Hydrol. 2019, 577, 123929. [Google Scholar] [CrossRef]
- Oh, Y.; Chung, G. Estimation of snow damage and proposal of snow damage threshold based on historical disaster data. J. Korean Soc. Civ. Eng. 2017, 37, 325–331. [Google Scholar] [CrossRef] [Green Version]
- Marjanović, M.; Kovačević, M.; Bajat, B.; Voženílek, V. Landslide susceptibility assessment using SVM machine learning algorithm. Eng. Geol. 2011, 123, 225–234. [Google Scholar] [CrossRef]
- Merz, B.; Kreibich, H.; Lall, U. Multi-variate flood damage assessment: A tree-based data-mining approach. Nat. Hazards Earth Syst. Sci. 2013, 13, 53–64. [Google Scholar] [CrossRef]
- Goetz, J.N.; Brenning, A.; Petschko, H.; Leopold, P. Evaluating machine learning and statistical prediction techniques for landslide susceptibility modeling. Comput. Geosci. 2015, 81, 1–11. [Google Scholar] [CrossRef]
- Choi, C.; Kim, J.; Kim, J.; Kim, D.; Bae, Y.; Kim, H.S. Development of heavy rain damage prediction model using machine learning based on big data. Adv. Meteorol. 2018, 2018, 5024930. [Google Scholar] [CrossRef] [Green Version]
- Choi, C.; Kim, J.; Kim, J.; Kim, H.S. Development of combined heavy rain damage prediction models with machine learning. Water 2019, 11, 2516. [Google Scholar] [CrossRef] [Green Version]
- Lake, B.M.; Zaremba, W.; Fergus, R.; Gureckis, T.M. Deep Neural Networks Predict Category Typicality Ratings for Images. In Proceedings of the 37th Annual Conference of the Cognitive Science Society, Austin, TX, USA, 23–25 July 2015. [Google Scholar]
- Zhang, W.; Du, T.; Wang, J. Deep learning over multi-field categorical data. In Proceedings of the European conference on information retrieval, Padova, Italy, 20–23 March 2016; pp. 45–57. [Google Scholar]
- Sommer, L.W.; Schuchert, T.; Beyerer, J. Deep learning based multi-category object detection in aerial images. Int. Soc. Opt. Photonics 2017, 10202, 1020209. [Google Scholar]
- Han, J.; Zhang, D.; Cheng, G.; Liu, N.; Xu, D. Advanced deep-learning techniques for salient and category-specific object detection: A survey. IEEE Signal Process. Mag. 2018, 35, 84–100. [Google Scholar] [CrossRef]
- Alemany, S.; Beltran, J.; Perez, A.; Ganzfried, S. Predicting hurricane trajectories using a recurrent neural network. In Proceedings of the AAAI Conference on Artificial Intelligence, Honolulu, HI, USA, 27 January–1 February 2019; Volume 33, pp. 468–475. [Google Scholar]
- Rosenblatt, F. The Perceptron, a Perceiving and Recognizing Automaton Project Para; Cornell Aeronaut Laboratory: Buffalo, NJ, USA, 1957. [Google Scholar]
- Minsky, M.L.; Papert, S. Perceptrons: An Introduction to Computational Geometry; Cambridge Tiass: Cambridge, MA, USA, 1969. [Google Scholar]
- Rumelhart, D.E.; McClelland, J.L.; PDP Research Group. Parallel Distributed Processing; MIT Press: Cambridge, MA, USA, 1987. [Google Scholar]
- O’Connell, J.; Li, Z.; Hanson, J.; Heffernan, R.; Lyons, J.; Paliwal, K.; Dehzangi, A.; Yang, Y.; Zhou, Y. SPIN2: Predicting sequence profiles from protein structures using deep neural networks. Proteins Struct. Funct. Bioinform. 2018, 86, 629–633. [Google Scholar] [CrossRef] [Green Version]
- Schmidhuber, J. Deep learning in neural networks: An overview. Neural Netw. 2015, 61, 85–117. [Google Scholar] [CrossRef] [Green Version]
- Kons, Z.; Toledo-Ronen, O.; Carmel, M. Audio event classification using deep neural networks. Interspeech 2013, 1482–1486. [Google Scholar]
- Al Rahhal, M.M.; Bazi, Y.; AlHichri, H.; Alajlan, N.; Melgani, F.; Yager, R.R. Deep learning approach for active classification of electrocardiogram signals. Inf. Sci. 2016, 345, 340–354. [Google Scholar] [CrossRef]
- Ciregan, D.; Meier, U.; Schmidhuber, J. Multi-column deep neural networks for image classification. In Proceedings of the 2012 IEEE conference on computer vision and pattern recognition, Providence, RI, USA, 16–21 June 2012; pp. 3642–3649. [Google Scholar]
- Sun, L.; Du, J.; Dai, L.R.; Lee, C.H. Multiple-target deep learning for LSTM-RNN based speech enhancement. In Proceedings of the 2017 Hands-free Speech Communications and Microphone Arrays, San Francisco, CA, USA, 1–3 March 2017; pp. 136–140. [Google Scholar]
- Ying, Z.; Shi, X. An RNN-based algorithm to detect prosodic phrase for Chinese TTS. In Proceedings of the 2001 IEEE International Conference on Acoustics, Speech, and Signal Processing, Salt Lake City, UT, USA, 7–11 May 2001; IEEE: Piscataway, NJ, USA, 2001; Volume 2, pp. 809–812. [Google Scholar]
- Krizhevsky, A.; Sutskever, I.; Hinton, G.E. Imagenet classification with deep convolutional neural networks. In Advances in Neural Information Processing Systems; MIT Press: Cambridge, MA, USA, 2012; pp. 1097–1105. [Google Scholar]
- Shi, W.; Caballero, J.; Huszár, F.; Totz, J.; Aitken, A.P.; Bishop, R.; Rueckert, D.; Wang, Z. Real-time single image and video super-resolution using an efficient sub-pixel convolutional neural network. In Proceedings of the IEEE Conference on Computer Vision and Pattern Recognition, Las Vegas, NV, USA, 27–30 June 2016; pp. 1874–1883. [Google Scholar]
- Hershey, S.; Chaudhuri, S.; Ellis, D.P.; Gemmeke, J.F.; Jansen, A.; Moore, R.C.; Plakal, M.; Platt, D.; Saurous, R.A.; Seybold, B.; et al. CNN architectures for large-scale audio classification. In Proceedings of the 2017 IEEE International Conference on Acoustics, Speech and Signal Processing, Kuching, Malaysia, 12–14 September 2017; pp. 131–135. [Google Scholar]
- Lee, K.; Byun, N.; Shin, D. A Damage Localization Approach for Rahmen Bridge Based on Convolutional Neural Network. KSCE J. Civil Eng. 2020, 24, 1–9. [Google Scholar] [CrossRef]
- Ioffe, S.; Szegedy, C. Batch normalization: Accelerating deep network training by reducing internal covariate shift. arXiv 2015, arXiv:1502.03167. [Google Scholar]
- Clevert, D.A.; Unterthiner, T.; Hochreiter, S. Fast and accurate deep network learning by exponential linear units (elus). arXiv 2015, arXiv:1511.07289. [Google Scholar]
- He, K.; Zhang, X.; Ren, S.; Sun, J. Delving deep into rectifiers: Surpassing human-level performance on imagenet classification. In Proceedings of the IEEE International Conference on Computer Vision, Boston, MA, USA, 7–12 June 2015; IEEE: Piscataway, NJ, USA, 2015. [Google Scholar]
- CSC321 Winter 2014. Available online: http://www.cs.toronto.edu/~tijmen/csc321/slides/lecture_slides_lec6.pdf (accessed on 4 June 2020).
- Srivastava, N.; Hinton, G.; Krizhevsky, A.; Sutskever, I.; Salakhutdinov, R. Dropout: A simple way to prevent neural networks from overfitting. J. Mach. Learn Res. 2014, 15, 1929–1958. [Google Scholar]
- Bengio, Y.; Simard, P.; Frasconi, P. Learning long-term dependencies with gradient descent is difficult. IEEE Trans Neural Netw. 1994, 5, 157–166. [Google Scholar] [CrossRef]
- Hochreiter, S.; Schmidhuber, J. Long short-term memory. Neural Comput. 1997, 9, 1735–1780. [Google Scholar] [CrossRef]
- Lee, K.; Jeong, S.; Sim, S.H.; Shin, D. A novelty detection approach for tendons of prestressed concrete bridges based on a convolutional autoencoder and acceleration data. Sensors 2019, 19, 1633. [Google Scholar] [CrossRef] [Green Version]
Figure 1.
Number of heavy rain damage events and total heavy rain damage (1988–2017).

Figure 2.
Study area (Gyeonggi province in South Korea).

Figure 3.
Number of heavy rain damage events by damage category.

Figure 4.
Composition of independent variables.

Figure 5.
Base network architecture.

Figure 6.
Deep neural network (DNN)-based model architecture.

Figure 7.
Convolutional neural network (CNN)-based model architecture.

Figure 8.
Recurrent neural network (RNN)-based model architecture.

Figure 9.
Examples of training and test loss for each deep learning model: (a) DNN-based model; (b) CNN-based model; (c) RNN-based model.
Figure 9.
Examples of training and test loss for each deep learning model: (a) DNN-based model; (b) CNN-based model; (c) RNN-based model.

Figure 10.
Accuracy boxplot for the 30 test results for each deep learning model.

Figure 11.
Scatter plots of maximum accuracies with epochs from 30 test results for each model: (a) all models; (b) DNN-based model; (c) CNN-based model; (d) RNN-based model.
Figure 11.
Scatter plots of maximum accuracies with epochs from 30 test results for each model: (a) all models; (b) DNN-based model; (c) CNN-based model; (d) RNN-based model.


Table 1.
Range of damage by damage category.
| Damage Category | Range of Damage (1 Million KRW) |
|---|---|
| Minor | ~38 |
| Significant | 38 ~ Standards of national support |
| Severe | Standards of national support ~ |
Table 2.
Standards of national support by region.
| Region | Standards of National Support (1 Million KRW) | Region | Standards of National Support (1 Million KRW) |
|---|---|---|---|
| Ansan City | 42 | Namyangju City | 36 |
| Anseong City | 42 | Osan City | 42 |
| Anyang City | 42 | Paju City | 42 |
| Bucheon City | 42 | Pocheon City | 42 |
| Dongducheon City | 36 | Pyeongtaek City | 42 |
| Gapyeong County | 30 | Seongnam City | 42 |
| Gimpo City | 36 | Siheung City | 42 |
| Goyang City | 30 | Suwon City | 42 |
| Gunpo City | 36 | Uijeongbu City | 42 |
| Guri City | 36 | Uiwang City | 42 |
| Gwacheon City | 30 | Yangju City | 42 |
| Gwangju City | 36 | Yangpyeong County | 42 |
| Gwangmyeong City | 36 | Yeoju City | 42 |
| Hanam City | 42 | Yeoncheon County | 42 |
| Hwaseong City | 42 | Yongin City | 42 |
| Icheon City | 42 |
Table 3.
Used meteorological variables.
| Meteorological Variables | Unit |
|---|---|
| Average temperature | °C |
| Precipitation | mm |
| Average wind speed | m/s |
| Average relative humidity | % |
| Vapor pressure | hPa |
| Dew point temperature | °C |
| Average local pressure | hPa |
| Average sea-level pressure | hPa |
| Duration of sunshine | h |
| Visibility | 10 m |
| Ground-surface temperature | °C |
Table 4.
Example of confusion matrix for the DNN model.
| DNN Model | Predicted Damage Class | |||
|---|---|---|---|---|
| Severe | Significant | Minor | ||
| Actual damage class | Severe | 7.5% | 4.0% | 0.5% |
| Significant | 3.5% | 30.5% | 10.5% | |
| Minor | 1.5% | 12.5% | 30.0% | |
Table 5.
Example of confusion matrix for the CNN model.
| CNN Model | Predicted Damage Class | |||
|---|---|---|---|---|
| Severe | Significant | Minor | ||
| Actual damage class | Severe | 8.0% | 4.0% | 0.0% |
| Significant | 4.0% | 31.0% | 9.0% | |
| Minor | 2.5% | 12.5% | 29.0% | |
© 2020 by the authors. Licensee MDPI, Basel, Switzerland. This article is an open access article distributed under the terms and conditions of the Creative Commons Attribution (CC BY) license (http://creativecommons.org/licenses/by/4.0/).
Share and Cite
MDPI and ACS Style
Lee, K.; Choi, C.; Shin, D.H.; Kim, H.S. Prediction of Heavy Rain Damage Using Deep Learning. Water 2020, 12, 1942. https://0-doi-org.brum.beds.ac.uk/10.3390/w12071942
AMA Style
Lee K, Choi C, Shin DH, Kim HS. Prediction of Heavy Rain Damage Using Deep Learning. Water. 2020; 12(7):1942. https://0-doi-org.brum.beds.ac.uk/10.3390/w12071942
Chicago/Turabian StyleLee, Kanghyeok, Changhyun Choi, Do Hyoung Shin, and Hung Soo Kim. 2020. "Prediction of Heavy Rain Damage Using Deep Learning" Water 12, no. 7: 1942. https://0-doi-org.brum.beds.ac.uk/10.3390/w12071942
Note that from the first issue of 2016, this journal uses article numbers instead of page numbers. See further details here.