Article

Multivariate Analysis for Assessing Irrigation Water Quality: A Case Study of the Bahr Mouise Canal, Eastern Nile Delta

by
Mohamed K. Abdel-Fattah
1,
Sameh Kotb Abd-Elmabod
2,3,*,
Ali A. Aldosari
4,
Ahmed S. Elrys
1 and
Elsayed Said Mohamed
5,*
1
Soil Science Department, Faculty of Agriculture, Zagazig University, Zagazig 44519, Egypt
2
Soils and Water Use Department, Agricultural and Biological Research Division, National Research Centre, Cairo 1262, Egypt
3
MED Soil Research Group, Department of Crystallography, Mineralogy and Agricultural Chemistry, Seville University, 41012 Seville, Spain
4
Geography Department, King Saud University, 11451 Riyadh, Saudi Arabia
5
National Authority for Remote Sensing and Space Sciences, Cairo 11843, Egypt
*
Authors to whom correspondence should be addressed.
Submission received: 31 July 2020 / Revised: 5 September 2020 / Accepted: 9 September 2020 / Published: 11 September 2020
(This article belongs to the Special Issue Water Management for Agricultural, Environmental and Urban Uses)

Abstract

:
Water scarcity and suitable irrigation water management in arid regions represent tangible challenges for sustainable agriculture. The current study aimed to apply multivariate analysis and to develop a simplified water quality assessment using principal component analysis (PCA) and the agglomerative hierarchical clustering (AHC) technique to assess the water quality of the Bahr Mouise canal in El-Sharkia Governorate, Egypt. The proposed methods depended on the monitored water chemical composition (e.g., pH, water electrical conductivity (ECiw), Ca2+, Mg2+, Na+, K+, HCO3, Cl, and SO42−) during 2019. Based on the supervised classification of satellite images (Landsat 8 Operational Land Imager (OLI)), the distinguished land use/land cover types around the Bahr Mouise canal were agriculture, urban, and water bodies, while the dominating land use was agriculture. The water quality of the Bahr Mouise canal was classified into two classes based on the application of the irrigation water quality index (IWQI), while the water quality was classified into three classes using the PCA and AHC methods. Temporal variations in water quality were investigated, where the water qualities in winter, autumn, and spring (January, February, March, April, November, and December) were classified as class I (no restrictions) based on IWQI application, and the water salinity, sodicity, and/or alkalinity did not represent limiting factors for irrigation water quality. On the other hand, in the summer season (May, June, July, August, and October), the irrigation water was classified as class II (low restrictions); therefore, irrigation processes during summer may lead to an increase in the alkalinity hazard. The PCA classifications were compared with the IWQI results; the PCA classifications had similar assessment results during the year, except in September, while the water quality was assigned to class II using the PCA method and class I by applying the IWQI. Furthermore, the normalized difference vegetation index (NDVI) around the Bahr Mouise canal over eight months and climatic data assisted in explaining the fluctuations in water quality during 2019 as a result of changing the crop season and agriculture management. Assessments of water quality help to conserve soil, reduce degradation risk, and support decision makers in order to obtain sustainable agriculture, especially under water irrigation scarcity and the limited agricultural land in such an arid region.

1. Introduction

Surface water quality is a very sensitive and global environmental issue that is important for long-term economic development and environmental sustainability [1,2,3]. Awareness and attention to water irrigation quality have increased worldwide in recent years, and new approaches have been developed to achieve the sustainable management of water resources [4,5]. In the same context, the shortage of water resources has become a big problem in many countries, particularly under continued population growth, accelerated industrialization, rapid urbanization, and global climate change [6,7]. Therefore, water scarcity and sustainable irrigation water management have become global challenges for sustainable agriculture development in order to produce sufficient food to satisfy the population’s food requirements [8,9,10].
Agricultural production in Egypt is largely dependent on the River Nile, which contributes 73% of the total irrigation requirement (55 billion m3 per year) [11,12,13]. Egyptian agricultural land represents only 3.8% (km2) of the total area (1.01 million km2), and the Nile delta provides 65% (24,700 km2) of the total agricultural land [13,14]. Therefore, Egypt faces great challenges due to arid climate, fixed Nile water share, limited agricultural land, and rapid population growth. The water renewable resources per capita have dropped intensely to 700 m3/capita, which moved Egypt below the water poverty level [15]. In this context, the amount of water shares per capita in Egypt may decrease to 500 m3/capita by 2025 [16]. Therefore, the limited and fixed water resources, as well as ever-increasing water demands, are the main issues in accelerating the practice of agricultural drainage water reuse as an alternative resource to fill the gap between water supply and demand. The Egyptian national water strategy states that the practice of drainage water reuse would fulfil irrigation water demands for newly reclaimed areas in the Eastern and Western Nile Delta regions [15,16].
Irrigation water contains several dissolved salts [17,18,19]. The characteristics and amount of these dissolved salts depend on the water source and its chemical composition. The most ordinarily dissolved ions in water are calcium (Ca2+), sodium (Na+), magnesium (Mg2+), sulfate (SO42−), nitrate (NO3), chloride (Cl), boron (Br), carbonate (CO32−), and bicarbonates (HCO3). The proportion and concentration of these dissolved ions are used to determine the suitability of water for irrigation [20,21,22]. Water irrigation quality for agricultural use is determined based on its impact on crop yield (quality and quantity), as well as its impact on soil physiochemical properties [23]. Most soil problems (e.g., salinity, sodicity, contamination, and restricted infiltration) are due to the use of low-quality water for irrigation [24].
Nile river water is characterized by its high quality from the upper Nile countries to the mouth of the river in Egypt. The annual average electrical conductivity (EC) is about 0.15 dS m−1 in the Victoria and Atbara Lakes, while the EC increases to reach 0.70 dS m−1 in the Rosetta branch north of the Nile delta. Accordingly, the EC values of the river Nile range from 0.27 to 0.46 dS m−1 in upper Egypt [25]. In addition, calcium and magnesium are the dominant cations in the water of the Nile river in upper Egypt, while sodium and potassium are the dominant cations in the Nile water of lower Egypt [26]. The Bahr Mouise canal represents the main canal for irrigation and municipal water in the El-Sharkia Governorate, Egypt [8]. The contamination of the Bahr Mouise canal is due to the brick industry in close areas (Menia El-Kamh and Hehia), soup, and oil industries in El-Zagazig city, as well as human settlement effluent [27]. Generally, the use of low-quality water causes several environmental impacts on soil, plants, animals, and humans [28,29]. Urbanization and human activities impact almost all freshwater bodies [30].
The low quality of irrigation water is characterized by a reduction of dissolved oxygen, a lower transparency, a high electric conductivity, a high alkalinity, a water temperature increase, and high levels of total dissolved solids [31]. The irrigation water quality index (IWQI) represent a gathering of individual water parameters that are expressed in a single numerical expression in order to judge the use of water for irrigation purposes [32].
Many researchers have used remote sensing and geographic information system (GIS) techniques to study water quality and environmental contamination to find the relationship between water pollution and different land uses under diverse environmental conditions [33,34]. Different studies have proven the negative impacts of urban and industrial areas on water quality [35,36]. Land cover/land use (LCLU) changes are related to human activity, while rapid urbanization represents a real threat to the most fertile soils and water quality in the Nile delta [37]. Therefore, creating LCLU maps helps in monitoring the changes of land cover, and correlating the variation in water quality with LCLU changes helps to obtain optimal solutions and to improve irrigation water quality [38,39,40,41,42]. The spatiotemporal data provided by remote sensing analyses play a vital role in observing and investigating land cover changes over time [43]. The normalized difference vegetation index (NDVI) has been used for monitoring vegetation [44,45], calculating crop cover [46,47], monitoring drought [48], and assessing agricultural drought at the national level [49].
Principal component analysis (PCA) can convert multiple parameters into comprehensive indicators based on dimensional reduction and can decrease the calculation complexity of using many variables in a conventional statistical analysis [50,51,52,53,54]. In pervious study, various multivariate statistical analyses were applied to assess the river water quality based on using 13 parameters, and the cluster analysis (CA) method was used to group the 12 months of monitoring into three periods, as well as to group 18 sampling sites into three groups [55]. The discriminant analysis (DA) aimed to identify the significant parameters among the temporal and spatial groups, and the PCA method aimed to standardize water quality, examine the differences between groups, identify the main sources of contamination. Most former studies have used the PCA method to assess the water of rivers and lakes for irrigation proposes [56,57]. On the other hand, many indices have been used for monitoring recycled wastewater while considering wastewater reclamation standards [58,59,60,61].
The study objective was to assess the irrigation water quality of the Bahr Mouise canal at six locations over the 12 months of 2019 using a multivariate analysis (i.e., the IWQI and the development of a new classification method that depends on PCA and agglomerative hierarchical clustering (AHC) technique methods). Additionally, the study aimed to link the changes in the NDVI, LCLU, water use, and climate conditions with the fluctuations in water quality classifications in each month and site.

2. Materials and Methods

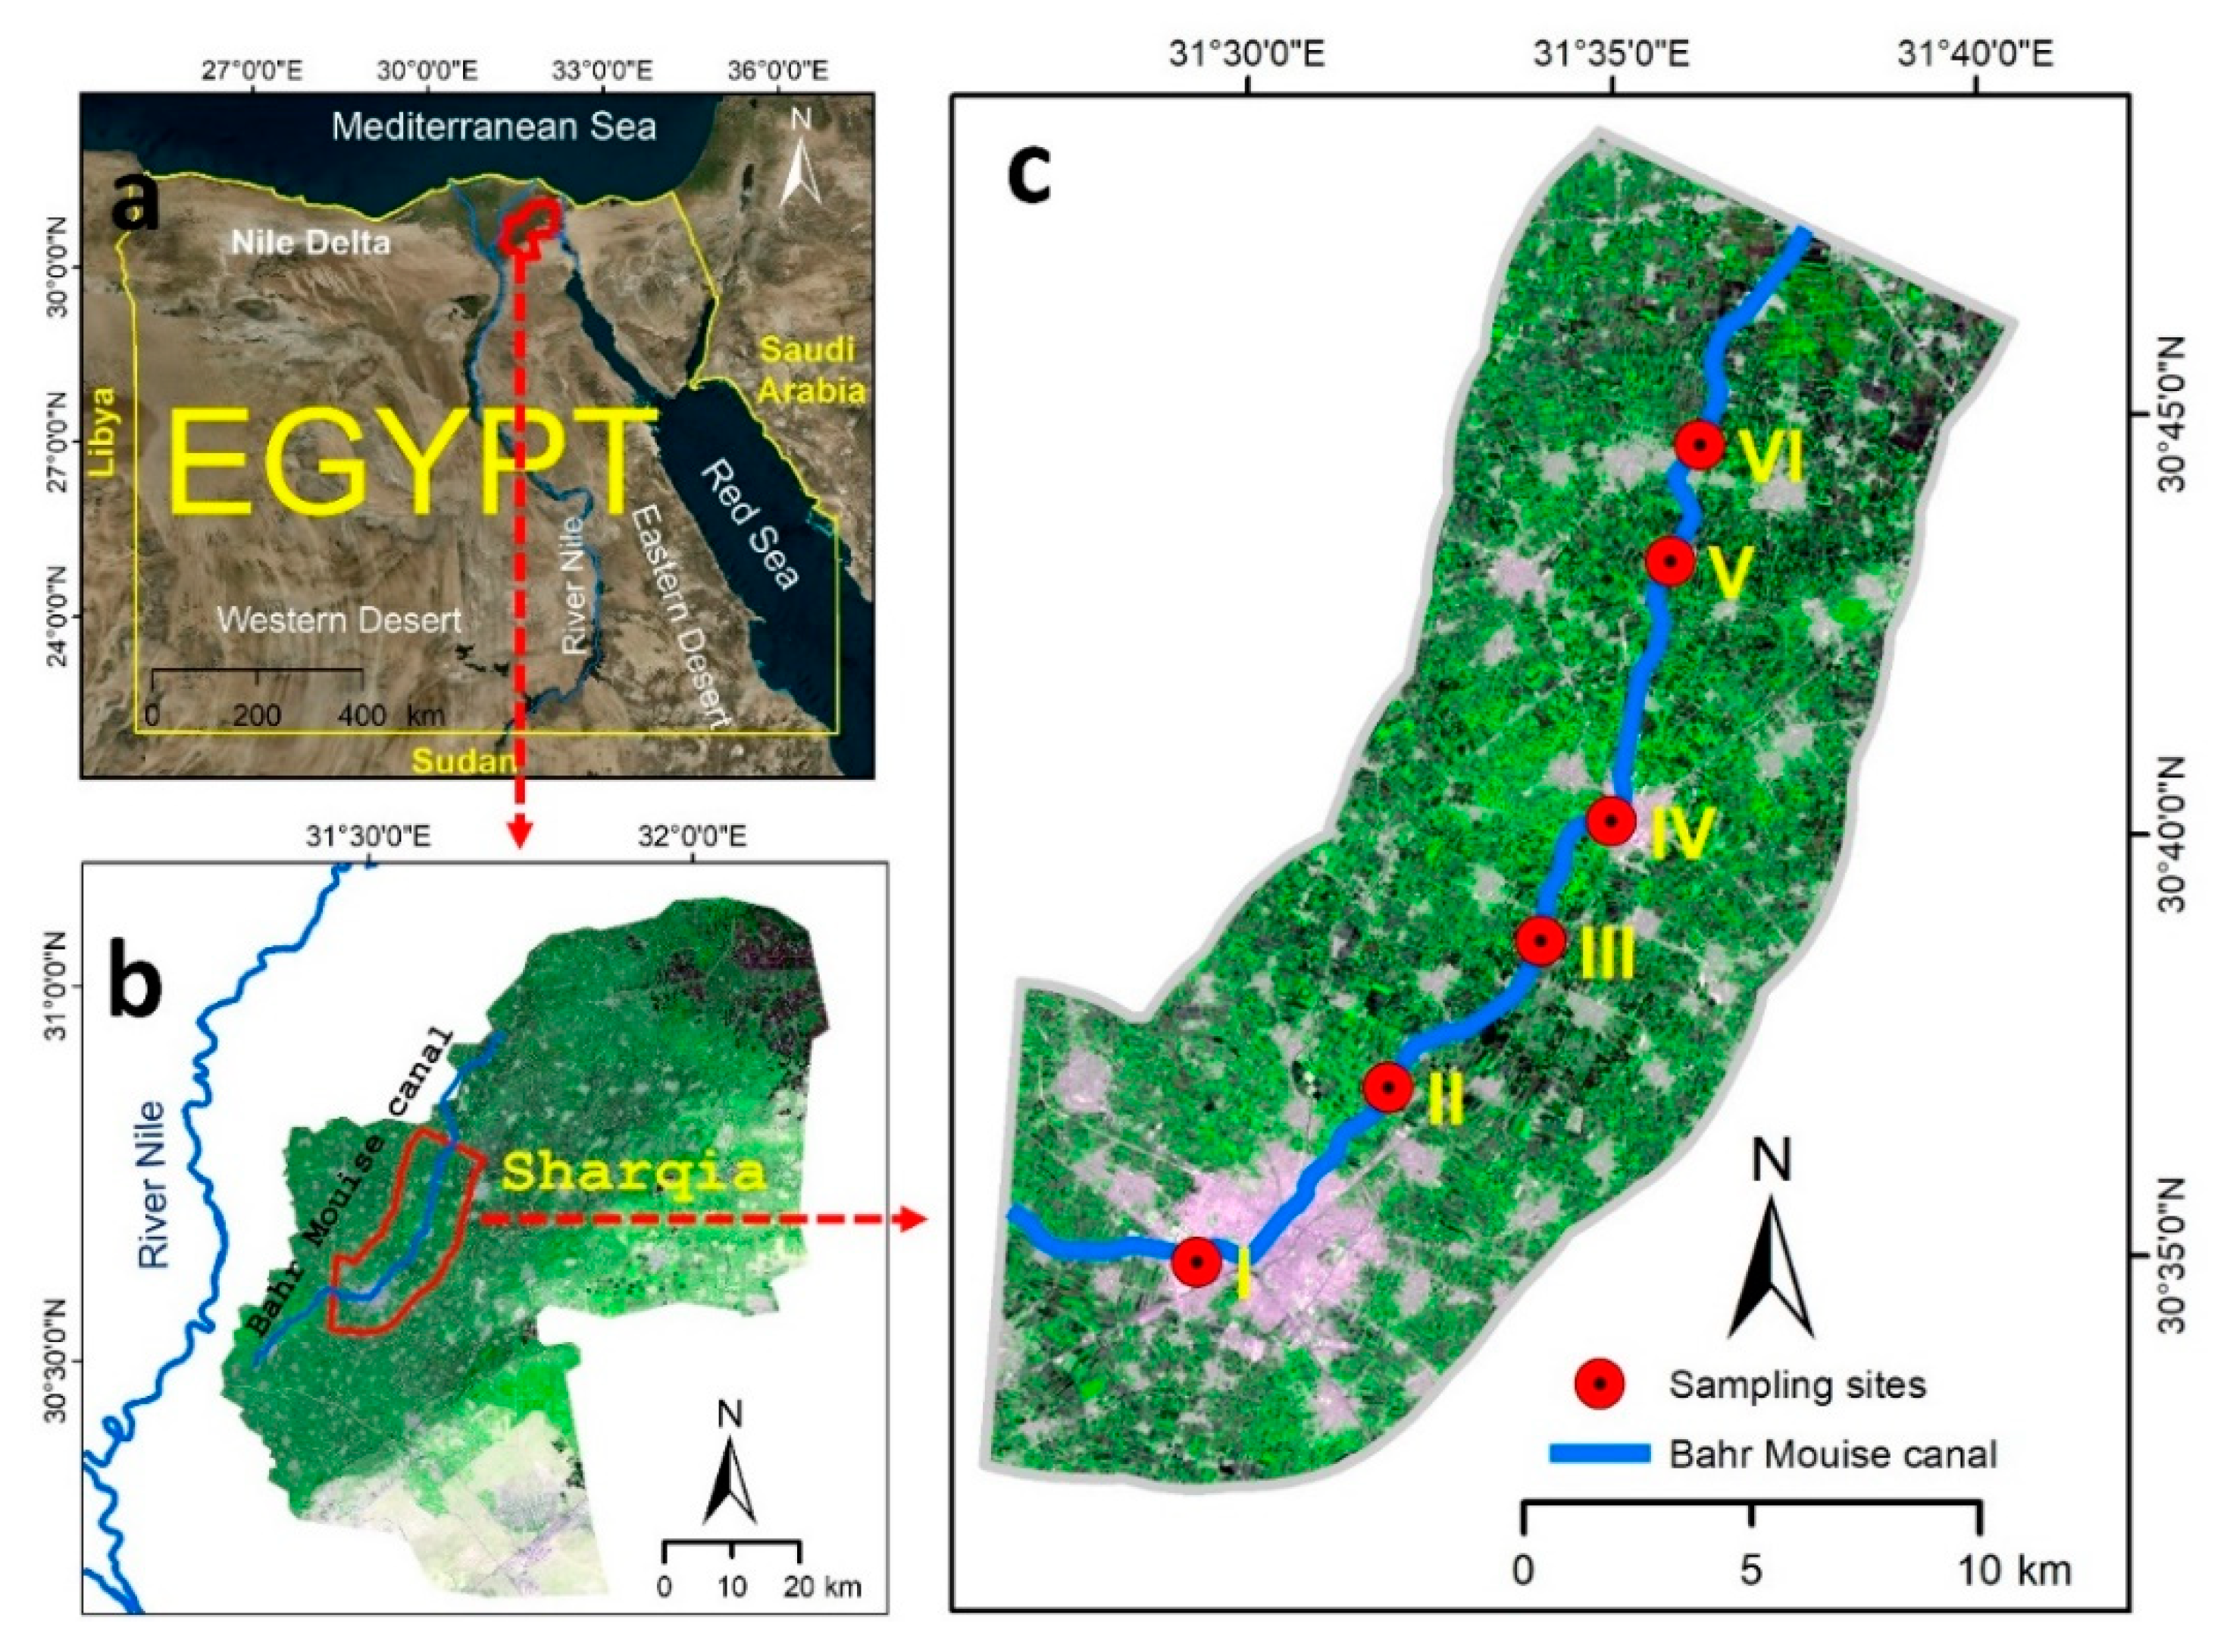
2.1. Study Area and Sampling

Bahr Mouise is the main irrigation canal located in the El-Sharkia Governorate (Egypt) between a latitude of 30°28′–30°50′ N and a longitude of 31°12′–31° 40′ E (Figure 1). The canal length is about 83 km, and it passes through several villages, towns, and cities (Menia El-Kamh, El-Zagazig, Hehia, and AwladSakr). The average daily discharge of the Bahr Mouise canal ranges between 5.0 and 12.5 million m3, and it provides the irrigation water requirements of 340,000 hectares [27]. To assess the water quality of Bahr Mouise, monthly samples (from January to December, 2019) were collected from six random sampling sites with irregular distances between one point and another along the central part of the canal. At each sampling site, four samples were collected using a portable water sampler, and all water measurements were carried out within 24 h after sampling. Samples were prepared to analyze salinity (measured as electrical conductivity), pH, and major ions (i.e., Ca2+, Mg2+, Na+, K+, HCO3, Cl, and SO42−) following the standard methods [55].

2.2. Remote Sensing Data and Analysis

The supervised imaging classification of the Bahr Mouise canal basin was carried out using the satellite image of the Operational Land Imager (OLI), which acquired data on 20 January 2019 with a spatial resolution of 30 m. The image preprocessing was done based on the radiometric and atmospheric calibrations using the ENVI software 5.3 (Exelis Visual Information Solutions, Boulder, CO, USA). The satellite image was classified using the supervised maximum likelihood classification to obtain an LCLU map [62]. The classification determined the different and the dominant LCLUs on the adjacent areas to the Bahr Mouise canal. Urban land use might have negative impacts on water quality [63]. The NDVI is a remote sensing measure that is used to identify crop growth status and earth surface vegetation [47]. Vegetation indices also help to distinguish the distribution of vegetation and soil based on the distinctive reflectance patterns of vegetation and other land surfaces [64,65]. The NDVI can be calculated by Equation (1) [66]:
NDVI = ( NIR RED ) ( NIR + RED )
where NIR is the near-infrared band and RED represents the red band. NDVI values range from −1 to 1.

2.3. Traditional Irrigation Water Quality Criteria

Various traditional equations have been used to judge the suitability of water for irrigation based on chemical parameters, such as the soluble sodium percentage (SSP) (Equation (2) [67]), the sodium absorption ratio (SAR) (Equation (3) [67]), the magnesium adsorption ratio (MAR) (Equation (4) [68]), the sodium-to-calcium activity ratio (SCAR) (Equation (5) [69], residual sodium carbonate (RSC) (Equation (6) [67]), residual sodium bicarbonate (RSBC) (Equation (7) [29]), the permeability index (PI) (Equation (8) [67,70]), and the Kelly ratio (KR) (Equation (9) [71]). Additionally, ion contents (i.e., Na+, Cl, HCO3, SO42−, and NO3), water electrical conductivity (ECiw), and pH were used in assessing irrigation water quality. The equations used to evaluate the irrigation water quality are explained below, and all ion concentrations are expressed in mmol L−1.
SSP = Na + Na + + K + + Ca 2 + + Mg 2 + × 100
SAR = Na + Ca 2 + + Mg 2 + 2
MAR = Mg 2 + Ca 2 + + Mg 2 + × 100
SCAR = Na + Ca 2 +
RSC = ( HCO 3 + CO 3 2 ) ( Ca 2 + + Mg 2 + )
RSBC = HCO 3 Ca 2 +
PI = Na + + HCO 3 Na + + Ca 2 + + Mg 2 + × 100
KR = Na + Ca 2 +

2.4. Irrigation Water Quality Index

The obtained water parameters of the Bahr Mouise canal, such as ECiw, Na+, SAR, HCO3, and Cl, were used in applying the IWQI that was developed by [72], as explained in Equation (10);
IWQI = i = 1 n q i w i
where qi and wi refer to quality measurement values and aggregation weights, respectively. The qi value was calculated based on Equation (11):
q i = q imax ( ( x ji x inf ) × q imap x imap )
where qmax is the maximum value of qi for each class, xij is the observed value for parameter, xinf is the lower limit of the class in which the parameter belongs, qiamp is class amplitude, and xamp is class amplitude to which the parameter belongs. Regarding the wi (aggregation weights), each parameter weight used in the IWQI was obtained via the methods of Meireles et al. [72]. The parameter weights were 0.211, 0.204, 0.202, 0.194, and 0.189 for ECiw, Na+, HCO3, Cl, and the SAR, respectively. The IWQI is a dimensionless parameter ranging from 0 to 100. Following [72], irrigation water quality was classified into four classes based on IWQI value: null (85–100), low (70–85), moderate (55–70), high (40–55), and severe restriction (0–40).

2.5. Principal Component Analysis

PCA was used to assess the irrigation water quality. Before applying the PCA analysis, the variable normality was checked using the Shapiro–Wilk test, and the correlation between different variables was measured by the Pearson correlation. Bartlett’s sphericity and Kaiser–Meyer–Olkin (KMO) tests were done to verify the data independency [73] before the PCA if the value of the KOM test was greater than 0.5, indicating the adequacy of performing the PCA analysis [74,75] (Table S1). Then, the PCA was performed using SPSS Software version 25 (SPSS Inc., Chicago, IL, USA) to obtain the principal components (PCs) that had high correlation with the studied variables. According to [76], a principal component can be explained using Equations (12) and (13):
Zk = ak1X1 + ak2X2 + ……. + aknXn
Z = (z1V1 + z2V2 + ……. + znVn)/(V1 + V2 + ……. + Vm)
where z is the component score, a is the component loading, X is the measured value of a parameter, k is the component number, n is the total number of parameters, Z is the comprehensive score, V is the total variance of each component, and m is the total number of components.
The number of PCs was selected depending on the eigenvalue. The PCs that had an eigenvalue greater than one were kept, and the rest were removed, and 70% or greater of the total variability had to be expressed by the selected PCs. Subsequently, the correlations between the selected PCs and the observed variables could be explained with factor loading. The factor loadings could be estimated based on Equation (14):
Factor   loadings = Eigenvectors × Eigenvalue
A factor loading of >0.3 is considered to be significant, >0.4 is more significant, and >0.50 is very significant [77]. The factor scores represent PC contributions to explain each variable’s variance. Each item’s contribution to the PC score depends on how strongly it relates to the PC.

Classification Method

Based on the principal component scores of each month, AHC, one of the most popular clustering methods, was done using Ward’s method in order to obtain the water quality classification. A small value of the sum of squared error (SSE) illustrates that all instances in the cluster are near to the cluster mean and thus have high degrees of similarity. The two clusters that minimally increase the value of the SSE were joined by Ward’s method. The SSE is a measure of the distance between a cluster’s instance attribute and mean attribute values, according to Equations (15) and (16):
SSE = i Sx j Sy | Xij Yi | 2
D ( x , y ) = SSE ( xy ) ( SSE ( X ) + SSE ( Y ) )
where Sx is the number of instances, Sy is the number of attributes, Xij is the value of attribute j in instance i, Yi is the mean value of attribute j, D (x,y) is the SSE change after joining clusters x and y, SSE(xy) is the SSE of joined clusters x and y, SSE(X) is the SSE of cluster x, and SSE(Y) is the SSE of cluster y.
Lastly, the dendrogram is a part of AHC outputs that shows the progressive data grouping; thus, it helps to group data in a suitable number of classes based on dissimilarity. The distances between the class centroids, as well as distances between the central objects, were produced using the Euclidean distance method. The Euclidean distance between two instances with k attributes is calculated using Equation (17):
d ( x , y ) = k = 1 n ( x k y k ) 2
where d(x,y) distance between the two instances, n is the number of dimensions (attributes), and xk and yk are, respectively the k attributes (components) or data objects x and y.

3. Results

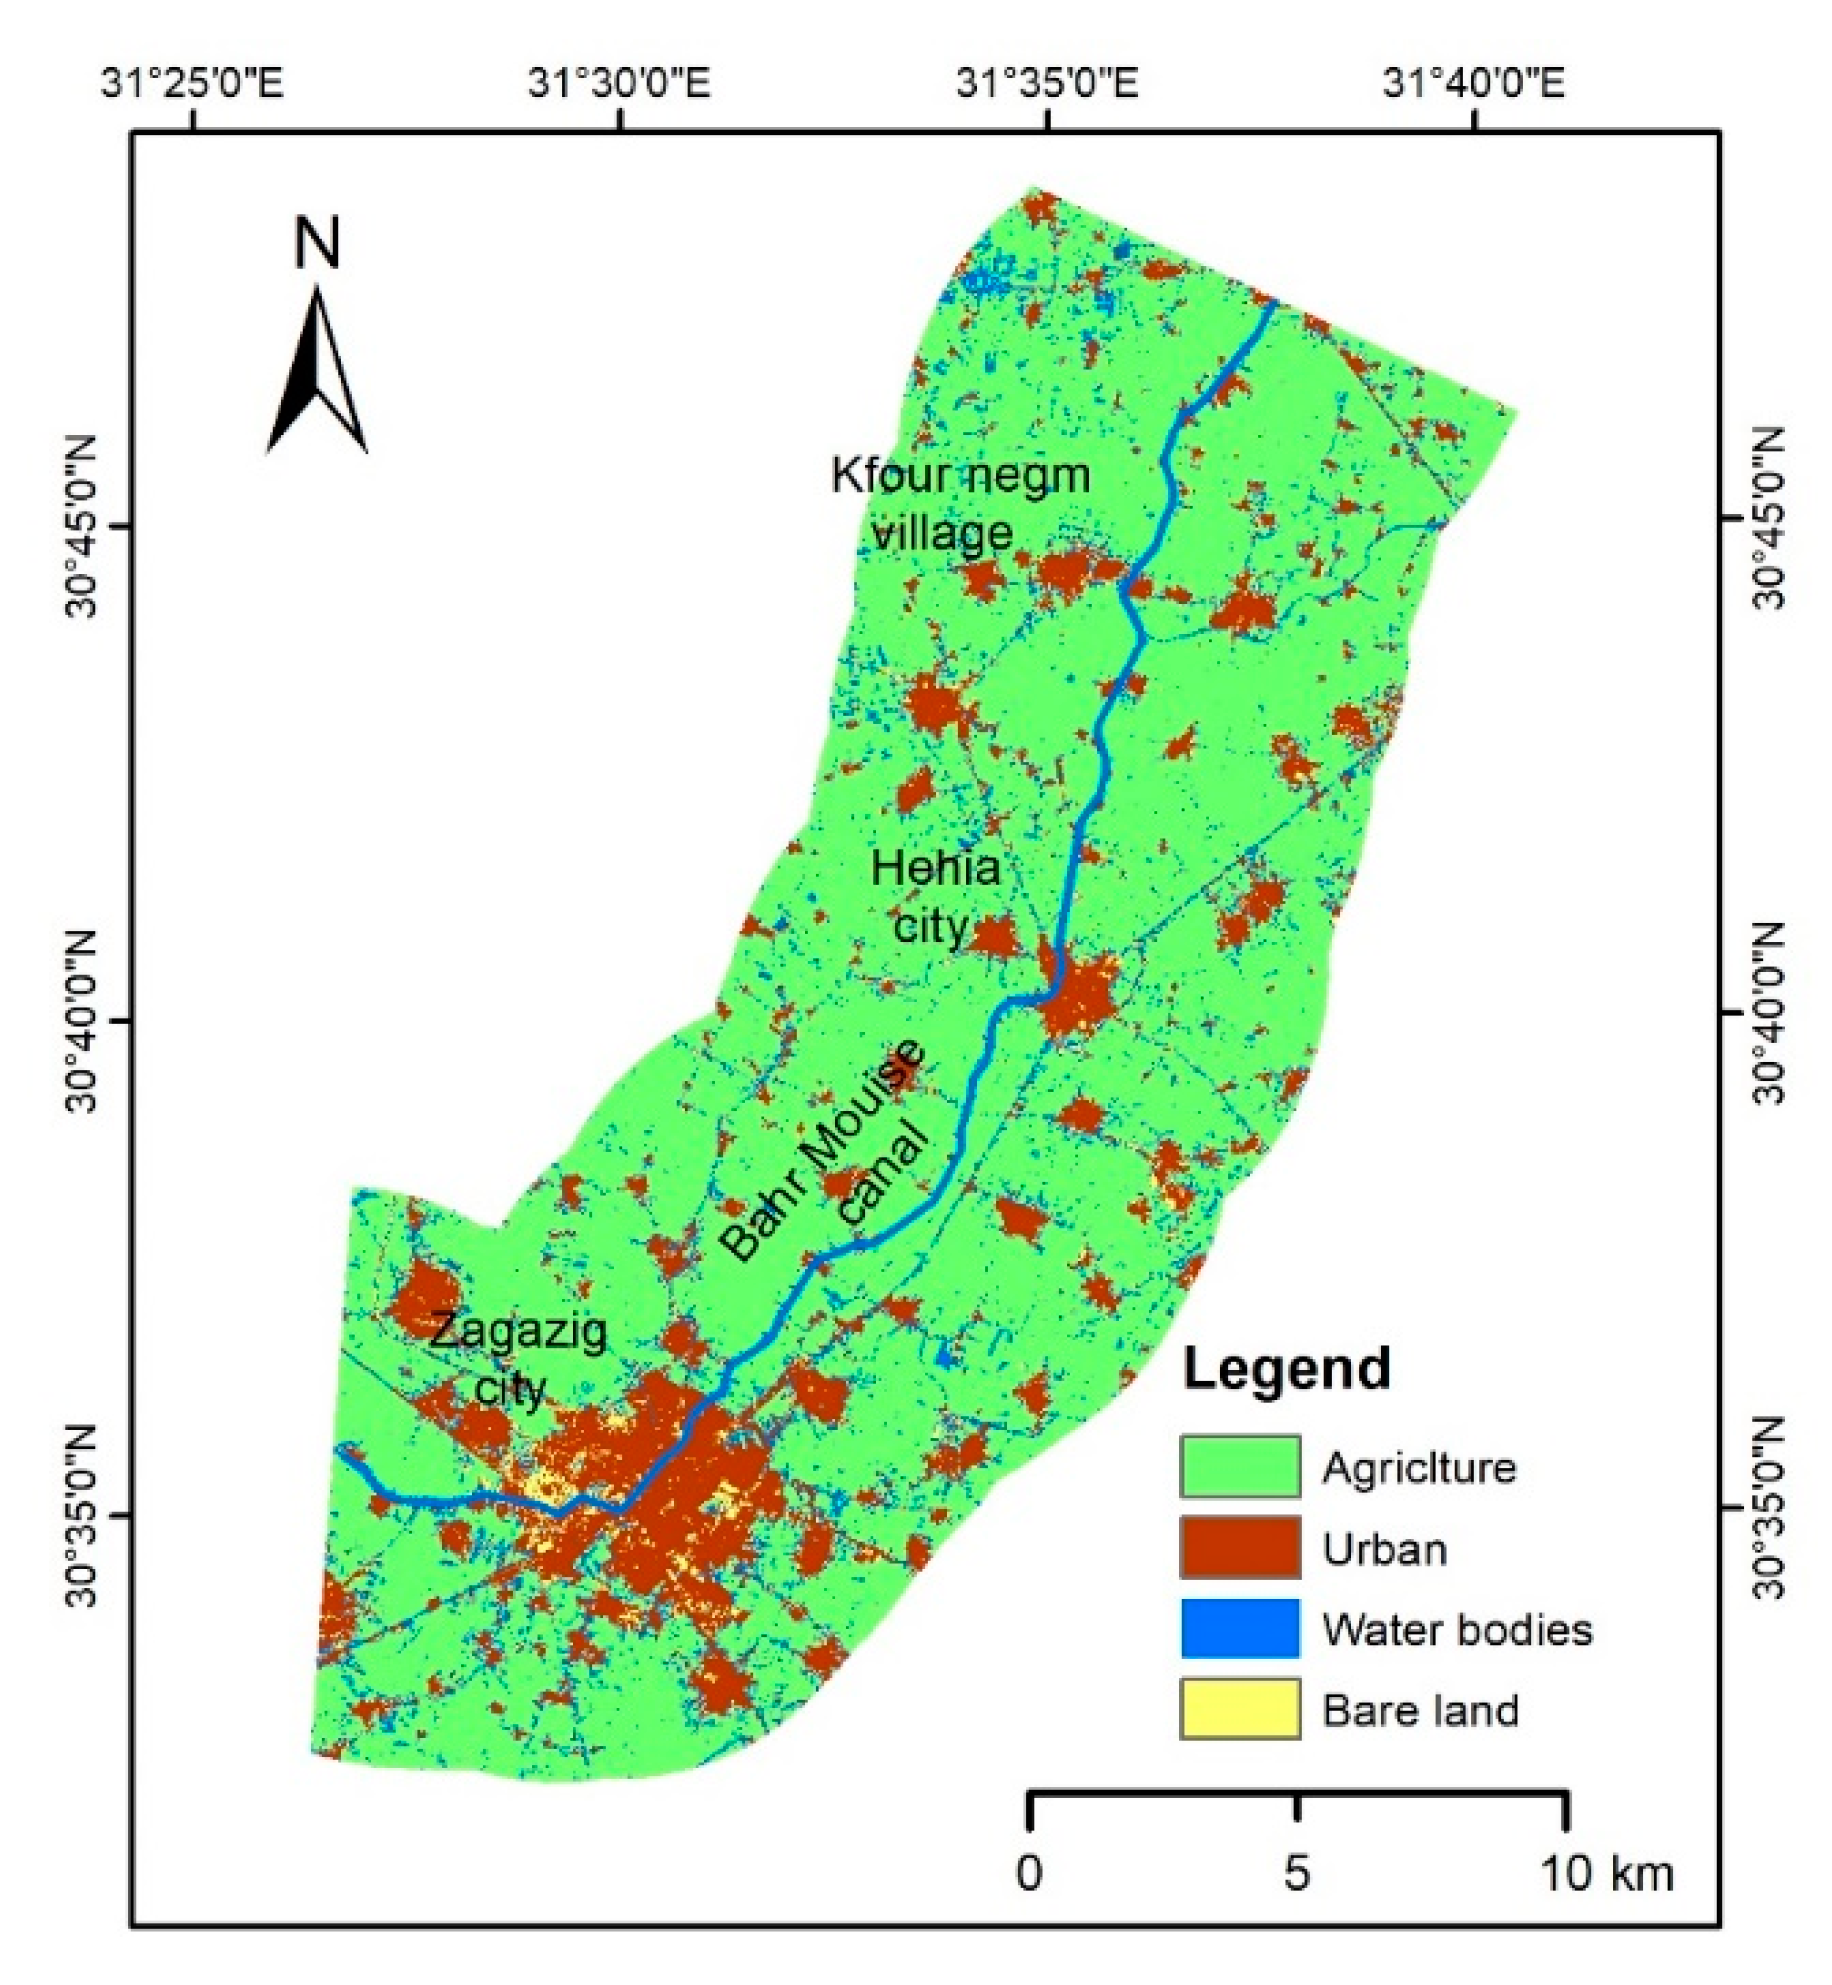
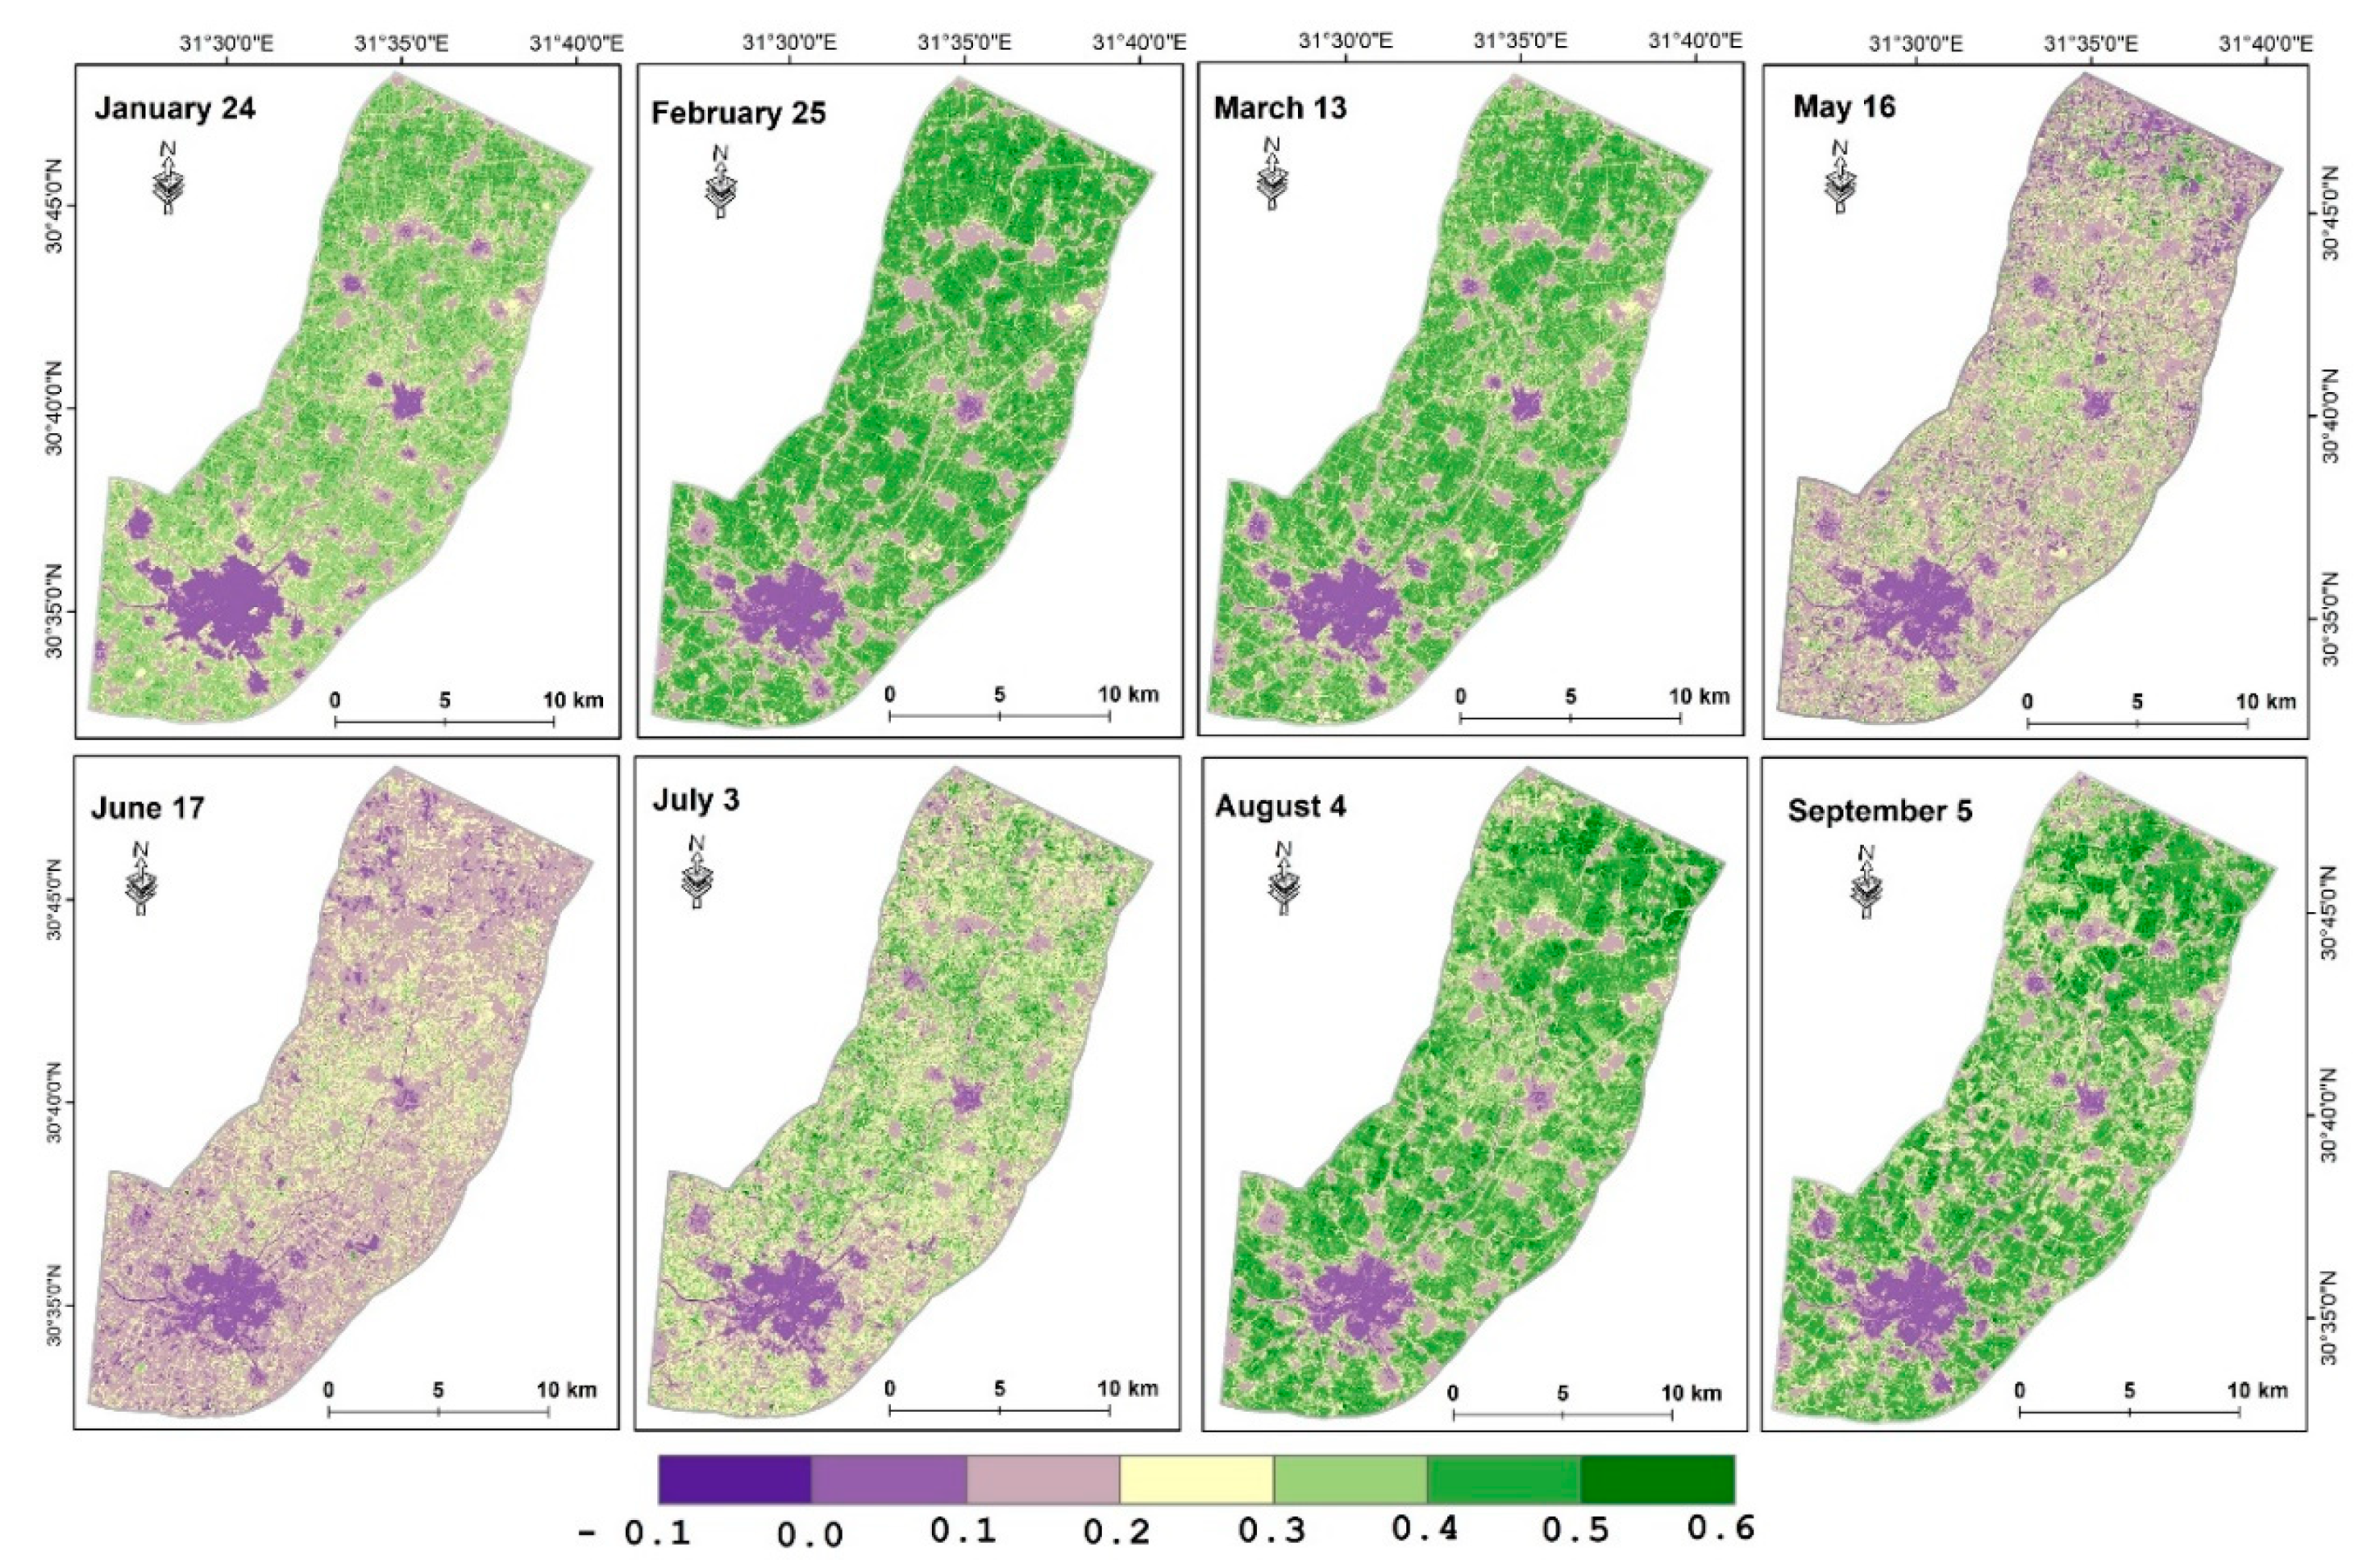
3.1. Land Use/Cover (LCLU)

Figure 2 shows the LCLU classes around the Bahr Mouise canal, where four classes were observed (agriculture, urban, water bodies, and bare land) that generally represent the main classes in the Nile Delta [78,79]. Agriculture (vegetation) land use is the dominant class, and urban (residential buildings and industrial areas) is the second dominant class, as it represents about 25% of the total studied area. Figure 2 shows that the Bahr Mouise canal is directed from the south towards the north. The water of the canal is affected by contamination sources from agriculture drainage and human effluent from urban areas. Figure S1 illustrates the impact of different land uses on the irrigation water quality of the Bahr Mouise canal, and the variations in variable concentrations (i.e., pH, ECiw, Ca2+, Mg2+, Na+, K+, HCO3, Cl, and SO42−), while the high concentration values were observed in the areas that had mixed urban and agricultural LCLU, which may negatively impact the water quality of this site location.
Figure 3 illustrates the values of the NDVI for water bodies that had the lowest values (from −0.1 to 0.0), bare land, and urban-occupied low values (0.0–0.1), while the higher NDVI values were assigned to the cropland where the values ranges from 0.1 to 0.6.
Figure 3 demonstrates the changes in the NDVI values over time (eight months during 2019). In May, farmers were preparing farmland (sowing and planting the summer crops); thus, the majority of the agricultural land had low NDVI values compared with the NDVI values in August and September where the summer crops were fully grown. Following the same trend, the winter crops were cultivated from October and November, and till January, the crops were still in the primary growth stage. As such, the NDVI values were low in January. On the contrary, the values were increased in February and March as a result of the growth stage development of the winter crops.

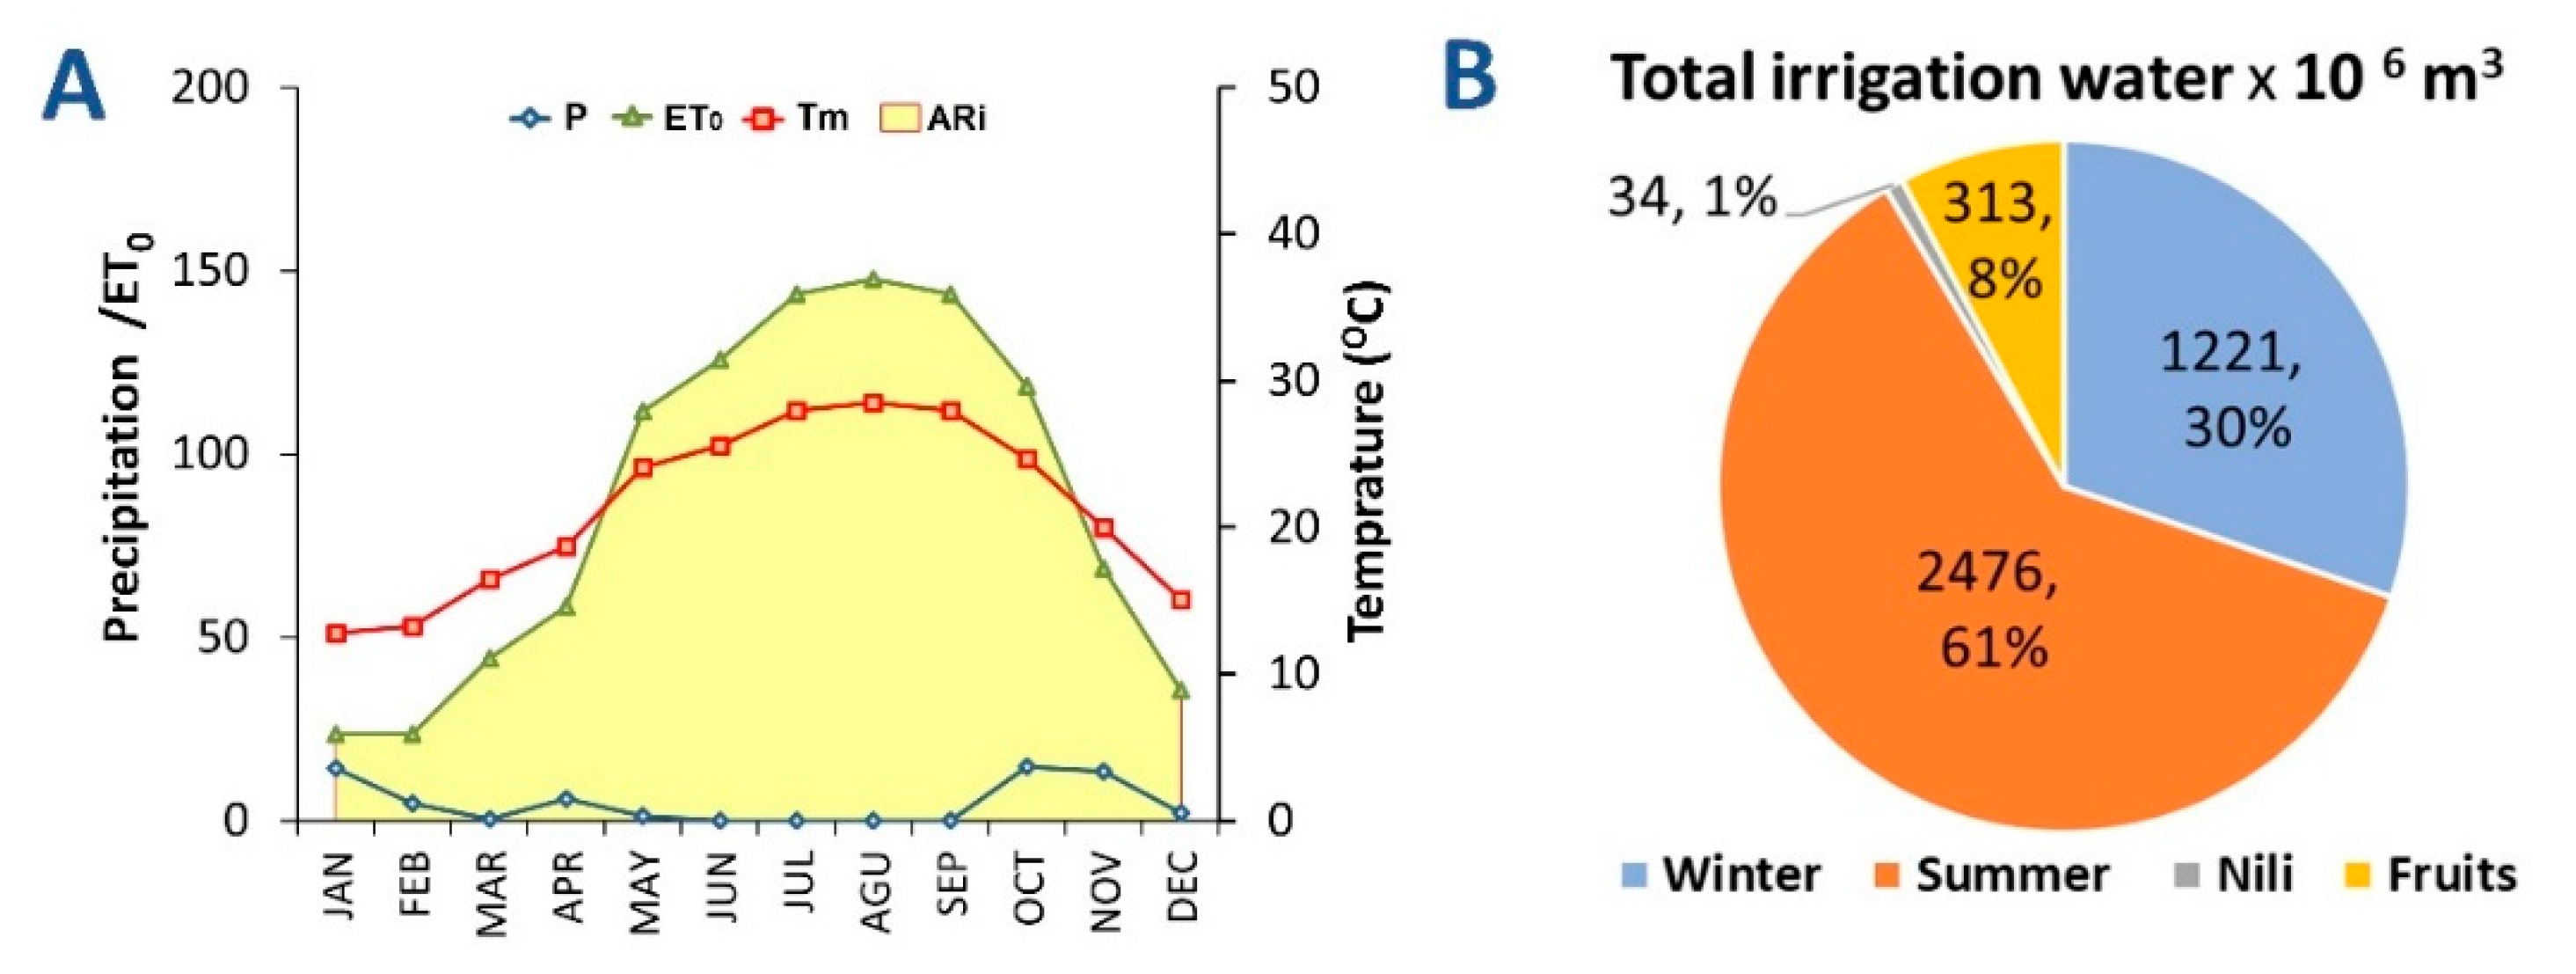
3.2. Climate and Water Use

The monthly climate parameters (i.e., mean temperature (Tmean), precipitation, and the annual potential evapotranspiration (ET0)) of the representative meteorological station of the El-Sharkia Governorate are presented graphically in Figure 4A. The mean annual temperature reached 21.3 °C, with an annual rainfall of 57 mm. In the same context, the ET0 had a value of 1045 mm, and according to the aridity index, the twelve months of the study period had arid climate conditions (in which the ET0 exceeded the actual precipitation) [11].
The agricultural water requirements in the El-Sharkia Governorate for summer crops (cultivated from February to May), winter crops (cultivated from September to November), Nili crops (cultivated from July to August), and fruits were 2.47, 1.22, 0.31, and 0.03 billion m3, respectively [11]. The major summer crops are maize, rice, sorghum, cotton, sunflower, sesame, sugarcane, soybean, and onions. The major winter crops are beans, wheat, sugar beet, barley, onion, alfalfa, garlic, and lupine. The Nili crops are sunflower, maize, rice, sorghum, and onions. Consequently, the summer crops had the greatest water irrigation requirements (Figure 5B).

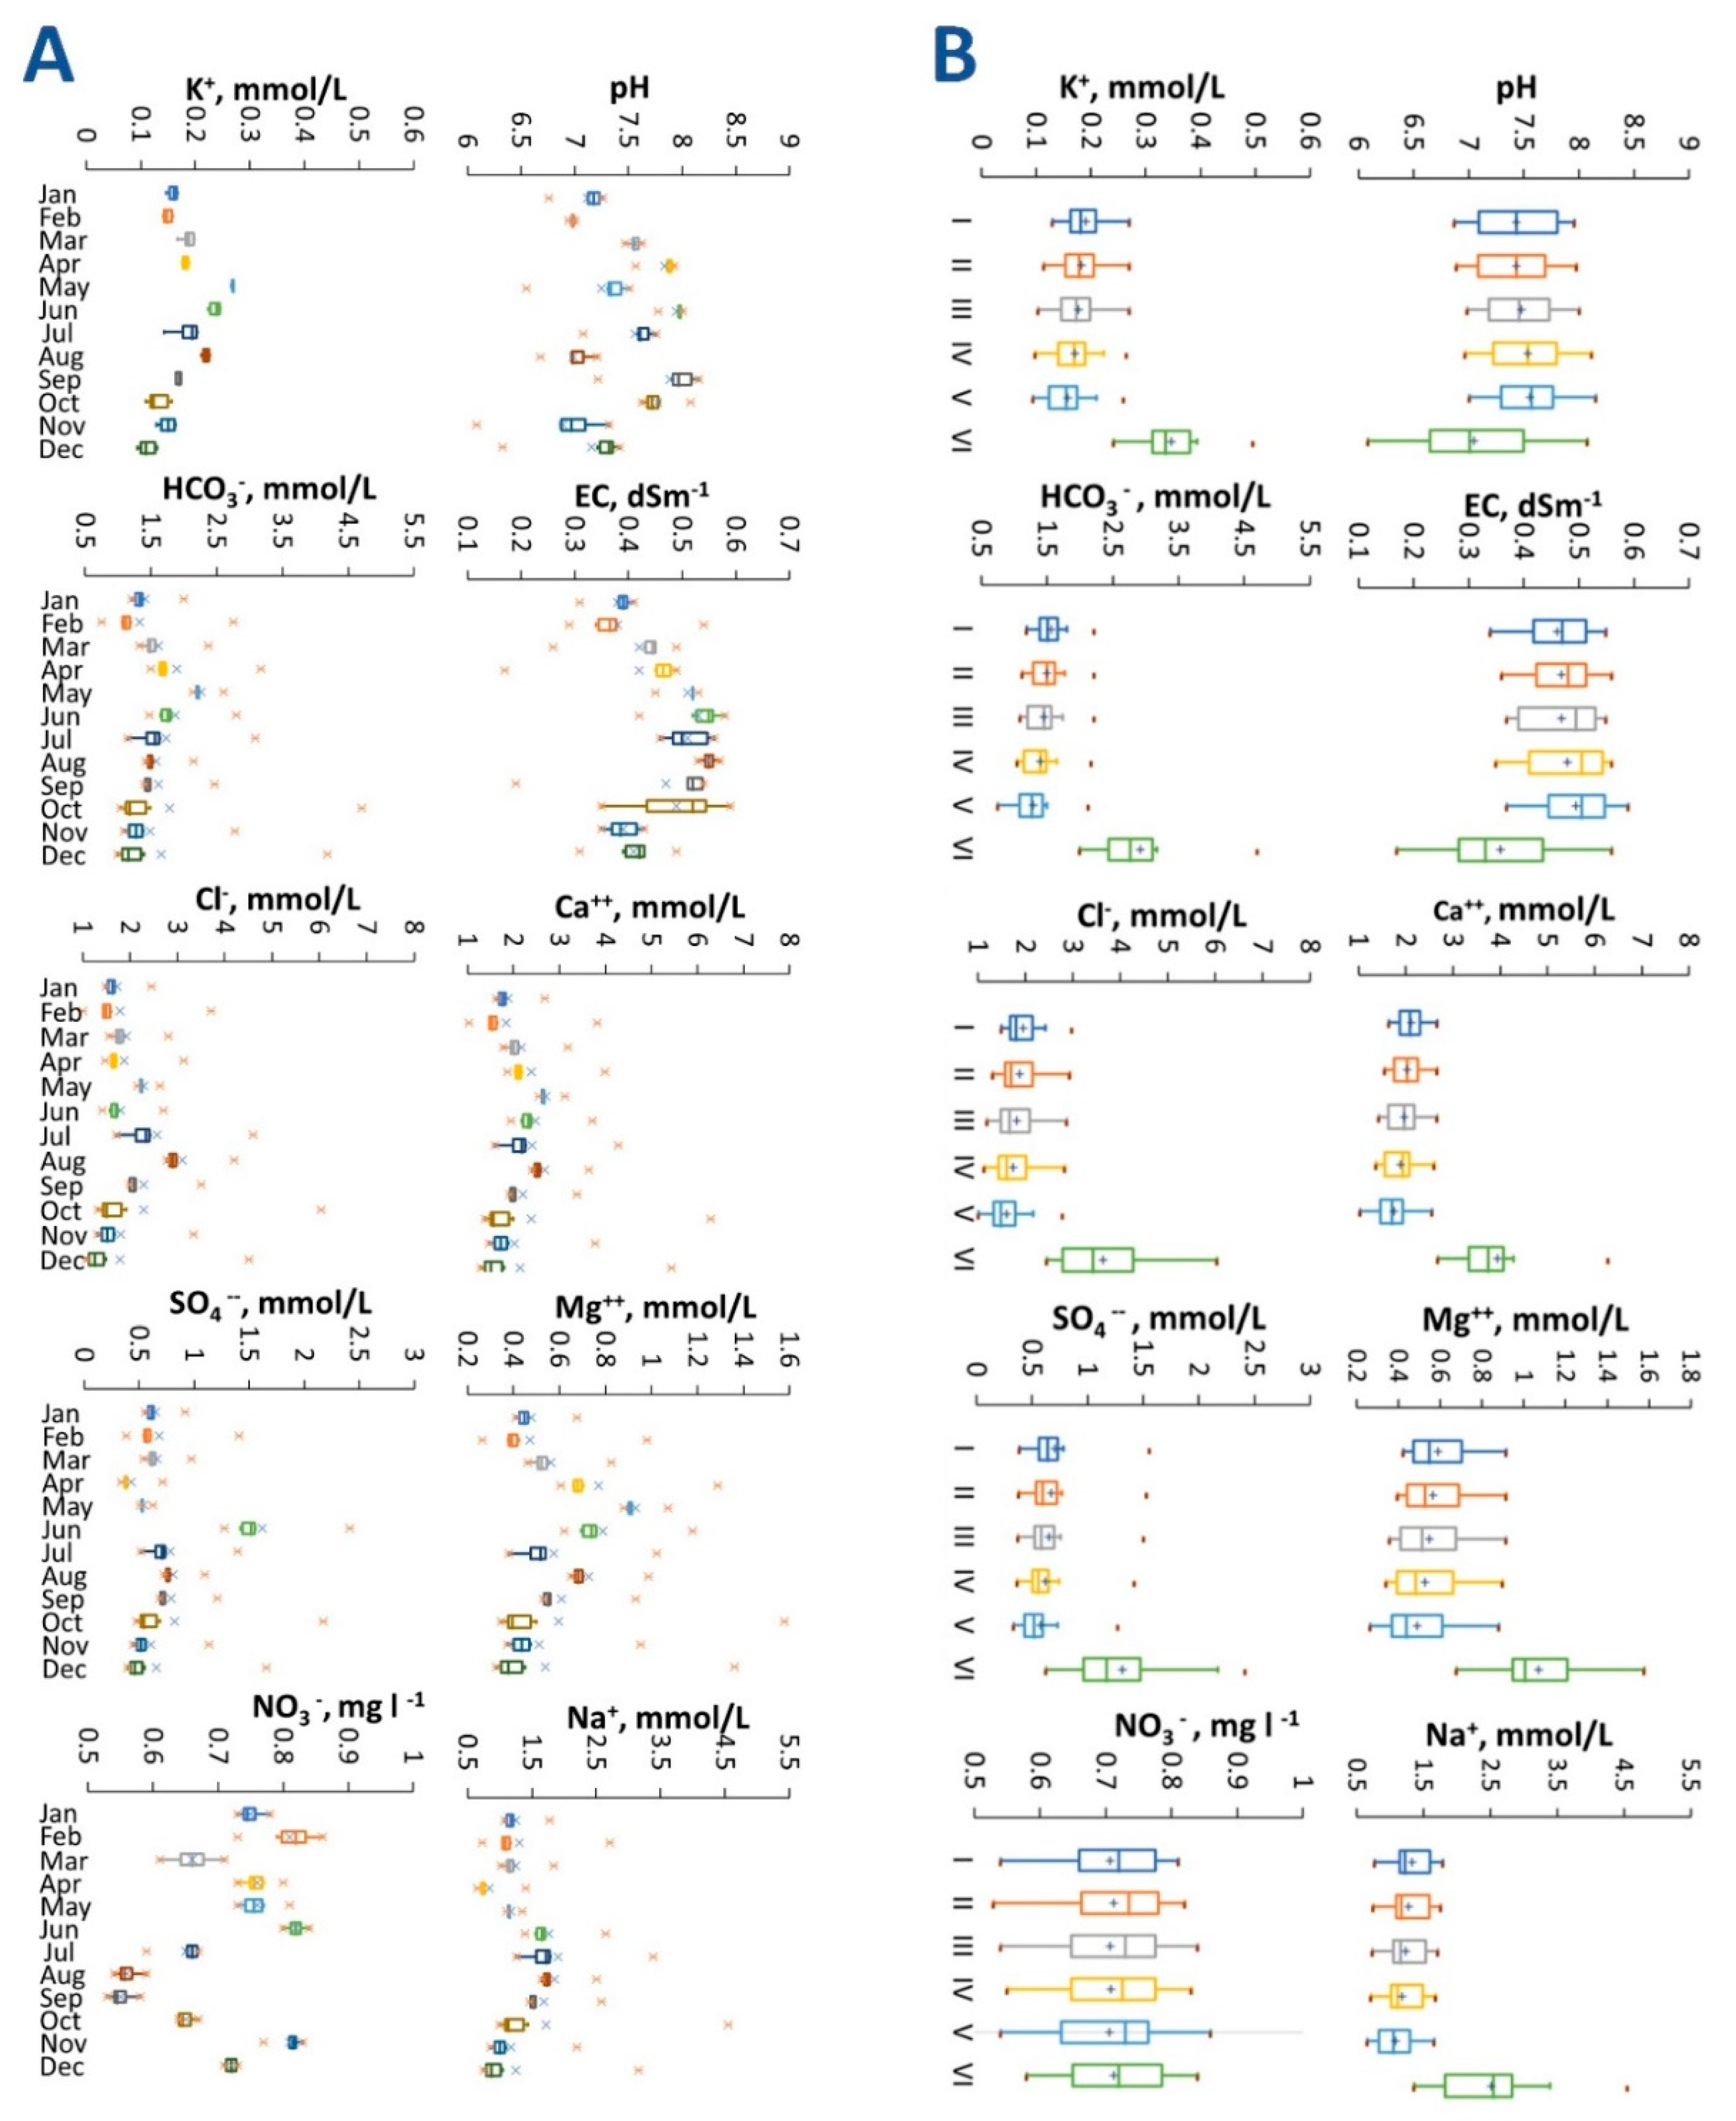
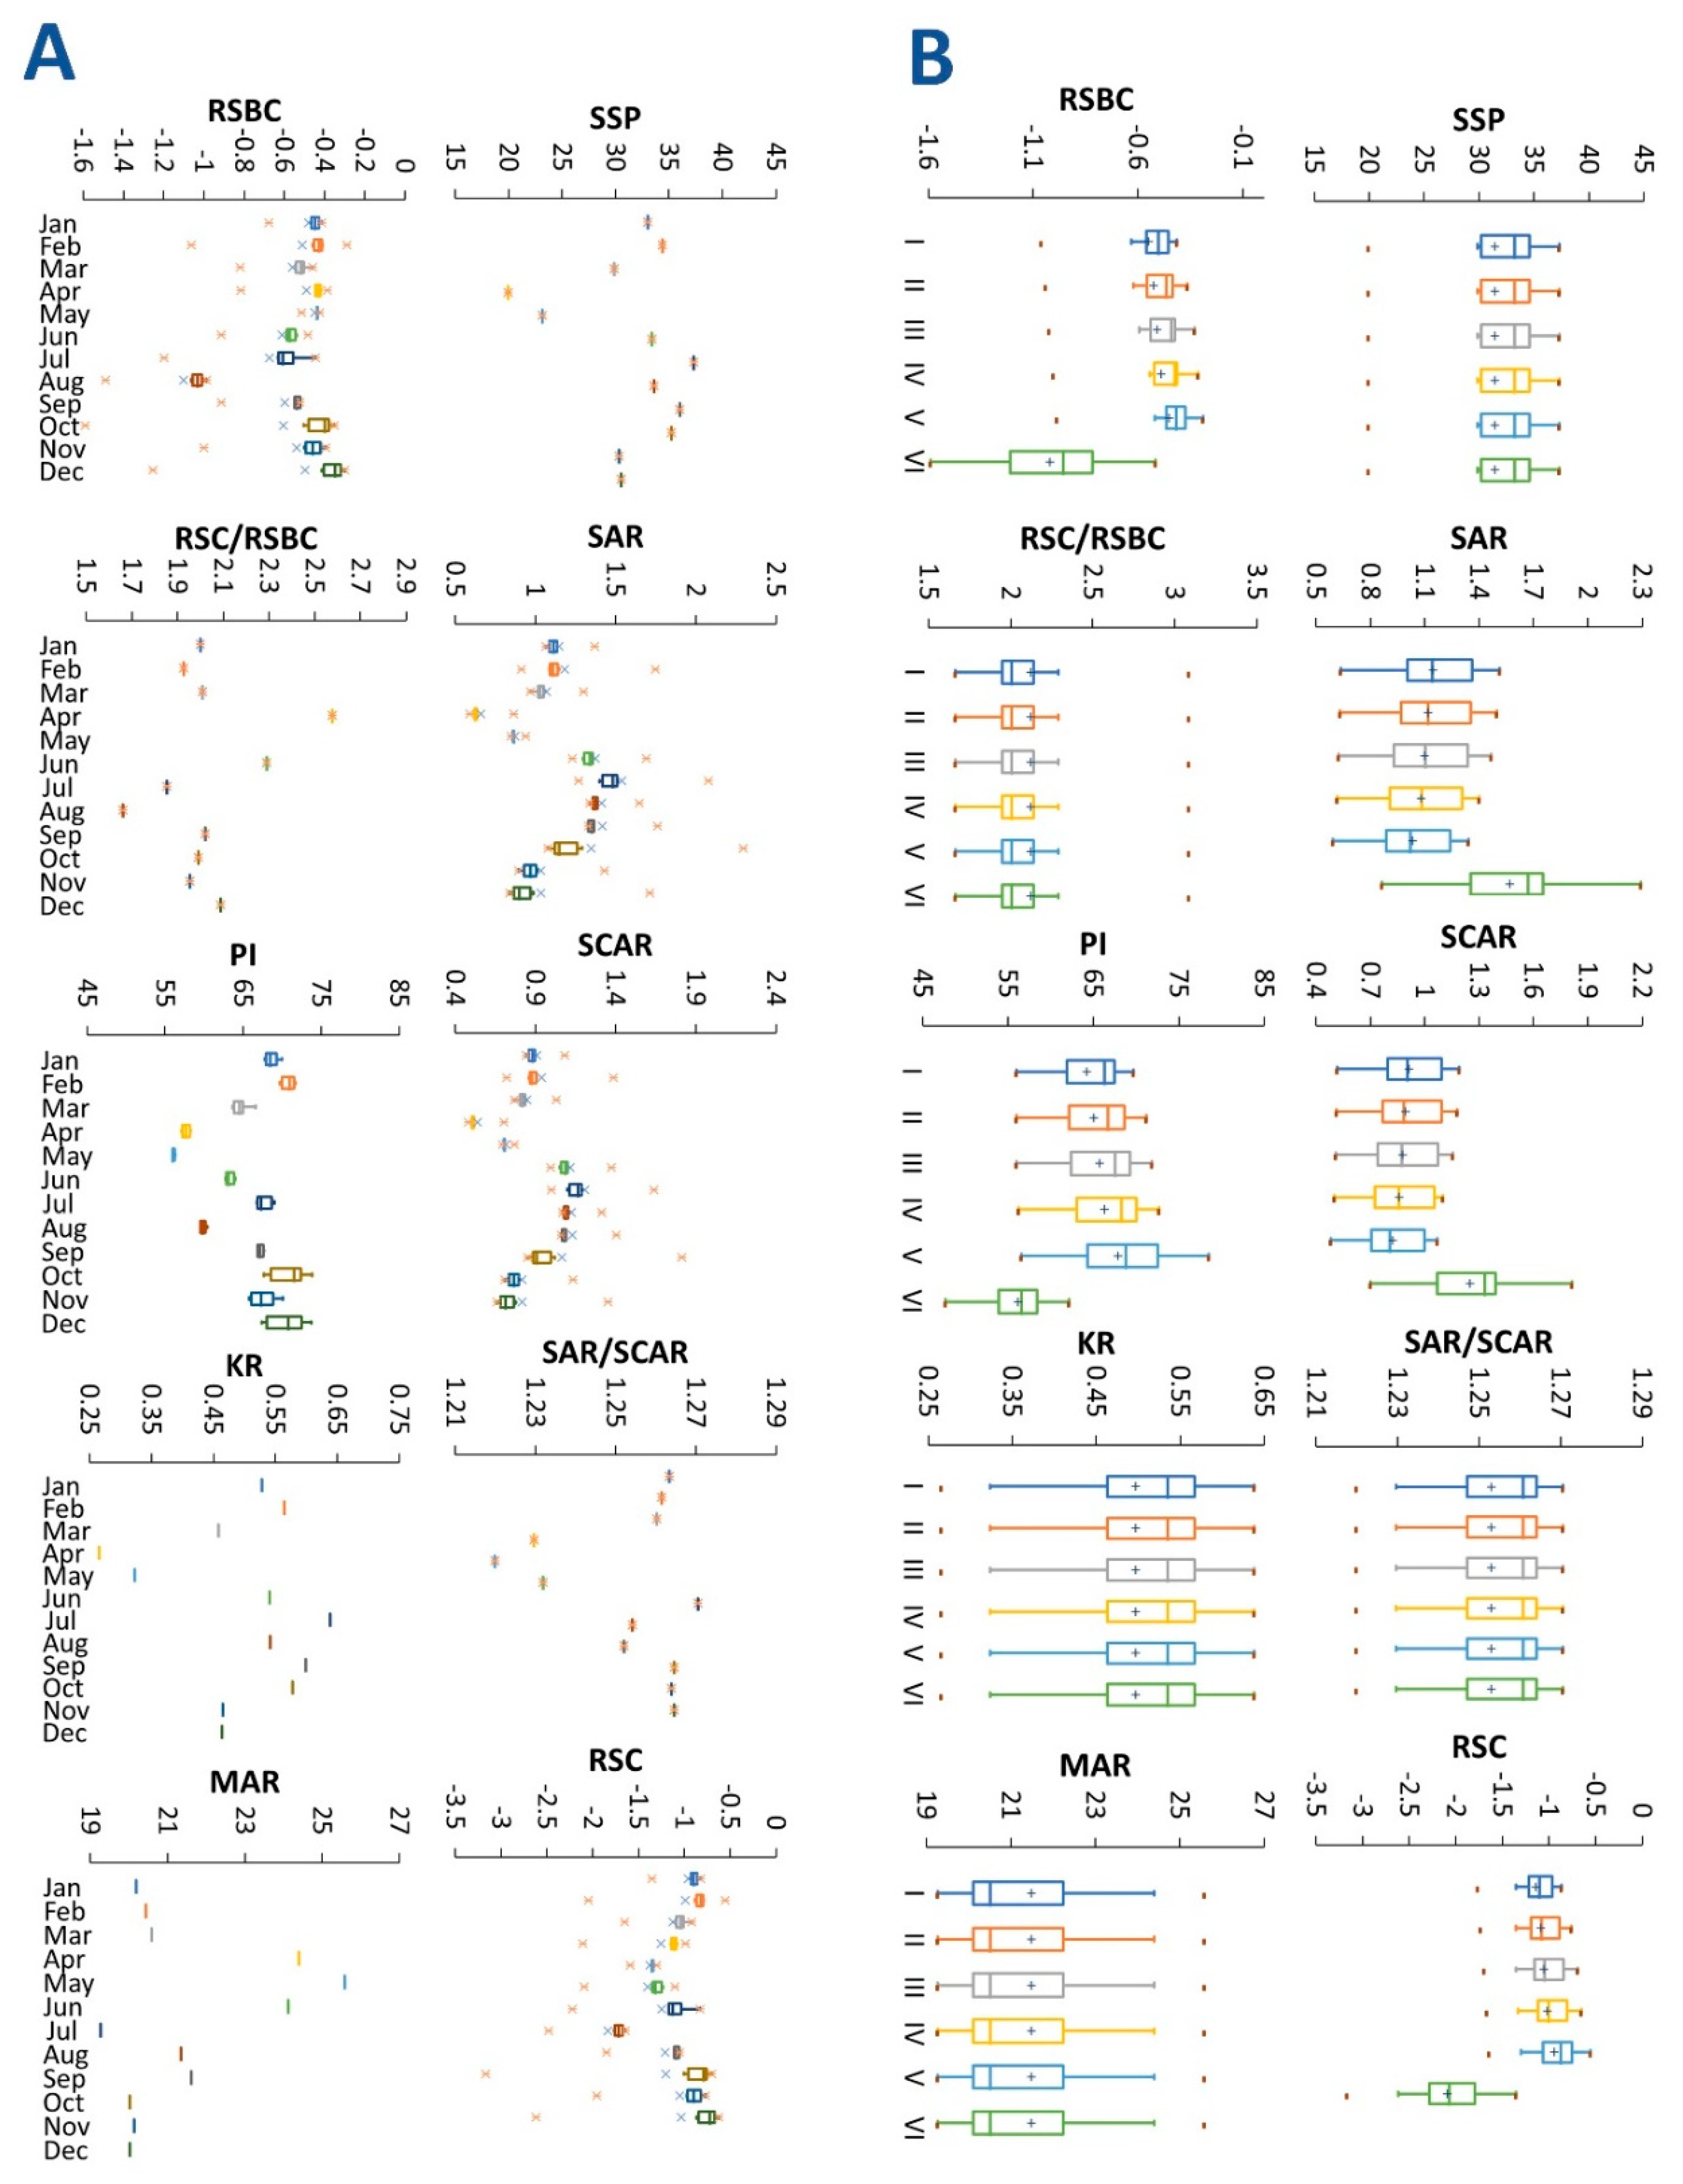
3.3. Validity of Bahr Mouise Water based on Traditional Criteria Analysis

Water pH: According to the Food and Agriculture Organization (FAO) [80], the acceptable level of pH for irrigation water is 6.0–8.5. The pH of the Bahr Mouise canal water was within the recommended ranges, varying from 6.89 to 7.95 over the twelve months with an average of 7.41 ± 0.39 (Figure 5 and Table S2).
Salinity hazard: The United States Department of Agriculture (USDA) [67] classified the irrigation water based on ECiw into four classes: low salinity (C1: <0.25 dS m−1), medium salinity (C2 ranged from 0.25 to 0.75 dS m−1), high salinity (C3 ranged from 0.75 to 2.25 dS m−1), and very high salinity (C4: >2.25 dS m−1). Therefore, the EC of the Bahr Mouise canal water was assigned to the medium salinity class where the values of ECiw ranged from 0.38 to 0.55 dS m−1 with an average of 0.46 dS m−1 (Figure 5 and Table S2).
Another classification of irrigation water based on ECiw was provided by Gupta [69]: low salinity (C-1: ECiw 0.2–1.5 dS m−1), medium salinity (C-2: ECiw 1.5–3.0 dS m−1), high salinity (C-3: ECiw 3.0–5.0 dS m−1), and very high salinity (C-4: ECiw 5–10 dS m−1). Accordingly, the EC of the Bahr Mouise canal water was assigned to the low salinity class. Moreover, the ECiw values were converted to total dissolved solid (TDS) values based on the equation TSD, mg L−1 = EC, dS m−1 × 640 that was expressed by the authors of [69]; the TDS ranged between 243 and 352 mg L−1 with an average of 294 mg L−1
Sodicity hazard: The most important indicators of sodicity water irrigation hazard are the SSP (Equation (2)) and the SAR (Equation (3)). When there is a high concentration of sodium ions in irrigation water, Na+ ions tend to be absorbed by clay particles, displacing Mg++ and other cations. Water with an SSP greater than 60% breaks down the soil’s physical properties, which may occur due to sodium accumulation [81]. The calculated SSP values varied from 19.96% to 37.32% with a mean value of 31.40%, indicating a low restriction degree on using the water for irrigation. Kumar et al. [82] note that water with an SSP < 50% is good quality and suitable for irrigation purposes.
The USDA [67] classifies irrigation water based on the SAR into four classes: low (S1: SAR <10), medium (S2: SAR 10–18), high (S3: SAR 18–26), and very high (S4: SAR >26). Thus, the SAR values of the Bahr Mouise canal were in the low class and ranged from 0.67 to 1.56 mmol L−1 with an average of 1.19 mmol L−1 (Figure 6 and Table S3).
Another classification of irrigation water based on the combination of EC and the SAR is provided by the USDA [67]. The classes of this classification are: very good water (C1S1), good water (C1S2, C2S2, and C2S1), usable water (C1S3, C2S3, C3S3, C3S2, and C3S1), and usable water with caution (C1S4, C2S4, C3S4, C4S4, C4S3, C4S2, and C4S1). The water of the Bahr Mouise canal was assigned to the good water C2SI class (Figure 6 and Table S3).
Regarding the SAR/SCAR ratio (the SCAR was calculated as shown in Equation (5)), the irrigation water was classified into six classes of sodicity [83]: non-sodic water (S-0: SAR/SCAR < 5), normal water (S-1: SAR/SCAR 5–10), low sodicity water (S-2: SAR/SCAR 10–20), medium sodicity water (S-3: SAR/SCAR 20–30), high sodicity water (S-4: SAR/SCAR 30–40), and very high sodicity water (S-5: SAR/SCAR > 40). Accordingly, the water of the Bahr Mouise canal was found to fall in the non-sodic water (S-0) class, where the values of the SAR/SCAR ratio ranged from 1.22 to 1.27 with an average of 1.25 (Figure 6 and Table S3).
Alkalinity hazard: According to the USDA [67], irrigation water is classified based on RSC (Equation (6)) into three classes: 1—safe for irrigation (RSC < 1.25); 2—medium hazard (RSC ranged from 1.25 to 2.5); and 3—extreme hazard (RSC > 2.5). Thus, the water of the Bahr Mouise canal was found to be safe for irrigation, and the values of RSC ranged between −1.83 and −0.96 mmol L−1 with an average of −1.22 mmol L−1 (Figure 6 and Table S3).
Moreover, using the RSC/RSBC ratio (the RSBC was calculated as shown in Equation (7)), the irrigation waters could be classified into six classes of alkalinity [83]. The six classes of the RSC/RSBC ratio are non-alkaline water (A-0: RSC/RSBC equals a negative value), normal water (A-1: RSC/RSBC equals zero), low alkalinity water (A-2: RSC/RSBC equals 2.5), medium alkalinity water (A-3: RSC/RSBC ranges from 2.5 to 5), high alkalinity water (A-4: RSC/RSBC ranges from 5 to 10), and very high alkalinity water (A-5: RSC/RSBC > 10). Accordingly, 83.33% of the studied water samples were assigned to the A-2 class, 16.67% were allocated to the A-3 class, and the values of the RSC/RSBC ratio were ranged between 1.66 and 3.09 with an average of 2.12 (Figure 6 and Table S3).
Permeability index: The PI value is used as an indicator of irrigation water suitability (Equation (8)). The PI can be classified into three classes: excellent (class I: >75%), good (class II: 25–75%), and unsuitable (class III: <25%) [84]. The PI values of the Bahr Mouise canal ranged between 55.48 and 67.91, so the water of the Bahr Mouise canal was in the good water class for irrigation.
Magnesium ratio: The magnesium hazard of irrigation water is evaluated using the MAR [85]. The MAR can be classified into two classes: safe water (Class I: <50) and water with Mg2+ hazard (Class II: >50). The water of the Bahr Mouise canal is safe for irrigation as the values of MR ranged from 19.28% to 25.59% with an average value of 21.48% (Figure 6).
Kelly ratio: The KR is calculated based on the measurement of sodium against calcium and magnesium (Equation (9)). If the KR > 1, this indicates an excess of sodium in the water [71]. Therefore, water with a KR < 1 is suitable for irrigation, while a greater ratio (KR > 1) is unsuitable [86]. The KR values of the Bahr Mouise canal water ranged from 0.27 to 0.64 with an average value of 0.50; consequently, the water is suitable for irrigation (Figure 6).
Specific ion toxicity: Sodium (Na+), chloride (Cl), bicarbonate (HCO3), and nitrate (NO3) ions are considered to be the most common toxic ions in irrigation water. According to guidelines of water quality for irrigation presented by the FAO [80], the Na+, Cl, and NO3 ions of the Bahr Mouise canal were found to be at levels characterized as safe for irrigation purposes. The values were Na+ < 3 (expressed as the SAR), Cl < 3, and NO3 < 5 mg L−1. On the other hand, the HCO3 concentrations ranged between slight and moderate concentrations, from 1.33 to 2.26 mmol L−1 with an average of 1.69 mmol L−1 (Figure 6 and Table S3).

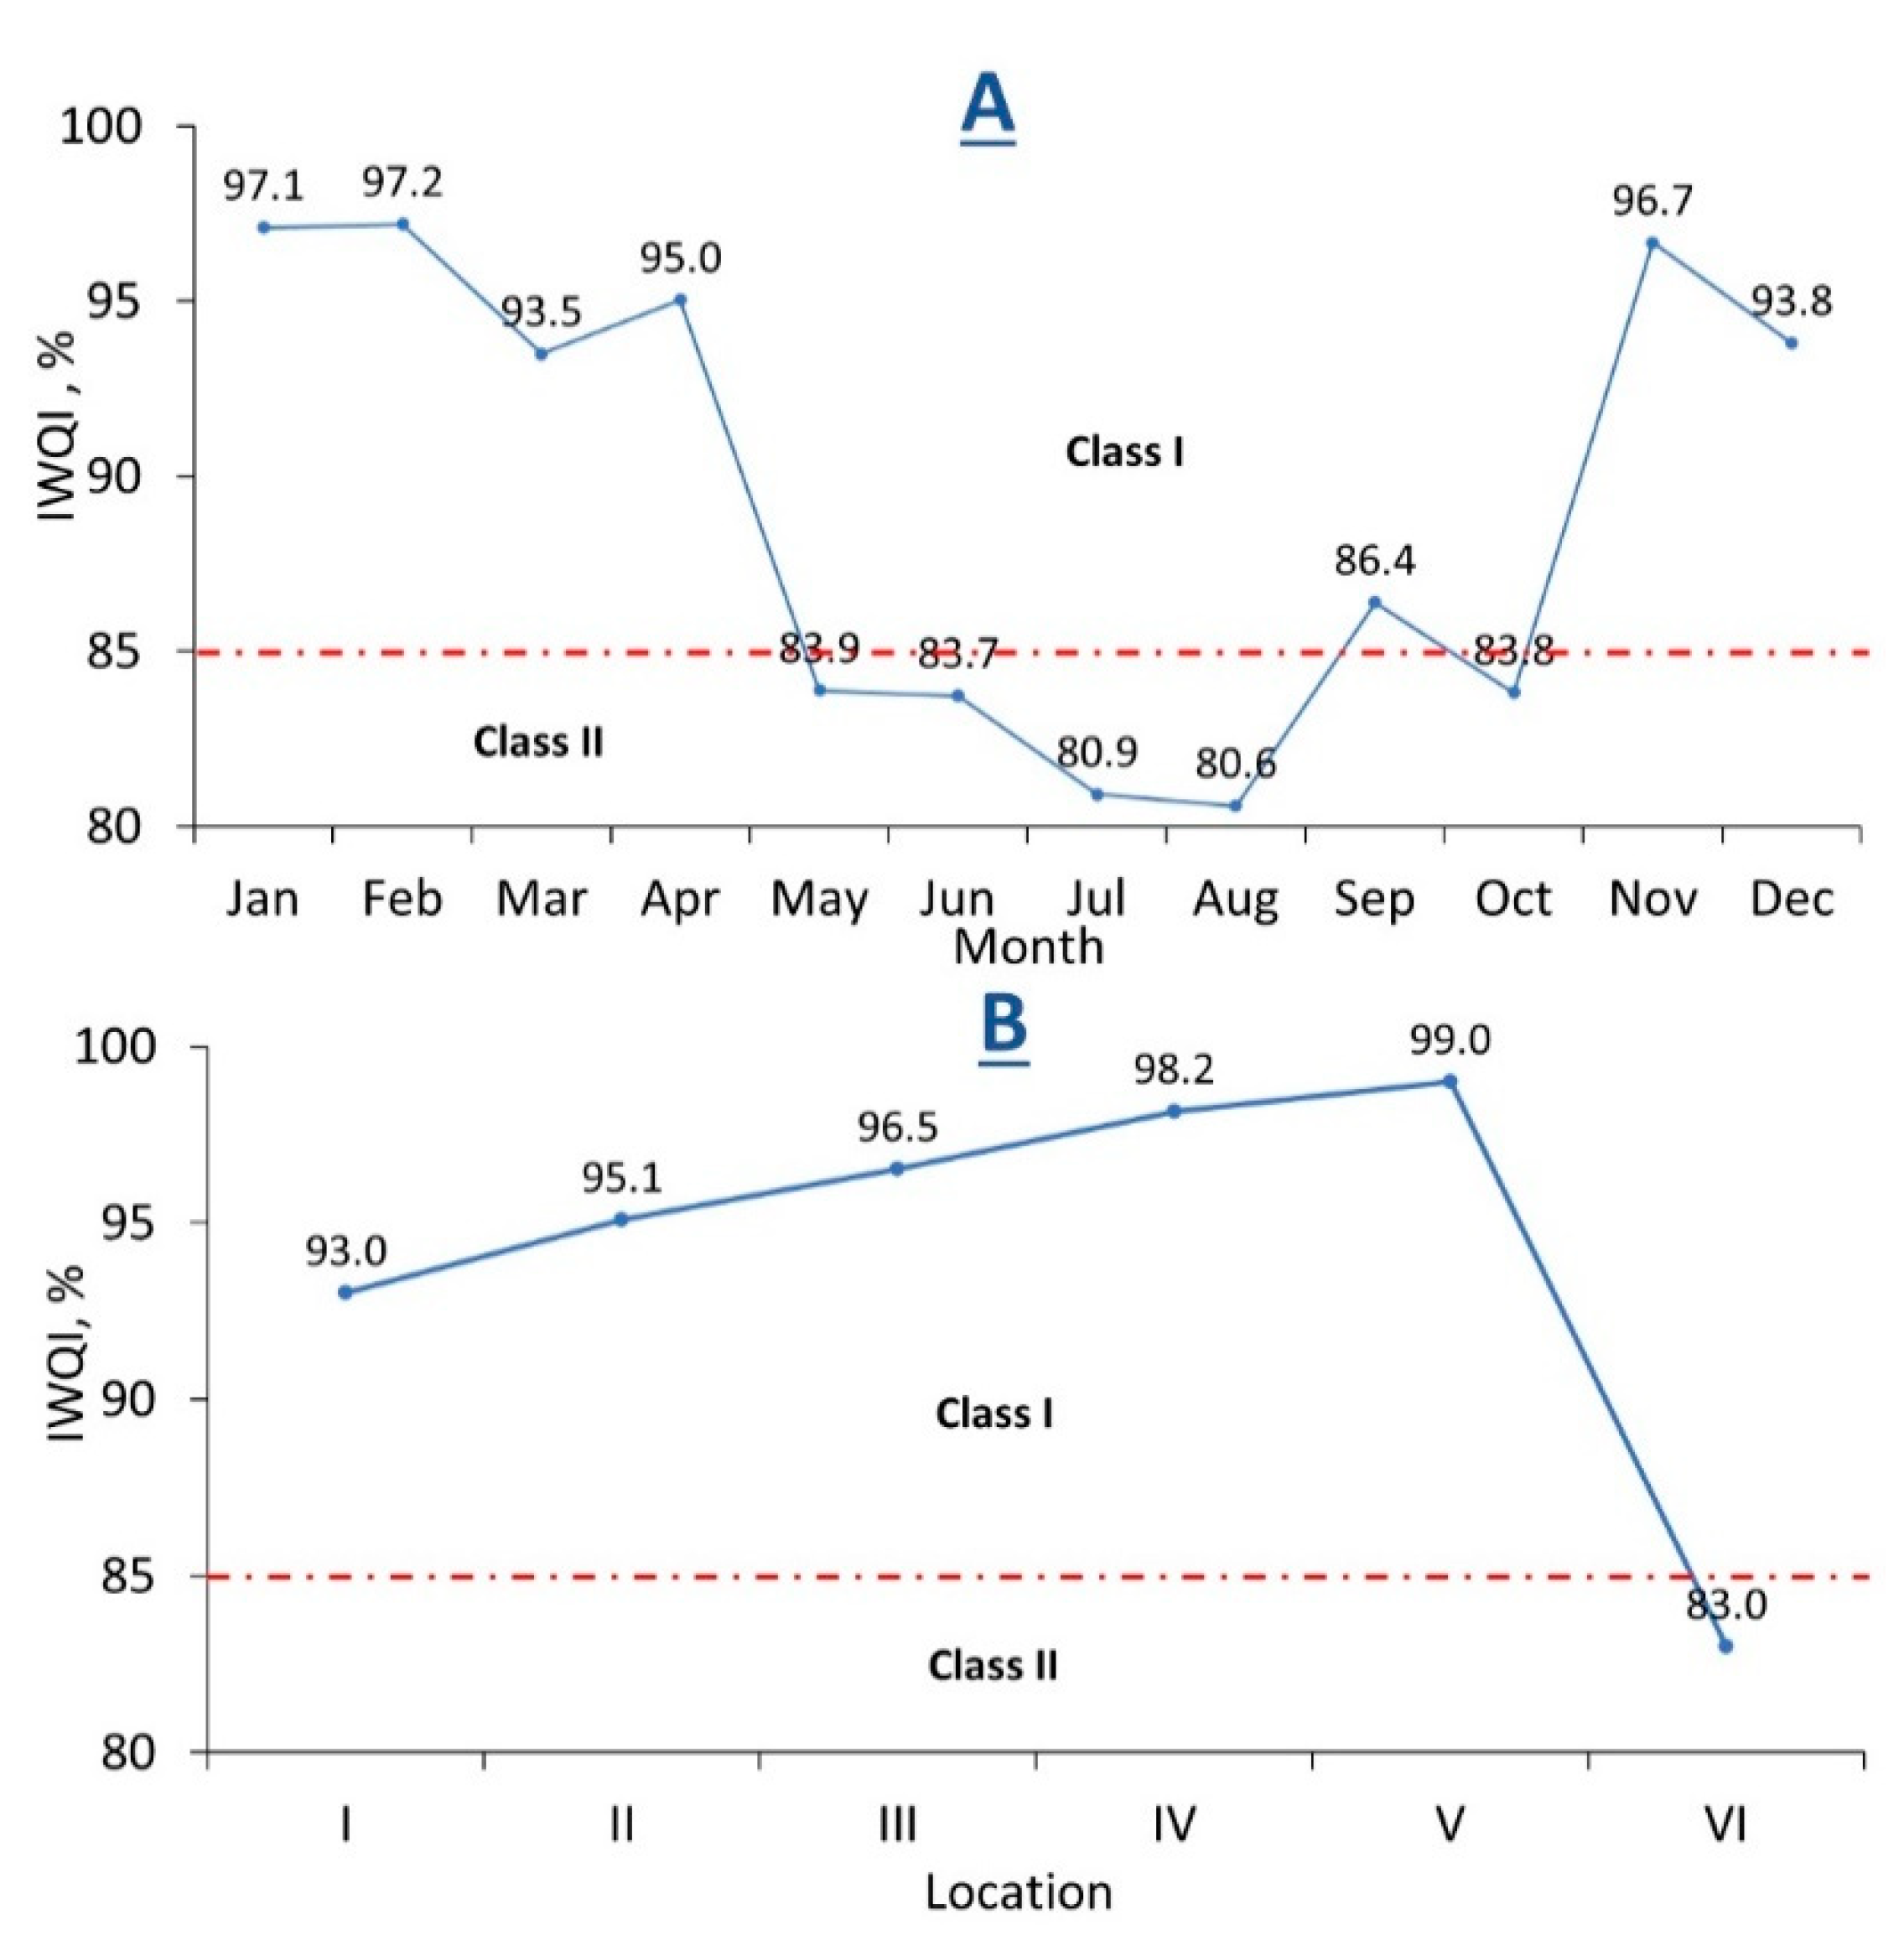
3.4. Irrigation Water Quality Index (IWQI)

The IWQI evaluation results of the Bahr Mouise canal indicated that the water quality was assigned to class I—“No restriction”—for January, February, March, April, September, November, and December, when the IWQI values ranged between 85 and 100 (Figure 7A). Therefore, the water can be used in almost types of soil and crops, and it cannot cause any long-term salinity/sodicity problems [72]. The water quality in May, June, July, August, and October was assigned to class II—“Low restriction”—(Figure 7A). Consequently, the water can be safely used to irrigate soils with coarse and medium textures (high contents of sand and silt) and a with moderate permeability status.
On the other hand, to avoid soil sodicity in heavy textures (high clay content) due to irrigation with low quality water, soil leaching is recommended because the water may cause an elevated risk to salinity-sensitive plants. Only sampling site VI was classified as class II—the rest of the studied sites were classified as class I (Figure 7B).

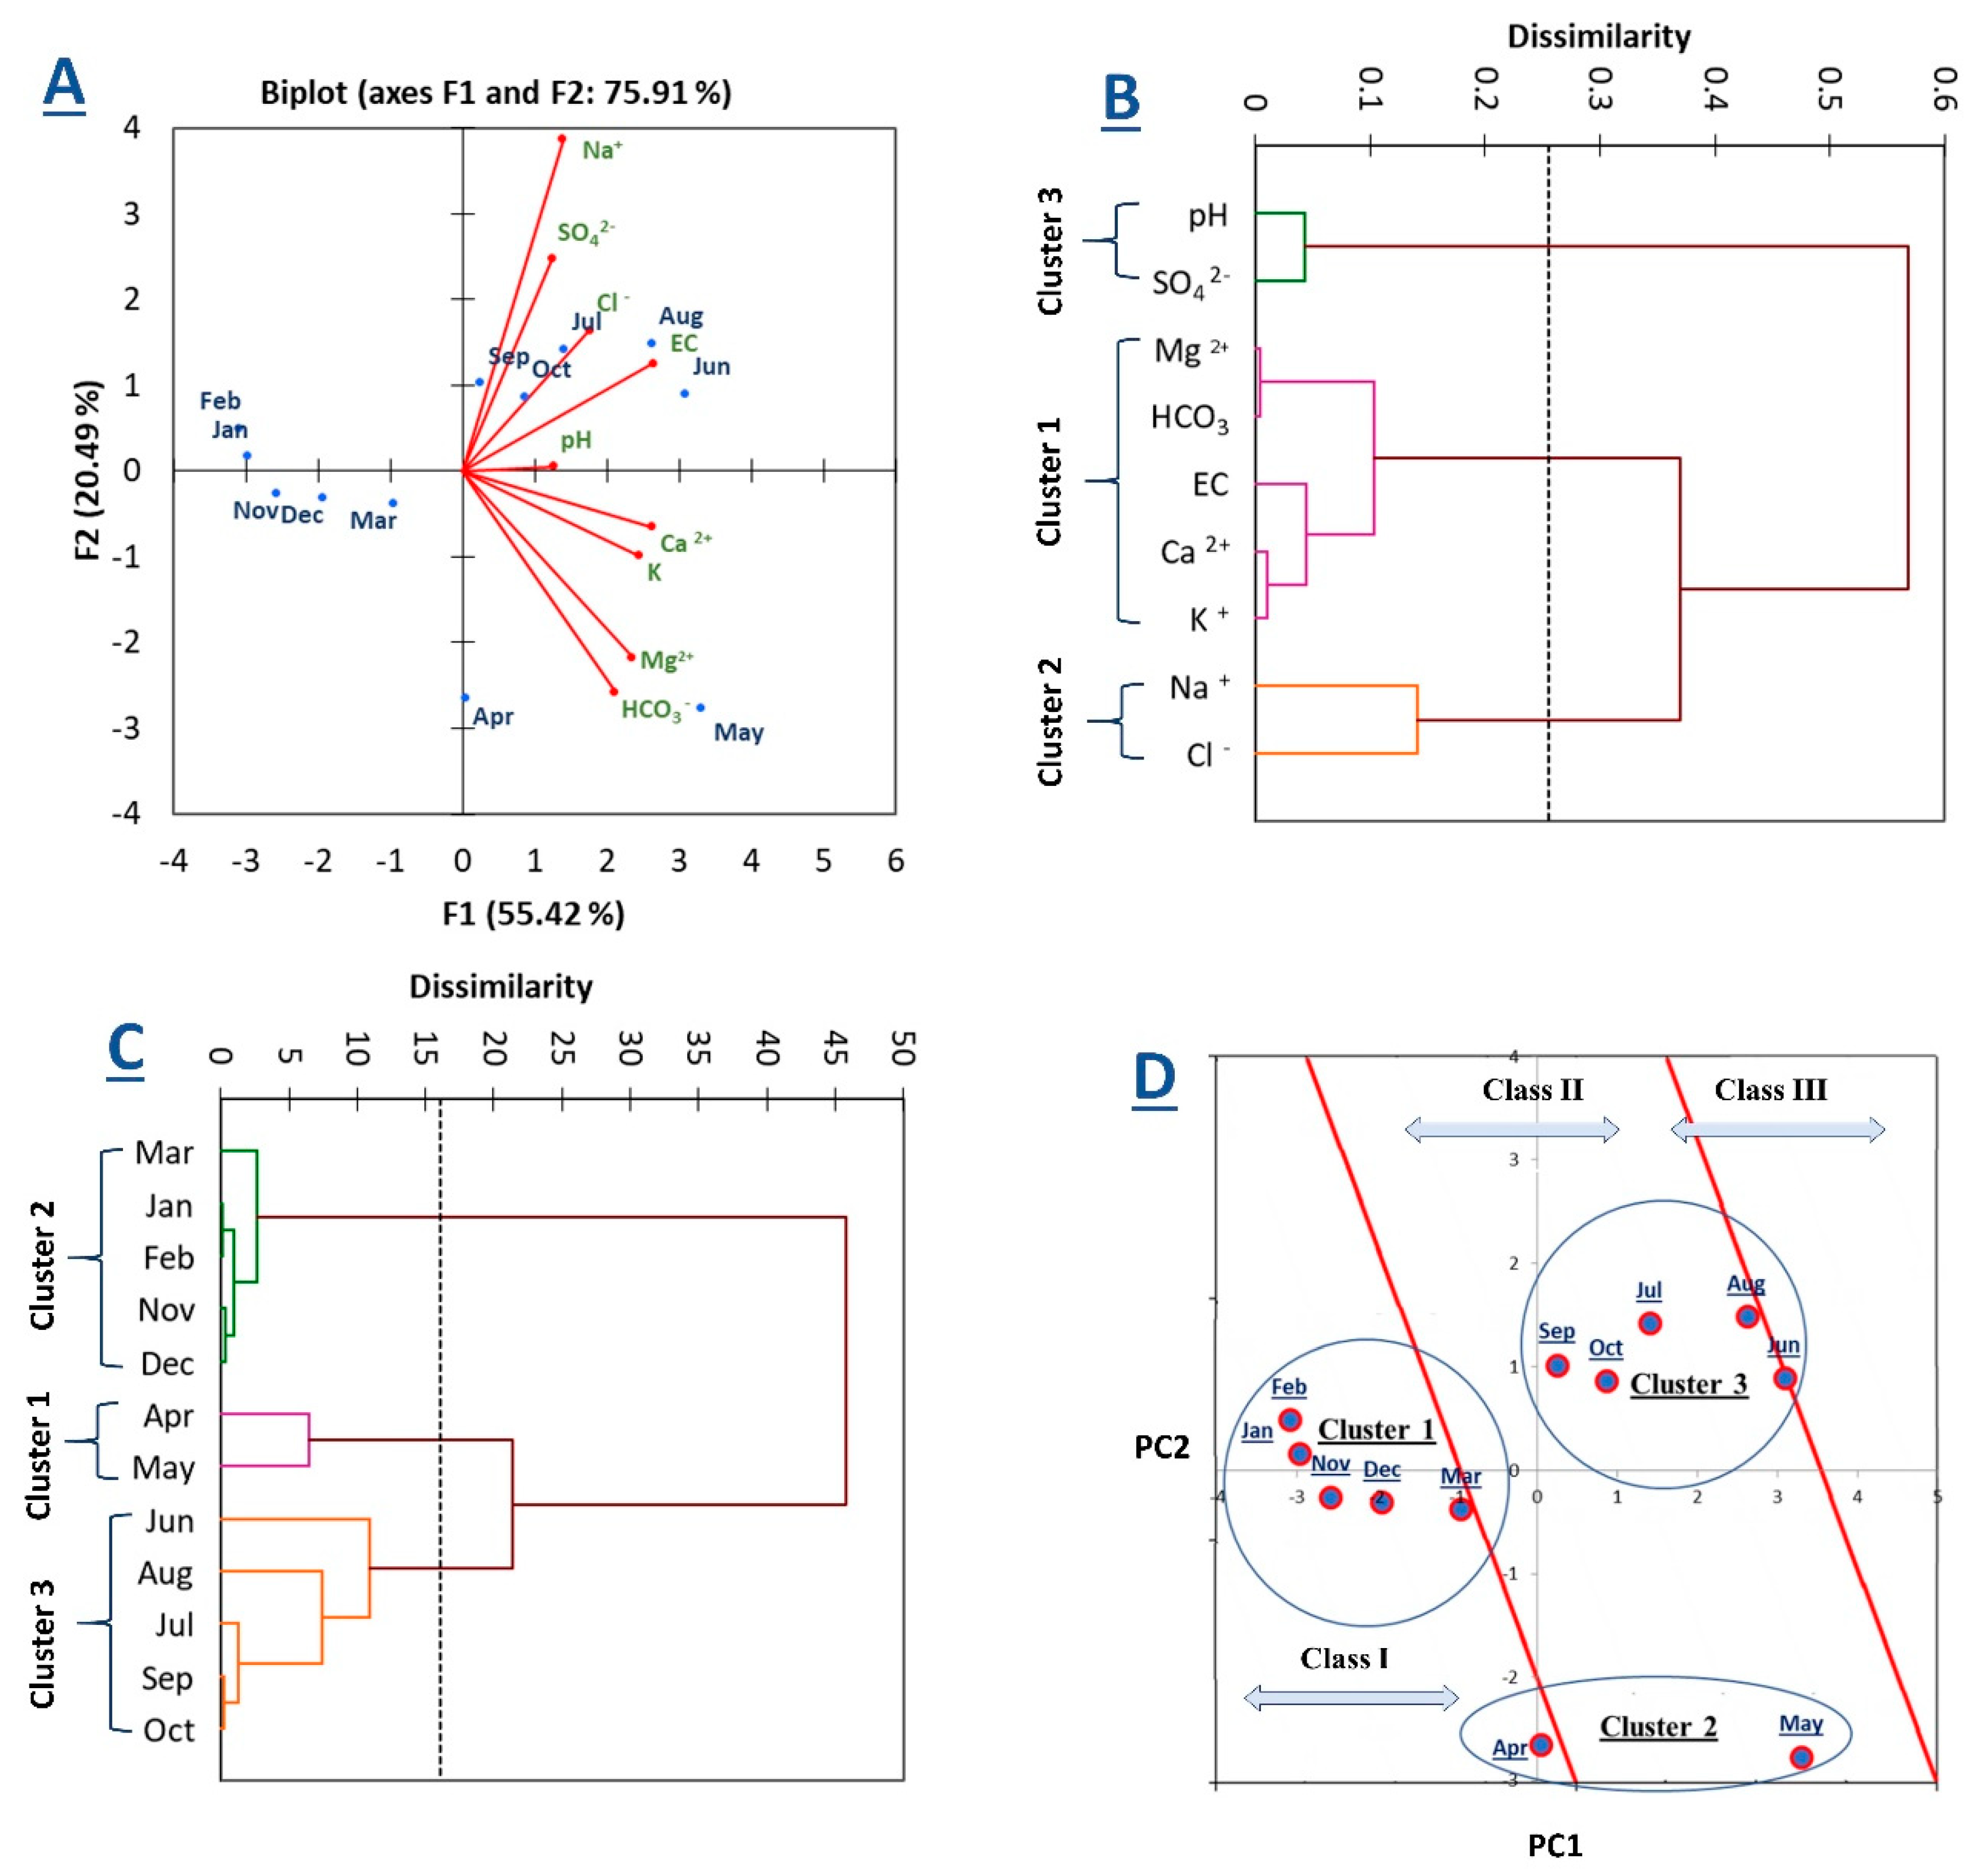
3.5. Principal Component Analysis (PCA)

3.5.1. Correlation Between the Chemical Constituents of Irrigation Water

The normality of the data was checked using the Shapiro–Wilk test, which indicated that most of the studied variables, except for Cl and SO42−, followed a normal distribution (Table S2). The correlation matrix between all variables of the Bahr Mouise canal water is presented in Table S4. The correlation matrix shows a positive correlation between ECiw and Ca2+ (0.90), Mg2+ (0.68), Na+ (0.72), K+ (0.77), HCO3 (0.57), Cl (0.77), and SO42− (0.52). There was a positive correlation between Ca2+ and Mg2+ (0.78), Na+ (0.35), K+ (0.83), HCO3 (0.79), Cl (0.68), and SO42− (0.23). More positive correlations existed between Mg2+ and K+ (0.89), HCO3 (0.88), Cl (0.34), and SO42− (0.19); between Na+ and Cl (0.65), and SO42− (0.64); and between K+ and HCO3 (0.75). Figure 8A illustrates the correlations between different variables through a biplot, and the angles between the vectors indicate the status of the correlations between each variable. When two vectors are positively correlated, a small angle between the two variables was observed, and if they meet each other at 90°, they are not likely to have been correlated. On the contrary, a big angle (close to 180°) indicates a negative correlation. The majority of the observed correlations were significant (p < 0.05) and indicated the presence of these variables in one or more of the major general components. Therefore, the PCA gave better results under these conditions of correlations, based on the verification of Bartlett’s sphericity test where small p values (p < 0.05) indicated that the PCA was a convenient method for the current data because the observed p value of the data was lower than 0.001 [73]. The Bartlett’s sphericity test results are illustrated in Table S1.

3.5.2. Validity of Water for Agricultural Irrigation

A summarization of the PCA output based on SPSS software is presented in Table 1. Generally, seven principal components (PCs) were obtained from PCA. The PCs that had an eigenvalue greater than one were kept, and the rest were removed [46].
Thus, there were three PCs that had an eigenvalue > 1 (Table 1). A scree plot (Figure S2) was used to determine the number of PCs. The three PCs explained about 90.39% of the total variance of the water variable data. PC1 represented about 55.42% of the total variance, whilst 20.49% and 14.49% of the total variance were represented by PC2 and PC3, respectively (Table 1).
Table 1 and Figure S3A show the factor loading of the three PCs, indicating the higher loading and contribution of the corresponding components [77]. Based on the factor loading of the variables in PC1, the contributing descriptors were ECiw, Ca2+, Mg2+, K+, HCO3, and Cl, where the contributions of the variables were 18.28%, 18.25%, 14.55%, 15.83%, 11.71%, and 8.14%, respectively. PC2 was highly correlated with Na+, where the contribution of the variable was 39.27%. Regarding PC3, the effective contributing descriptors were pH and SO42− (negative correlation), where the contributions of the variables were 37.92% and 26.68%, respectively.
A biplot analysis (PC1 vs. PC2) was used to visualize water variables correlations (Figure 8A), and three major groups of water properties were obtained based on the AHC technique (Figure 8B). Therefore, AHC was done to visualize the water variable grouping based on the three PCs that had an eigenvalue greater than 1.
The first group that affected by PC1 was constituted by ECiw, Ca2+, Mg 2+, K+, HCO3, and Cl; therefore, PC1 represents an indicator for salinity and alkalinity hazards because it includes the ECiw, which is normally used to estimate salinity hazard [87]. The ions (i.e., Ca2+, Mg2+, and HCO3) were used to estimate the alkalinity hazard based on the calculations of many criteria such as RSC and RSBC [37,69]. The second group that was affected by PC2 was constituted by Na+; thus, the PC2 is related to the sodicity hazard where the given hazard indicates the relationship of Na+ with the other cations (i.e., Ca2+, Mg2+, and K+) that expressed various criteria such as the SSP, the SAR, and the SCAR [69]. The third group was affected by PC3 and constituted by pH and SO42−; therefore, it may indicate water acidity.
The principal component scores for each month were calculated, and they are presented in Table 2 and Figure S3C, where a higher score indicates lower quality of water. Table 2 and Figure S3C illustrate that all months except January, February, March, November, and December had a high PC1 score (ranged between −2.59 and 3.30); therefore, Bahr Mouise water had some limitations in the months with high PC1 scores. The high PC2 scores were observed in January, February, June, July, August, September, October, November, and December (ranged from −0.31 to 1.49).
Generally, the limitations (high PCs scores) were observed from May to December. The comprehensive scores were calculated, they are presented in Table 2 and Figure S3C, where August is shown to have had the highest score (2.11) January is shown to have had the lowest score (−1.62). Moreover, Table 1 and Figure S3B,C show the correlations between PC1, PC2, and PC3 with the different variables.
The PC scores could be calculated based on the following equations (Equations (18)–(20)):
PC1=0.09X1 + 191X2 + 0.192X3 + 0.172X4 + 0.099X5 + 0.178X6 + 0.156X7+ 0.128X8 + 0.087X9
PC2=0.017X1 + 0.155X2 − 0.070X3 − 0.248X4 + 0.459X5 − 0.139X6−0.298X7 + 0.194X8 + 0.297X9
PC3=0.539X1 − 0.072X2 − 0.142X3 + 0.029X4 − 0.026X5 − 0.021X6 + 0.103X7 − 0.484X8 + 0.449X9
where X1 to X9 represent the measurement of each parameter: X1 is the pH, X2 is the ECiw, X3 is the Ca2+, X4 is the Mg2+, X5 is the Na+, X6 is the K+, X7 is the HCO3, X8 is the Cl, X9 is the SO42−
The comprehensive score can be calculated as shown in Equation (21):
PC = 0.5542 PC1 + 0.2049 PC2 + 0.1449 PC3
Table S4 represents the correlation components matrix that indicates that there was no correlation between the components; therefore, each component represents a discrete component.
Lastly, AHC was done to classify the water quality based on PC score results (Figure 8C,D). The class centroids and central objects for each cluster are shown in Table S5. Based on the AHC water quality classification, three water quality classes were obtained; Class 1 was the water quality that was allocated to class I was observed in January, February, March, April, November, and December. The quality of water during the given months did not have salinity, sodicity, and/or alkalinity limitations and could be used for irrigation without any restrictions. Class 2 was water quality that was allocated to class II that was observed during June, July, August, September, October, and December, and an alkalinity hazard may occur as a result of the continued irrigation during the given months. No months were allocated to class III. If one of the months had class III, the farmers would have to consider proper water management (e.g., providing a good drainage system and calculating the water leaching requirements) to prevent salt accumulation in the soil.

4. Discussion

The increasing demand for high-quality water for irrigation in Egypt in the last few decades has led to the use of poor-quality water for irrigation purposes in farmland, while the continuous usage of the low-quality water could cause a decline in crop productivity [88,89,90,91,92]. The current study shows that the water of the Bahr Mouise canal was classified as a moderate salinity hazard; this type of water has low limitations and is suitable for most agriculture crops [69]. Moreover, moderately salt-tolerant plants can be grown in most cases without special management, based on the guidelines for water quality for irrigation presented by the authors of [80]. The water of Bahr Mouise has a low and moderate salinity, but salt accumulation in soil may occur over the long term, and it may cause soil degradation and negatively impact crop productivity [92,93].
Phogat et al. [94] used the traditional criteria in order to evaluate the long-term impact of recycled water irrigation on soil chemical properties and crop yield. Irrigation with recycled water can potentially increase the soil solution salinity, the sodium adsorption ratio, and the exchangeable sodium percentage in the soil. The increased soil salinity reduces the potential almond yield by 12–20% in various soils. At the local farms that are irrigated by the Ethiopian Leyole River, the grown crops such as onion, carrot, potato, and cucumber would be sensitive to the concentration of chemical parameters such as BO3−, Na+, and the SAR. Higher Na+ and SAR values would lead to soil permeability problems. High SAR levels in irrigation water can cause soil problems such as soil surface crust formation, poor drainage, and poor soil tilth [80,91,95,96]. An excess of HCO3 concentration in irrigation water negatively affects the plant uptake and metabolism of nutrients. The excess of Na+ concentration in irrigation water leads to an increase adsorbed exchangeable sodium, which may cause dispersion in soil aggregates, blocking pores and reducing the water infiltration [20]. Soil function is generally threatened by increased food demands, human influence, and its activities (such as the continuous irrigation with low quality water), as well as land use and climate change [97,98]. This may lead to physical and chemical degradation processes and negatively affect soil sustainability [99,100].
Monitoring land use/land cover changes is fundamental for sustainable irrigation water management plans. The authors of [101,102] showed the importance of using the remote sensing techniques in order to detect LCLU changes and their impact on surface water in Nile Delta. Urban sprawl and rapid LCLU changes in the Nile Delta have a negative impact on water irrigation quality by increasing the concentration of contaminants [103,104]. In addition, using agricultural drainage water for irrigation causes degradation to the most fertile soils [6,27,37]. The NDVI assists in the detection of cultivation changes and crop growth during the year, while variations in crop types and growth consequently lead to fluctuations in irrigation water demand, where summer crops need more water compared with winter crops [105]. Moreover, in summer, the temperature and evapotranspiration are higher than other cultivation seasons, so the concentrations of some elements may raise and lead to an increase in the salinity and alkalinity hazards [106,107]. The high air temperatures during the year in arid regions negatively impact crop evapotranspiration, water irrigation requirements, and soil salinity level. Consequently, the plant growth and crop yield are significantly affected [107].
Here, the IWQI was used to assess the suitability of water bodies for different usage purposes, e.g., irrigation, aquatic life, and drinking. Furthermore, it can provide good information to decision makers in order to make suitable decisions about alternative water usage and conserving water bodies [108]. El Shemy et al. [109] applied the Canadian Council of Ministers of the Environment Water Quality Index (CCME-WQI) according to the Egyptian water quality standards for surface waterways Law 48/1982—Article No. 60 [110,111] to assess the overall water quality status of Lake Nubia (southern Egypt). Seven water quality parameters were integrated into the CCME-WQI and followed the Egyptian water quality standards (e.g., pH (7–8.5), dissolved oxygen (>5 mg L−1), nitrate–nitrite (>45 mg L−1), total phosphorus (>1 mg L−1), total dissolved solids (>500 mg L−1), ammonium (>0.5 mg L−1), and fecal coliforms (<2000 N/100 mL)); the obtained results indicated that the water quality ranged from 92% to 100% (good and excellent) according to the CCME-WQI.
Several studies around the world have applied PCA to evaluate and classify water quality for irrigation purposes, including China [112], Turkey [113], Nigeria [114], and Brazil [115]. China applied PCA to the Tongjiyan irrigation area, and the given study indicated that the PCA classification had similar results with other methods such as fuzzy evaluation, the Nemerow index, and improved Nemerow index methods. The authors of [116] identified four principal components in order to evaluate overall water quality. On the other hand, the seasonal and temporal variations of irrigation water quality in the Ajakanga area, Ibadan, Nigeria were examined by Ganiyu et al. [117] using PCA, and they reported that 95.7% (dry seasons) and 88.7% (wet seasons) of the total variance of the data set were represented by five principal components. The seasonal alterations in water quality were related to the weathering process, mineral dissolution, groundwater–rock interaction, and anthropogenic activities. Thus, the PCA represents a new approach to achieving the sustainable management of water resources [4,5]. In the same trend, cluster analysis (CA) and PCA were applied to analyzing 36 physicochemical parameters of water samples that were collected from a polluted lake in order to group five sampling sites into three clusters of similar water quality characteristics. The PCA method can be used for identifying physiochemical parameter correlations and the factors responsible for water quality variations [56,118].
As in many studies of water irrigation quality assessments, this study had some limitations. For example, the applied methods and the developed simplified water quality assessment were applied to an irrigation canal with a good water quality; therefore, further studies should be conducted in irrigation and drainage canals with diverse water qualities in order to justify and observe the variations between the applied methods. Nevertheless, the current research showed that temporal analysis is more important than spatial analysis for the same irrigation canal and that more changes were observed in water quality in different studied months than from one site to another.

5. Conclusions

The proper management of irrigation water depends on understanding irrigation water quality, as it assists in determining suitable crops and the potential agriculture uses. Irrigation water quality is affected by human activities, agricultural practices, and environmental conditions (e.g., urbanization, use of agrochemicals, and climate conditions). The irrigation water quality of the Bahr Mouise canal (El-Sharkia Governorate, Egypt) at six site locations over the twelve months of 2019 were assessed by using multivariate analyses (i.e., IWQI), as well as by developing a new classification method based on analyzing water chemical composition using the PCA and AHC techniques. The PCs of PCA explained 90.39% of the total variance of water data. The quality of Bahr Mouise canal water was decreased to class II in summer (June, July, August, September, and October), while the highest quality (class I) was observed during the winter (January February, March, April, November, and December).
The new approach of classification based on the PCA water quality as a statistical-based method had similar results to the IWQI method, except for in the assessment of water in September, which was assigned to class II when applying the PCA method but assigned to class I by the IWQI method. The dominant LCLU around the Bahr Mouise canal was agriculture use, and the variations in NDVI values indicated the dissimilarities of crop types and growth stages during the different cultivation seasons. Therefore, the variations in crop types and the status of growth stage were related to crop water requirements and irrigation water quality. Generally, the Bahr Mouise canal was found to have a good water quality for irrigation, but the decline in water quality during the summer indicated that continued irrigation (over the long term) during this season may cause salinization problems and, consequently, negatively impact crop productivity; therefore, the suitable planning of irrigation water management is highly recommended. Finally, irrigation water represents a principal issue for sustainable agricultural production in Egypt; hence, irrigation water quality must be monitored during the year, and good-quality irrigation water should be used to sustain soils and agricultural productivity.

Supplementary Materials

The following are available online at https://0-www-mdpi-com.brum.beds.ac.uk/2073-4441/12/9/2537/s1, Figure S1: Impact of different land uses on irrigation water quality, Figure S2: The eigenvalue scree plot for determine the number of PCs in the analysis, Figure S3: Component loadings for the three PCs (A), PC scores for the three PCs (B), and PC comprehensive for the months (SX2), Table S1: Results of Kaiser–Meyer–Olkin (KMO) and Bartlett’s sphericity tests, Table S2: Annual average of chemical composition analysis of Bahr Mouise canal water, Table S3: Criteria for judging the validity of Bahr Mouise canal water, Table S4: Correlation components matrix; Table S5: The Class centroids and Central objects for each cluster.

Author Contributions

Conceptualization, M.K.A.-F., A.A.A., and A.S.E.; introduction, M.K.A.-F. and E.S.M.; methodology, M.K.A.-F. and S.K.A.-E.; results and discussion, M.K.A.-F., S.K.A.-E., and E.S.M.; review and conclusions S.K.A.-E. and E.S.M.; funding acquisition, A.A.A. and M.K.A.-F. All authors have read and agreed to the published version of the manuscript.

Funding

The authors would like to declare that the funding from the study was supported by the Soil Science Department, Faculty of Agriculture, Zagazig University and National Authority for Remote Sensing and Space Science (NARSS), Egypt and Research Group Project no. RGP–VPP–275., King Saud University, Saudi Arabia.

Acknowledgments

The authors would like to thank the Soil Science Department, Faculty of Agriculture, Zagazig University for funding the laboratory analysis. The authors would like to National Authority for Remote Sensing and Space Sciences for supporting the satellite data and image processing. The authors would like to extend their sincere appreciation to the Deanship of Scientific Research at King Saud University for its funding of this research through the Research Group Project no. RGP–VPP–275.

Conflicts of Interest

The authors declare no conflict of interest.

References

  1. Nagy-Kovács, Z.; Davidesz, J.; Czihat-Mártonné, K.; Grischek, T. Water quality changes during riverbank filtrationin Budapest, Hungary. Water 2019, 11, 302. [Google Scholar] [CrossRef] [Green Version]
  2. Sandhu, C.; Grischek, T.; Börnick, H.; Feller, J.; Sharma, S.K. A water quality appraisal of some existing and potential riverbank filtration sites in India. Water 2019, 11, 215. [Google Scholar] [CrossRef] [Green Version]
  3. El-Zeiny, A.M.; Abd El-Hamid, H.T.; El-Alfy, M.A. Anthropogenic impacts on water quality of river nile and marine environment, Rosetta branch using geospatial analyses. J. Environ. Sci. 2018, 47, 89–101. [Google Scholar]
  4. Shirmohammadi, B.; Malekian, A.; Salajegheh, A.; Taheri, B.; Azarnivand, H.; Malek, Z.; Verburg, P.H. Scenario analysis for integrated water resources management under future land use change in the Urmia Lake region, Iran. Land Use Policy 2020, 90, 104299. [Google Scholar] [CrossRef]
  5. El-Alfy, M.A.; Hasballah, A.F.; Abd El-Hamid, H.T.; El-Zeiny, A.M. Toxicity assessment of heavy metals and organochlorine pesticides in freshwater and marine environments, Rosetta area, Egypt using multiple approaches. Sustain. Environ. Res. 2019, 29, 19. [Google Scholar] [CrossRef] [Green Version]
  6. Osman, R.; Ferrari, E.; McDonald, S. Water scarcity and irrigation efficiency in Egypt. Water Econ. Policy 2016, 2, 1650009. [Google Scholar] [CrossRef]
  7. Wang, F.; Wang, X.; Zhao, Y.; Yang, Z.F. Long-term water quality variations and chlorophyll a simulation with an emphasis on different hydrological periods in Lake Baiyangdian, northern China. J. Environ. Inform. 2012, 20, 90–102. [Google Scholar] [CrossRef]
  8. Wallace, J.S. Increasing agricultural water use efficiency to meet future food production. Agr. Ecosyst. Environ. 2000, 82, 105–119. [Google Scholar] [CrossRef]
  9. Molden, D. (Ed.) Water for Food Water for Life: A Comprehensive Assessment of Water Management in Agriculture; Routledge: Abingdon, UK, 2013. [Google Scholar]
  10. Movilla-Pateiro, L.; Mahou-Lago, X.M.; Doval, M.I.; Simal-Gandara, J. Toward a sustainable metric and indicators for the goal of sustainability in agricultural and food production. Crit. Rev. Food Sci. 2020, 20, 1–22. [Google Scholar] [CrossRef]
  11. CAPMAS. Statistical Year Book" Central Agency for Public Mobilization and Statistics (CAPMAS), Annual Report 2017, Cairo, Egypt. Available online: http://www.capmas.gov.eg (accessed on 19 May 2020).
  12. Abd-Elmabod, S.K.; Fitch, A.C.; Zhang, Z.; Ali, R.R.; Jones, L. Rapid urbanisation threatens fertile agricultural land and soil carbon in the Nile delta. J. Environ. Manag. 2019, 252, 109668. [Google Scholar] [CrossRef]
  13. El-Rawy, M.; Abdalla, F.; El Alfy, M. Water resources in Egypt. In the Geology of Egypt; Springer: Berlin, Germany, 2020; pp. 687–711. [Google Scholar]
  14. El Nahry, A.H.; Mohamed, E.S. Potentiality of land and water resources in African Sahara: A case study of south Egypt. Environ. Earth Sci. 2011, 63, 1263–1275. [Google Scholar] [CrossRef]
  15. Water, U.N. Coping with Water Scarcity: Challenge of the Twenty-first Century; Report for World Water Day 2007; World Water Day; United Nations: Rome, Italy, 2007; pp. 1–29. [Google Scholar]
  16. Water for the Future, National Water Resources Plan 2017; Ministry of Water Resources and Irrigation of the Arab Republic of Egypt: Cairo, Egypt, 2017.
  17. Machael, A.M. Irrigation Principles and Practice; Vikas publishing house ltd.: New Delhi, India, 1985; pp. 702–720. [Google Scholar]
  18. Allen, L.N.; MacAdam, J.W. Irrigation and Water Management. Forages Sci. Grassl. Agric. 2020, 2, 497–513. [Google Scholar]
  19. Kurunc, A.; Aslan, G.E.; Karaca, C.; Tezcan, A.; Turgut, K.; Karhan, M.; Kaplan, B. Effects of salt source and irrigation water salinity on growth, yield and quality parameters of Stevia rebaudiana Bertoni. Sci. Hortic. 2020, 270, 109458. [Google Scholar] [CrossRef]
  20. Ajayi, F.; Nduru, M.; Oningue, A. Halting the salt that kills crops. Afr. Farmer 1990, 4, 10–12. [Google Scholar]
  21. Perez, A.R.S. Characterizing Salinity Tolerance in Greenhouse Roses. Ph.D. Thesis, Texas A&M University, College Station, TX, USA, August 2011. Available online: https://oaktrust.library.tamu.edu/handle/1969.1/ETD-TAMU-2009-05-725 (accessed on 15 March 2020).
  22. Sarkar, B.; Islam, A. Assessing the suitability of water for irrigation using major physical parameters and ion chemistry: A study of the Churni River, India. Arab. J. Geosci. 2019, 12, 637. [Google Scholar] [CrossRef]
  23. Food and Agriculture Organization (FAO). Soil Survey Investigation for Irrigation. Soil Bulletin 42; Food and Agriculture Organization of the United Nations: Rome, Italy, 1985. [Google Scholar]
  24. US Salinity Laboratory Staff. Diagnosis and Improvement of Saline and Alkali Soils; Agriculture Handbook No. 60; Richards, L.A., Ed.; United States Department of Agriculture: Washington, DC, USA, 1954.
  25. Wahaab, R.A.; Salah, A.; Grischek, T. Water Quality Changes during the Initial Operating Phase of Riverbank Filtration Sites in Upper Egypt. Water 2019, 11, 1258. [Google Scholar] [CrossRef] [Green Version]
  26. Nile Basin Initiative. State of the River Nile Basin; Nile Basin Initiative Secretariat: Entebbe, Uganda, 2012. [Google Scholar]
  27. Ramadan, E.M.; Fahmy, M.R.; Nosair, A.M.; Badr, A.M. Using geographic information system (GIS) modeling in evaluation of canals water quality in Sharkia Governorate, East Nile Delta, Egypt. Model. Earth Syst. Environ. 2019, 5, 1925–1939. [Google Scholar] [CrossRef]
  28. Ali, H.; Khan, E.; Ilahi, I. Environmental chemistry and ecotoxicology of hazardous heavy metals: Environmental persistence, toxicity, and bioaccumulation. J. Chem. 2019, 4, 1–14. [Google Scholar] [CrossRef] [Green Version]
  29. El-Hassanin, A.S.; Samak, M.R.; Abdel-Rahman, G.N.; Abu-Sree, Y.H.; Saleh, E.M. Risk assessment of human exposure to lead and cadmium in maize grains cultivated in soils irrigated either with low-quality water or freshwater. Toxicol. Rep. 2020, 7, 10–15. [Google Scholar] [CrossRef]
  30. Qadri, R.; Faiq, M.A. Freshwater Pollution: Effects on Aquatic Life and Human Health. In Fresh Water Pollution Dynamics and Remediation; Springer: Berlin, Germany, 2020; pp. 15–26. [Google Scholar]
  31. Al Hadrami, S.N. Preparation, Characterization and Catalytic Activity Study of Transition Metal Doped Porous γ-Alumina. Master Thesis, United Arab Emirates University, Abu Dhabi, United Arab Emirates, January 2013. Available online: https://core.ac.uk/download/pdf/230628289.pdf (accessed on 12 June 2020).
  32. Noori, R.; Berndtsson, R.; Hosseinzadeh, M.; Adamowski, J.F.; Abyaneh, M.R. A critical review on the application of the National Sanitation Foundation Water Quality Index. Environ. Pollut. 2019, 244, 575–587. [Google Scholar] [CrossRef]
  33. Ziada, M.A.; Mashaly, I.A.; Torky, M. Ecological studies on the aquatic vegetation in North East Nile Delta, Egypt. Int. J. Bot. 2008, 4, 151–163. [Google Scholar] [CrossRef]
  34. Hassan, A.M.; Belal, A.A.; Hassan, M.A.; Farag, F.M.; Mohamed, E.S. Potential of thermal remote sensing techniques in monitoring waterlogged area based on surface soil moisture retrieval. J. Afr. Earth Sci. 2019, 155, 64–74. [Google Scholar] [CrossRef]
  35. Zhang, Q.; Yang, L.; Song, D. Environmental effect of decentralization on water quality near the border of cities: Evidence from China’s Province-managing-county reform. Sci. Total Environ. 2020, 708, 135154. [Google Scholar] [CrossRef] [PubMed]
  36. AbdelRahman, M.A.; Shalaby, A.; Mohamed, E.S. Comparison of two soil quality indices using two methods based on geographic information system. Egypt. J. Remote Sens. Space Sci. 2019, 22, 127–136. [Google Scholar] [CrossRef]
  37. Abd-Elmabod, S.K.; Mansour, H.; Hussein, A.A.; Mohamed, E.S.; Zhang, Z.; Anaya-Romero, M.; Jordán, A. Influence of Irrigation Water Quantity on The Land Capability Classification. Plant Arch. 2019, 19, 2253–2261. [Google Scholar]
  38. Mohamed, E.S.; Abdellatif, M.A.; Abd-Elmabod, S.K.; Khalil, M.M. Estimation of surface runoff using NRCS curve number in some areas in northwest coast, Egypt. In Proceedings of the E3S Web of Conferences, Barcelona, Spain, 10–12 February 2020; Volume 167, p. 02002. [Google Scholar]
  39. Mohamed, E.S. Spatial assessment of desertification in north Sinai using modified MEDLAUS model. Arab. J. Geosci. 2013, 6, 4647–4659. [Google Scholar] [CrossRef]
  40. Abdulaziz, A.M.; Hurtado, J.J.M.; Al-Douri, R. Application of multitemporal Landsat data to monitor land cover changes in the Eastern Nile Delta region, Egypt. Int. J. Remote Sens. 2009, 30, 2977–2996. [Google Scholar] [CrossRef]
  41. Abu-hashim, M.; Elsayed, M.; Belal, A.E. Effect of land-use changes and site variables on surface soil organic carbon pool at Mediterranean Region. J. Afr. Earth Sci. 2016, 114, 78–84. [Google Scholar] [CrossRef]
  42. Mohamed, E.S.; Abu-hashim, M.; AbdelRahman, M.A.; Schütt, B.; Lasaponara, R. Evaluating the effects of human activity over the last decades on the soil organic carbon pool using satellite imagery and GIS techniques in the Nile Delta Area, Egypt. Sustainability 2019, 11, 2644. [Google Scholar] [CrossRef] [Green Version]
  43. Grădinaru, S.R.; Kienast, F.; Psomas, A. Using multi-seasonal landsat imagery for rapid identification of abandoned land in areas affected by urban sprawl. Ecol. Indic. 2019, 96, 79–86. [Google Scholar] [CrossRef]
  44. Nageswara Rao, P.P.; Shobha, S.V.; Ramesh, K.S.; Somashekhar, R.K. Satellite-based assessment of agricultural drought in karnataka state. J. Indian Soc. Remote 2005, 33, 429–434. [Google Scholar] [CrossRef]
  45. Yang, Y.; Zhu, J.; Zhao, C.; Liu, S.; Tong, X. The spatial continuity study of NDVI based on kriging and BPNN algorithm. Math. Comput. Model. 2011, 54, 1138–1144. [Google Scholar] [CrossRef]
  46. Han, J.; Huang, Y.; Zhang, H.; Wu, X. Characterization of elevation and land cover dependent trends of NDVI variations in the hexi region, northwest china. J. Environ. Manag. 2019, 232, 1037–1048. [Google Scholar] [CrossRef]
  47. Park, T.; Ganguly, S.; TØmmervik, H.; Euskirchen, E.S.; Hogda, K.; Karlsen, S.R.; Myneni, R.B. Changes in growing season duration and productivity of northern vegetation inferred from long-term remote sensing data. Environ. Res. Lett. 2016, 11, 084001. [Google Scholar] [CrossRef]
  48. Kim, H.M.; Kwak, H.S.; Yoo, J.S. Improved clustering algorithm for change detection in remote sensing. Int. J. Digit. Content Technol. Its Appl. 2008, 2, 55–59. [Google Scholar]
  49. Wang, J.; Zhou, W.; Pickett, S.T.; Yu, W.; Li, W. A multiscale analysis of urbanization effects on ecosystem services supply in an urban megaregion. Sci. Total Environ. 2019, in press. [Google Scholar] [CrossRef]
  50. Kemsley, E.K. Discriminant analysis of high-dimensional data: A comparison of principal components analysis and partial least squares data reduction methods. Chemom. Intell. Lab. Syst. 1996, 33, 47–61. [Google Scholar] [CrossRef]
  51. Campbell, B.; Sayer, J.A.; Frost, P.; Vermeulen, S.; Pérez, M.R.; Cunningham, A.; Prabhu, R. Assessing the performance of natural resource systems. Conserv. Ecol. 2002, 5, 22. [Google Scholar] [CrossRef] [Green Version]
  52. Liu, L.; Dong, Y.; Kong, M.; Zhou, J.; Zhao, H.; Tang, Z.; Wang, Z. Insights into the long-term pollution trends and sources contributions in Lake Taihu, China using multi-statistic analyses models. Chemosphere 2020, 242, 125272. [Google Scholar] [CrossRef]
  53. Beiragh, R.G.; Alizadeh, R.; Kaleibari, S.S.; Cavallaro, F.; Zolfani, S.H.; Bausys, R.; Mardani, A. An integrated multi-criteria decision making model for sustainability performance assessment for insurance companies. Sustainability 2020, 12, 789. [Google Scholar] [CrossRef] [Green Version]
  54. Tung, T.M.; Yaseen, Z.M. A survey on river water quality modelling using artificial intelligence models: 2000–2020. J. Hydrol. 2020, 585, 124670. [Google Scholar]
  55. Zhang, Y.; Guo, F.; Meng, W.; Wang, X.Q. Water quality assessment and source identification of Daliao river basin using multivariate statistical methods. Environ. Monit. Assess. 2009, 152, 105–121. [Google Scholar] [CrossRef] [PubMed]
  56. Kazi, T.G.; Arain, M.B.; Jamali, M.K.; Jalbani, N.; Afridi, H.I.; Sarfraz, R.A.; Baig, J.A.; Shah, A.Q. Assessment of water quality of polluted lake using multivariate statistical techniques: A case study. Ecotox. Environ. Safe. 2009, 72, 301–309. [Google Scholar] [CrossRef] [PubMed]
  57. Peldszus, S.; Hallé, C.; Peiris, R.H.; Hamouda, M.; Jin, X.; Legge, R.L.; Budman, H.; Moresoli, C.; Huck, P.M. Reversible and irreversible low-pressure membrane foulants in drinking water treatment: Identification by principal component analysis of fluorescence EEM and mitigation by biofiltration pretreatment. Water Res. 2011, 45, 5161–5170. [Google Scholar] [CrossRef]
  58. Mandal, U.K.; Warrington, D.N.; Bhardwaj, A.K.; Bar-Tal, A.; Kautsky, L.; Minz, D.; Levy, G.J. Evaluating impact of irrigation water quality on a calcareous clay soil using principal component analysis. Geoderma 2008, 144, 189–197. [Google Scholar] [CrossRef]
  59. Guimet, F.; Ferré, J.; Boqué, R.; Rius, F.X. Application of unfold principal component analysis and parallel factor analysis to the exploratory analysis of olive oils by means of excitation emission matrix fluorescence spectroscopy. Anal. Chim. Acta 2004, 515, 75–85. [Google Scholar] [CrossRef]
  60. Primpas, I.; Tsirtsis, G.; Karydis, M.; Kokkoris, G.D. Principal component analysis: Development of a multivariate index for assessing eutrophication according to the European water framework directive. Ecol. Indi. 2010, 10, 178–183. [Google Scholar] [CrossRef]
  61. APHA. Standard Methods of Analysis of Water and Wastewater, 19th ed.; American Public Health Association (APHA): Washington, DC, USA, 1995. [Google Scholar]
  62. Lillesand, T.M.; Kiefer, R.W.; Chipman, J.W. Remote Sensing and Image Interpretation; John Willey & Sons: New York, NY, USA, 2000; p. 724. [Google Scholar]
  63. El-Sonbati, M.; El-Zeiny, A.; El-Gammal, M.; Ibrahim, M. Assessment of some water pollutants at New Damietta city-Egypt. J. Environ. Sci. 2012, 41, 267–282. [Google Scholar]
  64. Meera, G.G.; Parthiban, S.; Thummalu, N.; Christy, A. NDVI: Vegetation change detection using remote sensing and GIS—A case study of Vellore District. Procedia Comput. Sci. 2015, 57, 1199–1210. [Google Scholar]
  65. Xue, J.; Su, B. Significant remote sensing vegetation indices: A review of developments and applications. J. Sens. 2017. [Google Scholar] [CrossRef] [Green Version]
  66. Burgan, R.E.; Hartford, R.A. Monitoring Vegetation Greenness with Satellite Data; Gen. Tech. Rep. INT-GTR-297; Intermountain Research Station. 13; US Department of Agriculture, Forest Service: Ogden, UT, USA, 1993; p. 297.
  67. USDA. Diagnosis and Improvement of Saline and Alkali Soils. United States Department of Agriculture (USDA) Handbook; US Gov. Printing Office: Washington, DC, USA, 1954; Volume 60.
  68. Szabolcs, I.; Darab, C. The infuence of irrigation water of high sodium carbonate content of soils. Agrokémia és talajtan 1964, 13, 237–246. [Google Scholar]
  69. Gupta, I.C. Use of Saline Water in Agriculture: A Study of Arid and Semi-arid Zones of India; Oxford and IBH Publications: New Delhi, India, 1990. [Google Scholar]
  70. Doneen, L.D. Notes on Water Quality in Agriculture; University of California: Oakland, CA, USA, 1964. [Google Scholar]
  71. Kelly, W.P. Permissible Composition and Concentration of Irrigated Waters. Proc. Am. Soc. Civil Eng. 1940, 66, 607–613. [Google Scholar]
  72. Meireles, A.C.; Andrade, E.M.; Chaves, L.C.; Frischkorn, H.; Crisostomo, L.A. A new proposal of the classification of irrigation water. Rev. Cienc. Agron. 2010, 41, 349–357. [Google Scholar] [CrossRef] [Green Version]
  73. Hutcheson, G.D.; Nick, S. The Multivariate Social Scientist: Introductory Statistics Using Generalized Linear Models; SAGE: Oaks, CA, USA, 1999. [Google Scholar]
  74. Ted, A. Baumgartner. Reading Statistics and Research (5th ed.). Meas. Phys Educ Exercise Sci. 2008, 12, 52–54. [Google Scholar]
  75. Pallant, J.; Manual, S.S. A step by step guide to data analysis using SPSS for windows. In SPSS Survival Manual; SPSS Inc.: Chicago, IL, USA, 2007. [Google Scholar]
  76. Tao, X.F.; Huang, T.; Li, X.F.; Peng, D.P. Application of a PCA based water quality classification method in water quality assessment in the Tongjiyan Irrigation Area, China. In Proceedings of the 2016 5th International Conference on Energy and Environmental Protection, Shenzhen, China, 17–18 September 2016; Atlantis Press: Paris, France. [Google Scholar]
  77. Lawley, D.N.; Maxwell, A. Factor Analysis as a Statistical Method. J. R. Stat. Soc. 1962, 3, 209–229. [Google Scholar] [CrossRef]
  78. Mohamed, E.S.; Belal, A.; Saleh, A. Assessment of land degradation east of the Nile Delta, Egypt using remote sensing and GIS techniques. Arab. J. Geosci. 2013, 6, 2843–2853. [Google Scholar] [CrossRef]
  79. Mohamed, E.S.; Ali, A.; El-Shirbeny, M.; Abutaleb, K.; Shaddad, S.M. Mapping soil moisture and their correlation with crop pattern using remotely sensed data in arid region. Egypt. J. Remote Sens. Space Sci. 2019, in press. [Google Scholar] [CrossRef]
  80. FAO. Guidelines: Land Evaluation for Irrigated Agriculture-Soils Bul. 55; Food and Agriculture Organization (FAO) of the United Nations: Rome, Italy, 1985. [Google Scholar]
  81. Todd, D.K. Groundwater Hydrology; Wiley: Hoboken, NJ, USA, 1980. [Google Scholar]
  82. Kumar, P.M.; Kumar, S.A.; Pradeep, T.; Suresh, M.; Ramesh, S. Assessment of the Groundwater Quality for Irrigation Purposes in Rasipuram Taluk, Tamilnadu, India. Asian J. Res. Soc. Sci. Humanit. 2016, 6, 547–553. [Google Scholar] [CrossRef]
  83. Gupta, S.K.; Gupta, I.C. Management of Saline Soils and Waters, 2nd ed.; Scientific Pub: Jodhpur, India, 1997. [Google Scholar]
  84. Al-Amry, A.S. Hydrogeochemistry and groundwater quality assessment in an arid region: A case study from Al Salameh Area, Shabwah, Yemen. In Proceedings of the 3rd International Conference on Water Resources and Arid Environments, Riyadh, Saudi Arabia, 16–19 November 2008. [Google Scholar]
  85. Paliwal, K.V. Irrigation with saline water, Monogram No. 2 (Newseries). New Delhi India 1972, 198. [Google Scholar] [CrossRef] [Green Version]
  86. Sundaray, S.K.; Nayak, B.B.; Bhatta, D. Environmental studies on river water quality with reference to suitability for agricultural purposes: Mahanadi river estuarine system, India- a case study. Environ. Monitor. Assess. 2009, 155, 227–243. [Google Scholar] [CrossRef]
  87. Allison, L.E.; Richards, L.A. Diagnosis and Improvement of Saline and Alkali Soils; Soil and Water Conservative Research Branch, Agricultural Research Service, US Department of Agriculture: Washington, DC, USA, 1954. [Google Scholar]
  88. Rashash, A.A.; Mohamed, E.S.; Belal, A.; El-Shirbeny, M. GIS spatial model based for DAM reservoir on dry Wadis. In Proceedings of the ACRS 2015-36th Asian Conference on Remote Sensing: Fostering Resilient Growth in Asia, Proceedings (Asian Association on Remote Sensing, 2015), Quezon City, Philippines, 24–28 October 2015. [Google Scholar]
  89. Hem, J.D. Study and Interpretation of the Chemical Characteristics of Natural Water; Department of the Interior, US Geological Survey: Reston, VA, USA, 1985; Volume 2254.
  90. Kumar, M.; Kumari, K.; Ramanathan, A.L.; Saxena, R. A comparative evaluation of groundwater suitability for irrigation and drinking purposes in two intensively cultivated districts of Punjab, India. Environ. Geol. 2007, 53, 553–574. [Google Scholar] [CrossRef]
  91. Abdelhafez, A.A.; Metwalley, S.M.; Abbas, H.H. Irrigation: Water Resources, Types and Common Problems in Egypt. In Technological and Modern Irrigation Environment in Egypt; Springer: Berlin, Germany, 2020; pp. 15–34. [Google Scholar]
  92. Singh, A. Salinization and drainage problems of agricultural land. Irrig. Drain. 2020. [Google Scholar] [CrossRef]
  93. Hammam, A.A.; Mohamed, S.E. Mapping soil salinity in the East Nile Delta using several methodological approaches of salinity assessment. Egypt J. Remote Sens. Space Sci. 2020, 23, 125–131. [Google Scholar] [CrossRef]
  94. Phogat, V.; Mallants, D.; Cox, J.W.; Šimůnek, J.; Oliver, D.P.; Pitt, T.; Petrie, P.R. Impact of long-term recycled water irrigation on crop yield and soil chemical properties. Agric. Water Manag. 2020, 237, 106167. [Google Scholar] [CrossRef]
  95. Ullah, S.; Ai, C.; Huang, S.; Song, D.; Abbas, T.; Zhang, J.; He, P. Substituting ecological intensification of agriculture for conventional agricultural practices increased yield and decreased nitrogen losses in North China. Appl. Soil Ecol. 2020, 147, 103395. [Google Scholar] [CrossRef]
  96. Cerdà, A.; Rodrigo-Comino, J.; Yakupoğlu, T.; Dindaroğlu, T.; Terol, E.; Mora-Navarro, G.; Arabameri, A.; Radziemska, M.; Novara, A.; Kavian, A.; et al. Tillage Versus No-Tillage. Soil Properties and Hydrology in an Organic Persimmon Farm in Eastern Iberian Peninsula. Water 2020, 12, 1539. [Google Scholar] [CrossRef]
  97. Abbas, A.M.; Abd-Elmabod, S.K.; El-Ashry, S.M.; Soliman, W.S.; El-Tayeh, N.; Castillo, J.M. Capability of the invasive tree Prosopis glandulosa Torr. to remediate soil treated with sewage sludge. Sustainability 2019, 11, 2711. [Google Scholar] [CrossRef] [Green Version]
  98. Abd-Elmabod, S.K.; Muñoz-Rojas, M.; Jordán, A.; Anaya-Romero, M.; Phillips, J.D.; Laurence, J.; Zhang, Z.; Pereira, P.; Fleskens, L.; van der Ploeg, M.; et al. Climate change impacts on agricultural suitability and yield reduction in a Mediterranean region. Geoderma 2020, 374, 114453. [Google Scholar] [CrossRef]
  99. Hendawy, E.A.; Belal, A.; Mohamed, E.S.; Elfadaly, A.; Murgante, B.; Aldosari, A.; Lasaponara, R. The prediction and assessment of the impacts of soil sealing on agricultural land in the North Nile Delta (Egypt) using satellite data and GIS modeling. Sustainability 2019, 11, 4662. [Google Scholar] [CrossRef] [Green Version]
  100. Abd-Elmabod, S.K.; Ali, R.R.; Anaya-Romero, M.; de la Rosa, D. Evaluating soil contamination risks by using MicroLEIS DSS in El-Fayoum Province, Egypt. In Proceedings of the 2010 2nd International Conference on Chemical, Biological and Environmental Engineering, Cairo, Egypt, 2–4 November 2010; pp. 1–5. [Google Scholar]
  101. Muzammil, M.; Zahid, A.; Breuer, L. Water Resources Management Strategies for Irrigated Agriculture in the Indus Basin of Pakistan. Water 2020, 12, 1429. [Google Scholar] [CrossRef]
  102. Abd-Elmabod, S.K.; Jordán, A.; Fleskens, L.; Phillips, J.D.; Muñoz-Rojas, M.; Van der Ploeg, M.; Anaya-Romero, M.; De la Rosa, D. Modelling agricultural suitability along soil transects under current conditions and improved scenario of soil factors. In Soil Mapping and Process Modeling for Sustainable Land Use Management; Elsevier: Amsterdam, The Netherland, 2017; pp. 193–219. ISBN 9780128052006. [Google Scholar]
  103. Mohamed, E.S.; Belal, A.; Shalaby, A. Impacts of soil sealing on potential agriculture in Egypt using remote sensing and GIS techniques. Eurasian Soil Sci. 2015, 48, 1159–1169. [Google Scholar] [CrossRef]
  104. Saleh, A.M.; Belal, A.B.; Mohamed, E.S. Land resources assessment of El-Galaba basin, South Egypt for the potentiality of agriculture expansion using remote sensing and GIS techniques. Egypt. J. Remote Sens. Space Sci. 2015, 18, S19–S30. [Google Scholar] [CrossRef] [Green Version]
  105. Hogda, K.A.; Karlsen, S.R.; Solheim, I. Climatic change impact on growing season in Fennoscandia studied by a time series of NOAA AVHRR NDVI data. In Proceedings of the IEEE 2001 International Geoscience and Remote Sensing Symposium, Sydney, Australia, 9–13 July 2001; IEEE: Sydney, Ausralia; Volume 3, pp. 1338–1340. [Google Scholar]
  106. El-Shirbeny, M.A.; Mohamed, E.S.; Negm, A. Estimation of Crops Water Consumptions Using Remote Sensing with Case Studies from Egypt. In Conventional Water Resources and Agriculture in Egypt; Springer: Cham, Switzerland, 2018; pp. 451–469. [Google Scholar]
  107. Mansour, H.A.; Abd-Elmabod, S.K.; AbdelGawad, S. The impact of sub-surface drip irrigation and different water deficit treatments on the spatial distribution of soil moisture and salinity. Plant. Arch. 2019, 2, 384–392. [Google Scholar]
  108. Dutta, S.; Dwivedi, A.; Kumar, M.S. Use of water quality index and multivariate statistical techniques for the assessment of spatial variations in water quality of a small river. Environ. Monito. Assess. 2018, 190, 718. [Google Scholar] [CrossRef]
  109. Elshemy, M.; Meon, G. Climate change impacts on water quality indices of the southern part of Aswan High Dam reservoir, Lake Nubia. In Proceedings of the Fifteenth International Water Technology Conference, Alexandria, Egypt, 31 March–2 April 2011; p. 17. [Google Scholar]
  110. MWRI. Water for the Future, National Water Resources Plan. for Egypt–2017; MWRI: Pittsburgh, PA, USA, 2005. [Google Scholar]
  111. Heikal, M.T.; El-Sherbini, A.T.; Salem, A.; Yousry, M.M. Temporal and spatial variation of water quality parameters along the River Nile. In Proceedings of the NAWQAM Final Conference on Egypt Paradigm in Integrated Water Resources Management, Sharm El Sheikh, Egypt, 17–19 February 2007; p. 21. [Google Scholar]
  112. Shi, R.; Zhao, J.; Shi, W.; Song, S.; Wang, C. Comprehensive Assessment of Water Quality and Pollution Source Apportionment in Wuliangsuhai Lake, Inner Mongolia, China. Int. J. Environ. Res. Public Health 2020, 17, 5054. [Google Scholar] [CrossRef]
  113. Yurtseven, I. Evaluation of some streamwater quality parameters using with Principal Component Analysis (PCA) in mature Pinus sylvestris L. forest ecosystems. Kast. Univ. J. For. Fac. 2017, 17, 238–246. [Google Scholar]
  114. Okonofua, E.S.; Nwadialo, I.B.; Ekun, M.O. Modeling Ikpoba River Water Quality Using Principal Component Analysis (Pca) Method and Water Quality Index. J. Civ. Eng. Sci. Technol. 2019, 10, 59–74. [Google Scholar] [CrossRef] [Green Version]
  115. Garcia, C.A.B.; Garcia, H.L.; Mendonça, M.C.S.; da Silva, A.F.; Alves, J.D.P.H.; da Costa, S.S.L.; Silva, I.S. Assessment of water quality using principal component analysis: A case study of the açude da Macela–Sergipe–Brazil. Water Resour. 2017, 7, 8. [Google Scholar]
  116. Hao, R.X.; Li, S.M.; Li, J.B.; Zhang, Q.K.; Liu, F. Water Quality Assessment for Wastewater Reclamation Using Principal Component Analysis. J. Environ. Inform. 2013, 21, 45–54. [Google Scholar] [CrossRef]
  117. Ganiyu, S.A.; Badmus, B.S.; Olurin, O.T.; Ojekunle, Z.O. Evaluation of seasonal variation of water quality using multivariate statistical analysis and irrigation parameter indices in Ajakanga area, Ibadan, Nigeria. Appl. Water Sci. 2018, 8, 35. [Google Scholar] [CrossRef] [Green Version]
  118. Said, M.E.S.; Ali, A.M.; Borin, M.; Abd-Elmabod, S.K.; Aldosari, A.A.; Khalil, M.M.N.; Abdel-Fattah, M.K. On the Use of Multivariate Analysis and Land Evaluation for Potential Agricultural Development of the Northwestern Coast of Egypt. Agronomy 2020, 10, 1318. [Google Scholar]
Figure 1. Location of the Bahr Mouise canal in the El-Sharkia Governorate, Egypt ((a) and (b)), as well as the six sampling sites (c).
Water 12 02537 g001
Figure 2. The main land cover land use (LCLU) classes around the Bahr Mouise canal.
Water 12 02537 g002
Figure 3. The variation in the normalized difference vegetation index (NDVI) over eight months during 2019.
Water 12 02537 g003
Figure 4. Volumetric climate graph of the representative metrological station for the studied area (A). Governorate by crop season (B). Tm: mean temperature in °C; ET0: potential evapotranspiration in mm; P: precipitation in mm; and Ari: aridity index. Pie chart shows the distribution of water irrigation quantity in the El-Sharkia.
Water 12 02537 g004
Figure 5. Spatiotemporal analysis of the chemical water composition—monthly (A) and at each sampling site (B).
Water 12 02537 g005
Figure 6. Spatiotemporal assessment of the Bahr Mouise canal water using traditional criteria—monthly (A) and spatially in each sampling site (B). RSBC: residual sodium bicarbonate; SSP: soluble sodium percentage; SAR: sodium absorption ratio; PI: permeability index; SCAR: sodium-to-calcium activity ratio; KR: Kelly ratio; MAR: magnesium absorption ratio; and RSC: residual sodium carbonate.
Water 12 02537 g006
Figure 7. Temporal (A) and spatial variations (B) in the irrigation water quality index (IWQI) of the Bahr the Mouise canal.
Water 12 02537 g007
Figure 8. Classification of water quality based on the principal component analysis (PCA) and agglomerative hierarchical clustering (AHC) techniques. (A) The relationships between water chemical parameters, (B) a dendrogram for clustering chemical properties, (C) a dendrogram for clustering monthly variation, and (D) the final classification of water quality.
Water 12 02537 g008
Table 1. Summarization of the principal component analysis (PCA).
PC1PC2PC3PC1PC2PC3
Eigenvalue4.991.841.30
Variability (%)55.4220.4914.49
Cumulative %55.4275.9190.39
Factor loadingsComponent Score Coefficient
X1 (pH)0.460.01−0.700.0920.0170.539
X2 (ECiw)0.950.280.100.1910.155−0.072
X3 (Ca2+)0.95−0.140.190.192−0.070−0.142
X4 (Mg2+)0.85−0.48−0.020.172−0.2480.029
X5 (Na+)0.500.850.030.0990.459−0.026
X6 (K+)0.89−0.220.020.178−0.139−0.021
X7 (HCO3)0.76−0.57−0.130.156−0.2980.103
X8 (Cl)0.640.360.630.1280.194−0.484
X9 (SO42−)0.450.54−0.590.0870.2970.449
Table 2. Component score of different months.
MonthPC1PC2PC3PC Comprehensive Score
January−2.970.17−0.06−1.62
February−3.10.490.2−1.59
March−0.96−0.37−0.42−0.67
April0.04−2.65−0.56−0.6
May3.3−2.770.961.4
June3.090.9−2.71.5
July1.41.420.541.15
August2.621.492.422.11
September0.251.02−0.570.27
October0.860.87−0.370.6
November−2.59−0.260.54−1.41
December−1.95−0.310.01−1.14

