Article

Damming Induced Natural Attenuation of Hydrothermal Waters by Runoff Freshwater Dilution and Sediment Biogeochemical Transformations (Sochagota Lake, Colombia)

by
Gabriel Ricardo Cifuentes
1,
Rosario Jiménez-Espinosa
2,*,
Claudia Patricia Quevedo
1 and
Juan Jiménez-Millán
2
1
Water Resources Research Group, Faculty of Science and Engineering, Campus Tunja, University of Boyacá, Tunja 15003, Colombia
2
Department of Geology and CEACTEMA, Campus Las Lagunillas, University of Jaén, 23071 Jaén, Spain
*
Author to whom correspondence should be addressed.
Submission received: 1 November 2021 / Revised: 22 November 2021 / Accepted: 1 December 2021 / Published: 4 December 2021
(This article belongs to the Special Issue Water Quality Changes of Lakes and Rivers)

Abstract

:
The volcanic area of the Paipa system (Boyacá, Colombia) contains a magmatic heat source and deep fractures that help the flow of hot and highly mineralized waters, which are further combined with cold superficial inputs. This mixed water recharges the Salitre River and downstream feeding Sochagota Lake. The incoming water can contribute to substantial increases in hydrothermal SO42−-Na water in the water of the Salitre River basin area, raising the salinity. An additional hydrogeochemical process occurs in the mix with cold Fe-rich water from alluvial and surficial aquifers. This salinized Fe-rich water feeds the Sochagota Lake, although the impact of freshwaters from rain on the hydrochemistry of the Sochagota Lake is significant. A series of hydrogeochemical, biogeochemical, and mineralogical processes occur inside the lake. The aim of this work was to study the influence of damming in the Sochagota Lake, which acts as a natural attenuation of contaminants such as high concentrations of metals and salty elements coming from the Salitre River. Damming in the Sochagota Lake is considered to be an effective strategy for attenuating highly mineralized waters. The concentrations of dissolved elements were attenuated significantly. Dilution by rainfall runoff and precipitation of iron sulfides mediated by sulfate-reducing bacteria in deposits rich in organic material were the main processes involved in the attenuation of concentrations of SO42−, Fe, As Cu, and Co in the lake water. Furthermore, the K-consuming illitization processes occurring in the sediments could favor the decrease in K and Al.

1. Introduction

Geological ambiances with hydrothermal activity are a font of liquids that deliver and transfer metals and other elements. Some of the elements found in hydrothermal liquids (e.g., Fe, Pb, Zn, S and As) can induce harmful effects on the environment, thus it is essential to determine their behavior to identify probable environmental impacts (e.g., [1]). These elements can be added to geothermal solutions from the igneous gasses and the water–rock interaction, producing salty fluids with important metal contents [2,3,4]. Saline hydrothermal solutions might be a significant source of iron and trace-element water for streams and lakes in geothermal areas. Damming reservoirs is frequently considered as an operative approach for managing dissolved pollutants transported by rivers. Dams can be utilized to monitor the water properties by controlling contaminants from anthropogenic activities (e.g., [5]) as well as from natural processes. Moreover, barriers storing water are valuable instruments for local river management and offer methods for the control and administration of water resources [6]. However, the hydrologically limited environment produced by dams could induce eutrophication processes (e.g., [7,8]), producing organic matter-rich sediments that can interact with stored waters. Significant microorganism communities associated with the organic matter decay (such as sulfate-reducing bacteria) are present in these sediments and are important factors in the immobilization and removal of S and other related elements [9,10]. The fate of elements in these aquatic systems depends on many biogeochemical processes that control their precipitation, adsorption, desorption, and transport [11,12,13,14]. In order to understand the distribution of elements in these reservoirs and the effectiveness of the damming strategy it is necessary to characterize the critical processes controlling the destiny of elements in the ponds, and the interrelation of these biogeochemical processes in a natural system [11,15].
Ref. [16] indicates that two principal dams control the discharge of the upper Chicamocha River basin, namely, the La Playa dam and the Sochagota Lake dam. These barriers stock water for several requirements, such as ranch buildings, farming, the leisure industry, and manufacturing, and their reservoirs receive human activity inputs from ranch actions and sewage water as well as a contribution from geothermal waters that yield salinized waters, important eutrophication and sediments enriched in organic matter. Ref. [17] studied the factors controlling the heavy metal pollution of waters and deposits from the La Playa dam. The present study focuses on the other significant dam of the region, the Sochagota Lake. The lake is placed in a subtropical mountain region with an oceanic climate, located in the Andean geothermal Paipa volcanic area. Refs. [10,18] revealed that these geothermal structures provided remarkable magmatic water contributions of sulfur to the waters of the Sochagota Lake. We aimed to evaluate the effectiveness of damming for improving water quality by identifying the water sources and the interaction processes involved. Despite the importance of such processes, studies of this type are lacking.

2. Materials and Methods
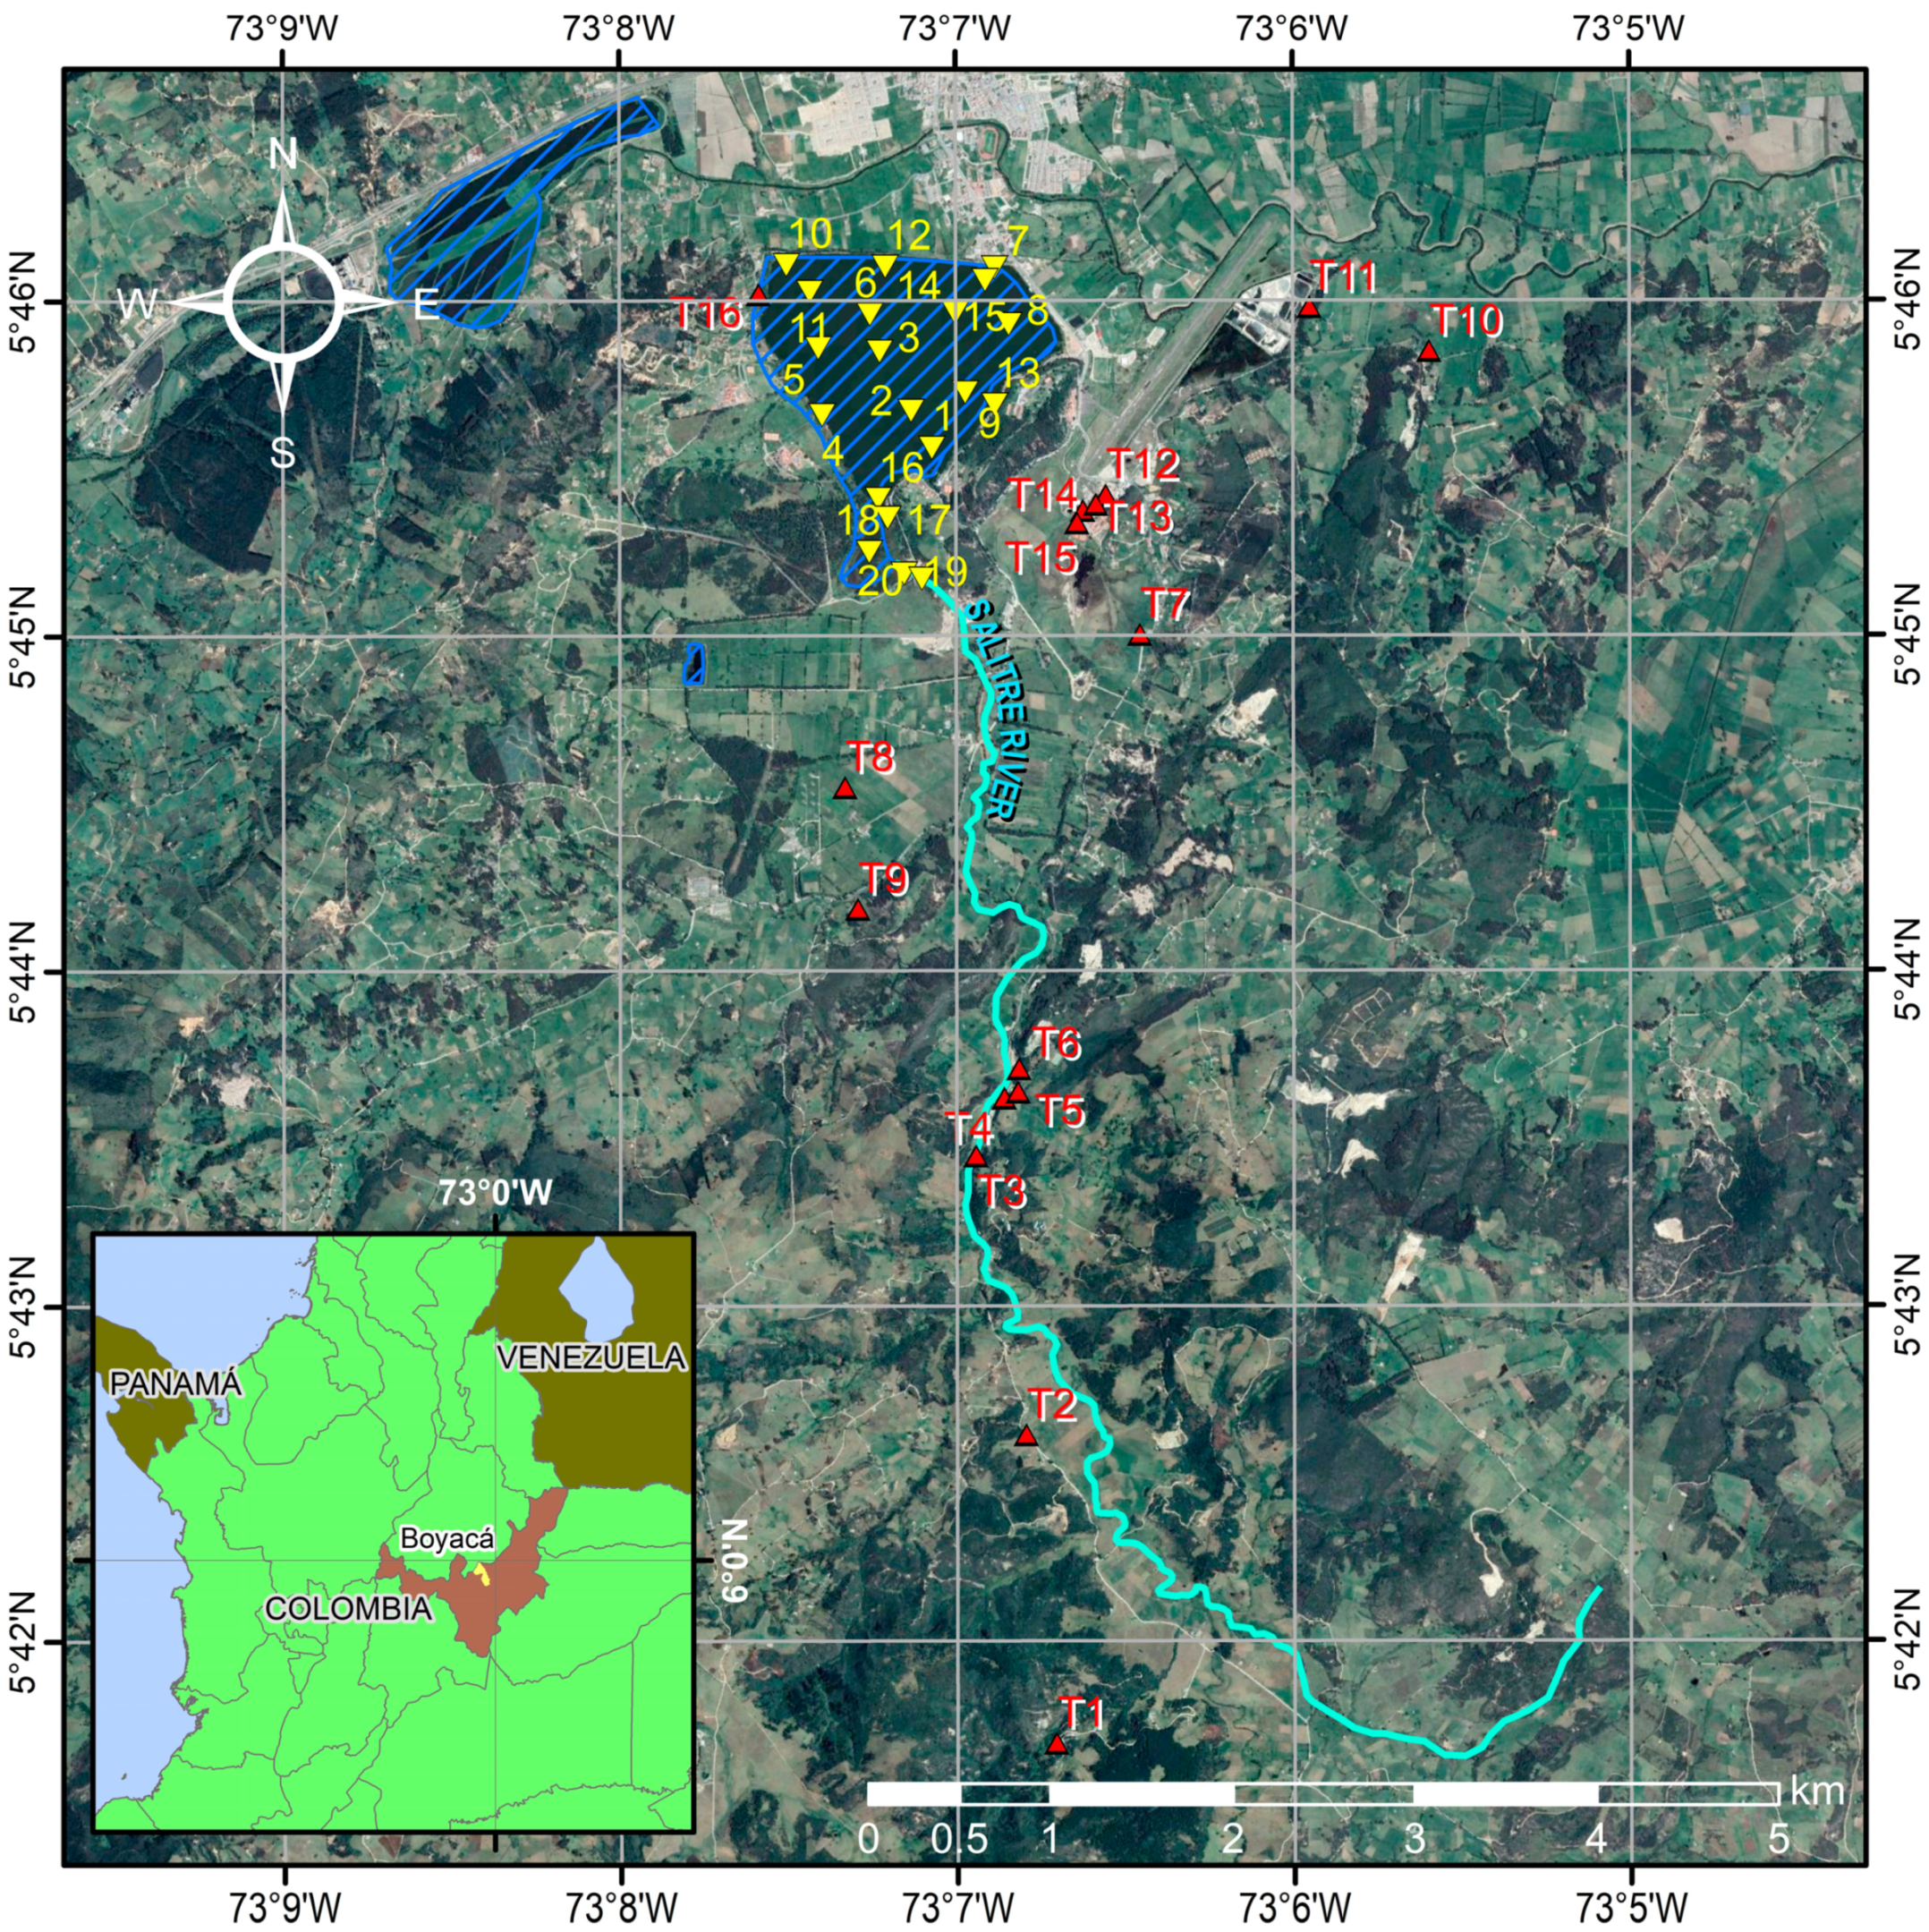
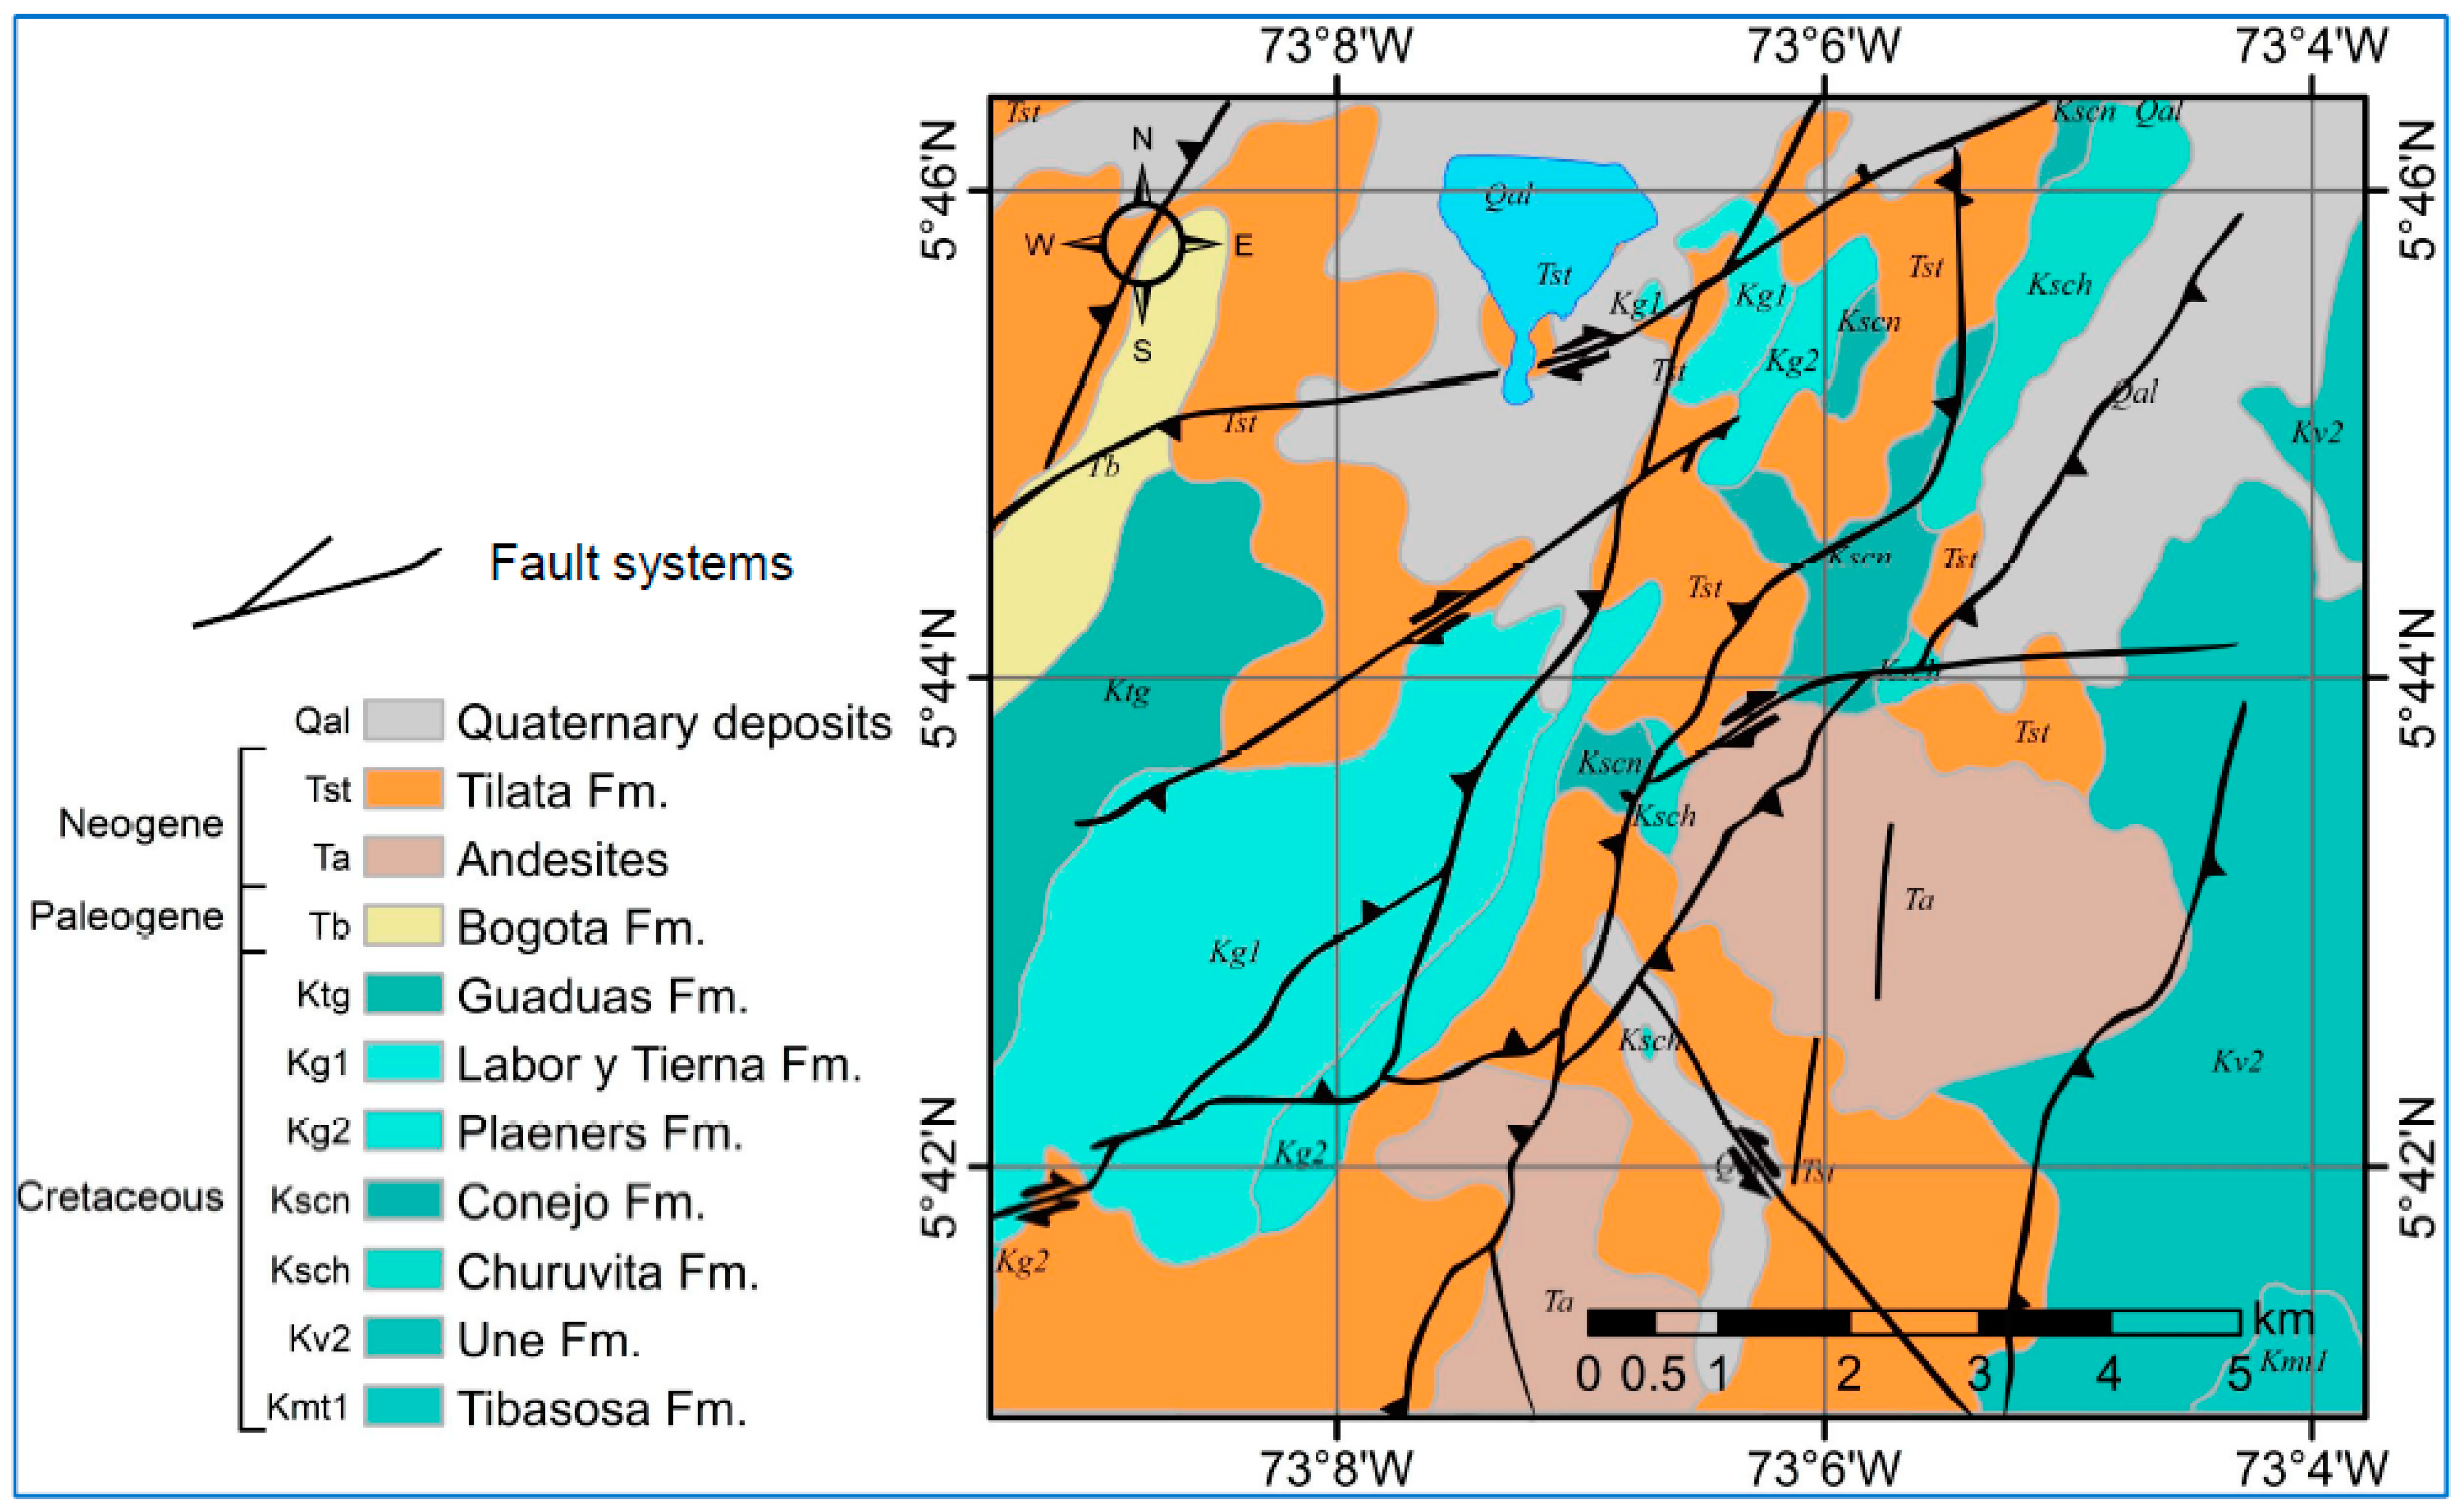
2.1. Study Area

The Sochagota Lake is an artificial pool utilized for leisure purposes constructed on an earlier natural wetland. It is situated in an upland (height 2496 m) of the Department of Boyacá in the Paipa province (Colombia), extending over 1.8 km2 (Figure 1). The greatest depth of the lake is around 3.2 m. A tributary of the Chicamocha River, the Salitre River, feeds the lake from the south.
The province of Paipa presents an average annual temperature of 14.4 °C. The rainfall is well distributed throughout the year, with an average precipitation of 911 mm/year. The climate is classified as subtropical highland oceanic (Cfb by the Köppen system).
Geologically, the study zone is in the principal Andean geothermal system in Colombia, the Paipa volcanic region in which the hydrothermal activities associated with these volcanoes can be observed [19]. Siliceous sedimentary rocks (Cretaceous) were intruded on by different volcanic rocks (Figure 2). In this area, there is an absence of any kind of evaporitic sedimentary deposits. The adjacent volcanic structure is the Paipa volcano [20] outcropping in the southern area of the Sochagota Lake, which appears to be composed of Pliocene–Pleistocene pyroclastic alkaline rhyolites and trachyandesites rocks. A collapsed caldera (3 km wide) with numerous hydrothermal vents, promoted by important fractures, controls the rise of hot flow fluids and cold shallow waters through several processes of mixing, producing sodium–sulfate water facies. These waters flow through the Salitre River basin and are mixed with the lake and rainwater in the Sochagota Lake [10,18].
The conceptual model of the Paipa geothermal system [21,22] considers that the heat source is magmatic and related to the Paipa volcano. The relationship between the geothermal system and the magmatic body is derived from their proximity. The main reservoir of water is located in the old volcanic caldera formed at the end of the first eruptive epoch; in addition, a secondary reservoir relates to the quaternary sedimentary cover. The circulation of hot spring water occurs through faults (Figure 2). The discharge zone is structurally controlled, whereby hot fluids rise to the surface preferentially through fault-intersection zones. The primary recharge zone by infiltration is located in the southern mountains, at approximately 3500 m altitude; however, there is a local recharge area around the volcanic caldera.
Ref. [10] indicates that organic matter-poor sediments (TOC < 0.7%), with quartz and kaolinite near the south entrance of the lake (Figure 3a), were enriched in Zr (up to 603 mg/kg) and some major detrital elements (Na, Ti, Al, and Si). Fine-sized clay-rich sediments deposited in the deep zones of the lake (central and northern segments) were characterized by a high content of organic matter (up to 11.10%) and the crystallization of S-bearing minerals, clay mineral mixed layers and illite (Figure 3b). These sediments were enriched in S, Fe, Zn, Rb, Co, K, Cr, Sb, Ni, As, Ba, Cu, Mn, Mg, and Sr. The presence of Fe-sulfide nanoparticles, enriched in heavy metals encrusting microbial cells, and a dominant sulfate-reducing bacteria (SRB) community (Desulfatiglans, Desulfobacterales and Sva0485), suggested that the precipitation of the hydrothermal S and the accumulation of trace elements in the sediments were regulated by SRB activity. The crystallization of S°, barite, and calcite and the good correlations between Ba, Sr, and Ca indicated that previously precipitated sulfide can be oxidized by the activity of a relevant sulfur-oxidizing bacterial community (Thioalkalimicrobium, Sulfurovum, Arcobacter and Sulfurimonas), which could favor the release of the metals.

2.2. Methods

Data Acquisition and Analytical Procedures

In order to analyze the Sochagota Lake water composition, 20 samples were obtained in September of 2017 at different depths: shallow, medium, and deep (Figure 1). Furthermore, 16 samples of mineral and thermal waters from hydrothermal springs were collected in August of 2015 by the Proagua Foundation and provided by Corpoboyaca (Regional Autonomous Corporation of Boyacá) in 2016, with the purpose of establishing the effect of these waters on the lake-water composition. At each site in the lake, water samples were collected in different clean high-density polyethylene bottles (HDPE), rinsed several times with the lake water to be sampled. One of the sample bottles was acidified to pH < 2.0 with nitric acid (HNO3), ACS reagent, at a purity of 70%, to stabilize the trace metals. The tubes were filled using sterilized syringes, filtered by 0.45 µm pore size filters, then acidified. In a different bottle, we kept a non-acidified sample, used for cations and anions analysis. These water samples were carried in iceboxes to the laboratory and maintained at 4 °C for the forthcoming analysis. Analyses were carried out in various laboratories. Major elements were determined in an Ion Chromatograph model Metrohm 850 Professional (Scientific Instrumentation Centre, University of Jaén, Jaén, Spain) with relative errors of analysis ±1% for major anions and cations. This Ion Chromatograph Professional IC 850–919 IC Autosampler Plus of Metrohm with ultrafiltration cell has a detection limit of this equipment of 0.1 mg/L. It uses MagIC Net™ software, which allows for the verification, recording, evaluation, and monitoring of data. The analysis of metals and trace elements was performed by ICP-mass spectrometer Agilent Model 7500, with errors of <5% RSD (Scientific Instrumentation Centre, University of Jaén). The Agilent—7500 is equipped with ChemStation™ software for the development of analytical methods and the treatment of data. This service uses Multielement Calibration Standard-2a from Agilent Technologies. The lowest concentration of the standards used for the calibration of the equipment was 0.1 ppb. The analysis of metals and trace elements was performed using ICP-mass spectrometer Agilent Model 7500, the errors being <5% RSD (Scientific Instrumentation Centre, University of Jaén). We used the AquaChem software package (Schlumberger Water Services), and SPSS and Statgraphics Statistics software to analyze hydrochemical data. Easy_Quim [23] was used for the graphical representation of Piper, Shöeller–Berkaloff, and salinity diagrams.
Different physico-chemical parameters were determined in situ using a Hanna Instruments multiparameter device (HI 9828), such as electrical conductivity (EC) for a standard temperature of 25 °C (µS/cm ±1 µS/cm), the total dissolved solids (TDS, ppm ±1 ppm), pH (±0.02 pH), temperature (T, °C, ±0.15 °C). Alkalinity was obtained by volumetric determination using the titrator 848 Titrino plus of Metrohm (Department of Geology, University of Jaén) and the amount of HCl consumed corresponds to the carbonate–bicarbonate concentrations.
Moreover, a sediment sampling survey for water was carried out in the lake at the same points. These samples were examined under SEM, using back-scattered electron (BSE) imaging and an energy-dispersive X-ray (EDX) analysis in order to obtain textural and chemical data of the mineral phases using a Carl Zeiss model MERLIN. Moreover, the mineral composition of these samples was examined by X-ray diffraction (XRD), using Cu-Kα radiation at 35 kV and 34 mA, with a scan speed of 6° 2θ min−1, in a Siemens D-5000 diffractometer. These analyses were carried out at the Scientific Instrumentation Centre of the University of Jaén. To ascertain the chemical characterization at the nanometer scale of clay minerals, samples were prepared for a transmission electron microscopy (TEM) study. Samples were prepared using a Cu grid surface, coated in a perforated formvar resin from a dispersion of finely ground sample particles, in alcohol or distilled water. The monomineralic character of each grain is proven by its electron diffraction pattern, confirming the existence of a single network and, therefore, a single crystalline phase. The TEM data were obtained using the Philips CM20 (STEM) microscope, operated at 200 kV from the Scientific Instrumentation Centre (C.I.C.) of the University of Granada. Quantitative analyses (AEM) of particles were obtained in STEM mode with an EDAX microanalysis system in the Philips CM20. The counting time selected was 100 s except for in the case of Na and K, which were analyzed for 15 s to minimize alkali-loss problems, as shorter counting times improve reproducibility for K and Na [24].
We used polished sections to obtain back-scattered electron (BSE) images and tridimensional sediment fragments to acquire secondary electron (SE) images in a field emission scanning electron microscope (FESEM, Merlin Carl Zeiss of the CICT of the University of Jaén, Jaén, Spain). Polished samples used for the BSE images were previously impregnated under vacuum with a polyester resin. BSE images were acquired at 15 kV with a working distance of 8 mm using an AsB detector, whereas SE images were acquired at 15 kV using conventional and In-Lens detectors. These images provide the information for a textural and microchemical characterization.

3. Results

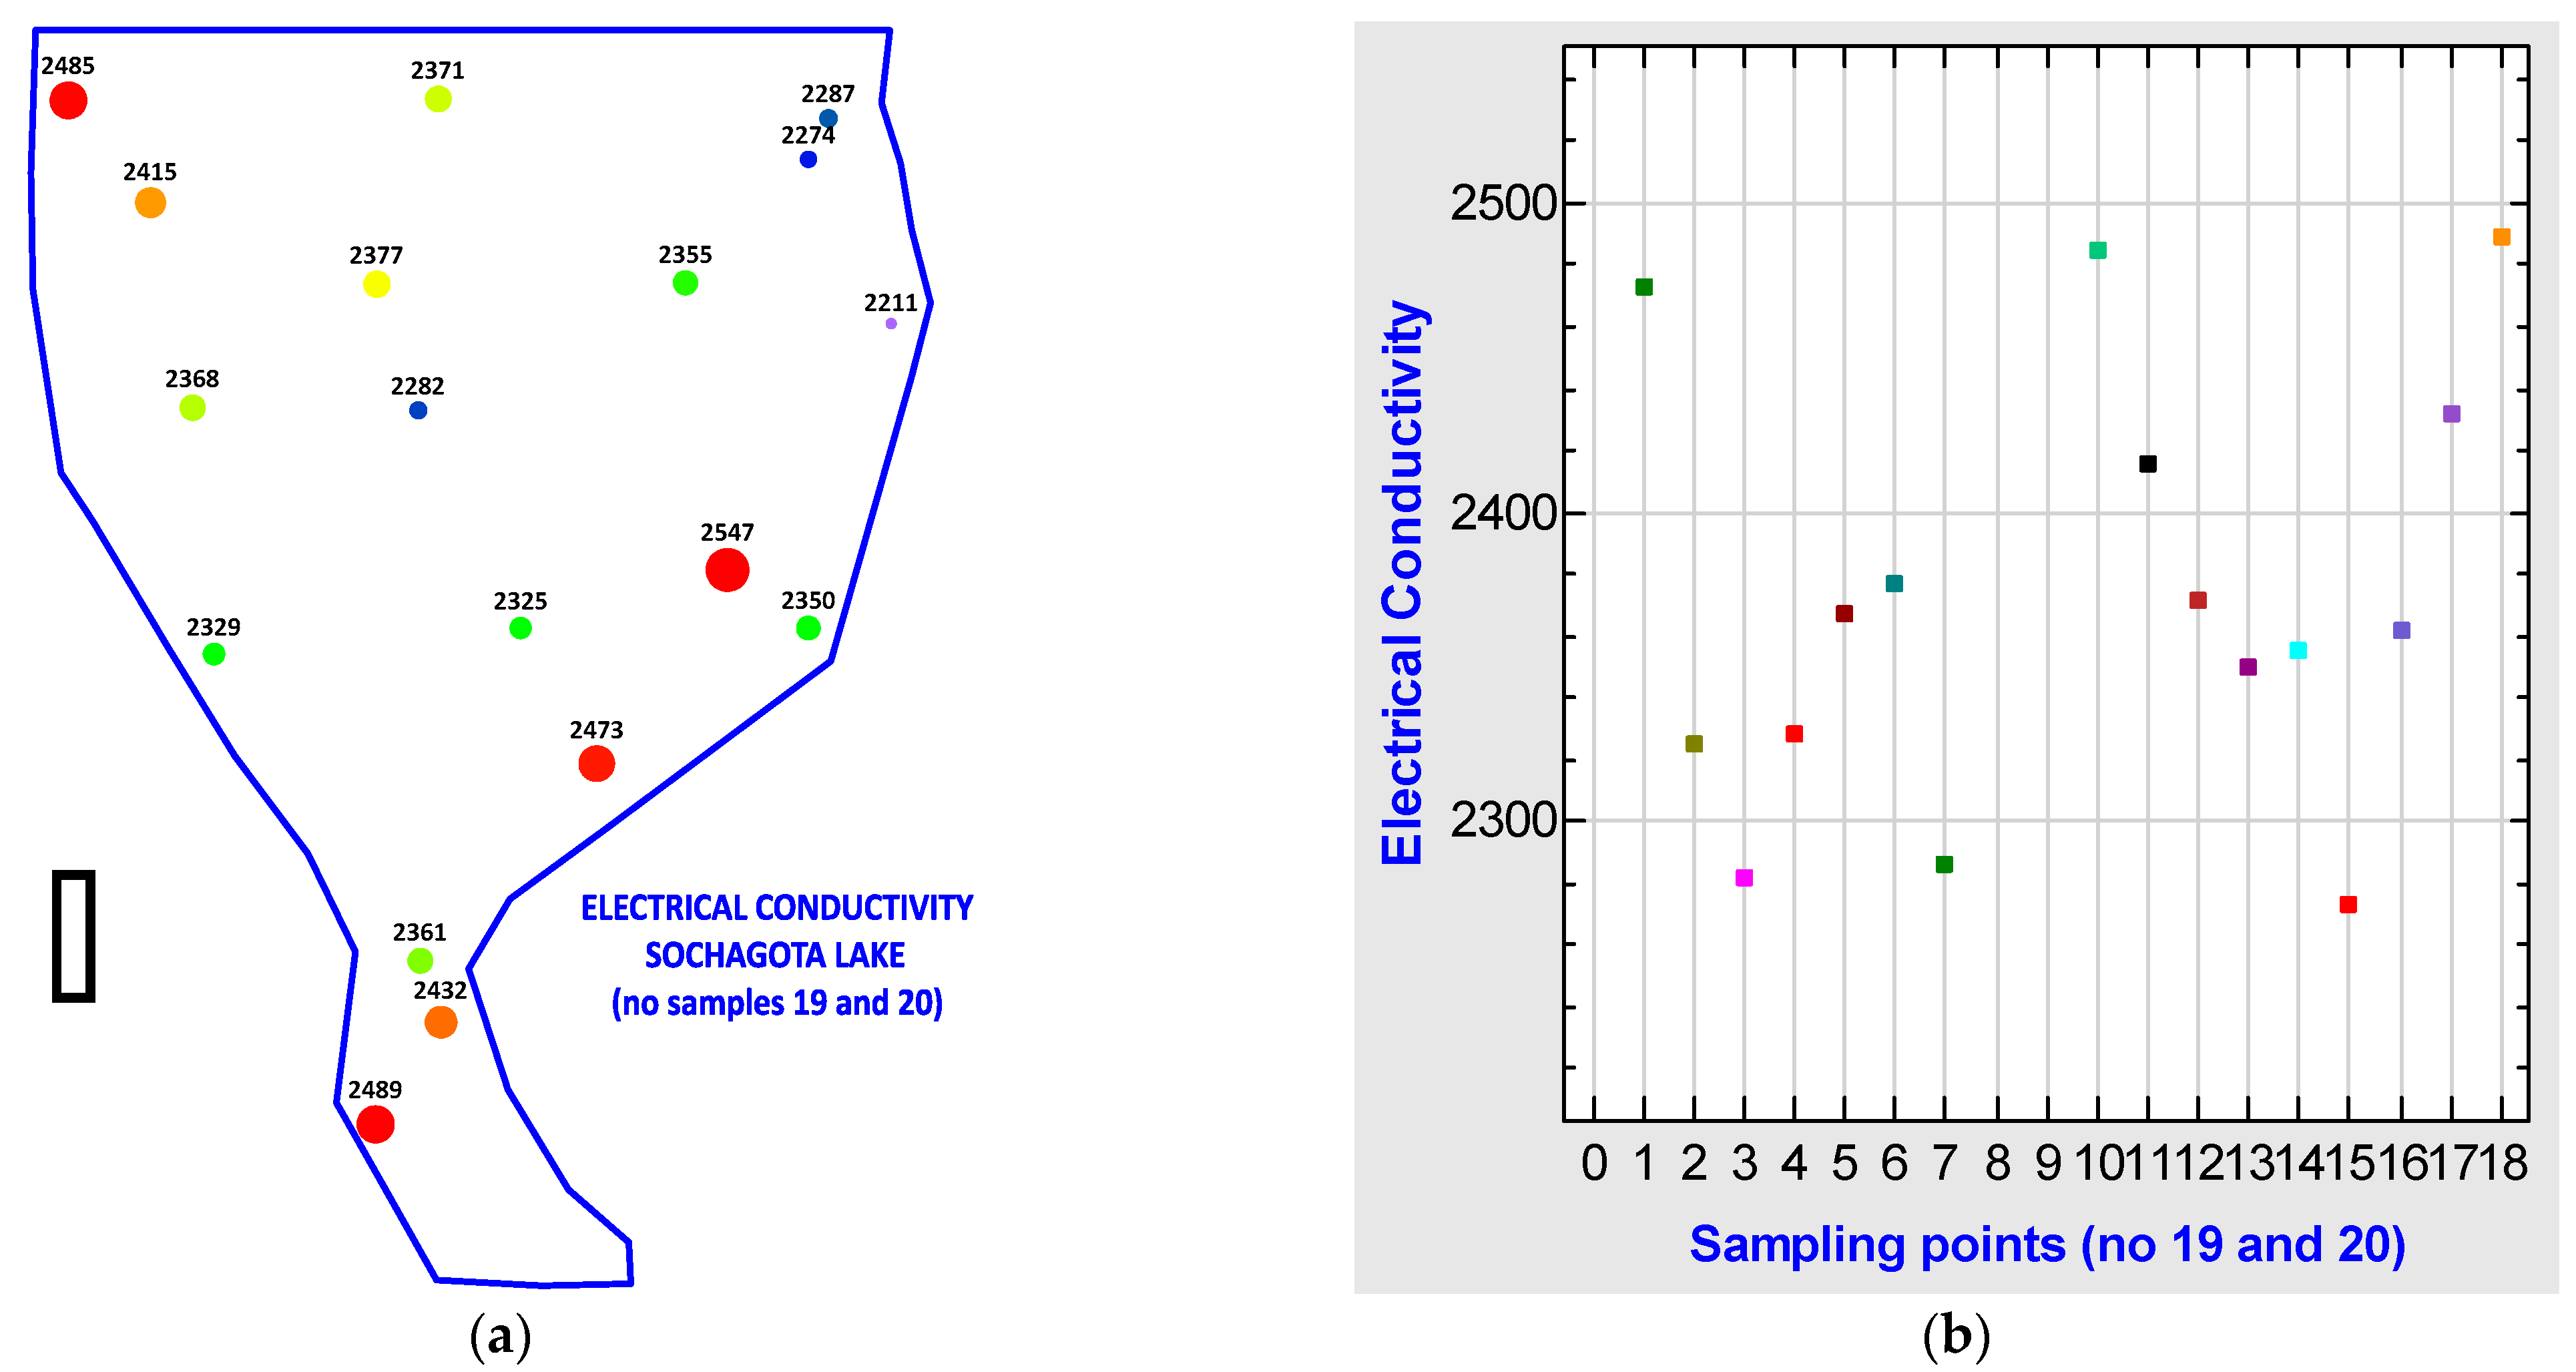
3.1. Physicochemical Properties of the Sochagota Lake Waters

As previously mentioned, water-data acquisition was performed by obtaining three different samples in a vertical line for each sampling point—deep, medium, and shallow (namely, B, M, and S for sample labels). Nonetheless, no significant variations were found in the three different measurements, indicating that depth is not an important parameter to control the geochemical behavior of the lake, because of its shallow depth during the sampling period. This behavior led us to consider data from the middle part for the calculations when possible (Table 1). Additionally, in order to better visualize the large data set, a descriptive statistical analysis, of minimum, maximum, average, and standard deviation, was performed (Table 2).
Analyzing the data globally illustrated the difference between samples from the southern area (19 and 20) and those from the rest of the lake. Samples 19 and 20 had a very high contents of most variables, such as electrical conductivity (E.C.), Cl, SO42−, Na+, K+ and some metals. The average value for E.C. was 2925.4 µS/cm, which was high, but the minimum value was 2211 µS/cm and the maximum 8651.7 µS/cm. In order to appreciate the spatial variation of E.C. in the lake, a plot of values was created, excluding samples 19 and 20 (Figure 4). In this figure, it is possible to observe the trend of the dilution of saline waters through the lake in the directions SW to NE and NW. Only in the center of the lake did the salinity contents present low values. This behavior was similar for most of the variables (Table 2), indicating the high influence at the main entrance to the lake of very highly mineralized water, which becomes geochemically changed inside the lake. For the most part, the average values of lake samples were higher than the recommendations of the World Health Organization and Colombian Drinking Water Legislation stipulate. Total dissolved solids (TDS) showed a similar trend, with high values in the South. For example, there was a considerable difference between the two samples for the southern part of lake 19 and the rest of the samples. The average was 1868.39 mg/L, while maximum values were bigger than 5400 mg/L. According to the World Health Organization, TDS levels of greater than 1000 mg/L for drinking water become significantly unpalatable, and the occurrence of high levels of TDS might also be unsuitable to users because of high scaling in water pipes and household appliances [25].
A health concern was not apparent with regard to pH values, but they were found to be highly important for the geochemical processes in natural waters; their values ranged from 8.8 to 9.2, indicating an alkaline affinity of the medium. The majority of the remaining ions were clearly above the recommended levels for drinking water. The average concentrations of cations followed the order of Na+ >> K+ > Ca2+ > Mg2+, Na+, being visibly considerably higher than the other cations by one order of magnitude. In relation to anions, the order was SO42− > Cl > HCO3, considering that SO42− was the most relevant anion in this water.
The Schoeller-Berkalof plot is a semi-logarithmic plot that represents major ion analyses in milliequivalents per liter (meq/L) and helps to demonstrate different hydrochemical water types on the same plot. This plot brings the advantage of displaying the actual parameter concentrations. Furthermore, it is a good indicator of values over potability limits. In this work, the Shöeller-Berkalov diagram showed high concentrations of elements such as Na+, SO42− and Cl, clearly indicating the non-drinkability of this water (red crosses in Figure 5a). Moreover, this water was not found to be suitable for irrigation because of its extreme salinity. In relation to this salinity, a way to show a possible sodium hazard when highly salinized water is used for irrigation is specified by the Sodium Adsorption Ratio, SAR [26]:
S A R = N a + C a 2 + + M g 2 + 2
The adverse effect of sodicity in water is related to its salinity. There is a risk of both reduced infiltration and of weakening soil structure if the water presents moderate to high SAR, but low salinity (EC). There will be no reduction in the amount of water infiltration with moderate to high salinity (EC). The main hazard regarding water penetration concerns soil-sodicity growths that occur due to sodic water, and the soil dissolves as a result in a rainy season. The guidelines for interpreting water SAR values are: <3: no problems as the water is non-sodic; 3 to 6: medium risk to soil structure and penetration on clayey soils if EC is <1.5; >6: increasing effect on all soils at low to moderate salinity and starts to reduce growth of most crop and pasture plants; and, >9: severe risk of increasing soil sodicity on most soils [27]. High sodium concentrations in water modify the permeability of the soil and causes infiltration complications, because Na+ in soils can substitute for Ca2+ and Mg2+ adsorbed on the soil clays and generate a dispersion of soil particles. In the Sochagota Lake, SAR values were found to be around or higher than 20. Samples 19 and 20 were 66 and 70, respectively, and were omitted from the conductivity vs. SAR salinity diagram in order to present the rest of the samples more clearly, and to avoid the screen effect caused by these high values (Figure 5b).
Minor elements presented significant values across the lake, but were more remarkable in samples 19 and 20, especially F, Mn, Fe or As. Additionally, heavy metal concentrations fluctuated depending on the water sampling position. Waters from the south entrance of the lake showed higher levels of heavy metals (Table 1 and Table 2) following a declining order of Fe >> Al > Mn > Zn > Cu > Ni. The high content of Fe in the lake was noteworthy. In contrast, lower average values of these elements in the waters from the central and northern sections were observed.
In a Piper plot, the major ions are plotted on separate cation (typically: Na+K, Ca, and Mg) and anion (typically: Cl, HCO3+CO3, and SO4) ternary diagrams in terms of percent milliequivalents, in two triangles along the base. The total cations in meq/l, and the total anions in meq/l, are set as equal to 100%. The data points in the two triangles are then projected onto the diamond grid. The projection reveals certain useful properties of the total ion relationships. Every sample is represented by three data points; one in each triangle and one in the projection diamond grid. The main purpose of Piper plots is to show clustering of samples and to infer hydrochemical facies of samples or clusters of samples. In this study, a Piper plot was conducted in order to detect hydrochemical patterns of major ion composition and water families (Figure 6). In relation to cations, a full concentration was detected around the area of Na+K, clearly indicating sodium–potassium type water; concerning anions, most samples were plotted in the sulfate zone with some influence of chlorides and few bicarbonates, showing that sulfate-type water was predominant. Consequently, the principal hydrochemical family of waters was found to be SO42−-(Cl)–Na+-(K). This was in agreement with the percentages of SO42− and Na+ and the rest of constituents observed in the analysis.
The saline nature of the wetland and high levels of minor and metals elements could be attributed, in the first instance, to the mineralized thermomineral waters that infiltrate the lake system through the Salitre stream entrance, as will be shown in the next chapter of the present study [21,28,29].
In Figure 7 the saturation indices (SIs) are presented for anhydrite, aragonite, calcite, dolomite, fluorite, gypsum, and halite in order to evaluate chemical equilibrium [30,31]. These indices were calculated using AquaChem® 5.1 and based on the next equation:
SI = log (IAP/KT)
IAP: ion activity product; KT: equilibrium constant at a temperature.
This parameter indicates which minerals could precipitate and which ones would dissolve in an aqueous medium due to physical–chemical processes. If the SI shows positive values (SI > 0), it implies the occurrence of processes of mineral oversaturation and precipitation, while negative values for SI (SI < 0) indicate unsaturated water and processes of mineral dissolution. This water was clearly oversaturated with respect to calcite, dolomite, and aragonite for samples from the northern and central portions of the lake; in contrast, in these areas, the remaining minerals were unsaturated, with high values for halite, gypsum and anhydrite. Samples close to the Salitre River presented saturation indices for all minerals < 1, indicating that waters from this part of the lake have a high potential of mineral dissolution for these specified minerals. This implied that, despite the high content of dissolved ions, the lake water does not favor the precipitation of these minerals, as shown in the mineralogical characterization of the lake sediments [10,32]. Furthermore, active biogeochemical processes play an important role in saline lakes and determine the precipitation of bacterial-induced clay mineralization in the sediments of the Sochagota Lake. Neoformed clay minerals (illite and illite–dioctahedral vermiculite mixed layers) were found in the central and north areas of the lake, in deposits with high organic material values [32]. In these organic matter-rich sediments it is common to find S-bearing minerals including mackinawite, pyrite, and elemental sulfur (So) [18].

3.2. Physicochemical Properties of the Hydrothermal Waters

We aimed to characterize the impact of hydrothermal waters from the Paipa magmatic system on the Sochagota Lake. A groundwater-sampling campaign was carried out by Proagua in 2015. Corpoboyacá provided us with a database of 16 samples, from different geothermal springs, and they measured: (i) physicochemical variables; (ii) major elements, and (iii) minor elements: Fe, F, B, and SiO2 (Figure 1 and Table 3). A statistical summary of these data is presented in Table 4.
Two types of springs were differentiated in the Paipa region—one located in the discharge area of Pozo Azul and surroundings (samples T12–15) and sample T3 in La Playa zone, with temperatures of around 40–70 °C, more directly connected to fault systems; and a second group, mainly samples T2, 8, 9 and 11, placed in the northern sector and along the river valley, probably as a result of a water-mixing process in relation to the alluvial aquifer and rain recharge, recognized for its low temperature and high salt content [33].
Cold waters, in general, were found to be related to low mineralization concentrations (minor values of E.C., Cl, SO42−, Na+, K, etc.) and high values of Fe. Otherwise, samples taken in hot springs presented very high values of electrical conductivity (Figure 8). Nevertheless, it is important to point out the high concentrations of Fe that appeared in some of the samples (maximum of 19.2 mg/L in T9), indicating an incorporation of this element into the groundwater during the evolution sequence of the thermal waters of the Paipa area.
Regarding the Piper plot (Figure 9), the hydrogeochemical facies of the geothermal waters corresponded to Na+K-SO42−-(Cl) waters toward the central part of the valley of the Salitre River, while the Na+-(Ca2+)-HCO3 waters were located toward the margins, with the exception of the Na+-Cl waters of the Curiosidad Fría (T5). It is worth mentioning that El Hervidero should not be considered as a source of hot springs, but rather an emanation of steam in steam vents because the heat is related to gas release, with little contributions of water [33]. Thus, from the genetic perspective, the classification of the waters of the Paipa geothermal system corresponded to immature waters resulting from heating, with steam derived directly from magmatic sources [34]. Consequently, the main group of waters were located in the zone with a high concentration of dissolved sulfate, while a secondary group corresponded to sulfated waters with appreciable contents of bicarbonates, which were considered as peripheral waters to the system.
Saturation indices, SIs, for anhydrite, aragonite, calcite, dolomite, fluorite, goethite, gypsum, halite, hematite, pyrite, and siderite (Figure 10) were calculated in order to evaluate their chemical equilibrium ([30,31]; AquaChem® 5.1). A very high pyrite dissolution capacity was observed for these waters in most of the samples, except 2, 4, 10, 12 and 16. Siderite showed a slightly negative SI value. On the other hand, the saturation index for hematite was positive, representing oversaturation, but it was clear that a balance between pyrite (siderite) dissolution and hematite precipitation favoring an enrichment of Fe in geothermal groundwaters does not exist, feeding the Salitre River and allowing further access to the Sochagota Lake.
By comparing the results of Sochagota Lake and Paipa region data, it is possible detect that, despite the variability of values of the thermal waters, as previously commented, the most perceptible is that these waters are much more mineralized than those of Lake Sochagota, and that their contribution increases the salinity in the south area of the lake. In relation to hydrochemical water families observed in the Piper plots (Figure 6 and Figure 9, respectively), it is noticeable that the Sochagota Lake shows a very specific composition of Na+K-SO42−-(Cl) facies, while thermal springs present a larger hydrochemical variability, as a result of the combination of endogenous and surface waters. The concentration of metals, such as Fe, is clearly different in both data sets. Average values of Fe in thermal waters were around 3.8 mg/L, while in the lake this concentration appears to be of around 0.6 mg/L, indicating the capturing of this metal by biogeochemical processes which promote the precipitation of Fe minerals. This could be observed in Figure 10, where the saturation index of pyrite is highly negative, indicating potential processes of dissolution of this mineral, Fe in the dissolution, and later in the lake precipitation of Fe minerals.

4. Discussion

4.1. Water Sources

The Sochagota Lake is recharged by the Salitre River basin waters, which are a mix of surficial and endogenous waters feeding the Salitre River (Figure 1). With the aim of determining the effect of diverse water inputs on the water of the lake, we compared the available data of water composition from the geothermal groundwaters. Geothermal waters contribute to the chemical composition of the water of this river as follows: (i) SO42−-(Cl) Na+-K-rich hot waters; and (ii) Fe-rich, HCO3 (Cl-SO42−) cold waters. In Figure 11, it is possible observe the correlation between high Fe contents and low temperatures. Ref. [1] suggested that hydrothermal fluids associated with geothermal systems contain potentially pollutant chemicals (e.g., S, Fe, As, Pb, Zn, Mn) in the liquid fraction that may be present in harmful concentrations and can cause environmental chemical pollution. The water isotopic composition of the Sochagota Lake waters, 6.4‰ for δ34S and 8.1 for δ18O, is comparable to several hydrothermal liquids, see, for instance, the low δ34S values of the aqueous sulfate derived from the disproportionation of magmatic SO2 in the active hydrothermal system from Lassen Peak area (California) [35,36], and the lack of evaporitic rocks in the stratigraphic sequence [18] indicated that the high mineralization of the lake water was a result of hydrothermal contributions of S-bearing fluids from springs feeding the Salitre River. The good correlations of SO42− with metals in the lake waters also supported that its origin is associated with hydrothermal inputs to the Salitre River. The hydrochemistry of the cold waters can be related to the water–rock interaction of an alluvial shallow aquifer made of volcanic and sedimentary particles and recharged by rain. A mixing of thermal and saline waters with cooler groundwater is produced at the Salitre River bed, causing the SO42−-Na+-K+-Fe-rich waters to accumulate at the south entrance of the lake. This mix of water was evidenced by samples T19 and T20, characterized by very high values of salinity and mainly Fe.
On the other hand, the authors of [37] indicated that anthropogenic inputs from farm activities and wastewaters can pollute river basins and their impoundments in Colombia, producing saline waters and organic-matter-rich sediments by eutrophication. Ref. [17] proposed that these activities increased metal concentrations in the sediments of the Chicamocha River basin. However, the very low values of P and NO3 and the absence of significant relationships with heavy metals caused by urban sewage and farming actions do not imply inputs associated with anthropic activity in the Sochagota Lake waters.

4.2. Chemical Distribution in the Lake Waters: Processes Controlling Elements Concentrations

Hydrochemical analyses revealed that the two principal types of waters were distinguished in the Sochagota Lake, for which the distribution could be related to several processes controlling element concentrations, such as water dilution and sedimentary mineral uptake. High E.C. and sulfate-rich waters from the south lake entrance were characterized by higher contents of Cl, Li, Be, Al, K, Fe, Co, Ni, Cu, Zn, As, Rb, Cs, and Pb. The concentrations of SO42−, Cl, Fe and As exceeded the regulatory framework for contaminants in waters (250 mg/L for SO42− and Cl, 0.3 and 0.01 mg/L, respectively) or electrical conductivity (1000 µS/cm). However, the contents of the remaining heavy metals were under the limits established by Colombian regulations for human consumption and domestic use. The chemical composition of these waters suggested the strong influence of hydrothermal and freshwater entrances into the lake through the Salitre River. Some geothermal fluids can be considered as excessive salt content brines that cause direct environmental damage [1]. The ponding of these brines can be an efficient technique for fighting against water pollution. The Sochagota Lake is a pond created to preserve the water quality of the Chicamocha River, storing natural saline brines that are periodically discharged to the Chicamocha River when their salinity is reduced [16]. These waters cover organic-matter-poor deposits mostly composed of quartz and kaolinite (Figure 3a) and enriched in detrital elements such as Zr and Ti from the adjacent sediments and low heavy metal concentrations [10], suggesting that the absence of significant processes of water–sediment interaction caused mineral authigenesis, or trace element incorporation, from waters into the sediments.
On the other hand, in the centre and north areas of the lake, conductivity, SO42− and Cl were clearly lower than in the waters from the south entrance, although these contents slightly exceeded the Colombian regulations for pollutants in waters. For the remaining trace elements, a strong decrease in their concentration was observed and their contents were always found to be below the regulatory Colombian framework, considering that sediments deposited under these waters are characterized by an enrichment in organic matter. Ref. [32] indicates that these sediments are made of a fine grain-sized matrix rich in illite and I-DV. The main characteristic of these deposits is the crystallization of S-bearing minerals (mackinawite, pyrite, and S°) and the enrichment in S, TOC, Fe, Zn, Mo, Rb, Co, K, Cr, Sb, Ni, As, Ba, LOI, Cu, Mn, Pb, P, Mg and Sr [18]. Ref. [10] also reported the presence of bacterial groups capable of causing a reduction in sulfate (Desulfatiglans, Desulfobacterales and Sva0485) and Fe3+ (Latescibacteria), as well as the occurrence of Fe-sulfide nanoparticles coating microbial cells.
Therefore, our data suggest that the water composition of the Sochagota Lake involved interactions among hydrothermal sources, freshwaters, and sediments. These processes caused a sharp decrease in many elemental concentrations, especially SO42−, Fe, Cl, Al, As, Cu and Co (between 22- and 8-fold). Li, Rb, Na, K, Ni, Cs, Ba, Zn and Pb suffered a significant decrease (around 3-fold) while Ca, Mg, and Sr were less affected (less than 1.5-fold decrease). Although freshwater from rain accumulating in the reservoir must play a crucial role in reduction of the dissolved metals provided by the hydrothermal inputs, the decrease in concentration is especially important for elements involved in some of the mineral processes occurring through the interaction between water, sediments, and their bacterial community. Biogeochemical processes influence the mobility of elements. Complexation and sorption actions on sediment components such as clay minerals, organic matter, oxides, and biological fixation and transformation can determine the water’s elemental composition. Ref. [17] indicated that, in the constructed wetland of La Playa (Chicamocha River), the deposit of sediments rich in organic matter and the accumulation of saline waters have generated suitable settings for water-reduction processes commonly related to reducing microorganism activity, that induces the production of sulfide, which can generate insoluble sulfides of divalent metals. The high contents of trace elements in the organic matter-rich sediments from the Sochagota Lake and the presence of a significant SRB community suggest that part of the decrease in SO42−, Cl and trace elements in the waters of the lake was promoted by immobilization processes from mineral reactions, such as the precipitation of the hydrothermal S and the accumulation of trace elements controlled by SRB in the sediments. The SO42− hydrothermal inputs to the Sochagota Lake were dropped by sedimentary processes associated with carbonaceous-matter degradation to precipitate S-bearing minerals in the sediments, and caused a decrease in metals in the waters (Figure 3b). Ref. [9] showed that the process of metal sulfidation can transform the metals into low-solubility minerals. The attenuation of the concentration of K, Al, and Rb could likewise be linked to mineral transformations taking place in the carbonaceous matter-rich deposits. Ref. [38] indicated that clay minerals can be rapidly transformed to illite through sequential mineral reactions in hypersaline and reducing environments. In these cases, sediments act as effective potassium sinks [39]. Ref [16] suggested that eutrophication in a closer impoundment (La Playa dam) created an environment with reducing conditions that favored the uptake of Fe into neoformed clay minerals (I-DV and Fe-smectite). Ref. [32] suggested that reducing settings in the carbonaceous matter-rich sediments of the Sochagota Lake favored low-temperature illitization. At the same time, I-DV uptakes Fe and K via continuous dissolution–precipitation reactions. Hydrothermal K from the organic-rich pore water was fixed in the neoformed illite layers, indicating that clay minerals can be considered as sinks for K in geothermal areas.
These processes could contribute significantly to remediate the presence of some elements in the waters by natural attenuation processes. We recommend increasing the vegetation at the south entry of the lake to promote the deposition of organic matter-rich sediments, where these biogeochemical processes can take place to further reduce concentrations of SO42− and As to below the Colombian regulatory framework for contaminants in waters.

5. Conclusions

The present study explored how the effect of damming in the Sochagota Lake can be considered an effective strategy for attenuating high salinity waters rich in SO42−, some of a hydrothermal origin, from the Salitre River basin. In this sense, a hydrogeochemical study of waters of the Sochagota Lake and the hydrothermal inputs transported to the lake through the Salitre River was conducted. Concentrations of major and minor elements were high in the south entrance of the lake, and these concentrations were progressively but significantly attenuated inside the Sochagota Lake. SO42−, Fe, Cl, Al, As Cu, and the Co contents decreased most significantly. However, SO42− and As concentrations remained above the Colombian regulations. Li, Na, K, Ni, Cs, Ba, Zn, and Pb concentrations presented moderate reductions, although enough to provide contents below the Colombian regulatory framework, while Ca, Mg, and Sr showed a scarce variation. Dilution by rainfall runoff and the precipitation of iron sulfides mediated by sulfate-reducing bacteria in the organic matter-rich sediments were the main processes involved in the concentration attenuation of SO42−, Fe, As Cu, and Co in the lake water. The K-consuming illitization processes occurring in the sediments could favor a decrease in K and Al.
Mineralogical, microbiological, and hydrological processes might help to remediate the occurrence of different contents of harmful elements in the waters by natural attenuation procedures. In this way, we recommend increasing the level of vegetation at the southern entry of the lake, so as to stimulate the accumulation of organic matter-rich sediments where these biogeochemical processes occur. Such a solutions would help to further reduce the concentrations of, mainly, SO42− and As, following the Colombian regulatory framework for contaminants in waters.

Author Contributions

G.R.C. and C.P.Q. managed field observations and sampling. J.J.-M., R.J.-E., G.R.C. and C.P.Q. performed water analysis procedures. G.R.C. and R.J.-E. performed the hydrochemical calculations and plots. All the authors deliberated the analytical results and arranged the manuscript. All authors have read and agreed to the published version of the manuscript.

Funding

This study was supported by the Spanish research project PGC2018-094573-B-I00 from the MCIU-AEI-FEDER and research group RNM-325 of the Junta de Andalucía (Spain). We are grateful to the Asociación Universitaria Iberoamericana de Posgrado (AUIP) and the Universidad de Boyacá. Added appreciations to Colombian Research groups Gestión Ambiental COL0005468 and Gestión de Recursos Hídricos COL0005477.

Institutional Review Board Statement

Not applicable.

Informed Consent Statement

Not applicable.

Data Availability Statement

Not applicable.

Acknowledgments

We would like to acknowledge the MDPI English Editing Services for correcting and improving the original manuscript. The authors appreciate the anonymous reviewers as their suggestions and comments helped to improve the manuscript.

Conflicts of Interest

The authors declare no conflict of interest.

References

  1. Kristmannsdóttir, H.; Ármannsson, H. Environmental aspects of geothermal energy utilization. Geothermics 2003, 32, 451–461. [Google Scholar] [CrossRef]
  2. Aiuppa, A.; Dongarra, G.; Capasso, G.; Allard, P. Trace elements in the thermal groundwaters of Vulcano Island Sicily. J. Volcanol. Geotherm. Res. 2000, 98, 189–207. [Google Scholar] [CrossRef]
  3. Aiuppa, A.; Federico, C.; Giudice, G.; Gurrieri, S. Chemical mapping of a fumarolic field: La Fossa crater, Vulcano Island (Aeolian Islands, Italy). Geophys. Res. Lett. 2005, 32. [Google Scholar] [CrossRef] [Green Version]
  4. Battistel, M.; Hurwitz, H.; Evans, W.C.; Barbieri, M. The chemistry and isotopic composition of waters in the low-enthalpy geothermal system of Cimino-Vico Volcanic District, Italy. J. Volcanol. Geotherm. Res. 2016, 328, 222–229. [Google Scholar] [CrossRef] [Green Version]
  5. Khadse, G.K.; Meshram, D.B.; Deshmukh, P.; Labhasetwar, P.K. Water quality of Tehri dam reservoir and contributing rivers in the Himalayan region, India. Sustain. Water Resour. Manag. 2019, 5, 1951–1961. [Google Scholar] [CrossRef]
  6. Aghasian, K.; Moridi, A.; Mirbagheri, A.; Abbaspour, M. Selective withdrawal optimization in a multipurpose water use reservoir. Int. J. Environ. Sci. Technol. 2019, 10, 5559–5568. [Google Scholar] [CrossRef]
  7. Willis, C.M.; Griggs, G.B. Reductions in fluvial sediment discharge by coastal dams in California and implications for beach sustainability. J. Geol. 2003, 111, 167–182. [Google Scholar] [CrossRef]
  8. Zhang, Y.; Liao, J.; Pei, Z.; Lu, X.; Xu, S.; Wang, X. Effect of dam construction on nutrient deposition from a small agricultural karst catchment. Ecol. Indic. 2019, 107, 105548. [Google Scholar] [CrossRef]
  9. Niu, Z.S.; Pan, H.; Guo, X.P.; Lu, D.P.; Feng, J.N.; Chen, Y.R.; Tou, F.Y.; Liu, M.; Yang, Y. Sulphate-reducing bacteria (SRB) in the Yangtze estuary sediments: Abundance, distribution and implications for the bioavailibility of metals. Sci. Total Environ. 2018, 634, 296–304. [Google Scholar] [CrossRef]
  10. Cifuentes, G.R.; Jiménez-Millán, J.; Quevedo, C.P.; Gálvez, A.; Castellanos-Rozo, J.; Jiménez-Espinosa, R. Trace element fixation in sediments rich in organic matter from a saline lake in tropical latitude with hydrothermal inputs (Sochagota Lake, Colombia): The role of bacterial communities. Sci. Total Environ. 2021, 762, 143113. [Google Scholar] [CrossRef] [PubMed]
  11. Chen, M.; Lu, G.; Wu, J.; Yang, C.; Niu, X.; Tao, X.; Zhenqing, S.; Xiaoyun, Y.; Dang, Z. Migration and fate of metallic elements in a waste mud impoundment and affected river downstream: A case study in Dabaoshan Mine, South China. Ecotoxicol. Environ. Saf. 2018, 164, 474–483. [Google Scholar] [CrossRef] [PubMed]
  12. Wang, W.H.; Wang, W.X. Trace metal behavior in sediments of Jiulong River Estuary and implication for benthic exchange fluxes. Environ. Pollut. 2017, 225, 598–609. [Google Scholar] [CrossRef]
  13. Acero, P.; Ayora, C.; Torrentó, C.; Nieto, J.M. The behavior of trace elements during schwertmannite precipitation and subsequent transformation into goethite and jarosite. Geochim. Cosmochim. Acta 2006, 70, 4130–4139. [Google Scholar] [CrossRef]
  14. Schaider, L.A.; Senn, D.B.; Estes, E.R.; Brabander, D.J.; Shin, J.P. Sources and fates of heavy metals in a mining-impacted stream:Temporal variability and the role of iron oxides. Sci. Total Environ. 2014, 490, 456–466. [Google Scholar] [CrossRef] [PubMed] [Green Version]
  15. Nordstrom, D.K. Hydrogeochemical processes governing the origin, transport and fate of major and trace elements from mine wastes and mineralized rock to surface waters. Appl. Geochem. 2011, 26, 1777–1791. [Google Scholar] [CrossRef]
  16. Quevedo, C.P.; Jiménez-Millán, J.; Cifuentes, G.R.; Jiménez-Espinosa, R. Clay mineral transformations in anthropic organic matter-rich sediments. under saline water environment. Effect on the detrital mineral assemblages in the Upper Chicamocha River Basin, Colombia. Appl. Clay Sci. 2020, 196, 105776. [Google Scholar] [CrossRef]
  17. Quevedo, C.P.; Jiménez-Millán, J.; Cifuentes, G.R.; Jiménez-Espinosa, R. Electron Microscopy Evidence of Zn Bioauthigenic Sulfides Formation in Polluted Organic Matter-Rich Sediments from the Chicamocha River (Boyacá-Colombia). Minerals 2020, 10, 673. [Google Scholar] [CrossRef]
  18. Cifuentes, G.R.; Jiménez-Millán, J.; Quevedo, C.P.; Jiménez-Espinosa, R. Transformation of S-Bearing Minerals in Organic Matter-Rich Sediments from a Saline Lake with Hydrothermal Inputs. Minerals 2020, 10, 525. [Google Scholar] [CrossRef]
  19. Alfaro, C.; Velandia, F.; Cepeda, H. Colombian geothermal resources. In Proceedings of the World Geothermal Congress, Antalya, Turkey, 24–29 April 2005; pp. 1–11. [Google Scholar]
  20. Pardo, N.; Cepeda, H.; Jaramillo, J.M. The Paipa volcano, eastern cordillera of Colombia, South America: Volcanic stratigraphy. Earth Sci. Res. J. 2005, 9, 3–18. [Google Scholar]
  21. Alfaro, C.; Velandia, F.; Cepeda, H.; Pardo, N. Preliminary Conceptual Model of the Paipa Geothermal System, Colombia. In Proceedings of the World Geothermal Congress 2010, Bali, Indonesia, 25–29 April 2010. [Google Scholar]
  22. Alfaro, C. Improvement of Perception of the Geothermal Energy as a Potential Source of Electrical Energy in Colombia, Country Update. In Proceedings of the World Geothermal Congress 2015, Melbourne, Australia, 19–25 April 2015. [Google Scholar]
  23. Vazquez-Suñe, E.; Serrano-Juan, A.; Easy Quim v5.0. Grupo de Hidrología Subterránea. 2012. Available online: https://h2ogeo.upc.edu/ (accessed on 4 June 2021).
  24. Nieto, F.; Ortega-Huertas, M.; Peacor, D.R.; Arostegui, J. Evolution of illite/smectite from early diagenesis through incipient metamorphism in sediments of the Basque-Cantabrian Basin. Clays Clay Miner. 1996, 44, 304–323. [Google Scholar] [CrossRef]
  25. WHO (World Health Organization). Guidelines for Drinking-Water Quality: Fourth Edition Incorporating the First Addendum; WHO Library Cataloguing-in-Publication Data; WHO: Geneva, Switzerland, 2017; ISBN 978-92-4-154995-0. [Google Scholar]
  26. USSL (US Salinity Laboratory). Diagnosis and Improvement of Saline and Alkaline Soils; Agriculture Handbook No. 60; USDA: Washington, DC, USA, 1954; p. 160.
  27. NSW Department of Primary Industries. Interpreting Water Quality Test Results. 2002. Available online: https://www.dpi.nsw.gov.au/__data/assets/pdf_file/0007/523618/interpreting-water-quality-test-results.pdf (accessed on 14 November 2021).
  28. Velandia, F. Cartografía Geológica y Estructural Sector Sur del Municipio de Paipa. Informe Técnico. INGEOMINAS. 2003, p. 31. Available online: https://docplayer.es/71639818-Informe-tecnico-cartografia-geologica-y-estructural-sector-sur-del-municipio-de-paipa-proyecto-de-geodinamica-francisco-velandia.html (accessed on 10 August 2020). (In Spanish).
  29. Usaquén, O.L. Desarrollo de una Metodología para la Gestión Ambiental de Humedales Costeros y Continentales Sometidos a Presiones Agrícolas. Ph.D. Thesis, University of Cantabria, Santander, Spain, 2007. (In Spanish). [Google Scholar]
  30. Parkhurst, D.L.; Appelo, C.A.J. User’s guide to PHREEQC (Version 2): A computer program for speciation, batch-reaction, one-dimensional transport, and inverse geochemical calculations. Water-Resour. Investig. Rep. 1999, 99, 312. [Google Scholar]
  31. Drever, J.I. The Geochemistry of Natural Waters, 3rd ed.; Prentice Hall: Upper Saddle River, NJ, USA, 1997; p. 436. [Google Scholar]
  32. Cifuentes, G.R.; Jiménez-Millán, J.; Quevedo, C.P.; Nieto, F.; Cuadros, J.; Jiménez-Espinosa, R. Low Temperature Illitization through Illite-Dioctahedral Vermiculite Mixed Layers in a Tropical Saline Lake Rich in Hydrothermal Fluids (Sochagota Lake, Colombia). Minerals 2021, 11, 523. [Google Scholar] [CrossRef]
  33. Alfaro, C. Geoquímica del Sistema Geotérmico de Paipa; INGEOMINAS, Unpublished Technical Report; Bogotá, Colombia, 2002; p. 88. (In Spanish) [Google Scholar]
  34. Corpoboyacá-Corporación Autónoma Regional de Boyacá. Lineamientos para la Gestión Integral de Aguas Termales y Termominerales en el Municipio de Paipa, Departamento de Boyacá. 2006 Fundación Profesional para el Manejo Integral del Agua; 2016; Unpublished Technical Report. (In Spanish) [Google Scholar]
  35. Rye, R.O.; Bethke, P.M.; Wasserman, M.D. The stable isotope geochemistry of acid sulfate alteration. Econ. Geol. 1992, 87, 225–262. [Google Scholar] [CrossRef]
  36. John, D.A.; Lee, R.G.; Breit, G.N.; Dilles, J.H.; Calvert, A.T.; Muer, L.J.P.; Clynne, M.A. Pleistocene hydrothermal activity on Brokeo volcano and in the Maidu volcanic center, Lassen Peak area, northeast California: Evolution of magmatic-hydrothermal systems on stratovolcanoes. Geosphere 2019, 15, 946–982. [Google Scholar] [CrossRef]
  37. Marrugo-Negrete, J.; Pinedo, J.; Díez, S. Assessment of heavy metal pollution, spatial distribution and origin in agricultural soils along the Sinú River Basin, Colombia. Environ. Res. 2017, 154, 380–388. [Google Scholar] [CrossRef]
  38. Andrade, G.R.P.; Cuadros, J.; Partiti, C.M.S.; Cohen, R.; Vidal-Torrado, P. Sequential mineral transformation from kaolinite to Fe-illite in two Brazilian mangrove soils. Geoderma 2018, 309, 84–99. [Google Scholar] [CrossRef]
  39. Cuadros, J.; Andrade, G.; Ferreira, T.O.; Partiti, C.S.M.; Cohen, R.; Vidal-Torrado, P. The mangrove reactor: Fast clay transformation and potassium sink. Appl. Clay Sci. 2017, 140, 50–58. [Google Scholar] [CrossRef]
Figure 1. Geographical location of the study zone and identification of sample positions. Red points represent the hydrothermal springs, and the yellow points are the sites from the Sochagota Lake. Base map: Google Earth.
Water 13 03445 g001
Figure 2. Map of the main geological outcropping and the principal fault system of the Paipa volcanic area related to the Sochagota Lake. Modified from [17].
Water 13 03445 g002
Figure 3. Images of the lake sediments obtained with an electron microscope. (a) BSE picture of a southern area of the lake sample, where crystals of quartz in a kaolinite-rich matrix can be seen. (b) BSE image of a sample from the north part of the lake, with parts rich in organic matter and framboidal pyrite in a plentiful clay-rich matrix. Phy: phyllosilicates, Kln: kaolinite, Qz: quartz, Py: pyrite, OM: Organic matter.
Water 13 03445 g003
Figure 4. Values of electrical conductivity for samples 1 to 18 in the Sochagota Lake. Samples 19 and 20 have been removed to better illustrate the variation of the remaining samples, avoiding the screen effect of these high values. (a) Map of the E.C. in the lake with scaling size and corresponding value; (b) Plot of the values of E.C. vs. samples.
Water 13 03445 g004
Figure 5. (a) Schöeller-Berkaloff diagram highlighting the geochemical behavior of water in the Sochagota Lake. Red marks indicate healthy recommended values [25]. (b) Salinity Diagram for Classification of Irrigation Waters for Sochagota Lake. Samples 19 and 20 are omitted from the plot (19-SAR: 66; 20-SAR: 70). Legend for water quality in this plot is: c1-s11: Very Good; c1-s2, c2-s1, c2-s2: Good; c1-s3, c2-s3, c3-s1: Medium; c1-s4, c2-s4, c4-s1, c3-s2: Bad; c3-s3, c3-s4, c4-s3, c4-s4: Very Bad.
Water 13 03445 g005
Figure 6. Piper diagram showing the hydrogeochemical facies identified for water samples of Sochagota Lake.
Water 13 03445 g006
Figure 7. Saturation indices for water samples from Sochagota Lake.
Water 13 03445 g007
Figure 8. (a) Map of Fe content in the Paipa area and the relationship of Fe concentration vs. temperature in the left corner. (b) Map of electrical conductivity in this area. In both plots, a color and size scale are used: reddish-warm colors and big dots are related to high values.
Water 13 03445 g008
Figure 9. Piper diagram showing the hydrogeochemical facies identified for water thermal samples of Paipa.
Water 13 03445 g009
Figure 10. Saturation indices for geothermal water samples of the Paipa region.
Water 13 03445 g010
Figure 11. Relationship between temperature and Fe in the geothermal water samples of the Paipa region.
Water 13 03445 g011
Table 1. Water sampling points in Sochagota Lake. M: medium vertical measurement.
SAMPLEpHECTempTDSClSO42−HCO3CO32−NO3Na+Mg2+Ca2+K
(m) µS/cm°Cmg/Lmg/Lmg/Lmg/Lmg/Lmg/Lmg/Lmg/Lmg/Lmg/L
P1 (1.2)9.072473.016.01582.9204.80687.34169.880.70-432.448.6524.0754.98
P2 (1.3)8.902325.017.01488.2203.54679.7599.580.403.13430.668.567.0555.53
P3 (1.2)9.162282.019.01460.3200.94671.6973.771.302.94424.248.3522.8954.17
P4 (0.9)9.142329.018.01490.3204.53686.5876.150.322.69434.728.4121.9654.94
P5 (1.2)9.172368.018.01515.3204.28687.09102.150.852.70433.508.4621.4254.81
P6 (1.1)9.212377.017.01521.4197.38666.29141.871.54-429.518.4421.8754.51
P7 (0.9)9.162287.017.01463.5194.90652.87107.820.342.74416.908.3126.6452.92
P8 (1.0)9.222211.017.01415.3198.35667.7034.050.472.70425.388.5524.3253.79
P9 (1.1)9.182547.020.01630.3208.36699.74187.270.642.68442.888.7123.8756.12
P10 (1.0)9.142485.019.01590.2206.21696.19158.900.43-440.638.5823.5055.77
P11 (1.1)9.162415.016.01545.9205.51694.10119.170.682.67438.328.5521.3955.46
P12 (0.9)9.152371.019.01517.4208.54703.5168.100.47-447.638.8423.7956.58
P13 (0.8)9.142350.019.01504.0209.71708.1745.400.602.72447.048.9025.0056.45
P14 (0.9)9.242355.019.01507.2211.70714.7839.720.38-450.788.7523.9857.10
P15 (0.9)9.272274.020.01455.1211.09712.5728.370.73-419.079.1421.0453.07
P16 (0.7)9.102361.018.01511.2211.82714.1535.150.172.67453.118.8727.9857.33
P17 (0.5)9.052432.019.01556.5218.03724.4158.580.152.76461.279.0622.2359.97
P18 (0.3)8.882489.018.01592.9224.62752.8241.300.20-481.908.7922.6760.57
8.847126.019.04526.3664.502142.5164.440.452.751470.698.6528.16178.31
P19 (0.2)8.908651.819.05493.8846.002598.0880.760.663.381719.0010.4228.46207.00
SAMPLENH4+FBrLiAlMnFeNiCuZnAsRbSrCs
mg/Lmg/Lmg/Lmg/Lmg/Lmg/Lmg/Lmg/Lmg/Lmg/Lmg/Lmg/Lmg/Lmg/L
P1 (1.2)0.000.9300.8420.5420.0550.7020.2210.0030.0040.0160.0090.3860.3250.016
P2 (1.3)0.000.5770.8340.5860.0630.7090.2190.0030.0010.0540.0080.3860.3290.016
P3 (1.2)0.000.7760.8230.5950.0580.7170.2120.0030.0010.0090.0080.3920.3340.016
P4 (0.9)0.030.9380.8270.5940.0600.7130.2170.0030.0010.0110.0080.3890.3330.016
P5 (1.2)0.030.9310.8230.6020.0630.7120.2120.0030.0010.0150.0080.3880.3330.016
P6 (1.1)0.040.9020.8130.6030.0550.6940.2050.0020.0010.0060.0080.3850.3290.016
P7 (0.9)0.030.8670.8080.5950.0500.6270.1930.0030.0010.0050.0080.3590.3100.016
P8 (1.0)0.030.9440.8160.5980.0570.6350.1930.0030.0010.0240.0080.3660.3160.016
P9 (1.1)0.041.0010.8380.6010.0620.6390.2020.0020.0010.0060.0080.3640.3140.016
P10 (1.0)0.081.0040.8190.5990.0480.6450.1990.0020.0010.0050.0080.3700.3170.016
P11 (1.1)0.041.0030.8240.5880.0540.6290.1910.0020.0010.0050.0080.3530.3080.015
P12 (0.9)0.031.0210.8380.5780.0450.6160.1900.0030.0010.0080.0080.3540.3050.015
P13 (0.8)0.040.9860.8360.5830.0640.6150.2180.0040.0010.0120.0080.3600.3090.016
P14 (0.9)0.061.0370.8380.5720.0540.6320.1940.0030.0010.0230.0080.3650.3150.016
P15 (0.9)0.061.0000.8360.5820.0530.6200.1920.0030.0010.0190.0080.3610.3100.016
P16 (0.7)0.051.0380.8360.5770.0570.6430.2130.0020.0010.0090.0080.3660.3160.016
P17 (0.5)0.071.1200.8490.5700.1000.6120.3560.0030.0000.0080.0090.3680.3140.016
P18 (0.3)0.051.0780.8500.6100.0240.0060.0330.0020.0000.0000.0070.3790.3170.017
0.102.9151.8281.9110.6480.4093.9390.0070.0050.0560.0661.2850.5720.076
P19 (0.2)0.173.5462.0012.1020.7130.4504.3330.0080.0050.0620.0721.4130.6290.083
Table 2. Descriptive statistics of sampled variables in Sochagota Lake (N: number of samples; Min: minimum; Max: maximum; Std. Dev.: standard deviation).
VariableNMin.Max.AverageStd. Dev
pH208.849.279.100.13
EC (µS/cm)202211.008651.752925.441717.38
Temp (°C)2016.0020.0018.201.19
TDS (mg/L)201415.315493.761868.391087.10
Cl (mg/L)20194.90846.00261.74171.46
SO42− (mg/L)20652.872598.08863.01521.24
HCO3 (mg/L)2028.37187.2786.6248.09
CO32− (mg/L)200.151.540.570.35
NO3 (mg/L)132.673.382.810.21
Na+ (mg/L)20416.901719.00554.98358.22
Mg2+ (mg/L)208.3110.428.750.45
Ca2+ (mg/L)207.0528.4623.114.41
K+ (mg/L)2052.92207.0069.4742.42
NH4+ (mg/L)200.000.170.040.037
F (mg/L)200.573.551.180.72
Br (mg/L)200.812.000.940.33
Li+ (mg/L)200.542.100.730.44
Al (mg/L)200.020.710.120.19
Mn (mg/L)200.010.720.600.16
Fe (mg/L)200.034.330.601.21
Ni (mg/L)200.000.010.0030.001
Cu (mg/L)200.000.010.0010.001
Zn (mg/L)200.000.060.0180.0181
As (mg/L)200.010.070.0140.0187
Rb (mg/L)200.351.410.470.3018
Sr (mg/L)200.310.630.350.0876
Cs (mg/L)200.020.080.0220.0195
Table 3. Water sampling points in the Paipa geothermal area.
Cl
(mg/L)
SO42−
(mg/L)
HCO3
(mg/L)
Na+
(mg/L)
Mg2+
(mg/L)
Ca2+
(mg/L)
K+
(mg/L)
T1. Termales Olitas3.319.264.720.00.88.16.8
T2. El Hervidero 9.759.34.912.80.83.727.2
T3. Piscina La Playa3050.09180.0999.05480.021.070.0930.0
T4. Curiosidad Caliente100.060.3360.0130.04.959.313.5
T5. Curiosidad Fría12600.019100.02598.614600.03.542.39060.0
T6. Los Delfines6580.016510.02830.412460.08.983.61250.0
T7. Escuela Esperanza242.0477.055.6315.09.947.313.7
T8. Colegio ITA13.016.062.522.94.63.75.1
T9. Finca Entre Lomas3.314.24.95.00.91.33.0
T10. Vereda Caños3.313.326.83.10.610.76.9
T11. Termal Marismas7540.015000.02976.812089.028.3175.01870.0
T12. Pozo Azul6620.016500.02635.211200.06.1168.01940.0
T13. Ojo Diablo6300.016400.02440.011400.015.9129.01390.0
T14. Hotel Colsubsidio6540.016600.02415.611500.017.6123.01210.0
T15. Interior Colsubsidio6120.017500.02403.411200.025.3126.01500.0
T16. Aljive6.012.529.57.21.69.22.2
pHC.E.
(µS/cm)
TDS
(mg/L)
SiO2
(mg/L)
Temp
(°C)
Fe
(mg/L)
F
(mg/L)
B
(mg/L)
T1. Termales Olitas6.0212.480.112.3026.90.793.730.00
T2. El Hervidero 6.0223.498.310.720.013.900.070.00
T3. Piscina La Playa8.030874.813300.029.064.00.9216.301.94
T4. Curiosidad Caliente7.81154.631700.010.927.80.000.690.33
T5. Curiosidad Fría7.390654.0466.013.424.00.7623.403.95
T6. Los Delfines7.162099.728300.020.034.60.9523.503.65
T7. Escuela Esperanza6.41822.51010.03.521.02.300.060.00
T8. Colegio ITA6.4221.667.82.819.911.200.100.00
T9. Finca E. Lomas6.584.844.32.419.019.200.070.00
T10. Vereda Caños6.4103.774.81.720.70.000.300.00
T11. Termal Marismas6.462033.934500.013.122.09.536.224.11
T12. Pozo Azul8.061073.226100.017.552.00.0017.503.58
T13. Ojo Diablo8.059522.025400.018.874.00.4116.402.94
T14. Hotel Colsubsidio7.060037.225800.017.352.00.3416.403.18
T15. Interior Colsubsidio7.360767.425500.016.044.00.4716.202.96
T16. Aljive6.8108.553.31.317.50.000.000.00
Table 4. Descriptive statistics of hydrothermal water samples from Paipa.
VariableVariableNAverageStd.Dev.Min.Max.
pHpH167.00.76.08.0
EC (µS/cm)EC1630687.133049.084.890654.0
Temp (°C)Temp1633.717.917.574.0
TDS (mg/L)TDS1613280.914128.844.334500.0
Cl (mg/L)Cl163483.23982.53.312600.0
SO42+ (mg/L)SO4167966.48384.612.519100.0
HCO3 (mg/L)HCO3161244.21278.14.92976.8
Na+ (mg/L)Na165652.86036.13.114600.0
Mg2+ (mg/L)Mg169.49.30.628.3
Ca2+ (mg/L)Ca1666.361.11.3175.0
K+ (mg/L)K161201.82225.82.29060.0
SiO2 (mg/L)SiO21611.97.91.329.0
F (mg/L)F168.89.30.023.5
B (mg/L)B161.71.70.04.1
Fe (mg/L)Fe163.86.10.019.2
Publisher’s Note: MDPI stays neutral with regard to jurisdictional claims in published maps and institutional affiliations.

