An Integrated Decision Support Model for Evaluating Public Transport Quality


Department of Transport Technology and Economics, Faculty of Transportation Engineering and Vehicle Engineering, Budapest University of Technology and Economics, Műegyetem rkp. 3., 1111 Budapest, Hungary
*
Author to whom correspondence should be addressed.
Appl. Sci. 2020, 10(12), 4158; https://0-doi-org.brum.beds.ac.uk/10.3390/app10124158
Submission received: 18 May 2020
/
Revised: 13 June 2020
/
Accepted: 15 June 2020
/
Published: 17 June 2020
Abstract
:Big cities suffer from serious complex problems such as air pollution, congestion, and traffic accidents. Developing public transport quality in such cities is considered an efficient remedy to obviate these critical issues. This paper aims to determine the significant supply quality criteria of public transportation. As a methodology, a hybrid Analytic Hierarchy Process (AHP) combined with the Best Worst Method (BWM) is applied. The proposed model is basically a hierarchy structure with at least a 5 × 5 pairwise comparison matrix or larger. A real-world complex problem was examined to validate the created model (public transport quality improvement). An urban bus transport system in the Jordanian capital city, Amman, was used as a case study; three stakeholder groups (passengers, nonpassengers, and representatives of the local government) participated in the evaluation process. The conventional Analytic Hierarchy Process (AHP) leads to weak consistency in the case of existing 5 × 5 pairwise comparison matrices or larger, particularly in estimating complex problems. To avoid this critical issue in AHP, we used Best Worst Method (BWM) comparisons, which make the evaluation process easier for decision makers; moreover, it saves survey time and provides more consistency when compared to AHP pairwise comparisons. The model adopted highlighted the most significant service quality criteria that influence urban bus transport systems. Furthermore, the sensitivity analysis conducted detected the stability of the criteria ranking in the three levels of the hierarchical structure. Since the proposed AHP–BWM model (which is the sole example of this sort of combination) is independent from the decision attributes, it can be applied to arbitrary hierarchically structured decision problems with a relatively large number of pairwise comparisons.
1. Introduction
Big cities suffer from serious risks and critical problems, such as air pollution, noise pollution, parking difficulties, road congestions, increasing transport costs, need for safety, and high infrastructure maintenance costs. To cover these critical issues, citizens have to leave their own cars and start using the public transport system. For this decision, among other personal considerations, different attributes can be connected to public transport quality as influencers. The strategy of many large cities is to retain public transport passengers or enhance a mode shift to public transport services; this leads to decreased congestion and reduced air and noise pollution. To attract nonusers and encourage them to leave their private vehicles and start using public transport, local government representatives in metropolitan areas have to ameliorate the supply quality of public transport system.
Improving public transport supply quality and detecting the real demand of citizens for its development were investigated by several scholars through employing not only statistical methodologies but also dynamical methodologies. In reference [1], the metropolitan Metro of Seville service quality was evaluated to provide a reliable measurement tool for transit performance by using composite index that combines the passenger point of view with the service provider point of view. Reference [2] aimed to evaluate the service quality of public bus transport in the UK by adopting a quality competition model and fare levels for high-density routes. Reference [3] determined citizens’ perspectives regarding public transport service quality improvement by adopting a qualitative approach, emphasizing the importance of understanding citizens’ demands and expectations, not only to increase users’ satisfaction, but also to boost public transportation usage. Reference [4] proposed a SERVQUL measurement approach to evaluate public transport service quality in Australia and the questionnaire survey detected a significant gap between the real demand of citizens’ perspective and the existing system. Reference [5] investigated commuters’ satisfaction towards public transport service quality by adopting switching barrier theory; the theory was examined by using a two-step Structural Equation Modeling (SEM) approach. For estimating public transport service quality, [6] adopted an integrated the SERVQUL measurement approach based on bivariate correlation and EN 13816, a European standard on service quality in public transport, which illustrated the significance of reliability and frequency; moreover, they highlighted the gap between discernment and anticipation for public transport service quality. Reference [7] utilized the SERVPERF approach (which is a multiple-item technique for measuring service quality) for measuring the service quality factors of airlines; the results highlighted reliability as the most significant factor, based on the passengers’ perspective. Reference [8] used a discrete choice model to evaluate public bus transport service quality in Gran Canaria, Spain. They illustrated the importance of citizens’ preferences toward improving the quality of the system. Reference [9] applied a P-TRANSQUAL approach (which is service quality model of public land transport) to estimate and develop a service quality of public transport in Indonesia; the applied approach would be useful for local government representatives in developing countries. Reference [10] presented the unreliability of public transport service quality results over time through application of an empirical study for selecting users’ point of view toward public transport service quality, and highlighted that cross-temporal comparison of service quality data must be interpreted with caution for public transport quality management. Reference [11] suggested a combination of Generalized Regression Neural Network (GRNN), Probabilistic Neural Network (PNN) and Pattern Recognition Neural Network (PRNN) approaches to analyze the service quality of public transport in Dhaka, Bangladesh. In their study, the physical comfort, reliability, and time availability were the most significant criteria from users’ perspective. Reference [12] examined public satisfaction and perceptions towards public transport quality in Granada. As a methodology, they conducted nonlinear principal component analysis (NLPCA) with a logit multilevel model (LMLM). The study conducted by [13] evaluated the service quality criteria of public bus transport in Batna, Algeria, which included the satisfaction degree toward the system by measuring and applying a survey based on factor analysis.
More recently, there is growth in the use of decision support methodologies, not only to evaluate and develop public transport supply quality but also to increase passengers’ satisfaction level. Reference [14] aimed to explore the most important factors affecting public bus transport supply quality within Yurihonjo, Japan. They adopted the Analytic Hierarchy Process (AHP) approach for prioritizing the supply quality criteria, and three different main groups (users, government, and the transport operator company) participated in the questionnaire survey; as a result, approachability was the most significant issue for users and government, while it was the third most significant issue for operators. Reference [15] adopted a novel combination of Decision-Making Trial and Evaluation Laboratory (DEMATEL) and Analytic Network Process (ANP) to evaluate the service quality of the Taiwanese airline industry. Reference [16] proposed a novel Multi Criteria Decision Making (MCDM) approach based on Group Analytic Hierarchy Process (GAHP) and Preference Ranking Organization Method for Enrichment of Evaluations (PROMETHEE) with the Delphi method to improve Tehran’s public transport and estimate users’ satisfaction for supporting decision makers in their decisions. The results illustrated the metro as the most important mode and the local government representatives must pay attention to this issue.
Reference [17] integrated MCDM methods with fuzzy sets to improve the quality of airline service in Turkey; the results obtained expressed evaluators’ preferences are more reliable and suitable due to utilizing fuzzy sets, which provide more accurate decisions. Reference [18] utilized combined AHP and Technique for Order Preference by Similarity to Ideal Solution (TOPSIS) to estimate public bus transport service quality; the results illustrated the convenience and frequency as the most significant service quality criteria from the passengers’ point of view. Reference [19] created a new aggregation method by adding an extra level of stakeholder groups (users, nonusers, and local government); moreover, Kendall rank correlation was used to detect the gap between the groups’ preferences, where the results showed a significant gap between users’ and the local government’s opinion in Mersin, Turkey. Reference [20] presented a novel approach of AHP with Pareto optimality to develop the quality service of public transport. This model led to better approximation for evaluators—judgments that reflected the real intention of the decision maker. Reference [21] detected passengers’ demand toward developing public transport supply quality in Amman, Jordan, by conducting the conventional AHP and extended the hierarchy structure of public bus transport supply quality of [14] by injecting the fare as a main criterion in the system; the outcomes showed the fare as the third most important criteria from passengers’ point of view. To deal with the inconsistencies and uncertainties of citizens’ answers in evaluating the urban transport quality, [22] adopted the interval AHP approach and compared users’ perspectives with nonusers’ and experts’ point of view. Reference [23] applied the AHP approach in a fuzzy environment to mitigate the uncertainty of the citizens’ evaluations for the supply quality of the urban bus transport system. Reference [24] presented how citizens’ demand affect public transport improvement decision sustainability by using Multicriteria Decision Making (MCDM) methodologies, such as Fuzzy AHP and Interval AHP.
In this study, we shed broad light on the most significant points for future strategic improvement plans. The study presents an integrated MCDM model to evaluate public transport supply quality with participating users, public transport experts, and local government representatives in the questionnaire survey. Reference [25] conducted a review paper to support the decision maker in the design and operation of urban passenger transport systems. The MAMCA approach [26] was introduced to evaluate the transport projects in this research, with the author taking into consideration the quantitative and qualitative factors and their relative importance. In [27], multicriteria decision analysis was introduced to compare a bus rapid transit system (BRT) and a light rail transit system (LRT). Reference [28] improved the traditional service evaluation approaches by using AHP and the Fuzzy Sets Theory by considering the Italian public transit service sector. Reference [29] assisted the service quality in healthcare system by developing a new decision-making model that relies on the SERVQUAL–fuzzy AHP approach.
The AHP–BWM model introduced here can be recommended in all decision cases in which the attributes are hierarchically structured and pairwise comparisons are necessary among a high number of decision criteria. Connecting BWM unburdens the evaluators, generates more consistent results, and makes the survey process easier and faster. This combination of two MCDM approaches can be considered pioneering, since prior related literature dominantly handled AHP and BWM as competitors. In our case study, the ranking of transport system attributes can demonstrate the applicability of the new innovative model very well.
The study questions addressed in this paper are: What are the main criteria affecting the supply quality of public transport? What are the stakeholder perspectives towards developing the public transport plan? To investigate a solution for these questions, pairwise comparisons surveys were conducted in the capital of Jordan, Amman.
2. Materials and Methods
2.1. Public Buses Questionnaire (PBQ) Survey
The questionnaire survey technique was a predefined series of questions used to collect data from individuals [9,10]. Some recent studies applied a public transportation questionnaire to assess the real-world situation by considering the significant transport quality factors and interrelations between the observed factors [20]. This study utilized the public transportation questionnaire (PBQ) as a tool to collect preferences of different stakeholder’s data, based on perceived supply quality issues. The case study was conducted for commuter, noncommuter passengers, public transport experts, and municipal officials in the Jordanian capital city, Amman. To do so, the targeted groups (passengers, public transport experts, and municipal officials) were asked to fill out the PBQ by face-to-face technique, which enhanced its reliability. The questionnaire survey was designed in two parts. The first part intended to accumulate demographic data about the participants and the results are tabulated in Table 1.
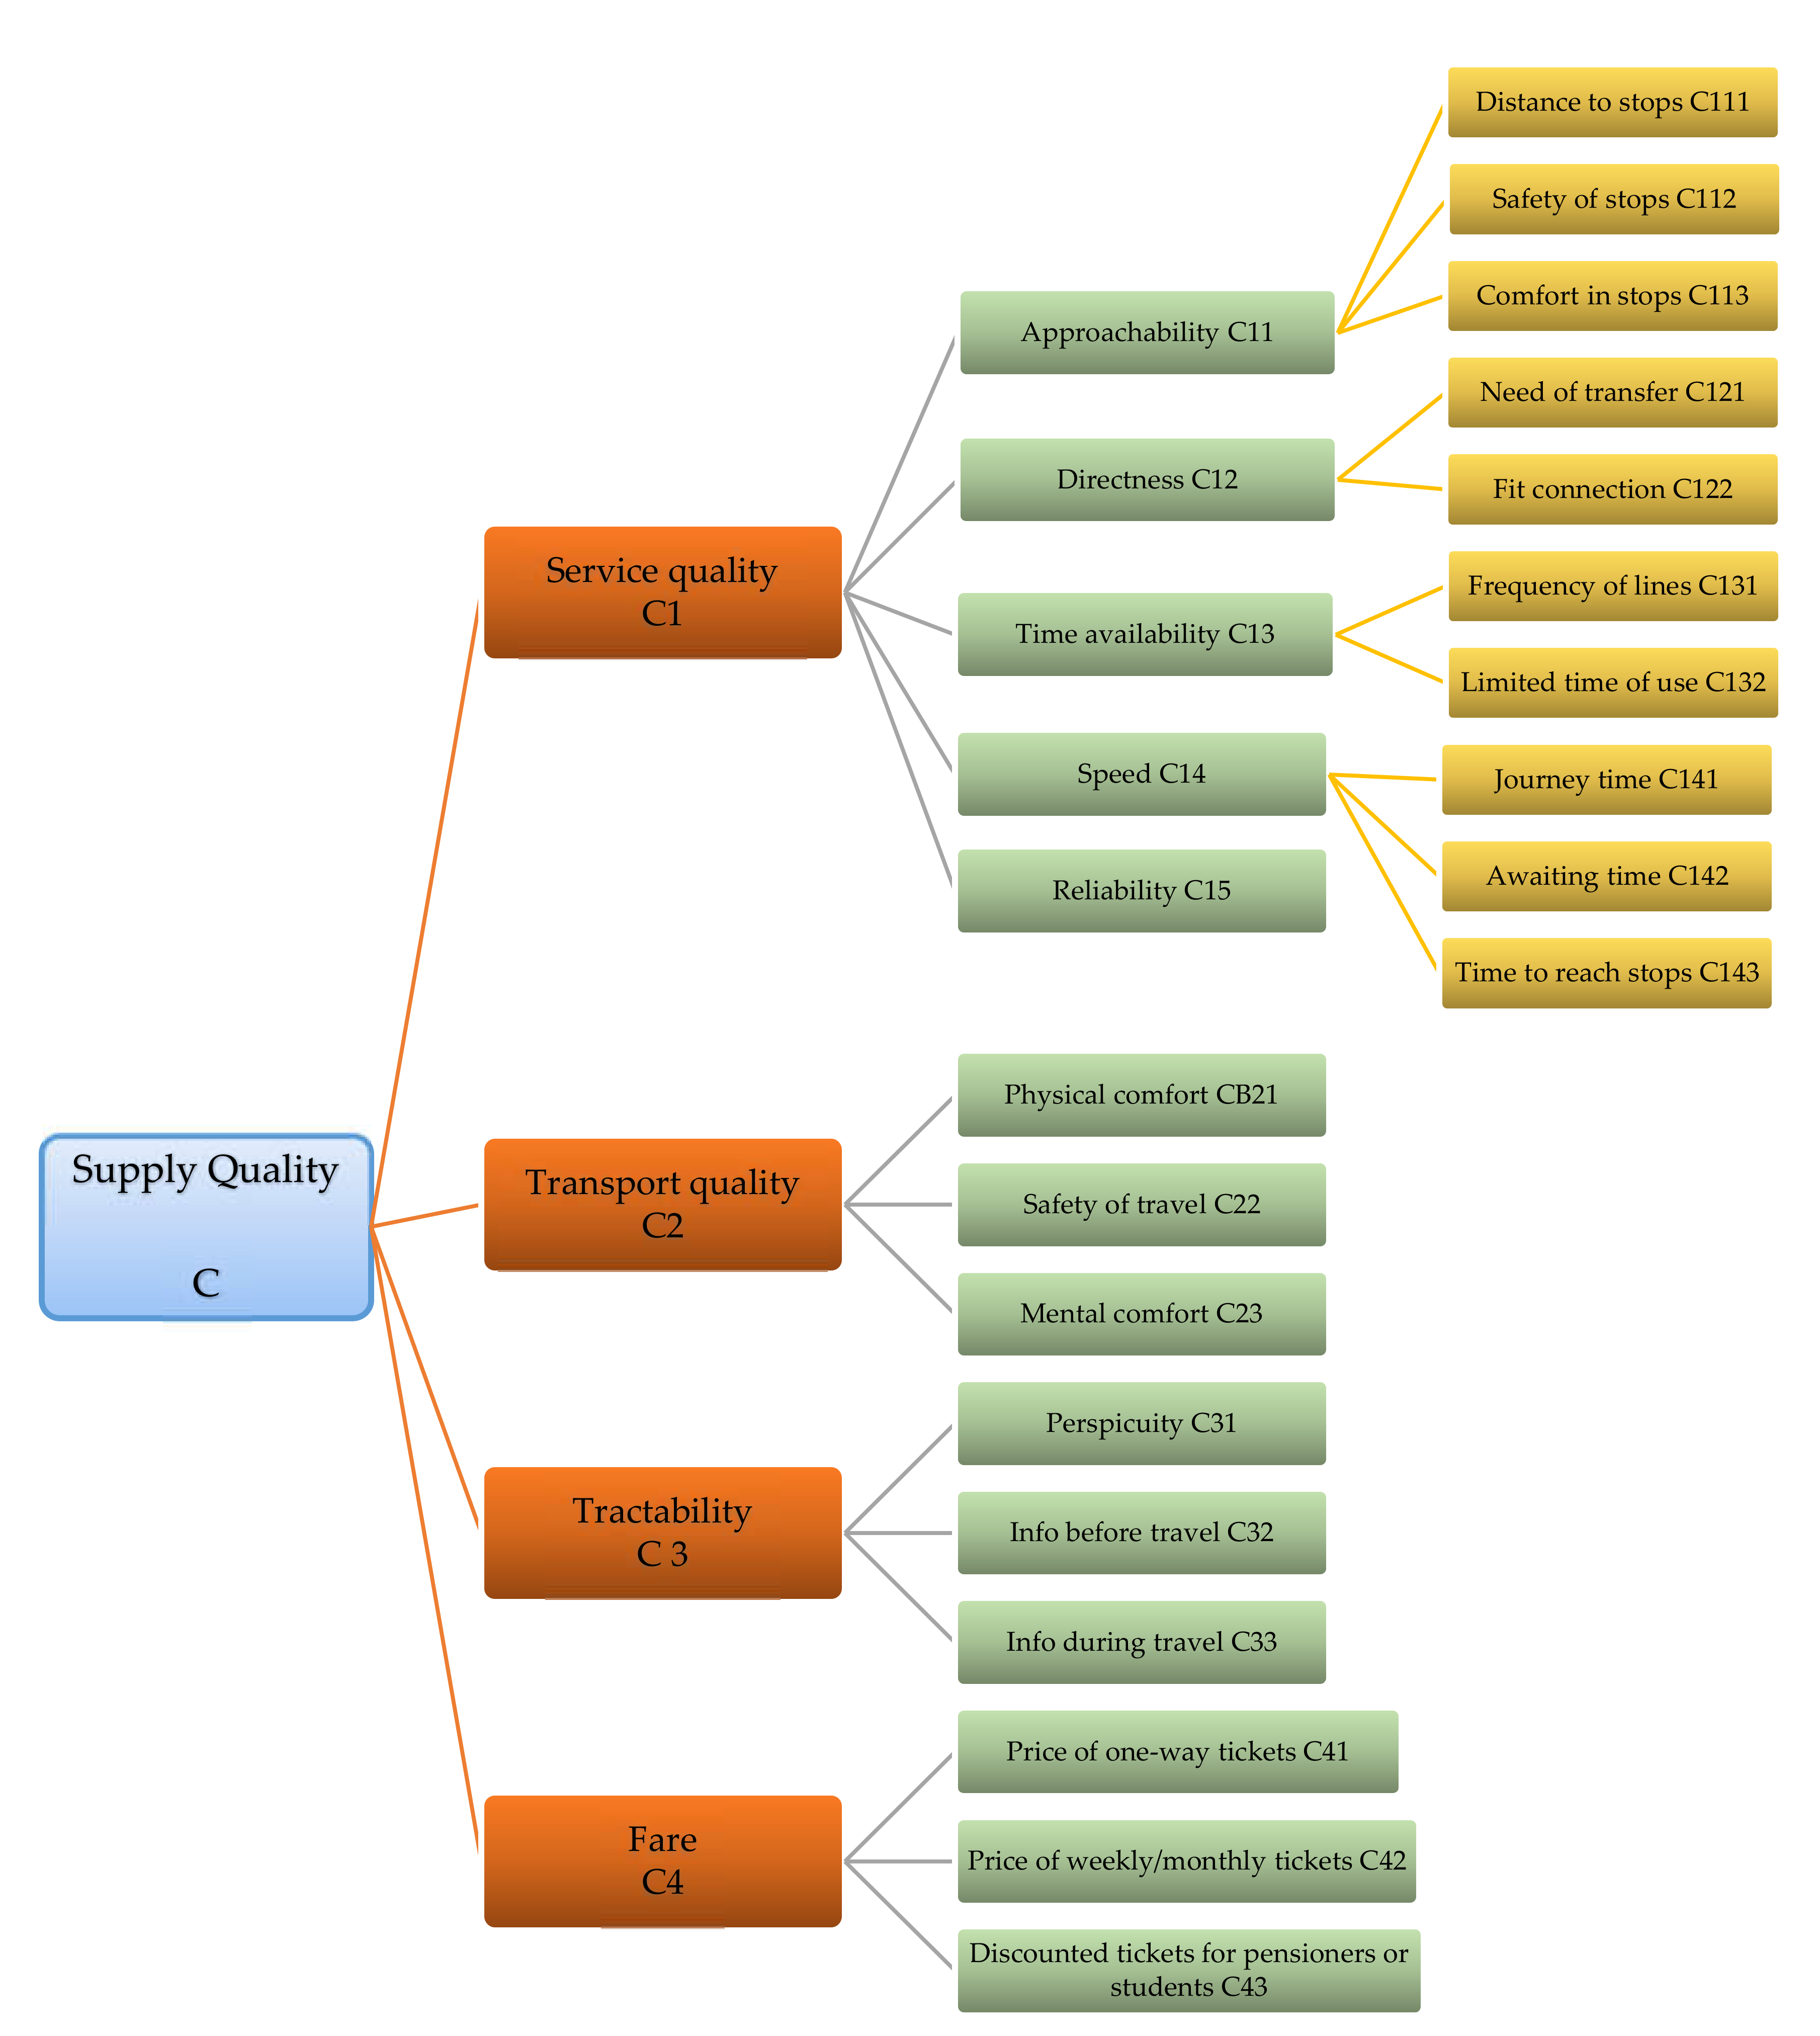
The second part of PBQ, which was designed based on the Saaty scale, was used to analyze the significant supply quality related to public transport. This study concerned the current public transportation situation in Amman and evaluated any decisions to improve it. For evaluation, the supply quality factors were designed in a three-level hierarchical structure with each factor symbolized with the code C, as shown in Figure 1. These supply quality factors have a significant influence on the public transportation system, as discussed in the foregoing studies [19,21].
There are 4 main criteria of the constructed model, the first one is Service Quality, which is everything excluding transport itself, and it has five sub-criteria. The second one is Transport Quality represents the real-time on the vehicle and it has three sub-criteria. The third one is Tractability, which means getting information from every aspect, has three sub-criteria. Lastly, Fare represents ticket types and price, and it has three sub-criteria.
2.2. Overview of the Conventional Analytic Hierarchy Process (AHP)
The hierarchical decision structure is the foundation of the Analytical Hierarchy Process (AHP), which is constructed from complex decision elements [30,31]. The hierarchical data structure generally consists of multilevels. The multilevels concept is a general structure for the hierarchy. The application was used to evaluate several transportation complex problems [32,33,34,35]
The importance of the linkages among the criteria in the different levels are determined by a global score for the criteria in the last level. The main steps of the conventional AHP follow:
- Set up the hierarchical structure of the decision problem. From the top, with the ultimate goal of the decision, then the objectives, through the intermediate levels (criteria on which subsequent elements depend), to the lowest level (which usually is a set of the alternatives). (Please see Figure 1 as an example for a decision hierarchy. This structure was used in this case study.)
- Construct the pairwise comparison matrices based on the hierarchy.
- For the comparisons, a questionnaire needs to be prepared.
- Check the consistency.
- Aggregate by the geometric mean.
- Weight vectors need to be derived.
- Calculate the global scores.
- Perform a sensitivity analysis.
The pairwise comparison matrices (PCMs) are a positive square matrix , where is the subjective ratio between and , and is the weight score from . The following equation can calculate the eigenvector method of Saaty, which defined for the PCMs:
where the maximum eigenvalue of the matrix is .
The structure of (5 × 5) consistent theoretical PCMs is defined in (2):
Reciprocity is applied for each pairwise comparison matrix , where is ensured. However, consistency is probably not performed for empirical matrices. The consistency criterion is
The questionnaire surveys were filled out by three decision-maker groups, taking into consideration the evaluated system factors related to public transportation established upon a Saaty’s scale (Table 2).
Eigenvector methodology contains inconsistency in the empirical matrices despite filled by the evaluators.
To have more robust outcomes, a consistency check was conducted by Saaty to examine the consistency of the PCMs:
where CI is the Consistency Index, the maximum eigenvalue of the PCM is , and m is the number of rows in the matrix. The following equation computes the consistency ratio (CR):
where the average of the consistency index (RI) and its values are presented in Table 3. The agreeable value of CR in the AHP approach is CR < 0.1.
CR = CI/RI
Sensitivity analysis enables in perceiving the effects of alternates in the main element on the subelement ranking, and helps the decision maker to check the stability of results throughout the process.
2.3. Overview on Best Worst Method (BWM)
The general model of BWM was customized to the decision problem of improving public bus transport. In our research, no alternatives were applied; only one matrix (5 5) in the second level of the hierarchy structure was evaluated since we relied on three different group considerations and did not strive to influence their judgments by any alternative selection.
To provide an overview of all stages for the recent survey, we defined the phases in the following order.
Step 1: Identify the main and submain criteria for public bus transport supply quality.
Step 2: Define the most important (MI) and the less important (LI) criteria by simple scoring of the participants.
Step 3: Evaluate the pairwise comparisons between MI criteria by using a 1–9 scale, where 1 is “equal importance” and 9 means “extremely more important.” The result of this step is represented by the following vector:
where is the preference of criterion B (the most important or the best) over the criterion j and . In our model n = 5, since we have five criteria to compare, j = (1, 2, …, 5).
Step 4: Make the pairwise comparisons between LI criteria by using the 1–9 scale. The result of this step is represented by the following vector:
where is the preference of criteria j (the most important or the best) over the criteria W, and . Since we have five criteria to compare in our model, j = (1, 2, … 5), then n = 5.
Step 5: Calculate the final optimal weight scores () of the criteria, and the indicator of the optimal consistency of comparisons .
The maximum absolute difference must be minimized:
After that, the solution can be obtained by solving the linear programming (LP) formula:
The following formula computes the consistency ratio to check the consistency of the comparisons [37]:
The consistency index (CI), presented in Table 4, is gained by random experiments for a different number of comparisons [38].
Consistency Ratio (CR) is acceptable in BWM methodology for the case when its value is between 0 and 1. This ratio can be calculated for individual evaluators, or for groups when the scores of the group are first aggregated by creating the geometric mean of the scores and then conducting the consistency check. In our case, the CR was checked individually.
In the following, an evaluation example with BWM method for the (5 × 5) matrix, which is an evaluator’s estimation regarding the MI and LI criteria are presented.
The example shown in Table 5 demonstrates the scoring of a respondent to the most important criteria, which in this case was Directness. The lower number indicates the closeness of other criteria to the most important one. The higher score represents a larger gap between the other criteria and the most important criterion.
In Table 6. the evaluator indicated Reliability as the less important criterion to be developed. The higher score represents the larger gap between the other criteria and the least important criterion.
Having selected the public transport service quality criteria and according to the BWM logic, the following questionnaire was created:
- Please select the most important (MI) and the less important (LI) criteria for improving public transport service quality;
- Please evaluate other criteria concerning the most important criteria by using (1–9) scale;
- Please evaluate other criteria concerning the less important criteria by using (1–9) scale.
We demonstrate the detailed calculation of the public transport service quality criteria scores for this example , computed by applying the BWM LP (see Equation (9)):
The weight scores for this specific evaluation are the following normalized values: , and the Consistency Ratio (CR = 0.1261) is acceptable because it is lower than 1.
2.4. The Proposed AHP–BWM Model
The proposed model aims to decrease the number of pairwise comparisons and improve their consistency. Reference [36] recommended avoiding 5 5 pairwise comparison matrices, due to the lack of consistency. For this reason, we adopt the BWM approach, not only to obtain more consistent pairwise comparison 5 5 matrices, but to also reduce the evaluated number of comparisons. This matter reflects the efficiency of the BWM approach in time and effort saving for both evaluators and analyzers.
In the simple AHP approach, to obtain a completed pairwise comparison matrix for an factor, we need to evaluate pairwise comparisons. On the other hand, the BWM method needs only PCs. For instance, if a problem consists of 20 factors, then the decision maker has to evaluate 190 PCs based on AHP approach, while she or he has to compare only 37 comparisons based on BWM. This matter shows the efficiency of BWM in time and effort savings for both decision makers and analyzers.
In the first level of the hierarchical model, the evaluators filled the matrix by factors with symbols in order to compare among PC1, PC2, and PC3.
In the pure AHP, the evaluator has to evaluate twenty-eight comparisons (12 comparisons for four (3 3) matrices + 1 comparison for one (2 2) matrix + 15 comparisons for (6 6) matrix).
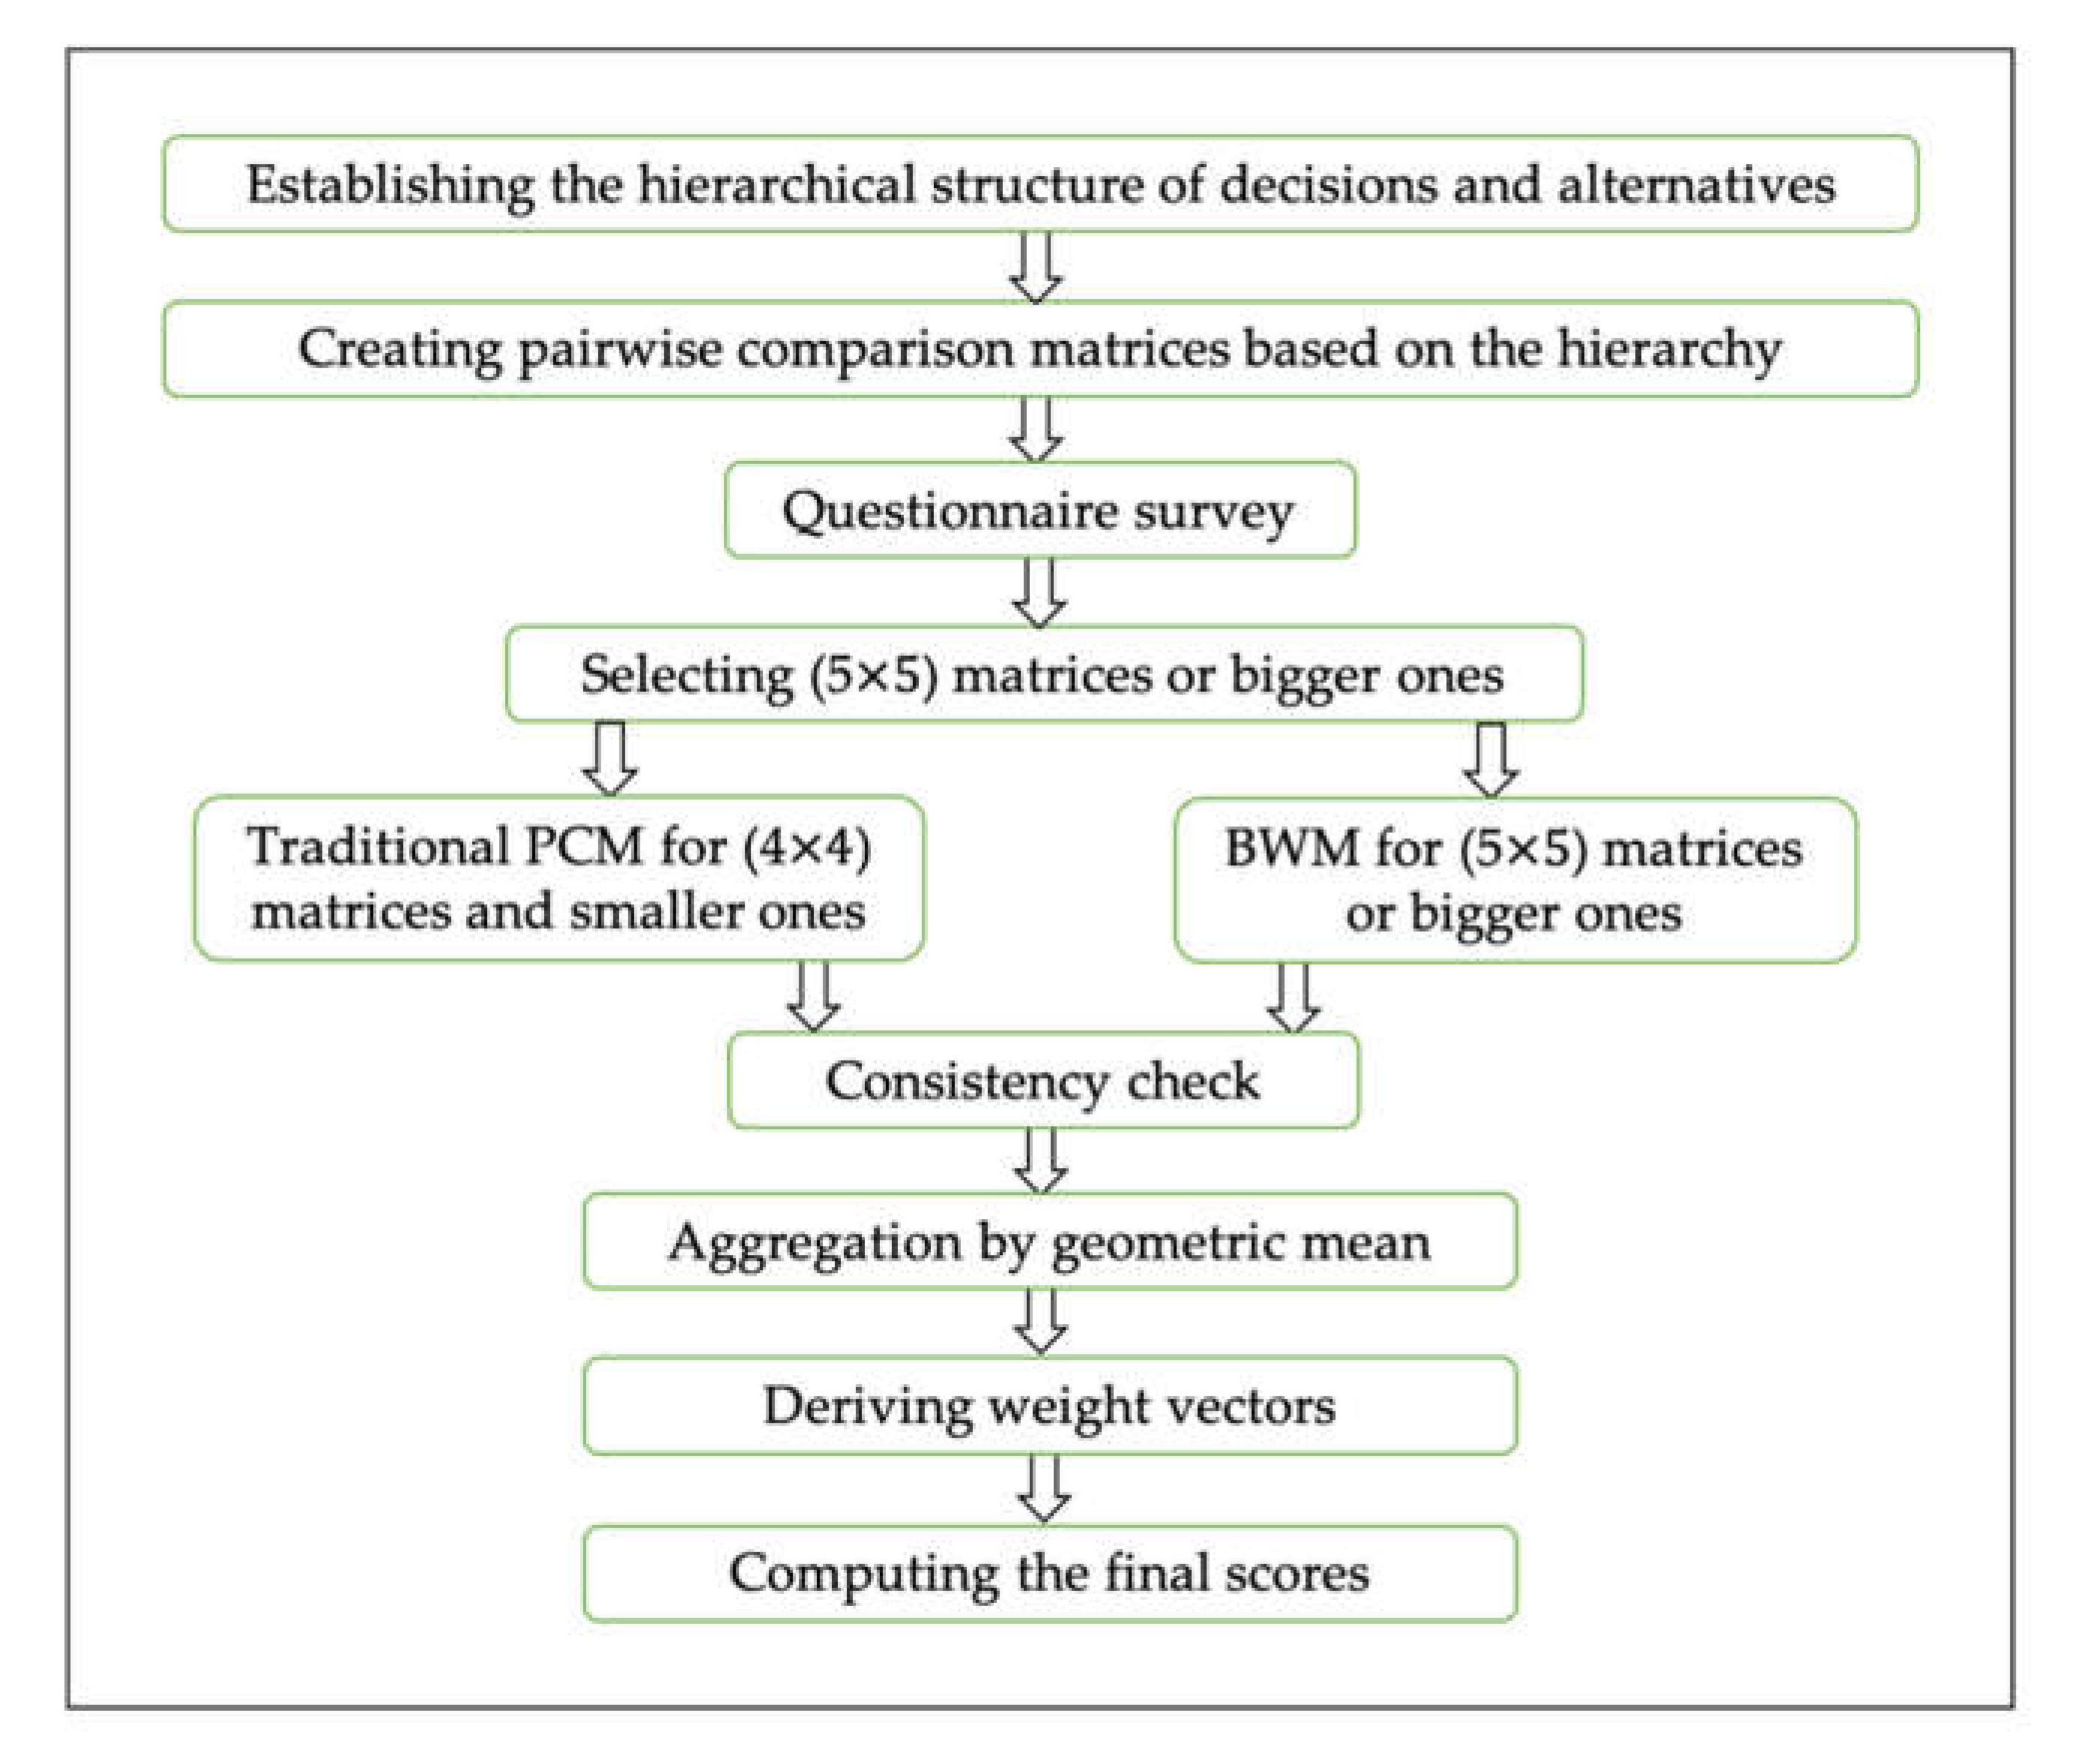
However, in the proposed AHP–BWM model, the evaluator has to evaluate only twenty comparisons. The main steps of the proposed AHP–BWM model are shown in Figure 2.
3. Results and Discussion
The AHP–BWM model was applied based on the size of matrices to evaluate more effectively the supply quality factors related to public transportation. Firstly, the analytic hierarchy process used for the hierarchical structure contains one (4 4) matrix, five (3 3) matrices, and two (2 2) matrices. The BWM was applied in the second level for the (5 5) matrix to compute the weight scores; this method helps us to perform only seven comparisons for the (5 5) matrix instead of 10 comparisons based on AHP. Furthermore, the reliability of the pairwise comparisons consistency in AHP and BWM was checked, and it was acceptable for all of them. Table 7 presents the weights and scores results for stakeholders in sequence (passengers, public transport experts, and municipal officials). An AHP survey was conducted in Amman, Jordan, to examine participants’ views on the supply quality of the public bus transport system. The optimal purpose was to provide Amman Municipality with a comprehensive evaluation approach for ranking public bus transportation development project proposals from the aspect of public and governmental needs. Participant groups consisted of three groups (passengers, public transport experts, and municipal officials). These three groups are believed to be most important to the success of the public transport system, especially the first group (passengers) because if they were satisfied, then the demand will be as expected and maybe more, consequently the system will succeed.
The properties of the conducted survey based on the model follow:
- -
- Two-hundred ten evaluators from different groups (5 municipal officials + 5 public transport experts in the relevant field + 200 public passengers) participated. The participants’ numbers are clearly not statistically representative, nevertheless all MCDM techniques (including AHP) give a deeper insight based on pairwise comparisons than simple statistical surveys [31].
- -
- Participants were randomly selected; the five public transport experts work in the transportation field and possess sufficient experience, while the five municipal officials work in Amman municipality and have enough experience.
- -
- The survey data were collected during January and February 2020, and analyzed in March 2020.
- -
- The approximate time of evaluating the questionnaire for passenger participants was 25 min while for public transport experts and municipal officials it took approximately 20 min; the results were highly consistent. A mentor helped both groups in the evaluation, which resulted in relatively good consistency with CR less than 0.1 for three participating groups.
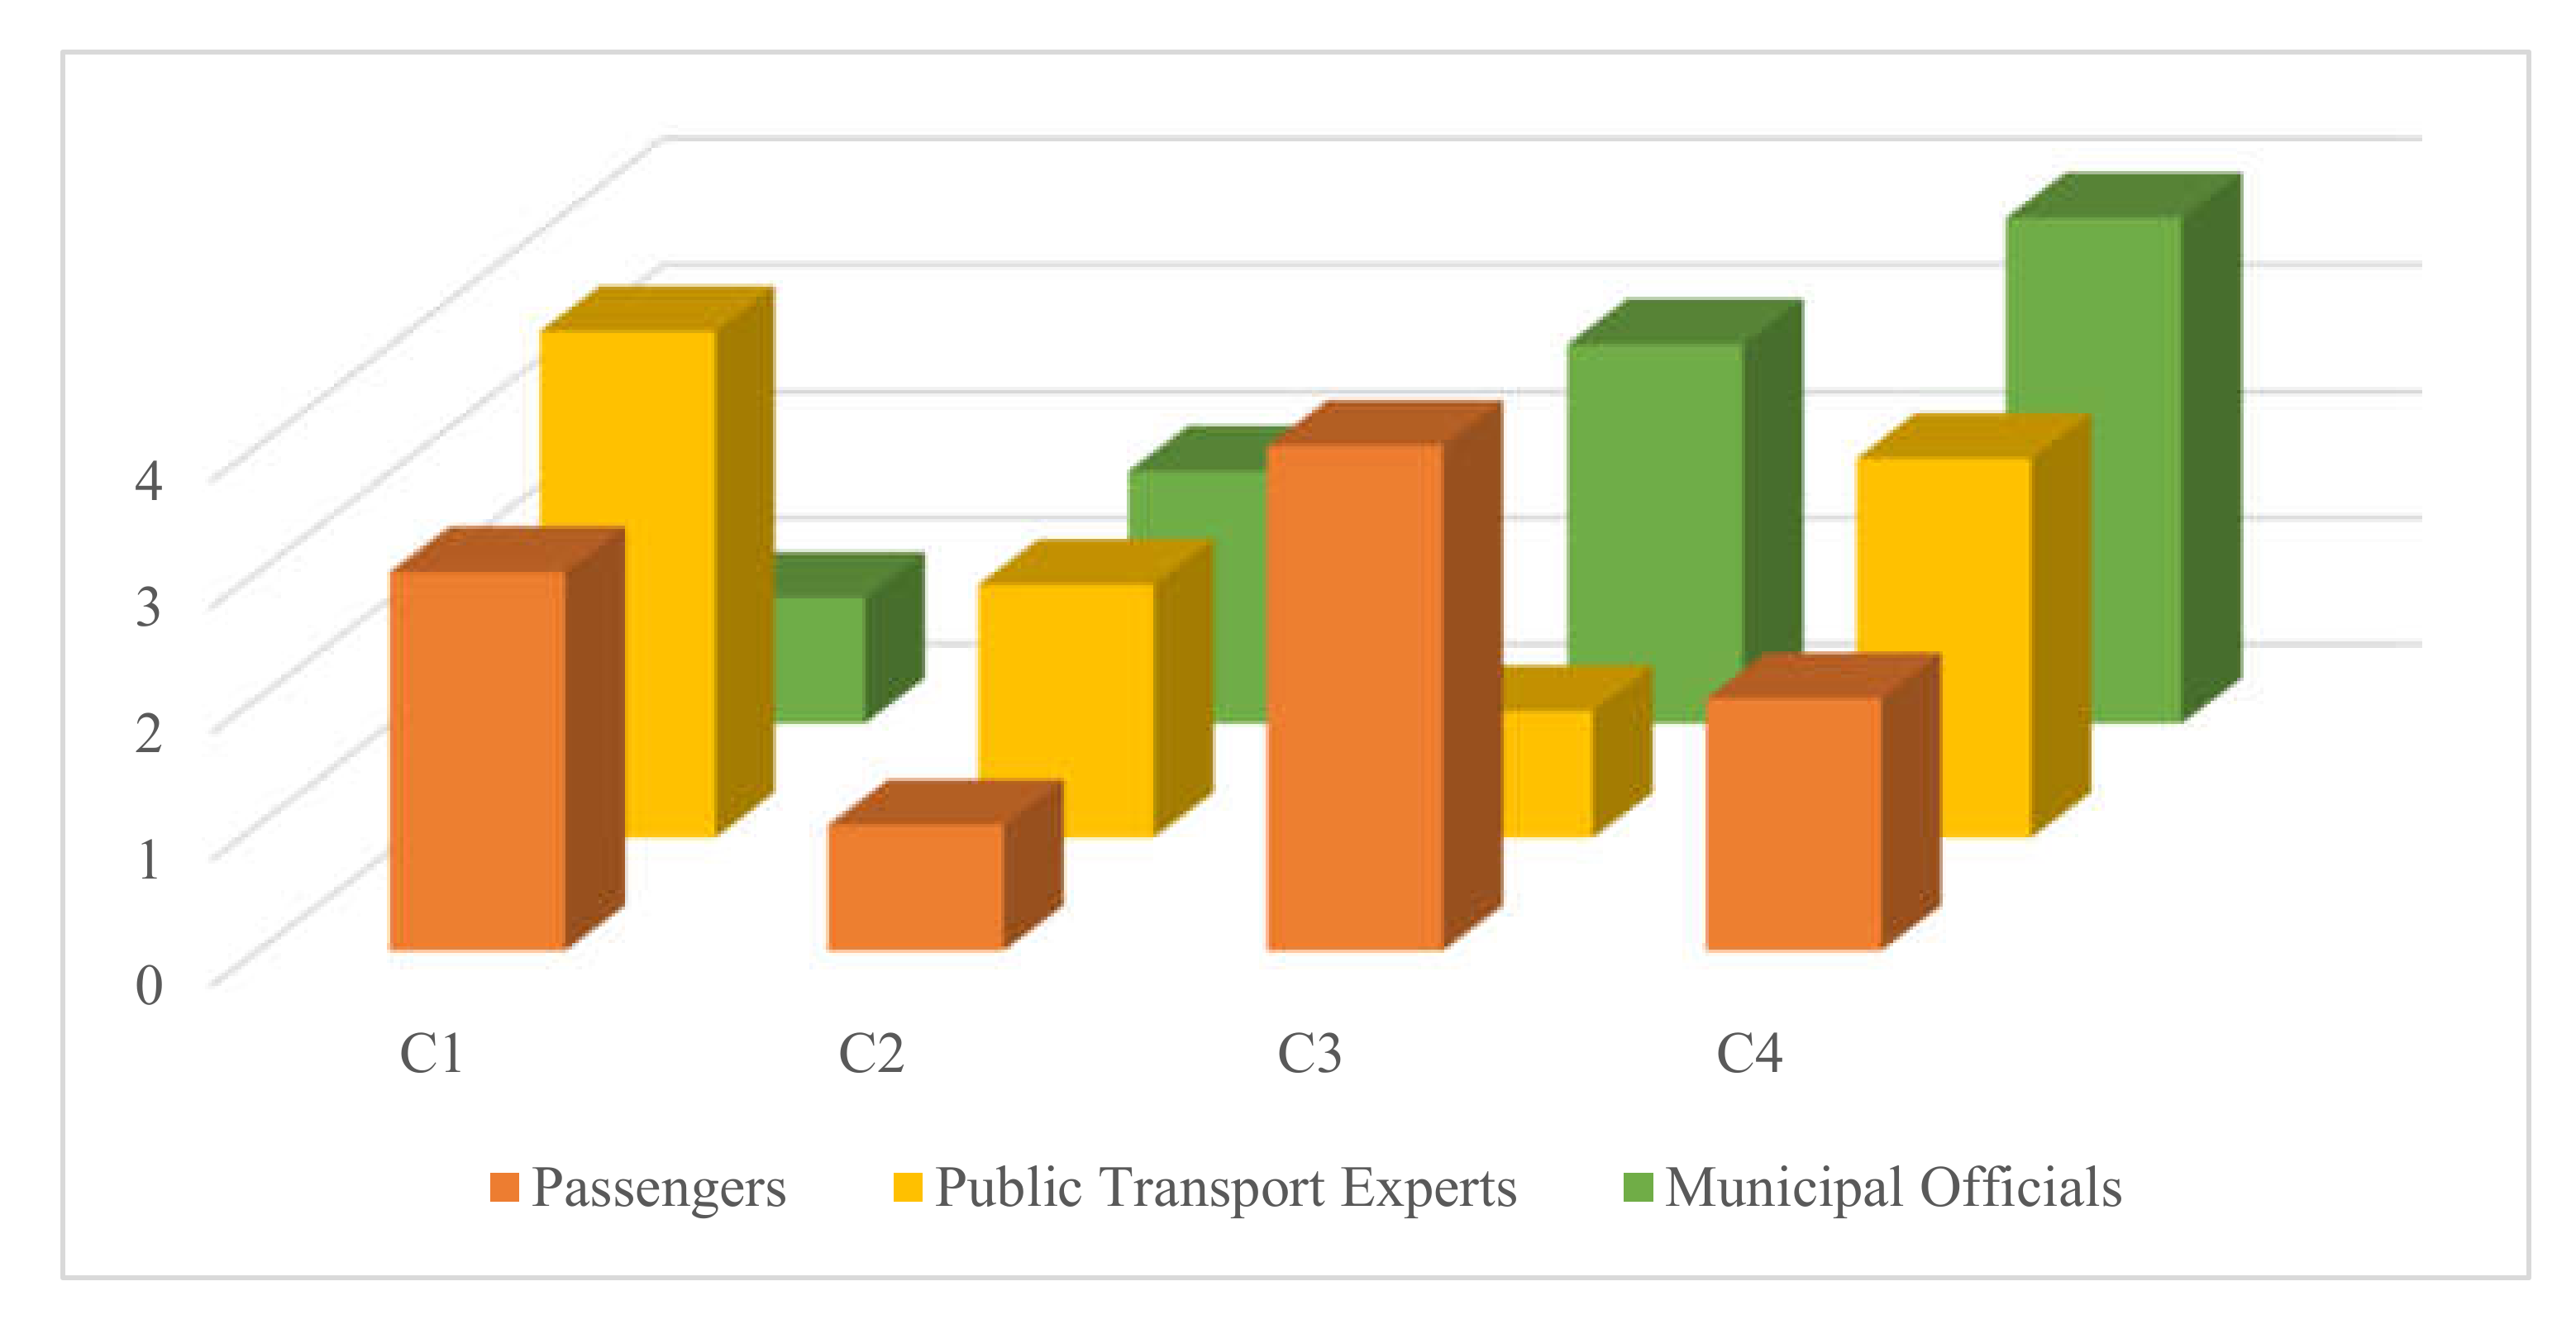
Based on the final weight scores for the first level (Table 7) it is visible that “Transport quality C2” improvement initiations, such as improvement in physical comfort, mental comfort, and safety of travel to raise passenger satisfaction, might be effective in the case of Amman. Municipal officials, seeing that improving the “Supply quality C1” is the top priority, may consider purchasing new buses to raise municipal officials’ satisfaction, which might be effective. But public transport experts have chosen “Tractability C3” as a top priority to be improved in the first place. This schism between the three stakeholders is interesting and leading to an optimal solution. There is no unified decision between the three decision makers on any one of the factors to improve in the first level. Service quality ranks third among the supply quality factors from the passengers’ point of view, while the public transport experts evaluated it in the eight position among the supply quality factors, which means that C1 is not the priority to be improved from their point of view, as shown in Figure 3.
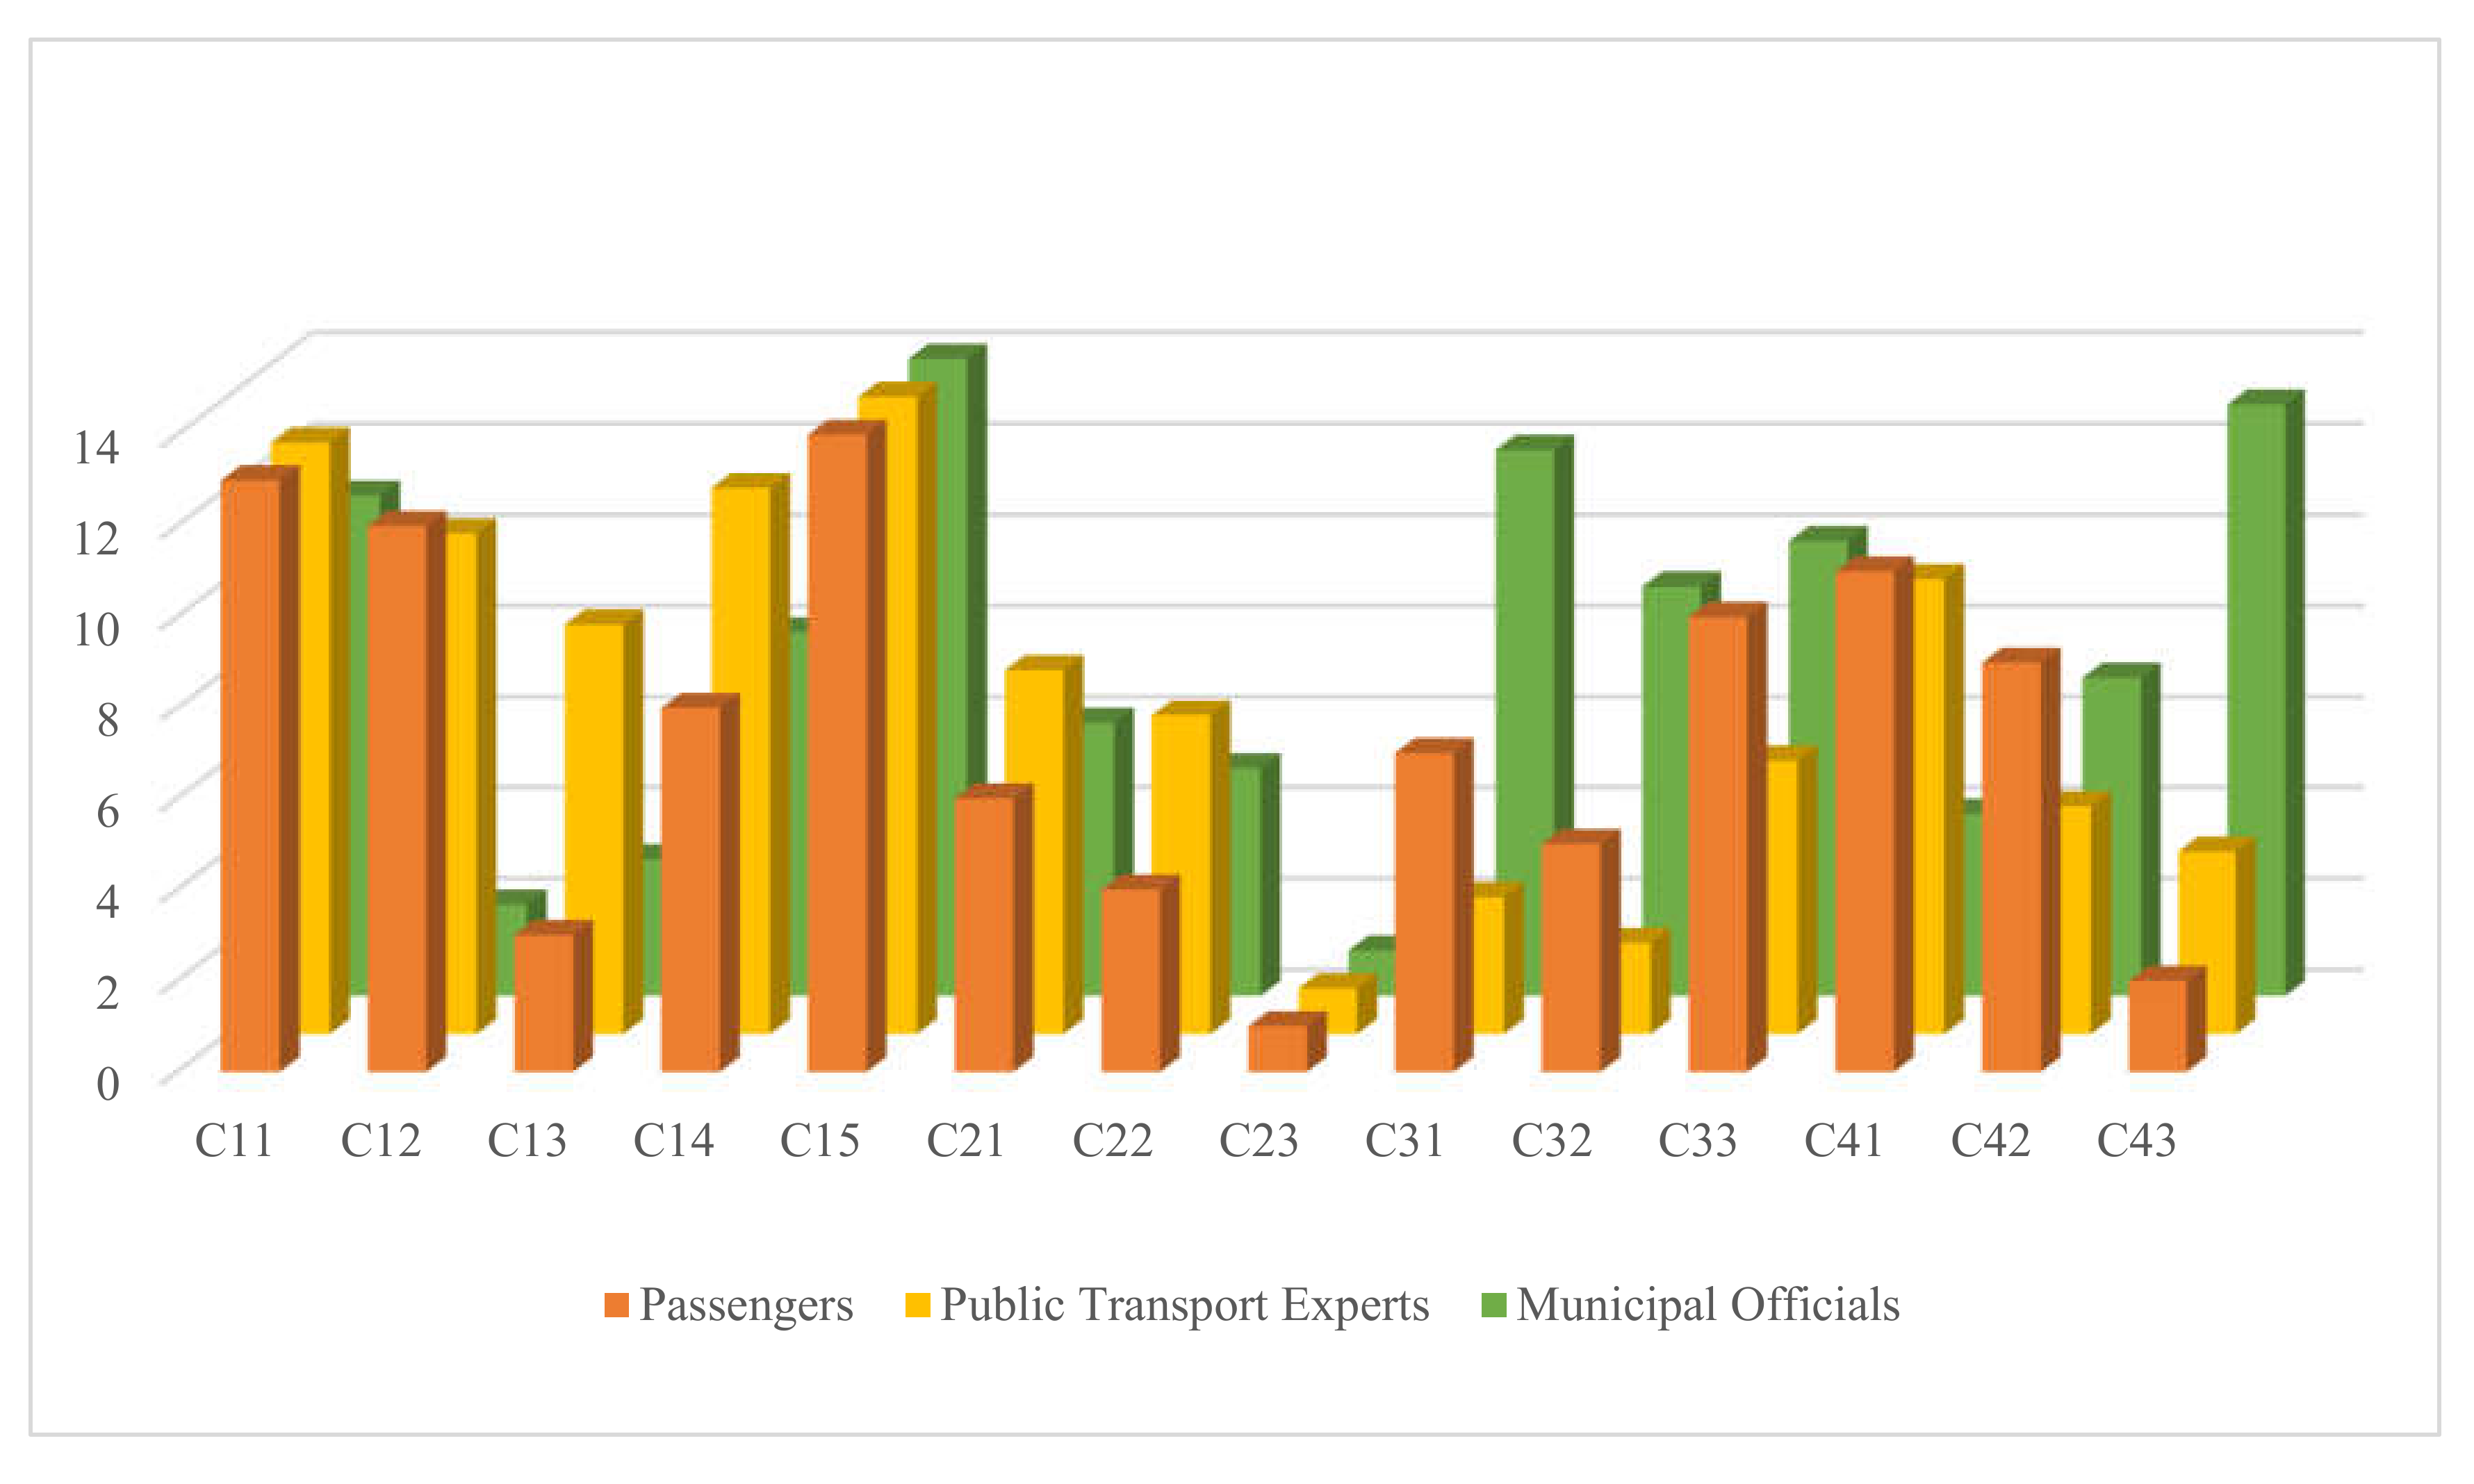
Table 8 demonstrates the results of the evaluator groups in level 2. The combined AHP–BWM model was applied due to three (3 3) matrices (AHP) and one (5 5) matrix (BWM). Level 2 results exhibit this phenomenon more explicitly (see Table 7). “Mental comfort C23” has the priority as it is ranked on the first position to be improved for the three groups. Reference [39] worked on the safety of public transportation in developing countries to improve it by conducting a specific agenda. This underlines the necessity of reorganizing the public bus network in the city, or might hint on examining the drivers’ behavior of public buses and on initiating the training of drivers to avoid and minimize the safety of travel issues, and accordingly, the mental comfort for the passengers will be improved. While “Discounted tickets for pensioners or students C43” has the priority to be improved from the passengers’ evaluation perspective, "Directness C12" is the second priority for municipal officials improve (second place in level 2), due to their belief that this criterion will raise the demand on public buses in the city. “Info before travel C32” has the second position for public transport experts (Figure 4); the experts believe that initiating a new mobile application to let the traveler know more information about the journey will raise the reliability and demand on public transportation above the current situation.
The application of AHP–BWM model resulted in more consistent weights, facilitating the completion of prepared questionnaires for the decision makers.
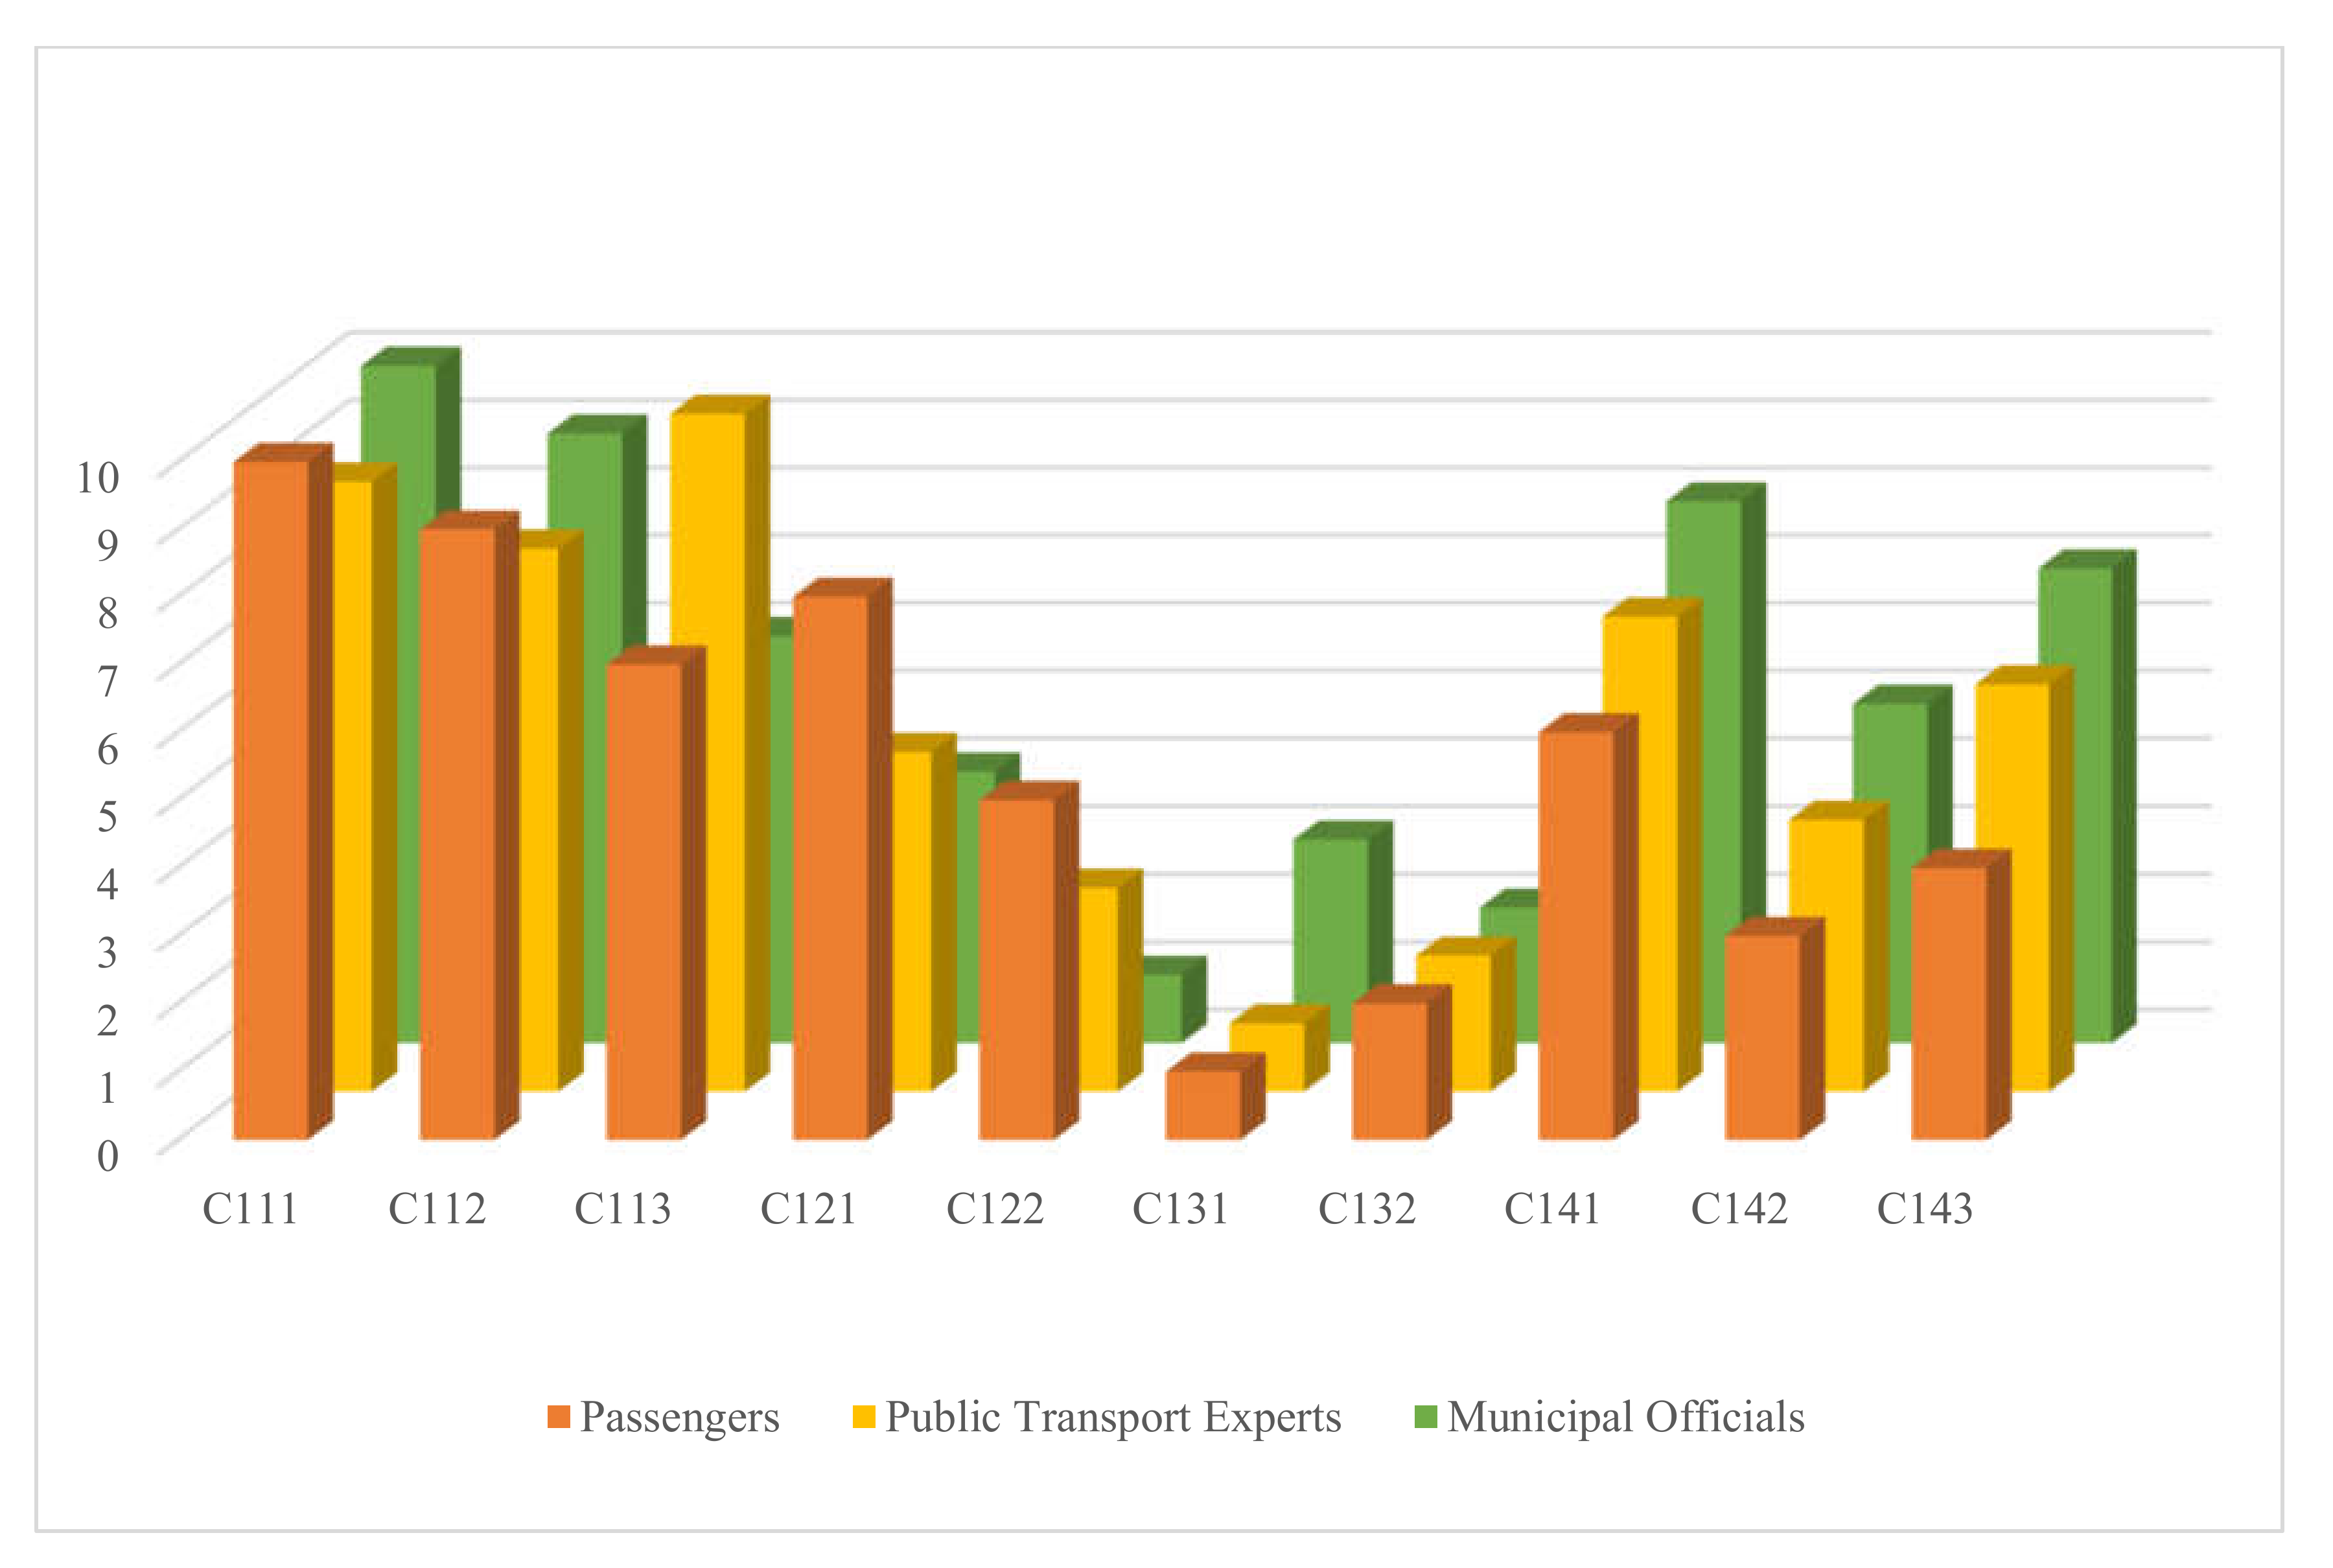
Table 9 presents the stakeholder results for level three in the sequence (passengers, public transport experts, and municipal officials). For the third level and from the municipal officials’ preferences, the model results showed “Fit connection (C122)” as the most significant supply quality factor related to public transportation. This result can be justified as that connection between bus lines and routes, or between buses and other types of public modes are essential to ensure the directness of the system [40], although “Frequency of lines (C131)” is the most significant criterion that needs improvement from the passengers’ point of view. Same as passengers, the public transport experts evaluated “Frequency of lines (C131)” as a priority to be improved subsequently, and the model results observed the “Distance to stop (C111)” criterion at the last position for both passengers and municipal officials (Figure 5), which means that it can be the last issue on the list to be improved.
3.1. Sensitivity Analysis
The final priorities of the alternatives rely highly on the weights linked to the main criteria. Minor changes within the relative weights can, therefore, cause major changes in the final ranking. Since these weights are usually based on highly subjective evaluation and judgments, the stableness of the ranking under varying criteria weights needs to be tested. For this purpose, sensitivity analysis can be performed based on scenarios that reflect alternative future developments or different views on the relative importance of the criteria [41]. Through increasing or decreasing the weight of individual criteria, the resulting changes within the priorities and thus the ranking of the alternatives are often observed. Sensitivity analysis, therefore, provides information on the stableness of the ranking. If the ranking is extremely sensitive to small changes within the standard weights, a careful review of the weights is usually recommended. In addition to this, decision criteria should be included as a sensitive ranking point to a weak discrimination potential for this set of criteria.
For this purpose, the weights of the important criteria are separately altered, simulating weights between 0% and 100%.
Performance sensitivity of alternatives was analyzed for the three decision groups. For the passengers’ group (see Table 10), when “Transport quality” was increased from 0.3559 to 0.36, this change did not affect the first level and each criterion kept its same position, while a change was detected in the second level. “Physical comfort” moved to the fifth position in place of the “Info before travel” criterion, while in the third level, the “Safety of stops” criterion fell to the seventh position instead of “Comfort of stops”, which means that minor changes were detected for the passengers’ group.
For the public transport expert group, the change of scores is very minor in the first level and did not change the position of the criteria, but in level 2 some changes were observed due to the sensitivity analysis check. The “Info before travel” attribute moved to the first position for this minor change and “Time availability” improved its ranking by moving to the seventh position. Thus, level 2 was found to be sensitive (shown in Table 11). “Physical comfort” and “Mental comfort” both fell by one position. In level 3, the attributes proved to be stable in their rankings, especially for the first five positions, while the ranking was otherwise changed, as shown in Table 11.
For the municipal officials group, interestingly, the change had an effect on the score positions for criteria when the weight of the “Transport Quality” criterion was changed from 0.3473 to 0.3500. The ranking was changed in the first level; “Fare” moved to the third position instead of “Tractability”, but in level 2 some changes were observed due to the sensitivity analysis check. The “Directness” attribute moved to the first position for this minor change, and “Safety of travel” moved to the second position. Hence, level 2 was found to be sensitive, as shown in Table 12. Level 3 was affected by the sensitivity check, but “Fit connection” proved to be stable even when the sensitivity check was conducted, and kept its first position in this level. Nevertheless, the “Need of transfer” criterion rose to the second position from its previous fourth position (Table 12).
3.2. Comparison of the Proposed AHP–BWM Model with Traditional AHP and BWM Approaches
Table 13 shows the basic differences between the proposed model and the pure AHP approach, taking in consideration the constructed hierarchy structure of public bus transport supply quality.
As Table 13 demonstrates, the proposed AHP–BWM model is between the AHP and BWM models from the aspect of pairwise comparisons, evaluation time, and level of consistency. We have to emphasize, however, that although BWM has significant practical advantage compared to AHP due to the less demanding evaluation phase, AHP covers all possible pairwise comparisons among the decision attributes. Thus, AHP provides more information on the relation of the attribute pairs than BWM. The AHP–BWM model created combines the advantages of the two original methods. It preserves the complete information of AHP in the case of smaller pairwise comparison branches in the decision structure, but in those cases, in which total pairwise comparisons would be demanding and probably inconsistent, it applies BWM.
3.3. AHP–BWM vs. SAW and SEM
Since public transport quality evaluations are generally conducted by two mainstream modeling techniques, Simple Additive Weighting (SAW) [42] and Structural Equation Modeling (SEM) [43], we present the comparison of our proposed AHP–BWM model with them. Obviously, the survey procedure is very different for the three different methodologies, so the comparison is just based on qualitative aspects.
Table 14 shows that the new method is competitive with the two other general methodologies, especially in the case when consistency is highly important for the decision makers. Obviously, SAW and SEM are well applicable and SAW can be recommended when low consistency is not a risk in the final derivation of the scores of attributes. SEM is suggested in those cases in which the interactions of the attributes are possible and important from the aspect of the final result.
4. Conclusions
Creating an appropriate methodology is a crucial issue in every survey-based decision support system. The results gained need to provide sufficient information for the analysis but simultaneously, the survey should be easy to conduct without burdening the respondents with complex and time-consuming questionnaires.
Based on our results, the integrated AHP–BWM model fulfills these requirements. Amending AHP on the selected level of the decision hierarchy avoids the huge number of pairwise comparisons while maintaining the consistency requirement of the evaluations. Obviously, in BWM we lose some information due to the reduced comparisons; that is why we kept the AHP for the other levels. We can conclude that there is a tradeoff between the information gained by the responses and the saving of time and energy for the respondents in the survey process. However, the AHP–BWM model introduced can balance between these two conflicting criteria and makes the survey closer to optimal.
The analysis and results presented indicate that the consistency of the responses is provided both for the AHP and BWM parts; moreover, the priority ranking gained is robust, as proven by the conducted sensitivity check. The new model requires a simple questionnaire with relatively short response duration and high response rate. Further, the computational time of the analysis is low and without the need for huge calculation capacity. The results are understandable and easy to present for the decision makers.
Limitation of the research is the representativity of the survey pattern, which could be extended in future studies. In addition, a comparison with other techniques, for instance, Structural Equation Modeling (SEM), is recommended to reveal similarities and differences of the attribute priorities gained.
As a remark for further research, other applications are suggested to discover the real nature of the proposed hybrid AHP–BWM model, concentrating on the benefits and still uncovered pitfalls of the methodology.
Author Contributions
Conceptualization, S.M. and A.A.; methodology, S.M. and A.A.; validation and formal analysis, S.M.; resources, S.M. and A.A.; data curation, A.A.; writing—draft preparation, S.D., S.M., and A.A.; writing, S.M. and A.A.; review and editing, A.A., S.M., K.I., and S.D.; visualization, K.I. and S.D. All authors have read and agreed to the published version of the manuscript.
Funding
This research did not receive any funding.
Conflicts of Interest
The authors declare no conflict of interest.
References
- De Oña, J.; de Oña, R.; Diez-Mesa, F.; Eboli, L.; Mazzulla, G. A Composite Index for Evaluating Transit Service Quality across Different User Profiles. J. Public Transp. 2016, 19, 128–153. [Google Scholar] [CrossRef] [Green Version]
- Dodgson, J.S.; Katsoulacos, A.Y. Quality competition in bus services. Some welfare implications of bus deregulation. J. Transp. Econ. Policy 1988, 21, 263–281. [Google Scholar]
- Beirão, G.; Cabral, J.A.S. Understanding attitudes towards public transport and private car: A qualitative study. Transp. Policy 2007, 14, 478–489. [Google Scholar] [CrossRef]
- Too, L.; Earl, G. Public transport service quality and sustainable development: A community stakeholder perspective. Sustain. Dev. 2010, 18, 51–61. [Google Scholar] [CrossRef]
- Jen, W.; Tu, R.; Lu, T. Managing passenger behavioral intention: An integrated framework for service quality, satisfaction, perceived value, and switching barriers. Transportation (Amsterdam) 2011, 38, 321–342. [Google Scholar] [CrossRef]
- Barabino, B.; Deiana, E.; Tilocca, P. Measuring service quality in urban bus transport: A modified SERVQUAL approach. Int. J. Qual. Serv. Sci. 2012, 4, 238–252. [Google Scholar] [CrossRef]
- Abdullah, K.; Jan, M.T.; Manaf, N.H.A. A structural equation modelling approach to validate the dimensions of servperf in airline industry of Malaysia. Int. J. Eng. Manag. Sci. 2012, 3, 134–141. [Google Scholar]
- Román, C.; Martín, J.C.; Espino, R. Using Stated Preferences to Analyze the Service Quality of Public Transport. Int. J. Sustain. Transp. 2014, 8, 28–46. [Google Scholar] [CrossRef]
- Bakti, I.G.M.Y.; Sumaedi, S. Quality paper P-TRANSQUAL: A service quality model of public land transport services. Int. J. Qual. Reliab. Manag. 2015, 32, 534–558. [Google Scholar] [CrossRef]
- Becker, J.U.; Albers, S. The limits of analyzing service quality data in public transport. Transportation (Amsterdam) 2016, 43, 823–842. [Google Scholar] [CrossRef]
- Islam, M.R.; Hadiuzzaman, M.; Banik, R.; Hasnat, M.M.; Musabbir, S.R.; Hossain, S. Bus service quality prediction and attribute ranking: A neural network approach. Public Transp. 2016, 8, 295–313. [Google Scholar] [CrossRef]
- Chica-Olmo, J.; Gachs-Sánchez, H.; Lizarraga, C. Route effect on the perception of public transport services quality. Transp. Policy 2018, 67, 40–48. [Google Scholar] [CrossRef] [Green Version]
- Bencherif, H.; Boubakour, F. The quality of service in urban public transport in Algeria. Int. J. Qual. Serv. Sci. 2019, 11, 559–575. [Google Scholar]
- Duleba, S.; Mishina, T.; Shimazaki, Y. A dynamic analysis on public bus transport’s supply quality by using AHP. Transport 2012, 27, 268–275. [Google Scholar] [CrossRef]
- Chen, I.S. A combined MCDM model based on DEMATEL and ANP for the selection of airline service quality improvement criteria: A study based on the Taiwanese airline industry. J. Air Transp. Manag. 2016, 57, 7–18. [Google Scholar] [CrossRef]
- Nassereddine, M.; Eskandari, H. An integrated MCDM approach to evaluate public transportation systems in Tehran. Transp. Res. Part. A Policy Pract. 2017, 106, 427–439. [Google Scholar] [CrossRef] [Green Version]
- Perçin, S. Evaluating airline service quality using a combined fuzzy decision-making approach. J. Air Transp. Manag. 2018, 68, 48–60. [Google Scholar] [CrossRef]
- Güner, S. Measuring the quality of public transportation systems and ranking the bus transit routes using multi-criteria decision making techniques. Case Stud. Transp. Policy 2018, 6, 214–224. [Google Scholar] [CrossRef]
- Duleba, S.; Moslem, S. Sustainable Urban Transport Development with Stakeholder Participation, an AHP-Kendall Model: A Case Study for Mersin. Sustainability 2018, 10, 3647. [Google Scholar] [CrossRef] [Green Version]
- Duleba, S.; Moslem, S. Examining Pareto optimality in analytic hierarchy process on real Data: An application in public transport service development. Expert Syst. Appl. 2019, 116, 21–30. [Google Scholar] [CrossRef]
- Alkharabsheh, A.; Moslem, S.; Duleba, S. Evaluating Passenger Demand for Development of the Urban Transport System by an AHP Model with the Real-World Application of Amman. Appl. Sci. 2019, 9, 4759. [Google Scholar] [CrossRef] [Green Version]
- Moslem, S.; Farooq, D.; Ghorbanzadeh, O.; Blaschke, T. Application of the AHP-BWM Model for Evaluating Driver Behavior Factors Related to Road Safety: A Case Study for Budapest. Symmetry 2020, 12, 243. [Google Scholar] [CrossRef] [Green Version]
- Moslem, S.; Duleba, S. Sustainable Urban Transport Development by Applying a Fuzzy-AHP Model: A Case Study from Mersin, Turkey. Urban. Sci. 2019, 3, 55. [Google Scholar] [CrossRef] [Green Version]
- Ghorbanzadeh, O.; Moslem, S.; Blaschke, T.; Duleba, S. Sustainable urban transport planning considering different stakeholder groups by an interval-AHP decision support model. Sustainability 2018, 11, 9. [Google Scholar] [CrossRef] [Green Version]
- Pérez, J.C.; Carrillo, M.H.; Montoya-Torres, J.R. Multi-criteria approaches for urban passenger transport systems: A literature review. Ann. Oper. Res. 2014, 226, 69–87. [Google Scholar] [CrossRef]
- Macharis, C.; de Witte, A.; Ampe, J. The multi-actor, multi-criteria analysis methodology (MAMCA) for the evaluation of transport projects: Theory and practice. J. Adv. Transp. 2009, 43, 183–202. [Google Scholar] [CrossRef]
- Lambas, M.E.L.; Giuffrida, N.; Ignaccolo, M.; Inturri, G. Comparison between bus rapid transit and light-rail transit systems: A multi-criteria decision analysis approach. WIT Trans. Built Environ. 2018, 176, 143–154. [Google Scholar]
- Lupo, T. Strategic analysis of transit service quality using fuzzy AHP methodology. Eur. Transp. Trasp. Eur. 2013, 53, 1–18. [Google Scholar]
- Büyüközkan, G.; Çifçi, G.; Güleryüz, S. Strategic analysis of healthcare service quality using fuzzy AHP methodology. Expert Syst. Appl. 2011, 38, 9407–9424. [Google Scholar] [CrossRef]
- Darko, A.; Chan, A.P.C.; Ameyaw, E.E.; Owusu, E.K.; Pärn, E.; Edwards, D.J. Review of application of analytic hierarchy process (AHP) in construction. Int. J. Constr. Manag. 2019, 19, 436–452. [Google Scholar] [CrossRef]
- Saaty, T.L. How to make a decision: The analytic hierarchy process. Eur. J. Oper. Res. 1990, 48, 9–26. [Google Scholar] [CrossRef]
- Moslem, S.; Gul, M.; Farooq, D.; Celik, E.; Ghorbanzadeh, O.; Blaschke, T. An Integrated Approach of Best-Worst Method (BWM) and Triangular Fuzzy Sets for Evaluating Driver Behavior Factors Related to Road Safety. Mathematics 2020, 8, 414. [Google Scholar] [CrossRef] [Green Version]
- Farooq, D.; Moslem, S.; Faisal Tufail, R.; Ghorbanzadeh, O.; Duleba, S.; Maqsoom, A.; Blaschke, T. Analyzing the Importance of Driver Behavior Criteria Related to Road Safety for Different Driving Cultures. Int. J. Environ. Res. Public Health 2020, 17, 1893. [Google Scholar] [CrossRef] [PubMed] [Green Version]
- Moslem, S.; Ghorbanzadeh, O.; Blaschke, T.; Duleba, S. Analysing Stakeholder Consensus for a Sustainable Transport Development Decision by the Fuzzy AHP and Interval AHP. Sustainability 2019, 11, 3271. [Google Scholar] [CrossRef] [Green Version]
- Farooq, D.; Moslem, S.; Duleba, S. Evaluation of driver behavior criteria for evolution of sustainable traffic safety. Sustainability 2019, 11, 3142. [Google Scholar] [CrossRef] [Green Version]
- Saaty, T.L. A scaling method for priorities in hierarchical structures. J. Math. Psychol. 1977, 15, 234–281. [Google Scholar] [CrossRef]
- Rezaei, J. Best-worst multi-criteria decision-making method. Omega (UK) 2015, 53, 49–57. [Google Scholar] [CrossRef]
- Rezaei, J. Best-worst multi-criteria decision-making method: Some properties and a linear model. Omega (UK) 2016, 64, 126–130. [Google Scholar] [CrossRef]
- Joewono, T.B.; Kubota, H. Safety and Security Improvement in Public Transportation Based on Public Perception in Developing Countries. IATSS Res. 2006, 30, 86–100. [Google Scholar] [CrossRef] [Green Version]
- Chen, X.; Yu, L.; Zhang, Y.; Guo, J. Analyzing urban bus service reliability at the stop, route, and network levels. Transp. Res. Part. A Policy Pract. 2009, 43, 722–734. [Google Scholar] [CrossRef]
- Chang, C.W.; Wu, C.R.; Lin, C.T.; Chen, H.C. An application of AHP and sensitivity analysis for selecting the best slicing machine. Comput. Ind. Eng. 2007, 52, 296–307. [Google Scholar] [CrossRef]
- Wang, Y.J. A fuzzy multi-criteria decision-making model based on simple additive weighting method and relative preference relation. Appl. Soft Comput. J. 2015, 30, 412–420. [Google Scholar] [CrossRef]
- Shen, W.; Xiao, W.; Wang, X. Passenger satisfaction evaluation model for Urban rail transit: A structural equation modeling based on partial least squares. Transp. Policy 2016, 46, 20–31. [Google Scholar] [CrossRef]
Figure 1.
The hierarchical model of the public bus transportation supply quality criteria [21].
Figure 1.
The hierarchical model of the public bus transportation supply quality criteria [21].

Figure 2.
Steps of the proposed Best Worst Method–Analytic Hierarchy Process (BWM–AHP) model.

Figure 3.
The main factors ranks based on the different group preferences in the first level.

Figure 4.
The subfactors rank based on the different group preferences on the second level.

Figure 5.
The subfactors ranks based on the different group preferences on the third level.


Table 1.
Pattern characteristics of participated evaluators.
| Variables | Passengers | Public Transport Experts | Municipal Officials |
|---|---|---|---|
| N | 200 | 5 | 5 |
| Gender (%) | |||
| Male | 51 | 100 | 40 |
| Female | 49 | 0 | 60 |
Table 2.
Saaty’s determination scale for relative weight score of elements [36].
Table 2.
Saaty’s determination scale for relative weight score of elements [36].
| Numerical Values | Explanation |
|---|---|
| 1 | Elements are equally importance |
| 3 | Element is more important over another. |
| 5 | One element is strongly important than the other one |
| 7 | One element is very strongly important than the other one |
| 9 | One element is favored by at least an order of magnitude |
| 2, 4, 6, 8 | Used to compromise between two judgments |
Table 3.
Average of the consistency indices (RI) from randomly generated matrices.
| m | 1 | 2 | 3 | 4 | 5 |
| RI | 0 | 0 | 0.58 | 0.9 | 1.12 |
Table 4.
The consistency index (CI) values for computing the consistency ratio.
| 1 | 2 | 3 | 4 | 5 | |
|---|---|---|---|---|---|
| CI | 0 | 0.44 | 1 | 1.63 | 2.3 |
Table 5.
Example of evaluating service quality criteria by comparing to the most important one.
| Service Quality | Approachability | Directness | Time Availability | Speed | Reliability |
|---|---|---|---|---|---|
| MI criteria: (Directness) | 3 | 1 | 5 | 2 | 7 |
Table 6.
Example of evaluating service quality criteria by comparing to the least important one.
| Service Quality | Approachability | Directness | Time Availability | Speed | Reliability |
|---|---|---|---|---|---|
| LI criteria: (Reliability) | 4 | 6 | 5 | 3 | 1 |
Table 7.
The final weights and level ranks for the factors in the first level.
| Factor | Decision Maker | Weight | Rank |
|---|---|---|---|
| C1 | Passengers | 0.2076 | 3 |
| Public Transport Experts | 0.1188 | 4 | |
| Municipal Officials | 0.3473 | 1 | |
| C2 | Passengers | 0.3559 | 1 |
| Public Transport Experts | 0.2654 | 2 | |
| Municipal Officials | 0.2771 | 2 | |
| C3 | Passengers | 0.1995 | 4 |
| Public Transport Experts | 0.3754 | 1 | |
| Municipal Officials | 0.191 | 3 | |
| C4 | Passengers | 0.2371 | 2 |
| Public Transport Experts | 0.2404 | 3 | |
| Municipal Officials | 0.1846 | 4 |
Table 8.
The final weights and ranks for the factors in the second level.
| Criteria Name | Passengers | Public Transport Experts | Municipal Officials | ||||||
|---|---|---|---|---|---|---|---|---|---|
| Weight Score | Final Weight Score | Rank | Weight Score | Final Weight Score | Rank | Weight Score | Final Weight Score | Rank | |
| C11 | 0.0906 | 0.0188 | 13 | 0.1176 | 0.014 | 13 | 0.0909 | 0.0316 | 11 |
| C12 | 0.1087 | 0.0226 | 12 | 0.1961 | 0.0233 | 11 | 0.5137 | 0.1784 | 2 |
| C13 | 0.4719 | 0.0980 | 3 | 0.4779 | 0.0568 | 9 | 0.2122 | 0.0737 | 3 |
| C14 | 0.2717 | 0.0564 | 8 | 0.1471 | 0.0175 | 12 | 0.1273 | 0.0442 | 8 |
| C15 | 0.0572 | 0.0119 | 14 | 0.0613 | 0.0073 | 14 | 0.0558 | 0.0194 | 14 |
| C21 | 0.2499 | 0.0889 | 6 | 0.1825 | 0.0484 | 8 | 0.2203 | 0.0610 | 6 |
| C22 | 0.2557 | 0.0910 | 4 | 0.1908 | 0.1663 | 7 | 0.2622 | 0.1434 | 5 |
| C23 | 0.4944 | 0.1760 | 1 | 0.6267 | 0.0506 | 1 | 0.5175 | 0.0727 | 1 |
| C31 | 0.2936 | 0.0586 | 7 | 0.3187 | 0.1196 | 3 | 0.2525 | 0.0482 | 12 |
| C32 | 0.4490 | 0.0896 | 5 | 0.4930 | 0.1851 | 2 | 0.3688 | 0.0705 | 9 |
| C33 | 0.2574 | 0.0513 | 10 | 0.1883 | 0.0707 | 6 | 0.3787 | 0.7230 | 10 |
| C41 | 0.1993 | 0.0473 | 11 | 0.1616 | 0.0389 | 10 | 0.3926 | 0.0725 | 4 |
| C42 | 0.2227 | 0.0528 | 9 | 0.3159 | 0.0759 | 5 | 0.3540 | 0.0653 | 7 |
| C43 | 0.5780 | 0.1370 | 2 | 0.5225 | 0.1256 | 4 | 0.2534 | 0.0468 | 13 |
Table 9.
The final weight and ranks for the factors in the third level.
| Criteria Name | Passengers | Public Transport Experts | Municipal Officials | ||||||
|---|---|---|---|---|---|---|---|---|---|
| Weight Score | Final Weight Score | Rank | Weight Score | Final Weight Score | Rank | Weight Score | Final Weight Score | Rank | |
| C111 | 0.1913 | 0.0036 | 10 | 0.2379 | 0.033 | 9 | 0.1991 | 0.0063 | 10 |
| C112 | 0.2144 | 0.0040 | 9 | 0.5011 | 0.007 | 8 | 0.2976 | 0.0094 | 9 |
| C113 | 0.5943 | 0.0112 | 7 | 0.2610 | 0.0036 | 10 | 0.5033 | 0.0159 | 6 |
| C121 | 0.2996 | 0.0068 | 8 | 0.3137 | 0.0073 | 5 | 0.3777 | 0.0674 | 4 |
| C122 | 0.7004 | 0.0158 | 5 | 0.6863 | 0.016 | 3 | 0.6223 | 0.111 | 1 |
| C131 | 0.6569 | 0.0644 | 1 | 0.5217 | 0.0296 | 1 | 0.4088 | 0.0301 | 3 |
| C132 | 0.3431 | 0.0336 | 2 | 0.4783 | 0.0272 | 2 | 0.5912 | 0.0436 | 2 |
| C141 | 0.2182 | 0.0123 | 6 | 0.2233 | 0.0039 | 7 | 0.2347 | 0.0104 | 8 |
| C142 | 0.4102 | 0.0231 | 3 | 0.4662 | 0.0081 | 4 | 0.4532 | 0.02 | 5 |
| C143 | 0.3716 | 0.0210 | 4 | 0.3105 | 0.0054 | 6 | 0.3121 | 0.0138 | 7 |
Table 10.
Weight scores and ranking after the sensitivity check for passengers’ group.
| Level | Criteria | Weight Scores | New Final Weight Scores | New Ranking | Old Ranking |
|---|---|---|---|---|---|
| Level 1 | Transport Quality | 0.3559 | 0.36 | 1 | 1 |
| Service Quality | 0.2076 | 0.21 | 3 | 3 | |
| Fare | 0.2371 | 0.23 | 2 | 2 | |
| Tractability | 0.1995 | 0.2 | 4 | 4 | |
| Level 2 | Approachability | 0.0188 | 0.0190 | 13 | 13 |
| Directness | 0.0226 | 0.0228 | 12 | 12 | |
| Time availability | 0.0980 | 0.0991 | 3 | 3 | |
| Speed | 0.0564 | 0.0571 | 8 | 8 | |
| Reliability | 0.0119 | 0.0120 | 14 | 14 | |
| Physical comfort | 0.0889 | 0.0900 | 5 | 6 | |
| Mental comfort | 0.0910 | 0.0920 | 4 | 4 | |
| Safety of travel | 0.1760 | 0.1780 | 1 | 1 | |
| Perspicuity | 0.0586 | 0.0587 | 7 | 7 | |
| Info before travel | 0.0896 | 0.0898 | 6 | 5 | |
| Info during travel | 0.0513 | 0.0515 | 9 | 10 | |
| One-way tickets | 0.0473 | 0.0458 | 11 | 11 | |
| Weekly/monthly tickets | 0.0528 | 0.0512 | 10 | 9 | |
| Discounted tickets | 0.1370 | 0.1329 | 2 | 2 | |
| Level 3 | Distance to stop | 0.0036 | 0.0036 | 10 | 10 |
| Safety of stops | 0.0112 | 0.0113 | 7 | 9 | |
| Comfort of stops | 0.0040 | 0.0041 | 9 | 7 | |
| Need for transfer | 0.0068 | 0.0068 | 8 | 8 | |
| Fit connection | 0.0158 | 0.0160 | 5 | 5 | |
| Frequency of lines | 0.0644 | 0.0651 | 1 | 1 | |
| Limited time of use | 0.0336 | 0.0340 | 2 | 2 | |
| Journey time | 0.0123 | 0.0124 | 6 | 6 | |
| Awaiting time | 0.0231 | 0.0234 | 3 | 3 | |
| Time to reach stops | 0.0210 | 0.0212 | 4 | 4 |
Table 11.
Weight scores and ranking after the sensitivity check for the public transport experts group.
Table 11.
Weight scores and ranking after the sensitivity check for the public transport experts group.
| Level | Criteria | Weight Scores | New Final Weight Scores | New Ranking | Old Ranking |
|---|---|---|---|---|---|
| Level 1 | Transport Quality | 0.1188 | 0.1200 | 4 | 4 |
| Service quality | 0.2654 | 0.2600 | 2 | 2 | |
| Fare | 0.3754 | 0.3800 | 1 | 1 | |
| Tractability | 0.2404 | 0.2400 | 3 | 3 | |
| Level 2 | Approachability | 0.0140 | 0.0141 | 13 | 13 |
| Directness | 0.0233 | 0.0235 | 11 | 11 | |
| Time availability | 0.0568 | 0.0574 | 7 | 9 | |
| Speed | 0.0175 | 0.0176 | 12 | 12 | |
| Reliability | 0.0073 | 0.0074 | 14 | 14 | |
| Physical comfort | 0.0484 | 0.0475 | 9 | 8 | |
| Mental comfort | 0.0506 | 0.0496 | 8 | 7 | |
| Safety of travel | 0.1663 | 0.1629 | 2 | 1 | |
| Perspicuity | 0.1196 | 0.1211 | 4 | 3 | |
| Info before travel | 0.1851 | 0.1873 | 1 | 2 | |
| Info during travel | 0.0707 | 0.0716 | 6 | 6 | |
| One-way tickets | 0.0389 | 0.0388 | 10 | 10 | |
| Weekly/monthly tickets | 0.0759 | 0.0758 | 5 | 5 | |
| Discounted tickets | 0.1256 | 0.1254 | 3 | 4 | |
| Level 3 | Distance to stop | 0.0033 | 0.0034 | 10 | 9 |
| Safety of stops | 0.0070 | 0.0071 | 6 | 8 | |
| Comfort of stops | 0.0036 | 0.0037 | 9 | 10 | |
| Need for transfer | 0.0073 | 0.0074 | 5 | 5 | |
| Fit connection | 0.0160 | 0.0161 | 3 | 3 | |
| Frequency of lines | 0.0296 | 0.0229 | 1 | 1 | |
| Limited time of use | 0.0272 | 0.0274 | 2 | 2 | |
| Journey time | 0.0039 | 0.0039 | 8 | 7 | |
| Awaiting time | 0.0081 | 0.0082 | 4 | 4 | |
| Time to reach stops | 0.0054 | 0.0055 | 7 | 6 |
Table 12.
Weight scores and ranking after the sensitivity check for the municipal officials group.
| Level | Criteria | Weight Scores | New Final Weight Scores | New Level-Wise Ranking | Old Level-Wise Ranking |
|---|---|---|---|---|---|
| Level 1 | Transport Quality | 0.3473 | 0.3500 | 1 | 1 |
| Service quality | 0.2771 | 0.2700 | 2 | 2 | |
| Fare | 0.1910 | 0.2000 | 3 | 4 | |
| Tractability | 0.1846 | 0.1800 | 4 | 3 | |
| Level 2 | Approachability | 0.0316 | 0.0318 | 13 | 11 |
| Directness | 0.1784 | 0.1798 | 1 | 2 | |
| Time availability | 0.0737 | 0.0743 | 4 | 3 | |
| Speed | 0.0442 | 0.0446 | 12 | 8 | |
| Reliability | 0.0194 | 0.0195 | 14 | 14 | |
| Physical comfort | 0.0610 | 0.0595 | 9 | 6 | |
| Mental comfort | 0.0727 | 0.0708 | 6 | 5 | |
| Safety of travel | 0.1434 | 0.1397 | 2 | 1 | |
| Perspicuity | 0.0482 | 0.0505 | 10 | 12 | |
| Info before travel | 0.0705 | 0.0738 | 5 | 9 | |
| Info during travel | 0.0723 | 0.0757 | 3 | 10 | |
| One-way tickets | 0.0725 | 0.0707 | 7 | 4 | |
| Weekly/monthly tickets | 0.0653 | 0.0637 | 8 | 7 | |
| Discounted tickets | 0.0468 | 0.0195 | 11 | 13 | |
| Level 3 | Distance to stop | 0.0063 | 0.0063 | 10 | 10 |
| Safety of stops | 0.0094 | 0.0095 | 9 | 9 | |
| Comfort of stops | 0.0159 | 0.0160 | 6 | 6 | |
| Need for transfer | 0.0674 | 0.0679 | 2 | 4 | |
| Fit connection | 0.1110 | 0.1119 | 1 | 1 | |
| Frequency of lines | 0.0301 | 0.0304 | 4 | 3 | |
| Limited time of use | 0.0436 | 0.0439 | 3 | 2 | |
| Journey time | 0.0104 | 0.0105 | 8 | 8 | |
| Awaiting time | 0.0200 | 0.0202 | 5 | 5 | |
| Time to reach stops | 0.0138 | 0.0139 | 7 | 7 |
Table 13.
The main differences between the proposed model and the pure AHP and BWM approaches.
| AHP | BWM | AHP–BWM | |
|---|---|---|---|
| Pairwise comparison numbers | 33 | 29 | 30 |
| Average evaluation time (minutes) | 35 | 29 | 32 |
| Consistency status | Weak consistency in the case of existing 5 × 5 or larger PCMs | High transparent consistency but might contain hidden inconsistency | Generates more consistency compared to pure AHP in the case of existing 5 × 5 or larger PCMs |
Table 14.
Comparison of the proposed method with mainstream techniques.
| SAW | SEM | AHP–BWM | |
|---|---|---|---|
| Evaluation logic | comparisons | direct evaluations | comparisons |
| Average evaluation time | high | low | middle |
| Consistency status | low | low | high |
| Nonhierarchical connections among attributes | not allowed | allowed and computed | not allowed |
© 2020 by the authors. Licensee MDPI, Basel, Switzerland. This article is an open access article distributed under the terms and conditions of the Creative Commons Attribution (CC BY) license (http://creativecommons.org/licenses/by/4.0/).
Share and Cite
MDPI and ACS Style
Moslem, S.; Alkharabsheh, A.; Ismael, K.; Duleba, S. An Integrated Decision Support Model for Evaluating Public Transport Quality. Appl. Sci. 2020, 10, 4158. https://0-doi-org.brum.beds.ac.uk/10.3390/app10124158
AMA Style
Moslem S, Alkharabsheh A, Ismael K, Duleba S. An Integrated Decision Support Model for Evaluating Public Transport Quality. Applied Sciences. 2020; 10(12):4158. https://0-doi-org.brum.beds.ac.uk/10.3390/app10124158
Chicago/Turabian StyleMoslem, Sarbast, Ahmad Alkharabsheh, Karzan Ismael, and Szabolcs Duleba. 2020. "An Integrated Decision Support Model for Evaluating Public Transport Quality" Applied Sciences 10, no. 12: 4158. https://0-doi-org.brum.beds.ac.uk/10.3390/app10124158
Note that from the first issue of 2016, this journal uses article numbers instead of page numbers. See further details here.