Analysis of Emergency Medical Vulnerability and Survival Rates Following Real-Time Traffic Information


1
Spatial Information Research Institute, Korea Land and Geospatial Informatix Corporation, Jeonju 54870, Korea
2
Interdisciplinary Program in Agricultural and Forest Meteorology, College of Agriculture and Life Sciences, Seoul National University, Seoul 08826, Korea
3
Department of Emergency Medicine, KangNam Medical Center, College of Medicine, Hallym University, Seoul 07441, Korea
4
Graduate School of International Agricultural Technology, Institute of Green Bio Science Technology, Seoul National University, Pyeongchang 25354, Korea
*
Author to whom correspondence should be addressed.
Appl. Sci. 2020, 10(18), 6492; https://0-doi-org.brum.beds.ac.uk/10.3390/app10186492
Submission received: 25 August 2020
/
Revised: 12 September 2020
/
Accepted: 16 September 2020
/
Published: 17 September 2020
(This article belongs to the Special Issue New Trends in Medical Informatics)
Abstract
:Providing rapid access to emergency medical services (EMS) within the “golden time” for survival is important to improve the survival rate of emergency patients. This study analyzes the accessibility of EMS based on driving speed changes following real-time road traffic conditions by time to estimate vulnerable areas for EMS and survival rates of emergency patients. The key results of the network analysis based on real-time road speed and this evaluation of vulnerable areas by village level across South Korea reveal the different characteristics of urban and rural areas to access emergency medical facilities. In urban areas, road traffic congestion during rush hour delays the patients’ access time to EMS. In contrast, in rural areas, the long geographical distance to an emergency medical facility is a hurdle for receiving care from an EMS during the “golden time” because emergency medical facilities are mostly located in urban areas. The existing standard to assess vulnerable areas of EMS accessibility is based on the speed limit of roads, but the time may be underestimated because the speed limit alone does not reflect the real road conditions. The study results show that an effective way to increase the survival rate is receiving immediate first aid treatment, which means that the government should continuously train the public to perform cardiopulmonary resuscitation (CPR) as well as install automated external defibrillators (AEDs) in populated places, and train the public to use them. Reducing assess time to emergency medical centers in urban areas and providing additional manpower to help with first aid in rural areas are reasonable ways to improve the survival rate of emergency patients.
1. Introduction
Rapid access to emergency medical facilities within the “golden time” as well as prompt and appropriate first aid are essential factors to improve the survival rate of emergency patients [1,2,3,4]. The emergency medical services (EMS) system enables manpower, facilities, and equipment to be organically operated to effectively and quickly provide medical care in emergencies [5]. The EMS system is divided into the pre-hospital and in-hospital phases depending on the place before and after receiving help from an EMS. In the pre-hospital phase, emergency responders provide appropriate first aid to patients onsite before promptly and safely transferring the patient to a hospital for treatment [6]. In the pre-hospital phase, accessibility to EMS is evaluated by the time and distance to arrive at the best EMS facility in a short time, mainly considering the available EMS resources and the transfer time [7]. The method used to evaluate accessibility to EMS considers service availability, population coverage, and time-based geographic delivery of emergency services.
Differences in the locational distribution of emergency medical facilities in urban and rural areas also need to be considered to improve accessibility to EMS in vulnerable areas [8,9,10,11]. Among Organization for Economic Cooperation and Development (OECD) countries, the accessibility and mobility of medical services in Korea are generally evaluated as excellent based on a statistical evaluation with a high rate of receiving medical service benefits per person [12]. However, medical facilities and manpower are concentrated in urban areas [13]. As of 2019, most medical centers (3699 medical facilities including general hospitals and clinics) were concentrated in cities (90.4% of general hospitals, 85.2% of common hospitals, and 88.8% of clinics), indicating that there is a broad gap in medical service quality between urban and rural areas [14]. Unlike cities, poor medical access in rural areas makes the transfer distance and time to emergency medical facilities longer.
Emergency situations occur more frequently among the elderly. For conditions such as cardiovascular diseases and respiratory diseases, rapid first aid significantly affects the survival rates of patients [15]. For the elderly in Korea, deaths from cardiovascular and cerebrovascular diseases that require immediate first aid have increased by about 63% in the last 10 years (from 15 thousands in 2006 to 24 thousands in 2016), and the ratio has increased annually by about 6% for the last 10 years [16]. The aging population rate of rural areas (23.1% as of 2019) is more than twice as high as that of urban areas (10.9%) [17]. The rapid pace of aging compared to urban areas also makes it more likely that emergencies with a high risk of death will occur in rural areas. Thus, poor medical facilities and aging in rural areas further widen the gap of preventable or amendable mortality between rural and urban areas [7,18].
New methods such as calculating the traffic flow speed and dispatch time of emergency medical technician-paramedics (EMT-P) in real time to determine the appropriate response time to an emergency situation are very effective in identifying vulnerable areas for EMS based on practical accessibility [19]. Korean government defines vulnerable areas for EMS as areas where the local EMS center cannot be reached within 30 min or residents cannot reach a regional emergency medical center within 60 min [20]. This standard was revised in 2017 to apply the concept of the golden time to accessible time based on the accessibility to emergency medical facilities for a population of less than 150,000 in a rural area. The time to reach an emergency medical facility is calculated as the time required from where patient’s emergency occurred to a local/regional emergency medical center by mainly calculating the time based on the legal speed limit of the roads. Using this standard, 99 administrative districts (Si, Gun, and Gu) across the country in Korea (approximately 44%) could not receive EMS within the appropriate time [19]. However, the number of vulnerable areas for EMS increases if the real-time traffic conditions to reach the emergency medical facility are considered. In addition, the dispatch time by an emergency medical technician (e.g., the EMT-P or ambulance workers from the 119-safety center) who can provide first aid should also be considered. In particular, an evaluation of time-based accessibility is an essential requirement considering real-time road conditions by region, because the survival rate could vary significantly depending on whether or not rapid first aid is given in emergencies, such as an acute cardiac arrest.
Many studies on accessibility to medical or healthcare-related facilities have been conducted in various fields based on physical distance to identify vulnerable areas [21,22,23,24,25]. However, few related studies have used real-time traffic flow as well as driving speed data. Studies related to accessibility have mainly based the calculations on the physical distance, such as the Euclidean distance (linear distance), the estimated road distance using a circuity factor, and the actual road distance [26,27,28,29,30,31,32,33,34]. However, Kim [13] and Li [35] pointed out that the linear distance is more likely to result in excessive distortion compared to actual road distances because the linear distance does not reflect the geographical features such as the terrain or road geometry. Kim [13] suggested that calculating the estimated road distance by applying circuity factors to linear distance could be a substitute for the actual road distance for the vulnerability assessment of access to medical facilities. Studies on accessible vulnerability using physical distance have recently improved, and now estimate the accessible time using data about the shape of the road network and legal speed limit provided by the Korean government [36]. However, calculating accessibility using the speed limit of the road has limitations since it does not reflect the effects of slower vehicle speed during traffic jams or traffic signals.
The goal of this study is to analyze EMS accessibility using real-time road traffic conditions with driving speed changes by time of day and to estimate the vulnerable areas and survival rate of emergency patients. We also compare the results of urban areas and rural areas. For this purpose, we established a nationwide road network map across Korea to identify the current status of road use distribution following real road speed flow by time. In addition, we evaluated vulnerable areas for EMS by estimating the real-time access time via an optimal route from a village to an emergency medical facility using network analysis. We set up four cases according to the patient transfer process to an EMS facility, considering whether the patient receives first aid or not, and the dispatch time of an EMT-P. We also examined the changes in the survival probability for each case in urban areas compared to rural areas.
2. Data and Methods
2.1. Data
To analyze the access vulnerability to EMS by region in South Korea based on real-time road traffic flow speed, we established spatial big data including road and position information of relevant facilities (Figure 1). The facility information we established using spatial big data included community centers in urban and rural villages, emergency centers, 119-safety centers, community health centers, population and road network maps, as well as traffic speed flow data (Table 1).
We used 17,771 addresses of community centers in urban and rural villages (as the facility point to represent the center of a village (3507 urban community centers and 14,264 rural community centers) as of 2019 [37]. Community centers, as landmarks of villages, are a space for culture, administration, and communication for village residents in the villages which are the sub-municipal level divisions (Dong and Ri) [38,39,40].
We also acquired data on the addresses of the medical facilities including emergency centers, community health centers, and 119-safety centers. Data were provided by various sources: data on emergency centers were provided by the National Medical Center (NMC) [41], community health centers were provided by the Ministry of Health and Welfare (MHW) [42], and 119-safety centers were provided by the National Fire Agency (NFA) [43]. The addresses were taken from the Open Application Programming Interface (Open API) and converted into coordinate data through a geocoding method.
We used traffic-related data such as road network maps and traffic speed information. The road network map was provided by the Intelligent Transport Systems (ITS) of the Ministry of Land, Infrastructure and Transport (MLIT) [44], and the traffic speed was provided by the Traffic and Road Information Service of MLIT [45]. The road network maps were based on 2019 data, and the traffic speed information was also acquired from the Open API of ITS from February to April in 2020.
2.2. Method
2.2.1. Accessibility Using Network Analysis
We used network analysis to evaluate vulnerable areas for EMS in urban and rural areas. The network analysis for calculating accessibility was performed using the Network Analyst extension of the Geographic Information System (ArcGISTM), which provides various techniques for network-based spatial analysis, such as optimal path analysis on a road network, identification of the nearest facility, analysis of service ranges, and other accessibility functions [46]. Among the various network analyst functions, we used the origin-destination cost matrix (O-D cost matrix) to create a matrix of the origins and destinations. The optimal path was extracted to determine the least time to arrive at the destinations. The transfer path for emergency patients was determined as the route from the community center (through 119-safety centers or community health center) to the nearest emergency center.
2.2.2. Emergency Medical Vulnerability and Survival Rates by Emergency Case
(1) Emergency situation cases
Since the golden time is very important for emergency patients, their survival rate can increase if prompt and appropriate first aid is administered. For example, with myocardial infarction, the survival rate may double when someone (e.g., the primary respondent around the patient) promptly performs cardiopulmonary resuscitation (CPR) and may triple when an automated external defibrillator (AED) is used [47]. Since the golden time is just 5 to 10 min for cardiac arrest, the survival rate of emergency patients depends not only on the real-time road traffic flow speed but also appropriate first aid administered before or during transportation [48,49,50].
We evaluated changes in vulnerable areas and survival rates of an emergency by setting up four emergency medical response cases considering the presence of first aid and dispatching of EMT-P (Table 2). Case 1 is when a patient moves to an emergency center in person without initial emergency treatment. This case simulates the same situation that has been used in previous assessments of vulnerable areas of EMS. Case 2 is when a person near the emergency patient performs first aid according to the first aid directions provided by a telephone operator (dispatcher) and then the EMT-P arrives on-site to transport the patient to an emergency center by ambulance. Case 3 is when an EMT-P arrives onsite, provides first aid, and then transports the patient to an emergency center by ambulance. Case 4 is when an EMT-P or a community health center healthcare provider who is nearest to the emergency patient arrives onsite and provides first aid first, and then the EMT-P transports the patient to an emergency center.
(2) Vulnerable areas for emergency medical services (EMS)
Based on the relevant laws and regulations about vulnerable areas in Korea, the vulnerable area of EMS is defined as an area where an emergency medical center cannot be accessed within 30 min. Although data in previous studies on vulnerability to EMS within 30 min have been analyzed based on the road network and legal speed limit of the roads, these analyses do not reflect the real-time traffic flow speed. We evaluated the accessible time every five minutes according to the real traffic speed based on the traffic speed information provided by the Traffic and Road Information Service.
(3) Survival rates
The survival rate of patients with myocardial infarction decreased by 3–4% each minute the patient did not receive CPR, and by 8–10% each minute CPR was not performed [51,52]. Therefore, the survival rate was assumed to decrease by 3% for each minute first aid was not provided by a person near the emergency patient, an EMT-P, or a community health center worker, and by 10% each minute no first aid was provided.
3. Results and Discussion
3.1. Vulnerable Areas for Emergency Medical Services (EMS)
3.1.1. The Distribution State of EMS in Urban and Rural Areas
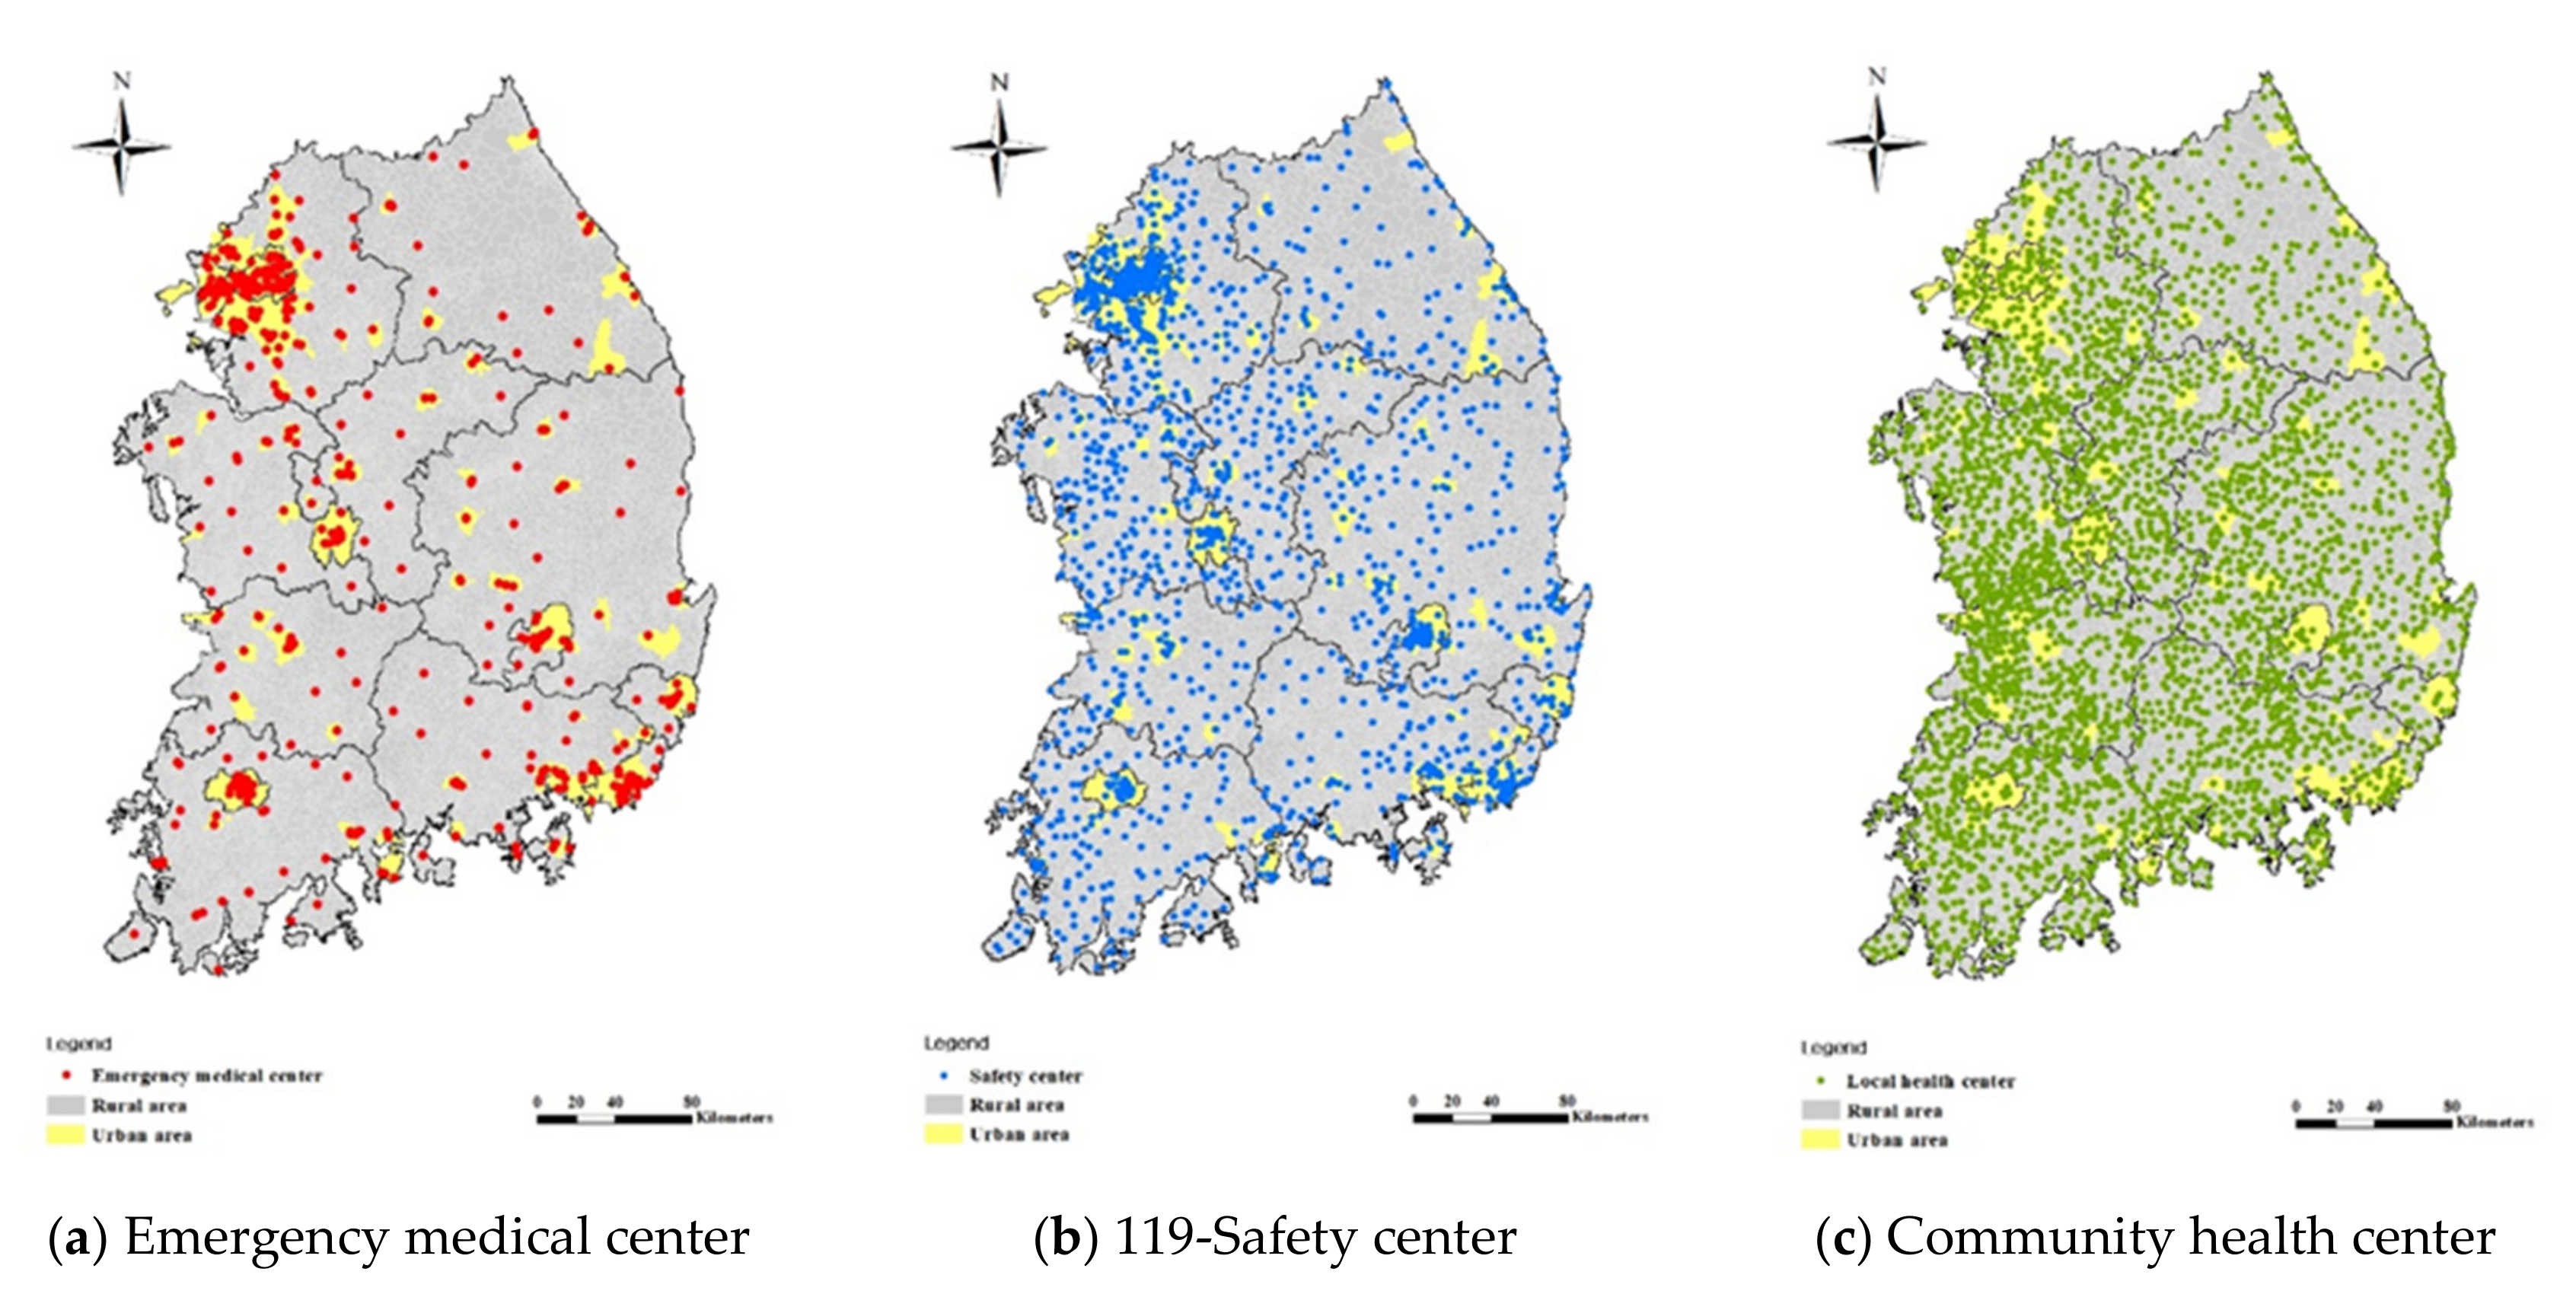
We examined the current states of medical facilities to identify whether the medical environment is balanced between rural and urban areas (Figure 2). The number of medical facilities includes 495 emergency medical centers (Figure 2a), 3161 community health centers (Figure 2b), and 1711 119-safety centers in Korea (Figure 2c). Of these facilities, 80.2% of the emergency medical centers (397 centers) are concentrated in urban areas. Since most emergency medical centers are concentrated in urban areas that are highly populated, emergency patients in rural areas are relatively vulnerable to health emergencies.
Community health centers and 119-safety centers are also balanced between urban and rural areas because they are managed by the government to improve and promote residents’ public health. They provide protective services for residents’ health and property according to the Regional Public Health Act and the Framework Act on fire-fighting services [53]. Approximately 90.9% of community health centers seem to be concentrated in rural areas, but in fact one health center is located in each jurisdictional county in each urban and rural village. The distribution of 119-safety centers is relatively balanced between urban and rural areas with 41.4% (709 centers) in urban areas and 58.6% (1002 centers) in rural areas.
3.1.2. Comparison of Speed Limit and Real Speed of Traffic Flow
We established a road network map that can be used to analyze accessibility in 5-min units by combining a standard node link and traffic communication information. We compared the legal speed limit of each road to the real speed in the established road network.
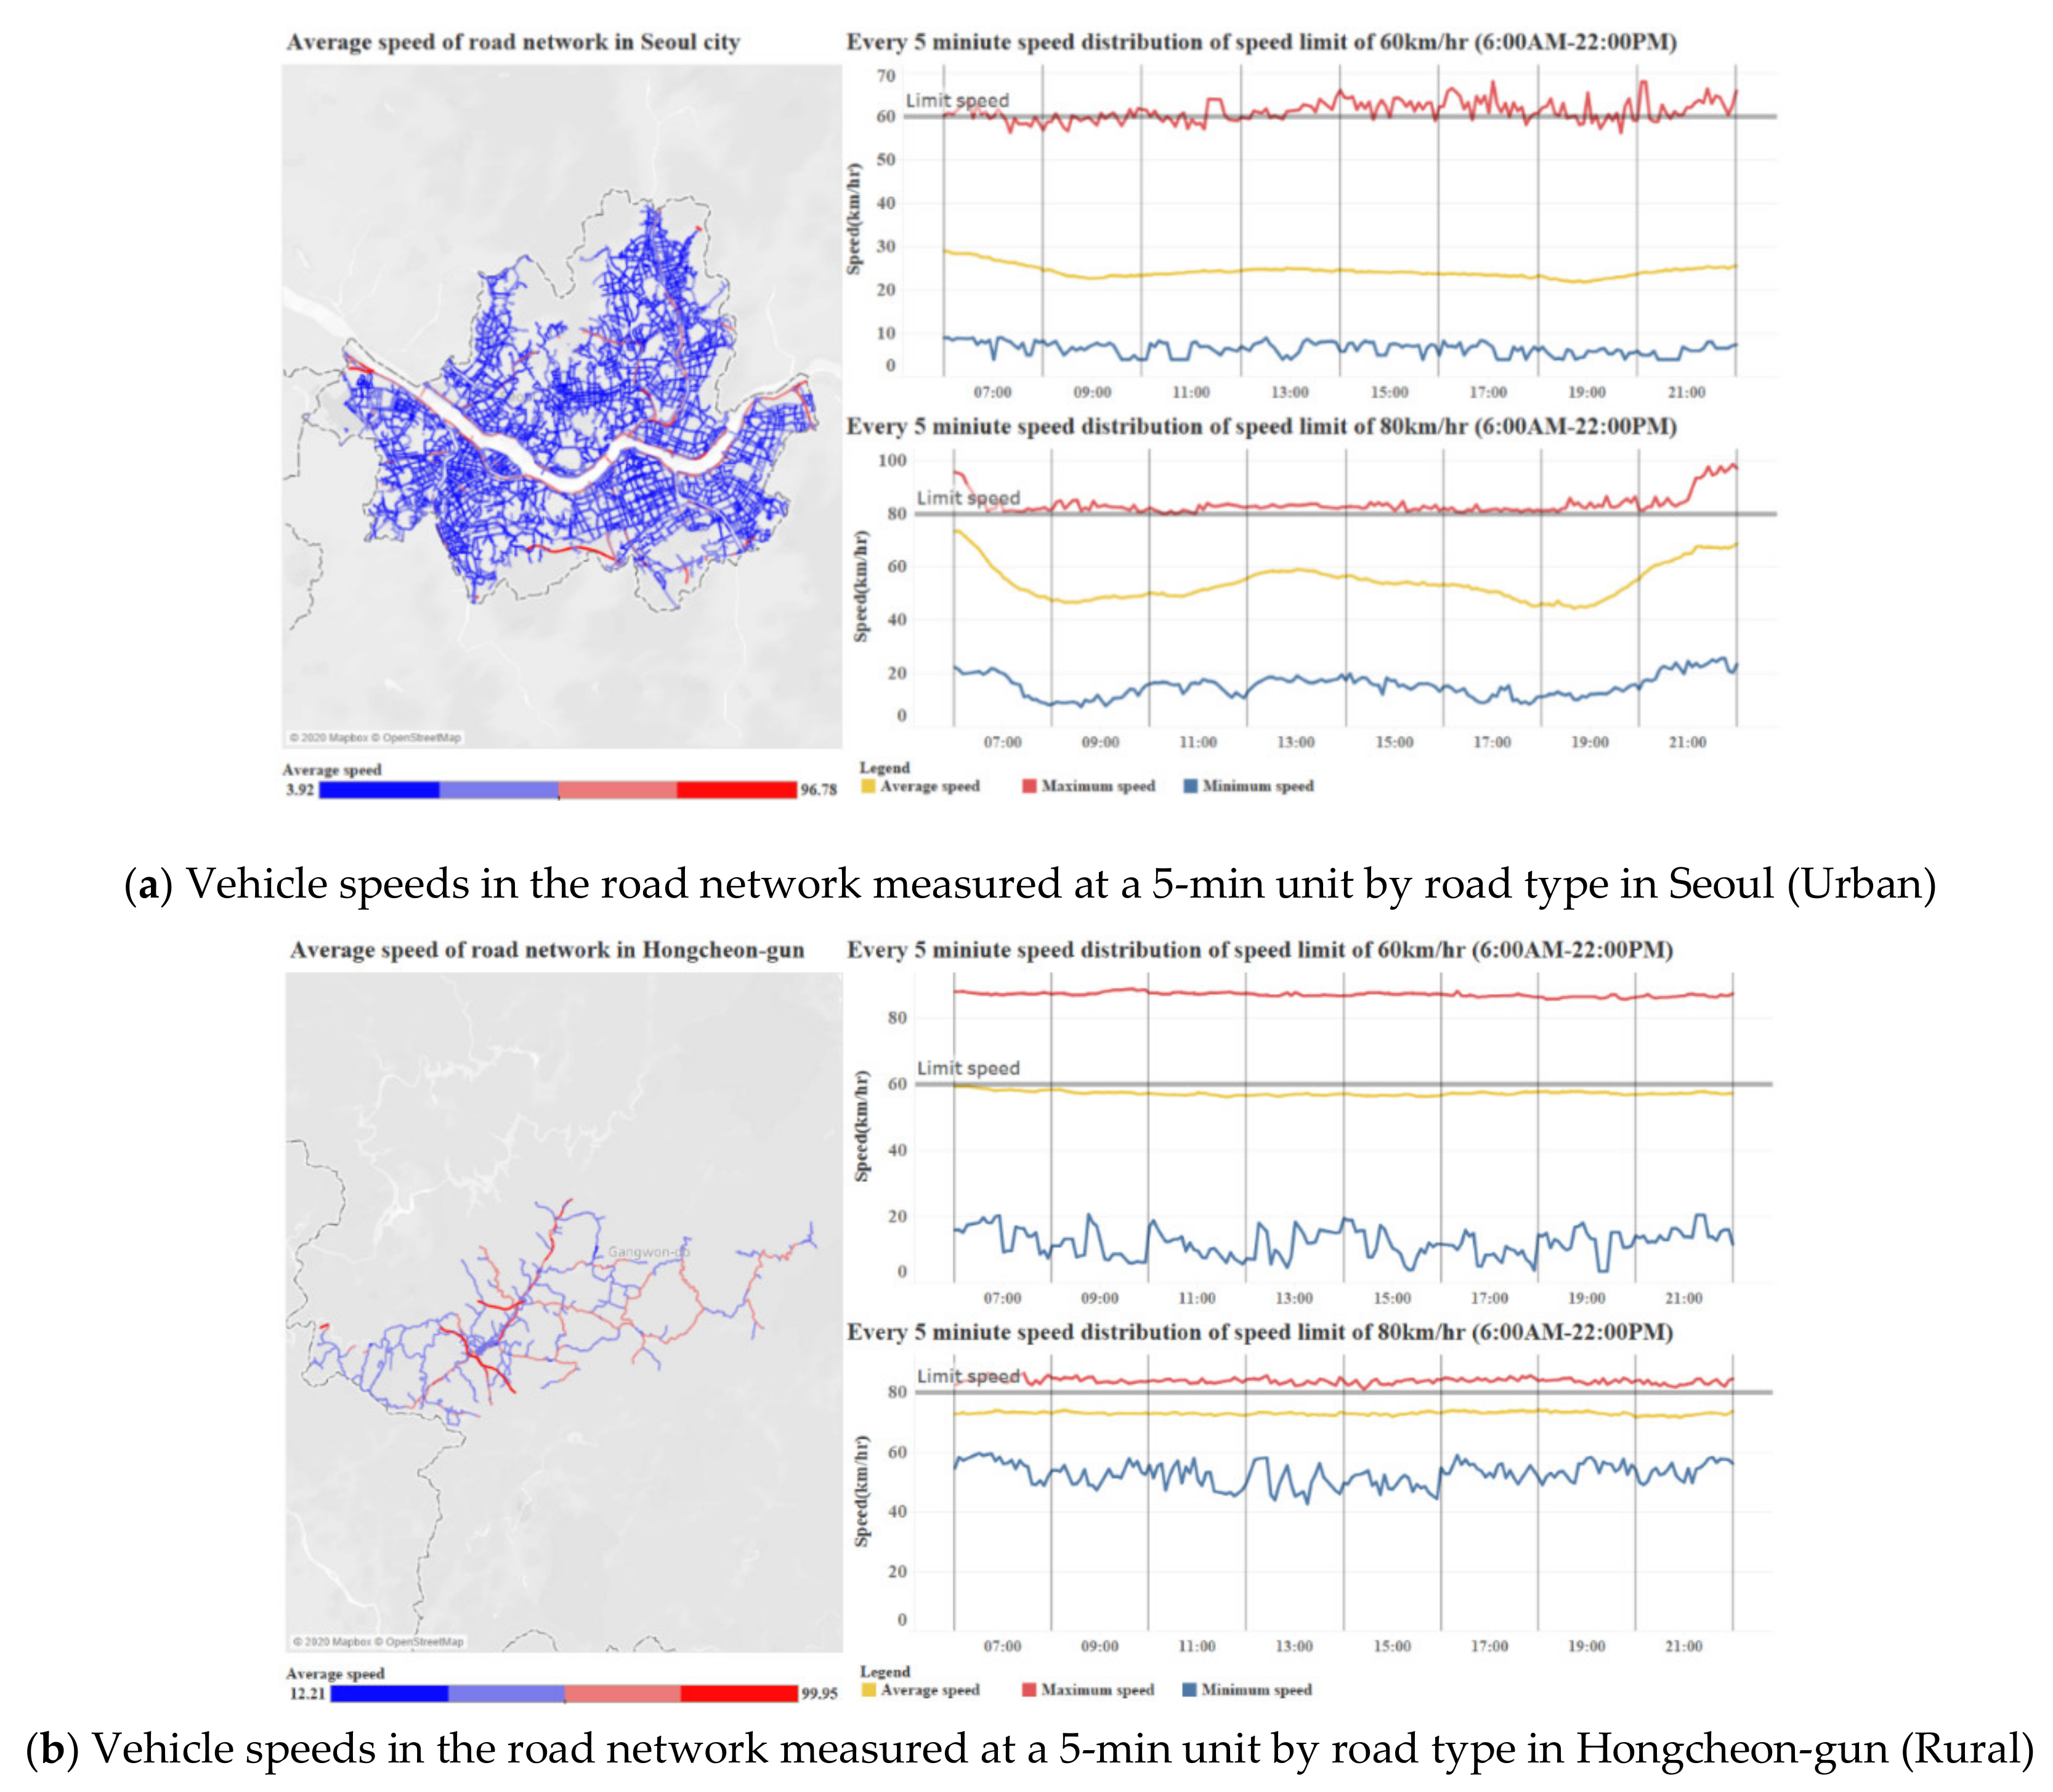
Data on the speed range showed a descriptively statistical range within 5-min for 3 months. The speed of vehicles in urban areas is not as easily available as the speed limit, but in rural areas, the speed of vehicles can be sufficiently calculated at a speed corresponding to the speed limit of the road (Figure 3). In the capital city (Seoul), for example, the highest population density, on average, vehicles traveled 20–30 km/h on roads with a 60 km/h speed limit and 40–60 km/h on roads with an 80 km/h speed limit (Figure 3a). However, the vehicle speed decreased remarkably around the morning and evening rush hour (8 a.m. and 5 p.m.). By contrast, vehicles in Hongcheon, a typical rural area located in a mountainous region, on average, vehicles can travel at a similar speed to a speed limit of 60 km/h and 60–70 km/h on the road with an 80 km/h speed limit (Figure 3b).
3.1.3. Vulnerable Areas for EMS
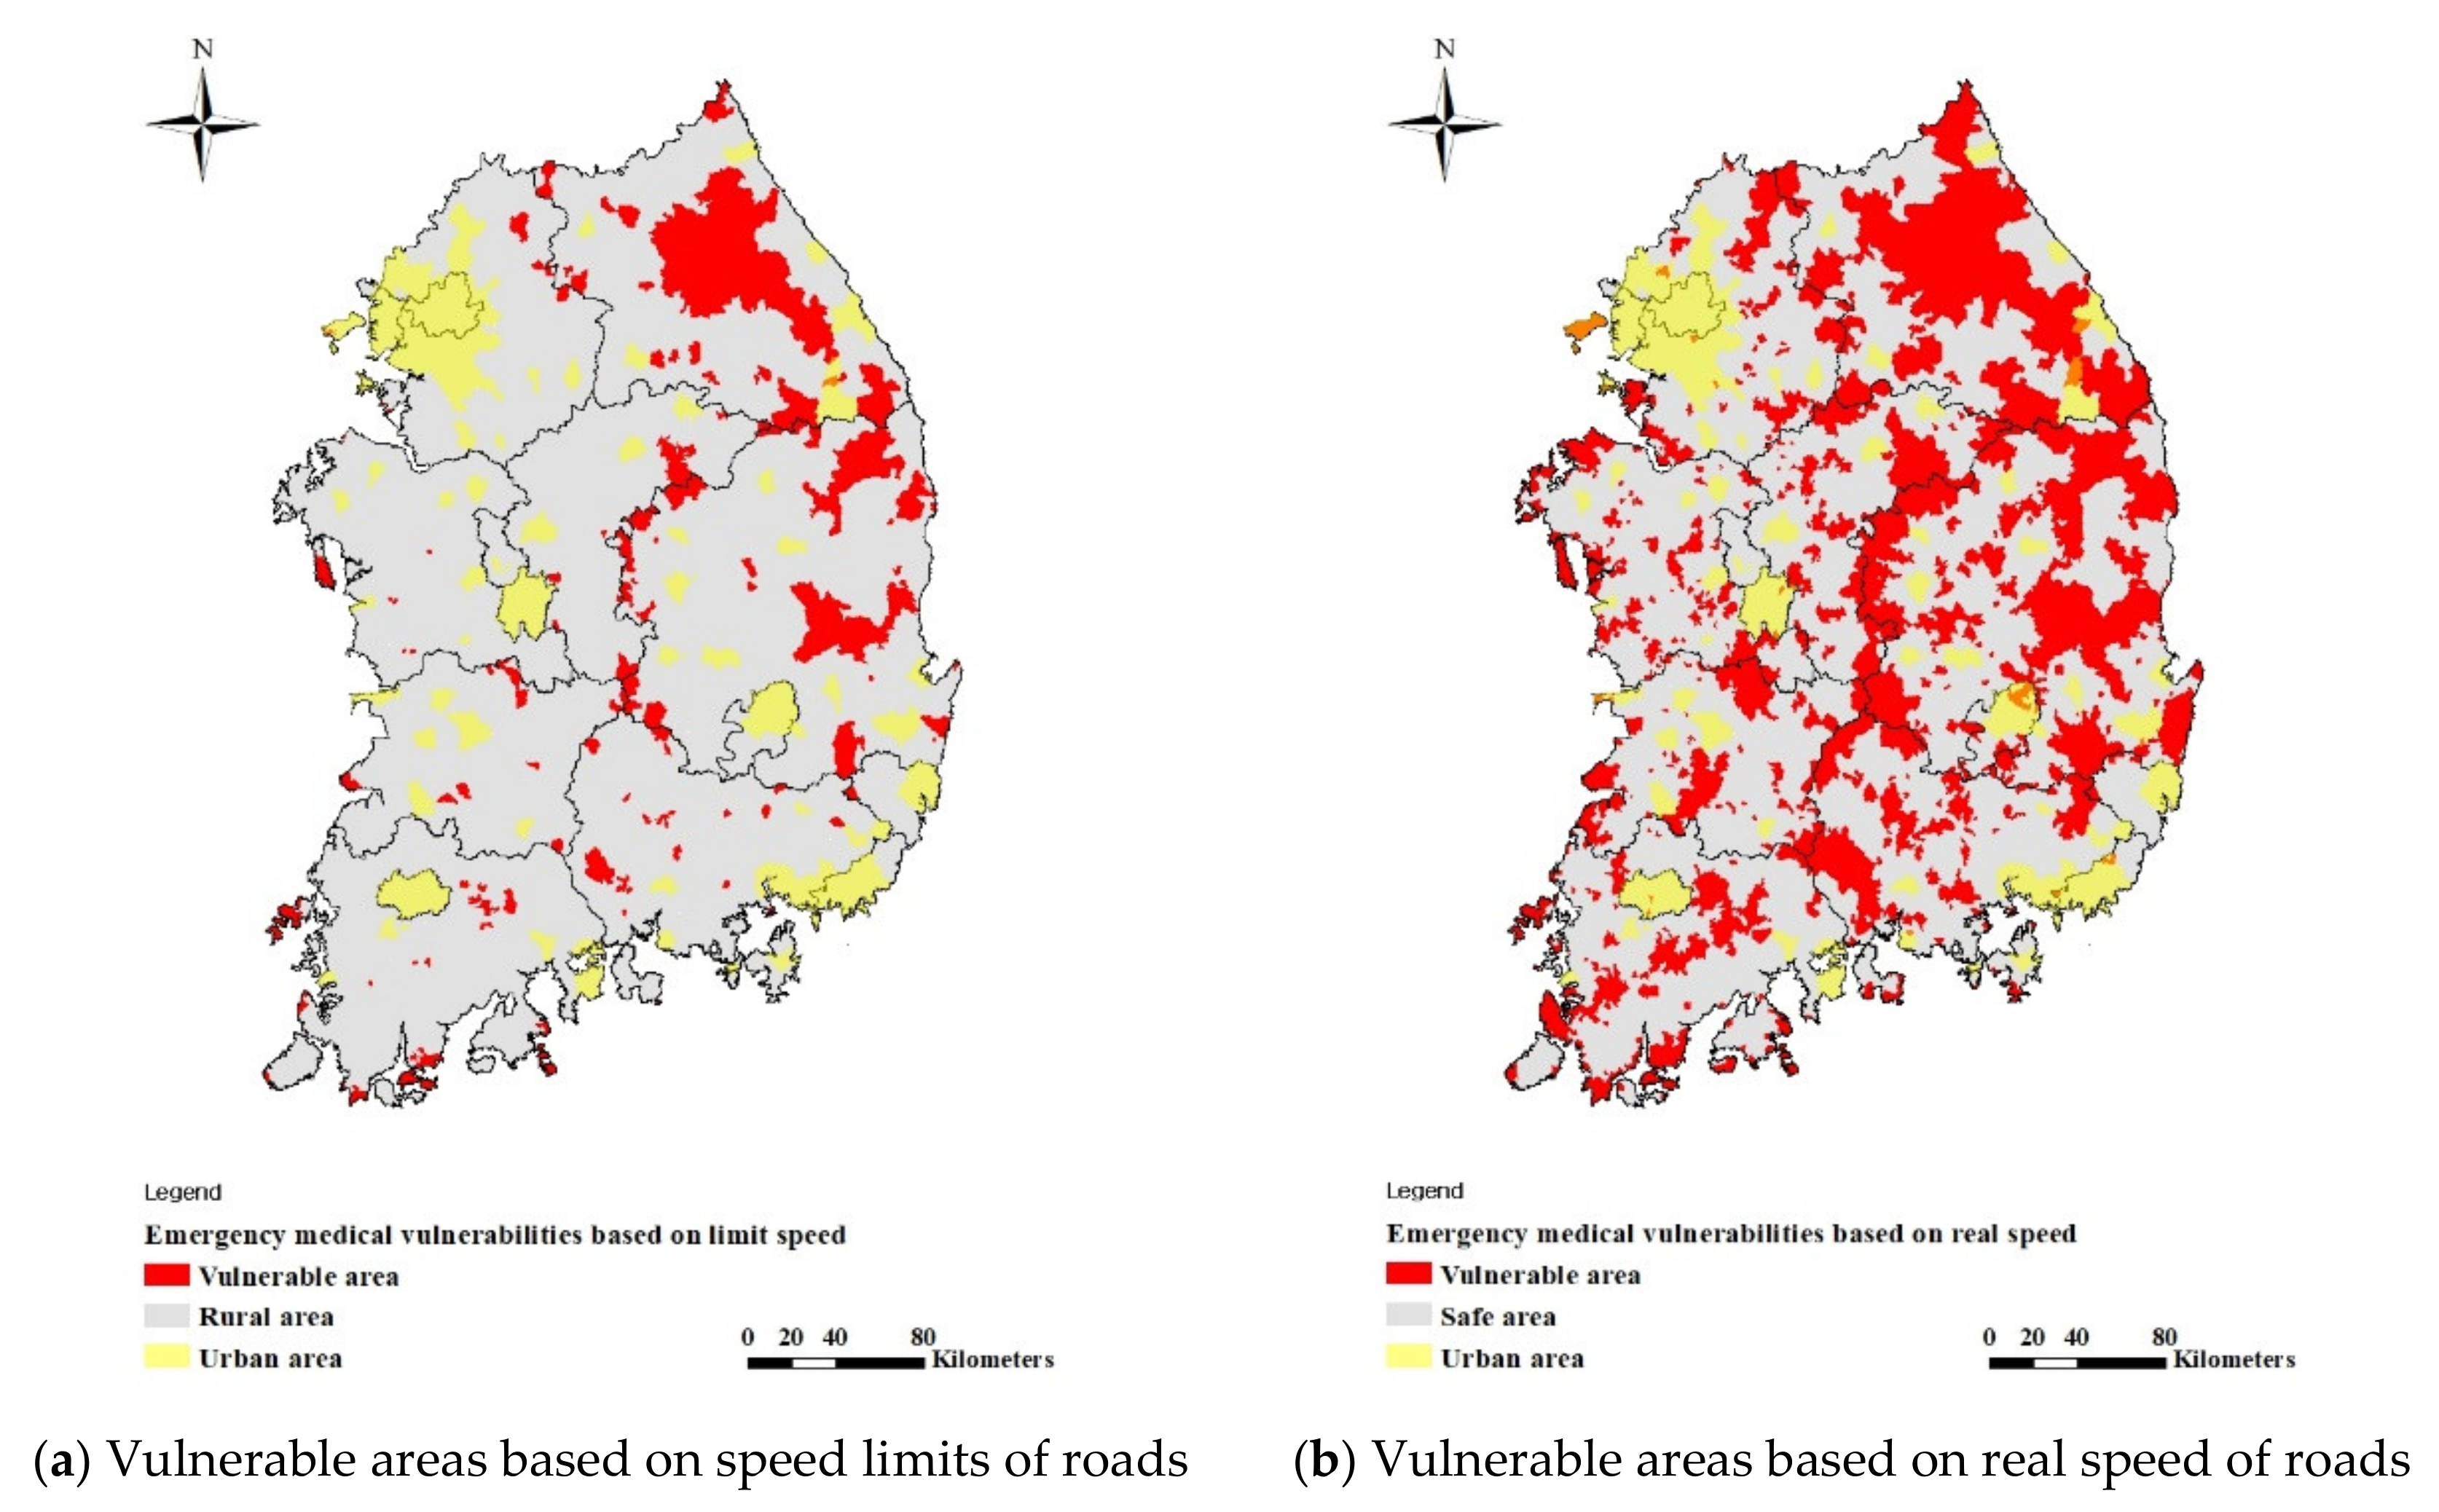
We evaluated and compared the vulnerable areas of EMS, which are defined as areas where a patient from a community center cannot reach the nearest emergency center within 30 min according to the speed limit, and the real speed (Figure 4). When a patient goes directly to the emergency medical center in an emergency situation as in Case 1, the speed limit-based assessment is underestimated using the current method of assessing emergency medical vulnerability compared to the real speed-based assessment. In particular, the number of vulnerable areas of EMS was 659 villages based on the speed limit (Figure 4a), but 3618 villages based on the real speed (Figure 4b). Rural areas had the most vulnerable areas that increased using the real speed.
An assessment using a 5-min unit based on the real speed of the road reveals that vulnerable areas occurred mostly during afternoon rush hour. In urban areas, 48 villages were considered vulnerable at 6:35 p.m. In rural areas, 3570 villages were vulnerable at 6:25 p.m. (Figure 5). The trend of real speed of the road by time shows that rural areas are relatively insensitive to traffic congestion during rush hour compared to urban areas, but the trend was still the highest during afternoon rush hour. We think that this tendency refers to locations around emergency medical centers. Since most emergency medical centers are located in cities (397 emergency medical centers, 80.2%), the real traffic flow of roads entering the city from rural areas slowed down when patients were transferred from a rural area to an urban emergency medical center, which ultimately led to increased vulnerability of villages in rural areas.
3.2. Survival Rate of Patients by Emergency Case
3.2.1. Survival Rate by Time Slot in Urban and Rural Areas
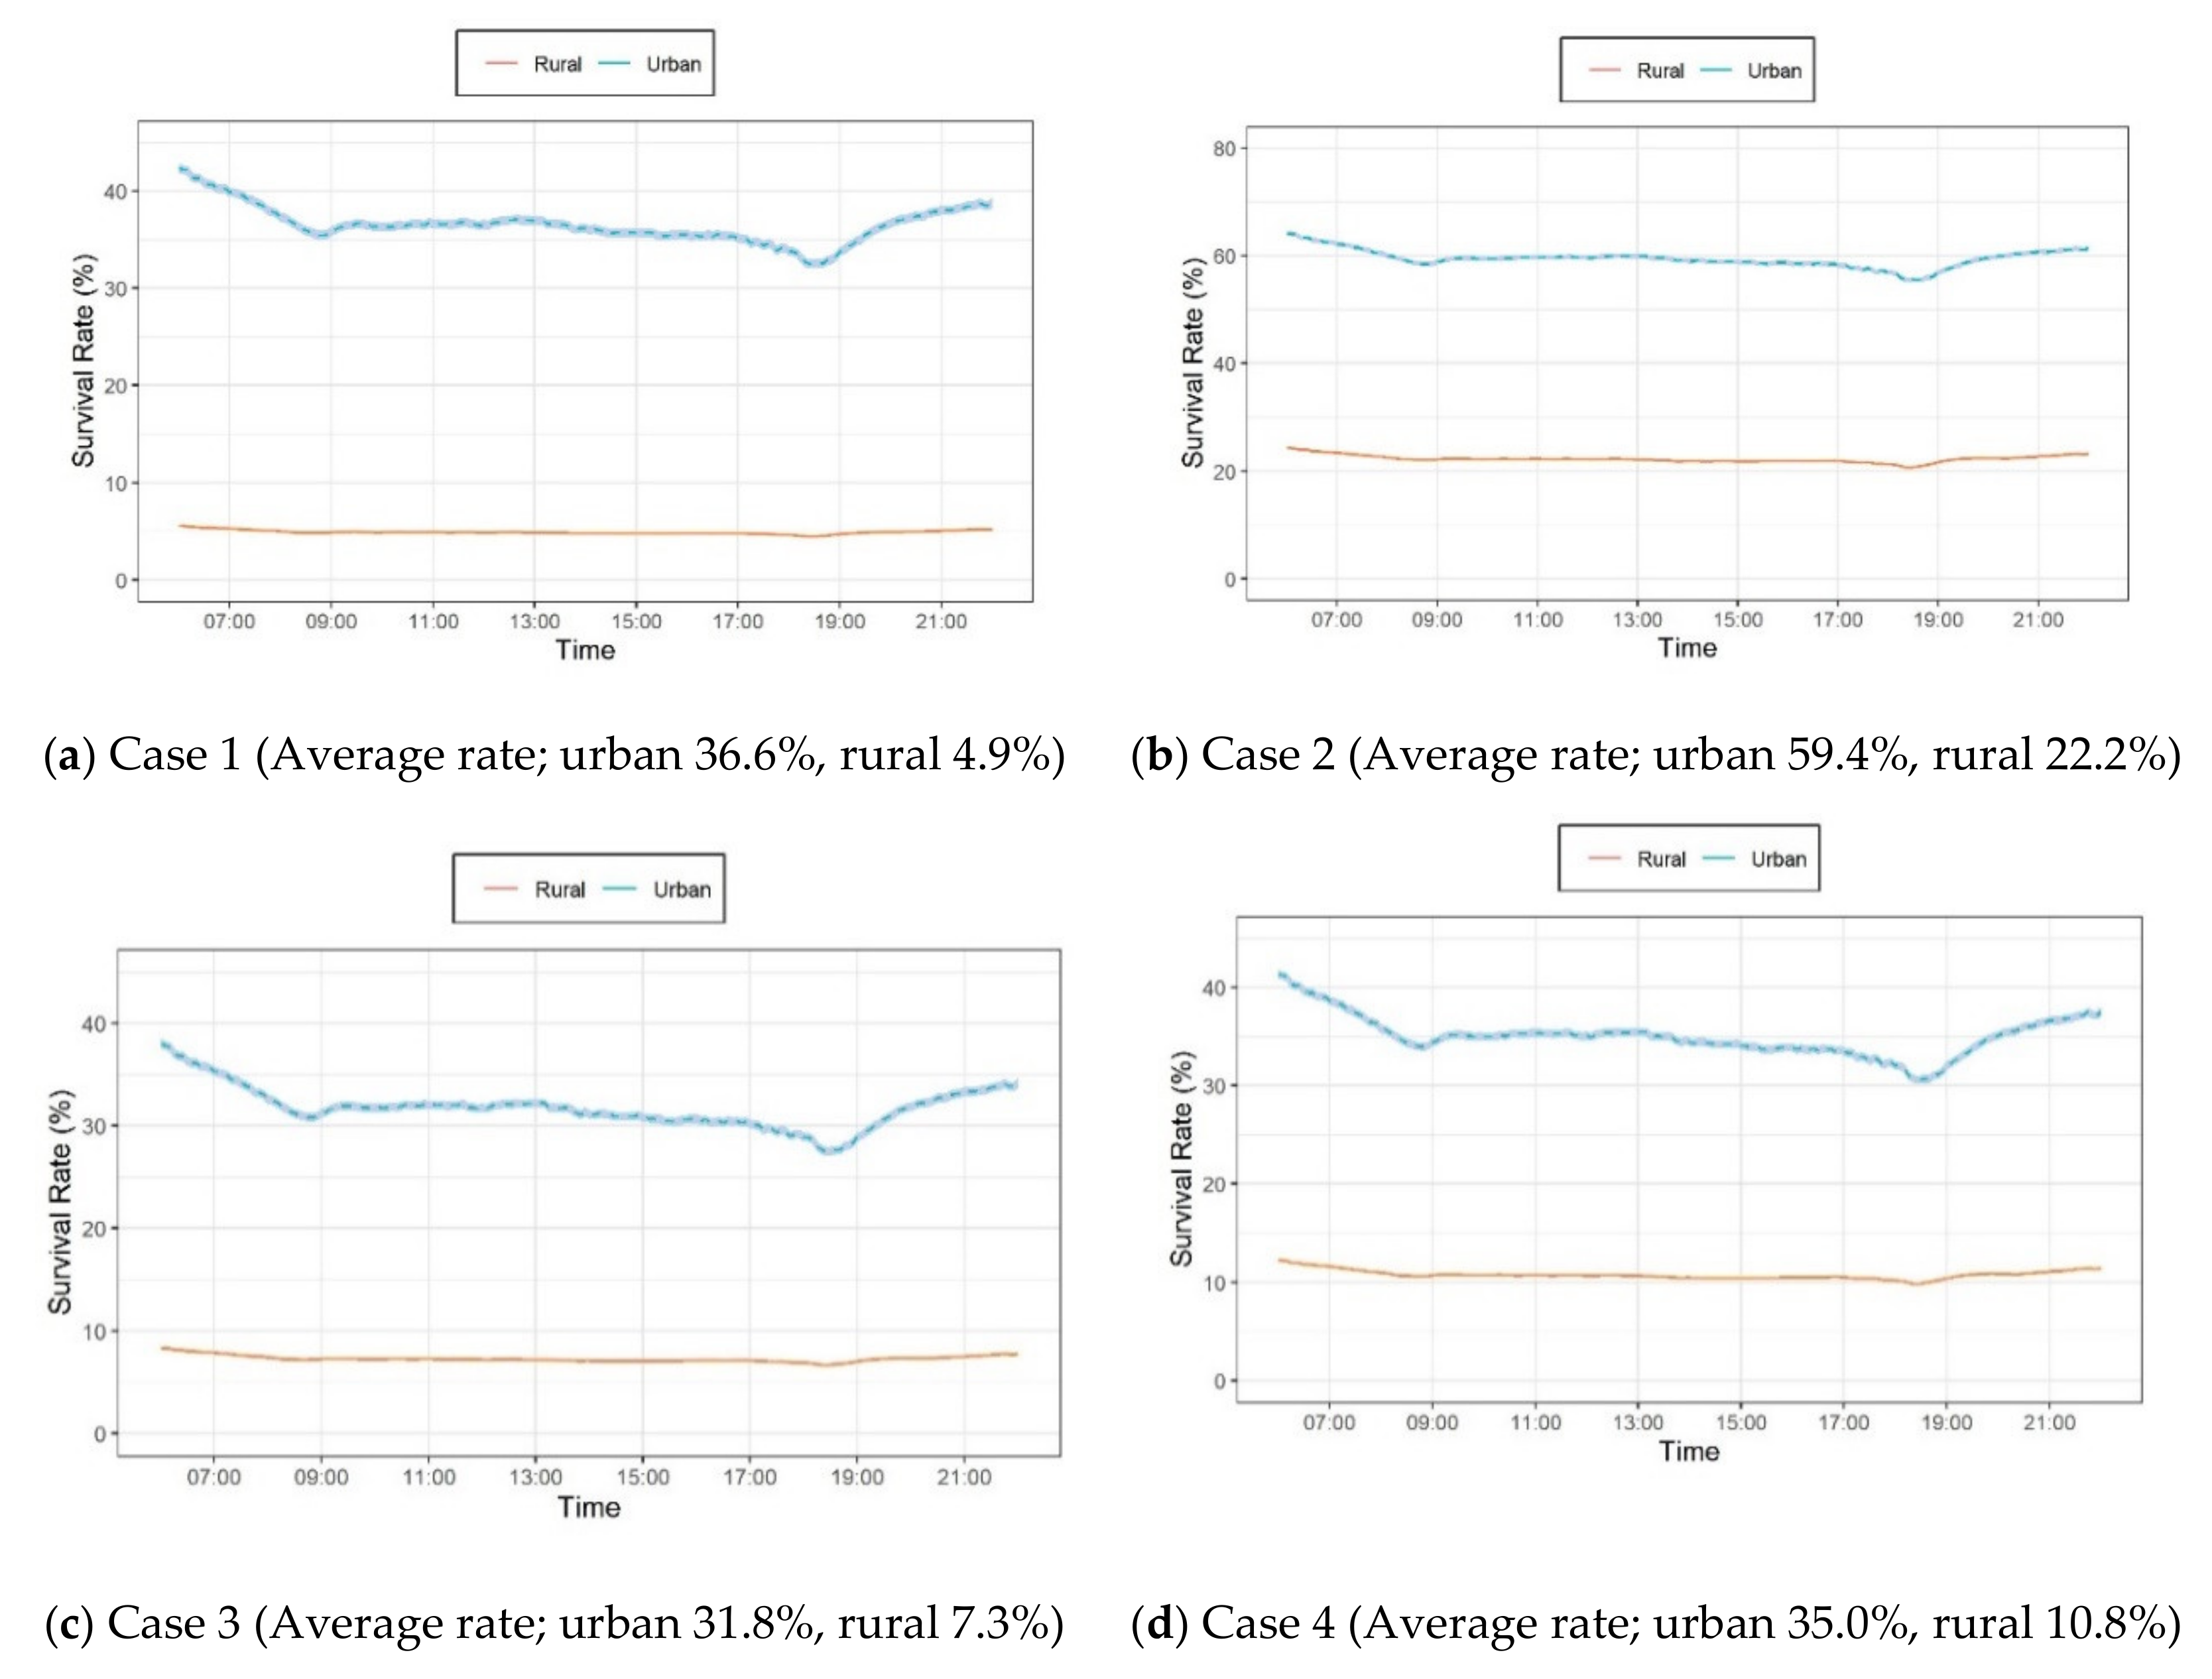
We estimated the survival rate of emergency patients by emergency case considering first aid status and dispatching EMT-paramedics (Figure 6). In Case 1 (Figure 6a), the average survival rate in urban areas was about 31.7% higher than those in rural areas: 36.6% in urban areas and 4.9% in rural areas. In Case 2 (Figure 6b), the average survival rate was 59.4% in urban areas and 22.2% in rural areas, which is about 22.9% higher for urban areas and 17.3% higher in rural areas than Case 1. As the survival rate in rural areas in Case 2 was about 4.5 times higher than those of Case 1, immediate CPR action can remarkably increase the survival rate of emergency patients in Case 2.
In Case 3 (Figure 6c), the survival rate was 31.8% in urban areas and 7.3% in rural areas. In Case 4 (Figure 6d), the survival rate was 35.0% in urban areas and 10.8% in rural areas. The survival rate in urban areas in Case 3 was about 5% lower than that in Case 1, indicating that the survival rate of patients decreases because of the delayed arrival time of an EMT-P to assist the patient and the longer transfer time to an emergency medical center due to low speed flow in urban areas. In contrast, the lower survival rate in rural areas was because of the long distance to an emergency medical facility. Despite these negative impact factors, dispatching an EMT-P can positively affect the overall survival rates of emergency patients.
In Case 4, the survival rate in urban areas also generally decreased to the same as Case 3, since the dispatch time of an EMT or healthcare provider has a negative effect on improving patient survival. In rural areas with Case 4, however, the survival rate was about two times as high as that in Case 1. Because rapid first aid can increase the survival rate of patients in rural areas, where there is a longer distance to a fire station or an emergency center, the survival rate could double when personnel at the nearest community health center are used. When personnel from a community health center are combined with first aid provided promptly by a person near the patient, the survival rate can increase by more than four times.
3.2.2. Survival Rates by Region Depending on Emergency Cases
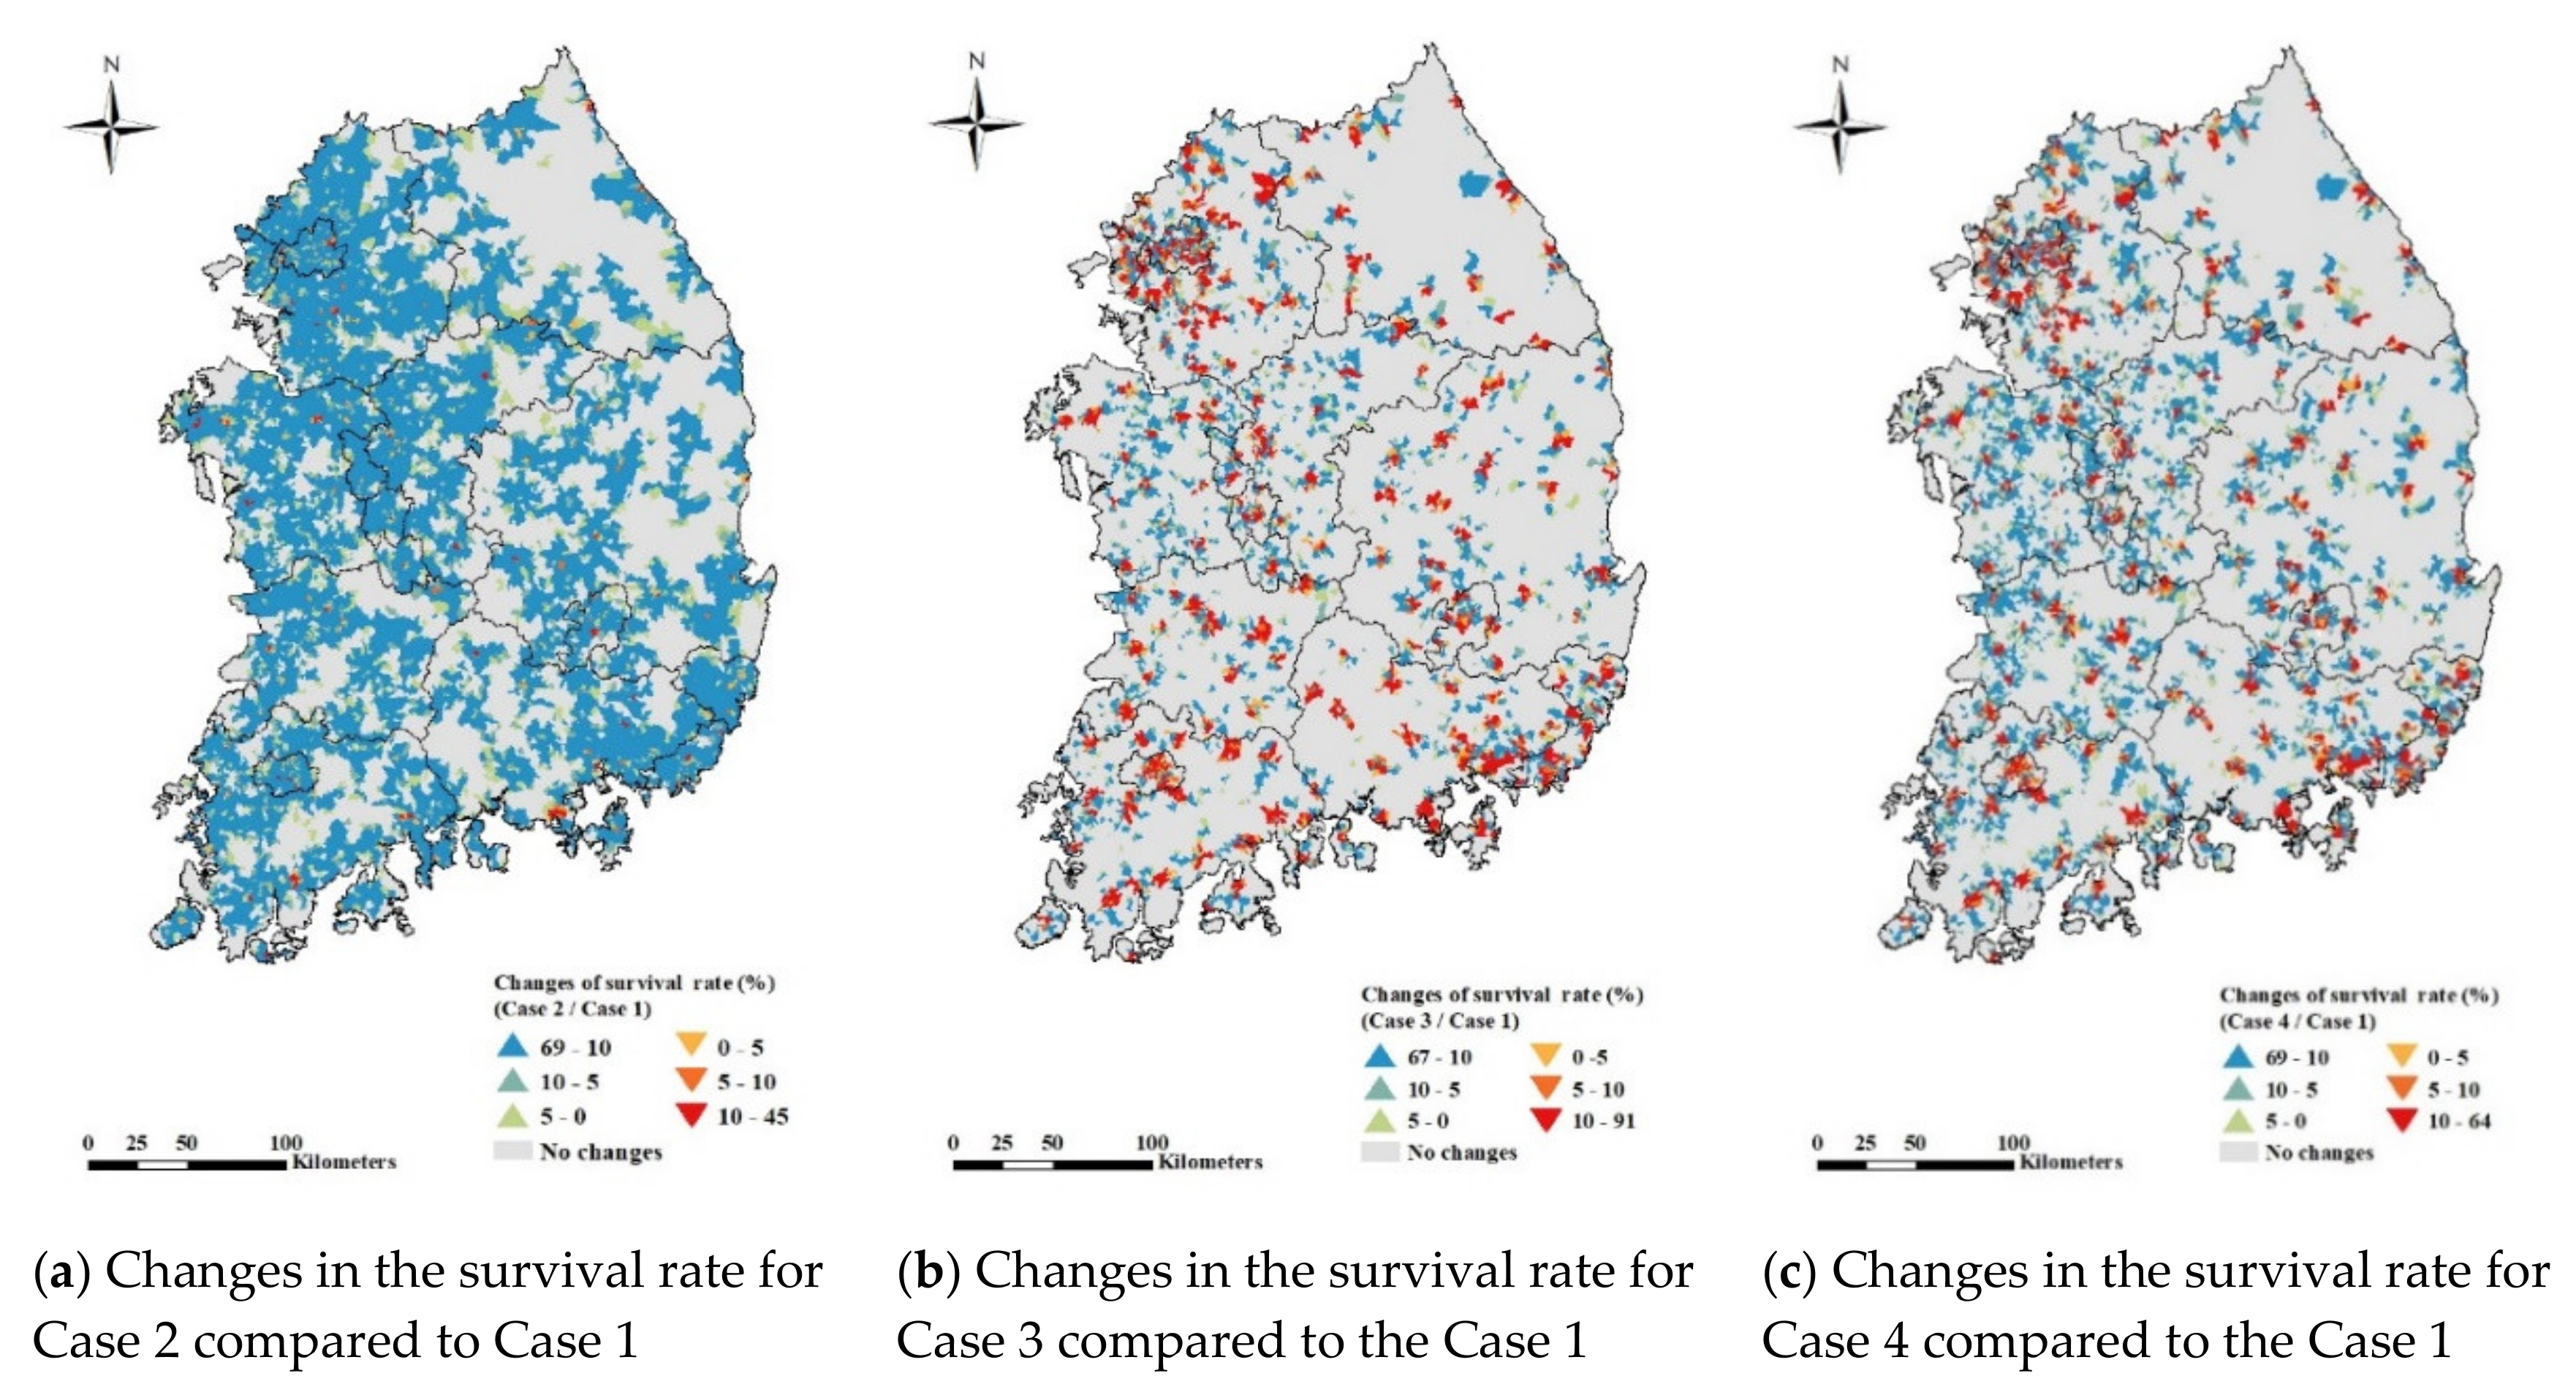
We examined the survival rate by region (urban and rural areas) with different emergency situations (Case 2, Case 3, and Case 4) compared to Case 1 (Figure 7). In Case 2 when patients immediately receive CPR, the survival rate increased in 12,439 villages compared to Case 1 (Figure 7a). Case 2 seems to be an ideal situation because the survival rate increased in 70% of the villages throughout the country. This result supports the other studies [54,55,56] that first aid provided by a person near the patient before an EMT arrives is important in improving the survival rate. In Case 3 where first aid is provided after the EMT arrives onsite, the survival rate increased in 3440 villages, but decreased in 2627 villages in mainly Busan, Gwangju, and Gyeonggi compared to Case 1 (Figure 7b). However, the survival rate in Seoul with Case 3 increased in some areas and decreased in other areas.
In Case 4 where first aid is provided by a healthcare provider or an EMT-P nearest the patient, the survival rate increased in 5309 villages, but decreased in 2217 villages in urban areas such as Seoul, Busan, Gwangju, Daegu, and Gyeonggi (Figure 7c). Case 4 does not seem to be applicable to urban areas as a policy because the time to receive help from a healthcare provider or an EMT-P increases and the time required to transfer the patient to an emergency medical facility increases. However, the survival rate in rural areas increased for 4060 villages in Case 4. This shows that establishing a system for medical staff in community health centers to provide first aid before an EMT-P arrives is an appropriate method to improve the survival rate. However, Case 4 is not a suitable method in Gangwon province, a representative mountainous region in Korea, because of the low road density and because the major medical facilities are concentrated in the central areas that are highly populated. Therefore, another alternative EMS is needed in this region to more effectively increase the survival rate of local residents.
4. Discussion
We suggest policy-based support to provide rapid first aid using local personnel. As the current major medical infrastructure is concentrated in urban areas, more emergency medical facilities should be established in rural areas to improve accessibility to EMS. However, it may be less efficient to build new emergency medical centers to cover all rural areas due to the personal and social expenditure needed. Instead, a more efficient method is to provide first aid to emergency patients to improve the survival rate. Based on our analysis, when first aid is provided by a primary respondent before an EMT-P arrives, the survival rate increased by 70% of the villages in rural areas. In addition, the survival rate increased in rural areas where an EMT-P or a healthcare provider provides first aid and then transfers the patient to an emergency medical facility. In urban areas, however, access by an EMT-P or a healthcare provider increased the time required for patient transfer and ultimately decreased the survival rate. Healthcare providers can also be used as additional personnel in rural areas to provide prompt and proper first aid. To further reduce the transfer time of emergency patients in urban areas, the government should consider introducing a traffic sign control system based on artificial intelligence on the road.
Based on some studies revealing the importance of reducing EMT-P dispatch time and implementing AED by the public [57,58,59], establishing an efficient response system that could increase patients’ survival rate if they receive quick first aid could be through additional dissemination of AEDs to places with potential risks (e.g., with many acute cardiac arrest patients, highly populated, and largely transient populated places) as well as through continuous training for the public on how to use AEDs and CPR. Because the most effective way to increase the survival rate is immediate first aid treatment, the government should train the public to administer CPR as well as to install and educate AEDs in populated places. One effective way to offer faster first aid is to foster the human infrastructure, including police, general staff of community health centers, apartment or building managers, and village representatives (town chiefs), to increase opportunities to provide first aid. These approaches would also be reasonable ways to improve the survival rate of emergency patients considering both the access time to emergency medical centers in urban areas and more people who can help provide first aid in rural areas before an EMT-P arrives.
5. Conclusions
We explored the vulnerable accessibility to emergency medical services (EMS) by region and time considering the speed limit and real speed of roads. The main findings showed that urban and rural areas have different characteristics in terms of access to an emergency medical facility. In urban areas, the congested road traffic flow (particularly during rush hour) delays the access time. In contrast, in rural areas, the far physical distance to an emergency medical facility increases the travel time, because most emergency medical facilities are concentrated in urban areas. We also found that assessing vulnerable areas to EMS based on the speed limit of roads, as in the existing standard, underestimates the time to a medical facility because it does not reflect the real road conditions.
This study delivers significant meaning to the existing government’s approach to define vulnerable areas for emergency care and shows the potential possibility of the underestimation to reflect real world through big data analysis using activity data (real-time road speed) and geographical data (spatial information). However, the study results can be improved with more data sources for the following: First, we assume that there is no delay time due to traffic signals as well as no extra time to prepare the EMT-P’s dispatch in 119-safety center which would ultimately have affected the survival rate of emergency patients. Second, we supposed that all emergency patients will be transferred to the nearest emergency medical center although patients can be transferred to different emergency centers following the patient’s choices or medical conditions of the center such as medical manpower and equipment. Third, the influence of epidemic conditions such as COVID-19 cannot be considered even though pandemic diseases potentially restrict the accessibility of emergency patients because of uncertain information and related laws to prevent the possibility of infection for medical personnel and other patients in the medical facilities.
We expect that future studies overcome current data availability issues for modeling precise cases including EMT-P’s actual dispatch time and arrival time as well as the exact transferred emergency center location of emergency patients. Our ongoing studies will not only provide more accurate assessment of vulnerable areas for EMS but also suggest optimal transport systems for regional emergency medical services.
Author Contributions
Conceptualization, J.J., S.K., and K.S.; methodology, J.J.; software, J.J.; validation, G.H.K. and K.S.; formal analysis, J.J.; investigation, S.K. and K.S.; resources, J.J. and G.H.K.; data curation, J.J., G.H.K. and K.S.; writing—original draft preparation, J.J. and S.K.; writing—review and editing, J.J., S.K. and K.S.; visualization, J.J. and S.K.; supervision, K.S.; project administration, K.S.; funding acquisition, K.S. All authors have read and agreed to the published version of the manuscript.
Funding
This research was supported by Basic Science Research Program through the National Research Foundation of Korea(NRF) funded by the Ministry of Education(NRF-2020R1A6A3A13075970).
Conflicts of Interest
The authors declare no conflict of interest.
References
- Hoffman, E. Mortality and morbidity following road accidents. Ann. R. Coll. Surg. Engl. 1976, 58, 233. [Google Scholar] [PubMed]
- Weber, E.J. Travel or Traffic: Either Way, Emergency Service May Be Delayed. Ann. Emerg. Med. 2009, 2, 270–271. [Google Scholar] [CrossRef] [PubMed]
- Carr, B.G.; Branas, C.C.; Metlay, J.P.; Sullivan, A.F.; Camargo, C.A., Jr. Access to emergency care in the United States. Ann. Emerg. Med. 2009, 54, 261–269. [Google Scholar] [CrossRef] [PubMed] [Green Version]
- Carr, B.G.; Caplan, J.M.; Pryor, J.P.; Branas, C.C. A meta-analysis of prehospital care times for trauma. Prehosp. Emerg. Care 2006, 10, 198–206. [Google Scholar] [CrossRef] [PubMed]
- Eisenberg, M.S.; Cummins, R.O.; Damon, S.; Larsen, M.P.; Hearne, T.R. Survival rates from out-of-hospital cardiac arrest: Recommendations for uniform definitions and data to report. Ann. Emerg. Med. 1990, 19, 1249–1259. [Google Scholar] [CrossRef]
- Noble-Mathews, P.M. Pre-Hospital Care; Elsevier Health Sciences: London, UK, 2005; pp. 61–69. [Google Scholar]
- Bigdeli, M.; Khorasani-Zavareh, D.; Mohammadi, R. Pre-hospital care time intervals among victims of road traffic injuries in Iran. A cross-sectional study. BMC Public Health 2010, 10, 406. [Google Scholar] [CrossRef] [Green Version]
- Lee, E. Designing service coverage and measuring accessibility and serviceability of rural and small urban ambulance systems. Systems 2014, 2, 34–53. [Google Scholar] [CrossRef]
- Shin, K.; Lee, T. Improving the measurement of the Korean emergency medical System’s spatial accessibility. Appl. Geogr. 2018, 100, 30–38. [Google Scholar] [CrossRef]
- Grossman, D.C.; Kim, A.; Macdonald, S.C.; Klein, P.; Copass, M.K.; Maier, R.V. Urban-rural differences in prehospital care of major trauma. J. Trauma Acute Care Surg. 1997, 42, 723–729. [Google Scholar] [CrossRef]
- Chng, C.L.; Collins, J.; Eaddy, S. A comparison of rural and urban emergency medical system (EMS) personnel: A Texas study. Prehosp. Disaster Med. 2001, 16, 159–165. [Google Scholar] [CrossRef]
- OECD. OECD Health Care Quality Review: Korea; Organization for Economic Cooperation and Development Publishing: Paris, France, 2012. [Google Scholar]
- Kim, S.; Kim, T.; Suh, K. Assessment of accessibility to medical facilities in rural areas using real road distance focusing on Pyeongchang-gun. J. Korean Soc. Agric. Eng. 2015, 57, 39–49. [Google Scholar] [CrossRef]
- HIRAS. Healthcare Bigdata Hub; Health Insurance Review & Assessment Service: Wonju-si, Korea, 2020; Available online: https://opendata.hira.or.kr/home.do (accessed on 17 September 2020).
- Lloyd-Jones, D.M.; Leip, E.P.; Larson, M.G.; d’Agostino, R.B.; Beiser, A.; Wilson, P.; Wolf, P.A.; Levy, D. Prediction of lifetime risk for cardiovascular disease by risk factor burden at 50 years of age. Circulation 2006, 113, 791–798. [Google Scholar] [CrossRef] [PubMed]
- KOSIS. 2017 Causes of Death Statistics; Korean Statistical Information Service, Statistics Korea: Daejeon, Korea, 2017. [Google Scholar]
- KOSIS. Population Ageing; Korean Statistical Information Service, Statistics Korea: Daejeon, Korea, 2019. [Google Scholar]
- Van den Heuvel, W.; Ghinescu, M.; Olaroiu, M. How to Prevent Preventable Death. SM Prev. Med. Public Health 2017, 1, 1004. [Google Scholar] [CrossRef]
- Jeon, J.; Park, M.; Jang, D.; Lim, C.; Kim, E. Vulnerable Analysis of Emergency Medical Facilities based on Accessibility to Emergency Room and 119 Emergency Center. J. Korean Soc. Rural Plan. 2018, 24, 147–155. [Google Scholar] [CrossRef]
- Health and Welfare. Public Health and Medical Services Act. In Article 12 (Designation and Public Announcement of Areas Lacking Medical Services); Korea Legislative Research Institute: Bangok-dong, Korea, 2018. [Google Scholar]
- Barbarisi, I.; Bruno, G.; Diglio, A.; Elizalde, J.; Piccolo, C. A spatial analysis to evaluate the impact of deregulation policies in the pharmacy sector: Evidence from the case of Navarre. Health Policy 2019, 123, 1108–1115. [Google Scholar] [CrossRef] [PubMed]
- Ikram, S.Z.; Hu, Y.; Wang, F. Disparities in spatial accessibility of pharmacies in Baton Rouge, Louisiana. Geogr. Rev. 2015, 105, 492–510. [Google Scholar] [CrossRef]
- Neutens, T. Accessibility, equity and health care: Review and research directions for transport geographers. J. Transp. Geogr. 2015, 43, 14–27. [Google Scholar] [CrossRef]
- Pu, Q.; Yoo, E.-H.; Rothstein, D.H.; Cairo, S.; Malemo, L. Improving the spatial accessibility of healthcare in North Kivu, Democratic Republic of Congo. Appl. Geogr. 2020, 121, 102262. [Google Scholar] [CrossRef]
- Wang, F. Measurement, optimization, and impact of health care accessibility: A methodological review. Ann. Assoc. Am. Geogr. 2012, 102, 1104–1112. [Google Scholar] [CrossRef] [Green Version]
- Ehara, A. Accessibility of pediatric inpatient services in Japan. PLoS ONE 2018, 13, e0201443. [Google Scholar] [CrossRef]
- Jin, M.; Liu, L.; Tong, D.; Gong, Y.; Liu, Y. Evaluating the spatial accessibility and distribution balance of multi-level medical service facilities. Int. J. Environ. Res. Public Health 2019, 16, 1150. [Google Scholar] [CrossRef] [PubMed] [Green Version]
- Bruno, G.; Cavola, M.; Diglio, A.; Piccolo, C. Improving spatial accessibility to regional health systems through facility capacity management. Socio-Econ. Plan. Sci. 2020, 71, 100881. [Google Scholar] [CrossRef]
- Wielebski, Ł.; Medyńska-Gulij, B. Graphically supported evaluation of mapping techniques used in presenting spatial accessibility. Cartogr. Geogr. Inf. Sci. 2019, 46, 311–333. [Google Scholar] [CrossRef]
- Liu, S.; Qin, Y.; Xu, Y. Inequality and Influencing Factors of Spatial Accessibility of Medical Facilities in Rural Areas of China: A Case Study of Henan Province. Int. J. Environ. Res. Public Health 2019, 16, 1833. [Google Scholar] [CrossRef] [PubMed] [Green Version]
- Dejen, A.; Soni, S.; Semaw, F. Spatial accessibility analysis of healthcare service centers in Gamo Gofa Zone, Ethiopia through Geospatial technique. Remote Sens. Appl. Soc. Environ. 2019, 13, 466–473. [Google Scholar] [CrossRef]
- Kim, S.; Kim, T.; Suh, K. Analysis of the implication of accessibility to community facilities for land price in rural areas using a hedonic land price model. J. Korean Soc. Rural Plan. 2016, 22, 93–100. [Google Scholar] [CrossRef]
- Jeon, J.; Kim, S.; Kwon, S.M. The Effects of Urban Containment Policies on Public Health. Int. J. Environ. Res. Public Health 2020, 17, 3275. [Google Scholar] [CrossRef]
- Kim, S.; Jeon, J.; Suh, K. Evaluating Educational Fairness of Commuting Distances for Rural Villages following the Closing of Elementary Schools. J. Korean Soc. Agric. Eng. 2020, 62, 29–38. [Google Scholar] [CrossRef]
- Li, L.; Du, Q.; Ren, F.; Ma, X. Assessing spatial accessibility to hierarchical urban parks by multi-types of travel distance in Shenzhen, China. Int. J. Environ. Res. Public Health 2019, 16, 1038. [Google Scholar] [CrossRef] [Green Version]
- Jeon, J.; Kim, S.; Suh, K.; Yoon, S. Analysis of Village Safety Index using Accessibility to Public Facilities. J. Korean Soc. Rural Plan. 2016, 22, 121–129. [Google Scholar] [CrossRef]
- Rural Areas Information Service (RAISE). Available online: https://www.raise.go.kr/raise/index.do (accessed on 16 September 2020).
- Chin, H.S.; Park, M.J.; Yun, D.S. Evaluating Accessibilities to Village Community Centers via Rural Amenity Resources Information. J. Korean Soc. Rural Plan. 2014, 20, 57–69. [Google Scholar] [CrossRef]
- Kim, S.; Kim, T.; Suh, K. Evaluation of Accessibility to Elementary and Secondary Educational Facilities on Village Level in Rural Areas. J. Korean Soc. Rural Plan. 2017, 23, 121–131. [Google Scholar] [CrossRef]
- Wikipedia. Administrative Divisions of South Korea. Available online: https://en.wikipedia.org/wiki/Administrative_divisions_of_South_Korea (accessed on 16 September 2020).
- National Medical Center (NMC). Available online: https://www.nmc.or.kr/main.asp (accessed on 16 September 2020).
- Ministry of Health and Welfare (MHW). Available online: http://www.mohw.go.kr/react/index.jsp (accessed on 16 September 2020).
- National Fire Agency (NFA). Available online: https://www.nfa.go.kr/nfa/ (accessed on 16 September 2020).
- Intelligent Transport Systems (ITS). Available online: http://nodelink.its.go.kr/ (accessed on 16 September 2020).
- Traffic and Road Information Service. Available online: http://openapi.its.go.kr/data/centerTraffic.do (accessed on 16 September 2020).
- ESRI. What is the ArcGIS Network Analyst Extension? Available online: https://desktop.arcgis.com/en/arcmap/latest/extensions/network-analyst/what-is-network-analyst-.htm (accessed on 16 September 2020).
- Eisenberg, M.S.; Cummins, R.O.; Larsen, M.P. Numerators, denominators, and survival rates: Reporting survival from out-of-hospital cardiac arrest. Am. J. Emerg. Med. 1991, 9, 544–546. [Google Scholar] [CrossRef]
- Gottschalk, A.; Burmeister, M.-A.; Freitag, M.; Cavus, E.; Standl, T. Influence of early defibrillation on the survival rate and quality of life after CPR in prehospital emergency medical service in a German metropolitan area. Resuscitation 2002, 53, 15–20. [Google Scholar] [CrossRef]
- May, S.; Zhang, L.; Foley, D.; Brennan, E.; O’Neil, B.; Bork, E.; Levy, P.; Dunne, R. Improvement in Non-Traumatic, Out-Of-Hospital Cardiac Arrest Survival in Detroit From 2014 to 2016. J. Am. Heart Assoc. 2018, 7, e009831. [Google Scholar] [CrossRef] [Green Version]
- Eisenberg, M.S.; Horwood, B.T.; Cummins, R.O.; Reynolds-Haertle, R.; Hearne, T.R. Cardiac arrest and resuscitation: A tale of 29 cities. Ann. Emerg. Med. 1990, 19, 179–186. [Google Scholar] [CrossRef]
- Larsen, M.P.; Eisenberg, M.S.; Cummins, R.O.; Hallstrom, A.P. Predicting survival from out-of-hospital cardiac arrest: A graphic model. Ann. Emerg. Med. 1993, 22, 1652–1658. [Google Scholar] [CrossRef]
- European Resuscitation Council. Part 6: Advanced cardiovascular life support. Section 8: Postresuscitation care. European Resuscitation Council. Resuscitation 2000, 46, 195–201. [Google Scholar]
- Health and Welfare. Regional Public Health Act. In Article 3 of the Framework Act on Health and Medical Services; Act No. 16262; Korea Legislative Research Institute: Bangok-dong, Korea, 2019. [Google Scholar]
- Holmberg, M.J.; Vognsen, M.; Andersen, M.S.; Donnino, M.W.; Andersen, L.W. Bystander automated external defibrillator use and clinical outcomes after out-of-hospital cardiac arrest: A systematic review and meta-analysis. Resuscitation 2017, 120, 77–87. [Google Scholar] [CrossRef]
- Hasselqvist-Ax, I.; Riva, G.; Herlitz, J.; Rosenqvist, M.; Hollenberg, J.; Nordberg, P.; Ringh, M.; Jonsson, M.; Axelsson, C.; Lindqvist, J. Early cardiopulmonary resuscitation in out-of-hospital cardiac arrest. N. Engl. J. Med. 2015, 372, 2307–2315. [Google Scholar] [CrossRef] [Green Version]
- Park, Y.M.; Do Shin, S.; Lee, Y.J.; Song, K.J.; Ro, Y.S.; Ahn, K.O. Cardiopulmonary resuscitation by trained responders versus lay persons and outcomes of out-of-hospital cardiac arrest: A community observational study. Resuscitation 2017, 118, 55–62. [Google Scholar] [CrossRef] [PubMed]
- Lee, S.Y.; Do, Y.K.; Do Shin, S.; Park, Y.J.; Ro, Y.S.; Lee, E.J.; Lee, K.W.; Lee, Y.J. Community socioeconomic status and public access defibrillators: A multilevel analysis. Resuscitation 2017, 120, 1–7. [Google Scholar] [CrossRef] [PubMed]
- Hawkes, C.; Booth, S.; Ji, C.; Brace-McDonnell, S.J.; Whittington, A.; Mapstone, J.; Cooke, M.W.; Deakin, C.D.; Gale, C.P.; Fothergill, R. Epidemiology and outcomes from out-of-hospital cardiac arrests in England. Resuscitation 2017, 110, 133–140. [Google Scholar] [CrossRef] [PubMed] [Green Version]
- Nishi, T.; Takei, Y.; Kamikura, T.; Ohta, K.; Hashimoto, M.; Inaba, H. Improper bystander-performed basic life support in cardiac arrests managed with public automated external defibrillators. Am. J. Emerg. Med. 2015, 33, 43–49. [Google Scholar] [CrossRef] [PubMed]
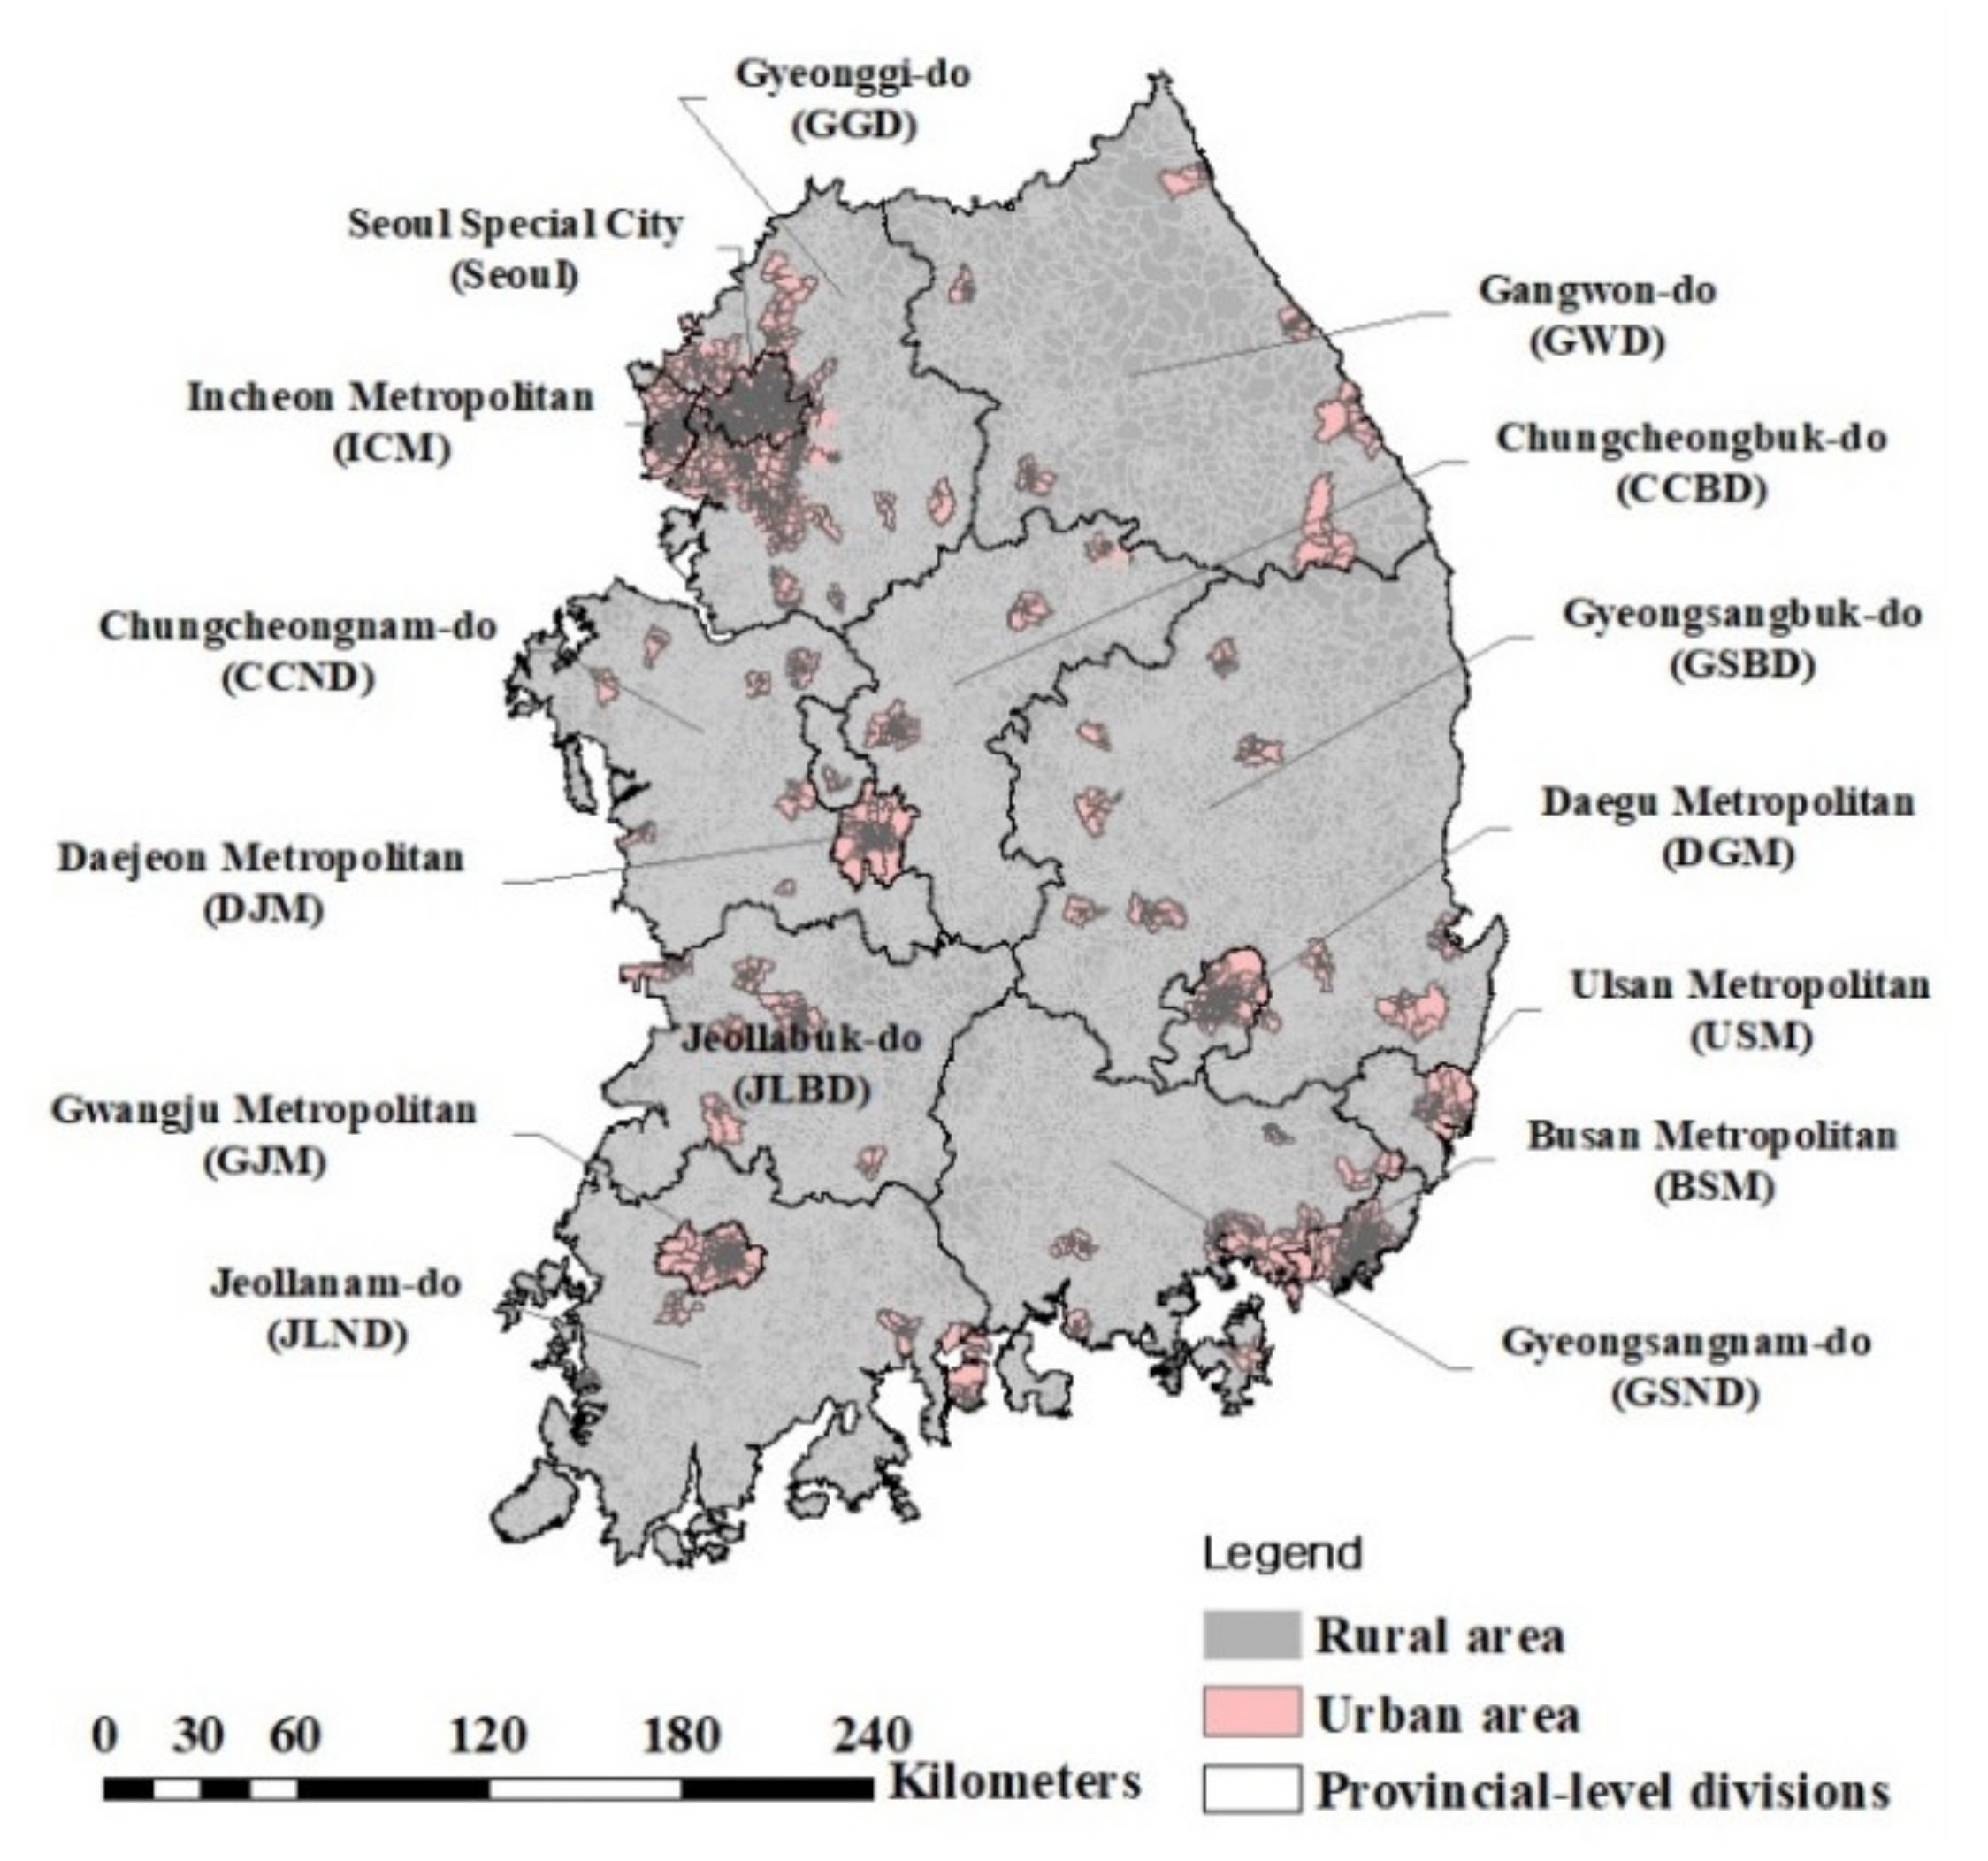
Figure 1.
Location of provincial-level divisions in South Korea except for Jeju island. South Korea consists of 17 first-tier administrative divisions: 6 metropolitan cities, 1 special city, 1 special self-governing city, and 9 provinces. The gray and pink areas indicate rural and urban areas, organized sub-municipal level divisions (Dong (neighborhood in Urban) and Ri (Village in Rural).

Figure 2.
Distribution of medical facilities in Korea. The yellow and gray areas indicate urban and rural areas, respectively. The individual medical facilities are represented by dots. Red dots in (a) are emergency medical centers, blue dots in (b) are community health centers, and green dots in (c) are 119-safety centers. There are 495 emergency medical centers, 3161 community health centers, and 1711 safety centers.

Figure 3.
Vehicle speeds in the road network measured at a 5-min unit by road type in urban and rural areas. The average speed of roads is shown in blue to red on each road map. The distribution of the actual vehicle speed is indicated by road type (speed limit of 60 km/h and 80 km/h) on the right side in the line graph.

Figure 4.
Vulnerable areas depending on the road traffic flow speed. The yellow and gray areas indicate urban and rural areas, respectively. The red areas indicate vulnerable areas of EMS, where an emergency patient could not arrive at an emergency medical center within 30 min. (a) shows 659 vulnerable areas (4 urban areas and 655 rural areas). (b) shows 3618 vulnerable areas (48 urban areas and 3570 rural areas).

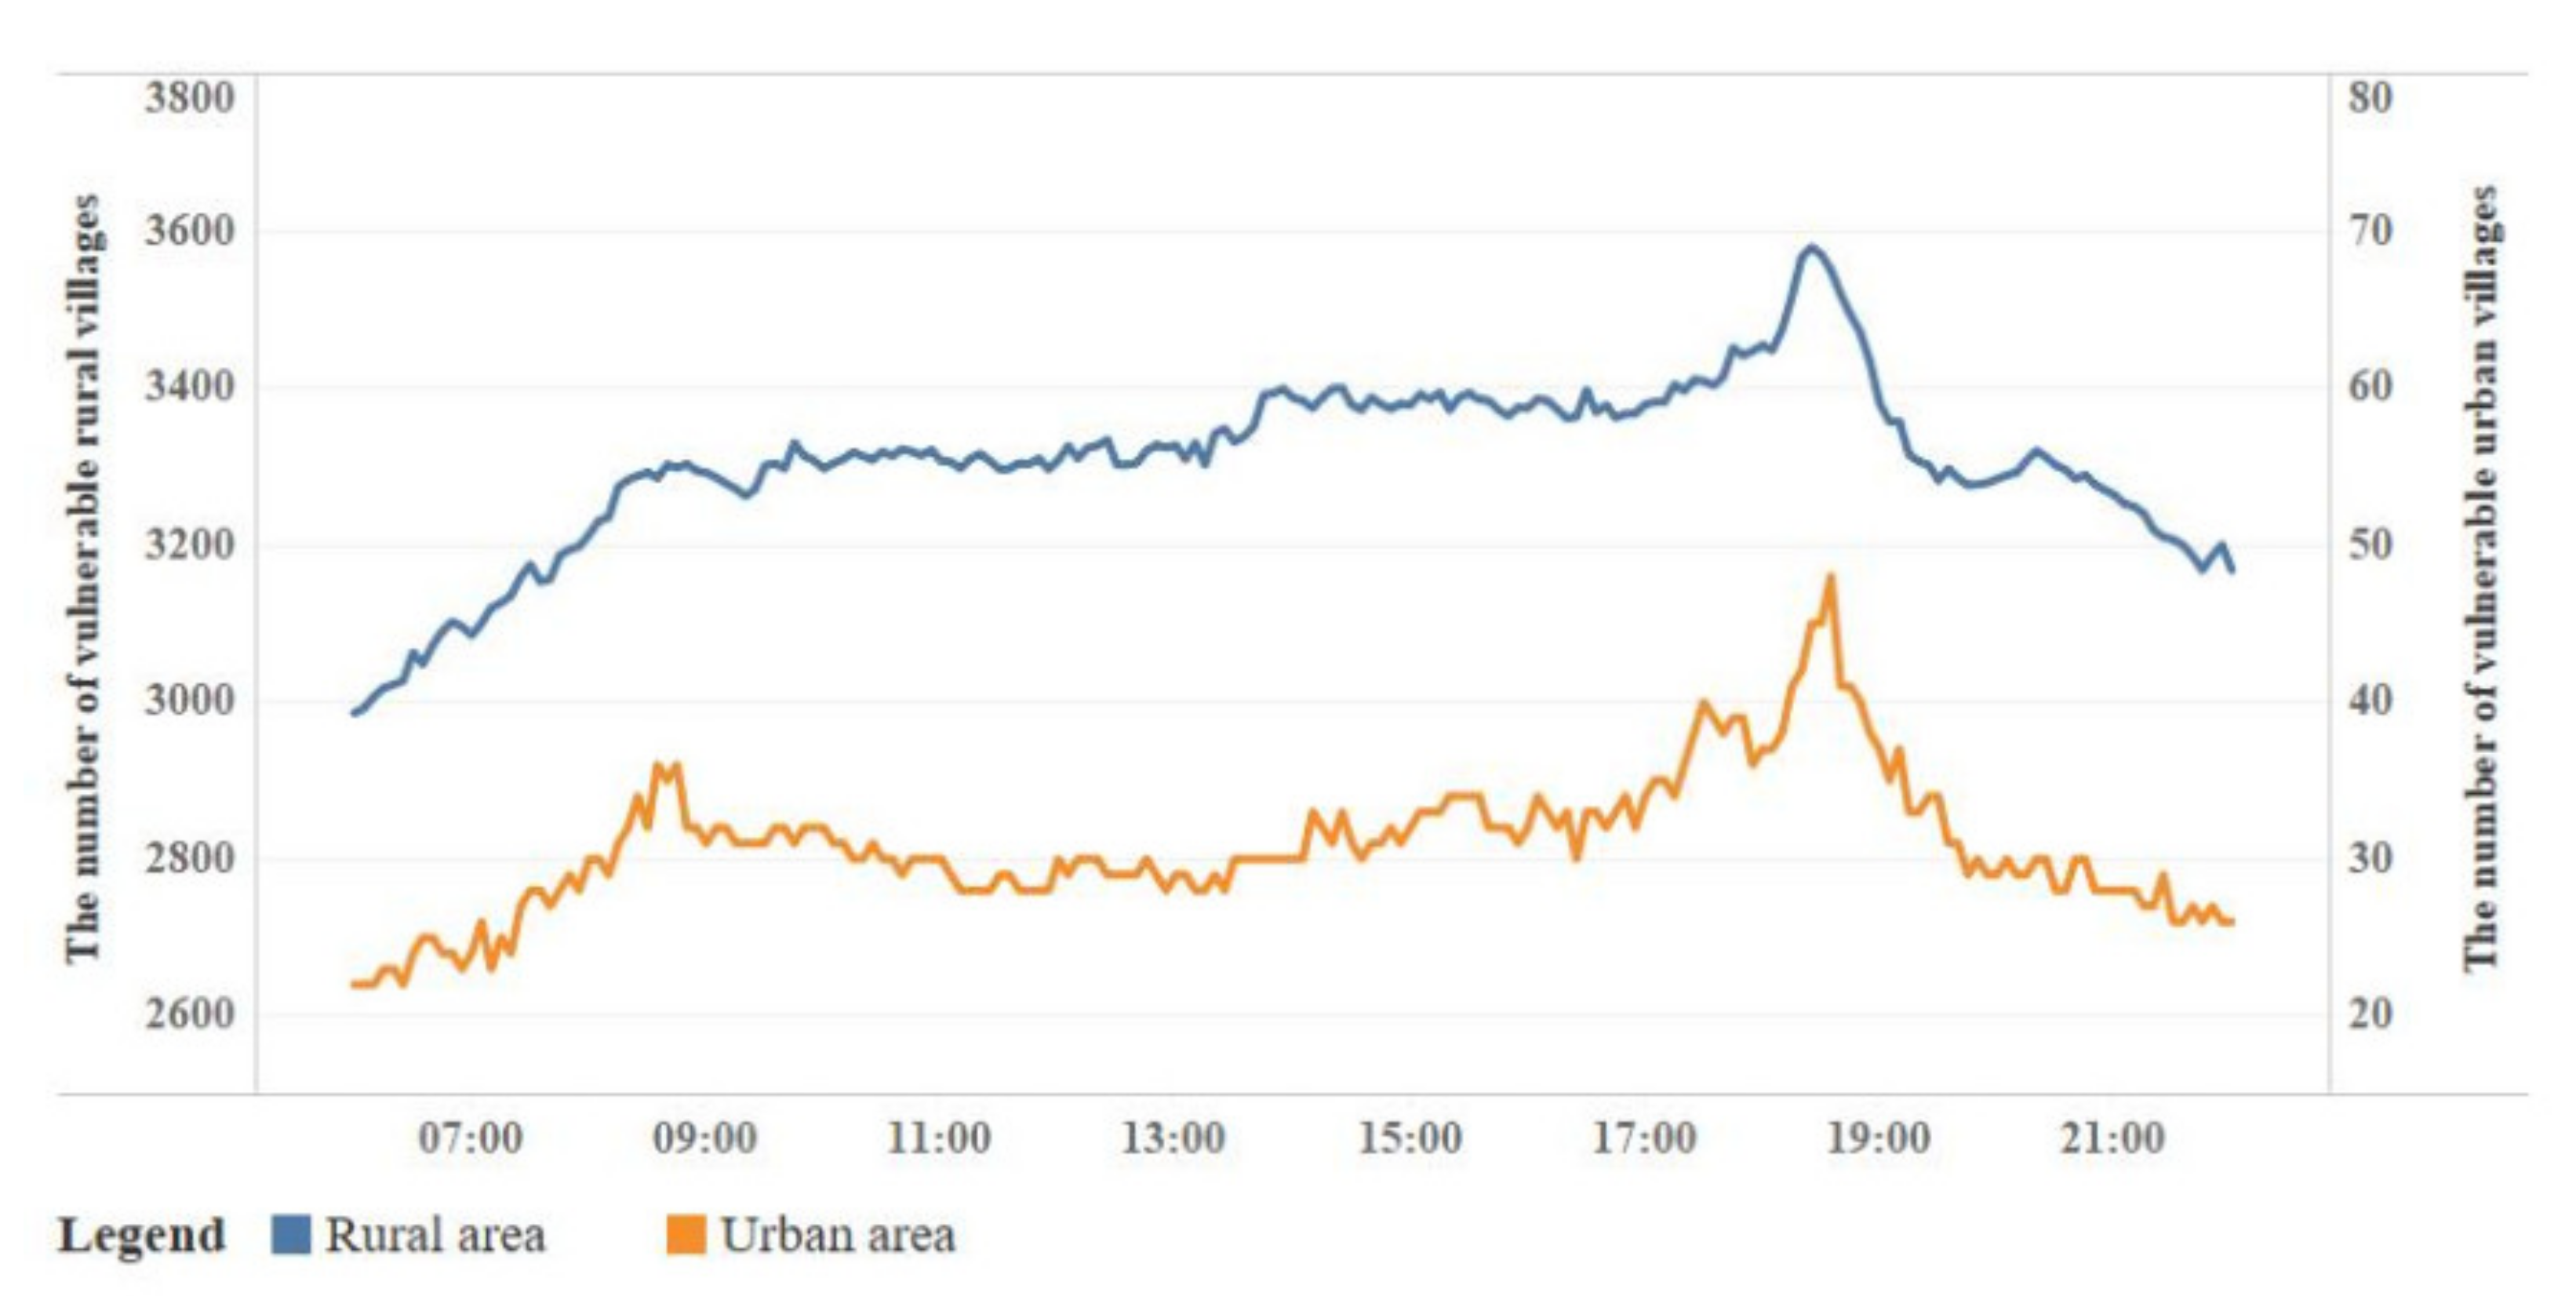
Figure 5.
Number of vulnerable areas of EMS in urban and rural areas based on the real road traffic speed in five-minute units. The number of vulnerable areas is marked as an orange line for urban areas and as a blue line for rural areas. The time slots when the number of vulnerable areas reach a peak during afternoon rush hour (17:00–20:00). The highest is 6:35 p.m. (48 villages) in urban areas, and 6:25 p.m. (3570 villages) in rural areas.

Figure 6.
Survival rates in urban and rural areas by emergency response case. The survival rates in different timeslots are shown according to the emergency response cases described in Table 2. Among the four cases, the highest survival rate is Case 2, which is when a patient receives cardiopulmonary resuscitation (CPR) by someone near the patient.

Figure 7.
Survival rates in emergency response cases compared to Case 1. The blue areas represent the areas where the survival rate increases through expanded emergency responses by local individuals compared to Case 1. Red areas represent areas where the survival rate decreases. In both urban and rural areas, the emergency response in Case 2 was found to be the most effective in improving the survival rate.


Table 1.
List of available data (facility, population, and traffic speed data) to analyze the vulnerable areas for emergency medical services (EMS). The facility data include data about community centers and medical centers. Each type of data includes a description of the data, the number of available statistics (urban and rural), and reasons for exceptions. The data were provided by the Korean government, and the source of each type of data is shown.
| Category | Description | Number of Available Data | Source | |||
|---|---|---|---|---|---|---|
| Urban | Rural | Exception 1 | ||||
| Facility data | ||||||
| Community center | Coordinate information on community centers in urban and rural villages | 3507 | 15,171 | 907 | MIS 2/RAISE 3 | |
| Medical center | Emergency medical center | Coordinate information on emergency medical facilities including local emergency rooms and regional medical centers | 397 | 112 | 14 | NMC 4 |
| 119-safety centers | Coordinate information on 119-safety centers | 709 | 1112 | 110 | NFA 5 | |
| Community health center | Converting addresses to coordinate information of local community health centers | 287 | 3195 | 321 | MHW 6 | |
| Traffic speed data | ||||||
| Roadmap | Polyline information | 531,843 links | ITS 7 | |||
| Traffic speed | Text information | 358,143 links | MLIT 8 | |||
1 Each facility for assessing accessibility of emergency medical center in island and military zone excepts in this study; 2 Ministry of the Interior and Safety (MIS); 3 Rural Areas Information Service (RAISE); 4 National Medical Center (NMC); 5 National Fire Agency (NFA); 6 Ministry of Health and Welfare (MHW); 7 Intelligent Transport Systems (ITS); 8 Ministry of Land, Infrastructure and Transport (MLIT).
Table 2.
Description of emergency cases considering first-aid and transfer systems.
| Case | Description | Emergency First Aid |
|---|---|---|
| Case 1 | A patient moves to the nearest emergency center using a personal means of transportation. | X |
| Case 2 | An emergency medical technician-paramedic (EMT-P) is dispatched, but a person near the patient immediately provides first aid according to the first aid instructions given by a telephone operator (dispatcher). After arriving onsite, the EMT-P transfers the patient to the nearest emergency center. | O |
| Case 3 | An EMT-P is dispatched. After arriving onsite, the EMT-P provides first aid, and then transfers the patient to the nearest emergency center. | O |
| Case 4 | An EMT-P or an additional healthcare provider from a community health center is dispatched, provides first aid on-site, and then the EMT-P transfers the patient to the nearest emergency center. | O |
© 2020 by the authors. Licensee MDPI, Basel, Switzerland. This article is an open access article distributed under the terms and conditions of the Creative Commons Attribution (CC BY) license (http://creativecommons.org/licenses/by/4.0/).
Share and Cite
MDPI and ACS Style
Jeon, J.; Kim, S.; Kang, G.H.; Suh, K. Analysis of Emergency Medical Vulnerability and Survival Rates Following Real-Time Traffic Information. Appl. Sci. 2020, 10, 6492. https://0-doi-org.brum.beds.ac.uk/10.3390/app10186492
AMA Style
Jeon J, Kim S, Kang GH, Suh K. Analysis of Emergency Medical Vulnerability and Survival Rates Following Real-Time Traffic Information. Applied Sciences. 2020; 10(18):6492. https://0-doi-org.brum.beds.ac.uk/10.3390/app10186492
Chicago/Turabian StyleJeon, Jeongbae, Solhee Kim, Gu Hyun Kang, and Kyo Suh. 2020. "Analysis of Emergency Medical Vulnerability and Survival Rates Following Real-Time Traffic Information" Applied Sciences 10, no. 18: 6492. https://0-doi-org.brum.beds.ac.uk/10.3390/app10186492
Note that from the first issue of 2016, this journal uses article numbers instead of page numbers. See further details here.