Article

Comprehensive Identification of Reliable Reference Genes for qRT-PCR Normalization of Fusarium oxysporum-Resistant Genes’ Expressions in Lilium sargentiae Wilson

Flower Research Institute of Yunnan Academy of Agricultural Sciences, Key Lab of Yunnan Flower Breeding, National Engineering Research Center for Ornamental Horticulture, Kunming 650205, China
*
Authors to whom correspondence should be addressed.
These authors contributed equally to this work.
Submission received: 12 December 2022 / Revised: 27 February 2023 / Accepted: 28 February 2023 / Published: 7 March 2023

Abstract

:
Fusarium wilt (caused by Fusarium oxysporum f. sp. Lilii) is one of the most damaging diseases in lily (Lilium sargentiae Wilson). Although some F. oxysporum-resistant lily varieties have been identified and are being utilized in resistant breeding, the regulation network of the resistance-associated mechanisms is yet to be studied due to the lack of reliable reference genes for qRT-PCR (quantitative reverse transcription PCR) normalization. The reliability of results by qRT-PCR relies mainly on the stability of the reference genes. This study investigated the reliability of nine candidate reference genes (CYP, EF1-α, GAPDH, TUB, UBQ, AQP, HIS, PGK, and RPL13) for qRT-PCR analysis of F. oxysporum-resistant genes. Expression stability analysis via common programs GeNorm, BestKeeper, and NormFinder, at different time points post-inoculation of F. oxysporum, revealed that all nine genes met the basic requirements of reference genes. Amongst them, HIS and GAPDH displayed the highest and the lowest expression stability, respectively. The reliability of HIS was further validated by analyzing the expression levels of four resistance-related candidate genes. The expression patterns of the four target genes were consistent with their responses to pathogenetic fungi in other plants. Our results show that HIS is the most suitable reference gene for accurately normalizing F. oxysporum-resistant genes’ expressions in L. sargentiae.

1. Introduction

Gene expression analysis is crucial in dissecting the regulation network of physiological and metabolic processes in plants [1,2,3]. At present, transcriptome sequencing is the most widespread method to explore transcriptional changes during diverse biological processes in various species [4,5,6]. However, transcriptome data are not always reliable, and qRT-PCR analysis is the most used approach to validate transcriptome data [6,7,8]. It is highly sensitive, specific, accurate, and reproducible [9,10,11]. Nevertheless, its accuracy is influenced by diverse factors, including the quality of RNA, initial sample capacity, primer specificity, reverse transcription efficiency, and amplification efficiency [11,12]. It is necessary to utilize one or more stable reference genes as the calibration standard to normalize the relative expression levels of target genes [2,13]. In plant science, reliable reference genes are commonly chosen from the stably expressed housekeeping genes, including polyubiquitin (UBQ), actin (ACT), glyceraldehyde 3-phosphate dehydrogenase (GAPDH), 18S ribosomal RNA (18S), elongation factor (EF), Tubulin (TUB), and so on [2,3,10,14,15]. These genes are associated with fundamental cellular functions and processes, maintenance of cell structure and properties, and primary metabolism [12]. A reliable reference gene should exhibit stable expression in all plant organs at different physiological and developmental stages and under various experimental conditions [10,16]. However, some studies have shown that reference genes’ expression levels are not always stable under changing growth conditions in many species [15,17,18,19,20]. Thus, an improper selection of reference genes may lead to erroneous results and conclusions by qRT-PCR analysis [21,22,23]. Accordingly, it is essential to identify suitable and stable reference genes for specific experimental conditions and in each species [10].
Lily (Lilium spp.) is an important ornamental plant that contributes considerably to the global cut flower market economy. Yunnan, China, is one of the main producers of lily cut flowers in the world. With the expansion of lily planting areas, lily diseases have become more serious in recent years. Fusarium wilt disease (also labeled as basal rot, stem rot, or root rot) is one of the most limiting threats to bulbs and flower production in lilies, specifically under special growing conditions in greenhouses [24,25,26]. The soilborne fungus Fusarium oxysporum f. sp. Lilii is the main pathogen that causes lily Fusarium wilt. It can survive for a long time as mycelium, chlamydospore, or sclerotium with diseased residue in the soil or as mycelium in the lily bulbs [27]. F. oxysporum is difficult to control effectively. Therefore, the most effective and safe approach for controlling this disease is to understand resistance-related molecular mechanisms and identify and exploit key genome resources in breeding novel F. oxysporum-resistant lily varieties. A few lily breed cultivars (Asiatic hybrids, LA hybrids) and some wild species (L. sargentiae Wilson, L. regale Wilson, and L. pumilum DC) have shown resistance to F. oxysporum [24,27,28,29,30].
L. sargentiae is endemic to China and is naturally distributed in the southwest regions [31]. Due to its resistance to F. oxysporum and ornamental characters, it represents one of the important parents used in lily cross-breeding [32,33]. However, the regulation of the resistance to F. oxysporum in L. sargentiae is largely unknown. In a recent study (unpublished data), we applied high-throughput transcriptome sequencing technology and identified potential candidate genes for F. oxysporum resistance in L. sargentiae. To enable in-depth studies of these genes, reliable reference genes for qRT-PCR normalization are required. Herein, we selected nine candidate reference genes based on the RNA-seq data and evaluated their expression stability at different time points following F. oxysporum inoculation in L. sargentiae. Three available statistical programs, i.e., GeNorm, BestKeeper, and NormFinder, were used, and their respective results were fitted to unveil the most suitable reference gene for qRT-PCR normalization in L. sargentiae during infection with F. oxysporum. Our findings will facilitate the molecular dissection of Fusarium wilt disease resistance in L. sargentiae.

2. Materials and Methods

2.1. Plant and Fungal Materials

A total of 20 lily bulbs of wild L. sargentiae Wilson plants were collected from a locality of Weixi county (altitude, 1906 m; 27°20′ N, 99°39′ E) of Yunnan province, China, and were grown in a greenhouse of Flower Research Institute, Yunnan Academy of Agricultural Sciences. F. oxysporum f. sp. Lilii was isolated from the infected oriental hybrid lily plants with standard Fusarium wilt symptoms. The pathogen was isolated and purified by conventional tissue separation and agar plate dilution and then was identified according to the morphology of spore and mycelium and molecular fingerprints [34]. The molecular fingerprint is a ribosomal DNA ITS (internal transcribed spacer) sequence (GenBank accession no. GU371875) from F. oxysporum strain (No. Fol-2) [34]. The detailed procedures for identifying pathogen by molecular fingerprint were described in reference [34]. The highly aggressive F. oxysporum strain (No. Fol-2) was preserved and offered by the Yunnan Flower Breeding Key Laboratory.

2.2. Cultivation and Inoculation

The tissue culture seedlings of wild L. sargentiae Wilson were used in this study. The tissue culture seedlings were cultivated under controlled conditions (growth chamber: temperature, 25 °C; humidity, 30%–40%; photoperiod, 14 h light/10 h dark). The tissue culture seedlings with a bulb diameter from 1 to 1.5 cm and strong root tissue were screened out and separated into two groups (treatment and control) for inoculation [30]. Each group comprised three bottles with ten plants in each bottle. The F. oxysporum isolates were cultivated in potato sucrose liquid medium (potato, 20 g · L−1; sucrose, 20 g · L−1; RO water, 1 L) on a shaker (100 rpm/min) for 15 days. Next, the spore suspension of F. oxysporum was subsequently filtrated through a wire gauze of 200 mesh and diluted to a final concentration of approximately 1.0 × 10⁶ spores/mL by microscopic count using the Bürker-Türk hemocytometer [26,28,30].
To induce the Fusarium wilt disease, the root tips of seedlings (treatment group) were cut off to create a wound and then inoculated with the spore suspension using the root dip inoculation method. In parallel, a mock inoculation was performed in seedlings within the control group with sterile distilled water [30]. The tissue culture seedlings were collected at 0, 6, 12, 24, 48, and 72 h after inoculation with F. oxysporum (treatment) and sterile water (control), respectively. Ten inoculated tissue culture seedlings with the same conditions (same time and same treatment) and same growth potential were sampled and mixed equally to constitute one experimental sample. All samples were immediately frozen directly in liquid nitrogen and kept in a freezer at −80 °C until use.

2.3. Selection of Candidate Reference Genes

We have performed high-throughput comparative transcriptome of L. sargentiae tissue culture seedlings at 24 h post-inoculation with F. oxysporum and sterile water, respectively (data unpublished). By examining the expression levels of genes, nine reference genes, including cyclophilin (CYP), elongation factor 1-α (EF1-α), glyceraldehyde-3-phosphate dehydrogenase (GAPDH), tubulin (TUB), ubiquitin (UBQ), aquaporin (AQP), histone (HIS), phosphoglycerate kinase (PGK), and 60S ribosomal protein L13-1(RPL13), were chosen as potential candidate reference genes. These genes exhibited relatively (similar or indistinguishable) stable expression levels in all six samples based on (fragments per kb per million reads) FPKM values (Table S1). Meanwhile, based on the RNA-Seq result, four potential Fusarium wilt resistance candidate genes that showed differential expression patterns were also selected to verify the efficiency of candidate reference genes for qRT-PCR validation (Table S1). They included genes for peroxidase (POD), phenylalanine ammonia-lyase (PAL), chitinase (CHI), and dirigent-like protein (DIR). Specific primers of each gene were designed in Primer Premier 5.0 software and are listed in Table 1.

2.4. RNA Extraction and cDNA Synthesis

The mirVanaTM RNA Isolation Kit (Invitrogen, Carlsbad, CA, USA) was used for total RNA extraction from each sample, following the instructions by the manufacturer. The NanoDrop 2000 spectrophotometer (Thermo Scientific, Waltham, MA, USA) was used to evaluate the yield and quality of RNA. Finally, the RNA integrity was assessed via electrophoresis with 1% agarose gel.
cDNAs synthesis was carried out in a GeneAmp® PCR System 9700 (Applied Biosystems, Foster City, CA, USA). The RT (reverse transcription) reaction consisted of 0.5 μg RNA, 2 μL of 5 × TransScript All-in-one SuperMix (TransGen Biotech, Beijing, China), 0.5 μL of gDNA Remover, and a total volume of 10 μL with ddH2O. The RT reaction conditions were 15 min at 42 °C and 5 s at 85 °C. Each RT product was diluted ten times with nuclease-free water and then stored at −20 °C.

2.5. qRT-PCR Analysis

The qRT-PCR was carried out on LightCycler®480 ⅡReal-time (Roche, Basel, Switzerland). The PCR reaction was composed of 1 μL cDNA, 5 μL 2 × PerfectStartTM Green qPCR Super Mix (TransGen Biotech, Beijing, China), 0.2 μL each primer (10 pmol/L), and 3.6 μL of nuclease-free water. The conditions were as follows: 94 °C for 30 s, 45 cycles of 94 °C for 5 s, and 60 °C for 30 s. At the end of the PCR cycles, we conducted melting curve analysis to evaluate the quality of each PCR product. Each gene was analyzed in three technical and biological replicates. The Ct (cycle threshold) values of each gene were computed automatically [23].

2.6. Expression Stability Analysis and Validation of Reference Genes

Based on standard curves obtained in PCR runs, we considered the Ct values as relative quantities and used them directly in performing gene expression stability analysis [35]. The expression stability of the candidate reference genes were assessed utilizing NormFinder [6,35], geNorm [1], and BestKeeper [36]. The results obtained from the three programs were fitted to generate a comprehensive stability ranking of each candidate reference gene via the GM (geometric mean) method [37]. Microsoft Excel 2016 and Data Processing System were used for data analysis and statistics [37,38].
To confirm the most reliable reference gene, the four selected resistance-related genes (POD, PAL, CHI, and DIR) were also analyzed by qRT-PCR. The PCR reaction systems and conditions were the same as those above. The most stable candidate reference gene served as the internal control for target genes’ expression normalization. In theory, the gene expression level was the lowest at the 0 h time point with sterile water treatment (0 h W). So, 0 hW was used as the control, and other time points were compared with 0 h W. The relative expression levels of four target genes were normalized according to the 2−∆∆Ct method [39]. One-way ANOVA with Tukey’s HSD post-hoc test was used to compare the means of multiple samples at the 5% significance level [37].

3. Results

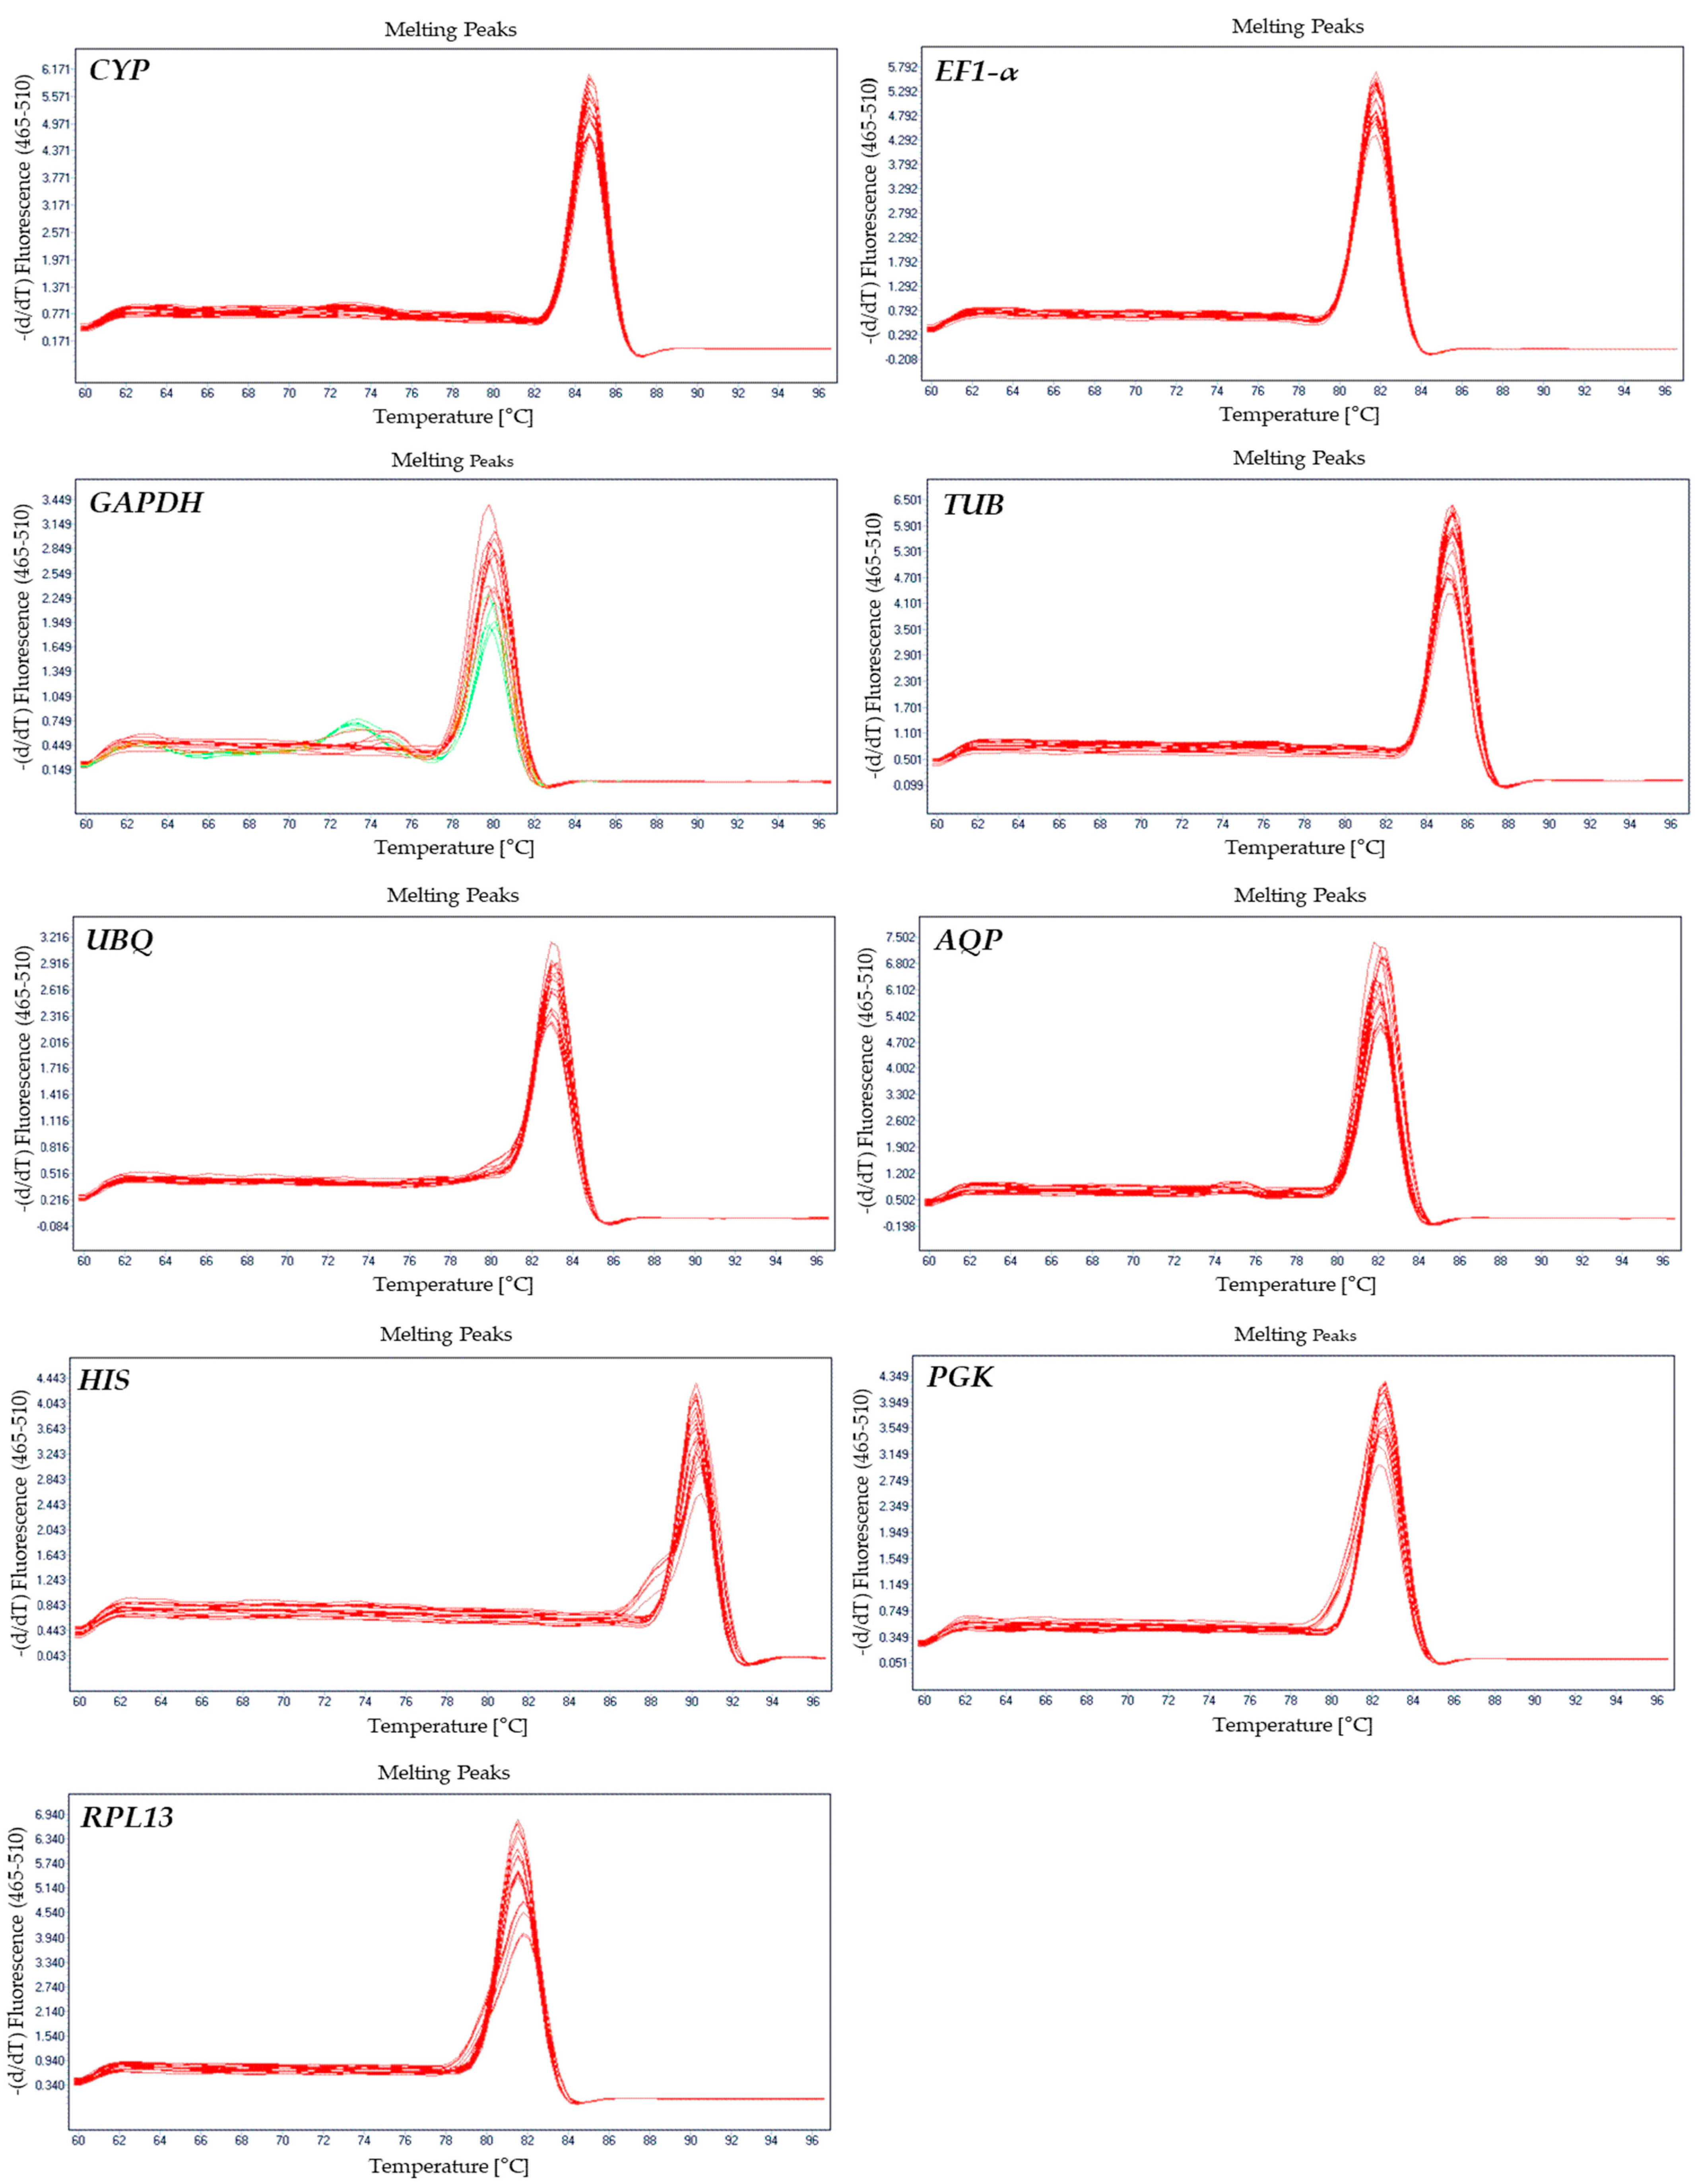
3.1. Verification of Primer Specificity and PCR Amplicons

To identify suitable reference genes for qRT-PCR validation analysis of potential disease-resistant candidate genes in L. sargentiae, nine candidate reference genes were selected from RNA-seq data of L. sargentiae for qRT-PCR analysis. The qRT-PCR melting curves of most candidate reference genes showed a single peak in all samples (the red color curves), indicating that the primers were highly specific (Figure 1), and the gene amplification curves for each sample had excellent repeatability, showing that the qRT-PCR results were accurate and reliable. However, in some samples (the green color curves), GAPDH showed a non-specific peak, indicating that its primer specificity was not high.

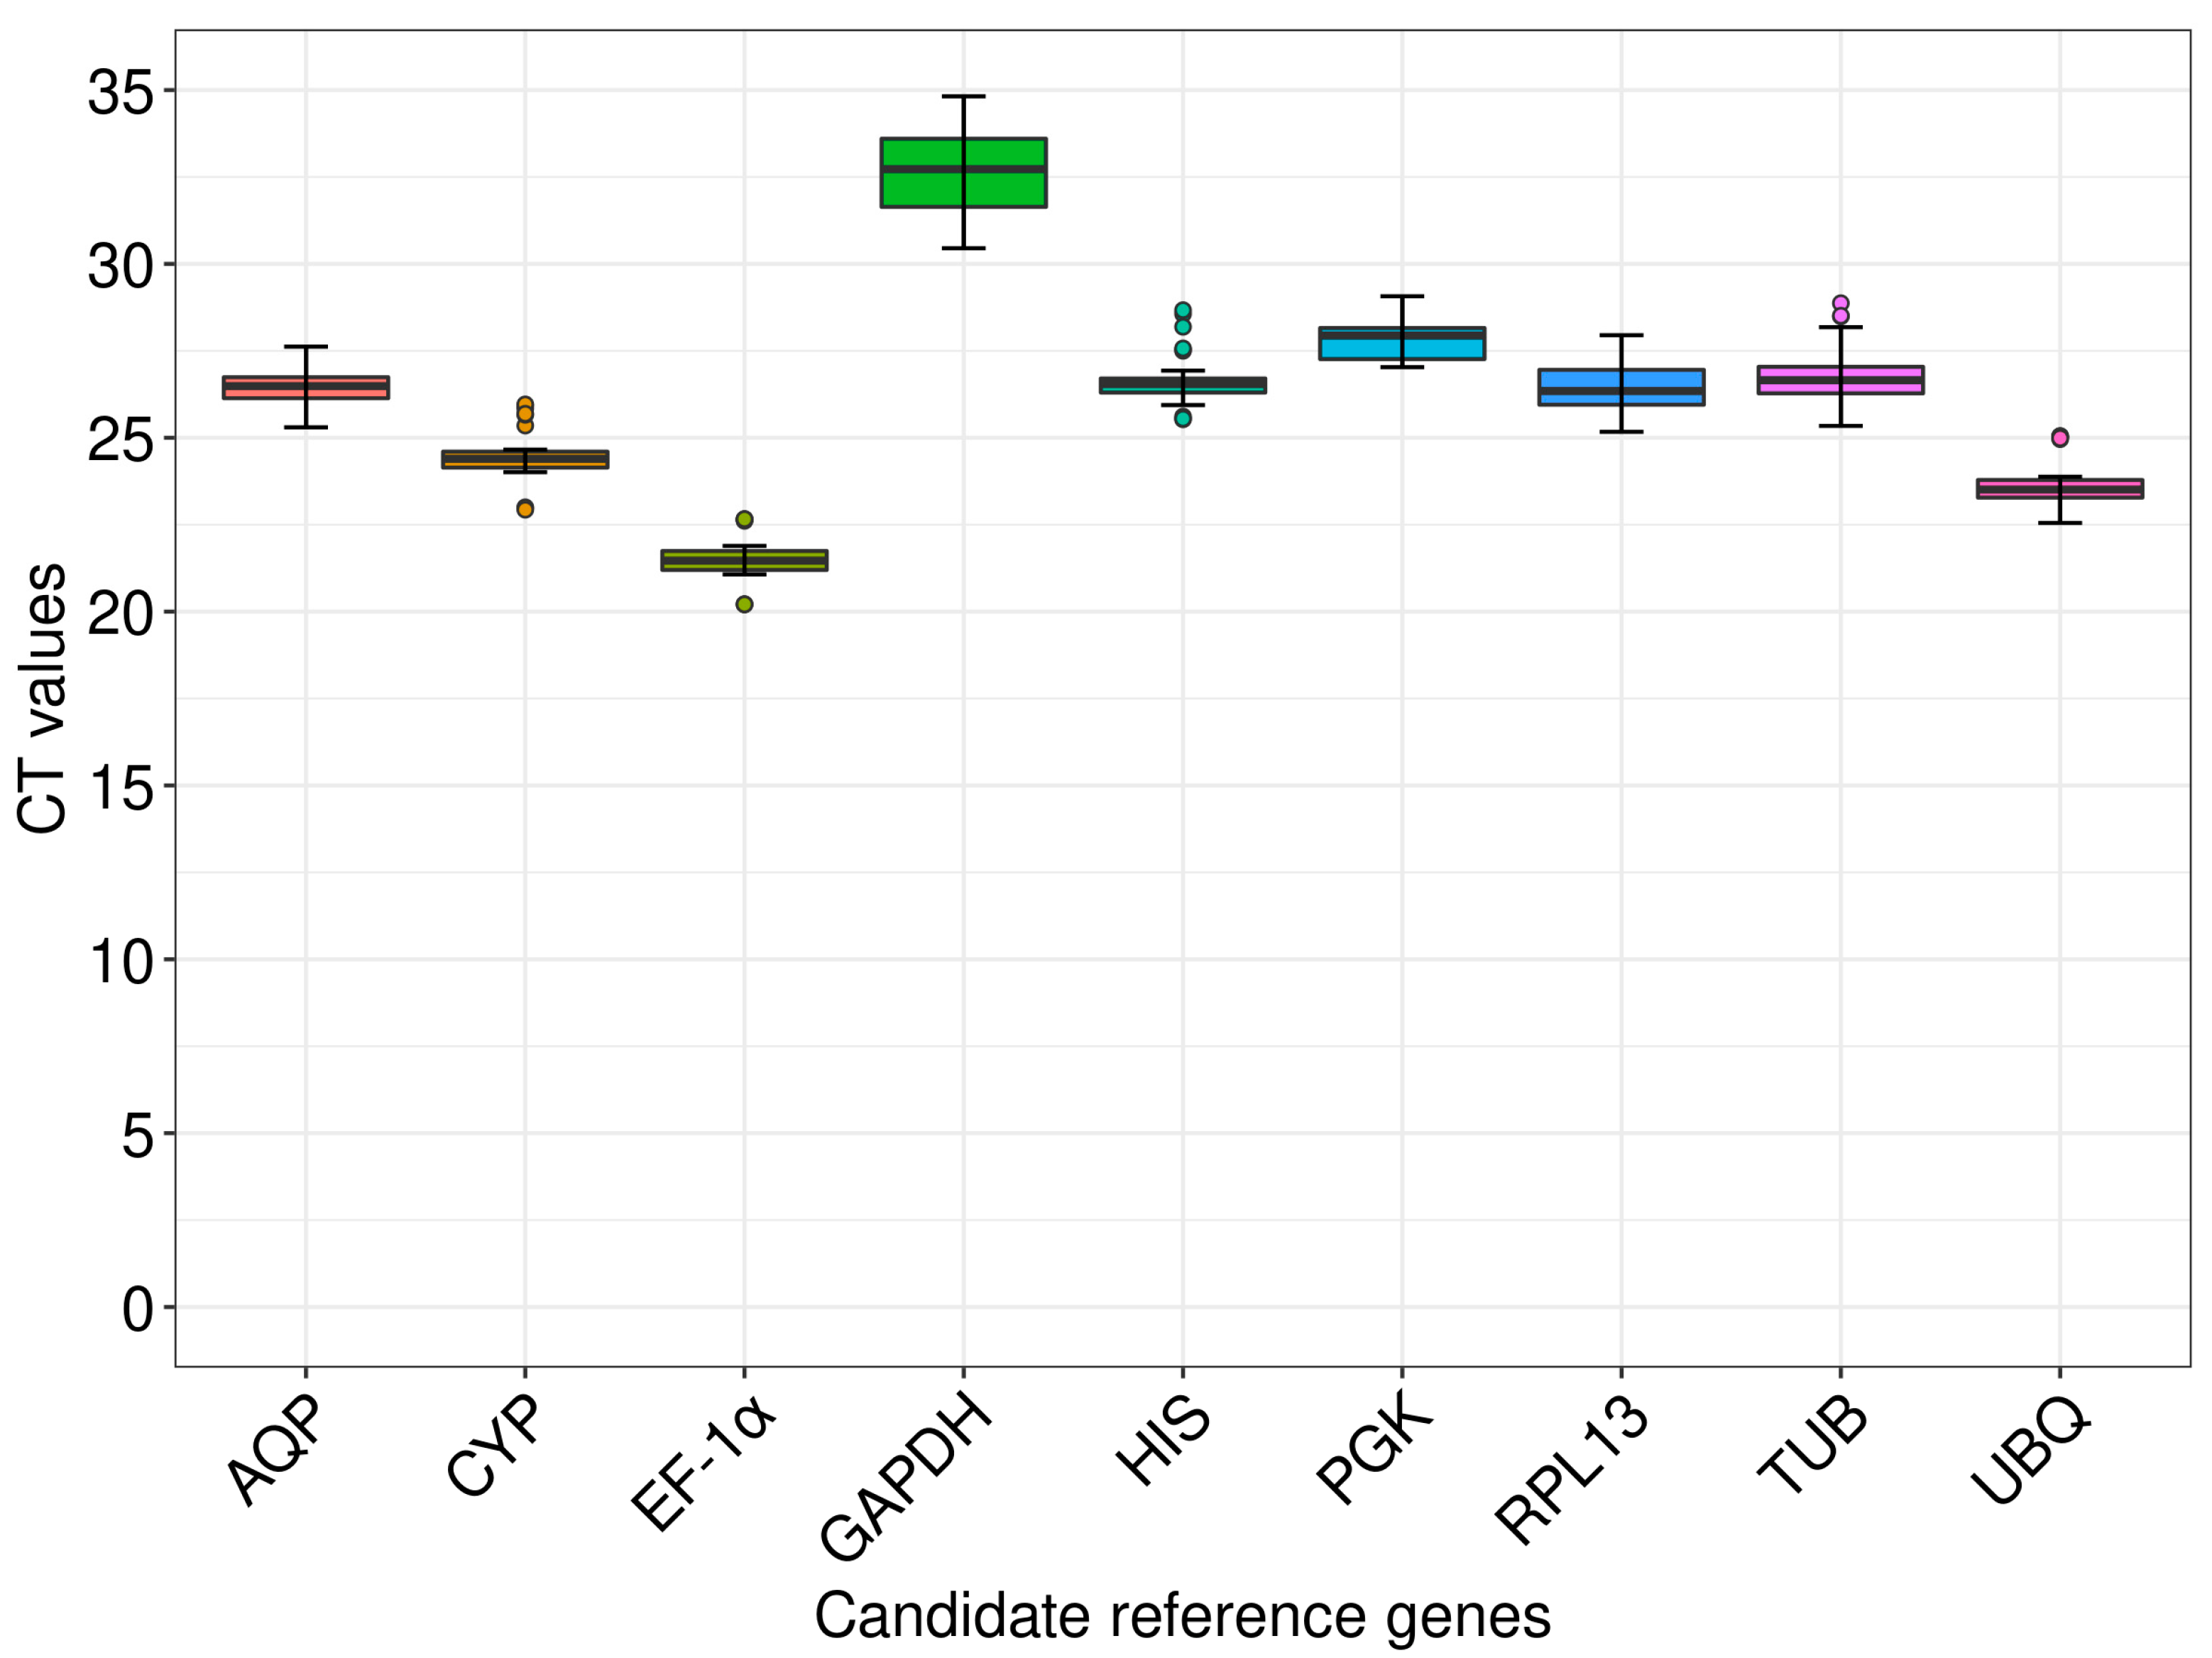
3.2. Expression Profile Analysis of the Candidate Reference Genes

To explore the expression levels of the nine potential reference genes, we computed their respective Ct values from the qRT-PCR (Figure 2). The Ct values of the nine genes varied from 20.21 to 34.82. The gene with the highest transcripts was EF-1α (average Ct value 21.53), followed by UBQ, CYP, AQP, RPL13, HIS, TUB, PGK, and GAPDH. GAPDH exhibited the lowest relative expression levels (average Ct value 32.61) with the greatest variation, ranging from 30.45 to 34.82. AQP and PGK showed the least variation in gene expression levels, with Ct values varying from 25.30 to 27.62 and 27.03 to 29.07, respectively.

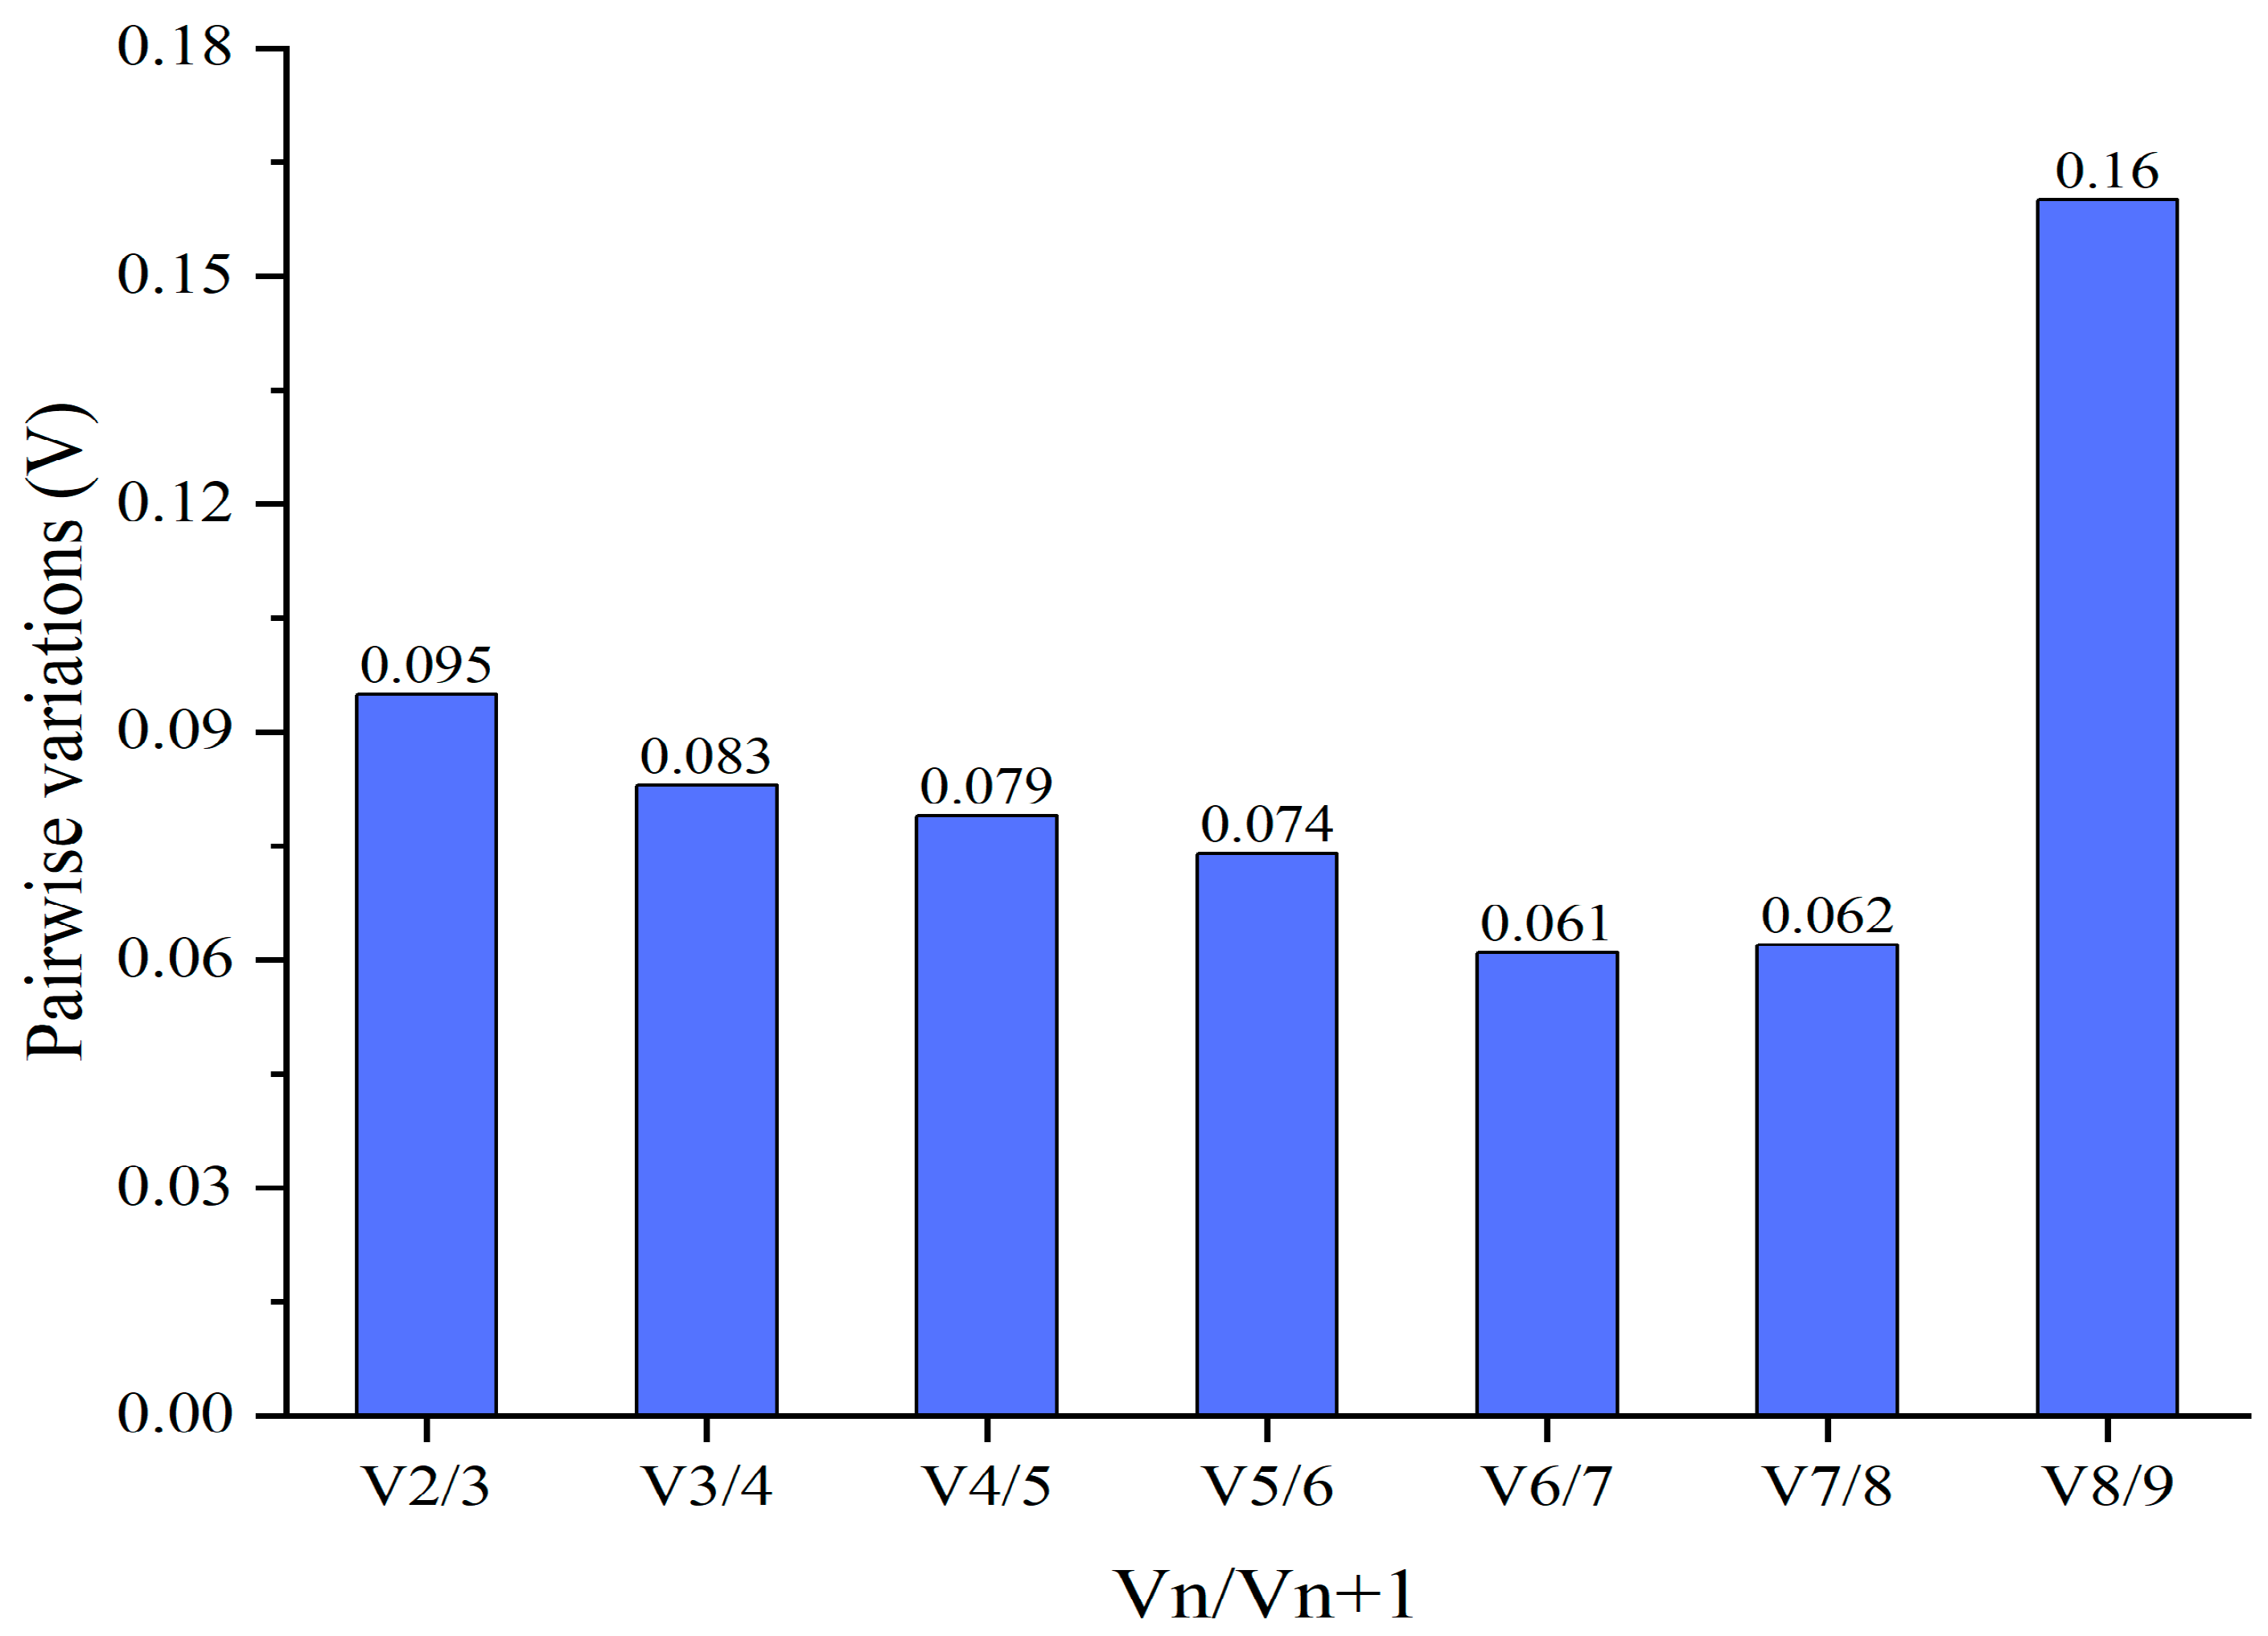
3.3. Expression Stability Analysis of the Candidate Reference Genes

Three programs (GeNorm, BestKeeper, and NormFinde) were used to determine the rankings of the nine potential reference genes separately. Thereafter, the GM method was applied to compute the comprehensive stability ranking.
By computing the gene expression stability measure (M) based on the average pairwise expression ratio, GeNorm was used to determine the most stable reference gene. The gene with the lowest M value is considered the most stable. A gene can be considered a reference gene if its M value is less than 1.5; lower M value indicates a more stable expression of the gene [3]. Eight of these reference genes had M values lower than 1.0, with the exception of GAPDH, which recorded an M value of 1.466. HIS and EF-1α were certified as the two most stable reference genes, with M values of 0.533 and 0.535, respectively (Table 2). In some gene expression analyses, a single reference gene may not be able to satisfy the experiment requirements if the precision requirements are high or the quantity change of gene expression has to be expressed quantitatively. It is therefore necessary to use two or more reference genes in order to obtain accurate and reliable normalization results. It is possible to determine the optimal number of reference genes for normalization based on the pairwise variation value (Vn/n + 1, V value). When Vn/n +1 is greater than or equal to 0.15, the optimal number of reference genes for accurate normalization should be n + 1. On the contrary, if Vn/n + 1 is less than 0.15, n is the optimal number of reference genes [3,5]. GeNorm V value analysis showed that when the V value of the two to eight reference genes (V2/3 to V7/8) was less than 0.15 (Figure 3), the optimal number of reference genes is two. Based on the V values, the most appropriate combination of reference genes for qRT-PCR normalization of resistance-related genes’ expression levels in L. sargentiae was HIS and EF-1α.
Unlike GeNorm analysis, the NormFinder is commonly used to evaluate the stability value (SV) of reference genes and to detect, via intra- and inter-group variations, the optimal number of reference genes for precise normalization. A gene is considered more stable if its expression level is lower than the average expression stability. The results of NormFinder analyses were the same as the GeNorm results in stability rankings of five reference genes including HIS, CYP, TUB, RPL13, and GAPDH (Table 2). Similarly, HIS (SV = 0.086) and GAPDH (SV = 0.994) were confirmed as the most stable and unstable genes, respectively.
BestKeeper is another tool to explore the stability index of potential reference genes through the evaluation of SD (standard deviation), CV (coefficient of variation), and R (correlation coefficient) [36]. If SD < 1.0, the gene is considered stable [1,4]. According to the BestKeeper results, all nine genes are suitable for use as reference genes (SD < 1.0). CYP (SV = 0.126) and GAPDH (SV = 0.217) ranked first and last in terms of stability, respectively (Table 2). All three programs showed that GAPDH was the most unstable gene.
In order to determine the comprehensive stability ranking of the nine candidate reference genes, we integrated the results from the three programs based on GM value of ranking. GM value indicated that HIS was the most suitable reference gene, followed by CYP, PGK, UBQ, AQP, EF-1α, TUB, RPL13, and GAPDH (Table 3).

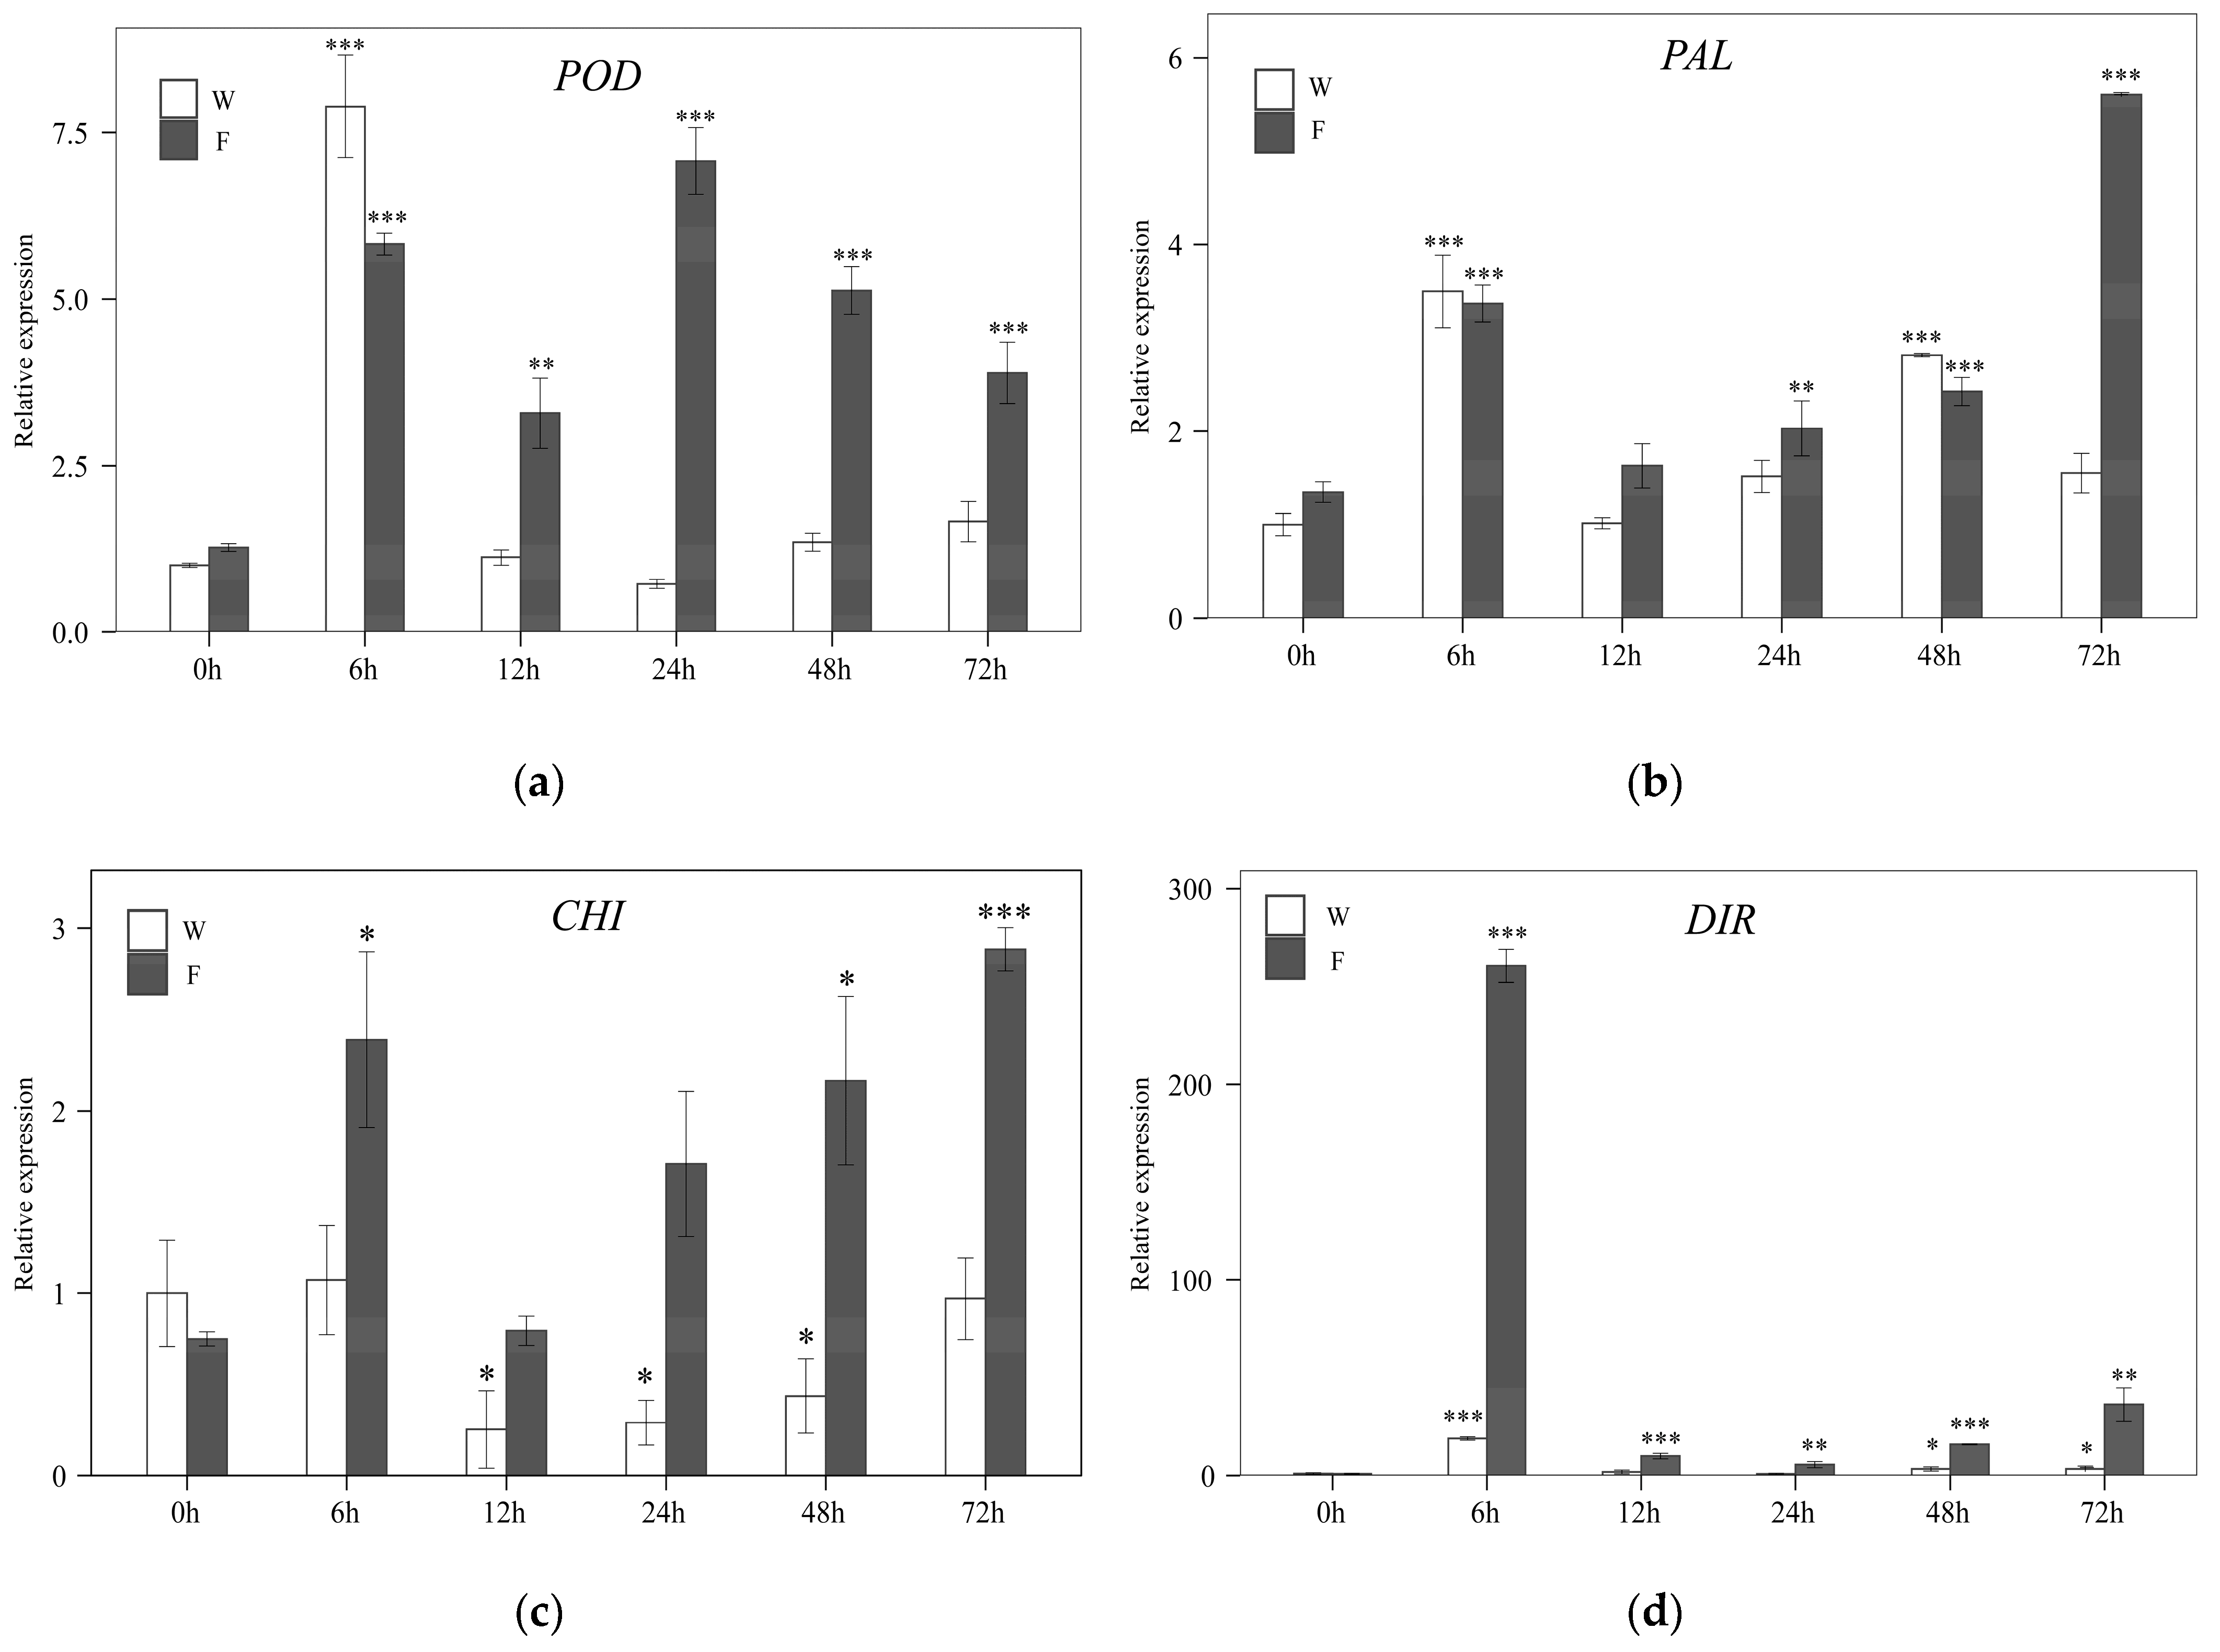
3.4. Expression Stability Validation of the Most Reliable Reference Gene

To verify the stability and reliability of HIS (the most stable reference gene) for accurate normalization of the expression levels of Fusarium wilt-related genes, we evaluated the expression of four potential resistance-related genes, including POD, PAL, CHI, and DIR, using qRT-PCR. As presented in Figure 4, the results showed that the expression patterns of the four target genes were the same during the first three time periods (0 h, 6 h, and 12 h) after inoculating; all genes showed the lowest expression at the 0 h time-point and began to significantly up-regulate in 6 h and then down-regulated again in 12 h. In the next three time periods (24 h, 48 h, and 72 h), they again showed a certain upregulation. The time period of their highest expression was not exactly the same. However, the general expression levels of the four target genes were stronger in most samples inoculated with F. oxysporum than that in control samples (Figure 4).

4. Discussion

Fusarium wilt disease is one of the biggest threats endangering lilies. It can cause huge economic losses through its adverse impacts on lily yield and quality [24,25,26]. Currently, chemical control is the primary method to control or prevent this disease. However, chemical pesticides have shown diminishing effects due to the soil-borne nature of F. oxysporum and the development of pathogenic resistance [27]. Moreover, chemicals are expensive and harm the environment [24]. Therefore, breeding novel resistant varieties is the most effective approach for managing Fusarium wilt diseases in lilies [28,40]. Some Chinese endemic wild lily species, including L. sargentiae Wilson, L. regale Wilson, and L. pumilum DC, have shown higher resistance to F. oxysporum and have been integrated into disease resistance breeding programs [30,33]. With the rapid developments of genomics-assisted breeding, it is essential to integrate quantitative genetics and functional genomics to decipher the regulation network of Fusarium wilt resistance in lilies. These studies require qRT-PCR analysis for precise and efficient quantification of expression levels of target genes. Accordingly, the present study identified reliable reference genes for precise qRT-PCR normalization of candidate Fusarium wilt-related resistant genes’ expressions to facilitate further molecular studies in L. sargentiae. Diverse molecular studies have been conducted in L. regale Wilson [25,28,29,41,42,43] and L. pumilum DC [30], but rarely in L. sargentiae Wilson.
Transcriptome sequencing technology was applied to uncover the resistance-related genes of F. oxysporum and gain insight into the molecular mechanisms that govern disease resistance in L. sargentiae. Based on the transcriptome data, we selected nine candidate reference genes for qRT-PCR normalization of F. oxysporum-resistant candidate genes’ expressions. The expression stabilities of these genes were assessed via three public programs (GeNorm, BestKeeper, and NormFinder). To our knowledge, this study represents the first comprehensive identification of reliable reference genes for molecular dissection of F. oxysporum-resistance mechanisms in L. sargentiae. Previous related studies were focused on internal reference genes for other phenotypic traits of lily and other close species. For example, the genes TIP41 and ACT were identified as the best combination of reference genes for analyzing candidate genes associated with shading in the lily cultivar ‘Tiny Padhye’ [2]. EF-1α and 18S rRNA were unveiled as the most suitable reference genes for investigating the expression levels of abiotic stresses related candidate genes, including heat, cold, heavy metals, and drought, in L. brownii var. Viridulum [44]. In L. davidii var. Unicolor, FP, ACT, GAPDH, and AP4 were detected as reference genes for studying abiotic stress and developmental process-related genes [45]. These results indicate that reference genes are specific to experimental conditions, and for the same trait, they may differ according to the species and studied organs.
In L. regale Wilson, GAPDH is the commonly used reference gene to normalize Fusarium wilt-related candidate genes’ expression levels at different time points of post-F. oxysporum inoculation [28,29,41,42,43]. Nevertheless, in this study, we found that HIS was the most reliable reference gene for similar studies in L. sargentiae. Instead, GAPDH was found to be the least stable reference gene among all nine tested reference genes (Table 3). Consistently, in L. pumilum DC, 18S is the suitable reference gene, instead of GAPDH for resistance to F. oxysporum-related studies [30]. These results show that GAPDH is unsuitable for accurate qRT-PCR normalizing the expression levels of F.oxysporum-resistant genes in L. sargentiae and L. pumilum.
To confirm the suitability of the identified most reliable reference gene (HIS), it was used to normalize the expression levels of four resistance-related genes at different times in two treatments in L. sargentiae. The selected target genes, including POD, PAL, CHI, and DIR, are well-known to be involved in defense mechanisms against various pathogens in plants. POD, PAL, and CHI were significantly up-regulated in L. regale under F. oxysporum treatment [25,29,43,46]. DIR may play an important role in responses to different pathogenetic fungi in many plants. In Pisum sativum, the expression of DIR was significantly induced after inoculating with F. solani f. sp. Phaseoli [47]; Erysiphe necator in Vitis vinifera [48]; Colletotrichum gloeosporioides in Physcomitrella patens [49]; and Marssonina brunnea in Populus [50]. In the present study, the four resistance-related genes expression patterns via HIS normalization were consistent with the above results. This result further demonstrated that HIS should represent the reference genes for qRT-PCR normalization of the expression levels of target genes related to F. oxysporum resistance in L. sargentiae. Functional characterization of POD, PAL, CHI, and DIR is needed to uncover the regulatory mechanisms associated with their respective expressions in responses to F. oxysporum in L. sargentiae and close species.

5. Conclusions

Overall, a total of nine candidate reference genes were selected from the RNA-seq data of L. sargentiae based on their FPKM values in this study. The expression stability of all reference genes was validated under F. oxysporum inoculation by three different statistical algorithms (geNorm, NormFinder, and BestKeeper). Among them, HIS exhibited the highest level of stability. The expression patterns of four F. oxysporum-resistant genes normalized by HIS were consistent with their responses to pathogenetic fungi in other plants. It indicates that HIS can be used as a suitable reference gene for the standardized qRT-PCR analysis of F. oxysporum-resistant genes in Lilium. Our findings will help provide comprehensive guidelines for identifying suitable reference genes in other lily species and also contribute to further explorations of the molecular mechanisms in Lilium in resisting F. oxysporum.

Supplementary Materials

The following supporting information can be downloaded at: https://0-www-mdpi-com.brum.beds.ac.uk/article/10.3390/app13063395/s1, Table S1: Candidate reference genes and target genes in RNA-seq libraries of L. sargentiae induced by F. oxysporum and sterile water, respectively.

Author Contributions

Conceptualization, J.W. and Y.Z.; methodology, L.M., Q.D. and G.C.; formal analysis, L.M., Y.Z. and W.J; software, X.L. and W.D.; validation, L.M. and G.C.; investigation, W.J., Q.D., X.L. and W.D.; resources, Q.D., G.C. and X.W.; writing—original draft preparation, L.M. and X.L.; writing—review and editing, G.C., X.L. and W.D.; supervision, J.W. and Y.Z. All authors have read and agreed to the published version of the manuscript.

Funding

This research was funded by the National Key Research and Development Program of China (Grant No. 2019YFD1000400, 2020YFD10004), the Green Food Brand-Build a Special Project (Floriculture) supported by Yunnan Provincial Finance Department (530000210000000013742), the Joint Lab of Yunnan Seed Industry (202205AR070001-10) and Open Fund of National Engineering Research Center for Ornamental Horticulture, and Yunnan Key Laboratory of Flower Breeding (FKL-202103).

Institutional Review Board Statement

Not applicable.

Informed Consent Statement

Not applicable.

Data Availability Statement

Not applicable.

Conflicts of Interest

The authors declare no conflict of interest.

References

  1. Vandesompele, J.; Preter, K.D.; Pattyn, F.; Poppe, B.; Roy, N.V.; Paepe, A.D.; Speleman, F. Accurate normalization of real-time quantitative RT-PCR data by geometric averaging of multiple internal control genes. Genome Biol. 2002, 3, research0034.1–0034.11. [Google Scholar] [CrossRef] [PubMed] [Green Version]
  2. Xu, L.; Xu, H.; Cao, Y.; Yang, P.; Feng, Y.; Tang, Y.; Yuan, S.; Ming, J. Validation of Reference Genes for Quantitative Real-Time PCR during Bicolor Tepal Development in Asiatic Hybrid Lilies (Lilium spp.). Front. Plant Sci. 2017, 8, 669. [Google Scholar] [CrossRef] [PubMed] [Green Version]
  3. Chen, C.; Wu, J.; Hua, Q.; Tel-Zur, N.; Xie, F.; Zhang, Z.; Chen, J.; Zhang, R.; Hu, G.; Zhao, J.; et al. Identification of reliable reference genes for quantitative real-time PCR normalization in pitaya. Plant Methods 2019, 15, 70. [Google Scholar] [CrossRef] [PubMed] [Green Version]
  4. Hyun, T.K.; Rim, Y.; Jang, H.-J.; Kim, C.H.; Park, J.; Kumar, R.; Lee, S.; Kim, B.C.; Bhak, J.; Nguyen-Quoc, B.; et al. De novo transcriptome sequencing of Momordica cochinchinensis to identify genes involved in the carotenoid biosynthesis. Plant Mol. Biol. 2012, 79, 413–427. [Google Scholar] [CrossRef]
  5. Chen, L.; Li, L.; Dai, Y.; Wang, X.; Duan, Y.; Yang, G. De novo transcriptome analysis of Osmanthus serrulatus Rehd. flowers and leaves by Illumina sequencing. Biochem. Syst. Ecol. 2015, 61, 531–540. [Google Scholar] [CrossRef]
  6. Cao, A.; Shao, D.; Cui, B.; Tong, X.; Zheng, Y.; Sun, J.; Li, H. Screening the Reference Genes for Quantitative Gene Expression by RT-qPCR During SE Initial Dedifferentiation in Four Gossypium hirsutum Cultivars that Have Different SE Capability. Genes 2019, 10, 497. [Google Scholar] [CrossRef] [Green Version]
  7. Yan, F.; Zhu, Y.; Zhao, Y.; Wang, Y.; Li, J.; Wang, Q.; Liu, Y. De novo transcriptome sequencing and analysis of salt-, alkali-, and drought-responsive genes in Sophora alopecuroides. BMC Genom. 2020, 21, 423. [Google Scholar] [CrossRef]
  8. Wu, Y.; Zhou, J.; Liu, Y.; Gu, Y.; Zhang, H.; Ahmad, F.; Wang, G.; Ren, L. Selection and Validation of Reliable Reference Genes for qRT-PCR Normalization of Bursaphelenchus xylophilus from Different Temperature Conditions and Developmental Stages. Appl. Sci. 2022, 12, 2880. [Google Scholar] [CrossRef]
  9. Huggett, J.; Dheda, K.; Bustin, S.; Zumla, A. Real-time RT-PCR normalisation; strategies and considerations. Genes Immun. 2005, 6, 279–284. [Google Scholar] [CrossRef] [Green Version]
  10. Liu, Q.; Qi, X.; Yan, H.; Huang, L.; Nie, G.; Zhang, X. Reference Gene Selection for Quantitative Real-Time Reverse-Transcriptase PCR in Annual Ryegrass (Lolium multiflorum) Subjected to Various Abiotic Stresses. Molecules 2018, 23, 172. [Google Scholar] [CrossRef]
  11. Kou, X.; Zhang, L.; Yang, S.; Li, G.; Ye, J. Selection and validation of reference genes for quantitative RT-PCR analysis in peach fruit under different experimental conditions. Sci. Hortic. 2017, 225, 195–203. [Google Scholar] [CrossRef]
  12. Nolan, T.; Hands, R.E.; Bustin, S.A. Quantification of mRNA using real-time RT-PCR. Nat. Protoc. 2006, 1, 1559–1582. [Google Scholar] [CrossRef]
  13. Quackenbush, J. Microarray data normalization and transformation. Nat. Genet. 2002, 32, 496–501. [Google Scholar] [CrossRef]
  14. Zhang, J.; Zhu, C.-S.; Huo, Y.-B.; Zhang, B.; Ma, Z.-Q.; Feng, J.-T.; Zhang, X. Validation of suitable reference genes for quantitative gene expression analysis in Tripterygium wilfordii. Mol. Biol. Rep. 2019, 46, 4161–4174. [Google Scholar] [CrossRef]
  15. Liang, L.; He, Z.; Yu, H.; Wang, E.; Zhang, X.; Zhang, B.; Zhang, C.; Liang, Z. Selection and Validation of Reference Genes for Gene Expression Studies in Codonopsis pilosula Based on Transcriptome Sequence Data. Sci. Rep. 2020, 10, 1362. [Google Scholar] [CrossRef] [Green Version]
  16. Wan, H.; Zhao, Z.; Qian, C.; Sui, Y.; Malik, A.A.; Chen, J. Selection of appropriate reference genes for gene expression studies by quantitative real-time polymerase chain reaction in cucumber. Anal. Biochem. 2010, 399, 257–261. [Google Scholar] [CrossRef]
  17. Volkov, R.A.; Panchuk, I.I.; Schöffl, F. Heat-stress-dependency and developmental modulation of gene expression: The potential of house-keeping genes as internal standards in mRNA expression profiling using real-time RT-PCR. J. Exp. Bot. 2003, 54, 2343–2349. [Google Scholar] [CrossRef] [Green Version]
  18. Hong, S.-Y.; Seo, P.J.; Yang, M.-S.; Xiang, F.; Park, C.-M. Exploring valid reference genes for gene expression studies in Brachypodium distachyon by real-time PCR. BMC Plant Biol. 2008, 8, 112. [Google Scholar] [CrossRef] [Green Version]
  19. Yi, S.; Qian, Y.; Han, L.; Sun, Z.; Fan, C.; Liu, J.; Ju, G. Selection of reliable reference genes for gene expression studies in Rhododendron micranthum Turcz. Sci. Hortic. 2012, 138, 128–133. [Google Scholar] [CrossRef]
  20. Li, J.; Huang, H.; Shan, T.; Pang, S. Selection of reference genes for real-time RT-PCR normalization in brown alga Undaria pinnatifida. J. Appl. Phycol. 2019, 31, 787–793. [Google Scholar] [CrossRef]
  21. Dheda, K.; Huggett, J.F.; Chang, J.S.; Kim, L.U.; Bustin, S.A.; Johnson, M.A.; Rook, G.A.W.; Zumla, A. The implications of using an inappropriate reference gene for real-time reverse transcription PCR data normalization. Anal. Biochem. 2005, 344, 141–143. [Google Scholar] [CrossRef] [PubMed]
  22. Yan, J.; Yuan, F.; Long, G.; Qin, L.; Deng, Z. Selection of reference genes for quantitative real-time RT-PCR analysis in citrus. Mol. Biol. Rep. 2012, 39, 1831–1838. [Google Scholar] [CrossRef] [PubMed]
  23. Kim, S.J.; Na, J.U.; Kim, J.S.; Lee, J.E.; Nie, H.; Lee, K.A.; Woo, S.Y.; Kim, S.H. Identification of valid reference genes for quantitative RT-PCR in Caragana microphylla under salt and drought stresses. Physiol. Mol. Biol. Plants 2020, 26, 2103–2108. [Google Scholar] [CrossRef] [PubMed]
  24. Lim, J.H.; Rhee, H.K.; Kim, Y.J.; Lim, K.B.; van Tuyl, J.M. Resistance to Fusarium oxysporum f. sp. lilii in Lilium. Acta Hortic. 2003, 620, 311–318. [Google Scholar] [CrossRef]
  25. Rao, J.; Liu, D.; Zhang, N.; He, H.; Ge, F.; Chen, C. Identification of Genes Differentially Expressed in a Resistant Reaction to Fusarium Oxysporum in Lilium Regale by SSH. IERI Procedia 2013, 5, 95–101. [Google Scholar] [CrossRef] [Green Version]
  26. Zhang, Y.P.; Jiang, S.; Qu, S.P.; Yang, X.M.; Wang, X.N.; Ma, L.L.; Wu, L.L.; He, Y.Q.; Wang, J.H. In Vitro Selection for Fusarium Resistant Oriental Lily Mutants Using Culture Filtrate of the Fungal Agent. Acta Hortic. 2014, 1027, 205–212. [Google Scholar] [CrossRef]
  27. Yang, X.M.; Wang, J.H.; Wang, L.H.; Zhang, Y.P.; Zhang, L.F.; Qu, S.P. Resistance Identification and Genetic Diversity Among Lily Varieties Based on Resistance Gene Analogue. Acta Hortic. Sin. 2012, 39, 2404–2412. [Google Scholar]
  28. He, H.; Liu, D.; Zhang, N.; Zheng, W.; Han, Q.; Ji, B.; Ge, F.; Chen, C. The PR10 gene family is highly expressed in Lilium regale Wilson during Fusarium oxysporum f. sp. lilii infection. Genes Genom 2014, 36, 497–507. [Google Scholar] [CrossRef]
  29. Li, S.; Hai, J.; Wang, Z.; Deng, J.; Liang, T.; Su, L.; Liu, D. Lilium regale Wilson WRKY2 Regulates Chitinase Gene Expression During the Response to the Root Rot Pathogen Fusarium oxysporum. Front. Plant Sci. 2021, 12, 741463. [Google Scholar] [CrossRef]
  30. He, X.; Li, W.; Zhang, W.; Jin, X.; Shenkute, A.G.; Aynalem, T.; Xu, S.; Wang, W. Transcriptome Sequencing Analysis Provides Insights Into the Response to Fusarium oxysporum in Lilium pumilum. Evol. Bioinform. Online 2019, 15, 1–10. [Google Scholar] [CrossRef] [Green Version]
  31. Liu, C.-Q.; Sun, H. Pollination in Lilium sargentiae (Liliaceae) and the first confirmation of long-tongued hawkmoths as a pollinator niche in Asia. J. Syst. Evol. 2019, 57, 81–88. [Google Scholar] [CrossRef] [Green Version]
  32. Van Huylenbroeck, J. Ornamental Crops; Springer International Publishing: Cham, Switzerland, 2018; ISBN 978-3-319-90697-3. [Google Scholar]
  33. Straathof, T.P.; Tuyl, J.M.V. Genetic variation in resistance to Fusarium oxysporum f.sp. lilii in the genus Lilium. Ann. Appl. Biol. 1994, 125, 61–72. [Google Scholar] [CrossRef]
  34. Yang, X.M.; Wang, J.H.; Wang, L.H.; Wu, X.W.; Peng, L.C.; Qu, S.P. Identification and ITS Sequence Analysis of Pathogen of Lily Wilt. Southwest China J. Agric. Sci. 2010, 23, 1914–1916. [Google Scholar] [CrossRef]
  35. Imai, T.; Ubi, B.E.; Saito, T.; Moriguchi, T. Evaluation of reference genes for accurate normalization of gene expression for real time-quantitative PCR in Pyrus pyrifolia using different tissue samples and seasonal conditions. PLoS ONE 2014, 9, e86492. [Google Scholar] [CrossRef]
  36. Pfaffl, M.W.; Tichopad, A.; Prgomet, C.; Neuvians, T.P. Determination of stable housekeeping genes, differentially regulated target genes and sample integrity: BestKeeper--Excel-based tool using pair-wise correlations. Biotechnol. Lett. 2004, 26, 509–515. [Google Scholar] [CrossRef]
  37. Li, F.; Cheng, Y.; Ma, L.; Li, S.; Wang, J. Identification of reference genes provides functional insights into meiotic recombination suppressors in Gerbera hybrida. Hortic. Plant J. 2022, 8, 123–132. [Google Scholar] [CrossRef]
  38. Tang, Q.-Y.; Zhang, C.-X. Data Processing System (DPS) software with experimental design, statistical analysis and data mining developed for use in entomological research. Insect Sci. 2013, 20, 254–260. [Google Scholar] [CrossRef]
  39. Livak, K.J.; Schmittgen, T.D. Analysis of relative gene expression data using real-time quantitative PCR and the 2(-Delta Delta C(T)) Method. Methods 2001, 25, 402–408. [Google Scholar] [CrossRef]
  40. Chung, W.-C.; Wu, R.-S.; Hsu, C.-P.; Huang, H.-C.; Huang, J.-W. Application of antagonistic rhizobacteria for control of Fusarium seedling blight and basal rot of lily. Australas. Plant Pathol. 2011, 40, 269–276. [Google Scholar] [CrossRef] [Green Version]
  41. Zhang, N.; Liu, D.; Zheng, W.; He, H.; Ji, B.; Han, Q.; Ge, F.; Chen, C. A bZIP transcription factor, LrbZIP1, is involved in Lilium regale Wilson defense responses against Fusarium oxysporum f. sp. lilii. Genes Genom. 2014, 36, 789–798. [Google Scholar] [CrossRef]
  42. Zhang, N.; Guan, R.; Yang, Y.; Bai, Z.; Ge, F.; Liu, D. Isolation and characterization of a Fusarium oxysporum-resistant gene LrGLP1 from Lilium regale Wilson. Vitr. Cell. Dev. Biol.-Plant 2017, 53, 461–468. [Google Scholar] [CrossRef]
  43. Rao, J.; Liu, D.; Zhang, N.; He, H.; Ge, F.; Chen, C. Differential gene expression in incompatible interaction between Lilium regale Wilson and Fusarium oxysporum f. sp. lilii revealed by combined SSH and microarray analysis. Mol. Biol. 2014, 48, 802–812. [Google Scholar] [CrossRef]
  44. Luo, H.L.; Luo, L.P.; Guan, B.C.; Li, E.X.; Xiong, D.J.; Sun, B.T.; Peng, K.; Yang, B.Y. Evaluation of candidate reference genes for RT-qPCR in lily (Lilium brownii). J. Hortic. Sci. Biotechnol. 2014, 89, 345–351. [Google Scholar] [CrossRef]
  45. Li, X.; Cheng, J.; Zhang, J.; Da Teixeira Silva, J.A.; Wang, C.; Sun, H. Validation of Reference Genes for Accurate Normalization of Gene Expression in Lilium davidii var. unicolor for Real Time Quantitative PCR. PLoS ONE 2015, 10, e0141323. [Google Scholar] [CrossRef] [PubMed]
  46. Ma, L.L.; Zhang, Y.P.; Ding, K.; Wu, L.F.; Wang, X.N.; Cui, G.F.; Jia, W.J.; Duan, Q.; Wang, J.H. Resistance Identification of lily Germplasms to Fusarium oxysporum and Screening of the Resistance Identification of lily Germplasms to Fusarium oxysporum and Screening of the Resistance Related Genes. Acta Hortic. Sin. 2012, 39, 1141–1150. [Google Scholar]
  47. Seneviratne, H.K.; Dalisay, D.S.; Kim, K.-W.; Moinuddin, S.G.A.; Yang, H.; Hartshorn, C.M.; Davin, L.B.; Lewis, N.G. Non-host disease resistance response in pea (Pisum sativum) pods: Biochemical function of DRR206 and phytoalexin pathway localization. Phytochemistry 2015, 113, 140–148. [Google Scholar] [CrossRef] [Green Version]
  48. Borges, A.F.; Ferreira, R.B.; Monteiro, S. Transcriptomic changes following the compatible interaction Vitis vinifera-Erysiphe necator. Paving the way towards an enantioselective role in plant defence modulation. Plant Physiol. Biochem. 2013, 68, 71–80. [Google Scholar] [CrossRef] [Green Version]
  49. Reboledo, G.; Del Campo, R.; Alvarez, A.; Montesano, M.; Mara, H.; Ponce de León, I. Physcomitrella patens Activates Defense Responses against the Pathogen Colletotrichum gloeosporioides. Int. J. Mol. Sci. 2015, 16, 22280–22298. [Google Scholar] [CrossRef] [Green Version]
  50. Li, L.; Sun, W.; Zhou, P.; Wei, H.; Wang, P.; Li, H.; Rehman, S.; Li, D.; Zhuge, Q. Genome-Wide Characterization of Dirigent Proteins in Populus: Gene Expression Variation and Expression Pattern in Response to Marssonina brunnea and Phytohormones. Forests 2021, 12, 507. [Google Scholar] [CrossRef]
Figure 1. Melting curves of the nine selected potential reference genes.
Applsci 13 03395 g001
Figure 2. qRT-PCR Ct values for all candidate reference genes in all samples. The box graph represents the 75th to 25th percentiles and the line across the box represents the median. The whiskers on each box represent the minimum and maximum values and the circles represent outliers.
Applsci 13 03395 g002
Figure 3. The pairwise variation values (Vn/Vn + 1, V) of candidate reference genes.
Applsci 13 03395 g003
Figure 4. The relative expression levels of four resistance-related genes at different time points of L. sargentiae. The relative expression levels of POD (a), PAL (b), CHI (c), and DIR (d). F and W represent the different treatments with F. oxysporum and sterile water, respectively. The 0 h time point with sterile water treatment (0 hW) is the control. Each time period was compared with the control. *, **, and *** represent p < 0.05, p < 0.01, and p < 0.001, respectively. The expression of the four target genes was normalized according to the most suitable reference gene HIS using the 2−ΔΔCt method. One-way ANOVA with Tukey’s HSD post-hoc test was used to compare the means of multiple samples at the 5% significance level.
Applsci 13 03395 g004
Table 1. Primers of the candidate reference genes and target genes for qRT-PCR analysis.
GenePrimer Sequence (5′ to 3′)Product Length (bp)
CYPF:CGGTGGCGAGTCTATCTAT; R:TGGTATTAGGCCCAGCAT104
EF1-αF:TATTGACAAGCGTGTGATCG; R:TTATCAAGCACCCACGCA87
GAPDHF:ACATGGCTGCAACCAAGTA; R:CATGAAGCCGGCATTTATT80
TUBF:GCTGTTTCATCCCGAGCA; R:CAGGCACAGGTCAACAAT103
UBQF:CACCCTTGCGGACTATAAC; R:TTCCGGTGAGCGTCTTGA98
AQPF:CGTTTCCTCTCTATCTCCAG;R:CCATGAGCAGATCCATGTATT117
HISF:GATTCACAGGCAGTTGAAGT; R:TTCAGATCCTTGCTCGCAT138
PGKF:GGCTAAAGGCGTACGACTA; R:GCAGGTACAACCTTGCTC87
RPL13F:GCAGGTACAACCTTGCTC; R:CCTTGCTCCTCTTGATCTTTA93
PODF:CCGAGCCTCTTGAGTACAATTA; R:CCATTGACAAAGCAGTCGT110
PALF:CTGATCAAGGTCATAGACAGG; R:TAGTGCGTGCTCCACCAATA111
CHIF:GCCGACAATAAGATGGCG; R:AGGTTAGCTCCATAGCTGAC80
DIRF:GAGCGGCCTATTCAGGCTA; R:CGTACTCGACGAGAGATG89
The Tm of all primers in this table is 60 °C. F, forward primers; R, reverse primers.
Table 2. Stability rank of candidate reference gene expression by geNorm, NormFinder, and BestKeeper analysis.
Stability RankgeNormNormFinderBestKeeper
Reference GenesMReference GenesSVReference GenesSD
1HIS0.533HIS0.086CYP0.126
2EF-1α0.535PGK0.174AQP0.134
3CYP0.543CYP0.175EF-1α0.135
4UBQ0.598EF-1α0.182HIS0.146
5PGK0.611AQP0.211UBQ0.153
6TUB0.615TUB0.233TUB0.166
7AQP0.620UBQ0.280RPL130.180
8RPL130.717RPL130.420PGK0.204
9GAPDH1.466GAPDH0.994GAPDH0.217
Table 3. The comprehensive ranking of candidate reference gene stability by GM method.
Comprehensive RankingReference GenesGM Values of Ranking
1HIS1.587
2CYP2.080
3PGK2.884
4UBQ4.121
5AQP4.309
6EF-1α5.192
7TUB6.000
8RPL137.652
9GAPDH9.000
Disclaimer/Publisher’s Note: The statements, opinions and data contained in all publications are solely those of the individual author(s) and contributor(s) and not of MDPI and/or the editor(s). MDPI and/or the editor(s) disclaim responsibility for any injury to people or property resulting from any ideas, methods, instructions or products referred to in the content.

