
Wave Climate along Calabrian Coasts
by
 , , , ,
Giandomenico Foti
1,* ,
,
Giuseppe Barbaro
1 ,
,
Giovanni Besio
2 ,
,
Giuseppina Chiara Barillà
1 ,
,
Pierluigi Mancuso
3 and
Pierfabrizio Puntorieri
1 1
Department of Civil, Energy, Environmental and Material Engineering (DICEAM), Mediterranea University of Reggio Calabria, Via Graziella loc. Feo di Vito, 89122 Reggio Calabria, Italy
2
DICCA Department, Genoa University, Via Montallegro 1, 16145 Genoa, Italy
3
Public Works Department, Calabria Region, Viale Europa loc. Germaneto, 88100 Catanzaro, Italy
*
Author to whom correspondence should be addressed.
Climate 2022, 10(6), 80; https://0-doi-org.brum.beds.ac.uk/10.3390/cli10060080
Submission received: 1 May 2022
/
Revised: 21 May 2022
/
Accepted: 24 May 2022
/
Published: 28 May 2022
(This article belongs to the Special Issue Wave Climate)
Abstract
:The wave climate is highly variable temporally and spatially, depending mainly on the atmospheric conditions and on fetch extensions. Wave climate is one of the main causes of coastal erosion processes, together with anthropogenic pressure and with coastal and river sedimentary balance. Therefore, a detailed spatial and temporal knowledge of wave climate is very important in managing coastal areas and in planning coastal defense works. This paper describes an analysis of the wave climate carried out along the Calabrian coasts in over 50 areas, each of them covering an average of 15 km of coastline. For each area, over 40 years of wave data were analyzed to calculate over 20 parameters, representative of annual and seasonal average and maximum wave conditions. The large number of areas is related to the geomorphological and climatic complexity of Calabria. This analysis mainly highlighted that the two Ionian and Tyrrhenian coasts are very different from the wave climate point of view. Indeed, the Ionian coast is heavier in ordinary wave conditions, while the Tyrrhenian coast is heavier in extreme wave conditions.
1. Introduction
One of the main mechanisms of wave motion generation is the transfer of energy from the atmosphere to the sea surface through the wind. Therefore, the wave motion generated by the wind is closely related to atmospheric conditions and is particularly variable in space and time [1,2,3,4,5,6,7]. Another important factor causing spatial variations in the wave climate is the fetch length. Therefore, the wave climate generally depends on the wind speed and duration, on the airflow stability, on the bathymetry, and on the length of the fetch where the wind acts [8,9,10,11,12]. The dependence between wave climate and fetch length also implies a dependence between wave climate and coastal morphology [13,14,15,16]. This dependence is particularly important both in closed basins, such as the Mediterranean Sea, where the fetches vary considerably as the direction changes, and for irregular coastal morphologies, with gulfs, straits, and promontories.
To analyze the wave climate, it is necessary to have time series of wave data long enough to represent a statistically significant sample. The main types of wave data are those measured in situ by buoys or those reconstructed by numerical modeling [17,18,19,20,21]. Buoy data have the advantage of being real data but also have the disadvantage of being spatially limited. For example, in Italy, there are only about fifteen buoys for over 8000 km of coastline, and in Calabria, a region of southern Italy, there are only two buoys for over 700 km of coastline. Furthermore, these buoys have time series varying from a few years up to 25 years, with a recent lack of records for seven years. On the other hand, hindcast model data have the disadvantage of not being real data but have the advantage of greater spatial and temporal coverage.
Wave climate is determined by many parameters, the main ones being significant wave height, peak and mean period, mean wave direction, mean energy flux, main sector and, where present, secondary and tertiary sectors [22]. Wave climate, through the action of sea storms, is the main cause of coastal flooding [23,24], together with intense rainfall events [25,26], especially when these events are concurrent [27,28,29]. Additionally, wave climate is one of the main causes of coastal erosion [30,31,32]. Other important causes are the alteration of coastal sedimentary balance, which is mainly related to longshore and river transport [33,34,35,36,37,38,39], and anthropogenic pressure in coastal and river areas [40,41,42,43,44,45,46], through the destruction of dune systems [47,48,49,50], the withdrawal of river sediment [51] and the construction of ports and coastal and river structures [52,53,54,55,56,57]. Therefore, the correct and detailed knowledge of wave climate is very important to manage coastal areas and to plan coastal defense works [58].
The paper describes an analysis of the wave climate carried out along the Calabrian coasts starting from the wave data from the last 40 years, available in the database developed by the MeteOcean group of the University of Genoa. The analysis was carried out in more than 50 points of the MeteOcean database grid and the values of over 20 wave parameters were calculated to analyze the spatial and temporal variations of the wave climate in a very complex case such as the Calabrian one. Indeed, Calabria is a region in southern Italy that represents an interesting case study due to its notable coastal length and due to the considerable variability of climatic and geomorphological conditions.
2. Materials and Methods
2.1. Site Description
Calabria is an interesting case study of wave climate analysis due to its geographical position and due to some geomorphological and climatic peculiarities.
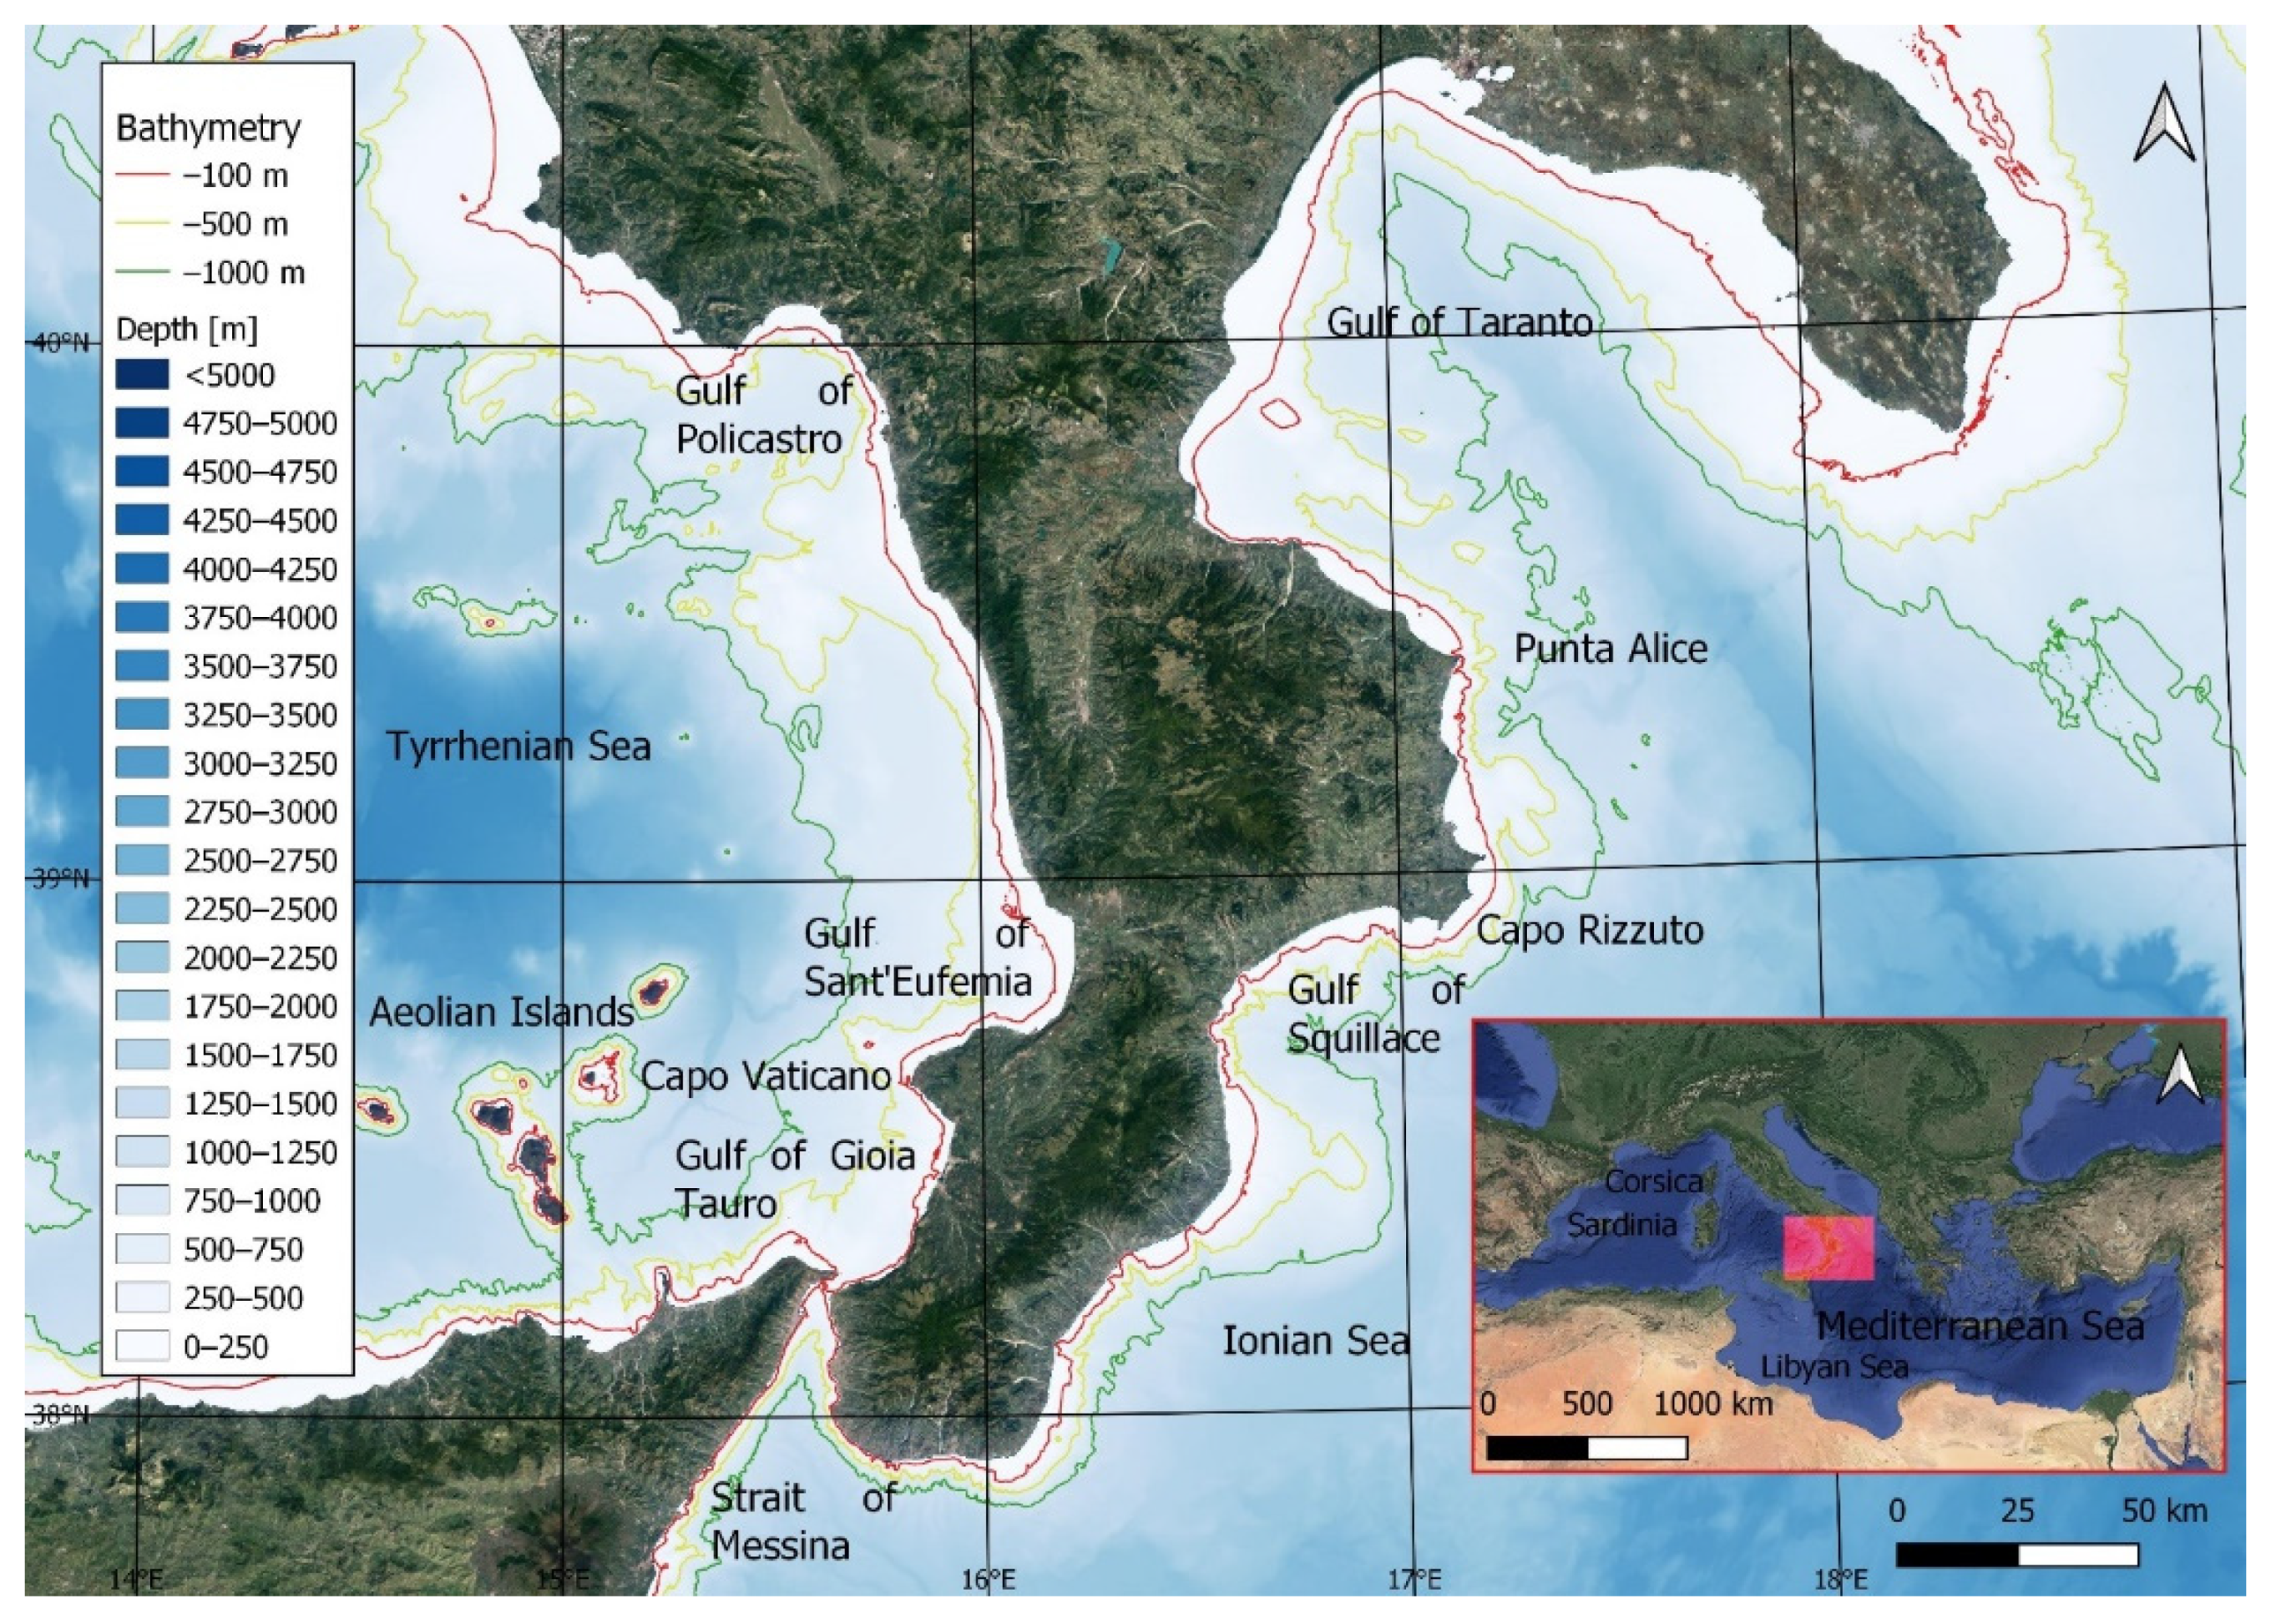
From the geographical position point of view, Calabria is a region of southern Italy that is in the center of the Mediterranean Sea and is a peninsula within the Italian peninsula, with a total coastal length of about 750 km (Figure 1). In fact, it is bathed by the sea to the south, east, and west, and is connected to the Italian peninsula only to the north, through a strip of land about 75 km long. The eastern coast of Calabria is located on the Ionian Sea; this sea is bordered by Greece to the east and by the Libyan Sea to the south and is characterized by depths of over 5000 m and by fetches of the order of hundreds of kilometers, up to over 1000 km. The western coast of Calabria is located on the Tyrrhenian Sea; this sea is bordered by Corsica and Sardinia to the west, by Sicily to the south, and by the Italian peninsula to the north and is characterized by depths of about 3800 m and by fetch lengths of order of hundreds of kilometers, up to over 700 km. Within the Ionian Sea there are two gulfs, Taranto and Squillace. The Gulf of Taranto is in the northern part of Calabria between the northern border of Calabria and Punta Alice to the south and is characterized by depths of about 1500 m and by fetch lengths up to about 130 km. The Gulf of Squillace is in the central part of Calabria between Capo Rizzuto and Punta Soverato and is characterized by depths over 500 m and by fetch lengths up to about 60 km. On the other hand, within the Tyrrhenian Sea, there are three gulfs, Policastro, Sant’Eufemia, and Gioia Tauro. The Gulf of Policastro is in the northern part of Calabria and is characterized by depths over 500 m and by fetch lengths up to about 30 km. The Gulf of Sant’Eufemia is in the central part of Calabria and is characterized by depths of about 200 m and by fetch lengths up to about 30 km. The Gulf of Gioia Tauro is in the southern part of Calabria and is characterized by depths over 300 m and by fetch lengths up to about 40 km. Finally, in its southern part, Calabria is separated from Sicily by the Strait of Messina. This Strait is characterized by depths of up to 2000 m and by fetches of varying lengths between 3 and 30 km.
From the bathymetry point of view, there are considerable variations between the two coasts. Indeed, the analysis of the bathymetry available on the European Marine Observation and Data Network (EMODnet) portal (https://www.emodnet-bathymetry.eu/, accessed on 5 April 2022) showed that the Tyrrhenian Sea has generally shallower bottoms and less slope than the Ionian Sea offshore. On the other hand, nearshore, the Ionian Sea has less slope than the Tyrrhenian Sea. In detail, in the center of the Gulf of Taranto, there is a submarine canyon that exceeds 1500 m in depth and the bathymetric −100 m is located at distances between 5 and 15 km from the coast, except in front of point I5 where this distance is about 500 m. Additionally, in the coast between Punta Alice and point I29, the bathymetric −100 m is almost always located about 5 km from the coast, except in front of points I18, I23, I24 and I26 where this distance is a few hundred meters. In these last three points, there are submarine canyons in front of the mouths of some rivers. In the Strait of Messina and in the adjacent coasts, between points I28 and T2, the seabed is steeply sloping. In fact, the bathymetric −100 m is almost always located a few hundred meters from the coast, while the bathymetric −1000 m in the steeper part is located less than 3 km from the coast. In the Tyrrhenian Sea, the bathymetric −100 m is located less than 4 km from the coast except for the Gulf of Sant’Eufemia and in front of points T15 and T16. Finally, about 80 km in front of the Gulf of Gioia Tauro to the west are the Aeolian Islands, a small archipelago of volcanic islands that partially cover the waves coming from the west direction. From the geomorphological point of view, 90% of the Calabrian territory is mountainous or hilly. The main massifs are Pollino, Sila and Aspromonte, all with a maximum altitude of the order of 2000 m, and the Catena Costiera, which is located a short distance from the northern Tyrrhenian coast and has a maximum height of over 1500 m. In addition, there are some promontories and the main are Capo Rizzuto, on the Ionian coast, and Capo Vaticano, on the Tyrrhenian coast. The main coastal plains are that of Sibari, on the Ionian coast in the Gulf of Taranto, and those of Lamezia Terme in the Gulf of Sant’Eufemia and of Gioia Tauro in the homonymous gulf, both on the Tyrrhenian coast. Regarding the coastline, there is an alternation between sandy and pebbly beaches and high coasts.
From the climatic point of view, the Calabrian climate is strongly influenced by the geomorphological variability described above. The mountainous areas have a typical mountain climate, with frequent snow during the winter. Instead, the coastal areas have a Mediterranean climate with significant differences in rainfall and temperatures between the two coasts. In fact, the Tyrrhenian coast is cooler and rainier than the Ionian one. The greatest rainfall occurs mainly in winter and autumn and is significantly reduced in the summer months, varying between 1400 and 1800 mm per year in the mountainous areas, between 700 and 1000 mm per year on the Tyrrhenian coast and around 500 mm per year on the Ionian coast. The sea water temperature reaches the highest value in July and August with 26 °C, it remains around 22–23 °C until October and then decreases to 14 °C in winter. The high sea water temperature in the autumn months favors the formation of particularly intense atmospheric disturbances, which sometimes become a kind of hurricane, also called medicane (Mediterranean hurricane) or tropical-like cyclones (TLC), as happened in 2015 in Bruzzano, on the southern Ionian coast [59]. Finally, the Ionian coasts are mainly exposed to the winds of Scirocco, south-east, and Grecale, north-east, while the Tyrrhenian coasts are mainly exposed to the winds of the Mistral, north-west. These differences, together with the different fetches’ lengths between the two seas and the various gulfs, lead to a remarkable variability of sea conditions between the two coastal areas.
2.2. Methodology
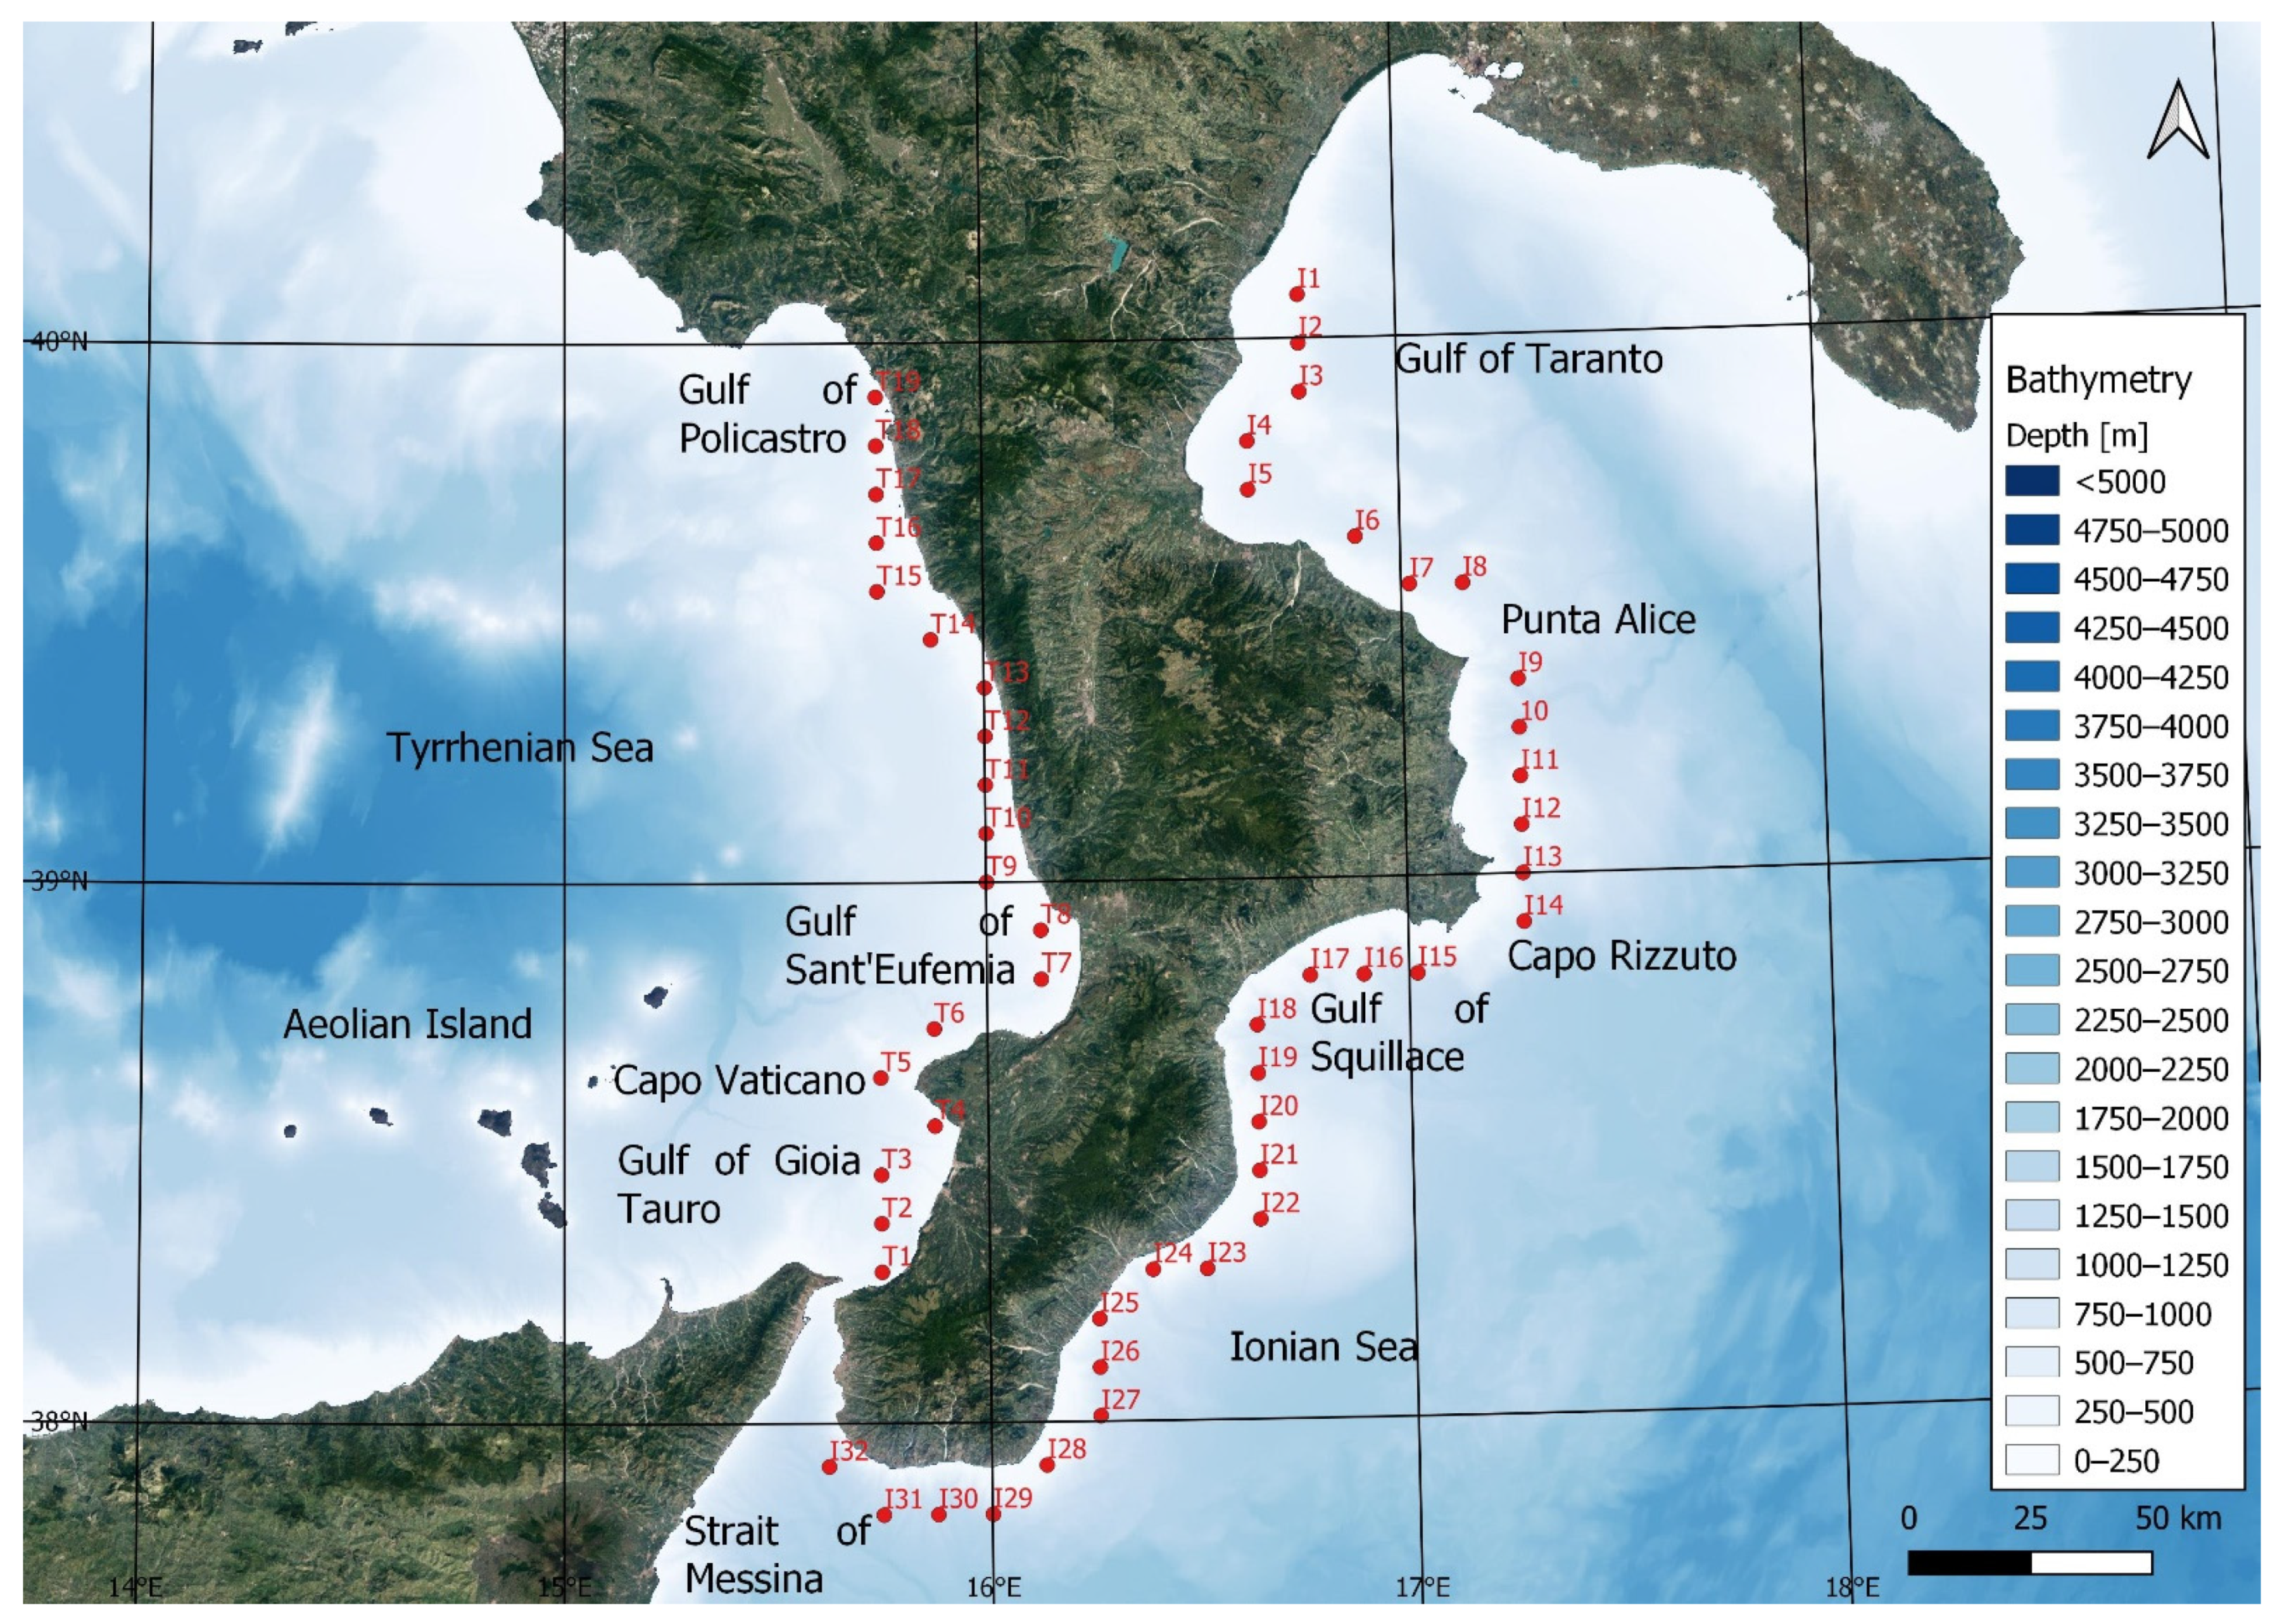
The wave climate along Calabrian coasts was analyzed starting from the wave data from the last 40 years, available in the database developed by the MeteOcean group of the University of Genoa (http://www3.dicca.unige.it/meteocean/hindcast.html, accessed on 15 February 2022). This group has performed a re-analysis of atmospheric and wave conditions, producing an hindcast database that starts from January 1979 until today. This database has been reconstructed from the Climate Forecast System Reanalysis (CFSR) database through a numerical model that consists of a meteorological model for the reanalysis and the simulation of winds and atmospheric fields and in a third-generation model for the description of the generation and the propagation of wind and swell waves in the Mediterranean basin. In detail, the wind forcing has been provided by the 10 m wind fields obtained using the non-hydrostatic mesoscale model Weather Research and Forecasting with the Advanced Research solver (WRF-ARW). The wave conditions were analyzed using the third-generation wave model WavewatchIII. Additionally, the Mediterranean basin has been discretized into a regular grid with a resolution of 0.1273 × 0.09 degrees, corresponding almost to 10 km at the latitude of 45° N [60,61,62,63,64,65]. To consider the significant geographical differences between the Calabrian coasts described above, some points of the grid have been chosen that characterize the wave climate along the various coastal areas. In detail, over 50 points were chosen, so the distance along the coast between one point and another is about 15 km (Figure 2). Each point was identified with the suffix I for the points of the Ionian Sea and with the suffix T for the points of the Tyrrhenian Sea, both followed by an increasing number in a clockwise direction, and was characterized by the time series of the order of hundreds of thousands of sea states, from a minimum of 330,000 to a maximum of 350,000, starting on 1 January 1979 and ending on 31 December 2021, with hourly data. All points are located on deep water, as no points are located at depths less than 100 m, except for point I20, which is located at depths of 87 m. Additionally, for each sea state, significant wave height, mean and peak periods and wave direction are available.
For each point, the entire time series were grouped into sectors of 10° each and the following parameters were calculated:
- Maximum significant wave height hs,max;
- Average significant wave height hs, average peak period tp and average mean period tm;
- Frequency f of each sector;
- Average annual energy flux Φ of each sector;
- Average annual energy flux Φt;
- Main, secondary and tertiary sectors;
- Significant wave height of fixed return period (hs1, corresponding to return period of 1 year, and hs100, corresponding to return period of 100 years, to consider both frequent and rare events) and their difference ∆hs1–100;
- Characteristic parameters u, w, a10, b10.
In addition, a seasonal analysis was performed where the following parameters were calculated (where the i-th season has been indicated with subscripts W for winter, SP for spring, SU for summer and A for autumn):
- 9.
- Seasonal maximum significant wave height hs,max,i;
- 10.
- Seasonal average significant wave height hs,i;
- 11.
- Seasonal average annual energy flux Φt,i;
- 12.
- Seasonal main sector MSi.
The frequency of each sector is the ratio between the number of sea states from that sector and the total number of registered sea states. The average annual energy flux of each sector is the sum of the average annual energy flux of each sea state from that sector, which depends on the specific gravity of the water, on the peak period, on the square of the significant wave height and on the frequency. So, the average annual energy flux of each point is the sum of the average annual energy flux of each sector. The main sector is the one with the greatest energy flux value, while the secondary and tertiary sectors are those with the second and third highest energy flux values. The criterion adopted to define the secondary and tertiary sectors is as follows: sectors characterized by an increasing mean energy flux compared to the adjacent sector and not contiguous to the main sectors (in the case of secondary sector) and not contiguous to the secondary sector (in the case of the tertiary sector). So, the secondary and tertiary sectors are not always present. The significant wave height of fixed return period was estimated reversing the following formula [63]:
where the parameters u and w describe a Weibull-type distribution of the probability of exceeding a fixed significant height threshold, while the parameters a10 and b10 are related to the equivalent triangular storm model (ETS) [66]. Among the various distributions of the probability of exceeding, Weibull was chosen as appropriate for the Mediterranean Sea [66,67], and applied in Italy, for example, by [68,69]. The reliability of the Weibull distribution was tested by calculating the coefficient of determination R-squared [70]. ETS is a model that associates an equivalent triangular storm to each real sea storms. The height a of the equivalent triangular storm is equal to the maximum significant wave height of the real sea storm, and the base b of the equivalent triangular storm is obtained imposing equality between the maximum expected wave height during the equivalent triangular storm and during the real sea storm. Therefore, a10 and b10 represent, respectively, the average values of a and b, referring to a sample of the N stronger real sea storms, with N equal to 10 for the number of years of available data. Furthermore, the parameters u, w, a10 and b10 are characteristic of the analyzed location.
T = (b10 (1.12 − 0.12 hs/a10)) × (exp (hs/w)u)/(1 + u (hs/w)u)
3. Results
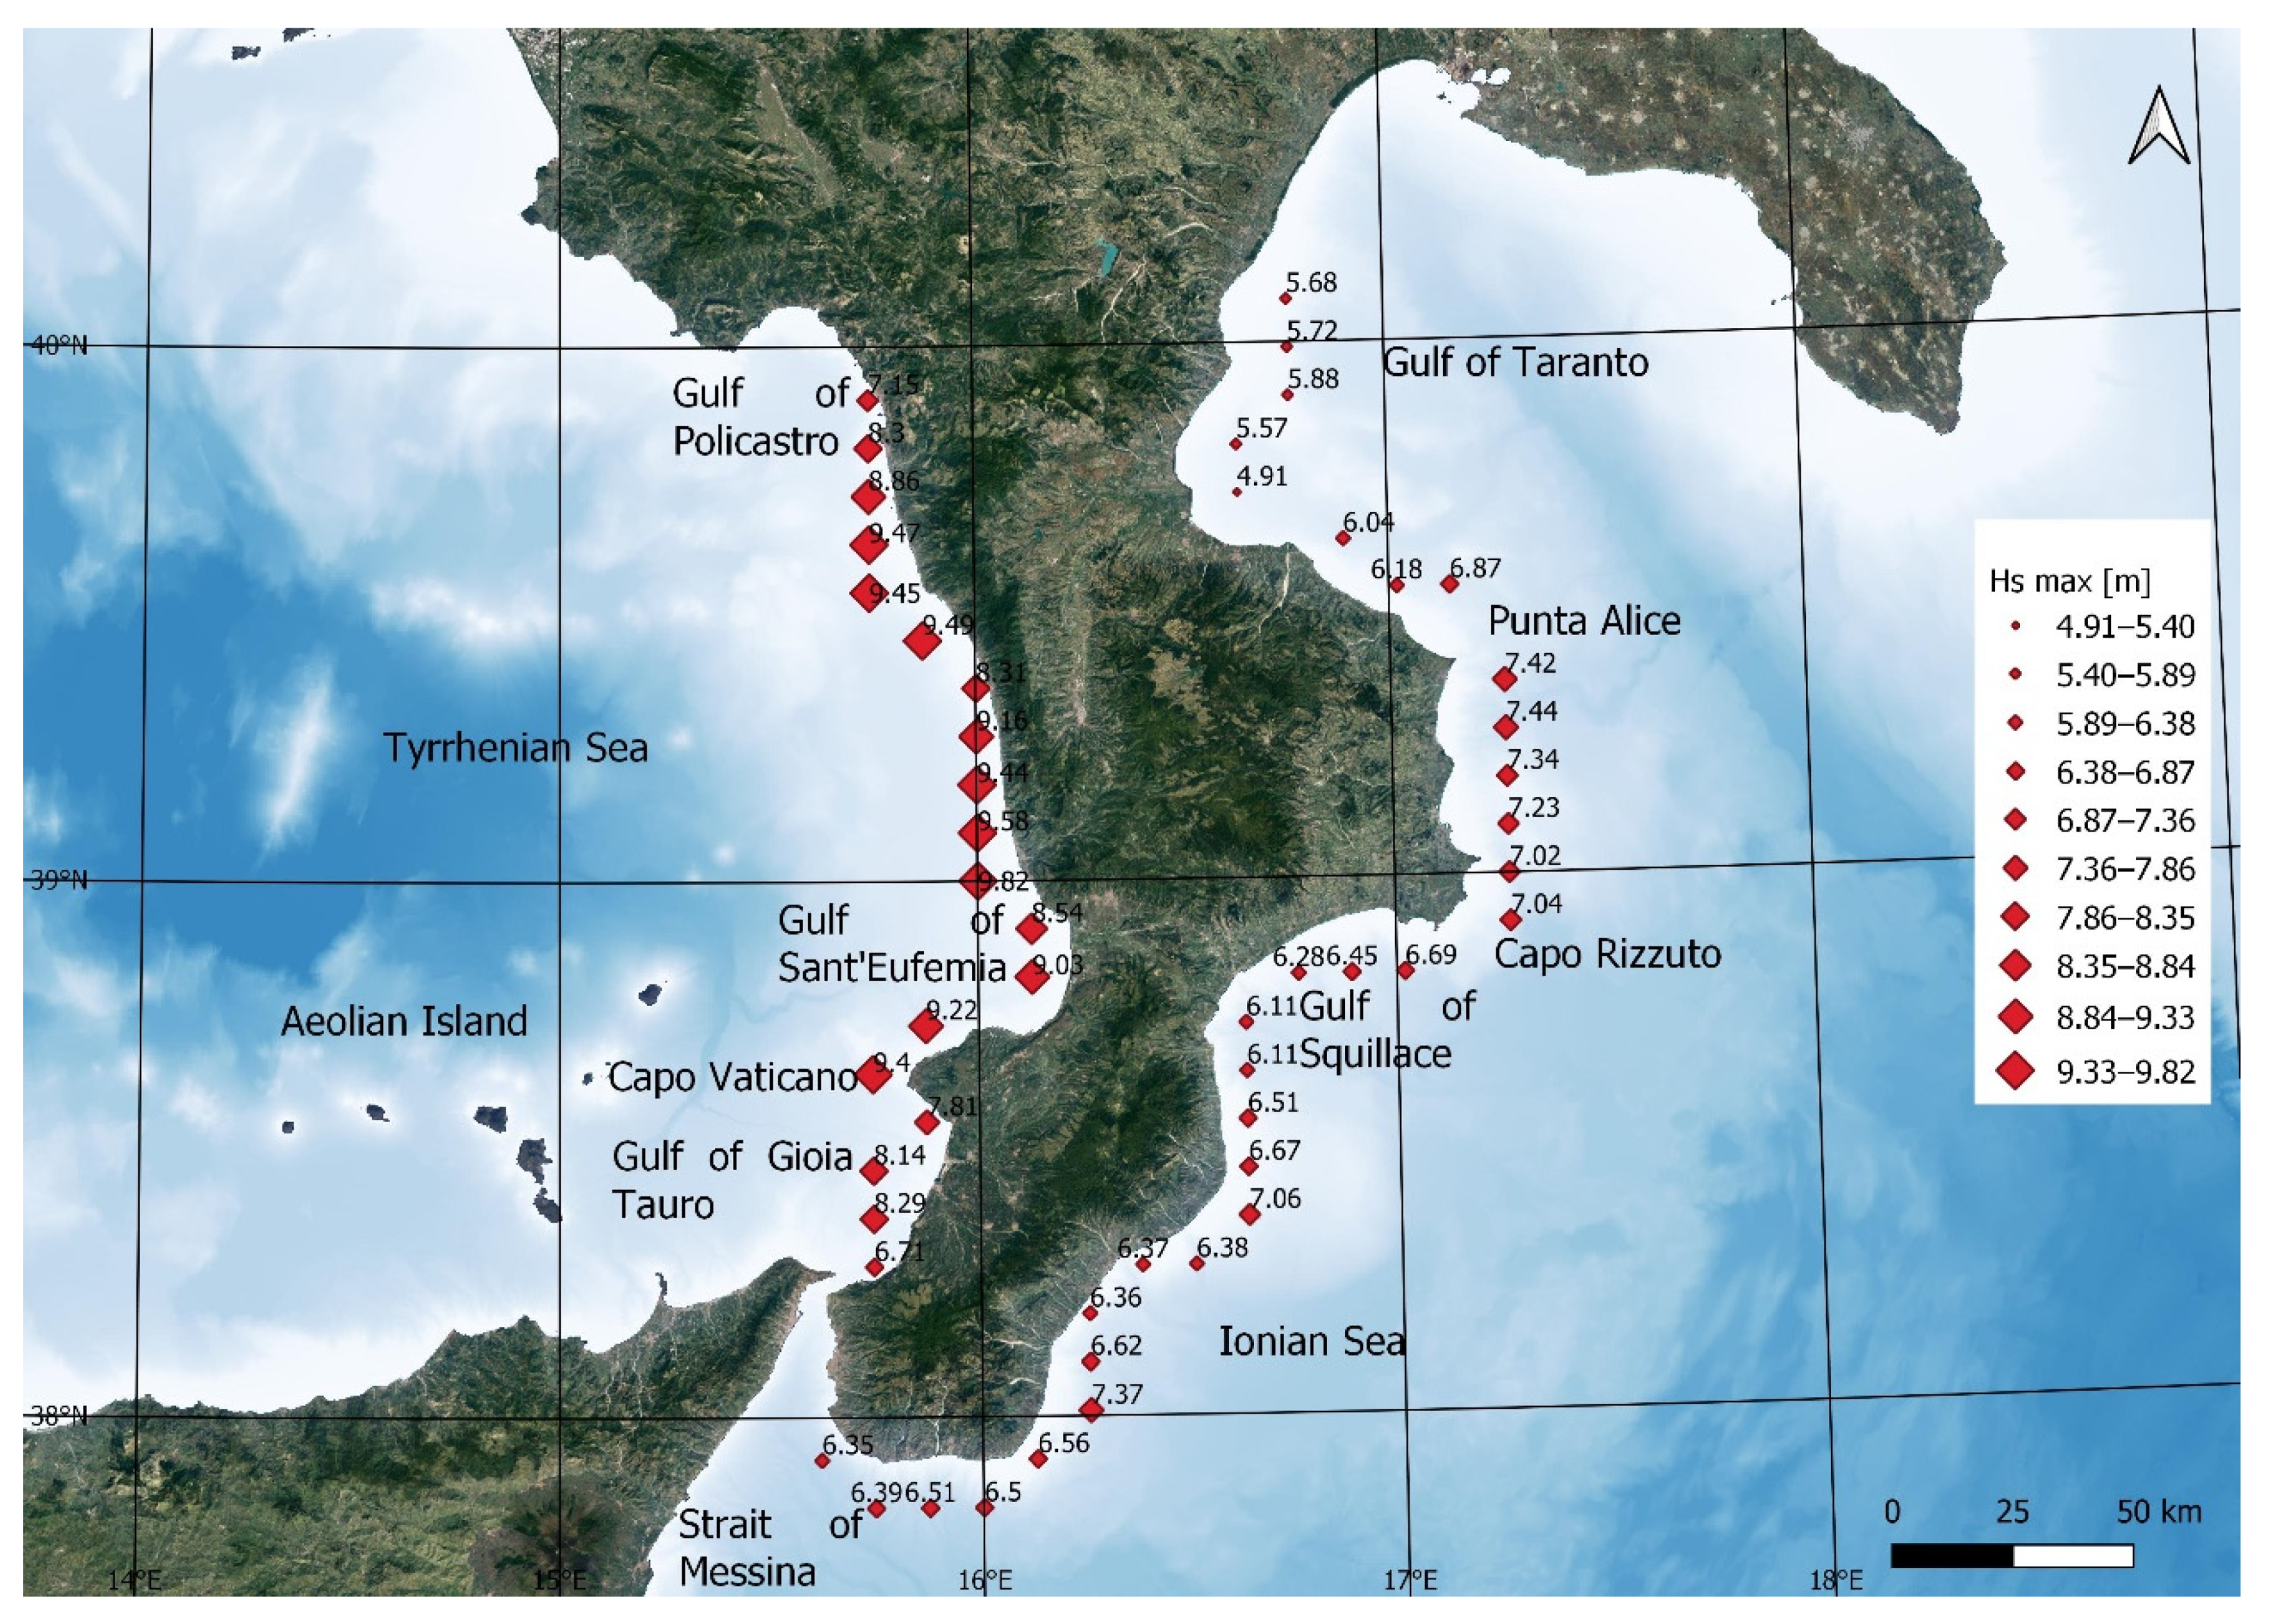
Table 1, Table 2, Table 3 and Table 4 show a summary of the calculated parameters. In detail, Table 1 shows the coastal municipalities present in the coastal area corresponding to each point and the values of hs,max, hs, tp, tm, hs1, hs100 and ∆hs1–100 calculated for each point. Table 2 shows the values of average annual energy flux Φt, the main MS, secondary SS and tertiary TS sectors and the corresponding values of energy flux ΦMS, ΦSS and ΦTS, respectively, the ratio between the main sector energy flux value and the total energy flux value ΦMS/Φt and the characteristic parameters u, w, a10 and b10. Table 3 shows the values of seasonal maximum significant wave height hs,max,i and of seasonal average significant wave height hs,i. Table 4 shows the values of seasonal average annual energy flux Φt,i, and of seasonal main sector MSi. The i-th season has been indicated with subscripts W for winter, SP for spring, SU for summer and A for autumn. The maximum values of hs,max are between 4.91 m at point I5, located in the Gulf of Taranto, and 9.82 m at point T9, located in the central-northern Tyrrhenian Sea. The average value of hs,max is 7.33 m, and this parameter is characterized by a considerable spatial variability between the two macro areas Ionic and Tyrrhenian and within each macro area. Indeed, in the Ionian coast, the hs,max values are always lower than 7.5 m, while in the Tyrrhenian coast, the hs,max values are always higher than 8, with the exception of three points (T1, T4, T19). Spatial variability is then analyzed in detail by proceeding clockwise starting from the Ionian coast. The lowest hs,max values are observed in the innermost part of the Gulf of Taranto, in the points between I1 and I5, with values always lower than 6 m. From point I5 towards the east, the hs,max values increase up to about 7 m at point I8, located near Punta Alice at the mouth of the Gulf of Taranto. Below, between Punta Alice and Capo Rizzuto in the points between I9 and I14, the highest hs,max values of the whole Ionic macro area are observed, with values between 7 and 7.5 m. Following, within the Gulf of Squillace, the hs,max values gradually decrease to just over 6 m at point I18 near Punta Soverato. From this point southwards to point I22, the hs,max values increase over 7 m. Then, there are three points, from I23 to I25, with very similar hs,max values of about 6.4 m, followed by a new growth up to point I27, with hs,max values up to almost 7.4 m. From this point towards the west, up to the southern mouth of the Strait of Messina, the hs,max values decrease to just over 6.3 m. At point T1, near the northern mouth of the Strait of Messina, the hs,max value is about 6.7 m and is the lowest of the entire Tyrrhenian coast. Inside the Gulf of Gioia Tauro, between points T2 and T4, the hs,max values are between 7.8 and 8.3 m and decrease towards the north. On the promontory of Capo Vaticano, the hs,max values exceed 9 m and then decrease within the Gulf of Sant’Eufemia up to just over 8.5 m. At the point immediately north of this is observed the maximum hs,max value of the whole of Calabria, over 9.8 m. Subsequently, the hs,max values decrease towards the north remaining above 9 m and then decrease to 8.3 m at point T13. The three points following it, from T14 to T16, have very similar hs,max values of about 9.5 m. In the next two points, T17 and T18, the hs,max values are lower than the previous ones but are still high, between 8.3 and 8.9 m. Finally, at point T19 the hs,max value is 7.15 m, much lower than the other Tyrrhenian values but this point is inside the Gulf of Policastro.
The hs values vary between 0.43 m at point I5, and 0.92 m at point I14. The average value is 0.7 m and this parameter is characterized by an increasing and decreasing trend between the various points in agreement with that observed with hs,max. However, unlike this, the hs values obtained in the two macro-areas are similar and the value maximum is observed in the Ionian coast. Another difference with hs,max concerns the trends between Punta Alice and Capo Rizzuto (points from I9 to I14) and between points I28 and I32. Indeed, in both cases, hs,max decreases while hs grows.
The tp values vary between 3.94 s at point I5, and 5.66 s at points T17 and T18, located in the northern Tyrrhenian coast. The average value is 5.13 s, and the variations between the various points are like those of hs,max. However, the maximum tp values obtained in the two macro areas are not very different from each other and are equal to 5.41 s in the Ionian coast (point I28, in the southern part) and 5.66 s in the Tyrrhenian coast.
The tm values vary between 3.36 s at point I5, and 4.76 s at points T17 and T18. The average value is 4.33 s, and the variations between the various points are like those of tp.
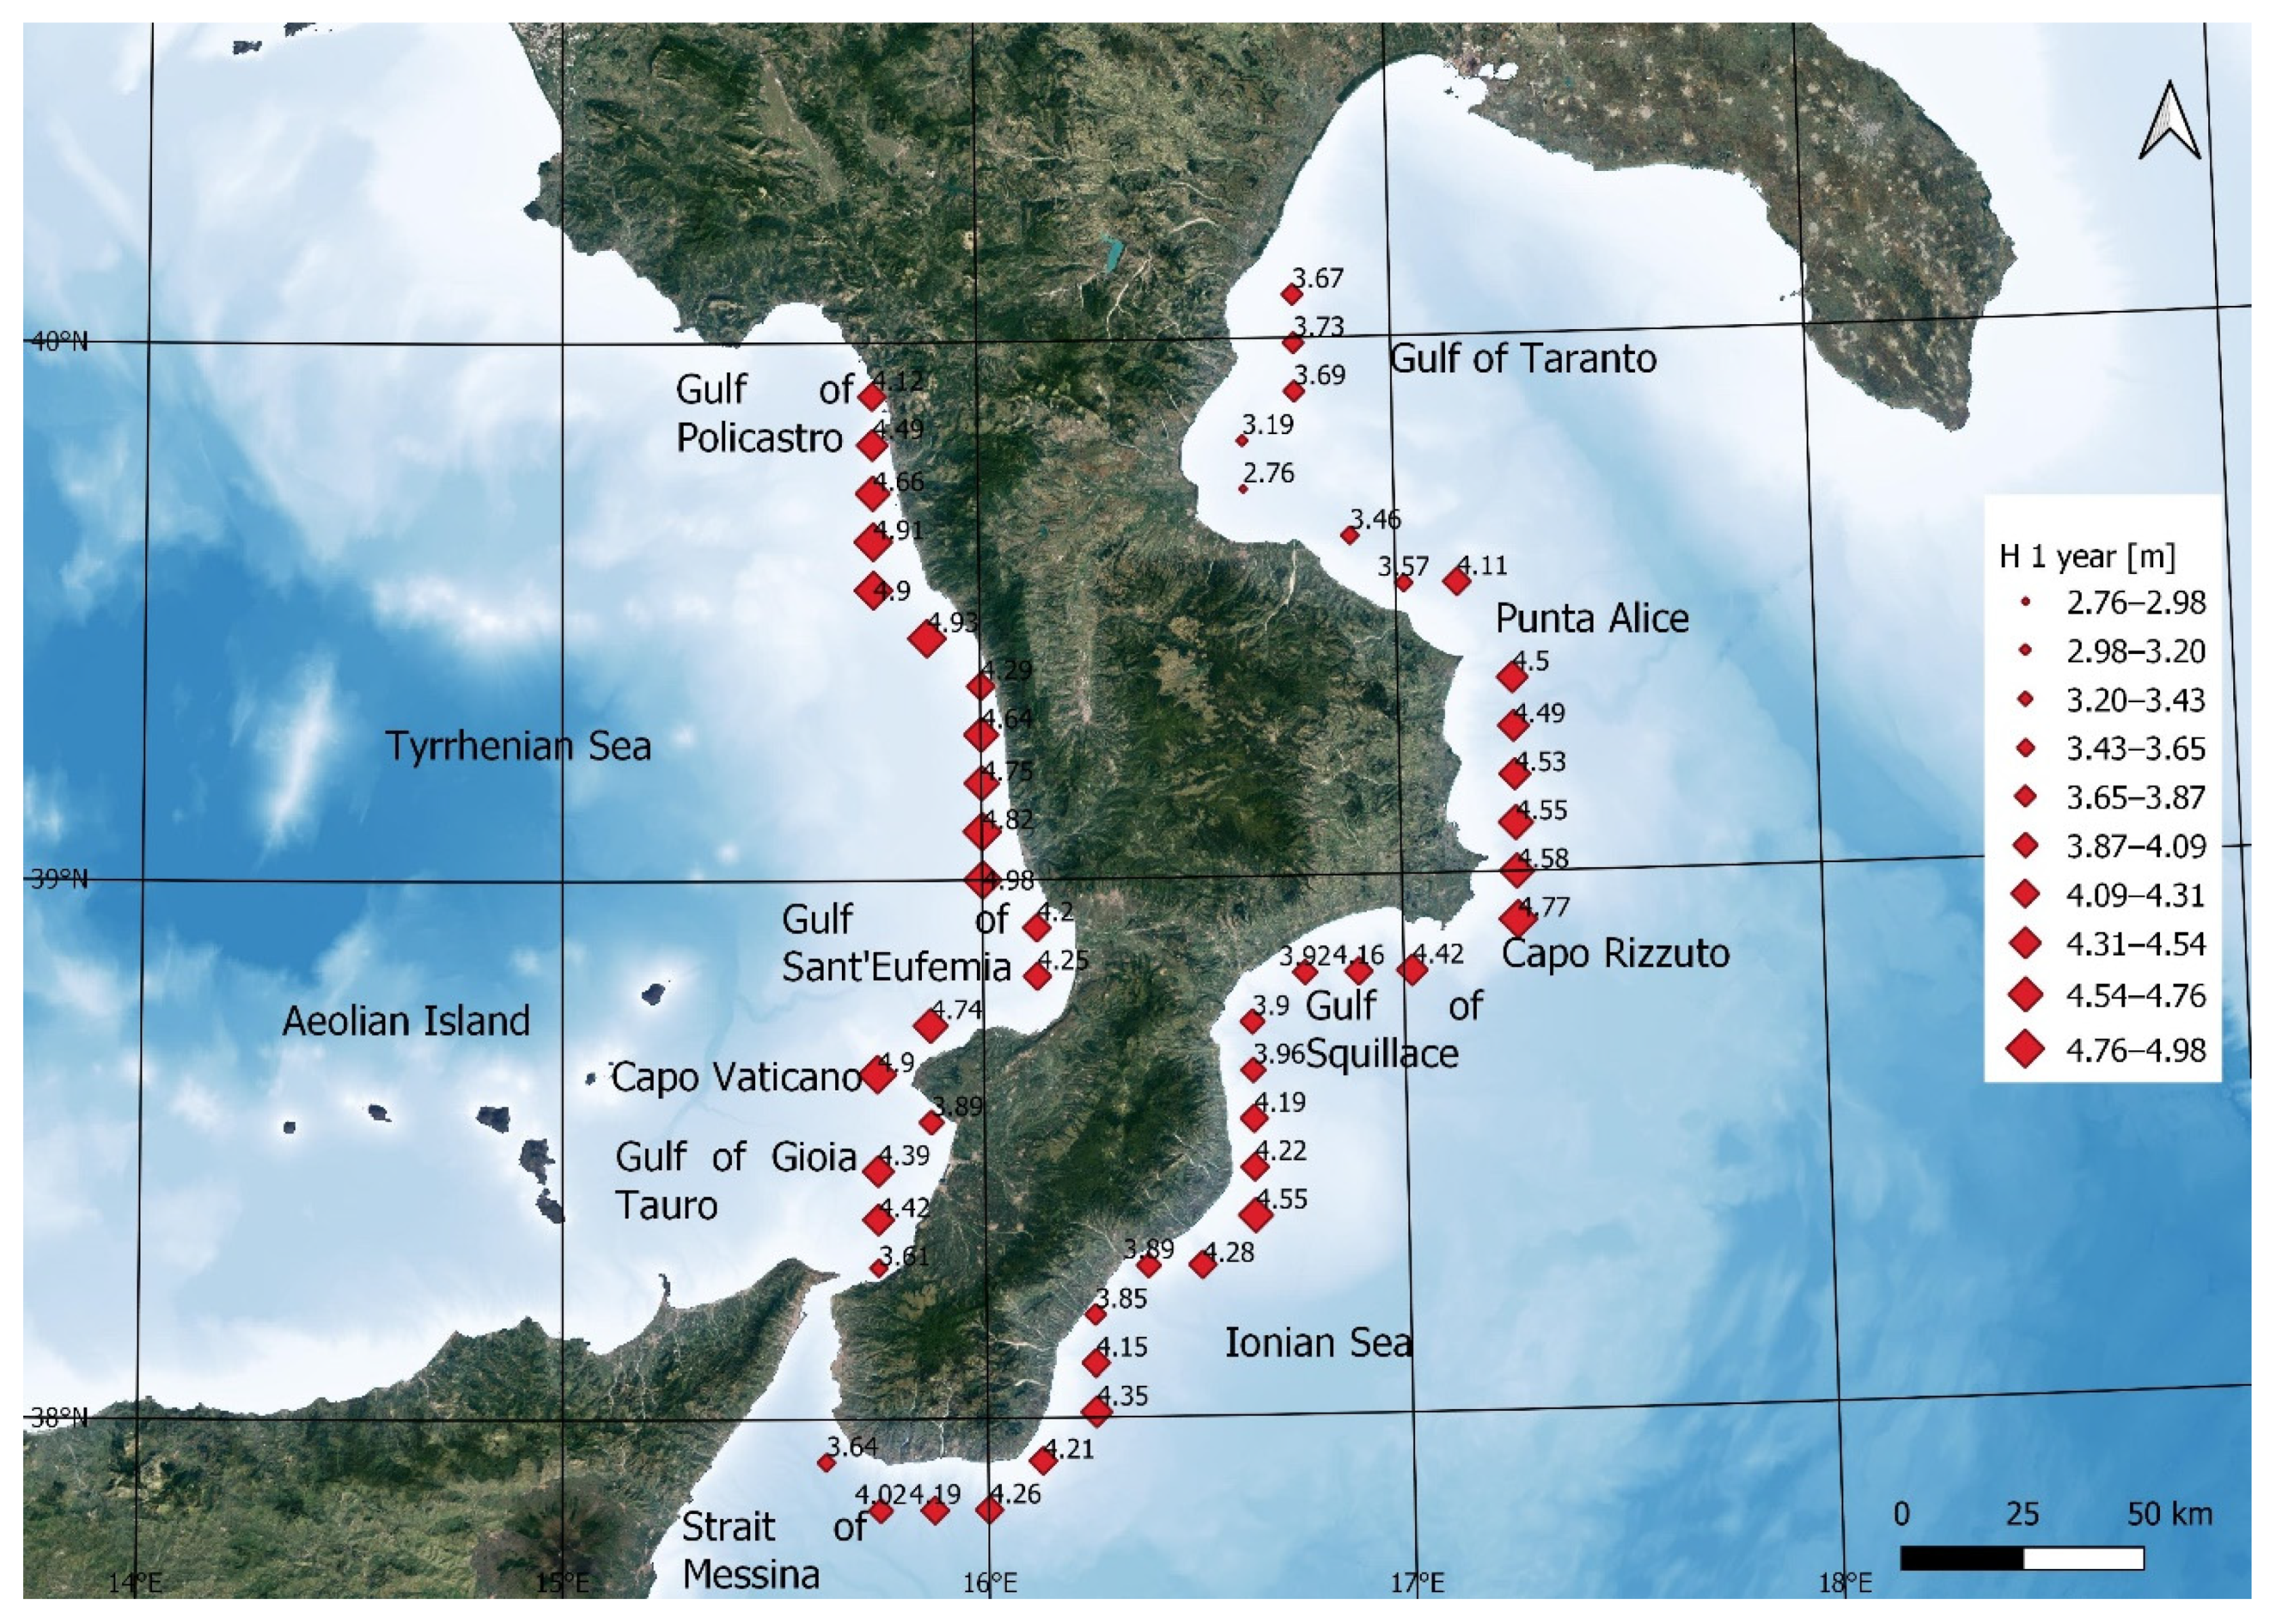
The hs1 values vary between 2.76 m at point I5, and 4.98 m at point T9, located in the central-northern Tyrrhenian Sea. The average value is 4.23 m. Additionally, this parameter has a variability between the various points like that of hs,max. However, the maximum values obtained in the two macro areas are not very different from each other and are equal to 4.77 m in the Ionian coast (point I14) and to 4.98 m in the Tyrrhenian coast.
The values of hs100 vary between 4.71 m at point I5, and 9.18 m at point T9. The average value is 7.43 m, and the variations between the various points are like those of hs1. However, unlike what was observed with hs1, the hs100 values obtained in the two macro areas are very different from each other. In fact, the maximum hs100 value in the Ionian coast is 7.9 m (at point I22, in the central-southern part), while in the Tyrrhenian coast, in 12 points out of 19, the value of hs100 largely exceeds 8 m, and in one point, it even exceeds 9 m. Consequently, the differences between these values ∆hs1–100 vary between 1.95 m at point I5, and 4.2 m at point T9. The average value is 3.2 m, and the variations between the various points are like those of hs100, where the Tyrrhenian coast are characterized by generally higher values than the Ionian coast.
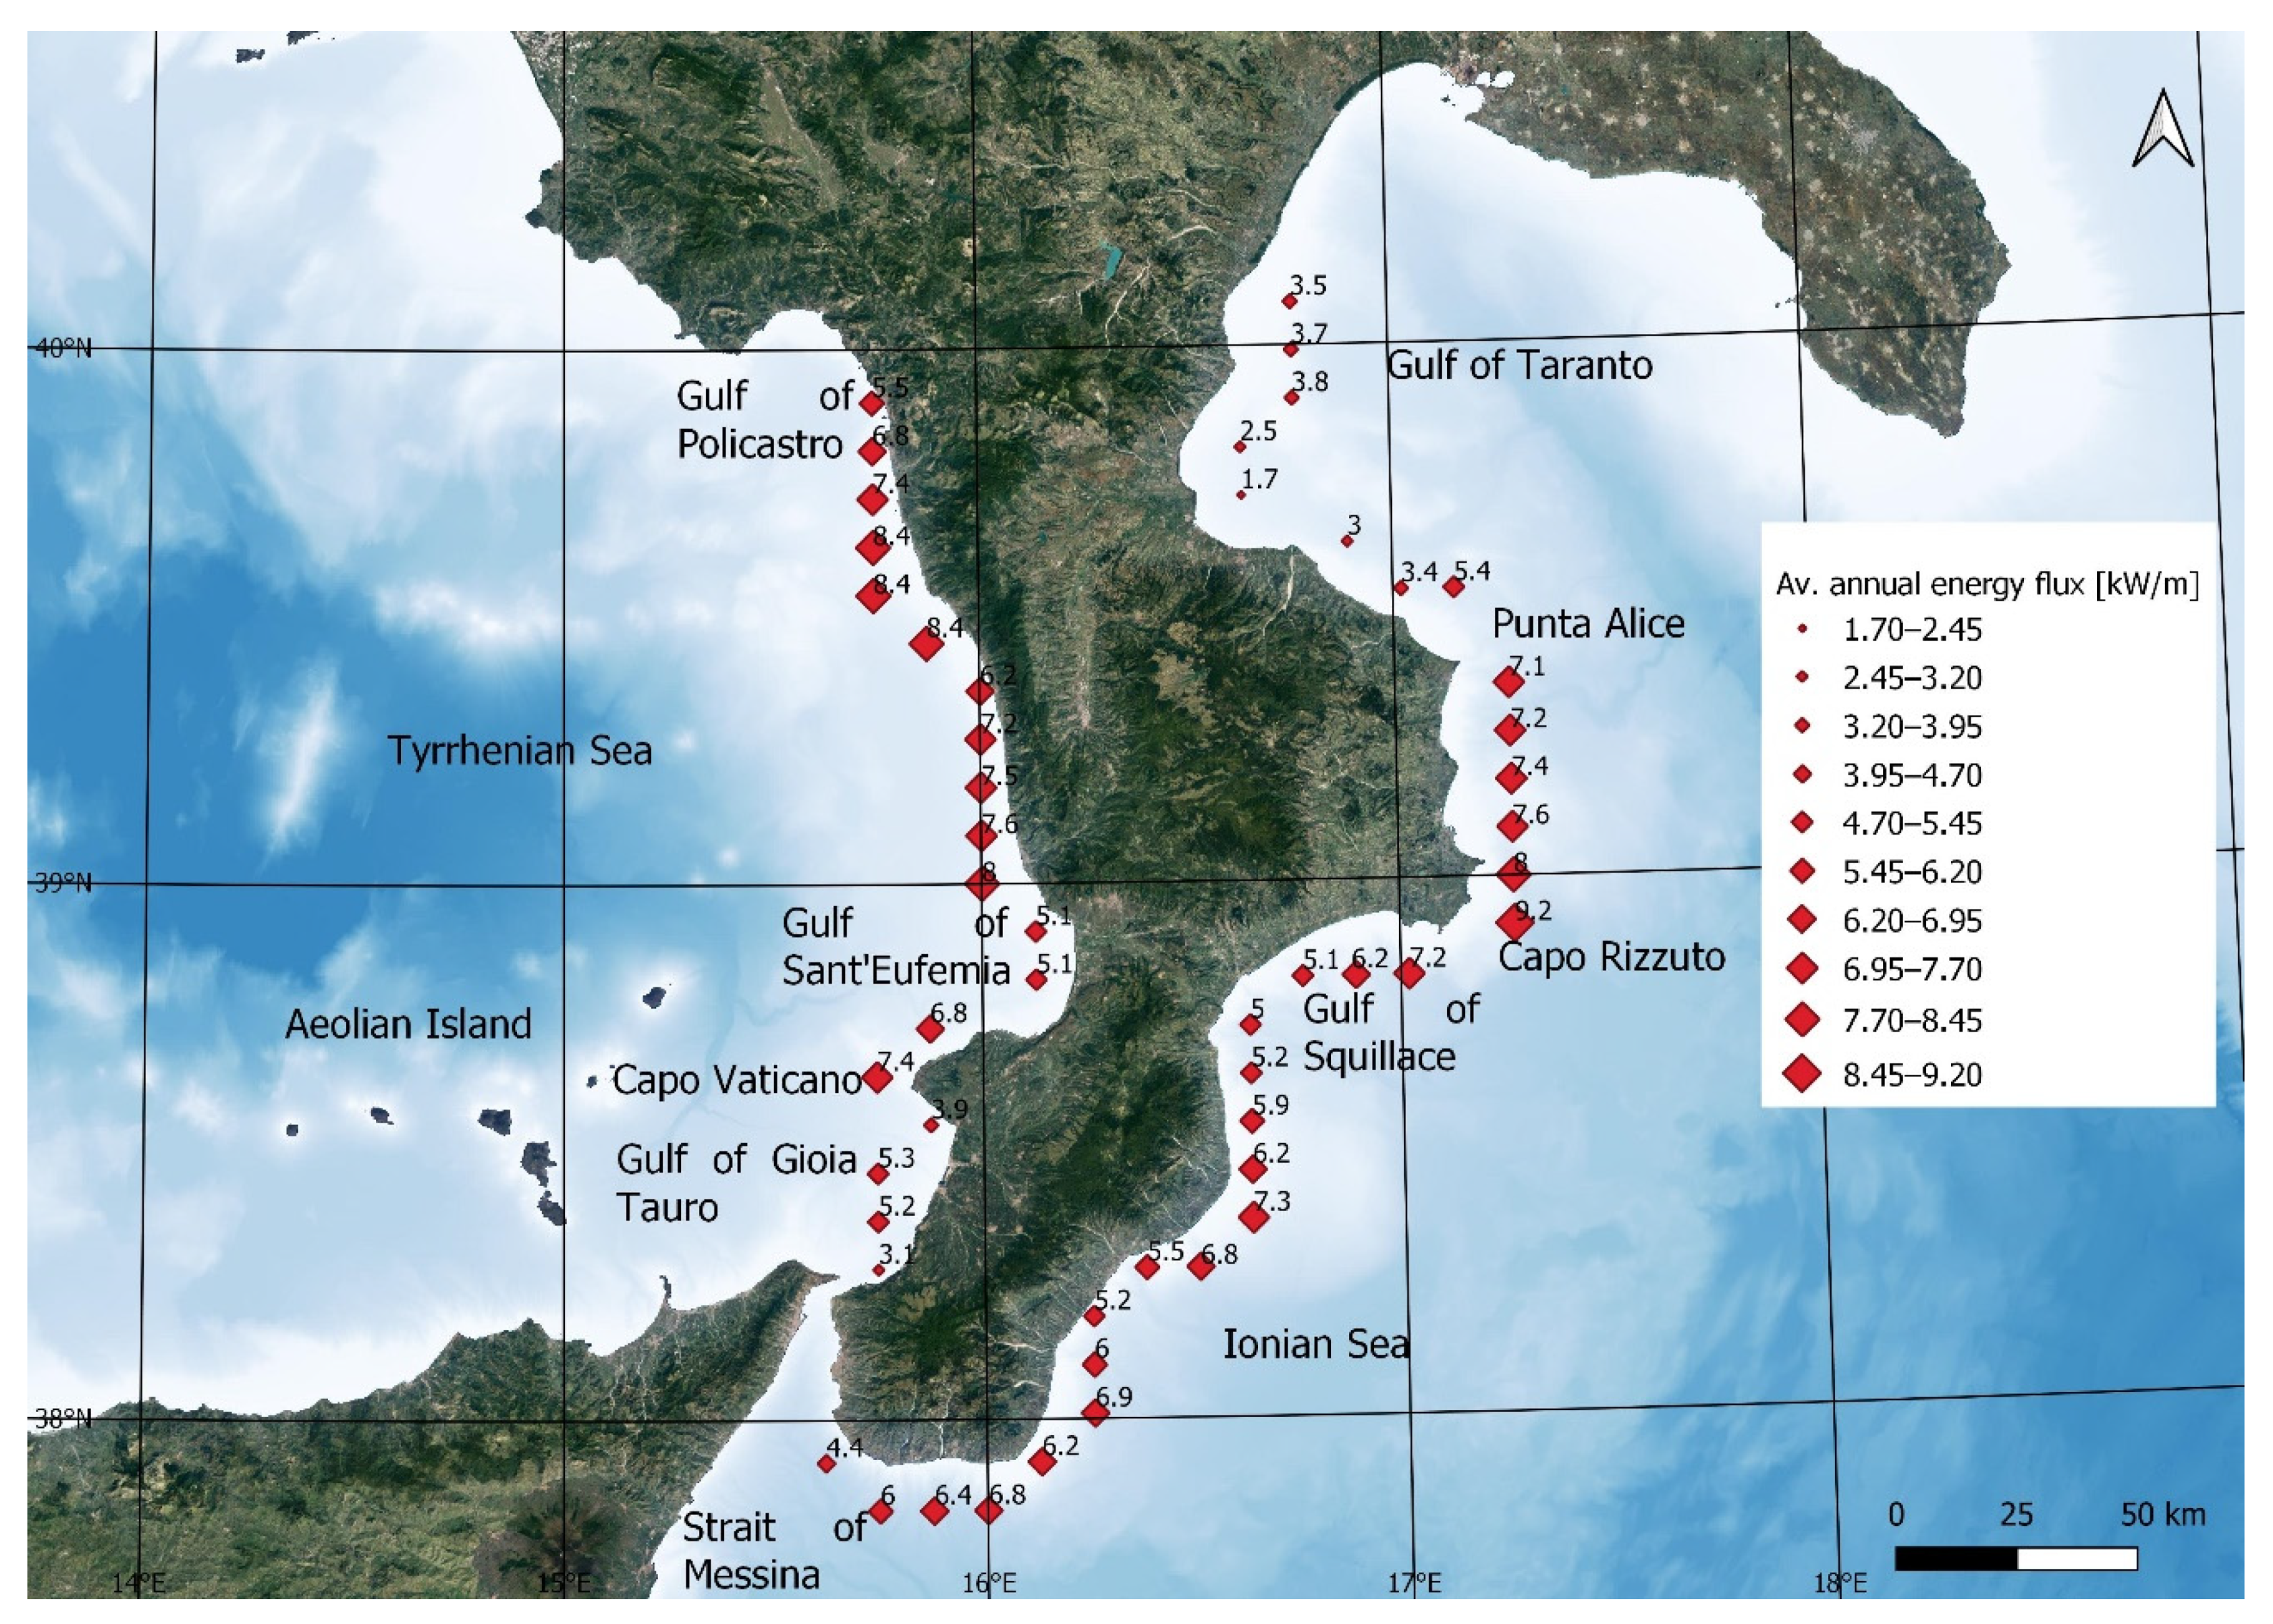
The Φt values vary from just over 1.70 kW/m at point I5 to over 9.2 kW/m at point I14. The average value is about 6.0 kW/m, and this parameter is characterized by an increasing and decreasing trend between the various points in agreement with that observed with hs,max. However, unlike this, in many cases, the Φt values reached in the two macro-areas Ionic and Tyrrhenian are similar, and the maximum value is observed in the Ionian coast. Another difference with hs,max concerns the trend between Punta Alice and Capo Rizzuto (points from I9 to I14), where hs,max decreases while Φt grows.
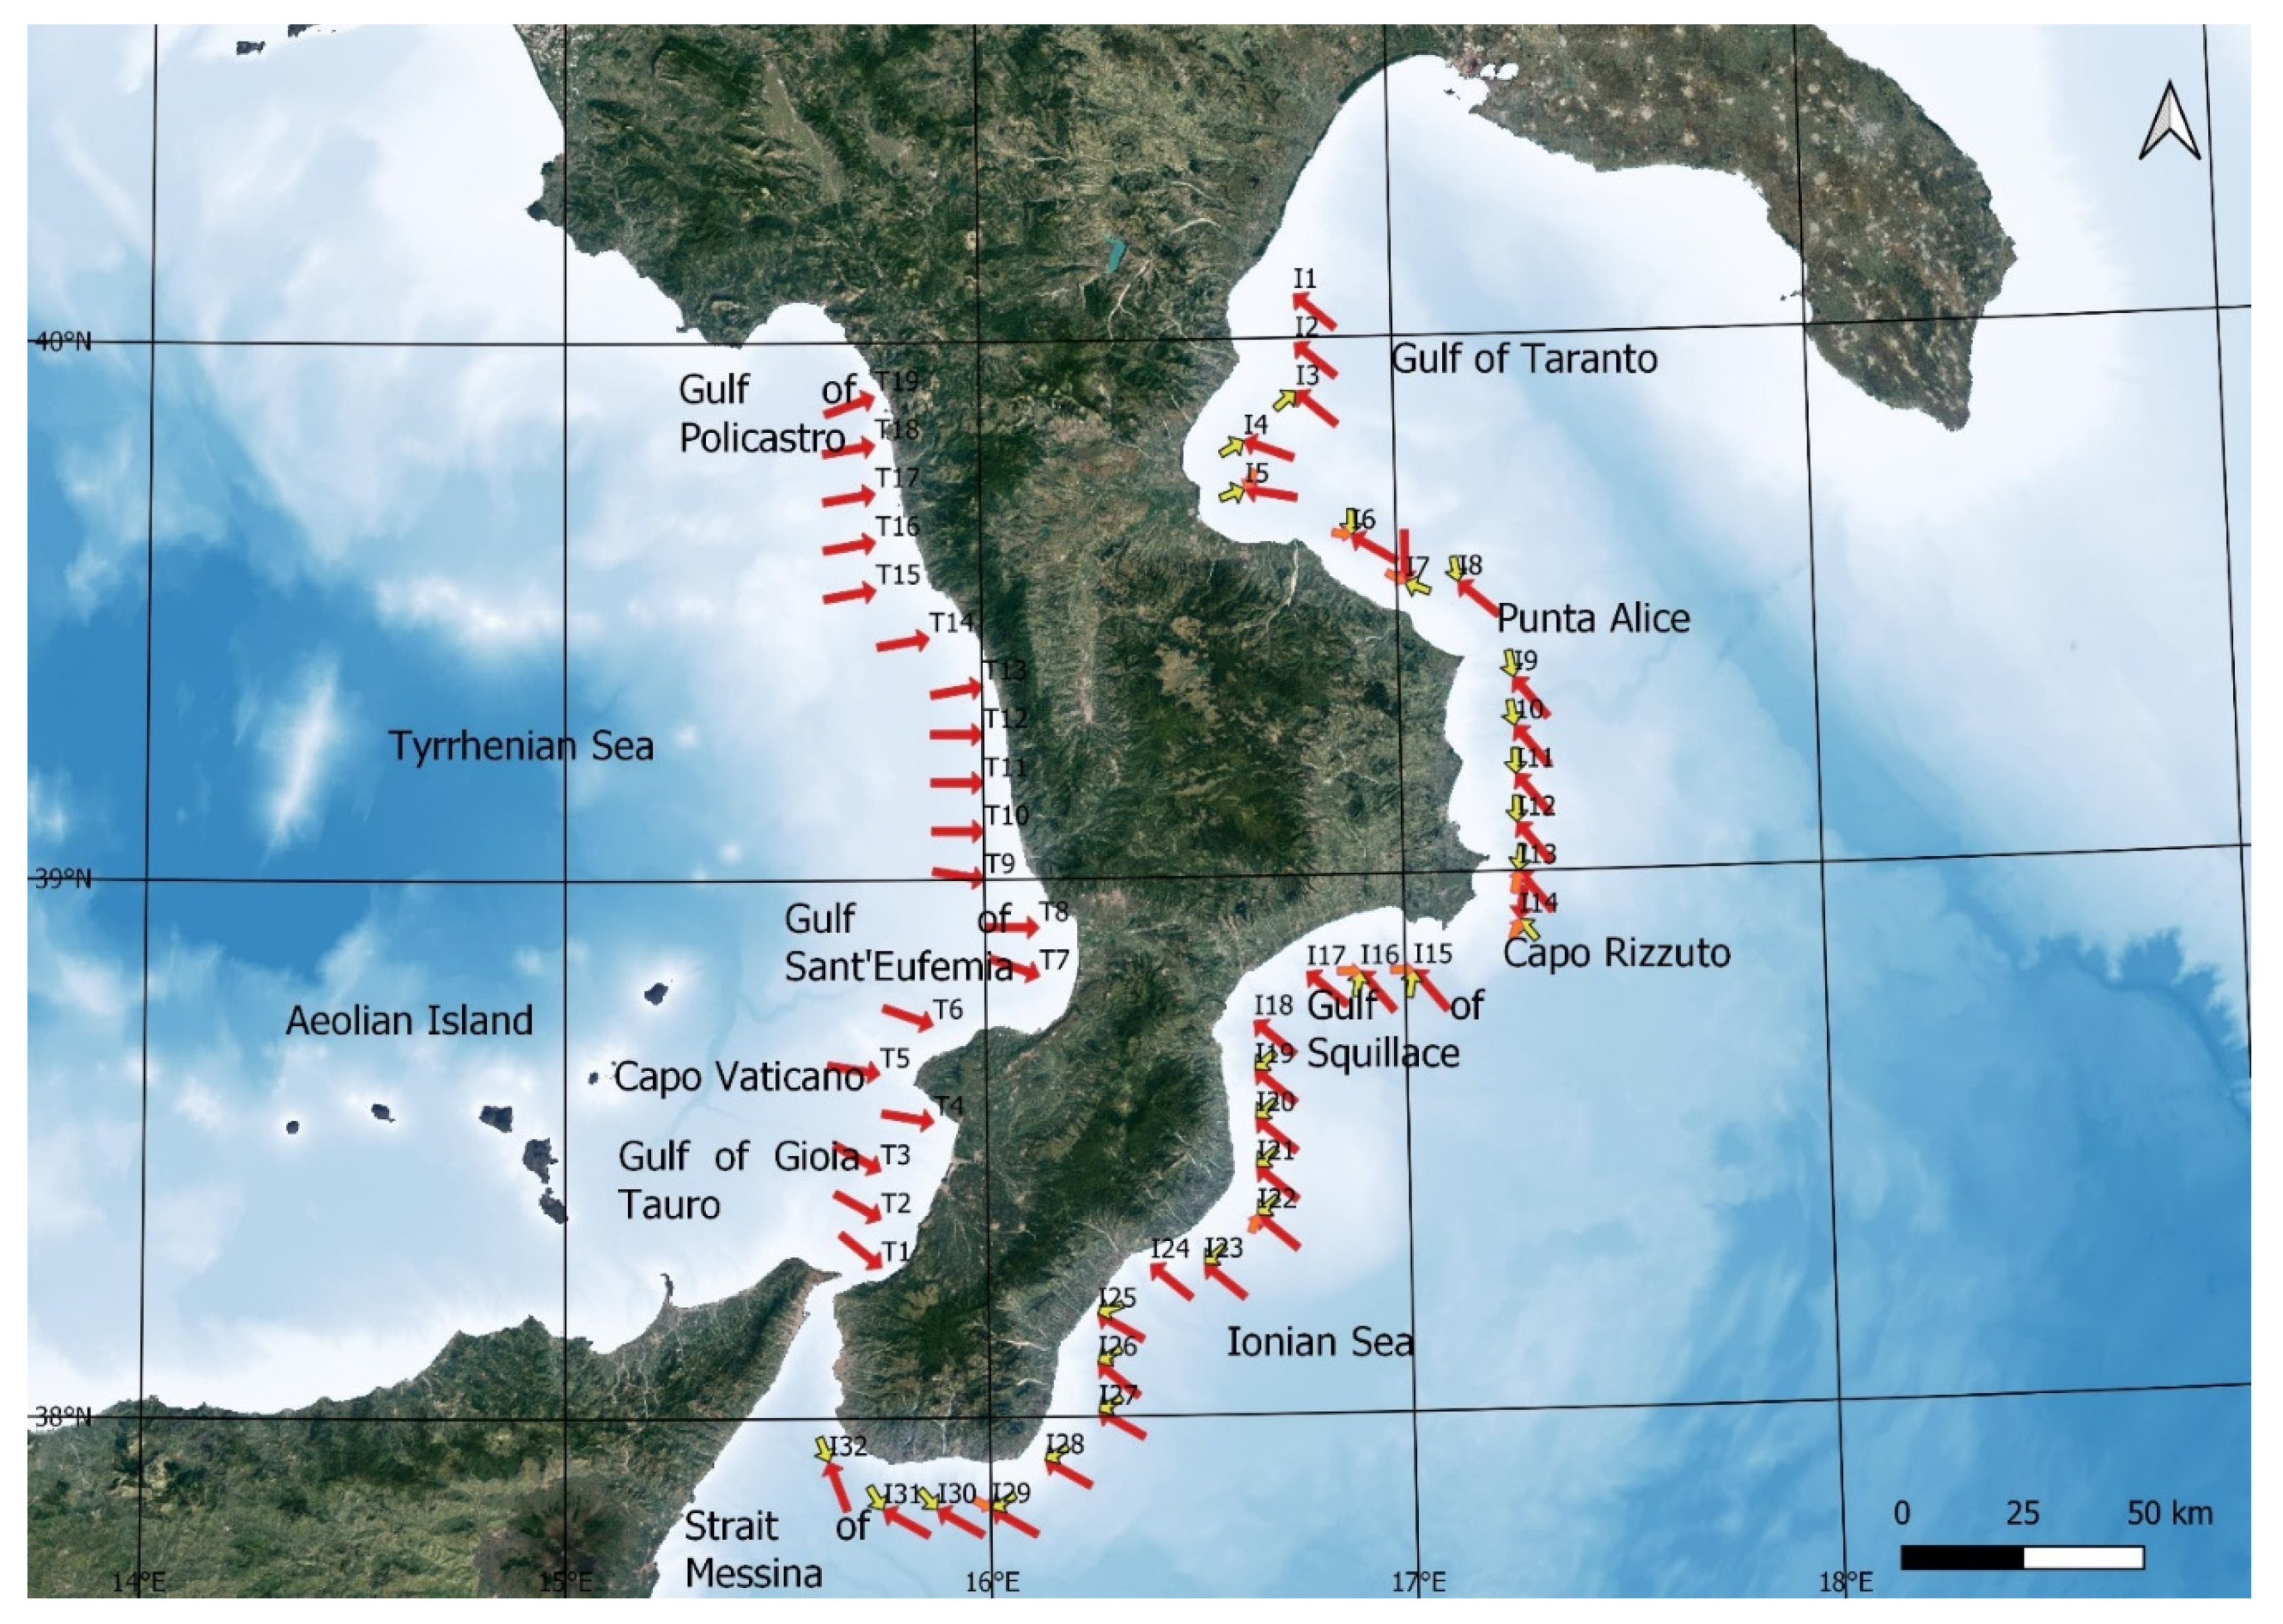
Regarding the main sectors MS, in the Ionian coast, they generally come from the south-east directions, from sectors between 100 and 140° to the north. Exceptions are point I32, at the southern mouth of the Strait of Messina, where the main sector MS comes from 160° to the north, and points I7, near the mouth of the Gulf of Taranto, and I14, both characterized from main sectors MS coming from the north direction.
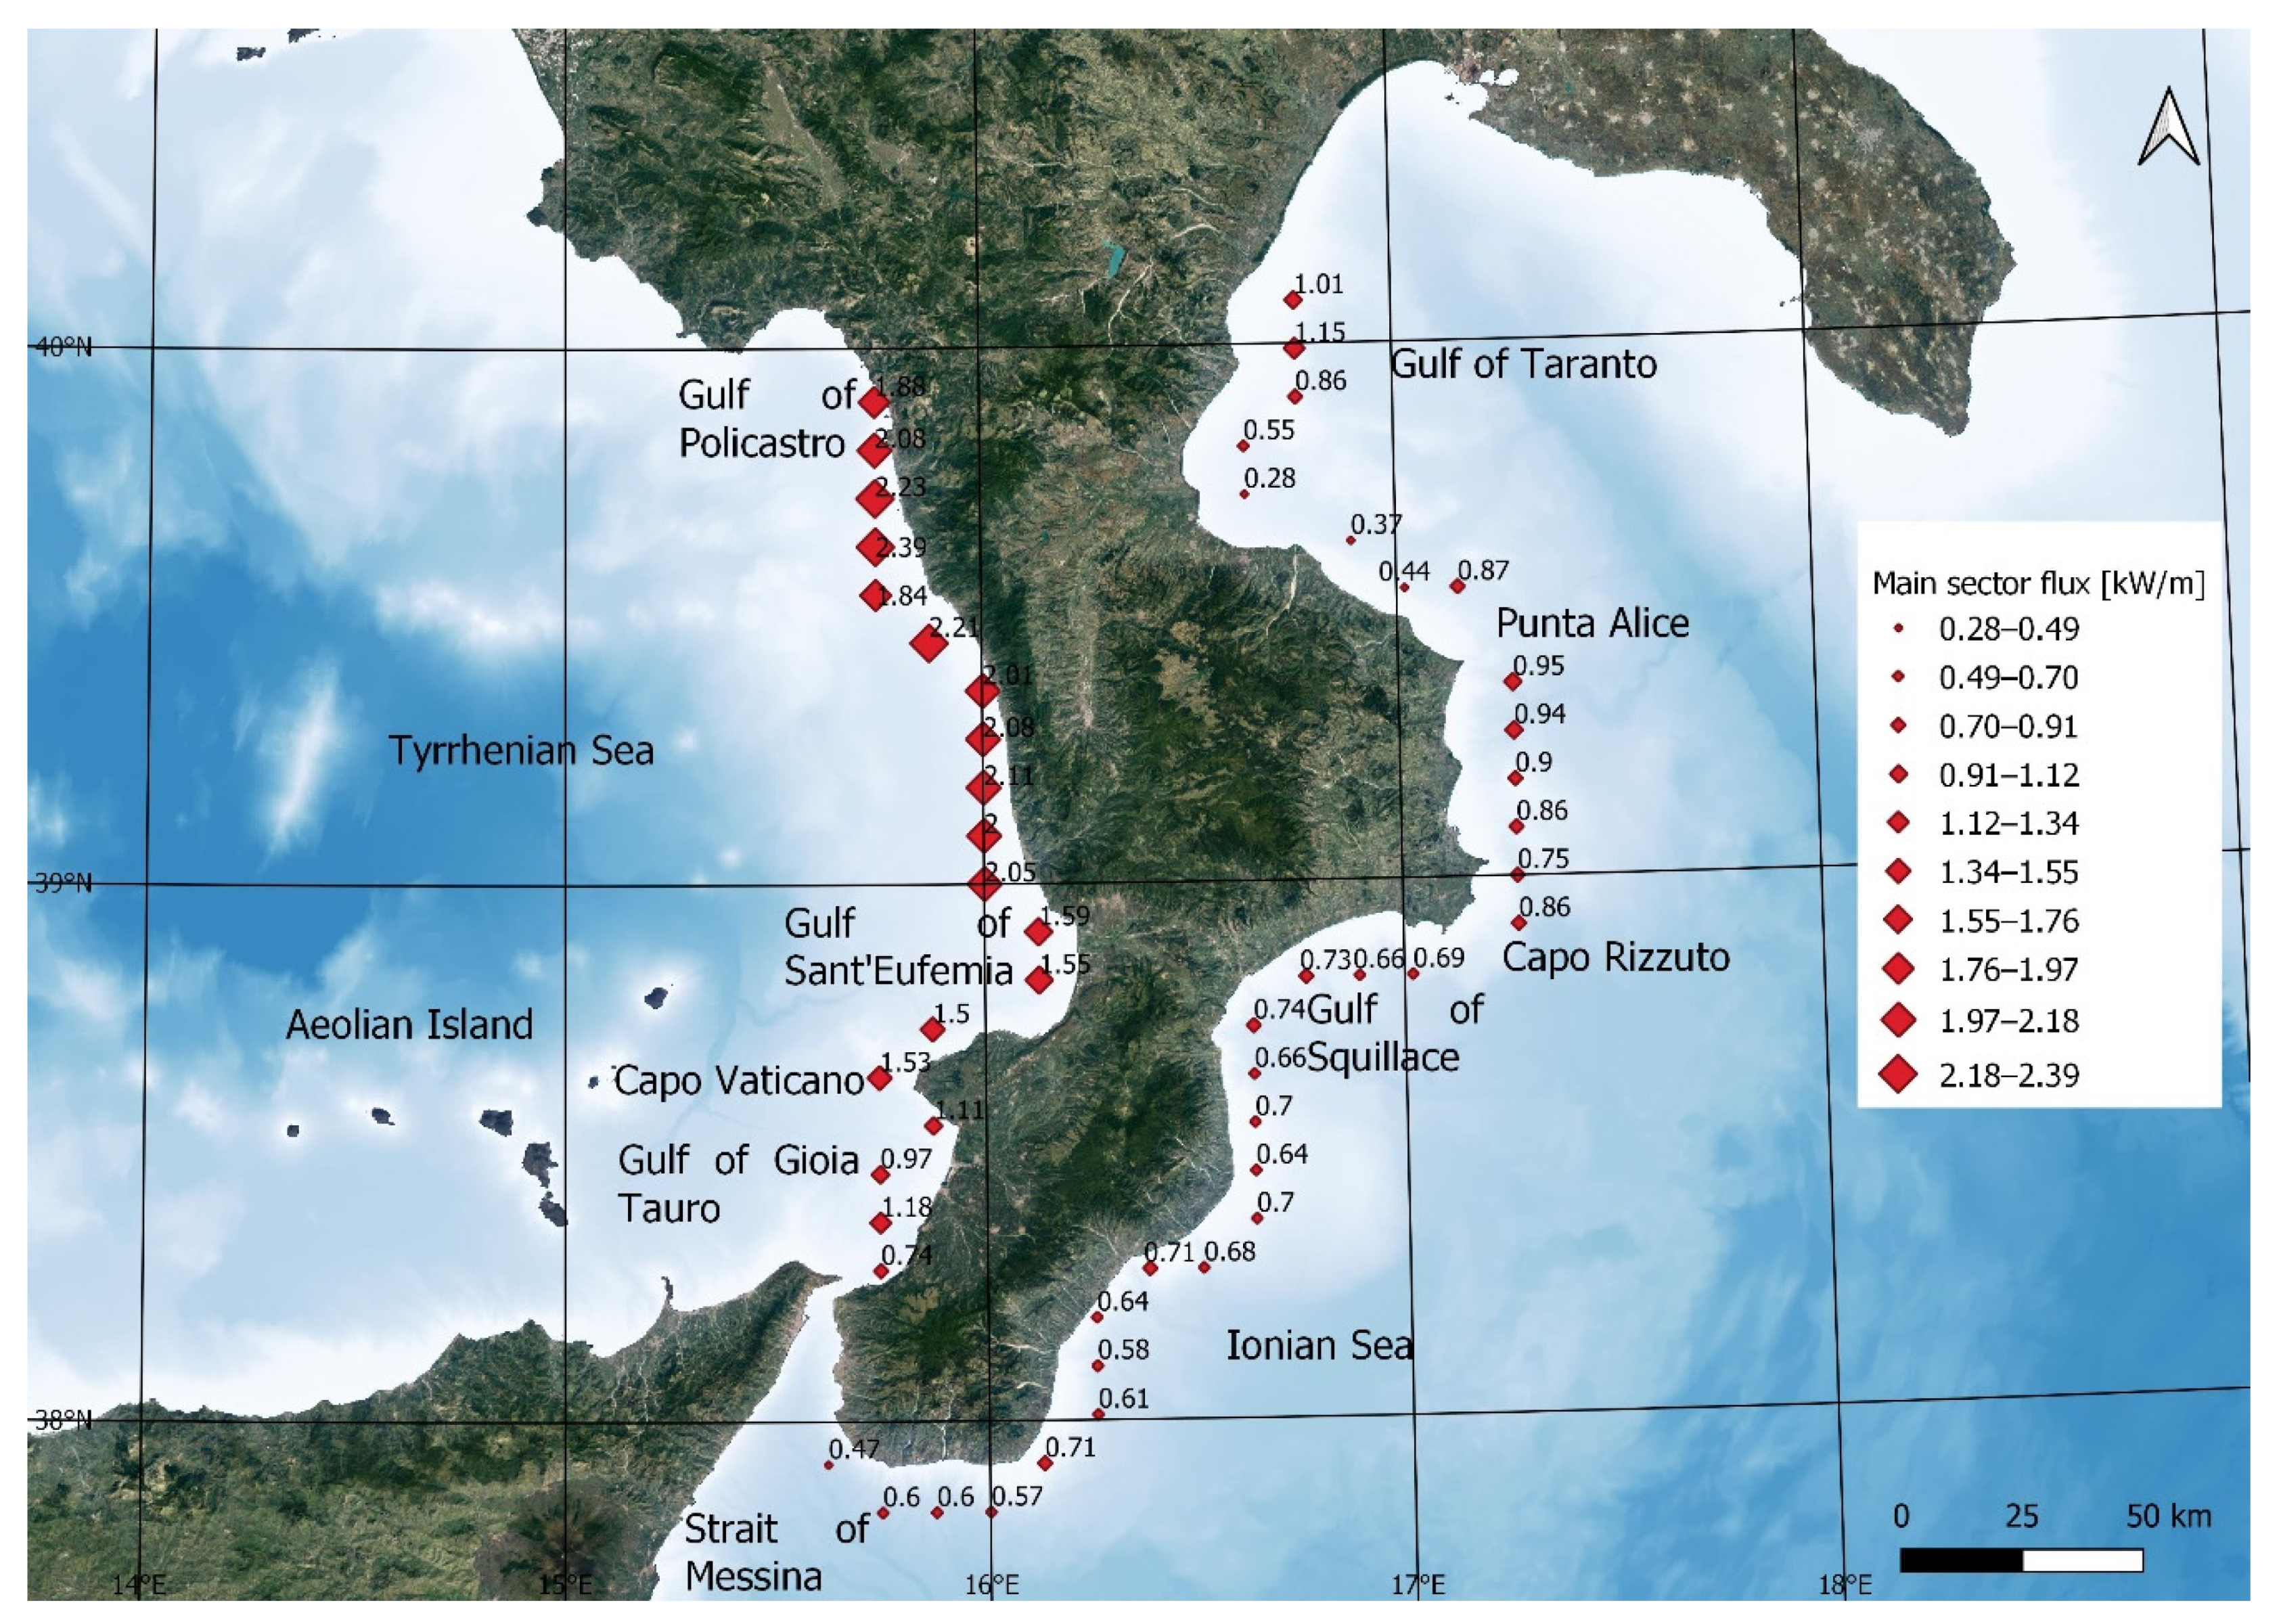
The ΦMS values vary between just under 0.30 kW/m at point I5, to about 2.4 kW/m at point T16, located in the northern Tyrrhenian Sea. The average value is about 1.10 kW/m; the higher values are in the Tyrrhenian coast, and the variations of its values between the various points are very different from those of the previous parameters. In fact, in the Ionian coast, the ΦMS values are always lower than 1.00 kW/m, except for points I1 and I2 located in the northern part of the Gulf of Taranto, and only at points I9, I10 and I11, all located near Punta Alice, do the ΦMS values exceed 0.90 kW/m. Instead, in the Tyrrhenian coast the ΦMS values are always higher than 1.00 kW/m, and often, they are higher than 2.00 kW/m, except for points T1, located at the northern mouth of the Strait of Messina, and T3, located in the Gulf of Gioia Tauro.
Regarding the secondary sectors SS, they are totally absent in the Tyrrhenian coast, while they are almost always present in the Ionian coast, except for points I1 and I2, I17 and I18, located in the Gulf of Squillace, and I24, located in the southern part of the Ionian Sea. The secondary sectors SS are characterized by a considerable variability of directions. Most of them come from the east or the north directions, while the others come from the south, south-west, south-east, and north-west directions.
The ΦSS values vary between just under 0.20 kW/m at point I19, located in the central part of the Ionian coast, to over 0.80 kW/m at point I12, located between Punta Alice and Capo Rizzuto. The average value is 0.45 kW/m.
Regarding the tertiary sectors TS, they are present in just nine points, almost all located at the southern mouth of the Gulf of Taranto and around Capo Rizzuto.
The ΦTS values vary between just under 150 N/s at point I5, and 550 N/s at point I14.
The values of the ratio ΦMS/Φt vary between 9% at points I13 and I14, both located near Capo Rizzuto, I27, I29 and I30, all in the southern part of the Ionian Sea, and 34% at point T19, located in the Gulf of Policastro. The average value is 18%, and significant differences are observed between the two macro areas. In fact, in the Ionian coast, the ΦMS/Φt values are always between 9 and 15%, except for the points in the Gulf of Taranto, which reach up to about 30%. On the other hand, in the Tyrrhenian coast, the ΦMS/Φt values are always higher than 20%, except for point T3.
Regarding the characteristic parameters, it is observed that u varies between 0.87 at point T1, and 1.15 at point I14. The average value is 1.02, and the values observed in the Tyrrhenian coast are generally lower than those in the Ionian coast. The parameter w varies between 0.4 m at point T1, and 0.9 at point I14. The average value is 0.64, and the highest values are observed between Punta Alice and Capo Rizzuto. Parameter a10 varies between just over 2.2 m at point I5, and about 4 m at point T9. The average value is about 3.4 m, the lower values are observed in the Gulf of Taranto, and no substantial differences are observed between the two macro areas. The parameter b10 varies between just under 60 h at point I5, and about 90 h at point I24. The average value is about 80 h and the variations between the various points are very similar to those of a10.
The seasonal analysis highlighted significant differences between the various seasons, the main one being that, in 36 sample areas out of 51, the hs,max,i are not reached in winter but in autumn. These areas are all those of the Tyrrhenian Sea, except point T1, and those of the Ionian Sea between points I3, located in the Gulf of Taranto, and I17 and in the points I29, I30 and I32. Furthermore, it is observed that the maximum hs,max,W values vary between 9.1 m at point T9 and 4.67 m at point I5, with an average value of 6.9 m. The values observed in the Tyrrhenian coast are generally higher than those of the Ionian coast. In fact, in the Ionian coast the maximum hs,max,W exceeds 7 m only at point I27 m, while in the Tyrrhenian coast, the maximum hs,max,W is always higher than 7 m, except at points T1 and T19. The maximum hs,max,SP values vary between 6.48 m at point T18 and 2.65 m at point I5, with an average value of 4.55 m. The values observed in the Tyrrhenian coast are always greater than those of the Ionian coast, except at point T1. The maximum hs,max,SU values vary between 5.03 m at point I22 and 2.67 m at point T1, with an average value of 4.19 m. In this case, the values observed in the Ionian coast are often similar to or higher than the Tyrrhenian one, except in the Gulf of Taranto. The maximum hs,max,A values vary between 9.82 m at point T9 and 4.91 m at point I5, with an average value of 7.22, and have a trend similar to that observed in the maximum hs,max. Instead, the hs,i values vary spatially in a homogeneous way between the various seasons, similar to hs values. The hs,W values vary between 1.21 m and 0.55 m, with an average value 0.91 m. The hs,SP values vary between 0.76 m and 0.37 m, with an average value of 0.59 m. The hs,SU values vary between 0.58 m and 0.31 m, with an average value of 0.44 m. The hs,A values vary between 1.13 m and 0.48 m, with an average value of 0.84 m. In all these cases, the maximum values are observed at point I14, and the minimum values are observed at point I5. From an energy flux point of view, most of the average seasonal flux Φt,i is observed in winter, between 39 and 44% of the average annual one, followed by autumn, where there is between 33 and 38% of the average annual one. On the other hand, in the spring, an average flux between 12 and 19% of the average annual one is observed, while in the summer, an average flux between 5 and 9% of the average annual one is observed. In all these cases, there are no significant differences between the Ionian and Tyrrhenian coasts. The minimum seasonal average Φt,i values are always observed at point I5, similarly to the average annual flux. Instead, the winter and autumn seasonal maximum Φt,i values are always observed at point I9, similarly to the average annual flux, while the spring and summer maximum Φt,i values are observed at points T16 and T15, respectively. Finally, regarding the seasonal main sectors MSi, in the Tyrrhenian coast the MSi are the same as the MS ones, with differences of only a few degrees. Instead, in the Ionian coast, only the main winter, spring and autumnal sectors are the same as the MS ones or differ by a few degrees, except at points I5 and I6 in spring and I7 and I14 in autumn. On the other hand, the main summer sectors often considerably differ from the MS ones. In fact, the MS always come from the south-east while the summer ones come from a range of directions between west and north-east.
4. Discussion
In the Results section, the values of each analyzed parameters were described in detail, together with their spatial variations between the various points, but each parameter was analyzed individually. Instead, in this section, a cross analysis of the analyzed parameters will be carried out, also considering the Calabrian peculiarities. Indeed, Calabria represents an interesting case study due to its climatic and geomorphological peculiarities and due to the anthropic action that has affected many coastal and river areas. Indeed, in the second half of the last century, after the end of the Second World War, many of the Calabrian inhabited centers considerably expanded, especially near the sea often in place of beaches and coastal dunes, and especially in the Northern Tyrrhenian coast, between the points T9 and T19. The main effects of these anthropogenic pressures were the triggering of intense coastal erosion processes, the retreats at the mouths of many rivers due to reduced river sediment transport caused by anthropogenic action, and the construction of numerous coastal defenses works. [46,50,71,72,73,74,75,76]. The anthropization process is more present on the Tyrrhenian coast than on the Ionian one. This can be related to the morphological peculiarities of these coasts. Indeed, the northern Calabrian Tyrrhenian coast, between the points T9 and T19, is characterized by a mountainous relief very close to the coast with few flat coastal areas. Therefore, the inhabited centers have expanded close to the coast. On the other hand, on the Ionian coast, there is generally a greater distance between the coast and the reliefs, so several inhabited centers have been built away from the coast, often behind the existing dunes. Furthermore, many infrastructures and archaeological sites are located a short distance from the coastline and are exposed to the wave action with frequent damaging events [77,78,79]. Among the main events, it is highlighted that which occurred between the end of October and the beginning of November 2015, where a TLC caused heavy rains and intense sea storms in the central-southern Ionian Calabria, causing the collapse of the road and railway bridges located near the mouth of the Bruzzano River near the point I28 [59,80]. The action of the sea storms also caused damage to the archaeological site of Kaulon during the winter of 2013–2014, in which a part of the dune where the archaeological site is located collapsed [49,81]. Finally, the case of Scilla should be mentioned. This is a pocket beach with an inhabited center on the back, located at the northern mouth of the Strait of Messina near point T1 and subject to frequent sea storms that flood part of the inhabited center almost annually [24].
One of the main differences between Ionian and Tyrrhenian macro-areas concerns the considerable spatial variability of the various parameters within the Ionian area, while the Tyrrhenian area is more homogeneous, with significant spatial variations of the various parameters only within the gulfs and near the north mouth of the Strait of Messina. These differences can be related to the differences in morphology, exposure to atmospheric disturbances and fetch lengths between the two macro-areas. In fact, the morphology of the Tyrrhenian coasts is generally linear, with gulfs of modest size and with only the promontory of Capo Vaticano to interrupt the linearity of the coast. Furthermore, the Tyrrhenian coasts are exposed to atmospheric disturbances coming almost only from the north-west directions, acting on fetches of lengths always of the order of hundreds of kilometers. On the other hand, the Ionian coasts have an irregular morphology, with very extensive gulfs, especially that of Taranto, which involve very variable fetch lengths. In addition, atmospheric disturbances do not come from a single direction but from varying directions, mainly between north-east and south-east.
Another relevant difference between the two coasts is observed in the values of maximum significant wave height hs,max (Figure 3), of average significant wave height hs (Figure 4), of significant wave height of return period of 1 year hs1 (Figure 5), and of significant wave height of return period of 100 years hs100 (Figure 6), where the last two parameters are associated with frequent and extreme events, respectively. In detail, the greatest values of hs,max are observed in the Tyrrhenian coast. A similar situation is also observed for hs100, corresponding to extreme events. However, these differences are not observed in terms of hs and hs1, corresponding to frequent events. In fact, the highest values of hs are observed in the Ionian coast, while the highest values of hs1 observed in the two macro-areas are very similar to each other. All this is also highlighted in the analysis of the characteristic parameters. In fact, the parameter u, which shows how the significant wave heights vary as the return period varies and is inversely proportional to their ratio, is generally lower in the Tyrrhenian coast than in the Ionian coast. Instead, the parameter w, which is also called the scale factor and is directly proportional to the values of significant wave height, is generally greater in the Ionian coast than in the Tyrrhenian coast. The most intense combination is that of low u and high w, as it means that the significant wave height values are high, and they increase significantly as the return period increases. Furthermore, the parameter a10, which represents the average value of the maximum significant wave heights of the sample consisting of the more than 400 most intense MTEs (equal to 10 for the number of years of data, as defined above), is very similar between the two macro-areas. On the other hand, the parameter b10, which represents the average value of the durations of the more than 400 most intense MTEs, as defined above, is generally greater in the Ionian Sea. So, the sea storms of the Ionian Sea are generally more persistent than the Tyrrhenian ones. This confirms that, in the Ionian coast, frequent events are often more intense than in the Tyrrhenian coast, while in the Tyrrhenian coast, the significant wave heights increase more as the return period increases, so rare events are generally shorter and more intense than in the Ionian coast.
Even from the point of view of the wave energy content, the two coasts are very different. In fact, the highest values of the total energy flux Φt (Figure 7) are observed in the Ionian coast. On the other hand, the values of energy flux of the main sector ΦMS (Figure 8) observed in the Tyrrhenian coast are generally much greater than those observed in the Ionian coast. Furthermore, the main sectors of the Tyrrhenian coast are all associated with directions coming from the west and the north-west, with small variations between one point and another. On the other hand, in the Ionian coast, the main sectors are associated with directions coming from both the north and the south-east, with considerable variations between one point and another. Additionally, the secondary and tertiary sectors often have energy flux values ΦSS and ΦTS slightly lower than ΦMS. In addition to this, it is highlighted that in no Tyrrhenian points are there secondary and tertiary sectors (Figure 9). Therefore, even from a wave energy content point of view, the Tyrrhenian coast is more homogeneous than the Ionian coast. In fact, in the Tyrrhenian Sea, the wave motion generally comes from a narrow range of directions. Along these directions, the wave energy content is high and much greater than the Ionian Sea, but the total energy content is often lower than the Ionian Sea. Instead, the Ionian Sea is characterized by wave motion coming from a wide range of directions; however, along these directions, the wave energy content is lower than that of the Tyrrhenian. All this is also highlighted by the relationship between the main sector energy flux value and the total energy flux value ΦMS/Φt, which shows the percentage of total energy flux coming from the main sector only. In fact, in the Tyrrhenian Sea, this ratio is always higher than 20%, while in the Ionian Sea, this ratio is always lower than 15%, and the points where the lower values are observed are those characterized by the greatest total energy flux. Therefore, in these points, the total energy content is high but disperses along various directions. The points located in the northern part of the Gulf of Taranto are an exception, where the ratio ΦMS/Φt is higher than 20% as in the Tyrrhenian Sea. In fact, due to the morphology of the coast, in these points, the intense wave motion can only come from the south-east directions, from the mouth of the Gulf, as the other directions are characterized by modest fetch extensions.
The seasonal analysis showed that, in autumn in most of the Calabrian coasts, except for the Gulf of Taranto and the southern Ionian coast, the maximum values of significant wave height hs,max are higher than in winter. This phenomenon is related to the high sea water temperature in the autumn months that favors the formation of TLC. Another important result of the seasonal analysis is that, in almost the entire Ionian coast, the hs,max values in the summer are similar to or greater than in the spring, while in the Tyrrhenian, this is not the case. Therefore, the seasonal variations of hs,max are much greater in the Tyrrhenian coast than in the Ionian coast. Consequently, the danger of the Tyrrhenian Sea about wave climate is generally limited to autumn and winter, while in the Ionian Sea, it is extended to the whole year. Furthermore, in many parts of the Ionian Sea, the main summer sectors MS are very different from those of the other seasons and are often associated with directions coming from the west and the north-west. However, it is a wave motion not directed from sea to land but, vice versa, directed from land to sea and generated by winds acting on the Tyrrhenian Sea that cross the mountain reaching the Ionian coasts. This phenomenon is most evident in the plains of Sibari, Lamezia and Gioia Tauro and at the southern mouth of the Strait of Messina. Furthermore, the particularities of two coastal areas should be highlighted. The first area is between the promontories of Punta Alice and Capo Rizzuto, and the second area is in the innermost part of the Gulf of Taranto, near point I5. In the first area, many parameters reach the highest values of the whole Ionian coast and, in the case of the total energy flux Φt, reach the highest values of the whole of Calabria. All this can be mainly related to the geographical position of this area, which is the easternmost point of Calabria and is exposed to fetches of the order of hundreds of kilometers along most directions, including those coming from the Gulf of Taranto. On the other hand, in the second area, almost all the analyzed parameters reach the lowest values of the whole of Calabria. Additionally, in this case, all this can be mainly related to the geographical position of this area, for which the fetches have modest lengths along most directions.
The results obtained are fairly in line with those obtained by analyzing the time series recorded by the two buoys of the National Wave Network (RON) present in Calabria. One buoy is in Crotone, on the Ionian Sea near point I13, and another buoy is in Cetraro, in the Tyrrhenian Sea near point T14. Both buoys are characterized by shorter time series than those analyzed, equal to 25 years in Crotone and 15 years in Cetraro, with the latest recording available in 2014 in both buoys. In particular, the maximum significant heights are about 0.5 m lower, and the average heights are about 0.1 m lower than those calculated in the present analysis.
Finally, a comparison was made between this analysis and the main analysis carried out along the Calabrian coast by Barbaro [82], Ferraro et al. [83] and Caloiero et al. [84]. In that of Barbaro, the wave climate was analyzed in 24 points, less than half of the present analysis, with a less extended time series, 20 years, and considering only four parameters. In the study by Ferraro et al., the wave climate was analyzed in several points like that of the present analysis but considering a time series of just over 20 years and estimating only the annual and seasonal energy potential. The study by Caloiero et al. followed that of Ferraro et al., also analyzing significant wave height and energy period and extending the time series to about 40 years. Therefore, the analysis described in this paper is characterized by a spatial and temporal level of detail and by a greater number of parameters analyzed than in the main previous analysis carried out in Calabria.
5. Conclusions
This paper described an analysis of the wave climate carried out along the Calabrian coasts. Calabria is a region of the Southern Italy that represents an interesting case study due to its high coastal length, over 700 km, and due to its geomorphological and climatic complexity. Calabria is enclosed by two seas, Ionian and Tyrrhenian, and is characterized by various gulfs and promontories that cause considerable variability in terms of fetch length and wave climate. The analysis described in the paper was carried out in over 50 sample areas, each of them covering an average of 15 km of coastline, by examining over 40 years of wave data and about 20 wave parameters representative of annual and seasonal average and maximum wave conditions. This analysis mainly highlighted that the two Ionian and Tyrrhenian coasts are very different from the wave climate point of view. Indeed, the average and frequent wave conditions are slightly higher in the Ionian coast, while the exceptional wave conditions are much greater in the Tyrrhenian coast. Furthermore, in the Tyrrhenian Sea, the intense wave conditions are concentrated along a few directions, coming mainly from the north-west, and there are no secondary and tertiary sectors. Instead, in the Ionian Sea, the intense wave conditions can come from different directions, varying between north-east and south-east, and in different locations, there are secondary and tertiary sectors. Another difference between the two seas concerns the considerable spatial variability of the wave climate along the Ionian Sea, especially within the Gulf of Taranto and between the Punta Alice and Capo Rizzuto promontories, while the wave climate in the Tyrrhenian Sea is substantially homogeneous spatially. The seasonal analysis showed that, in autumn in most of the Calabrian coasts, except for the Gulf of Taranto and the southern Ionian coast, the maximum values of significant wave height are higher than in winter. Another important result of the seasonal analysis is that the danger of the Tyrrhenian Sea about wave climate is generally limited to autumn and winter, while in the Ionian Sea, it is extended to the whole year.
Finally, the analysis described in this paper is characterized by a spatial and temporal level of detail and by a greater number of parameters analyzed than in the main previous analysis carried out in Calabria. So, it is important to analyze the wave climate with high spatial and parametric detail, especially for complex and highly variable geomorphological and climatic conditions within closed basins and in heavily man-made territories with numerous inhabited centers, infrastructures and archaeological sites exposed to wave motion as in this case study. Furthermore, the paper is of particular interest in the fields of planning and management of the coastal areas and of design of coastal defense works.
Author Contributions
Conceptualization, G.F. and G.C.B.; methodology, G.F., G.B. (Giuseppe Barbaro), G.B. (Giovanni Besio), G.C.B., P.M. and P.P.; software, G.F. and G.C.B.; validation, G.F., G.B. (Giuseppe Barbaro), G.B. (Giovanni Besio), G.C.B., P.M. and P.P.; formal analysis, G.F. and G.C.B.; investigation, G.F. and G.C.B.; resources, G.F. and G.C.B.; data curation, G.F. and G.C.B.; writing—original draft preparation, G.F.; writing—review and editing, G.F., G.B. (Giuseppe Barbaro), G.B. (Giovanni Besio), G.C.B., P.M. and P.P.; visualization, G.F.; supervision, G.B. (Giuseppe Barbaro); project administration, G.B. (Giuseppe Barbaro); funding acquisition, G.B. (Giuseppe Barbaro) and P.M. All authors have read and agreed to the published version of the manuscript.
Funding
This research was funded by the Public Works Department of Calabria Region.
Institutional Review Board Statement
Not applicable.
Informed Consent Statement
Not applicable.
Data Availability Statement
Not applicable.
Conflicts of Interest
The authors declare no conflict of interest. The funders had no role in the design of the study; in the collection, analyses, or interpretation of data; in the writing of the manuscript, or in the decision to publish the results.
References
- Bacon, S.; Carter, D.J.T. A connection between mean wave height and atmospheric pressure gradient in the North Atlantic. Int. J. Climatol. 1993, 13, 423–436. [Google Scholar] [CrossRef]
- Young, I.R. Seasonal variability of the global ocean wind and wave climate. Int. J. Climatol. 1999, 19, 931–950. [Google Scholar] [CrossRef]
- Stewart, R.H. Introduction to Physical Oceanography; Department of Oceanography, Texas A&M University: College Station, TX, USA, 2005; p. 353. [Google Scholar] [CrossRef]
- Pecher, A.; Kofoed, J.P. Handbook of Ocean Wave Energy; Springer Open: Aalborg, Denmark, 2017; p. 305. [Google Scholar]
- Cuttler, M.V.; Hansen, J.E.; Lowe, R.J. Seasonal and interannual variability of the wave climate at a wave energy hotspot off the southwestern coast of Australia. Renew. Energy 2020, 146, 2337–2350. [Google Scholar] [CrossRef]
- Cavaleri, L.; Fox-Kemper, B.; Hemer, M. Wind waves in the coupled climate system. Bull. Am. Meteorol. Soc. 2012, 93, 1651–1661. [Google Scholar] [CrossRef]
- Cotrim, C.D.S.; Semedo, A.; Lemos, G. Brazil wave climate from a high-resolution wave hindcast. Climate 2022, 10, 53. [Google Scholar] [CrossRef]
- Dodet, G.; Bertin, X.; Taborda, R. Wave climate variability in the North-East Atlantic Ocean over the last six decades. Ocean Model. 2010, 31, 120–131. [Google Scholar] [CrossRef]
- Hemer, M.A.; Church, J.A.; Hunter, J.R. Variability and trends in the directional wave climate of the Southern Hemisphere. Int. J. Climatol. 2010, 30, 475–491. [Google Scholar] [CrossRef]
- Young, I.R.; Zieger, S.; Babanin, A.V. Global trends in wind speed and wave height. Science 2011, 332, 451–455. [Google Scholar] [CrossRef]
- Kamranzad, B. Persian Gulf zone classification based on the wind and wave climate variability. Ocean Eng. 2018, 169, 604–635. [Google Scholar] [CrossRef]
- Semedo, A. Seasonal variability of wind sea and swell waves climate along the Canary Current: The local wind effect. J. Mar. Sci. Eng. 2018, 6, 28. [Google Scholar] [CrossRef] [Green Version]
- Divinsky, B.V.; Kosyan, R.D. Spatiotemporal variability of the Black Sea wave climate in the last 37 years. Cont. Shelf Res. 2017, 136, 1–19. [Google Scholar] [CrossRef]
- Vieira, F.; Cavalcante, G.; Campos, E. Analysis of wave climate and trends in a semi-enclosed basin (Persian Gulf) using a validated SWAN model. Ocean Eng. 2020, 196, 106821. [Google Scholar] [CrossRef]
- Rapizo, H.; Godoi, V.A.; Perez, J.; Durrant, T.; Guedes, R. Analysis of the New Zealand’s Taranaki regional wave climate using high-resolution modelling. Reg. Stud. Mar. Sci. 2021, 45, 101806. [Google Scholar] [CrossRef]
- Yuksel, Y.; Yuksel, Z.T.; Islek, F.; Sahin, C.; Guner, H.A.A. Spatiotemporal long-term trends of wind and wave climate and extreme characteristics over the Sea of Marmara. Ocean Eng. 2021, 228, 108946. [Google Scholar] [CrossRef]
- Menéndez, M.; Méndez, F.J.; Losada, I.J.; Graham, N.E. Variability of extreme wave heights in the northeast Pacific Ocean based on buoy measurements. Geophys. Res. Lett. 2008, 35, 1–6. [Google Scholar] [CrossRef]
- Wang, X.L.; Feng, Y.; Swail, V.R. North lsevier wave height trends as reconstructed from the 20th century reanalysis. Geophys. Res. Lett. 2012, 39, 1–6. [Google Scholar] [CrossRef]
- Barbariol, F.; Bidlot, J.R.; Cavaleri, L.; Sclavo, M.; Thomson, J.; Benetazzo, A. Maximum wave heights from global model reanalysis. Prog. Oceanogr. 2019, 175, 139–160. [Google Scholar] [CrossRef]
- Ramos, M.S.; Farina, L.; Faria, S.H.; Li, C. Relationships between large-scale climate modes and the South Atlantic Ocean wave climate. Prog. Oceanogr. 2021, 197, 102660. [Google Scholar] [CrossRef]
- Soomere, T. Numerical simulations of wave climate in the Baltic Sea: A review. Oceanologia 2022. [Google Scholar] [CrossRef]
- Holthuijsen, L.H. Waves in Oceanic and Coastal Waters; Cambridge University Press: New York, NY, USA, 2007; p. 405. [Google Scholar]
- Barbaro, G.; Foti, G.; Nucera, A.; Barillà, G.C.; Canale, C.; Puntorieri, P.; Minniti, F. Risk mapping of coastal flooding areas. Case studies: Scilla and Monasterace (Italy). Int. J. Saf. Secur. Eng. 2020, 10, 59–67. [Google Scholar] [CrossRef]
- Lemee, C.; Navarro, O.; Restrepo-Ochoa, D.; Mercier, D.; Fleury-Bahi, G. Protective behaviors regarding coastal flooding risk in a context of climate change. Adv. Clim. Chang. Res. 2020, 11, 310–316. [Google Scholar] [CrossRef]
- Fiori, E.; Comellas, A.; Molini, L.; Rebora, N.; Siccardi, F.; Gochis, D.J.; Tanelli, S.; Parodi, A. Analysis and hindcast simulations of an extreme rainfall event in the Mediterranean area: The Genoa 2011 case. Atmos. Res. 2014, 138, 13–29. [Google Scholar] [CrossRef] [Green Version]
- Zellou, B.; Rahali, H. Assessment of the joint impact of extreme rainfall and storm surge on the risk of flooding in a coastal area. J. Hydrol. 2019, 569, 647–665. [Google Scholar] [CrossRef]
- Dissanayake, P.; Brown, J.; Wisse, P.; Karunarathna, H. Comparison of stormcluster vs isolated event impacts on beach/dune morphodynamics. Estuar. Coast. Shelf Sci. 2015, 164, 301–312. [Google Scholar] [CrossRef] [Green Version]
- Barbaro, G.; Petrucci, O.; Canale, C.; Foti, G.; Mancuso, P.; Puntorieri, P. Contemporaneity of floods and storms. A case study of Metropolitan Area of Reggio Calabria in Southern Italy. In Proceedings of the 3rd International Symposium New Metropolitan Perspectives (ISTH2020), Reggio Calabria, Italy, 22–25 May 2018; Smart Innovation, Systems and Technologies, 2019. Volume 101, pp. 614–620. [Google Scholar] [CrossRef]
- Canale, C.; Barbaro, G.; Petrucci, O.; Fiamma, V.; Foti, G.; Barillà, G.C.; Puntorieri, P.; Minniti, F.; Bruzzaniti, L. Analysis of floods and storms: Concurrent conditions. Ital. J. Eng. Geol. Environ. 2020, 1, 23–29. [Google Scholar] [CrossRef]
- Almar, R.; Kestenare, E.; Reyns, J.; Jouanno, J.; Anthony, E.; Laibi, R.; Hemer, M.A.; du Penhoat, Y.; Ranasinghe, R. Response of the Bight of Benin (Gulf of Guinea, West Africa) coastline to anthropogenic and natural forcing, Part 1: Wave climate variability and impacts on the longshore sediment transport. Cont. Shelf Res. 2015, 110, 48–59. [Google Scholar] [CrossRef]
- Montreuil, A.L.; Chen, M.; Elyahyioui, J. Assessment of the impacts of storm events for developing an erosion index. Reg. Stud. Mar. Sci. 2017, 16, 124–130. [Google Scholar] [CrossRef]
- Kroon, A.; de Schipper, M.A.; van Gelder, P.H.A.J.M.; Aarninkhof, S.G.J. Ranking uncertainty: Wave climate variability versus model uncertainty in probabilistic assessment of coastline change. Coast. Eng. 2020, 158, 103673. [Google Scholar] [CrossRef]
- Dada, O.A.; Qiao, L.; Ding, D.; Li, G.; Ma, Y.; Wang, L. Evolutionary trends of the Niger Delta shoreline during the last 100 years: Responses to rainfall and river discharge. Mar. Geol. 2015, 367, 202–211. [Google Scholar] [CrossRef]
- Acciarri, A.; Bisci, C.; Cantalamessa, G.; Di Pancrazio, G. Anthropogenic influence on recent evolution of shoreline between the Conero Mt. and the Tronto, R. mouth (southern Marche, Central Italy). Catena 2016, 147, 545–555. [Google Scholar] [CrossRef]
- Smith, E.R.; D’Alessandro, F.; Tomasicchio, G.R.; Gailani, J.Z. Nearshore placement of a sand dredged mound. Coast. Eng. 2017, 126, 1–10. [Google Scholar] [CrossRef]
- Tomasicchio, G.R.; D’Alessandro, F.; Frega, F.; Francone, A.; Ligorio, F. Recent improvements for estimation of longshore transport. Ital. J. Eng. Geol. Environ. 2018, 1, 179–187. [Google Scholar]
- Barbaro, G.; Bombino, G.; Foti, G.; Borrello, M.M.; Puntorieri, P. Shoreline evolution near river mouth: Case study of Petrace River (Calabria, Italy). Reg. Stud. Mar. Sci. 2019, 29, 100619. [Google Scholar] [CrossRef]
- Foti, G.; Barbaro, G.; Bombino, G.; Fiamma, V.; Puntorieri, P.; Minniti, F.; Pezzimenti, C. Shoreline changes near river mouth: Case study of Sant’Agata River (Reggio Calabria, Italy). Eur. J. Remote Sens. 2019, 52, 102–112. [Google Scholar] [CrossRef]
- Ngowo, R.G.; Ribeiro, M.C.; Pereira, M.J. Quantifying 28-year (1991–2019) shoreline change trends along the Mnazi Bay–Ruvuma Estuary Marine Park, Tanzania. Remote Sens. Appl. Soc. Environ. 2021, 23, 100607. [Google Scholar] [CrossRef]
- Komar, P.D. Coastal erosion—Underlying factors and human impacts. Shore Beach 2000, 68, 3–16. [Google Scholar]
- Dada, O.A.; Li, G.; Qiao, L.; Asiwaju-Bello, Y.A.; Anifowose, A.Y.B. Recent Niger Delta shoreline response to Niger River Hydrology: Conflicts between forces of Nature and Humans. J. Afr. Earth Sci. 2018, 139, 222–231. [Google Scholar] [CrossRef]
- Ozpolat, E.; Demir, T. The spatiotemporal shoreline dynamics of a delta under natural and anthropogenic conditions from 1950 to 2018: A dramatic case from the Eastern Mediterranean. Ocean Coast. Manag. 2019, 180, 104910. [Google Scholar] [CrossRef]
- Anthony, E.J.; Almar, R.; Besset, M.; Reyns, J.; Laibi, R.; Ranasinghe, R.; Abessolo Ondoa, G.; Vacchi, M. Response of the Bight of Benin (Gulf of Guinea, West Africa) coastline to anthropogenic and natural forcing, Part 2: Sources and patterns of sediment supply, sediment cells, and recent shoreline change. Cont. Shelf Res. 2019, 173, 93–103. [Google Scholar] [CrossRef]
- Besset, M.; Anthony, E.J.; Bouchette, F. Multi-decadal variations in delta shorelines and their relationship to river sediment supply: An assessment and review. Earth-Sci. Rev. 2019, 193, 199–219. [Google Scholar] [CrossRef] [Green Version]
- Zhai, T.; Wang, J.; Fang, Y.; Qin, Y.; Huang, L.; Chen, Y. Assessing ecological risks caused by human activities in rapid urbanization coastal areas: Towards an integrated approach to determining key areas of terrestrial-oceanic ecosystems preservation and restoration. Sci. Total Environ. 2020, 708, 135153. [Google Scholar] [CrossRef] [PubMed]
- Foti, G.; Barbaro, G.; Barillà, G.C.; Mancuso, P.; Puntorieri, P. Shoreline evolutionary trends along calabrian coasts: Causes and classification. Front. Mar. Sci. 2022, 9, 846914. [Google Scholar] [CrossRef]
- Sancho, F.; Abreu, T.; D’Alessandro, F.; Tomasicchio, G.R.; Silva, P.A. Surf hydrodynamics under collapsing coastal dunes. J. Coast. Res. 2011, 64, 144–148. [Google Scholar]
- D’Alessandro, F.; Tomasicchio, G.R.; Musci, F.; Ricca, A. Dune erosion physical, analytical and numerical modelling. In Proceedings of the 33rd International Conference on Coastal Engineering, Santander, Boadilla del Monte, Spain, 1–6 July 2012; Volume 1, pp. 1–11. [Google Scholar]
- Barbaro, G.; Foti, G.; Barillà, G.C.; Frega, F. Beach and dune erosion: Causes and interventions, case study: Kaulon archaeological site. J. Mar. Sci. Eng. 2022, 10, 14. [Google Scholar] [CrossRef]
- Foti, G.; Barbaro, G.; Barillà, G.C.; Frega, F. Effects of anthropogenic pressures on dune systems—Case study: Calabria (Italy). J. Mar. Sci. Eng. 2022, 10, 10. [Google Scholar] [CrossRef]
- Foti, G.; Barbaro, G.; Manti, A.; Foti, P.; La Torre, A.; Geria, P.F.; Puntorieri, P.; Tramontana, N. A methodology to evaluate the effects of river sediment withdrawal: The case study of the Amendolea River in Southern Italy. Aquat. Ecosyst. 2020, 23, 465–473. [Google Scholar] [CrossRef]
- Barbaro, G. Saline Joniche: A predicted disaster. Disaster Adv. 2013, 6, 1–3. [Google Scholar]
- Tomasicchio, G.R.; D’Alessandro, F. Wave energy transmission through and over low crest-ed breakwaters. J. Coast. Res. 2013, 65, 398–403. [Google Scholar] [CrossRef]
- Zema, D.A.; Bombino, G.; Boix-Fayos, C.; Tamburino, V.; Zimbone, S.M.; Fortugno, D. Evaluation and modeling of scouring and sedimentation around check dams in a Mediterranean torrent in Calabria, Italy. J. Soil Water Conserv. 2014, 69, 316–329. [Google Scholar] [CrossRef]
- Prumm, M.; Iglesias, G. Impacts of port development on estuarine morphodynamics: Ribadeo (Spain). Ocean Coast. Manag. 2016, 130, 58–72. [Google Scholar] [CrossRef] [Green Version]
- Miduri, M.; Foti, G.; Puntorieri, P. Impact generated by Marina of Badolato on adjacent coasts. In Proceedings of the 13th International Congress on Coastal and Marine Sciences, Engineering, Management & Conservation (MEDCOAST), Mellieha, Malta, 31 October–4 November 2017; Volume 2, pp. 935–945. [Google Scholar]
- Valsamidis, A.; Reeve, D.E. Modelling shoreline evolution in the vicinity of a groyne and a river. Cont. Shelf Res. 2017, 132, 49–57. [Google Scholar] [CrossRef] [Green Version]
- Williams, A.T.; Rangel-Buitrago, N.; Pranzini, E.; Anfuso, G. The management of coastal erosion. Ocean Coast. Manag. 2018, 156, 4–20. [Google Scholar] [CrossRef]
- Canale, C.; Barbaro, G.; Foti, G.; Petrucci, O.; Besio, G.; Barillà, G.C. Bruzzano river mouth damage due to meteorological events. Int. J. River Basin Manag. 2021. [Google Scholar] [CrossRef]
- Komen, G.J.; Cavaleri, L.; Donelan, M.; Hasselmann, K.; Hasselmann, S.; Janssen, P.A.E.M. Dynamics and Modelling of Ocean Waves; Cambridge University Press: Cambridge, UK, 1996; p. 532. [Google Scholar]
- Skamarock, W.C.; Klemp, J.B.; Dudhia, J.; Gill, D.O.; Barker, D.; Duda, M.G.; Powers, J.G. A Description of the Advanced Research WRF Version 3; University Corporation for Atmospheric Research: Boulder, CO, USA, 2008. [Google Scholar] [CrossRef]
- Tolman, H.L. User Manual and System Documentation of WAVEWATCH III TM Version 3.14; Technical note, MMAB Contribution; U.S. Department of Commerce, National Oceanic and Atmospheric Administration, National Weather Service, National Centers for Environmental Prediction: Camp Springs, MD, USA, 2009; Volume 276.
- Saha, S.; Moorthi, S.; Pan, H.L.; Wu, X.; Wang, J.; Nadiga, S.; Goldberg, M. The NCEP climate forecast system reanalysis. Bull. Am. Meteorol. Soc. 2010, 91, 1015–1058. [Google Scholar] [CrossRef]
- Mentaschi, L.; Besio, G.; Cassola, F.; Mazzino, A. Developing and validating a forecast/hindcast system for the Mediterranean Sea. J. Coast. Res. 2013, 65, 1551–1556. [Google Scholar] [CrossRef]
- Mentaschi, L.; Besio, G.; Cassola, F.; Mazzino, A. Performance evaluation of Wavewatch III in the Mediterranean Sea. Ocean Model. 2015, 90, 82–94. [Google Scholar] [CrossRef]
- Boccotti, P. Wave Mechanics for Ocean Engineering; Elsevier Oceanography Series: Amsterdam, The Netherlands, 2000; Available online: https://0-www-sciencedirect-com.brum.beds.ac.uk/bookseries/lsevier-oceanography-series/vol/64/suppl/C (accessed on 15 February 2022).
- Arena, F.; Pavone, D. Return period of nonlinear high wave crests. J. Geophys. Res. 2006, 111, 1–10. [Google Scholar] [CrossRef] [Green Version]
- Parunov, J.; Ćorak, M.; Pensa, M. Wave height statistics for seakeeping assessment of ships in the Adriatic Sea. Ocean Eng. 2011, 38, 1323–1330. [Google Scholar] [CrossRef]
- Sartini, L.; Mentaschi, L.; Besio, G. Comparing different extreme wave analysis models for wave climate assessment along the Italian coast. Coast. Eng. 2015, 100, 37–47. [Google Scholar] [CrossRef]
- Kotz, S.; Balakrishnan, N.; Read, C.B.; Vidakovic, B. Encyclopedia of Statistical Sciences Volume 1; John Wiley & Sons: Hoboken, NJ, USA, 2005. [Google Scholar]
- Maiolo, M.; Versace, P.; Natale, L.; Irish, J.; Pope, J.; Frega, F. A comprehensive study of the tyrrhenian shoreline of the Province of Cosenza. In AIPCN—Giornate Italiane di Ingegneria Costiera, 5th ed.; AIPCN: Ravenna, Italy, 2000. [Google Scholar]
- Bellotti, P.; Caputo, C.; Davoli, L.; Evangelista, S.; Pugliese, F. Coastal protections in Tyrrhenian Calabria (Italy): Morphological and sedimentological feedback on the vulnerable area of belvedere Marittimo. Geogr. Fis. E Din. Quat. 2009, 32, 3–14. [Google Scholar]
- D’Alessandro, F.; Tomasicchio, G.R.; Frega, F.; Carbone, M. Design and management aspects of a coastal protection system. A case history in the South of Italy. J. Coast. Res. 2011, 64, 492–495. [Google Scholar]
- Ietto, F.; Le Pera, E.; Caracciolo, L. Geomorphology and sand provenance of the Tyrrhenian coast between capo Suvero and Gizzeria (Calabria, southern Italy). Rend. Online Soc. Geol. Ital. 2012, 21, 487–488. [Google Scholar]
- Ietto, F.; Cantasano, N.; Pellicone, G. A new coastal erosion risk assessment indicator: Application to the Calabria tyrrhenian littoral (southern Italy). Environ. Process. 2018, 5, 201–223. [Google Scholar] [CrossRef]
- Maiolo, M.; Carini, M.; Pantusa, D.; Capano, G.; Bonora, M.A.; Feudo, T.L.; Sinopoli, S.; Mel, R.A. History and heritage of coastal protection in the southern Tyrrhenian area. Ital. J. Eng. Geol. Environ. 2020, 2, 19–30. [Google Scholar]
- Cantasano, N.; Pellicone, G. Marine and River environments: A pattern of integrated coastal zone management (ICZM) in Calabria (southern Italy). Ocean Coast. Manag. 2014, 89, 71–78. [Google Scholar] [CrossRef] [Green Version]
- Cantasano, N.; Pellicone, G.; Ietto, F. The coastal sustainability standard method: A case study in Calabria (southern Italy). Ocean Coast. Manag. 2020, 183, 104962. [Google Scholar] [CrossRef]
- Cantasano, N.; Caloiero, T.; Pellicone, G.; Aristodemo, F.; De Marco, A.; Tagarelli, G. Can ICZM contribute to the mitigation of erosion and of human activities threatening the natural and cultural heritage of the coastal landscape of Calabria? Sustainability 2021, 13, 1122. [Google Scholar] [CrossRef]
- Rago, V.; Chiaravalloti, F.; Chiodo, G.; Gabriele, S.; Lupiano, V.; Nicastro, R.; Pellegrino, A.D.; Procopio, A.; Siviglia, S.; Terranova, O.G.; et al. Geomorphic effects caused by heavy rainfall in southern Calabria (Italy) on 30 October–1 November 2015. J. Maps 2017, 13, 836–843. [Google Scholar] [CrossRef] [Green Version]
- Di Luccio, D.; Benassai, G.; Di Paola, G.; Rosskopf, C.M.; Mucerino, L.; Montella, R.; Contestabile, P. Monitoring and modelling coastal vulnerability and mitigation proposal for an archaeological site (Kaulonia, Southern Italy). Sustainability 2018, 10, 2017. [Google Scholar] [CrossRef] [Green Version]
- Barbaro, G. Master plan of solutions to mitigate the risk of coastal erosion in Calabria (Italy), a case study. Ocean Coast. Manag. 2016, 132, 24–35. [Google Scholar] [CrossRef]
- Ferraro, D.A.; Aristodemo, F.; Veltri, P. Wave energy resources along calabrian coasts (Italy). Coast. Eng. Proc. 2017, 35, 1–12. [Google Scholar] [CrossRef] [Green Version]
- Caloiero, T.; Aristodemo, F.; Algieri Ferraro, D. Trend analysis of significant wave height and energy period in southern Italy. Theor. Appl. Climatol. 2019, 138, 917–930. [Google Scholar] [CrossRef]
Figure 1.
Calabria region (large panel). Geographical position of Calabria region in the center of Mediterranean Sea (small panel).
Figure 1.
Calabria region (large panel). Geographical position of Calabria region in the center of Mediterranean Sea (small panel).

Figure 2.
Calabrian sample areas, identified with the suffix I for the points of the Ionian Sea and with the suffix T for the points of the Tyrrhenian Sea, both followed by an increasing number in a clockwise direction.
Figure 2.
Calabrian sample areas, identified with the suffix I for the points of the Ionian Sea and with the suffix T for the points of the Tyrrhenian Sea, both followed by an increasing number in a clockwise direction.

Figure 3.
Maximum significant wave height hs,max values. The range between the minimum and the maximum values has been divided into 10 intervals of the same width.
Figure 3.
Maximum significant wave height hs,max values. The range between the minimum and the maximum values has been divided into 10 intervals of the same width.

Figure 4.
Average significant wave height hs values. The range between the minimum and the maximum values has been divided into 10 intervals of the same width.
Figure 4.
Average significant wave height hs values. The range between the minimum and the maximum values has been divided into 10 intervals of the same width.

Figure 5.
Significant wave height of return period of 1 year hs1 values. The range between the minimum and the maximum values has been divided into 10 intervals of the same width.
Figure 5.
Significant wave height of return period of 1 year hs1 values. The range between the minimum and the maximum values has been divided into 10 intervals of the same width.

Figure 6.
Significant wave height of return period of 100 years hs100 values. The range between the minimum and the maximum values has been divided into 10 intervals of the same width.
Figure 6.
Significant wave height of return period of 100 years hs100 values. The range between the minimum and the maximum values has been divided into 10 intervals of the same width.

Figure 7.
Average annual energy flux Φt values. The range between the minimum and the maximum values has been divided into 10 intervals of the same width.
Figure 7.
Average annual energy flux Φt values. The range between the minimum and the maximum values has been divided into 10 intervals of the same width.

Figure 8.
Average annual energy flux of main sectors ΦMS values. The range between the minimum and the maximum values has been divided into 10 intervals of the same width.
Figure 8.
Average annual energy flux of main sectors ΦMS values. The range between the minimum and the maximum values has been divided into 10 intervals of the same width.

Figure 9.
Main, secondary, and tertiary energy sector directions. Legend: main sectors MS are in red, secondary sectors SS are in yellow, and tertiary sectors TS are in orange.
Figure 9.
Main, secondary, and tertiary energy sector directions. Legend: main sectors MS are in red, secondary sectors SS are in yellow, and tertiary sectors TS are in orange.


Table 1.
Coastal municipalities present in the coastal area corresponding to each point and the values of maximum significant wave height hs,max, average significant wave height hs, average peak period tp, average mean period tm, significant wave height of return period of 1 year hs1, significant wave height of return period of 100 years hs100, and difference between significant wave height of return period of 1 and 100 years ∆hs1–100, calculated for each point. Legend: the higher values are in red, and the lower values are in green.
| Point | Coastal Municipality | hs,max [m] | hs [m] | tp [s] | tm [s] | hs1 [m] | hs100 [m] | ∆hs1–100 [m] |
|---|---|---|---|---|---|---|---|---|
| I1 | Rocca Imperiale, Montegiordano | 5.68 | 0.56 | 4.57 | 3.87 | 3.67 | 6.68 | 3.01 |
| I2 | Roseto Capo Spulico | 5.72 | 0.58 | 4.51 | 3.82 | 3.73 | 6.62 | 2.89 |
| I3 | Amendolara, Albidona, Trebisacce | 5.88 | 0.61 | 4.43 | 3.76 | 3.69 | 6.23 | 2.54 |
| I4 | Villapiana, Cassano allo Ionio | 5.57 | 0.50 | 4.22 | 3.57 | 3.19 | 5.44 | 2.25 |
| I5 | Corigliano-Rossano to the Trionto River mouth | 4.91 | 0.43 | 3.94 | 3.36 | 2.76 | 4.71 | 1.95 |
| I6 | Corigliano-Rossano from the Trionto River mouth to the east, Crosia, Calopezzati, Pietrapaola, Mandatoriccio | 6.04 | 0.54 | 4.30 | 3.62 | 3.46 | 5.88 | 2.42 |
| I7 | Scala Coeli, Cariati | 6.18 | 0.57 | 4.37 | 3.67 | 3.57 | 6.03 | 2.46 |
| I8 | Crucoli, Cirò, Cirò Marina up to Punta Alice | 6.87 | 0.71 | 4.66 | 3.94 | 4.11 | 6.86 | 2.75 |
| I9 | Cirò Marina from Punta Alice to the south | 7.42 | 0.79 | 4.94 | 4.19 | 4.50 | 7.58 | 3.08 |
| I10 | Melissa, Strongoli, Crotone to the Neto River mouth | 7.44 | 0.79 | 4.99 | 4.22 | 4.49 | 7.54 | 3.05 |
| I11 | Crotone from the Neto River mouth to the port | 7.34 | 0.80 | 5.04 | 4.27 | 4.53 | 7.63 | 3.10 |
| I12 | Crotone from the port up to Capo Colonna | 7.23 | 0.81 | 5.11 | 4.33 | 4.55 | 7.67 | 3.12 |
| I13 | Crotone from Capo Colonna to the south, Isola Capo Rizzuto up to Capo Cimiti | 7.02 | 0.84 | 5.18 | 4.39 | 4.58 | 7.64 | 3.06 |
| I14 | Isola Capo Rizzuto from Capo Cimiti up to Capo Rizzuto | 7.04 | 0.92 | 5.22 | 4.43 | 4.77 | 7.82 | 3.05 |
| I15 | Isola Capo Rizzuto from Capo Rizzuto up to Le Castella | 6.69 | 0.82 | 5.08 | 4.31 | 4.42 | 7.46 | 3.04 |
| I16 | Isola Capo Rizzuto from Le Castella to the west, Cutro, Belcastro, Botricello, Cropani, Sellia Marina to the Uria River mouth | 6.45 | 0.76 | 4.99 | 4.23 | 4.16 | 7.06 | 2.90 |
| I17 | Sellia Marina from Uria River mouth to the south-west, Simeri Crichi, Catanzaro, Borgia, Squillace, Stalettì up to Punta di Stalettì | 6.28 | 0.68 | 4.92 | 4.17 | 3.92 | 6.93 | 3.01 |
| I18 | Stalettì from Punta di Stalettì to the south, Montauro, Montepaone, Soverato up to Punta Soverato | 6.11 | 0.67 | 4.90 | 4.18 | 3.90 | 7.11 | 3.21 |
| I19 | Soverato from Punta Soverato to the south, Satriano, Davoli, San Sostene, Sant’Andrea Apostolo dello Ionio | 6.11 | 0.69 | 5.00 | 4.24 | 3.96 | 7.06 | 3.10 |
| I20 | Isca sullo Ionio, Badolato, Santa Caterina dello Ionio | 6.51 | 0.71 | 5.11 | 4.32 | 4.19 | 7.46 | 3.27 |
| I21 | Guardavalle, Monasterace | 6.67 | 0.72 | 5.23 | 4.42 | 4.22 | 7.37 | 3.15 |
| I22 | Stilo, Camini, Riace, Stignano | 7.06 | 0.78 | 5.30 | 4.48 | 4.55 | 7.90 | 3.35 |
| I23 | Caulonia | 6.38 | 0.77 | 5.25 | 4.45 | 4.28 | 7.32 | 3.04 |
| I24 | Roccella Ionica, Marina di Gioiosa Ionica, Grotteria, Siderno | 6.37 | 0.69 | 5.14 | 4.35 | 3.89 | 6.74 | 2.85 |
| I25 | Locri, Portigliola, Sant’Ilario dello Ionio, Ardore | 6.36 | 0.67 | 5.15 | 4.37 | 3.85 | 6.70 | 2.85 |
| I26 | Bovalino, Casignana, Bianco, Africo | 6.62 | 0.72 | 5.26 | 4.46 | 4.15 | 7.24 | 3.09 |
| I27 | Ferruzzano, Bruzzano Zeffirio | 7.37 | 0.76 | 5.33 | 4.52 | 4.35 | 7.45 | 3.10 |
| I28 | Brancaleone | 6.56 | 0.69 | 5.41 | 4.59 | 4.21 | 7.43 | 3.22 |
| I29 | Palizzi | 6.5 | 0.77 | 5.32 | 4.50 | 4.26 | 7.19 | 2.93 |
| I30 | Bova Marina, Condofuri, San Lorenzo | 6.51 | 0.77 | 5.18 | 4.39 | 4.19 | 7.08 | 2.89 |
| I31 | Melito di Porto Salvo, Montebello Ionico | 6.39 | 0.78 | 5.04 | 4.28 | 4.02 | 6.71 | 2.69 |
| I32 | Motta San Giovanni, Reggio Calabria | 6.35 | 0.68 | 4.80 | 4.10 | 3.64 | 6.21 | 2.57 |
| T1 | Villa San Giovanni, Scilla, Bagnara Calabra | 6.71 | 0.48 | 5.04 | 4.20 | 3.61 | 6.95 | 3.34 |
| T2 | Seminara, Palmi | 8.29 | 0.62 | 5.14 | 4.31 | 4.42 | 8.06 | 3.64 |
| T3 | Gioia Tauro, San Ferdinando, Rosarno | 8.14 | 0.63 | 5.11 | 4.27 | 4.39 | 7.92 | 3.53 |
| T4 | Nicotera, Joppolo, Ricadi up to Capo Vaticano | 7.81 | 0.52 | 5.29 | 4.38 | 3.89 | 7.18 | 3.29 |
| T5 | Ricadi from Capo Vaticano to the north | 9.4 | 0.74 | 5.38 | 4.49 | 4.90 | 8.89 | 3.99 |
| T6 | Tropea, Parghelia, Zambrone | 9.22 | 0.69 | 5.46 | 4.55 | 4.74 | 8.76 | 4.02 |
| T7 | Briatico, Vibo Marina, Pizzo, Curinga | 9.03 | 0.58 | 5.51 | 4.59 | 4.25 | 8.15 | 3.90 |
| T8 | Lamezia Terme, Gizzeria | 8.54 | 0.59 | 5.50 | 4.60 | 4.20 | 7.92 | 3.72 |
| T9 | Falerna, Nocera Terinese | 9.82 | 0.75 | 5.50 | 4.63 | 4.98 | 9.18 | 4.20 |
| T10 | Amantea | 9.58 | 0.73 | 5.51 | 4.65 | 4.82 | 8.79 | 3.97 |
| T11 | Belmonte Calabro, Longobardi, Fiumefreddo Bruzio | 9.44 | 0.73 | 5.53 | 4.68 | 4.75 | 8.65 | 3.90 |
| T12 | Falconara Albanese, San Lucido, Paola to the San Domenico River mouth | 9.16 | 0.71 | 5.55 | 4.70 | 4.64 | 8.46 | 3.82 |
| T13 | Paola from the San Domenico River mouth to the north, Fuscaldo, Guardia Piemontese | 8.31 | 0.67 | 5.54 | 4.66 | 4.29 | 7.75 | 3.46 |
| T14 | Acquappesa, Cetraro | 9.49 | 0.80 | 5.57 | 4.70 | 4.93 | 8.77 | 3.84 |
| T15 | Bonifati, Sangineto, Belvedere Marittimo to the Di Mare River mouth | 9.45 | 0.80 | 5.55 | 4.66 | 4.90 | 8.54 | 3.64 |
| T16 | Belvedere Marittimo from Di Mare River mouth, Diamante to the port | 9.47 | 0.78 | 5.64 | 4.75 | 4.91 | 8.81 | 3.90 |
| T17 | Diamante from the port to the north, Grisolia, Santa Maria del Cedro | 8.86 | 0.73 | 5.66 | 4.76 | 4.66 | 8.32 | 3.66 |
| T18 | Scalea | 8.3 | 0.69 | 5.66 | 4.76 | 4.49 | 7.99 | 3.50 |
| T19 | San Nicola Arcella, Praia a Mare, Tortora | 7.15 | 0.63 | 5.60 | 4.70 | 4.12 | 7.24 | 3.12 |
| Maximum | 9.82 | 0.92 | 5.66 | 4.76 | 4.98 | 9.18 | 4.20 | |
| Minimum | 4.91 | 0.43 | 3.94 | 3.36 | 2.76 | 4.71 | 1.95 | |
| Average | 7.33 | 0.70 | 5.13 | 4.33 | 4.23 | 7.43 | 3.20 | |
Table 2.
Values of average annual energy flux Φt, main MS, secondary SS, and tertiary TS sector and corresponding values of energy flux ΦMS, ΦSS, ΦTS, ratio between the main sector energy flux value and the total energy flux value ΦMS/Φt, and characteristic parameters u, w, a10, b10. Legend: the higher values are in red, and the lower values are in green.
| Point | Φt [kW/m] | MS [°] | ΦMS [kW/m] | SS [°] | ΦSS [kW/m] | TS [°] | ΦTS [kW/m] | ΦMS/Φt [%] | u | w [m] | a10 [m] | b10 [h] |
|---|---|---|---|---|---|---|---|---|---|---|---|---|
| I1 | 3.5 | 130 | 1.01 | 29 | 0.94 | 0.47 | 2.83 | 66.65 | ||||
| I2 | 3.7 | 130 | 1.15 | 31 | 0.98 | 0.51 | 2.89 | 65.77 | ||||
| I3 | 3.8 | 130 | 0.86 | 230 | 0.34 | 23 | 1.05 | 0.58 | 2.92 | 63.40 | ||
| I4 | 2.5 | 110 | 0.55 | 240 | 0.24 | 22 | 1.03 | 0.47 | 2.52 | 60.29 | ||
| I5 | 1.7 | 100 | 0.28 | 250 | 0.19 | 30 | 0.15 | 17 | 1.02 | 0.40 | 2.22 | 58.48 |
| I6 | 3.0 | 120 | 0.36 | 0 | 0.27 | 280 | 0.21 | 12 | 1.04 | 0.52 | 2.79 | 59.25 |
| I7 | 3.4 | 0 | 0.44 | 110 | 0.36 | 300 | 0.15 | 13 | 1.06 | 0.56 | 2.92 | 66.18 |
| I8 | 5.4 | 130 | 0.87 | 350 | 0.54 | 16 | 1.09 | 0.70 | 3.37 | 73.26 | ||
| I9 | 7.1 | 140 | 0.95 | 350 | 0.76 | 13 | 1.09 | 0.77 | 3.70 | 82.51 | ||
| I10 | 7.2 | 140 | 0.94 | 350 | 0.72 | 13 | 1.10 | 0.78 | 3.71 | 82.76 | ||
| I11 | 7.4 | 140 | 0.90 | 0 | 0.81 | 12 | 1.09 | 0.79 | 3.73 | 85.06 | ||
| I12 | 7.6 | 140 | 0.86 | 0 | 0.82 | 11 | 1.10 | 0.79 | 3.74 | 85.30 | ||
| I13 | 8.0 | 140 | 0.75 | 10 | 0.76 | 190 | 0.42 | 9 | 1.11 | 0.82 | 3.77 | 84.97 |
| I14 | 9.2 | 10 | 0.86 | 140 | 0.75 | 200 | 0.55 | 9 | 1.15 | 0.90 | 3.93 | 85.96 |
| I15 | 7.2 | 140 | 0.69 | 190 | 0.51 | 270 | 0.34 | 10 | 1.09 | 0.76 | 3.53 | 83.75 |
| I16 | 6.2 | 140 | 0.66 | 190 | 0.43 | 270 | 0.32 | 11 | 1.08 | 0.70 | 3.32 | 81.35 |
| I17 | 5.1 | 130 | 0.73 | 14 | 1.01 | 0.60 | 3.08 | 84.83 | ||||
| I18 | 5.0 | 130 | 0.74 | 15 | 0.97 | 0.55 | 3.01 | 86.89 | ||||
| I19 | 5.2 | 130 | 0.66 | 50 | 0.18 | 13 | 1.00 | 0.58 | 3.07 | 82.13 | ||
| I20 | 5.9 | 130 | 0.70 | 50 | 0.34 | 12 | 1.00 | 0.62 | 3.27 | 83.23 | ||
| I21 | 6.2 | 130 | 0.64 | 50 | 0.46 | 10 | 1.03 | 0.66 | 3.35 | 81.77 | ||
| I22 | 7.3 | 130 | 0.70 | 50 | 0.62 | 200 | 0.31 | 10 | 1.04 | 0.72 | 3.61 | 83.61 |
| I23 | 6.8 | 130 | 0.68 | 50 | 0.36 | 10 | 1.07 | 0.72 | 3.42 | 84.61 | ||
| I24 | 5.5 | 130 | 0.71 | 13 | 1.05 | 0.64 | 3.09 | 89.43 | ||||
| I25 | 5.2 | 120 | 0.64 | 70 | 0.19 | 12 | 1.04 | 0.62 | 3.05 | 86.91 | ||
| I26 | 6.0 | 130 | 0.58 | 60 | 0.40 | 10 | 1.03 | 0.65 | 3.26 | 82.76 | ||
| I27 | 6.9 | 120 | 0.61 | 60 | 0.54 | 9 | 1.06 | 0.71 | 3.48 | 82.77 | ||
| I28 | 6.2 | 120 | 0.71 | 60 | 0.37 | 11 | 1.02 | 0.65 | 3.29 | 87.68 | ||
| I29 | 6.8 | 120 | 0.58 | 60 | 0.34 | 300 | 0.17 | 9 | 1.09 | 0.72 | 3.40 | 82.19 |
| I30 | 6.4 | 120 | 0.60 | 320 | 0.26 | 9 | 1.08 | 0.70 | 3.33 | 78.38 | ||
| I31 | 6.0 | 120 | 0.60 | 330 | 0.38 | 10 | 1.10 | 0.70 | 3.22 | 78.01 | ||
| I32 | 4.4 | 160 | 0.47 | 340 | 0.20 | 11 | 1.05 | 0.57 | 2.91 | 70.10 | ||
| T1 | 3.1 | 310 | 0.74 | 24 | 0.87 | 0.40 | 2.76 | 66.79 | ||||
| T2 | 5.2 | 300 | 1.18 | 23 | 0.94 | 0.57 | 3.48 | 69.86 | ||||
| T3 | 5.3 | 300 | 0.97 | 18 | 0.96 | 0.59 | 3.47 | 69.42 | ||||
| T4 | 3.9 | 280 | 1.11 | 28 | 0.93 | 0.48 | 3.10 | 68.04 | ||||
| T5 | 7.4 | 280 | 1.53 | 21 | 0.96 | 0.67 | 3.90 | 76.96 | ||||
| T6 | 6.8 | 290 | 1.50 | 22 | 0.94 | 0.62 | 3.76 | 76.97 | ||||
| T7 | 5.1 | 290 | 1.55 | 30 | 0.89 | 0.51 | 3.36 | 78.57 | ||||
| T8 | 5.1 | 270 | 1.59 | 31 | 0.91 | 0.51 | 3.32 | 75.96 | ||||
| T9 | 8.0 | 280 | 2.05 | 26 | 0.95 | 0.67 | 3.96 | 83.01 | ||||
| T10 | 7.6 | 270 | 2.01 | 26 | 0.96 | 0.67 | 3.84 | 83.20 | ||||
| T11 | 7.5 | 270 | 2.11 | 28 | 0.97 | 0.67 | 3.78 | 84.16 | ||||
| T12 | 7.2 | 270 | 2.08 | 29 | 0.97 | 0.65 | 3.68 | 84.17 | ||||
| T13 | 6.2 | 260 | 2.01 | 33 | 0.98 | 0.62 | 3.40 | 83.72 | ||||
| T14 | 8.4 | 260 | 2.21 | 26 | 1.00 | 0.73 | 3.89 | 83.66 | ||||
| T15 | 8.4 | 260 | 1.84 | 22 | 1.03 | 0.75 | 3.88 | 78.96 | ||||
| T16 | 8.4 | 260 | 2.39 | 28 | 0.99 | 0.72 | 3.89 | 84.66 | ||||
| T17 | 7.4 | 260 | 2.23 | 30 | 0.99 | 0.68 | 3.68 | 81.41 | ||||
| T18 | 6.8 | 260 | 2.08 | 31 | 0.99 | 0.65 | 3.54 | 79.06 | ||||
| T19 | 5.5 | 250 | 1.88 | 34 | 1.00 | 0.60 | 3.25 | 73.63 | ||||
| Max | 9.2 | 2.39 | 0.82 | 0.55 | 34 | 1.15 | 0.90 | 3.96 | 89.43 | |||
| Min. | 1.7 | 0.28 | 0.18 | 0.15 | 9 | 0.87 | 0.40 | 2.22 | 58.48 | |||
| Av. | 6.0 | 1.09 | 0.45 | 0.29 | 18 | 1.02 | 0.64 | 3.37 | 78.28 |
Table 3.
Values of seasonal maximum significant wave height hs,max,i and of seasonal average significant wave height hs,i, where the i-th season has been indicated with subscripts W for winter, SP for spring, SU for summer and A for autumn. Legend: the higher values are in red, and the lower values are in green.
| Point | hs,max,W [m] | hs,max,SP [m] | hs,max,SU [m] | hs,max,A [m] | hs,W [m] | hs,SP [m] | hs,SU [m] | hs,A [m] |
|---|---|---|---|---|---|---|---|---|
| I1 | 5.68 | 3.55 | 3.19 | 5.66 | 0.72 | 0.48 | 0.34 | 0.67 |
| I2 | 5.72 | 3.47 | 3.36 | 5.72 | 0.76 | 0.50 | 0.37 | 0.70 |
| I3 | 5.55 | 3.37 | 3.43 | 5.88 | 0.79 | 0.52 | 0.39 | 0.71 |
| I4 | 5.23 | 2.77 | 3.28 | 5.57 | 0.65 | 0.43 | 0.33 | 0.58 |
| I5 | 4.67 | 2.65 | 2.99 | 4.91 | 0.55 | 0.37 | 0.31 | 0.48 |
| I6 | 5.87 | 3.57 | 3.46 | 6.04 | 0.71 | 0.45 | 0.37 | 0.64 |
| I7 | 6.13 | 4.02 | 3.43 | 6.18 | 0.74 | 0.46 | 0.39 | 0.67 |
| I8 | 6.26 | 4.23 | 3.79 | 6.87 | 0.93 | 0.59 | 0.47 | 0.86 |
| I9 | 6.77 | 4.4 | 4.2 | 7.42 | 1.05 | 0.64 | 0.50 | 0.98 |
| I10 | 6.8 | 4.27 | 4.32 | 7.44 | 1.05 | 0.63 | 0.49 | 0.99 |
| I11 | 6.83 | 4.29 | 4.42 | 7.34 | 1.06 | 0.64 | 0.49 | 1.00 |
| I12 | 6.78 | 4.24 | 4.48 | 7.23 | 1.08 | 0.65 | 0.50 | 1.02 |
| I13 | 6.66 | 4.29 | 4.53 | 7.02 | 1.12 | 0.68 | 0.52 | 1.05 |
| I14 | 6.71 | 4.33 | 4.79 | 7.04 | 1.21 | 0.76 | 0.58 | 1.13 |
| I15 | 6.54 | 4.01 | 4.72 | 6.69 | 1.06 | 0.72 | 0.53 | 0.99 |
| I16 | 6.34 | 3.77 | 4.64 | 6.45 | 0.97 | 0.68 | 0.49 | 0.91 |
| I17 | 6.24 | 3.63 | 4.67 | 6.28 | 0.86 | 0.61 | 0.44 | 0.80 |
| I18 | 6.11 | 3.67 | 4.69 | 6.03 | 0.85 | 0.60 | 0.44 | 0.80 |
| I19 | 6.11 | 3.71 | 4.63 | 5.84 | 0.88 | 0.60 | 0.44 | 0.83 |
| I20 | 6.51 | 3.88 | 4.86 | 6.18 | 0.93 | 0.60 | 0.44 | 0.88 |
| I21 | 6.67 | 3.98 | 4.7 | 6.04 | 0.96 | 0.60 | 0.44 | 0.91 |
| I22 | 7.06 | 4.27 | 5.03 | 6.28 | 1.05 | 0.64 | 0.46 | 0.99 |
| I23 | 6.38 | 4.33 | 4.75 | 6.31 | 1.01 | 0.66 | 0.46 | 0.95 |
| I24 | 6.37 | 4.16 | 4.59 | 5.92 | 0.88 | 0.61 | 0.43 | 0.84 |
| I25 | 6.36 | 4.12 | 4.33 | 5.8 | 0.86 | 0.60 | 0.42 | 0.82 |
| I26 | 6.62 | 4.22 | 4.35 | 5.97 | 0.94 | 0.61 | 0.44 | 0.89 |
| I27 | 7.37 | 4.34 | 4.42 | 6.17 | 1.01 | 0.63 | 0.45 | 0.96 |
| I28 | 6.56 | 4.41 | 4.34 | 6.09 | 0.95 | 0.58 | 0.36 | 0.90 |
| I29 | 6.4 | 4.35 | 4.23 | 6.5 | 1.02 | 0.67 | 0.45 | 0.96 |
| I30 | 6.41 | 4.23 | 4.01 | 6.51 | 0.99 | 0.69 | 0.49 | 0.93 |
| I31 | 6.39 | 4.03 | 3.64 | 6.19 | 0.97 | 0.71 | 0.54 | 0.90 |
| I32 | 5.91 | 3.65 | 3.32 | 6.35 | 0.82 | 0.65 | 0.50 | 0.76 |
| T1 | 6.71 | 3.53 | 2.67 | 6.61 | 0.65 | 0.41 | 0.31 | 0.57 |
| T2 | 8.15 | 4.8 | 3.49 | 8.29 | 0.84 | 0.53 | 0.40 | 0.73 |
| T3 | 7.91 | 4.84 | 3.59 | 8.14 | 0.84 | 0.54 | 0.41 | 0.75 |
| T4 | 6.74 | 4.76 | 3.51 | 7.81 | 0.69 | 0.44 | 0.33 | 0.61 |
| T5 | 8.73 | 5.69 | 4.16 | 9.4 | 0.99 | 0.63 | 0.48 | 0.87 |
| T6 | 8.78 | 5.52 | 4.05 | 9.22 | 0.93 | 0.58 | 0.45 | 0.81 |
| T7 | 8.32 | 5.38 | 3.76 | 9.03 | 0.77 | 0.49 | 0.39 | 0.66 |
| T8 | 7.47 | 5.44 | 3.92 | 8.54 | 0.78 | 0.51 | 0.37 | 0.69 |
| T9 | 9.1 | 6.1 | 4.66 | 9.82 | 1.00 | 0.65 | 0.48 | 0.88 |
| T10 | 8.82 | 5.84 | 4.61 | 9.58 | 0.98 | 0.63 | 0.47 | 0.86 |
| T11 | 8.55 | 5.73 | 4.66 | 9.44 | 0.97 | 0.62 | 0.46 | 0.86 |
| T12 | 8.11 | 5.61 | 4.68 | 9.16 | 0.95 | 0.60 | 0.45 | 0.85 |
| T13 | 7.25 | 5.3 | 4.47 | 8.31 | 0.89 | 0.56 | 0.41 | 0.81 |
| T14 | 8.26 | 5.9 | 5 | 9.49 | 1.05 | 0.67 | 0.50 | 0.97 |
| T15 | 8.14 | 5.99 | 4.84 | 9.45 | 1.06 | 0.67 | 0.51 | 0.97 |
| T16 | 8.01 | 6.31 | 4.92 | 9.47 | 1.02 | 0.66 | 0.50 | 0.94 |
| T17 | 7.35 | 6.38 | 4.61 | 8.86 | 0.95 | 0.62 | 0.46 | 0.87 |
| T18 | 7.01 | 6.48 | 4.43 | 8.3 | 0.91 | 0.58 | 0.44 | 0.84 |
| T19 | 6.36 | 5.99 | 4.01 | 7.15 | 0.83 | 0.52 | 0.38 | 0.77 |
| Max | 9.1 | 6.48 | 5.03 | 9.82 | 1.21 | 0.76 | 0.58 | 1.13 |
| Min. | 4.67 | 2.65 | 2.67 | 4.91 | 0.55 | 0.37 | 0.31 | 0.48 |
| Av. | 6.90 | 4.55 | 4.19 | 7.22 | 0.91 | 0.59 | 0.44 | 0.84 |
Table 4.
Values of seasonal average annual energy flux Φt,i, and of seasonal main sector MSi, where the i-th season has been indicated with subscripts W for winter, SP for spring, SU for summer and A for autumn. Legend: the higher values are in red, and the lower values are in green.
Table 4.
Values of seasonal average annual energy flux Φt,i, and of seasonal main sector MSi, where the i-th season has been indicated with subscripts W for winter, SP for spring, SU for summer and A for autumn. Legend: the higher values are in red, and the lower values are in green.
| Point | Φt,W [kW/m] | Φt,SP [kW/m] | Φt,SU [kW/m] | Φt,A [kW/m] | Φt,W [%] | Φt,SP [%] | Φt,SU [%] | Φt,A [%] | MS,W [°] | MS,SP [°] | MS,SU [°] | MS,A [°] |
|---|---|---|---|---|---|---|---|---|---|---|---|---|
| I1 | 1.47 | 0.52 | 0.21 | 1.33 | 0.42 | 0.15 | 0.06 | 0.38 | 130 | 140 | 140 | 130 |
| I2 | 1.56 | 0.55 | 0.24 | 1.38 | 0.42 | 0.15 | 0.06 | 0.37 | 130 | 130 | 130 | 130 |
| I3 | 1.59 | 0.57 | 0.28 | 1.37 | 0.42 | 0.15 | 0.07 | 0.36 | 130 | 130 | 230 | 120 |
| I4 | 1.05 | 0.36 | 0.20 | 0.90 | 0.42 | 0.14 | 0.08 | 0.36 | 110 | 110 | 240 | 110 |
| I5 | 0.71 | 0.24 | 0.16 | 0.57 | 0.42 | 0.14 | 0.09 | 0.33 | 100 | 250 | 250 | 100 |
| I6 | 1.29 | 0.41 | 0.24 | 1.09 | 0.43 | 0.13 | 0.08 | 0.36 | 120 | 280 | 280 | 110 |
| I7 | 1.46 | 0.42 | 0.27 | 1.23 | 0.43 | 0.12 | 0.08 | 0.36 | 350 | 0 | 0 | 110 |
| I8 | 2.29 | 0.73 | 0.41 | 2.00 | 0.42 | 0.13 | 0.08 | 0.37 | 130 | 140 | 350 | 130 |
| I9 | 3.02 | 0.93 | 0.48 | 2.70 | 0.42 | 0.13 | 0.07 | 0.38 | 140 | 140 | 350 | 130 |
| I10 | 3.06 | 0.93 | 0.47 | 2.74 | 0.43 | 0.13 | 0.06 | 0.38 | 140 | 140 | 0 | 130 |
| I11 | 3.16 | 0.96 | 0.48 | 2.82 | 0.43 | 0.13 | 0.06 | 0.38 | 140 | 130 | 0 | 130 |
| I12 | 3.25 | 1.00 | 0.49 | 2.91 | 0.42 | 0.13 | 0.06 | 0.38 | 140 | 140 | 0 | 130 |
| I13 | 3.39 | 1.07 | 0.53 | 3.03 | 0.42 | 0.13 | 0.07 | 0.38 | 140 | 150 | 10 | 130 |
| I14 | 3.87 | 1.27 | 0.65 | 3.44 | 0.42 | 0.14 | 0.07 | 0.37 | 140 | 150 | 10 | 10 |
| I15 | 2.92 | 1.13 | 0.51 | 2.62 | 0.41 | 0.16 | 0.07 | 0.37 | 140 | 150 | 270 | 130 |
| I16 | 2.51 | 0.99 | 0.43 | 2.25 | 0.41 | 0.16 | 0.07 | 0.36 | 140 | 150 | 270 | 130 |
| I17 | 2.10 | 0.81 | 0.33 | 1.87 | 0.41 | 0.16 | 0.06 | 0.37 | 130 | 140 | 280 | 130 |
| I18 | 2.04 | 0.79 | 0.33 | 1.80 | 0.41 | 0.16 | 0.07 | 0.36 | 130 | 140 | 280 | 130 |
| I19 | 2.15 | 0.80 | 0.34 | 1.90 | 0.41 | 0.15 | 0.07 | 0.37 | 130 | 140 | 300 | 130 |
| I20 | 2.47 | 0.85 | 0.36 | 2.18 | 0.42 | 0.14 | 0.06 | 0.37 | 130 | 140 | 310 | 120 |
| I21 | 2.61 | 0.88 | 0.36 | 2.31 | 0.42 | 0.14 | 0.06 | 0.38 | 130 | 140 | 50 | 120 |
| I22 | 3.12 | 1.01 | 0.42 | 2.76 | 0.43 | 0.14 | 0.06 | 0.38 | 130 | 140 | 50 | 120 |
| I23 | 2.84 | 1.04 | 0.41 | 2.50 | 0.42 | 0.15 | 0.06 | 0.37 | 130 | 140 | 60 | 120 |
| I24 | 2.27 | 0.89 | 0.34 | 1.98 | 0.41 | 0.16 | 0.06 | 0.36 | 130 | 140 | 310 | 120 |
| I25 | 2.18 | 0.85 | 0.33 | 1.88 | 0.42 | 0.16 | 0.06 | 0.36 | 130 | 130 | 310 | 120 |
| I26 | 2.54 | 0.92 | 0.37 | 2.20 | 0.42 | 0.15 | 0.06 | 0.37 | 130 | 130 | 330 | 120 |
| I27 | 2.93 | 1.00 | 0.40 | 2.54 | 0.43 | 0.15 | 0.06 | 0.37 | 120 | 130 | 60 | 120 |
| I28 | 2.67 | 0.93 | 0.30 | 2.30 | 0.43 | 0.15 | 0.05 | 0.37 | 120 | 130 | 70 | 110 |
| I29 | 2.84 | 1.08 | 0.41 | 2.43 | 0.42 | 0.16 | 0.06 | 0.36 | 120 | 130 | 300 | 110 |
| I30 | 2.62 | 1.10 | 0.45 | 2.22 | 0.41 | 0.17 | 0.07 | 0.35 | 120 | 130 | 320 | 110 |
| I31 | 2.41 | 1.07 | 0.49 | 2.01 | 0.40 | 0.18 | 0.08 | 0.34 | 120 | 130 | 330 | 110 |
| I32 | 1.71 | 0.84 | 0.39 | 1.43 | 0.39 | 0.19 | 0.09 | 0.33 | 130 | 150 | 340 | 120 |
| T1 | 1.34 | 0.46 | 0.26 | 1.01 | 0.44 | 0.15 | 0.08 | 0.33 | 310 | 310 | 310 | 310 |
| T2 | 2.26 | 0.80 | 0.45 | 1.72 | 0.43 | 0.15 | 0.09 | 0.33 | 290 | 300 | 310 | 300 |
| T3 | 2.26 | 0.82 | 0.46 | 1.77 | 0.43 | 0.15 | 0.09 | 0.33 | 290 | 290 | 300 | 300 |
| T4 | 1.68 | 0.62 | 0.33 | 1.30 | 0.43 | 0.16 | 0.08 | 0.33 | 280 | 280 | 290 | 280 |
| T5 | 3.16 | 1.15 | 0.64 | 2.46 | 0.43 | 0.15 | 0.09 | 0.33 | 280 | 280 | 300 | 280 |
| T6 | 2.92 | 1.02 | 0.59 | 2.25 | 0.43 | 0.15 | 0.09 | 0.33 | 290 | 290 | 300 | 280 |
| T7 | 2.19 | 0.80 | 0.45 | 1.69 | 0.43 | 0.16 | 0.09 | 0.33 | 280 | 280 | 290 | 280 |
| T8 | 2.16 | 0.81 | 0.42 | 1.69 | 0.43 | 0.16 | 0.08 | 0.33 | 270 | 280 | 280 | 270 |
| T9 | 3.36 | 1.27 | 0.68 | 2.64 | 0.42 | 0.16 | 0.09 | 0.33 | 270 | 280 | 290 | 270 |
| T10 | 3.20 | 1.21 | 0.64 | 2.53 | 0.42 | 0.16 | 0.08 | 0.33 | 270 | 270 | 290 | 270 |
| T11 | 3.14 | 1.19 | 0.63 | 2.50 | 0.42 | 0.16 | 0.08 | 0.33 | 270 | 270 | 280 | 270 |
| T12 | 3.00 | 1.14 | 0.60 | 2.42 | 0.42 | 0.16 | 0.08 | 0.34 | 270 | 270 | 280 | 270 |
| T13 | 2.58 | 0.98 | 0.49 | 2.12 | 0.42 | 0.16 | 0.08 | 0.34 | 260 | 260 | 270 | 260 |
| T14 | 3.49 | 1.35 | 0.70 | 2.91 | 0.41 | 0.16 | 0.08 | 0.34 | 260 | 270 | 280 | 260 |
| T15 | 3.45 | 1.34 | 0.71 | 2.90 | 0.41 | 0.16 | 0.08 | 0.35 | 260 | 270 | 280 | 260 |
| T16 | 3.44 | 1.36 | 0.71 | 2.89 | 0.41 | 0.16 | 0.08 | 0.34 | 260 | 260 | 280 | 260 |
| T17 | 3.03 | 1.20 | 0.61 | 2.57 | 0.41 | 0.16 | 0.08 | 0.35 | 260 | 260 | 270 | 260 |
| T18 | 2.76 | 1.09 | 0.54 | 2.36 | 0.41 | 0.16 | 0.08 | 0.35 | 260 | 260 | 260 | 260 |
| T19 | 2.23 | 0.87 | 0.41 | 1.94 | 0.41 | 0.16 | 0.08 | 0.36 | 250 | 250 | 250 | 250 |
| Max | 3.87 | 1.36 | 0.71 | 3.44 | 0.44 | 0.19 | 0.09 | 0.38 | ||||
| Min. | 0.71 | 0.24 | 0.16 | 0.57 | 0.39 | 0.12 | 0.05 | 0.33 | ||||
| Av. | 2.51 | 0.91 | 0.44 | 2.13 | 0.4 | 0.2 | 0.1 | 0.4 |
Publisher’s Note: MDPI stays neutral with regard to jurisdictional claims in published maps and institutional affiliations. |
© 2022 by the authors. Licensee MDPI, Basel, Switzerland. This article is an open access article distributed under the terms and conditions of the Creative Commons Attribution (CC BY) license (https://creativecommons.org/licenses/by/4.0/).
Share and Cite
MDPI and ACS Style
Foti, G.; Barbaro, G.; Besio, G.; Barillà, G.C.; Mancuso, P.; Puntorieri, P. Wave Climate along Calabrian Coasts. Climate 2022, 10, 80. https://0-doi-org.brum.beds.ac.uk/10.3390/cli10060080
AMA Style
Foti G, Barbaro G, Besio G, Barillà GC, Mancuso P, Puntorieri P. Wave Climate along Calabrian Coasts. Climate. 2022; 10(6):80. https://0-doi-org.brum.beds.ac.uk/10.3390/cli10060080
Chicago/Turabian StyleFoti, Giandomenico, Giuseppe Barbaro, Giovanni Besio, Giuseppina Chiara Barillà, Pierluigi Mancuso, and Pierfabrizio Puntorieri. 2022. "Wave Climate along Calabrian Coasts" Climate 10, no. 6: 80. https://0-doi-org.brum.beds.ac.uk/10.3390/cli10060080
Note that from the first issue of 2016, this journal uses article numbers instead of page numbers. See further details here.