Biometric User Identification Based on Human Activity Recognition Using Wearable Sensors: An Experiment Using Deep Learning Models


Abstract
:1. Introduction
2. Related Research
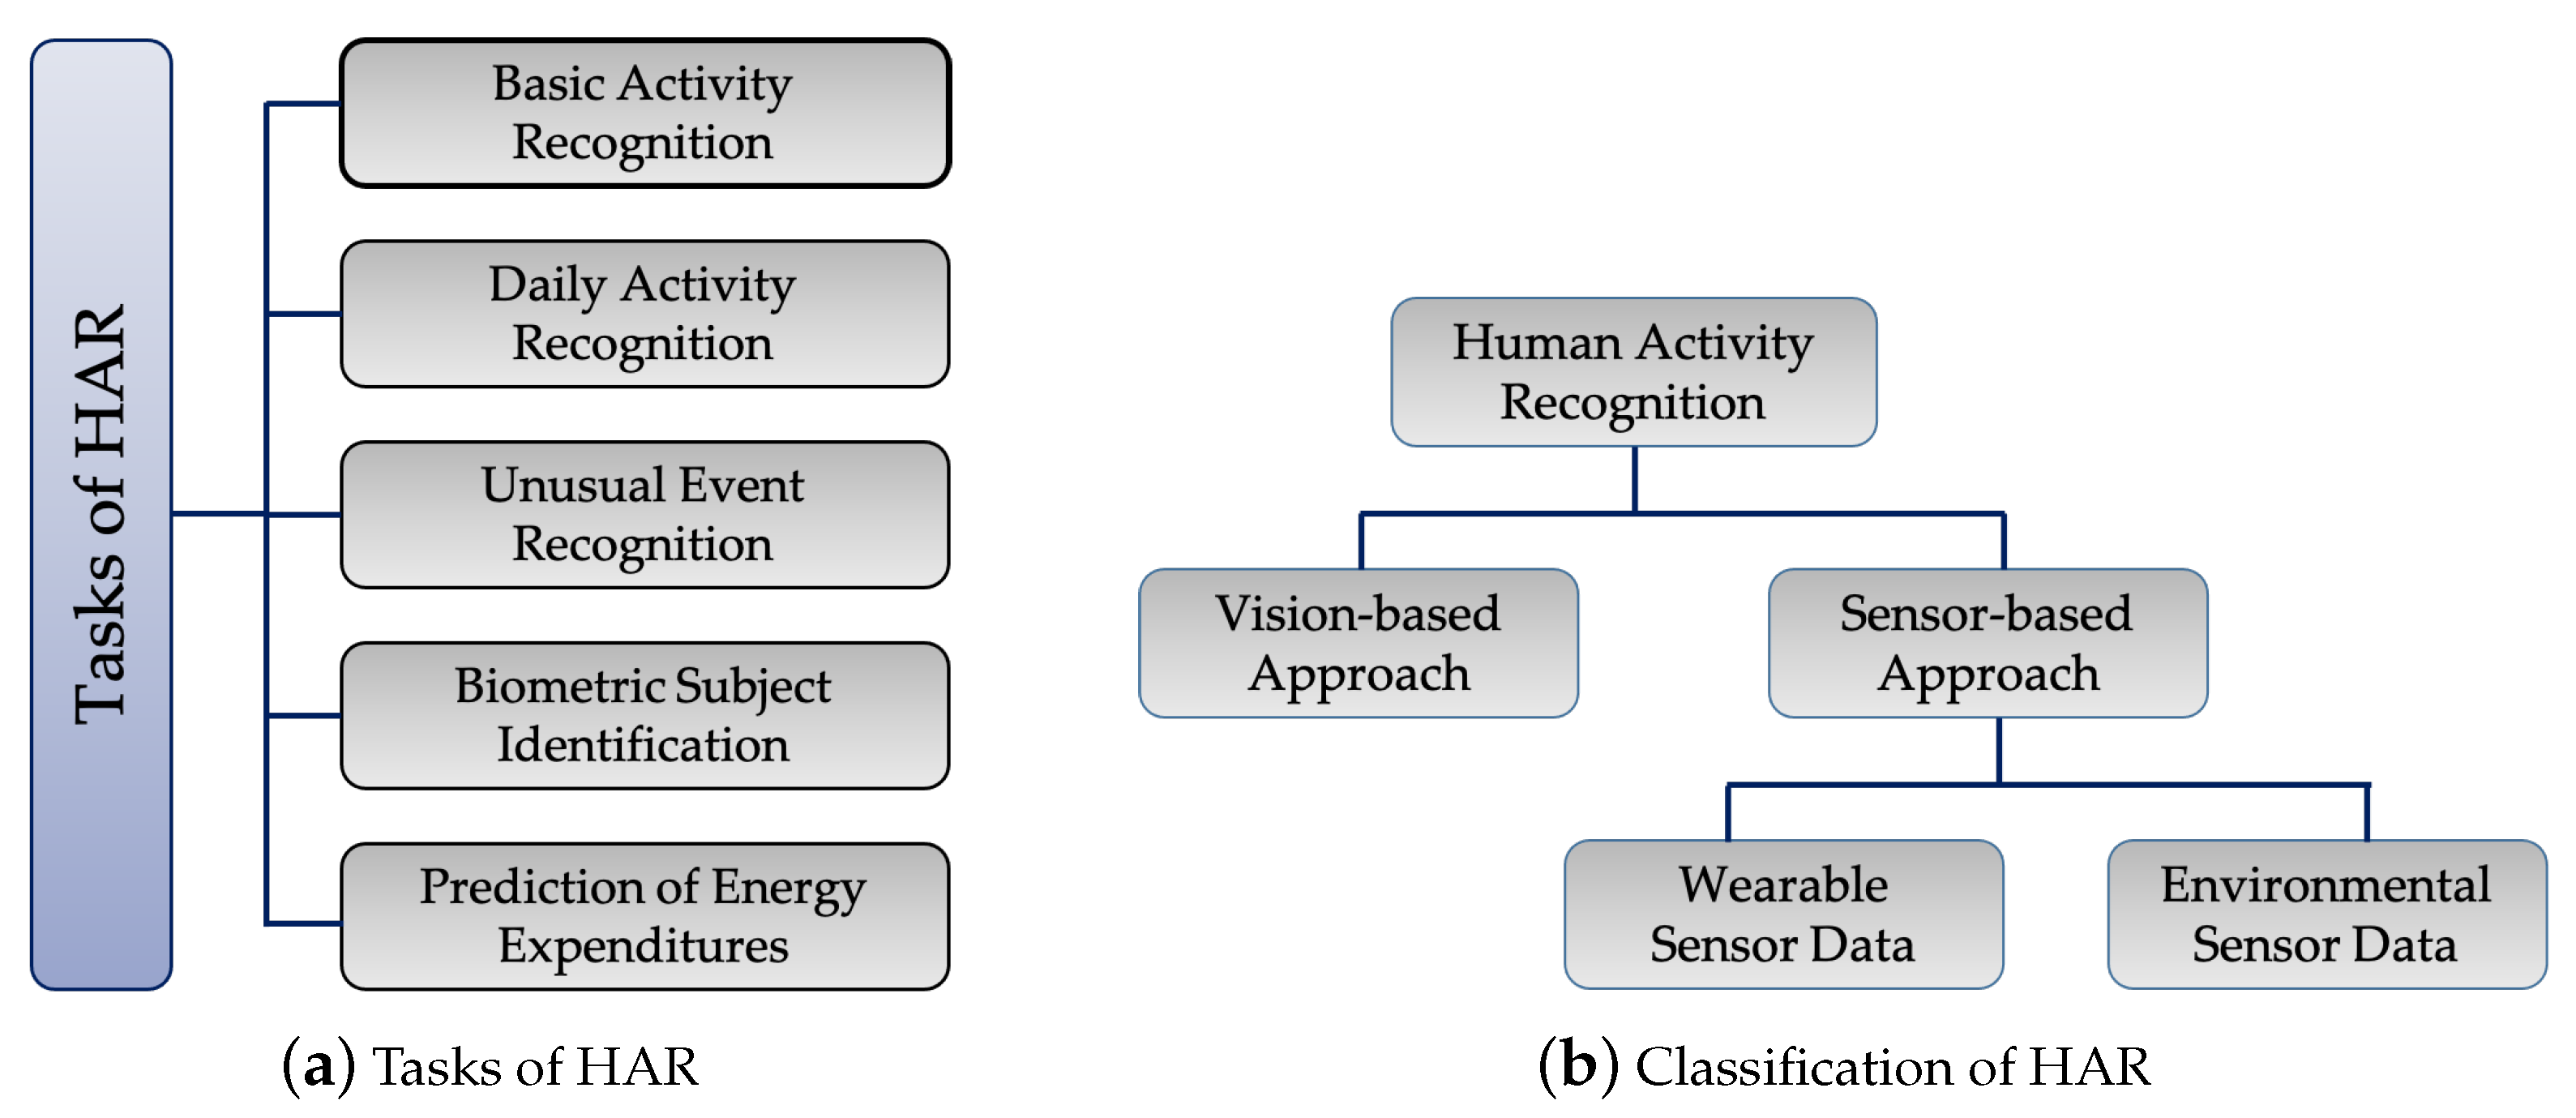
2.1. Human Activity Recognition via Machine Learning and Deep Learning
2.2. Biometric User Identification Using HAR
- Those based on features that are static, including physical characteristics, such as the face, fingerprints, iris of the eye, etc. This type of biological signal is usually collected by researchers in a spatial frequency domain;
- Those that include dynamic features, such as behavioral characteristics, including Electrocardiographic (ECG) signals, keystrokes, voice, etc. This type of biological signal is normally collected by researchers in a time-frequency domain [32].
3. Proposed Methodology
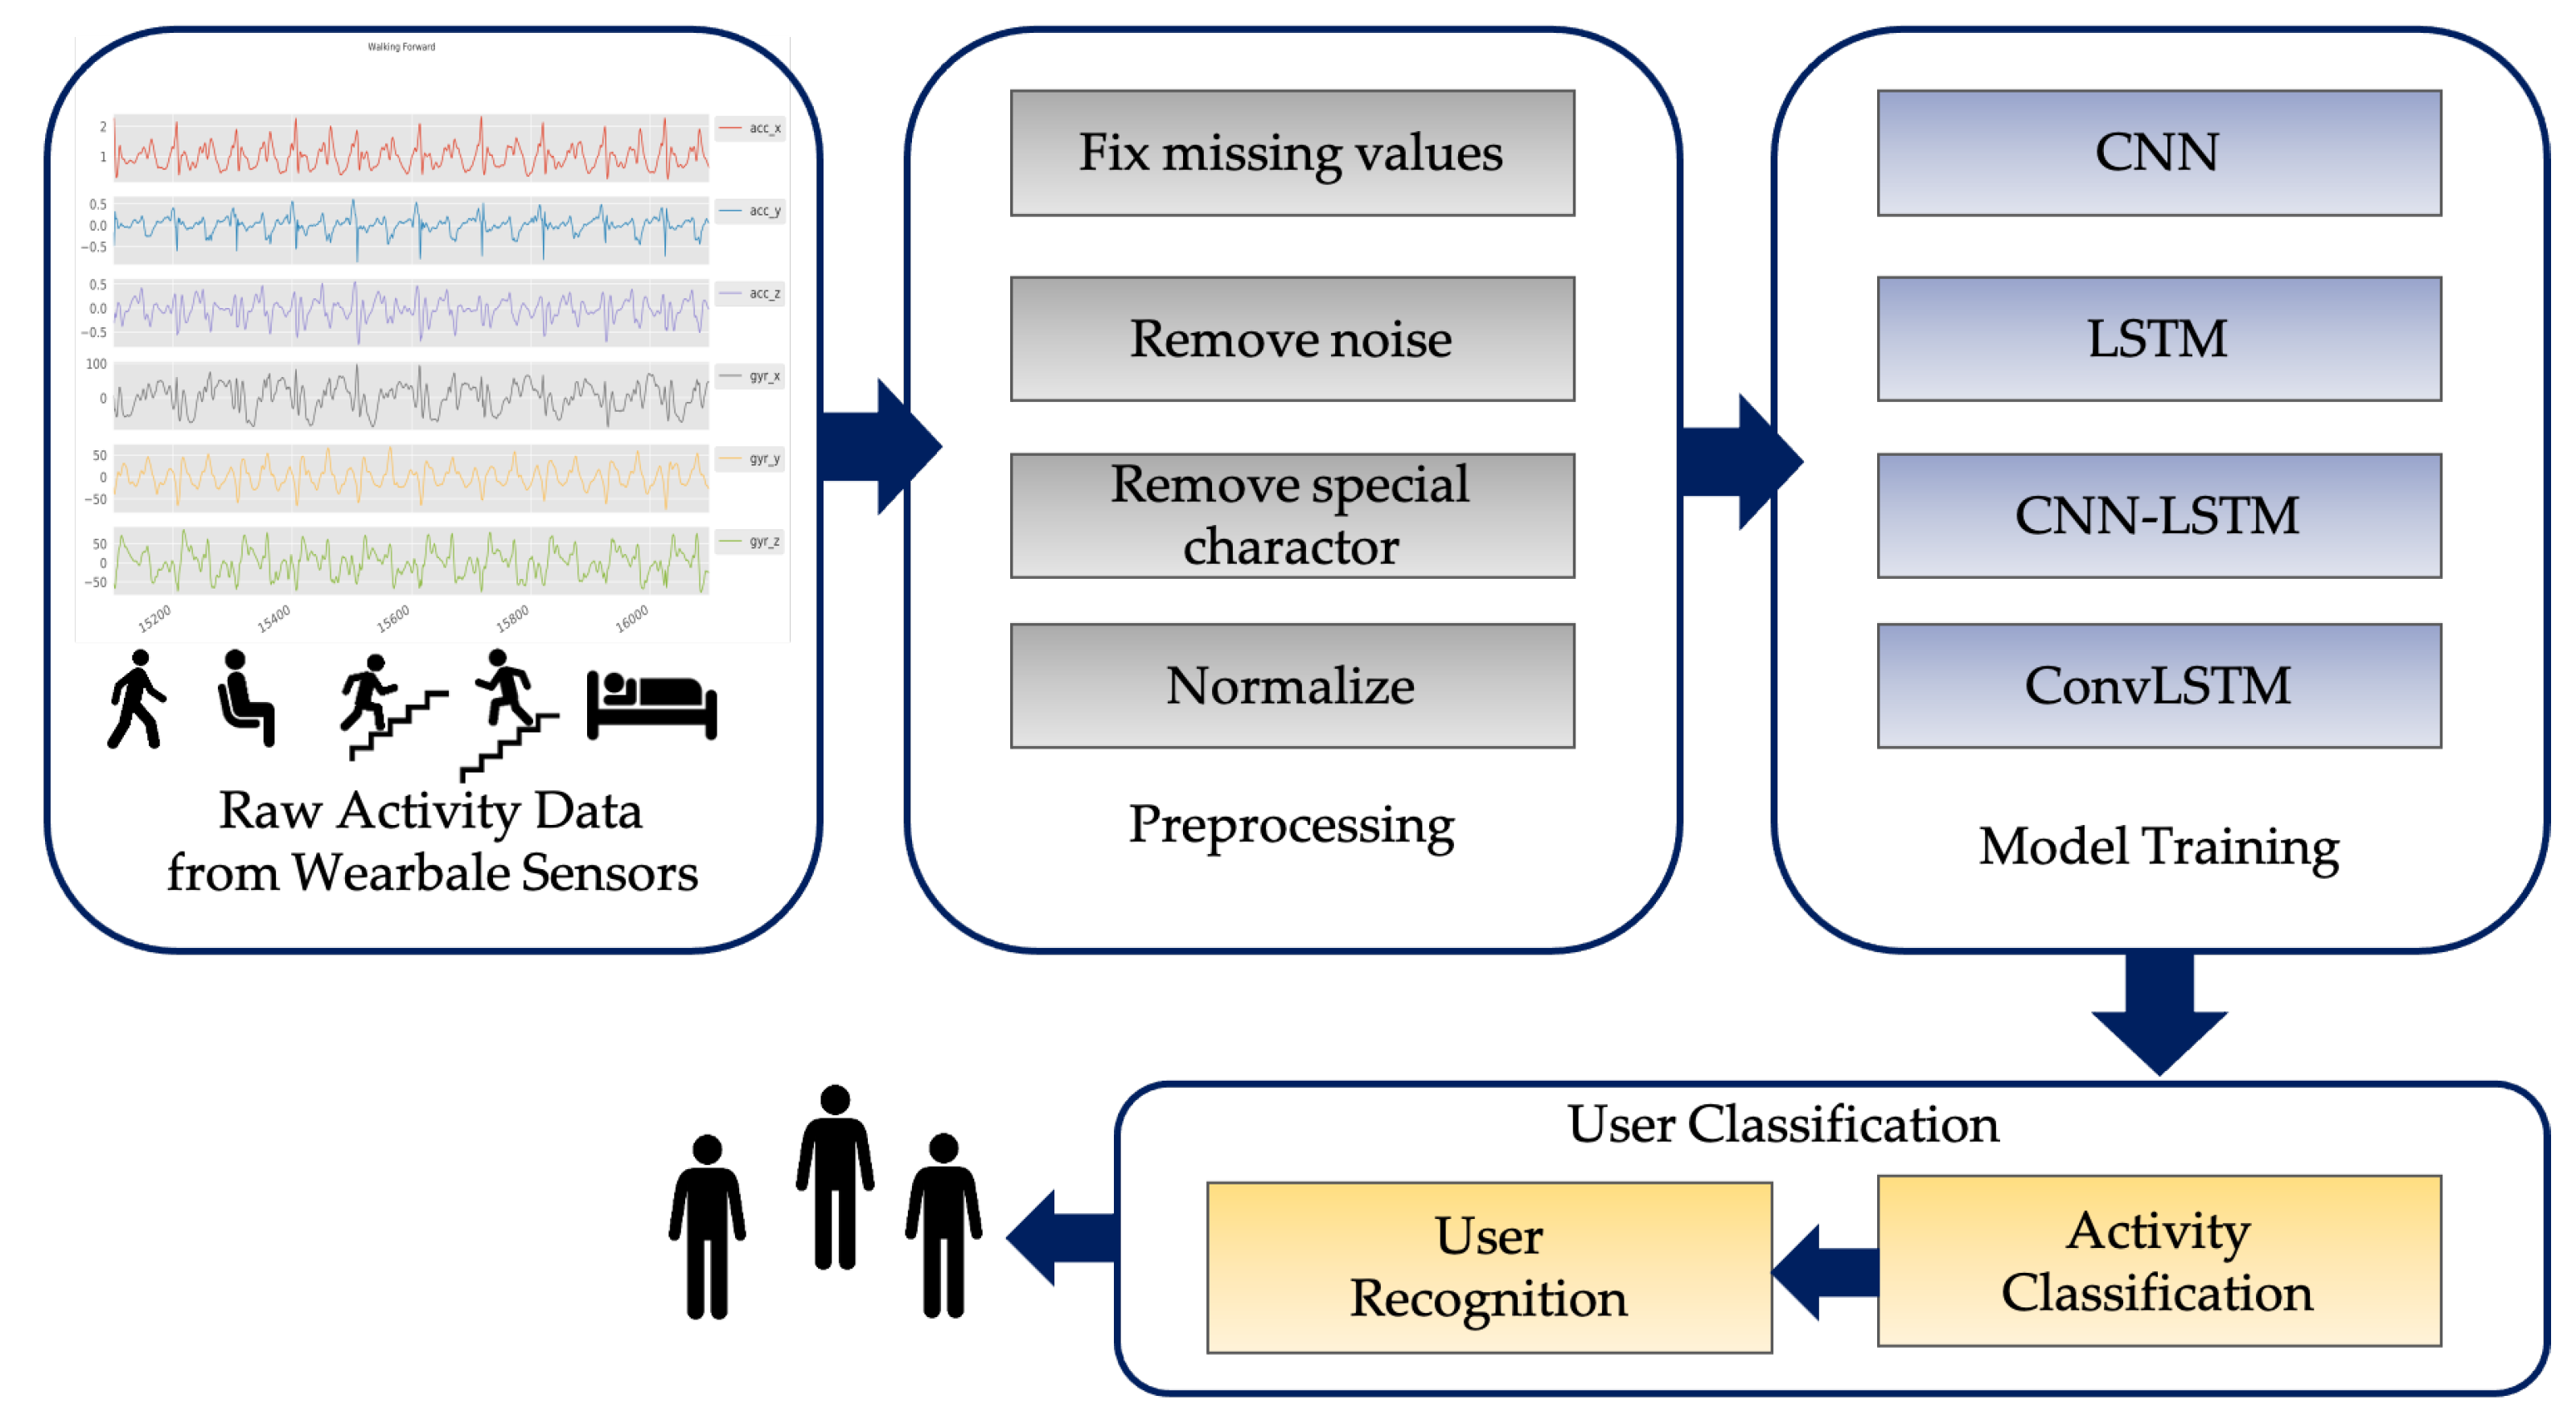
3.1. Proposed Framework
3.1.1. Datasets
- The UCI Human Activity Recognition Dataset (UCI HAR) [31] is the first dataset recorded using embedded tri-axial sensors of accelerometer and gyroscope in a smartphone (Samsung Galaxy S II) on the waist of 30 subjects performing six daily activities;
- The USC Human Activity Dataset (USC HAD) [36] is the second dataset recorded using MotionNode device-embedded tri-axial sensors of magnetometer, accelerometer, and gyroscope. The research sampling rate was 100 Hz. The dataset comprises activity data recorded with 14 subjects, including seven male and seven female subjects, aged between 21–49, performing 12 activities.
3.1.2. Data Pre-Processing
- Missing values of sensor data are fixed by the imputation technique with the linear interpolation method;
- Noises are removed. The sensor data used in this work were pre-processed for noise reduction with a median filter and a 3rd order low-pass Butterworth filter with a 20 Hz cutoff frequency. This rate is sufficient for capturing human body motion since 99% of its energy is contained below 15 Hz [31];
- Special characters are removed;
- A normalization process is used to transform each sensor data with mean and standard derivation [37].
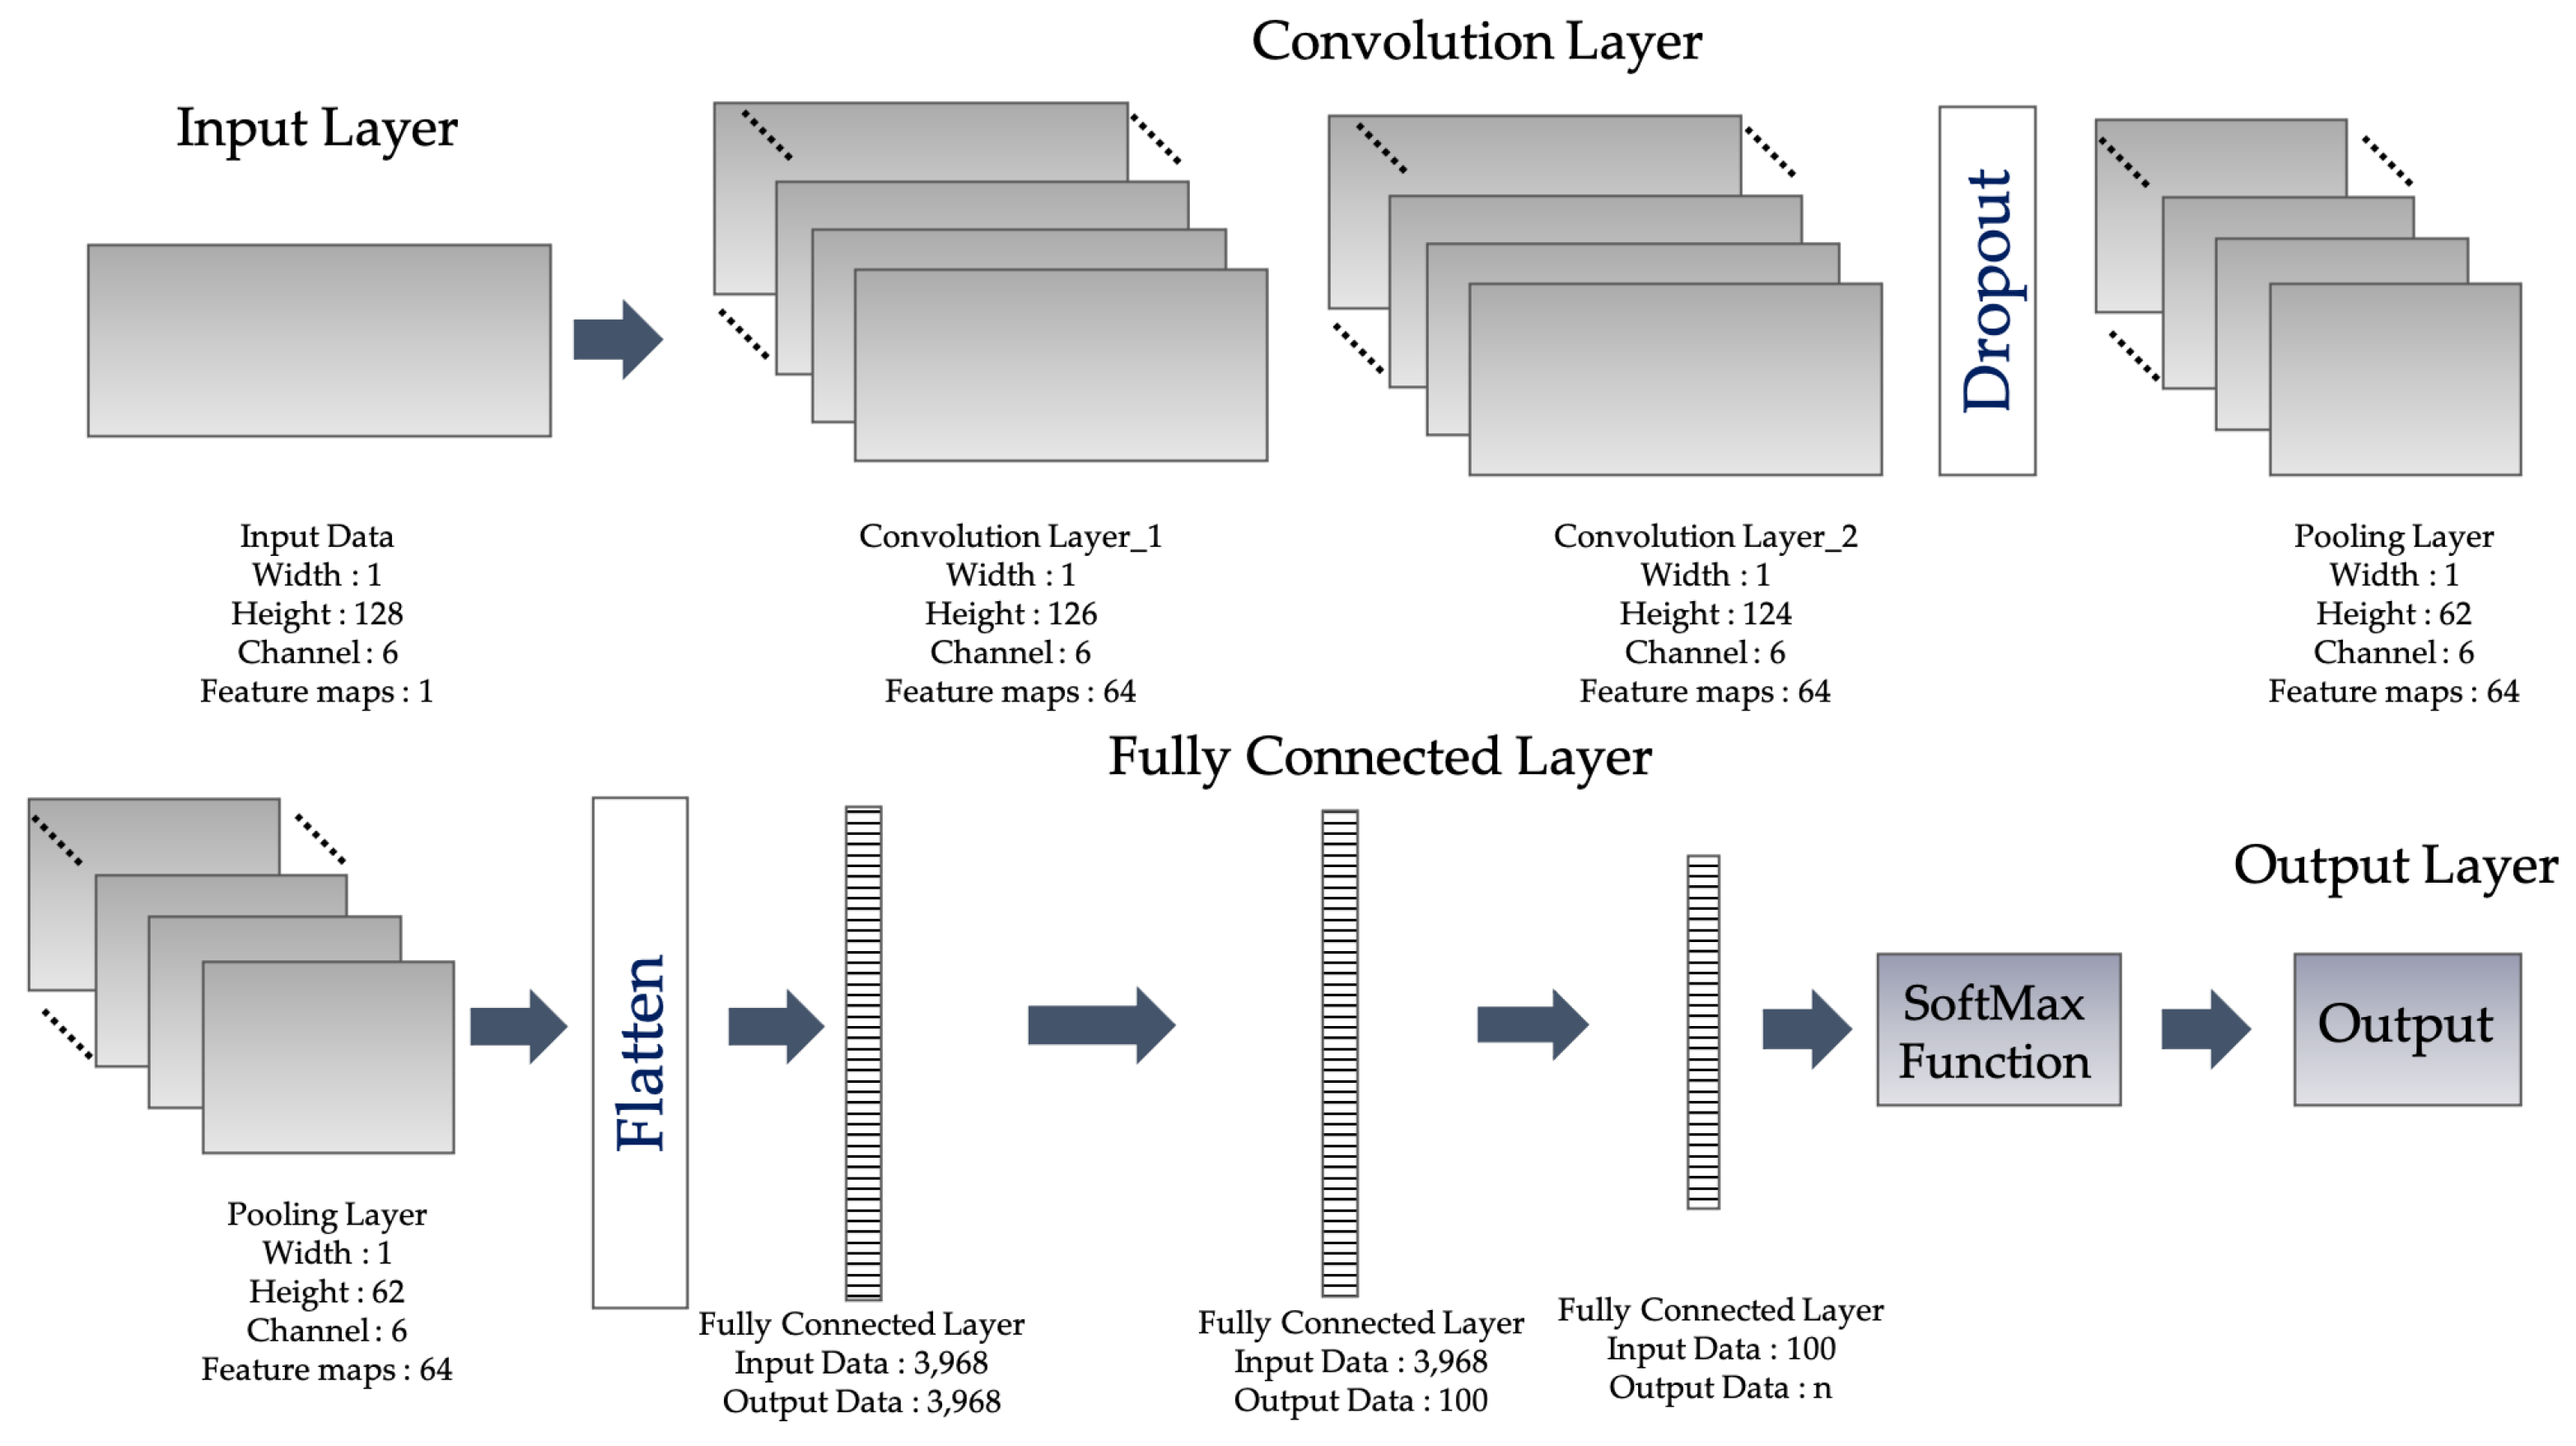
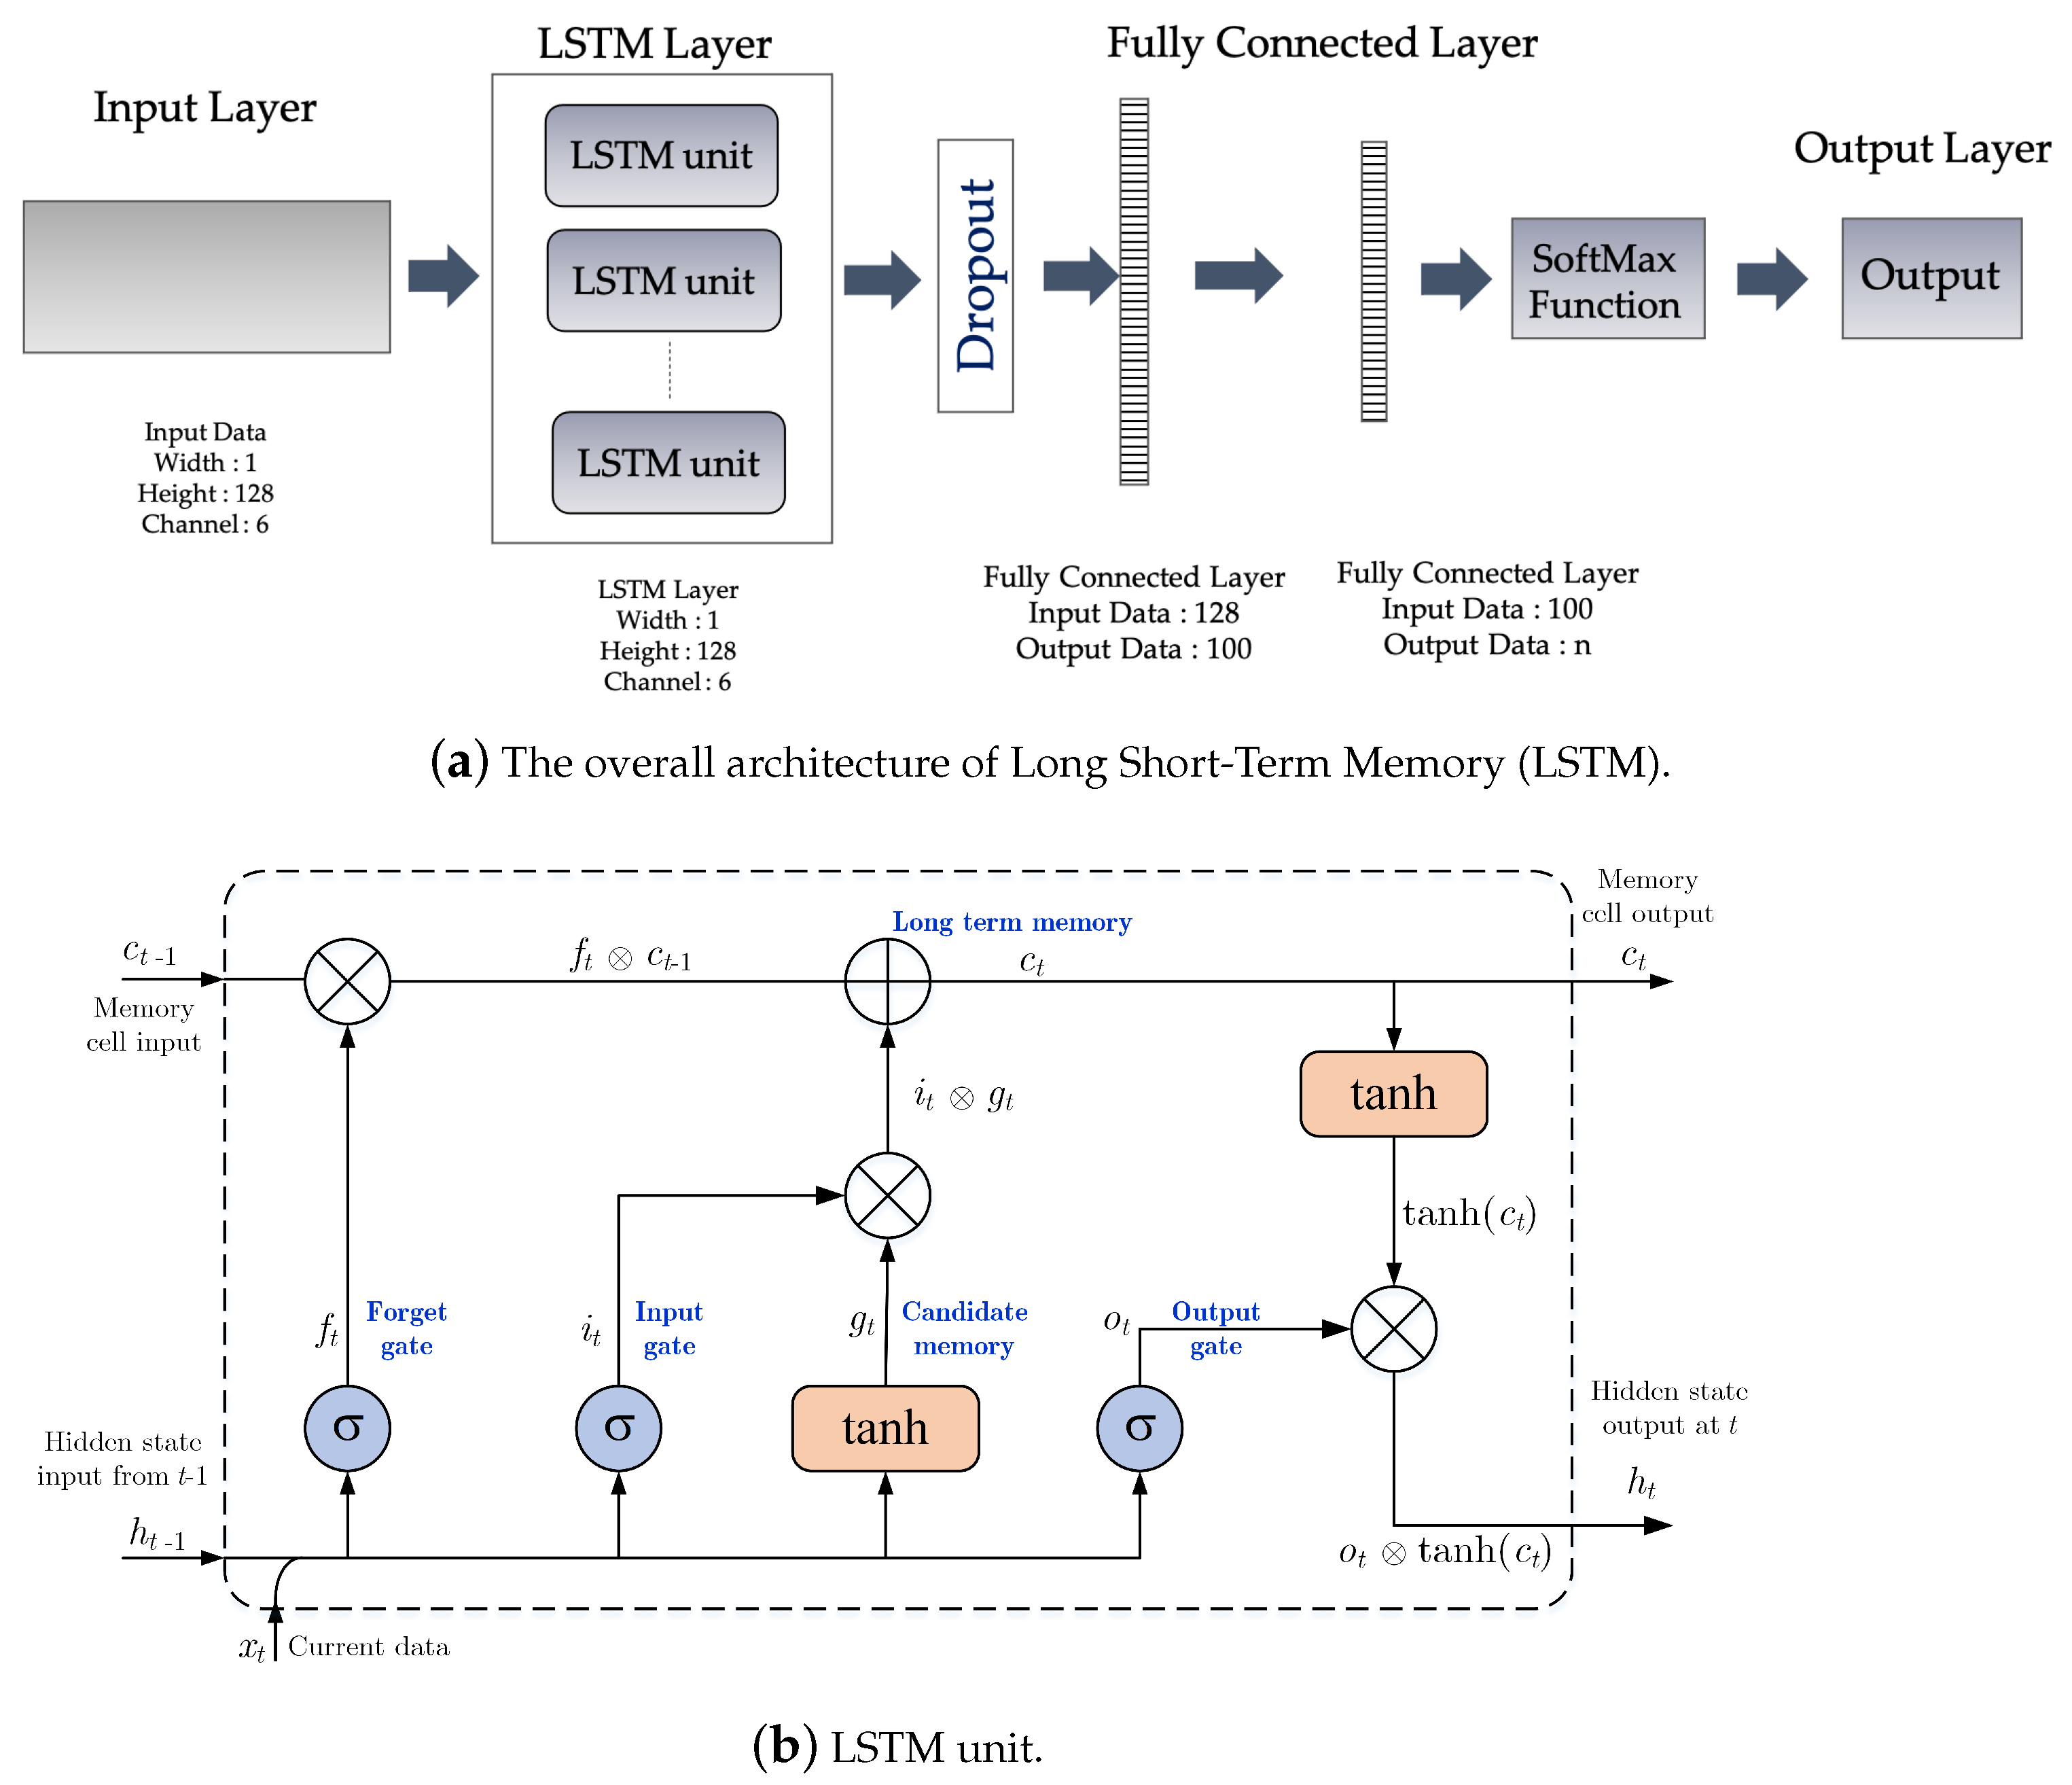
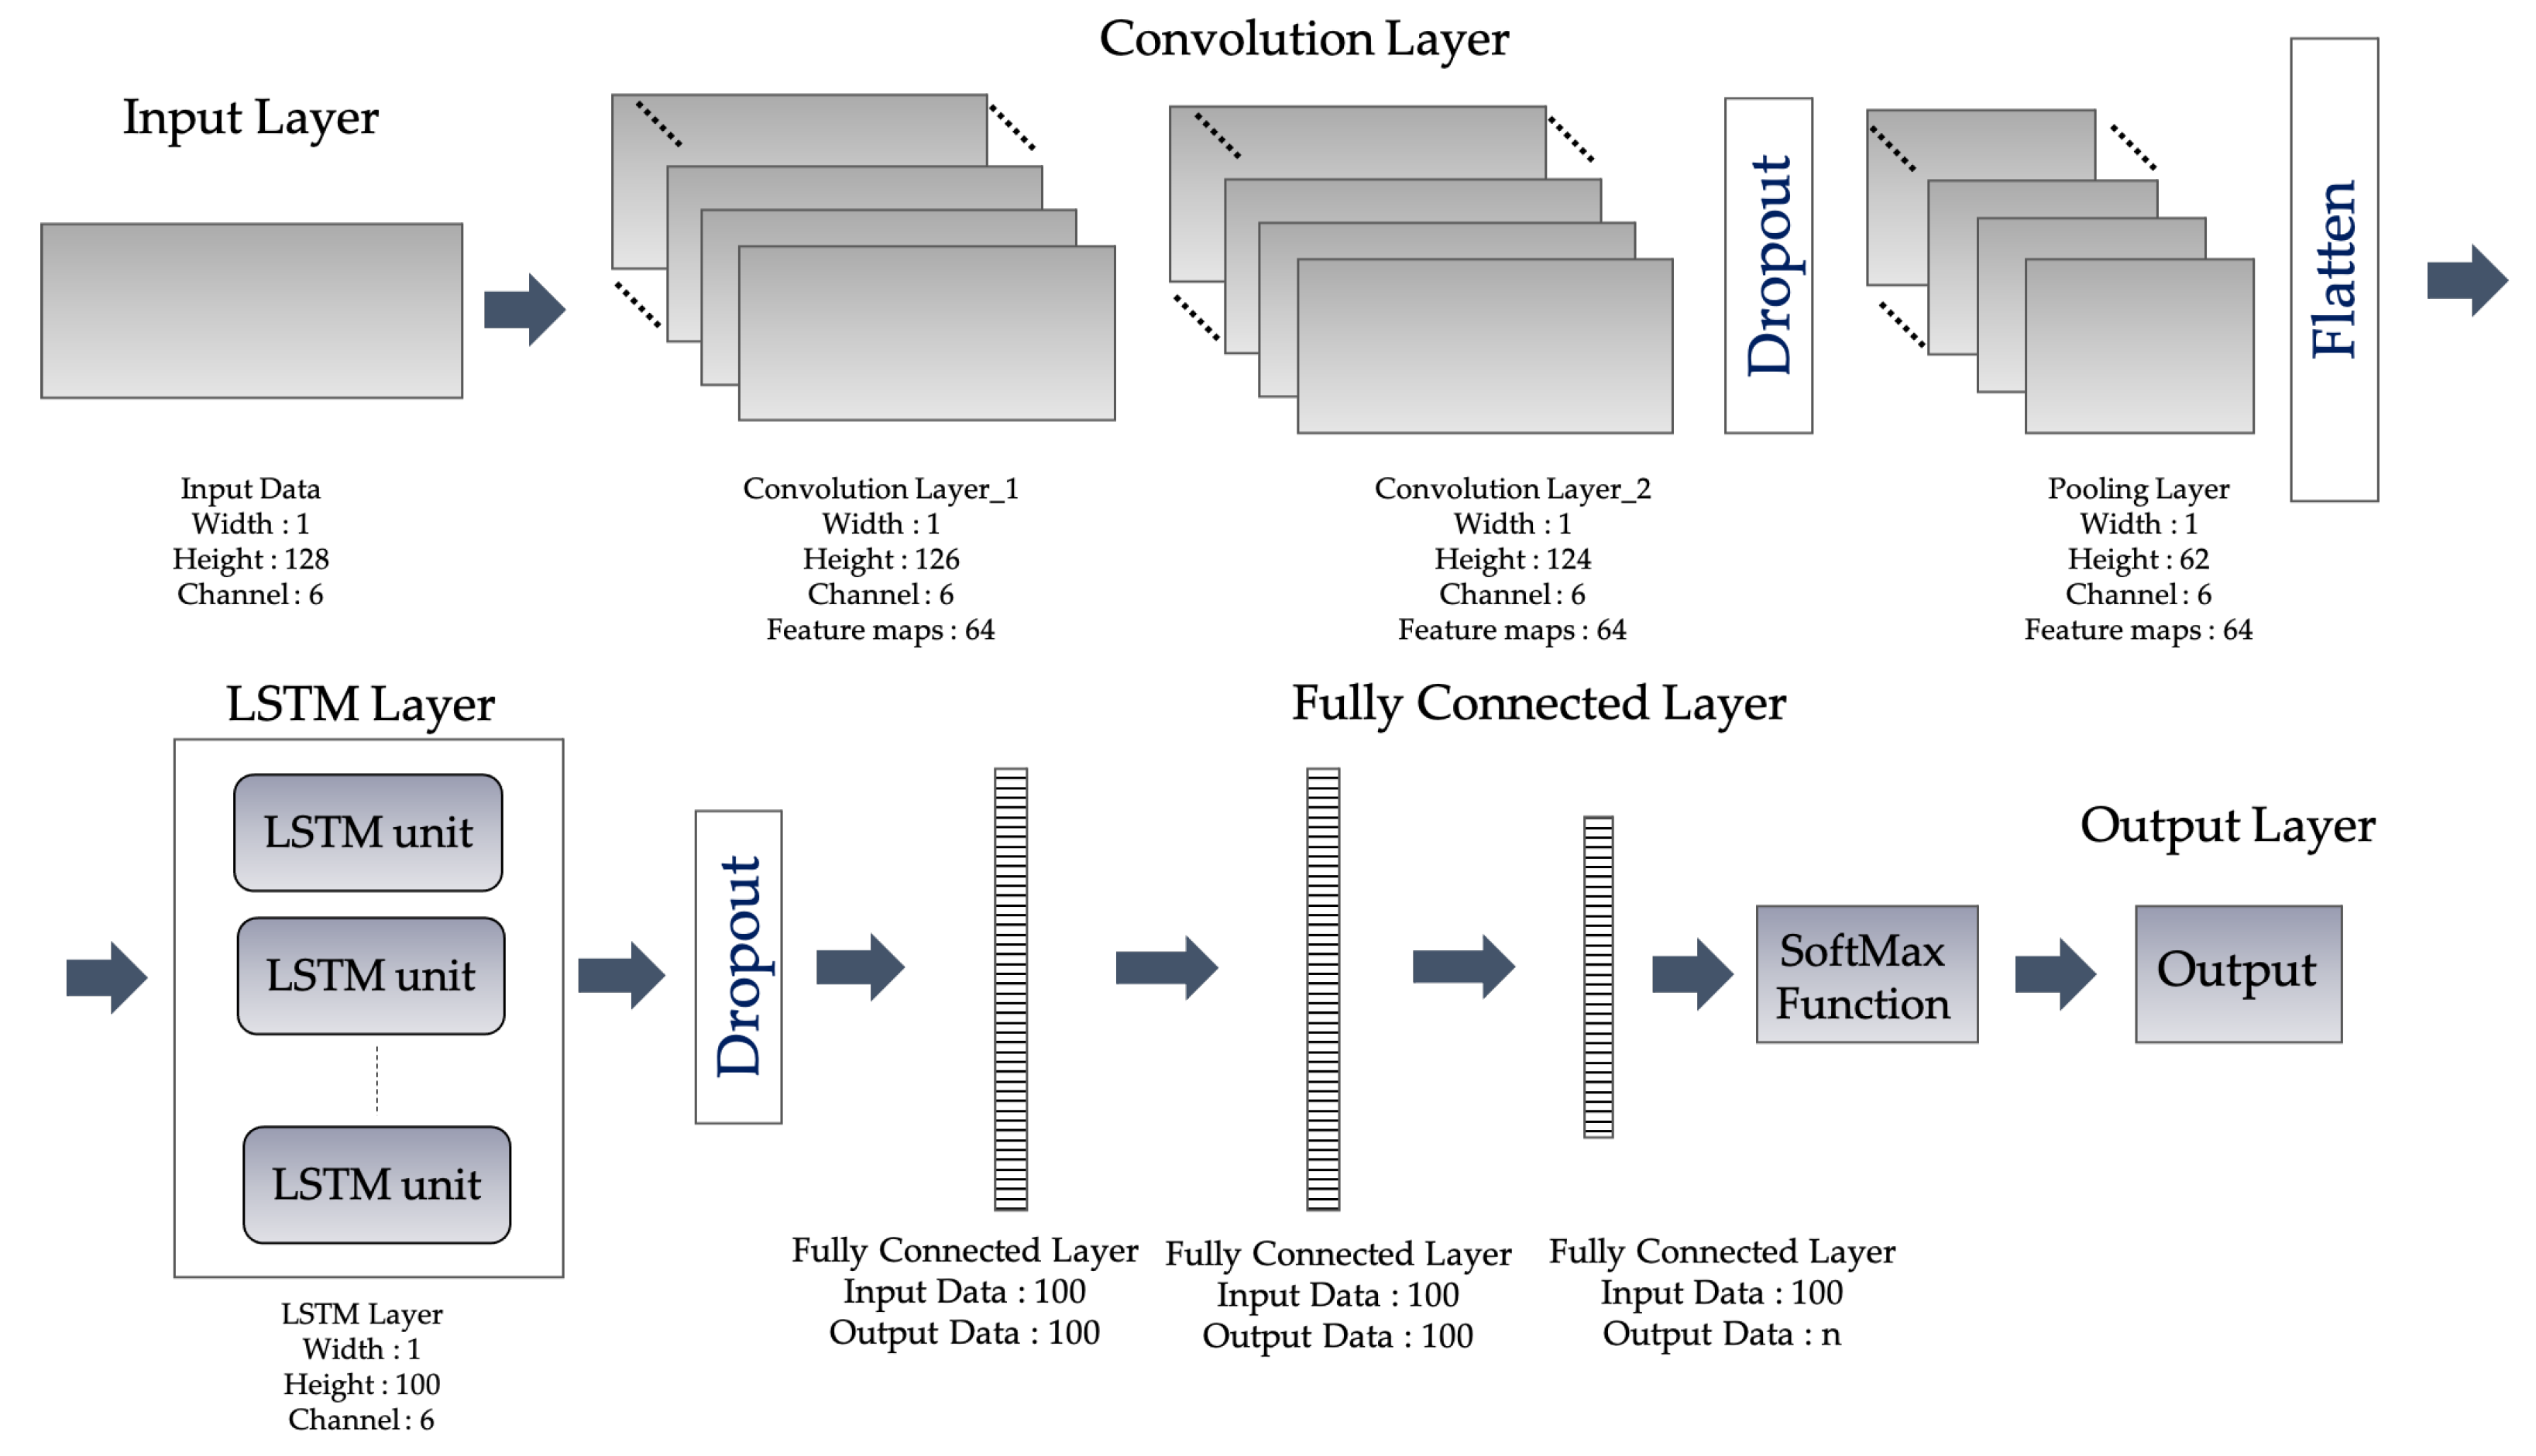
3.1.3. Model Training by Deep Learning Technique
- Convolutional layer,
- Pooling layer, and
- Fully-connected layer.
- Forget gate : Selects the information which is to be eliminated from the cell;
- Input gate : Selects the input values which are to be used in updating the memory state;
- Input modulation gate : Manipulates the preeminent input to the memory cell;
- Output gate : Selects the output on the basis of the input and the cell memory;
- Internal state : Manipulates the constitutional recurrence of cell;
- Hidden state : Manipulates the data from the preceding data case inward the context window.
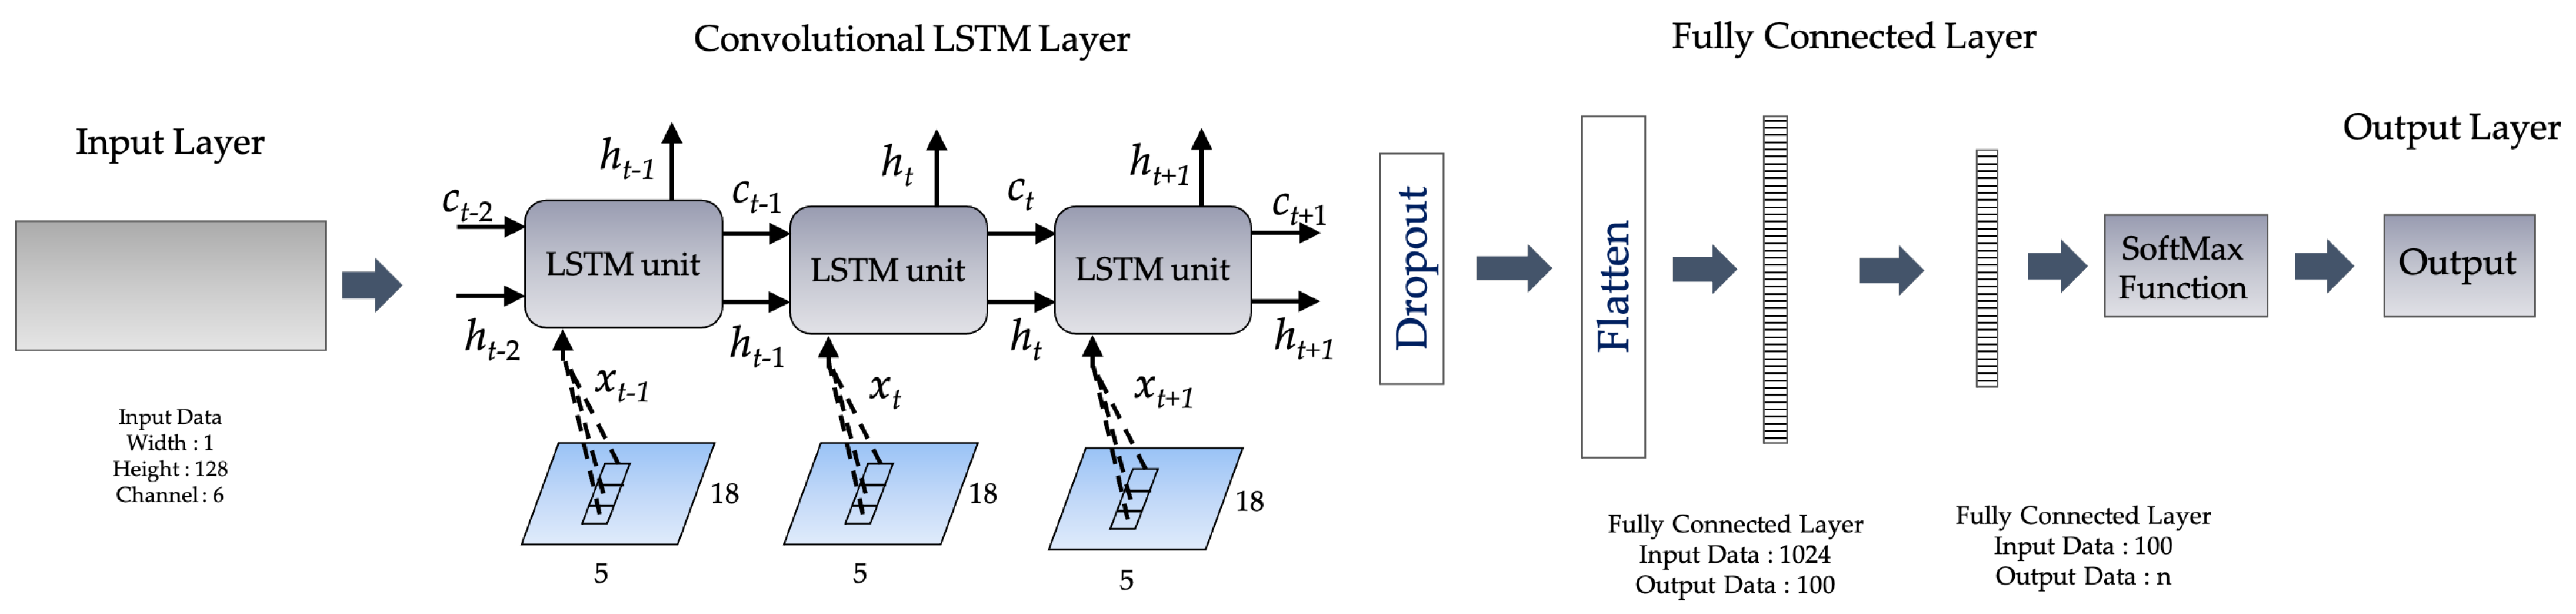
- For CNN-LSTM, the convolution structure is applied as the first layer, and sequentially, an LSTM layer is applied as the second layer;
- For the number of input dimensions, as LSTM input data is one-dimensional, it is not suitable for spatial sequential data. ConvLSTM is designed for 3D data as its input.
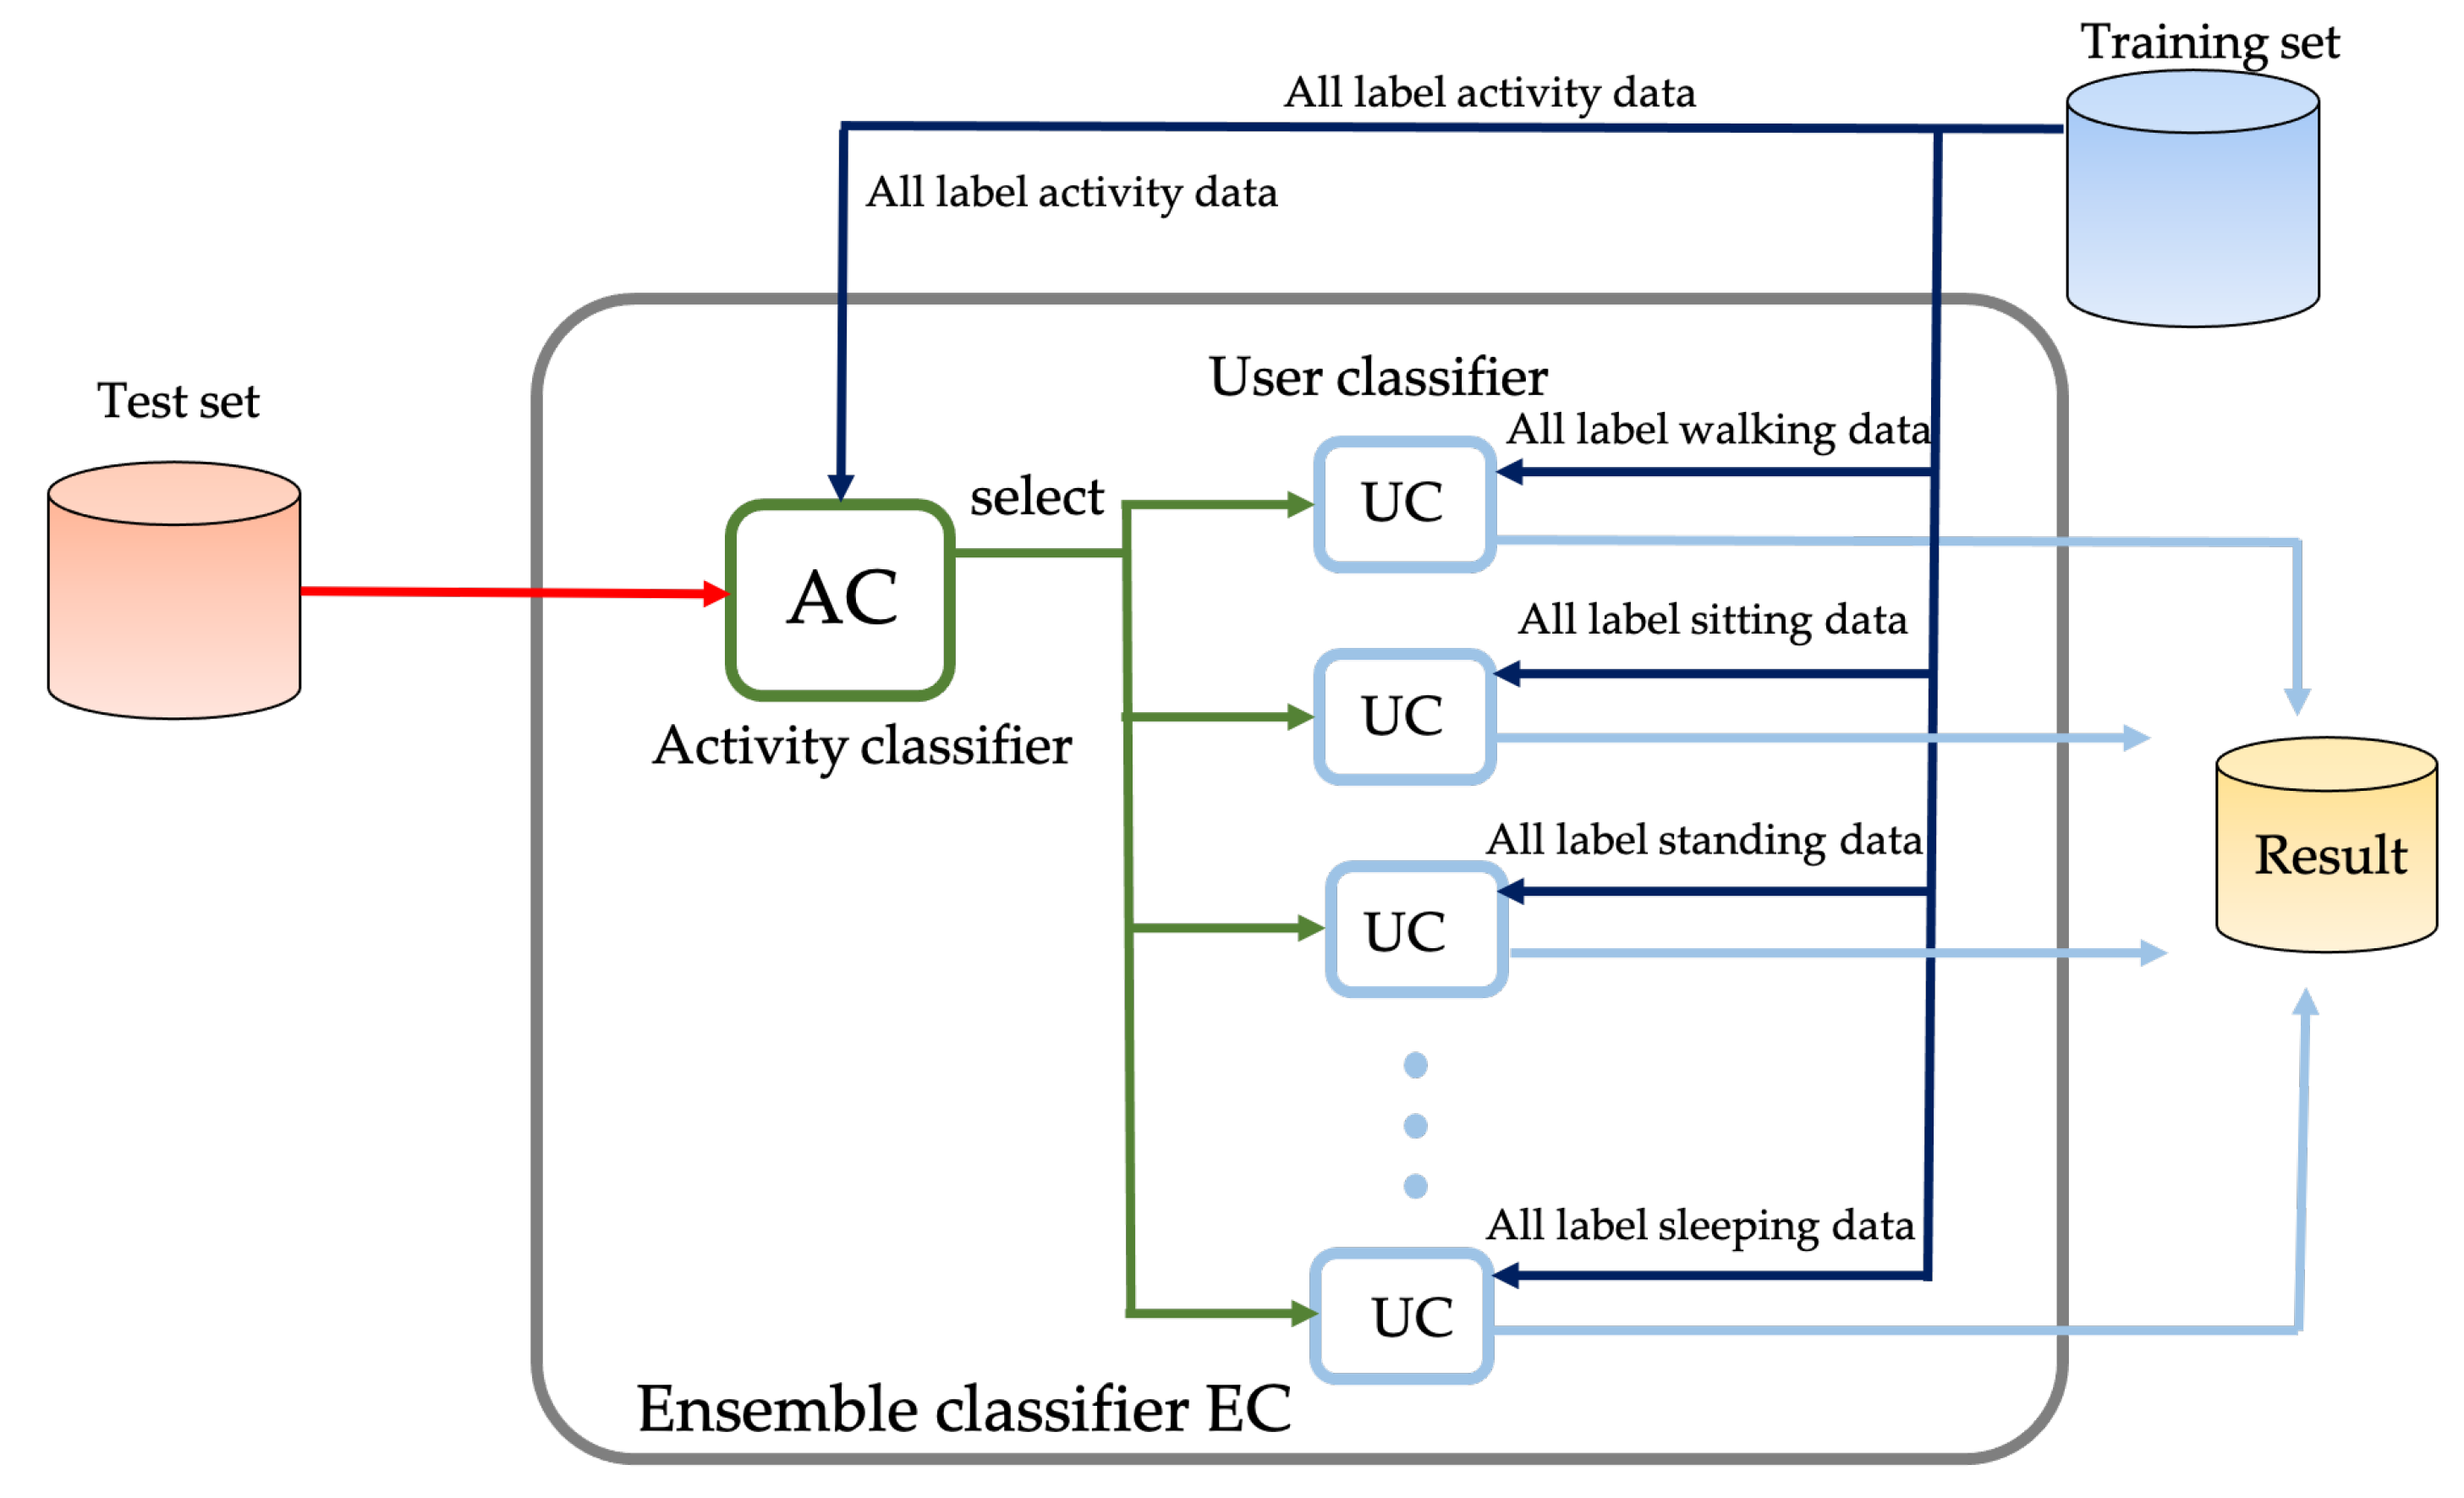
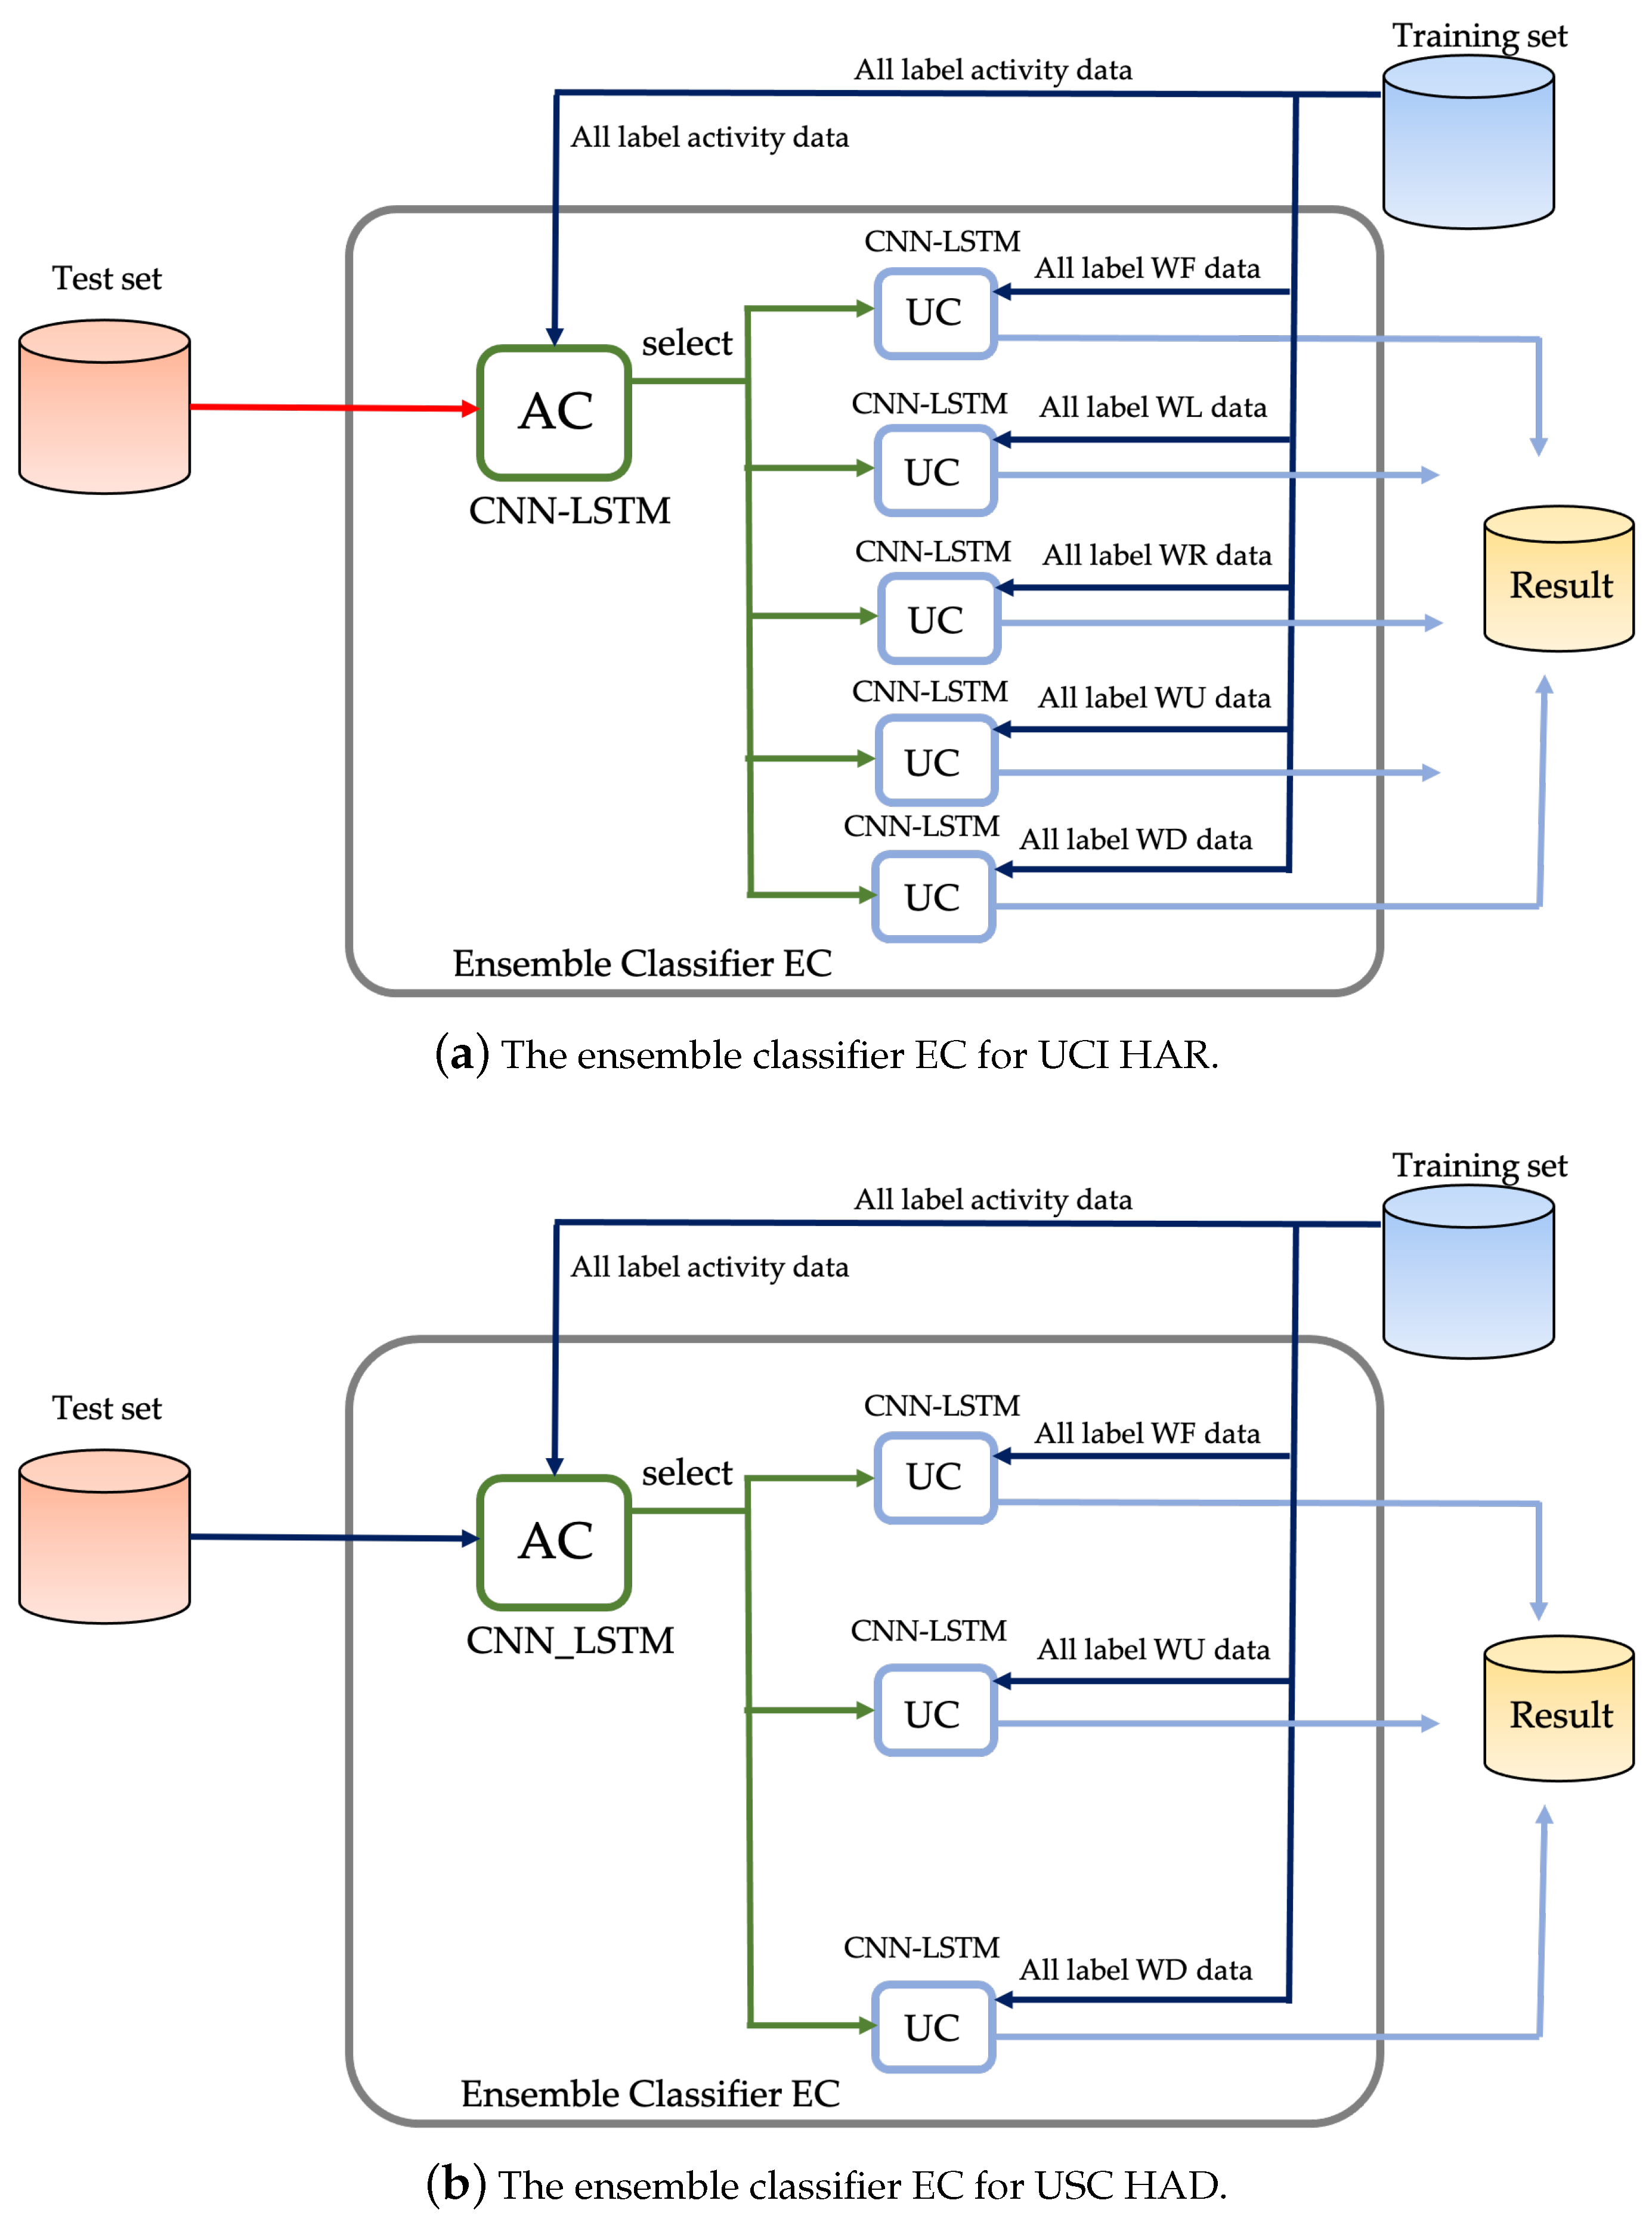
3.1.4. User Identification
- A User Classifier (UC) is able to characterize the user from the human activities data;
- An Ensemble Classifier (EC) obtained as the combination of the one AC to detect the activity and UC classifiers to identify the user from sensory data.
- First layer: The activity classification is operated through the AC;
- Second layer: The UC is used to perform the user identification.
4. Experiments and Results
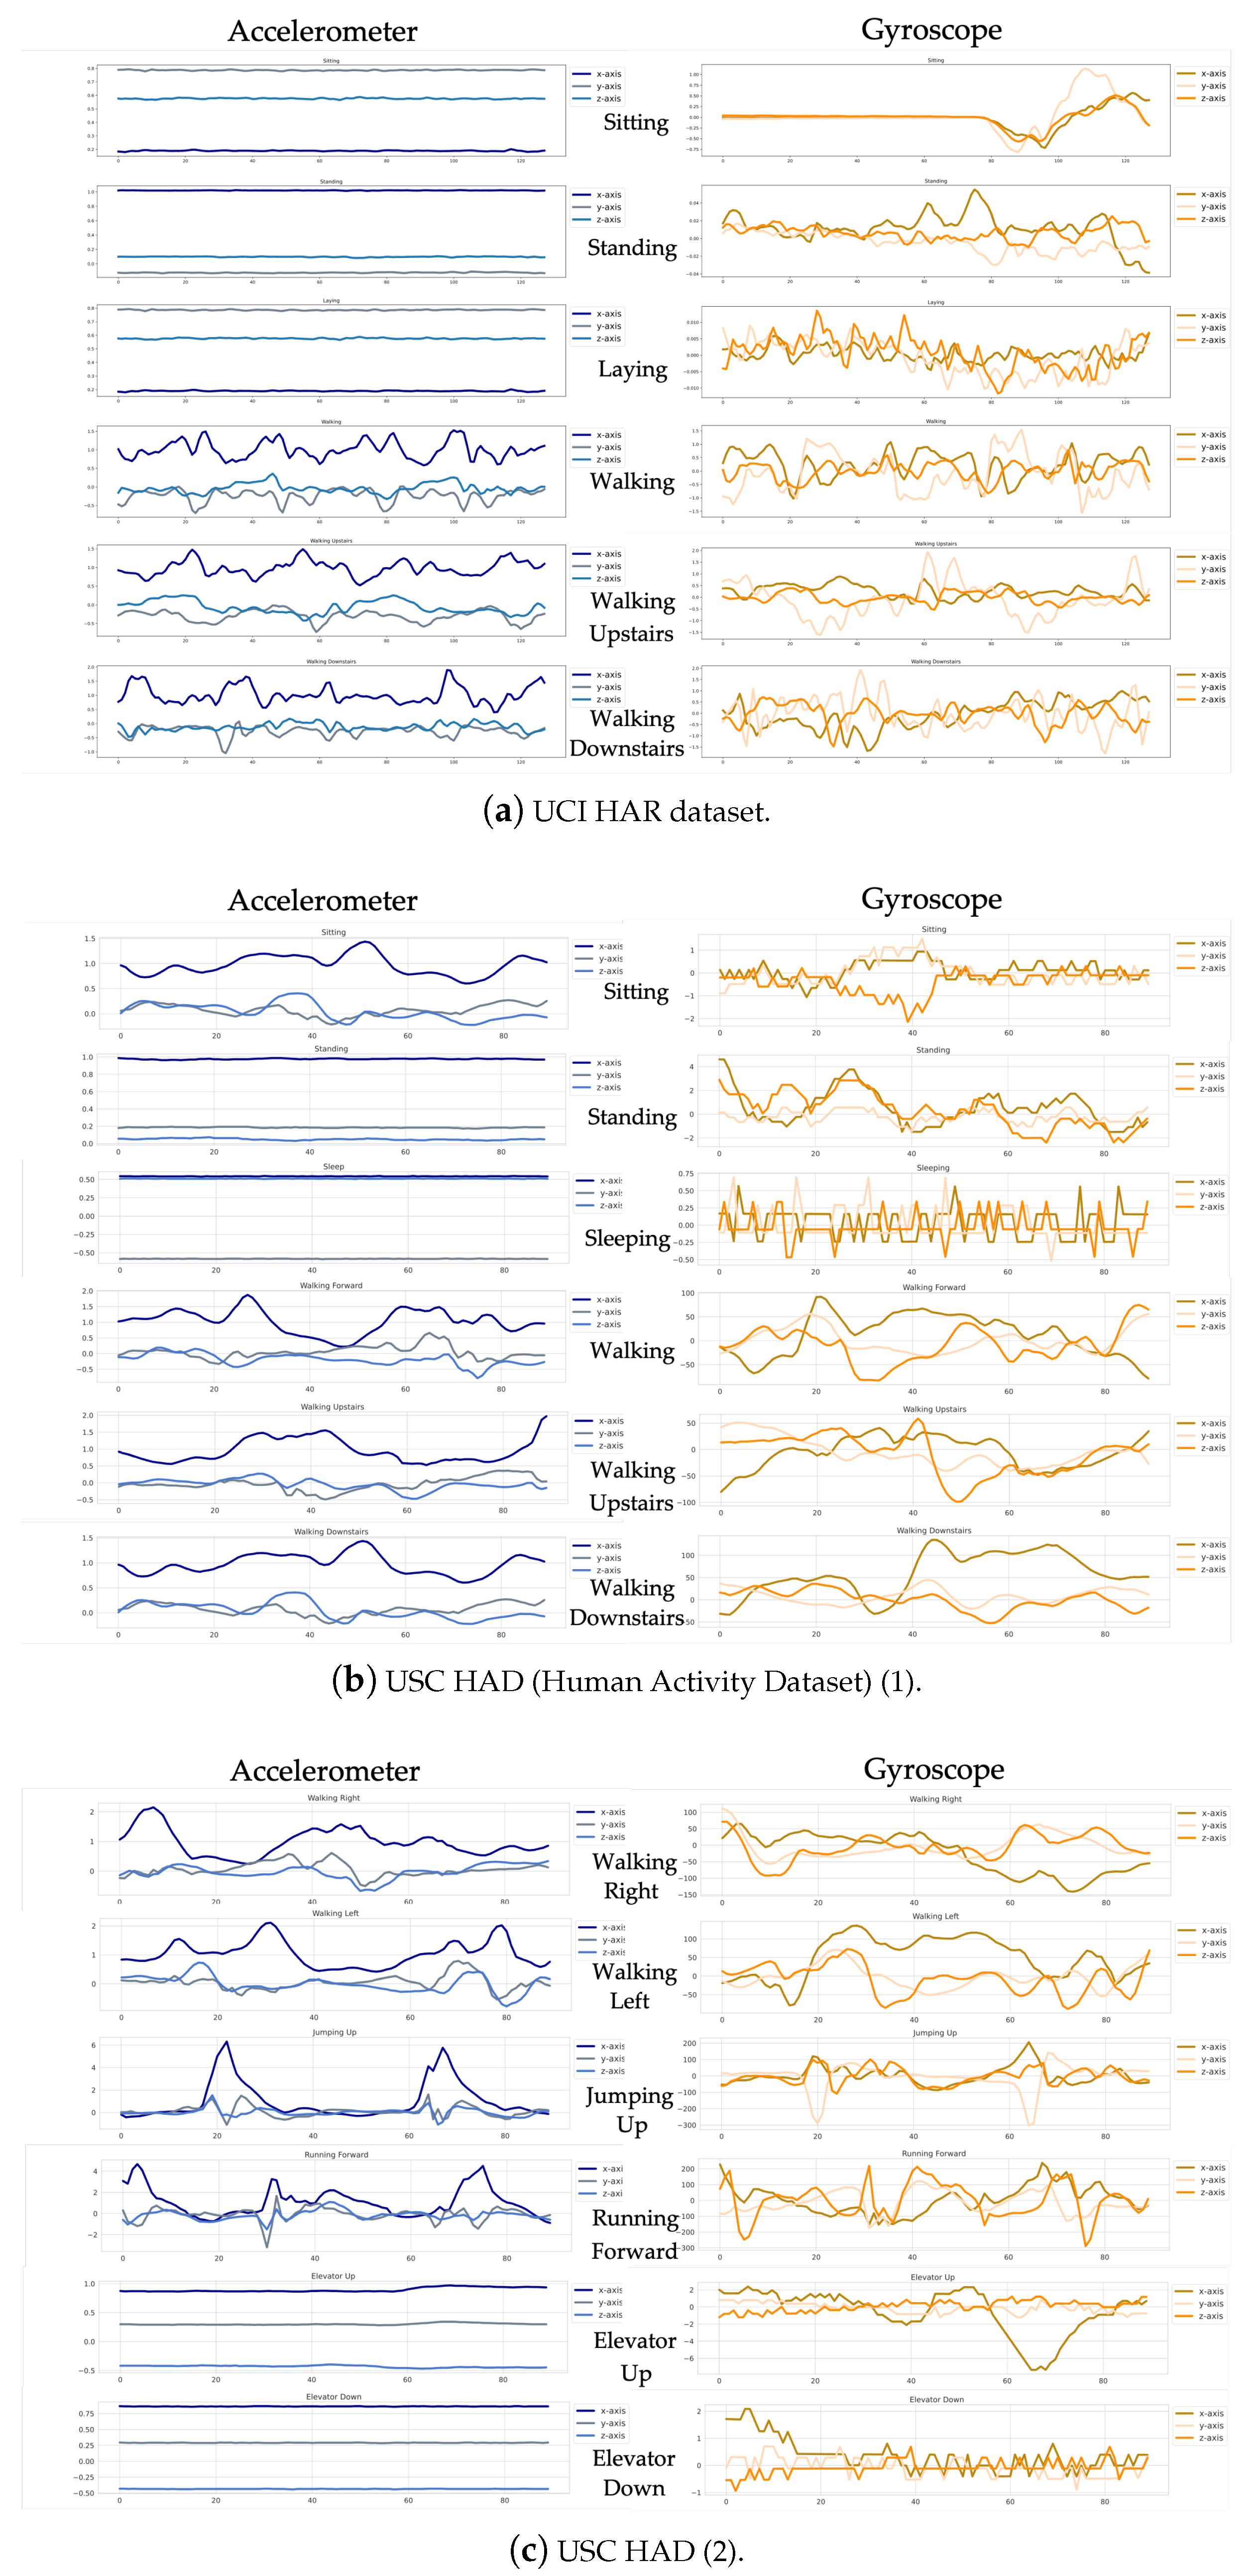
4.1. Data Analysis
- First Dataset—The UCI Human Activity Recognition Dataset (UCI HAR), recorded with an embedded accelerometer and gyroscope in a smartphone (Samsung Galaxy S II) on the waists of 30 subjects. The recorded data are tri-axial linear acceleration and tri-axial angular velocity at a constant rate, with a sampling rate of 50 Hz. The subjects were instructed according to the protocol of six selected activities, namely, Standing (St), Sitting (Si), Lying (Sl), Walking Forward (WF), Walking Upstairs (WU), and Walking Downstairs (WD);
- Second Dataset—The USC Human Activity Dataset (USC HAD), recorded with a MotionNode device-embedded tri-axial accelerometer and gyroscope sensors at a sampling rate of 100 Hz. The dataset has activity data recorded with 14 subjects performing 12 activities and five trials each. The activities are ones with the most elemental movements, as follows: Walking Forward (WF), Walking Left (WL), Walking Right (WF), Walking Upstairs (WU), Walking Downstairs (WD), Running Forward (WF), Jumping Up (JU), Sitting (Si), Standing (St), Sleeping (Sl), Elevating Up (EU), and Elevating Down (ED).
4.2. Hardware and Software Setup
- TensorFlow (version 2.2.0);
- Python (version 3.6.8);
- Keras (version 2.3.1).
4.3. Experimental Setup
- Activity classifier (AC), with both UCI HAR and USC HAD datasets, is used to perform activity identification in each dataset;
- The UC is used to perform user identification of each activity;
- The EC is used to present user identification, regardless of activity.
4.4. Evaluation Metrics
- Accuracy (A) is a description of systematic errors. This metric is the ratio of the sum of true positives (TP) and true negatives (TN) to the total number of records;
- Precision (P) is the proportion of the example belonging to the class of a specific category. It is the ratio of the number of relevant retrieved records (TP) to the total number of irrelevant retrieved records;
- Recall (R) is the proportion of examples allowed to the class of a specific category. It is calculated as the ratio of the number of retrieved relevant records (TP) to the total number of relevant records;
- F1-score (F1) is an evaluation of the test’s accuracy calculated as a weighted average of the precision and recall.
4.5. Results and Discussion
- Static Activities: In this environment; sitting, standing, and sleeping activities are considered, where people are stable with respect to the sensor setup in the situation;
- Dynamic Activities: In this environment, walking, jumping up, and running forward are considered, where people are moving continually with respect to the sensor.
| Algorithm 1: Evaluation Measurement |
|
4.6. Additional Experiment
4.7. Comparison with Previous Works
5. Conclusions
Author Contributions
Funding
Conflicts of Interest
References
- Slim, S.O.; Atia, A.; Elfattah, M.M.; Mostafa, M.S.M. Survey on Human Activity Recognition based on Acceleration Data. Int. J. Adv. Comput. Sci. Appl. 2019, 10, 84–98. [Google Scholar] [CrossRef]
- Issarny, V.; Sacchetti, D.; Tartanoglu, F.; Sailhan, F.; Chibout, R.; Levy, N.; Talamona, A. Developing Ambient Intelligence Systems: A Solution based on Web Services. Autom. Softw. Eng. 2005, 12, 101–137. [Google Scholar] [CrossRef] [Green Version]
- Mekruksavanich, S.; Jitpattanakul, A.; Youplao, P.; Yupapin, P. Enhanced Hand-Oriented Activity Recognition Based on Smartwatch Sensor Data Using LSTMs. Symmetry 2020, 12, 1570. [Google Scholar] [CrossRef]
- Osmani, V.; Balasubramaniam, S.; Botvich, D. Human Activity Recognition in Pervasive Health-Care: Supporting Efficient Remote Collaboration. J. Netw. Comput. Appl. 2008, 31, 628–655. [Google Scholar] [CrossRef]
- Ehatisham-ul Haq, M.; Azam, M.A.; Loo, J.; Shuang, K.; Islam, S.; Naeem, U.; Amin, Y. Authentication of Smartphone Users Based on Activity Recognition and Mobile Sensing. Sensors 2017, 17, 2043. [Google Scholar] [CrossRef] [PubMed] [Green Version]
- Mekruksavanich, S.; Jitpattanakul, A. Smartwatch-based Human Activity Recognition Using Hybrid LSTM Network. In Proceedings of the 2020 IEEE Sensors, Rotterdam, The Netherlands, 25–28 October 2020; pp. 1–4. [Google Scholar] [CrossRef]
- Drosou, A.; Ioannidis, D.; Moustakas, K.; Tzovaras, D. Spatiotemporal analysis of human activities for biometric authentication. Comput. Vis. Image Underst. 2012, 116, 411–421. [Google Scholar] [CrossRef]
- Mahfouz, A.; Mahmoud, T.M.; Eldin, A.S. A Survey on Behavioral Biometric Authentication on Smartphones. arXiv 2018, arXiv:1801.09308. [Google Scholar] [CrossRef] [Green Version]
- Mekruksavanich, S.; Jitpattanakul, A. Convolutional Neural Network and Data Augmentation for Behavioral-Based Biometric User Identification. In ICT Systems and Sustainability; Tuba, M., Akashe, S., Joshi, A., Eds.; Springer: Singapore, 2021; pp. 753–761. [Google Scholar]
- Lara, O.; Labrador, M. A Survey on Human Activity Recognition Using Wearable Sensors. IEEE Commun. Surv. Tutor. 2013, 15, 1192–1209. [Google Scholar] [CrossRef]
- Hnoohom, N.; Mekruksavanich, S.; Jitpattanakul, A. Human Activity Recognition Using Triaxial Acceleration Data from Smartphone and Ensemble Learning. In Proceedings of the 2017 13th International Conference on Signal-Image Technology Internet-Based Systems (SITIS), Jaipur, India, 4–7 December 2017; pp. 408–412. [Google Scholar] [CrossRef]
- Chrungoo, A.; Manimaran, S.S.; Ravindran, B. Activity Recognition for Natural Human Robot Interaction. In Social Robotics; Beetz, M., Johnston, B., Williams, M.A., Eds.; Springer International Publishing: Cham, Switzerland, 2014; pp. 84–94. [Google Scholar]
- Gehrig, D.; Krauthausen, P.; Rybok, L.; Kuehne, H.; Hanebeck, U.D.; Schultz, T.; Stiefelhagen, R. Combined Intention, Activity, and Motion Recognition for a Humanoid Household Robot. In Proceedings of the IEEE/RSJ International Conference on Intelligent Robots and Systems (IROS 2011), San Francisco, CA, USA, 25–30 September 2011. [Google Scholar]
- Yousefi, B.; Loo, C.K. Biologically-Inspired Computational Neural Mechanism for Human Action/activity Recognition: A Review. Electronics 2019, 8, 1169. [Google Scholar] [CrossRef] [Green Version]
- Mekruksavanich, S.; Jitpattanakul, A. Exercise Activity Recognition with Surface Electromyography Sensor using Machine Learning Approach. In Proceedings of the 2020 Joint International Conference on Digital Arts, Media and Technology with ECTI Northern Section Conference on Electrical, Electronics, Computer and Telecommunications Engineering (ECTI DAMT and NCON), Pattaya, Thailand, 11–14 March 2020; pp. 75–78. [Google Scholar] [CrossRef]
- Tripathi, R.K.; Jalal, A.S.; Agrawal, S.C. Suspicious Human Activity Recognition: A Review. Artif. Intell. Rev. 2018, 50, 283–339. [Google Scholar] [CrossRef]
- Damaševičius, R.; Maskeliūnas, R.; Venčkauskas, A.; Woźniak, M. Smartphone User Identity Verification Using Gait Characteristics. Symmetry 2016, 8, 100. [Google Scholar] [CrossRef]
- Rault, T.; Bouabdallah, A.; Challal, Y.; Marin, F. A Survey of Energy-Efficient Context Recognition Systems Using Wearable Sensors for Healthcare Applications. Pervasive Mob. Comput. 2017, 37, 23–44. [Google Scholar] [CrossRef] [Green Version]
- Fookes, C.; Denman, S.; Lakemond, R.; Ryan, D.; Sridharan, S.; Piccardi, M. Semi-supervised intelligent surveillance system for secure environments. In Proceedings of the 2010 IEEE International Symposium on Industrial Electronics, Bari, Italy, 4–7 July 2010; pp. 2815–2820. [Google Scholar]
- Zhou, Z.; Chen, X.; Chung, Y.C.; He, Z.; Han, T.; Keller, J. Activity Analysis, Summarization, and Visualization for Indoor Human Activity Monitoring. IEEE Trans. Circuits Syst. Video Technol. 2008, 18, 1489–1498. [Google Scholar] [CrossRef] [Green Version]
- Zhan, Y.; Miura, S.; Nishimura, J.; Kuroda, T. Human Activity Recognition from Environmental Background Sounds for Wireless Sensor Networks. In Proceedings of the 2007 IEEE International Conference on Networking, Sensing and Control, London, UK, 15–17 April 2007; pp. 307–312. [Google Scholar]
- Dong, B.; Biswas, S. Wearable Networked Sensing for Human Mobility and Activity Analytics: A Systems Study. In Proceedings of the 2012 Fourth International Conference on Communication Systems and Networks (COMSNETS 2012), Bangalore, India, 3–7 January 2012; Volume 2012, pp. 1–6. [Google Scholar] [CrossRef] [Green Version]
- Curone, D.; Bertolotti, G.M.; Cristiani, A.; Secco, E.L.; Magenes, G. A Real-Time and Self-Calibrating Algorithm Based on Triaxial Accelerometer Signals for the Detection of Human Posture and Activity. IEEE Trans. Inf. Technol. Biomed. 2010, 14, 1098–1105. [Google Scholar] [CrossRef] [PubMed]
- Wang, J.; Chen, Y.; Hao, S.; Peng, X.; Hu, L. Deep learning for sensor-based activity recognition: A survey. Pattern Recognit. Lett. 2019, 119, 3–11. [Google Scholar] [CrossRef] [Green Version]
- Jiang, W.; Yin, Z. Human Activity Recognition Using Wearable Sensors by Deep Convolutional Neural Networks. In Proceedings of the 23rd ACM International Conference on Multimedia (MM ’15), Brisbane, Australia, 26–30 October 2015; Association for Computing Machinery: New York, NY, USA, 2015; pp. 1307–1310. [Google Scholar] [CrossRef]
- Zhang, L.; Wu, X.; Luo, D. Recognizing Human Activities from Raw Accelerometer Data Using Deep Neural Networks. In Proceedings of the 2015 IEEE 14th International Conference on Machine Learning and Applications (ICMLA), Miami, FL, USA, 9–11 December 2015; pp. 865–870. [Google Scholar]
- Ordóñez, F.; Roggen, D. Deep Convolutional and LSTM Recurrent Neural Networks for Multimodal Wearable Activity Recognition. Sensors 2016, 16, 115. [Google Scholar] [CrossRef] [Green Version]
- Hammerla, N.Y.; Halloran, S.; Plötz, T. Deep, Convolutional, and Recurrent Models for Human Activity Recognition Using Wearables. In Proceedings of the Twenty-Fifth International Joint Conference on Artificial Intelligence (IJCAI’16), New York, NY, USA, 9–15 July 2016; AAAI Press: Menlo Park, CA, USA, 2016; pp. 1533–1540. [Google Scholar]
- Chavarriaga, R.; Sagha, H.; Calatroni, A.; Digumarti, S.T.; Tröster, G.; Millán, J.d.R.; Roggen, D. The Opportunity challenge: A benchmark database for on-body sensor-based activity recognition. Pattern Recognit. Lett. 2013, 34, 2033–2042. [Google Scholar] [CrossRef] [Green Version]
- Plötz, T.; Hammerla, N.Y.; Olivier, P. Feature Learning for Activity Recognition in Ubiquitous Computing. In Proceedings of the Twenty-Second International Joint Conference on Artificial Intelligence (IJCAI’11), Barcelona, Spain, 16–22 July 2011; AAAI Press: Menlo Park, CA, USA, 2011; Volume 2, pp. 1729–1734. [Google Scholar]
- Anguita, D.; Ghio, A.; Oneto, L.; Parra, X.; Reyes-Ortiz, J. A Public Domain Dataset for Human Activity Recognition using Smartphones. In Proceedings of the ESANN 2013 Proceedings, European Symposium on Artificial Neural Networks, Computational Intelligence and Machine Learning, Bruges, Belgium, 24–26 April 2013. [Google Scholar]
- Kataria, A.N.; Adhyaru, D.M.; Sharma, A.K.; Zaveri, T.H. A survey of automated biometric authentication techniques. In Proceedings of the 2013 Nirma University International Conference on Engineering (NUiCONE), Ahmedabad, India, 28–30 November 2013; pp. 1–6. [Google Scholar]
- Ailisto, H.J.; Lindholm, M.; Mantyjarvi, J.; Vildjiounaite, E.; Makela, S.M. Identifying people from gait pattern with accelerometers. In Biometric Technology for Human Identification II; Jain, A.K., Ratha, N.K., Eds.; International Society for Optics and Photonics, SPIE: Bellingham, WA, USA, 2005; Volume 5779, pp. 7–14. [Google Scholar] [CrossRef]
- Kwapisz, J.R.; Weiss, G.M.; Moore, S.A. Cell phone-based biometric identification. In Proceedings of the 2010 Fourth IEEE International Conference on Biometrics: Theory, Applications and Systems (BTAS), Washington, DC, USA, 27–29 September 2010; pp. 1–7. [Google Scholar]
- Juefei-Xu, F.; Bhagavatula, C.; Jaech, A.; Prasad, U.; Savvides, M. Gait-ID on the move: Pace independent human identification using cell phone accelerometer dynamics. In Proceedings of the 2012 IEEE Fifth International Conference on Biometrics: Theory, Applications and Systems (BTAS), Arlington, VA, USA, 23–27 September 2012; pp. 8–15. [Google Scholar]
- Zhang, M.; Sawchuk, A. USC-HAD: A daily activity dataset for ubiquitous activity recognition using wearable sensors. In Proceedings of the 2012 ACM Conference on Ubiquitous Computing, Pittsburgh, PA, USA, 5–8 September 2012; pp. 1036–1043. [Google Scholar] [CrossRef]
- Pires, I.M.; Hussain, F.; Garcia, N.M.; Zdravevski, E. Improving Human Activity Monitoring by Imputation of Missing Sensory Data: Experimental Study. Future Internet 2020, 12, 155. [Google Scholar] [CrossRef]
- Xia, K.; Huang, J.; Wang, H. LSTM-CNN Architecture for Human Activity Recognition. IEEE Access 2020, 8, 56855–56866. [Google Scholar] [CrossRef]
- Cho, H.; Yoon, S.M. Divide and Conquer-Based 1D CNN Human Activity Recognition Using Test Data Sharpening. Sensors 2018, 18, 1055. [Google Scholar] [CrossRef] [Green Version]


| Stage | Hyperparameters | Values | |
|---|---|---|---|
| Architecture | Convolution-1 | Kernel Size | 3 |
| Stride | 1 | ||
| Filters | 64 | ||
| Convolution-2 | Kernel Size | 3 | |
| Stride | 1 | ||
| Filters | 64 | ||
| Dropout-1 | 0.5 | ||
| Maxpooling | 2 | ||
| Dense | 100 | ||
| Training | Loss Function | Cross-entropy | |
| Optimizer | Adam | ||
| Batch Size | 64 | ||
| Number of Epoches | 50 | ||
| Stage | Hyperparameters | Values |
|---|---|---|
| Architecture | LSTM neuron | 100 |
| Dropout-1 | 0.5 | |
| Dense | 100 | |
| Training | Loss Function | Cross-entropy |
| Optimizer | Adam | |
| Batch Size | 64 | |
| Number of Epoches | 50 |
| Stage | Hyperparameters | Values | |
|---|---|---|---|
| Architecture | Convolution-1 | Kernel Size | 3 |
| Stride | 1 | ||
| Filters | 64 | ||
| Convolution-2 | Kernel Size | 3 | |
| Stride | 1 | ||
| Filters | 64 | ||
| Dropout-1 | 0.5 | ||
| Maxpooling | 2 | ||
| LSTM neuron | 100 | ||
| Dropout-2 | 0.5 | ||
| Dense | 100 | ||
| Training | Loss Function | Cross-entropy | |
| Optimizer | Adam | ||
| Batch Size | 64 | ||
| Number of Epoches | 50 | ||
| Stage | Hyperparameters | Values | |
|---|---|---|---|
| Architecture | ConvLSTM | Kernel Size | (1, 3) |
| Stride | (1, 1) | ||
| Filters | 64 | ||
| Dropout-1 | 0.5 | ||
| Dense | 100 | ||
| Training | Loss Function | Cross-entropy | |
| Optimizer | Adam | ||
| Batch Size | 64 | ||
| Number of Epoches | 50 | ||
| Data Source | No. of Activities | Sensor Type | No. of Subjects | Sampling Rate | Training Window Length |
|---|---|---|---|---|---|
| UCI HAR | 6 | 3D-Acc, 3D-Gyro | 30 | 50 Hz | 128 |
| USC HAD | 12 | 3D-Acc, 3D-Gyro | 14 | 100 Hz | 128 |
| Dataset | Activity | Abbreviation | Description |
|---|---|---|---|
| UCI HAR [31] | Walking Forward | WF | Subject walks forward in a straight line |
| Walking Upstairs | WU | Subject goes up multiple flights | |
| Walking Downstairs | WD | Subject goes down multiple flights | |
| Sitting | Si | Subject sits on a chair either working or resting. | |
| Standing | St | Subject stands and talks to someone | |
| Laying | Sl | Subject sleeps or lies down on a bed | |
| USC HAD [36] | Walking Forward | WF | Subject walks forward in a straight line |
| Walking Left | WL | Subject walks counter-clockwise in a full circle | |
| Walking Right | WR | Subject walks clockwise in a full circle | |
| Walking Upstairs | WU | Subject goes up multiple flights | |
| Walking Downstairs | WD | Subject goes down multiple flights | |
| Running Forward | RF | Subject runs forward in a straight line | |
| Jumping Up | JU | Subject stays at the same position and continuously jumps up and down | |
| Sitting | Si | Subject sits on a chair either working or resting. | |
| Standing | St | Subject stands and talks to someone | |
| Sleeping | Sl | Subject sleeps or lies down on a bed | |
| Elevator Up | EU | Subject rides in an ascending elevator | |
| Elevator Down | ED | Subject rides in a descending elevator |
| Dataset | Activity | Abbreviation | No. of Samples | Sample Percent of Each Human Activity |
|---|---|---|---|---|
| UCI HAR [31] | Walking | WF | 1722 | 16.72% |
| Walking Upstairs | WU | 1544 | 14.99% | |
| Walking Downstairs | WD | 1406 | 13.65% | |
| Sitting | Si | 1777 | 17.25% | |
| Standing | St | 1906 | 18.51% | |
| Laying | Sl | 1944 | 18.88% | |
| USC HAD [36] | Walking Forward | WF | 8476 | 13.57% |
| Walking Left | WL | 5872 | 9.39% | |
| Walking Right | WR | 5991 | 9.59% | |
| Walking Upstairs | WU | 4709 | 7.54% | |
| Walking Downstairs | WD | 4382 | 7.01% | |
| Running Forward | RF | 3921 | 6.28% | |
| Jumping Up | JU | 2383 | 3.81% | |
| Sitting | Si | 5810 | 9.29% | |
| Standing | St | 5240 | 8.39% | |
| Sleeping | Sl | 8331 | 13.33% | |
| Elevator Up | EU | 3687 | 5.90% | |
| Elevator Down | ED | 3674 | 5.88% |
| Activity | UCI HAR | USC HAD |
|---|---|---|
| Dynamic Activiy | WF, WU, WD | WF, WL, WR, WU, WD, RF, JU |
| Static Activity | Si, St, Sl | Si, St, Sl, EU, ED |
| Model | %Accuracy (±Std) of Activity Data | |
|---|---|---|
| UCI HAR | USC HAD | |
| CNN | 90.322 (1.133) | 85.656 (0.596) |
| LSTM | 90.278 (1.072) | 83.112 (0.932) |
| CNN-LSTM | 90.356 (8.841) | 87.773 (0.307) |
| ConvLSTM | 91.235 (0.906) | 85.571 (0.813) |
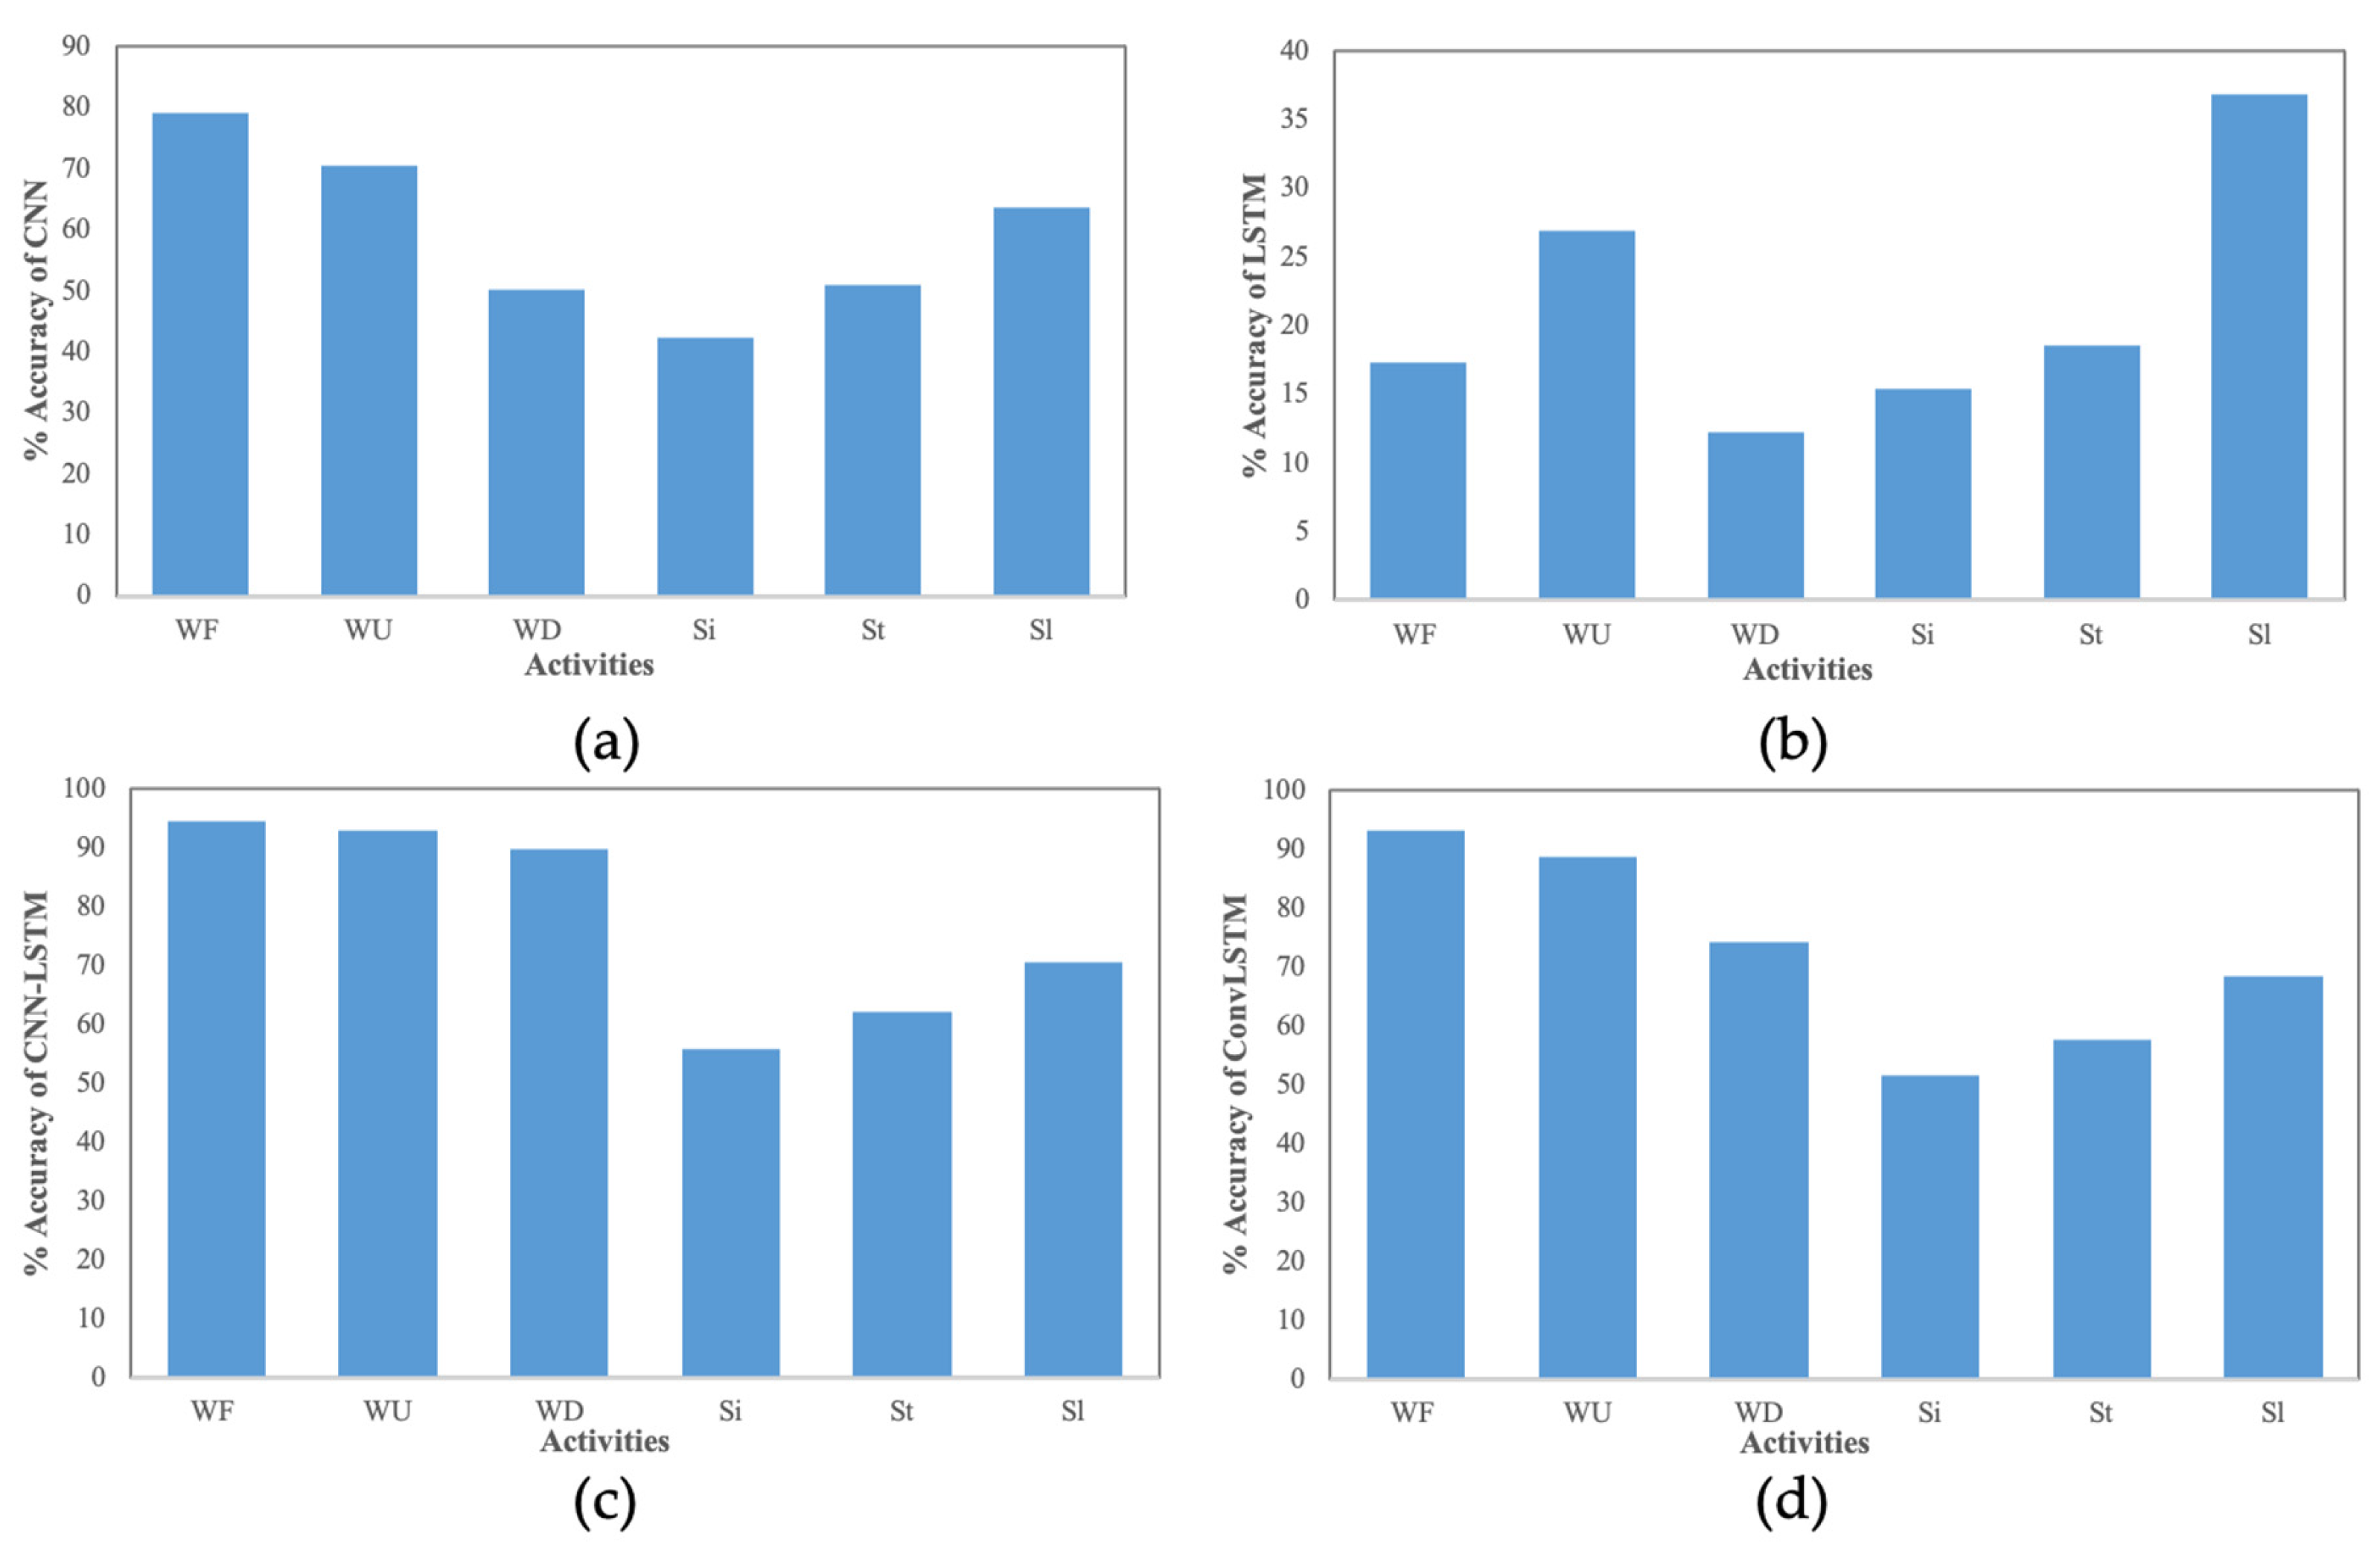
| Activity | Model | %Accuracy (±Std) of the User Classifier UC | Average | ||
|---|---|---|---|---|---|
| WF | WU | WD | |||
| Dynamic Activity | CNN | 79.139 (2.142) | 70.471 (1.259) | 50.065 (2.349) | 66.558 |
| LSTM | 17.364 (3.599) | 26.961 (3.688) | 12.284 (3.772) | 18.870 | |
| CNN-LSTM | 94.569 (3.256) | 92.980 (0.889) | 89.784 (1.673) | 92.444 | |
| ConvLSTM | 93.357 (0.684) | 88.706 (1.478) | 74.310 (2.357) | 85.458 | |
| Si | St | Sl | |||
| Static Activity | CNN | 42.283 (2.867) | 50.843 (2.411) | 63.660 (2.138) | 52.262 |
| LSTM | 15.451 (3.218) | 18.553 (6.853) | 36.791 (6.041) | 23.618 | |
| CNN-LSTM | 55.741 (2.283) | 62.178 (2.015) | 70.436 (2.011) | 62.785 | |
| ConvLSTM | 51.635 (2.131) | 57.631 (2.078) | 68.551 (2.722) | 59.272 | |
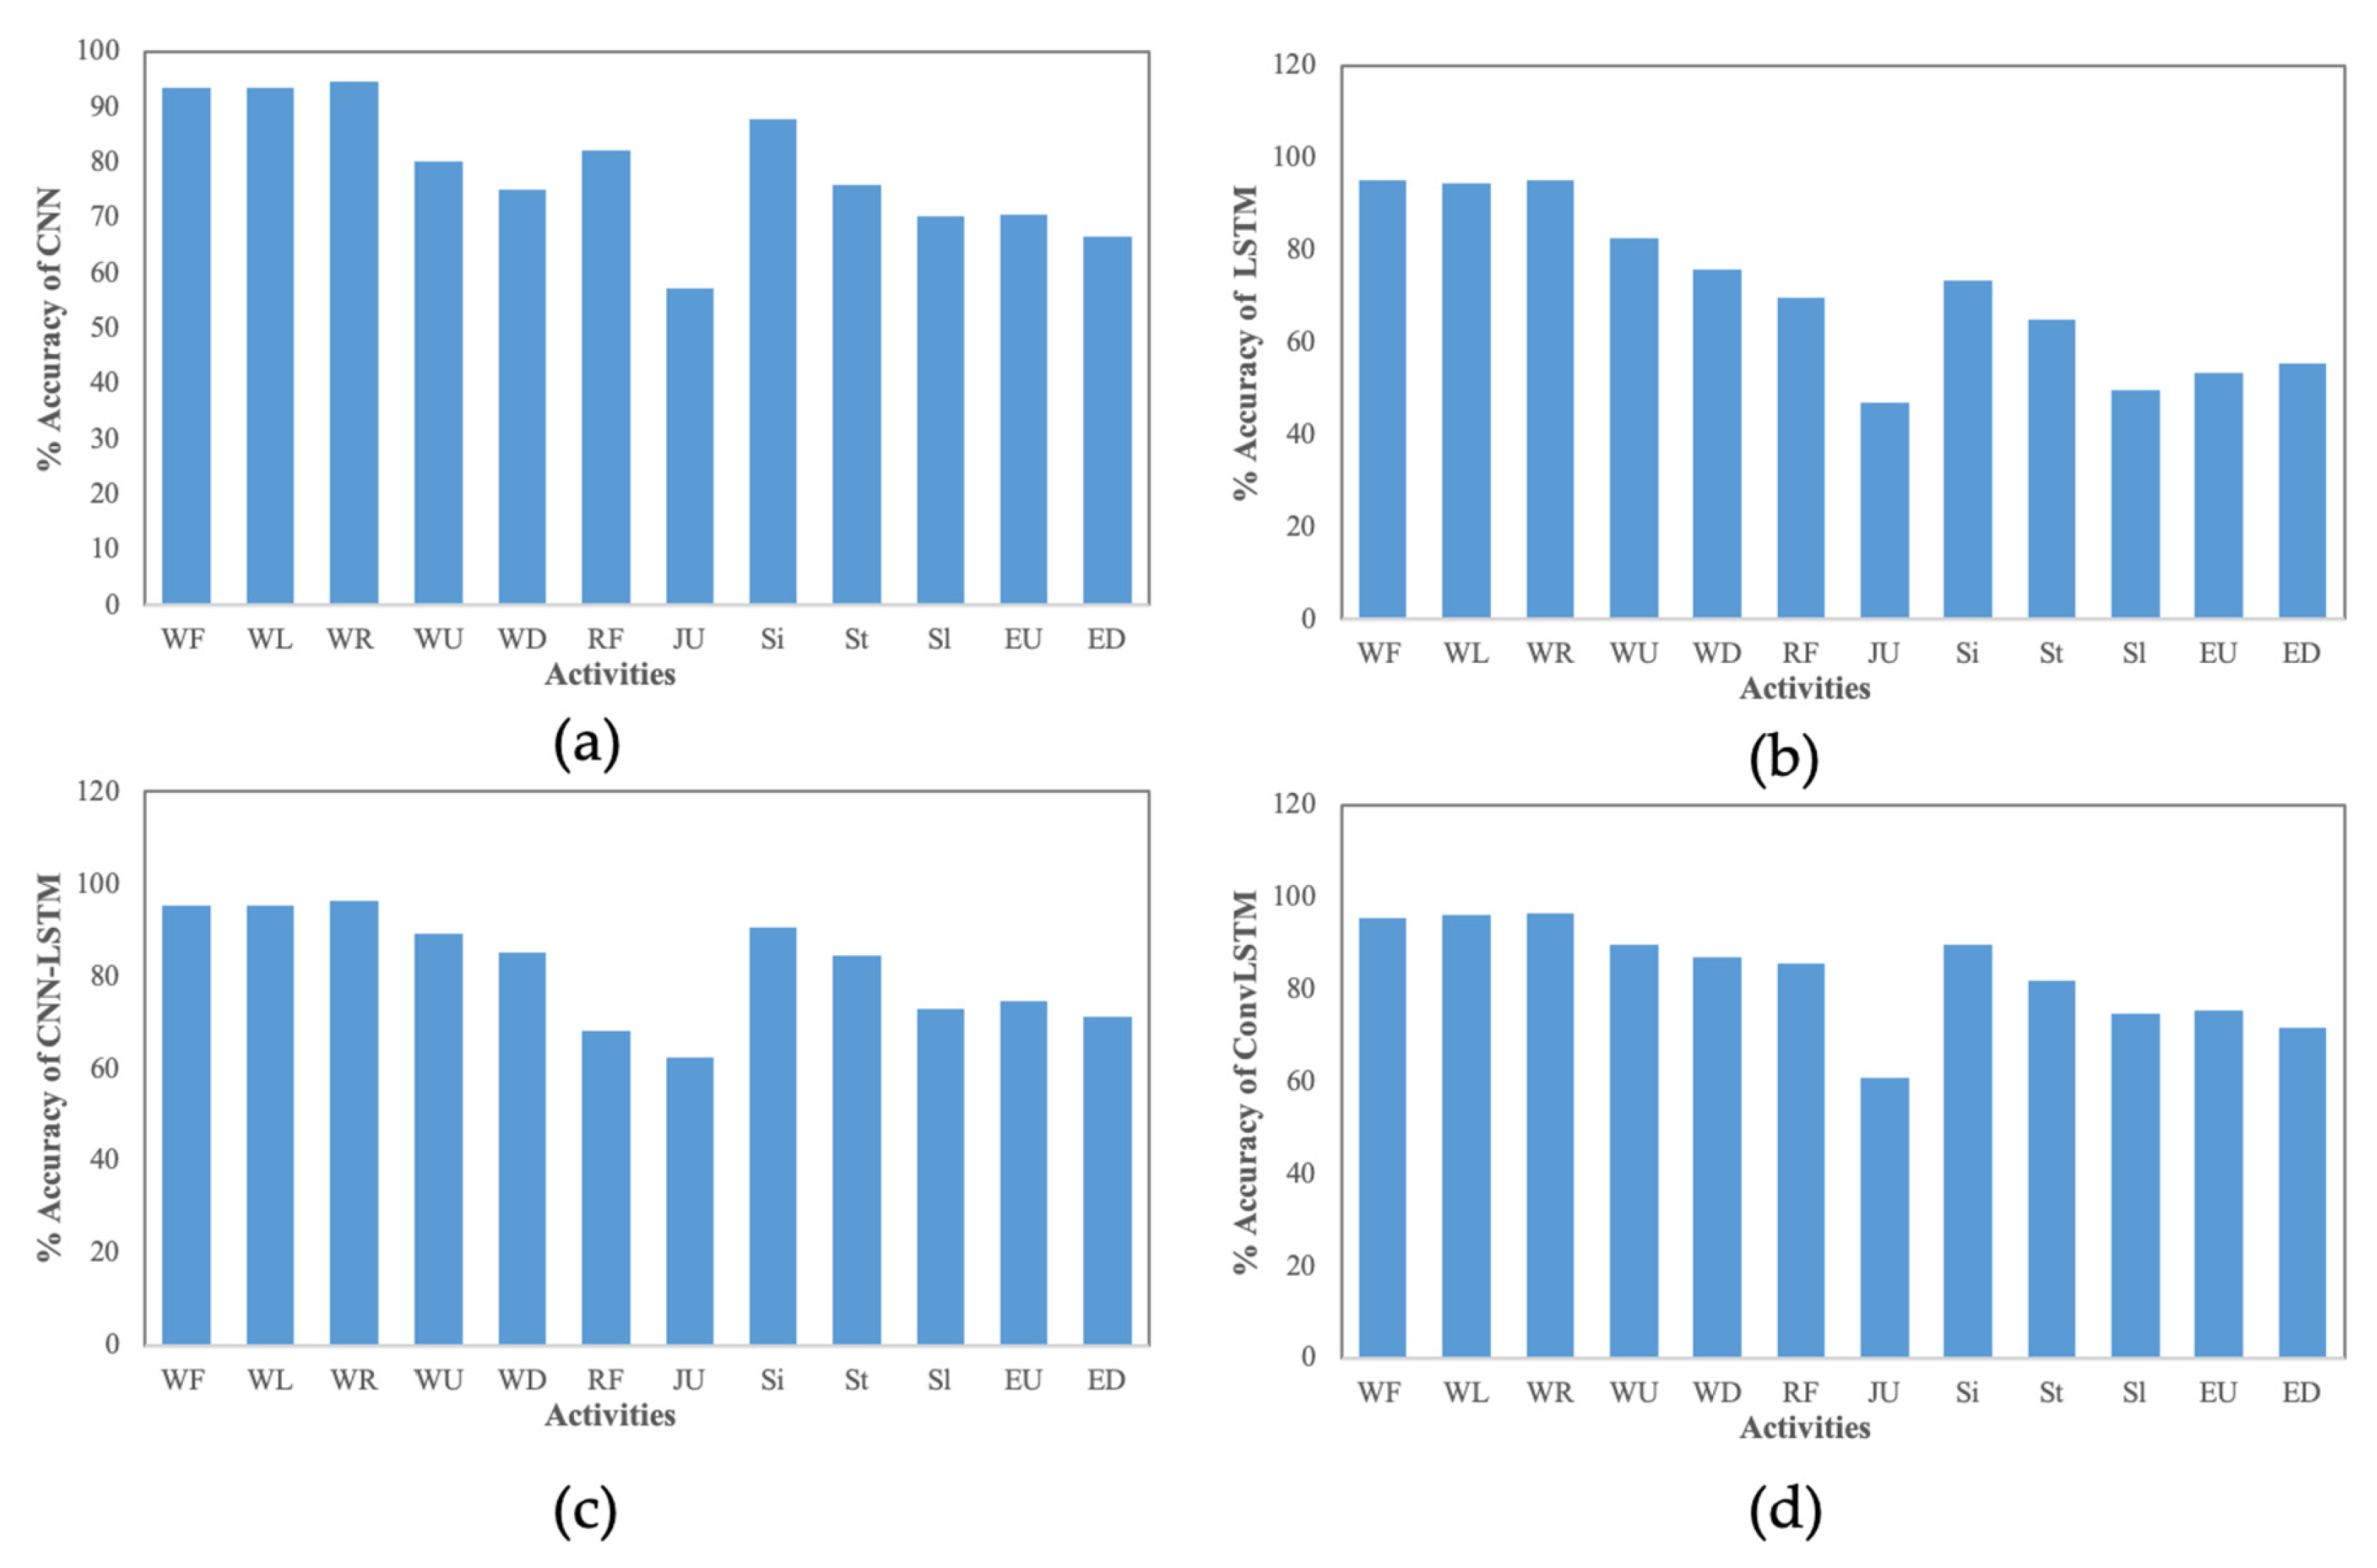
| Activity | Model | % Accuracy (±Std) of the Ensemble Classifier UC | Average | ||||||
|---|---|---|---|---|---|---|---|---|---|
| WF | WL | WR | WU | WD | RF | JU | |||
| Dynamic Activity | CNN | 93.349 | 93.380 | 94.479 | 80.116 | 74.934 | 82.187 | 57.192 | 82.234 |
| (0.716) | (0.652) | (0.575) | (1.527) | (1.256) | (3.781) | (3.892) | |||
| LSTM | 95.232 | 94.530 | 95.313 | 82.754 | 75.840 | 69.521 | 46.823 | 80.002 | |
| (0.631) | (0.470) | (0.546) | (1.265) | (2.478) | (1.756) | (2.459) | |||
| CNN-LSTM | 95.168 | 95.929 | 96.476 | 89.292 | 85.294 | 68.014 | 62.541 | 84.568 | |
| (0.591) | (1.394) | (0.504) | (0.910) | (2.676) | (2.673) | (2.798) | |||
| ConvLSTM | 95.289 | 95.196 | 96.269 | 89.685 | 86.925 | 85.410 | 60.737 | 87.178 | |
| (0.480) | (0.402) | (0.546) | (1.266) | (1.548) | (1.285) | (3.409) | |||
| Si | St | Sl | EU | ED | |||||
| Static Activity | CNN | 87.914 | 75.827 | 70.127 | 70.394 | 66.480 | 74.148 | ||
| (1.113) | (1.607) | (2.916) | (2.196) | (1.712) | |||||
| LSTM | 73.410 | 64.988 | 49.589 | 53.270 | 55.507 | 45.353 | |||
| (3.998) | (3.669) | (4.389) | (6.888) | (4.501) | |||||
| CNN-LSTM | 90.537 | 84.341 | 72.978 | 74.511 | 71.121 | 78.698 | |||
| (2.900) | (1.427) | (2.101) | (1.922) | (2.254) | |||||
| ConvLSTM | 89.687 | 81.717 | 74.545 | 75.489 | 71.805 | 78.648 | |||
| (1.077) | (1.186) | (1.505) | (1.285) | (1.735) | |||||
| Accuracy | Precision | Recall | F1-Score | |
|---|---|---|---|---|
| UCI HAR | 91.776 | 91.10 | 89.20 | 90.10 |
| USC HAD | 92.432 | 92.50 | 90.10 | 91.30 |
| Method | Walking-Related Activities | %Accuracy |
|---|---|---|
| Random projection method [17] | WF, WL, WR | 94.443 |
| Our proposed ensemble classifier | WF, WL, WR | 95.858 |
Publisher’s Note: MDPI stays neutral with regard to jurisdictional claims in published maps and institutional affiliations. |
© 2021 by the authors. Licensee MDPI, Basel, Switzerland. This article is an open access article distributed under the terms and conditions of the Creative Commons Attribution (CC BY) license (http://creativecommons.org/licenses/by/4.0/).
Share and Cite
Mekruksavanich, S.; Jitpattanakul, A. Biometric User Identification Based on Human Activity Recognition Using Wearable Sensors: An Experiment Using Deep Learning Models. Electronics 2021, 10, 308. https://0-doi-org.brum.beds.ac.uk/10.3390/electronics10030308
Mekruksavanich S, Jitpattanakul A. Biometric User Identification Based on Human Activity Recognition Using Wearable Sensors: An Experiment Using Deep Learning Models. Electronics. 2021; 10(3):308. https://0-doi-org.brum.beds.ac.uk/10.3390/electronics10030308
Chicago/Turabian StyleMekruksavanich, Sakorn, and Anuchit Jitpattanakul. 2021. "Biometric User Identification Based on Human Activity Recognition Using Wearable Sensors: An Experiment Using Deep Learning Models" Electronics 10, no. 3: 308. https://0-doi-org.brum.beds.ac.uk/10.3390/electronics10030308