Macroeconomic Electric Energy Production Efficiency of Photovoltaic Panels in Single-Family Homes in Poland


1
Institute of Economics, The State University of Applied Sciences in Elbląg, Wojska Polskiego 1, 82-300 Elbląg, Poland
2
Institute of Economics and Finance, Warsaw University of Life Science-SGGW, Nowoursynowska 166, 02-787 Warsaw, Poland
*
Author to whom correspondence should be addressed.
Energies 2021, 14(1), 126; https://0-doi-org.brum.beds.ac.uk/10.3390/en14010126
Submission received: 30 November 2020
/
Revised: 14 December 2020
/
Accepted: 24 December 2020
/
Published: 29 December 2020
(This article belongs to the Special Issue Building Energy: Economics and Environment)
Abstract
:An increase in energy demand that is caused by fast economic development, a limited and constantly decreasing supply of traditional energy sources, as well as excessive environmental pollution that is caused by an increasing concentration of dust and gases in the atmosphere constitute the main factors that contribute to the ever-increasing interest in renewable sources of energy. The most important and promising renewable source of energy is thought to be solar energy. The aim of the paper is to assess the macroeconomic investment efficiency of photovoltaic installations in order to meet the demand for electric energy in single-family homes in Polish conditions. The conducted analysis comprises market characteristics and legal regulations concerning the sale of electric energy in Poland. Calculations were made for 320 variants that differed with regard to investment location, building orientation, and roof inclination. The results indicate that the most beneficial region for photovoltaic micro-installations, from a social perspective, is the south-east of and central Poland. The highest values of economic efficiency were achieved in the case of a southern roof inclination as well as a south-eastern and south-western building orientation. No big differences were observed in the economic investment efficiency for the panel inclinations. The calculated Discounted Payback Period, depending on the calculation method, equals 5.4 to 10 years. The results of the study confirm that the implemented support instruments for investments in photovoltaic installations producing energy for single-family house demand is economically viable.
1. Introduction
The steady increase in energy demand that is caused by fast-paced economic development, the awareness that the world’s traditional energy resources are limited [1,2,3] and ever-growing proof of the negative impact of the use of fossil fuels in energy production on the environment, human life, and health constitute the main reasons why there is increasing interest in renewable energy sources (RES). The increase in the significance of renewable energy in the fuel and energy balance sheet of the world may contribute to savings when it comes to using up energy resources and improving the condition of the environment by reducing the emission of pollutants into the air and water, as well as reducing the amount of waste produced. Therefore, supporting the development of renewable energy resources is fast becoming one of the main policies that must be considered when designing the energy policy of many countries around the world.
Solar energy is thought to be the most relevant and promising renewable energy source. Other renewable energy resources, except sea and ocean waves, are directly associated with sunrays. The amount of solar energy reaching Earth annually surpasses world demand many-fold [4,5]. However, this is diffused energy, which, in practice, is difficult to take advantage of. The main obstacles in making use of PVs are economic factors (e.g., the high price of photovoltaic cells, the cost of accumulating energy when not directly used), its great dependence on location (seasonal and daily differences in the quantity of energy produced, dependency on the amount of sunlight, and the occurrence of shade), technical aspects (e.g., a decrease in panel performance caused by its lifecycle), as well as safety and legal aspects [6,7,8]. Despite the observed difficulties, worldwide PV energy production in recent years has grown dynamically from 32 TWh in 2010 to 544 TWh in 2018, whereby the greatest producers are China (31.9% of world total), the USA (14.7%), Japan (11.3%), and Germany (8.3%), while the greatest players in photovoltaic energy production are Italy (7.8%), Germany (7.1%), and Japan (5.9%) [9]. Some of the main reasons for the dynamic growth in photovoltaic development are, among others, growing social awareness in the scope of environmental protection [10,11], a lack of direct CO2 emissions and noise made while producing energy [2], as well as supporting programmes aimed at ensuring economic investment efficiency in technologies applying sunrays [12].
Applying renewable energy sources, including fixing photovoltaic panels in order to produce electric energy for single-family home demand, is of grave significance, due to the growing role of electric and electronic devices in everyday life. Access to electricity is treated as a basic right in the context of social equality and justice enabling social integration and access to an array of key services [13]. We cannot forget about the possibility of applying solar energy to heat and cool buildings. According to the ESTTP outlook, by 2030, solar heat energy will become Europe’s most important source of energy being used to cool and heat new and already existing buildings [14].
Phenomena that are related to the possibility of using solar energy constitute the subject of much research and scientific analyses. They are mostly focused on the productivity of photovoltaic installations [15,16,17,18,19,20,21,22,23,24], supporting installations and energy storage [25,26], the influence of photovoltaic panels on the environment [10,27], as well as on the legal and economic aspects conditioning the development of these types of installations. Notions pertaining to the economic efficiency of investments in photovoltaic installations concern photovoltaic power plants [28,29,30], storing energy [2,31], installations producing energy in the place of use (for own needs) in communal buildings [32,33,34,35,36], for public use [37], and for industrial purposes [38,39,40].
Our research concerns the economic efficiency of photovoltaic panel installations producing electricity on-site. This matter was, among others, taken up by Orioli and Di Gangi [36], who defined the factors impacting the economic efficiency of PV panels in rural areas in Southern Italy. Bernal-Augustin and Dufo-Lopez [32] evaluated the impact of various amounts of subsidies on the economic efficiency of photovoltaic installations on the example of Zaragoza, in Spain. Duong et al. conducted further studies regarding photovoltaic investments on the roof of a model single-family house in Quang Binh Province in Vietnam [33]. The results of the economic and ecological analyses on the efficiency of applying solar energy by households in Azerbaijan were published by Gulaliyev et al. [6]. In these studies, the authors covered the whole country distinguishing six regions differing in solar radiation level. Social and economic factors impacting the development of the market of PV household roof installations were the subject of research that was carried out by Kurdgelashvili et al. [41], in the state of California and Cho et al. [42] in the Pacific Northwest USA. Among research that was conducted in Polish conditions, Soliński and Kała’s [43] work deserves significant attention. It refers to the economic efficiency of PV installations on small rural households that were located in the south of Poland.
The results that were presented in publications thus far concern the microeconomic perspective, giving insight into the investor’s point of view (the installation owner). In our study, we undertook an evaluation of the economic efficiency of investments in PV installations at the macroeconomic level, focusing on the perspective of society as a whole. There are many basic differences between the macro- and microeconomic perspective when it comes to understanding outlays and effects. On the macroeconomic level, costs do not include custom duties or tax. However, what is considered a cost, on this level, are subsidies allocated to investors. On the microeconomic level, the effects of such PV investments only consider savings that result from lower electricity fees, while, at a macroeconomic level, the effects of such investments also cover benefits that result from the avoidance of ecological damage that is generated by obtaining and converting conventional energy sources.
In Poland, as of 2013, the growing force of installed photovoltaic panels is being observed [10,44]. When considering the fact that insolation in Poland is more or less around (950–1250 kWh/m2), as in Germany [24], which belongs to one of the world’s leading producers of photovoltaic energy, it may be assumed that the significance of this technology will continue to increase. Installations connected to the network fixed on communal and industrial buildings are most popular [35,39,40]. Growing investment in such technologies are a result of implemented support programmes targeted more specifically on installations with a power of 10 kWp [45]. In this situation, it seems sound to conduct economic analyses into the investment efficiency of photovoltaic installations on the macroeconomic level.
In this study, we have conducted an assessment into the economic efficiency of investment in photovoltaic installations in order to satiate the demand for electricity in single-family homes from the perspective of the whole of society (a macroeconomic level) and in Polish conditions. According to Knutel et al. [2], the results concerning the economic efficiency of investments in photovoltaic technology, to a great extent, depend on regional conditions and, cannot, therefore, be transferred to regions and countries with a different electric energy market. When considering the fact that the energy market in Poland differs greatly from that of other EU countries [2], and the profitability of such investments is greatly dependent on the country’s law [46,47], this study encompasses market characteristics and legal regulations regarding the sale of electric energy in Poland. According to the authors’ best knowledge, issues that are related to the macroeconomic effectiveness of such investments, taking various regions of Poland into account, have, thus far, not been researched. One of the most significant parts of this paper is indicating regional variation regarding the macroeconomic efficiency of investments in photovoltaic panels meeting the demands of electric energy in single-family homes. Because society is strongly subsidizing photovoltaic installations, the authors believe this subject to be of grave relevance.
2. Materials and Methods
2.1. Indicators of the Economic Efficiency of the Investment
The basis forming the assessment of the economic effectiveness of an investment is an economic evaluation that includes investment outlays as well as operating costs in relation to the effects that were achieved in the results of the undertaking. This evaluation is, as a rule, ex ante, and it serves to assess the economic effectiveness of variations of the projected investment undertaking to choose the most optimal version.
The method that is used to assess the absolute effectiveness of investment undertakings is called the cost-benefit analysis [48]. In the scope of this analysis, the applied methods of economic efficiency assessment of a project may be divided into two [49]:
- a simple method, limiting the time scope of the conducted evaluation to one year, and
- an advanced method, incorporating the whole timeframe of the conducted evaluation to the whole period of implementation as well as the forecasted operational period of the investment project.
In both cases, the economic efficiency of the business is assessed as a result of comparing its economic effects that constitute the business activity and its outlays. In general, if the sum of the value of positive effects exceeds the sum of the value of outlays, then the given business activity is deemed to be economically viable.
Producing electricity with the application of photovoltaic panels is a long-term project. For this reason, the economic evaluation of such a project should be conducted while using the advanced method incorporating all of the outlays and results over time. The method enabling this is the Net Present Value method, as well as other methods that stem from it [50].
Applying the Net Present Value (NPV) method requires developing a model of defining, in a forecasted timeframe, the effects of a project, the outlays, and effects that are involved in the shape of cashflows and effects. On this basis, the current net value of the project is calculated. It is an algebraic discounted sum for the present moment, with a negative sign for investment outlays (I) and operating costs (K) and a plus sign for the effects of the undertaking (P), for the period of investment duration and period of the effects, calculated according to the formula [51]:
where:
- tt—the period of economic effects of the project together with the implementation period of the investment,pp, ii, kk—the appropriate number of specified effects, investment outlays. and operational costs of the project, and,at—the discount factor concerning a specific subperiod (e.g., a year) t.
In order to reach effectiveness, it is necessary for NPV ≥ 0 [52].
The number of years (if the evaluation considers annual time periods), after which the NPV indicator changes its value from a negative to a positive one, is defined as the period of invested capital return. This period defines the time, in which it takes for the achieved results/effects of the project to cover the full outlays incurred during that time, including investment outlays [53].
In the study, the economic efficiency of electric energy production with the use of solar panels from the perspective of the society as a whole (macroeconomic evaluation) was carried out. A macroeconomic evaluation is especially important with regard to environmental undertakings, to which producing energy from renewable sources belong, as the outlays, and, more importantly, the effects of such activity concern many social groups.
Choosing the right social discount rate (SDR) is a widely debated issue impacting the long-term assessment of the macroeconomic efficiency of investment. The results that were connected with the calculations of the social discount rate were presented by Freeman, Groom, and Spackman (2018) [54]. According to these authors, the accurate discount rate applicable when assessing the economic efficiency from a social perspective is a rate of 3.5% [54]. This social discount rate was applied in the study.
The time horizon, the period pf the forecasted cashflow generated by panels was given, starting from the moment that the first expenses were incurred, was 25 years. This period is a result of the durability of photovoltaic installations [55].
2.2. Technical Characteristics of the Analised Variations
The macroeconomic evaluation of the efficiency of energy production with the use of photovoltaic installations was carried out on 320 calculation variants, which were distinguished on the basis of:
- installation region—16 locations were considered—according to the administrative division of Poland (16 voivodships);
- roof positioning in relation to geographic directions—for each location, five most beneficial building orientations, on which an installation is fixed, were selected—East, West, South, South-east, South-west; and,
- roof inclination—in every variant of roof inclination in relation to geographical direction, the calculations assumed fixing an installation to a flat roof, a roof inclination of 30, a roof inclination of 45, and a roof inclination of 60°.
The basis of evaluating the economic efficiency of electric energy that is produced with the use of solar panels is the installation power. In the literature, many ways of selecting the power of the PV installation are distinguished. The most common are: the loss of load probability (LLP), adapting to the maximum short-term load, adapting to energy demand in a specific time period, or criteria connected with balancing out the demand for energy or costs [56]. In the case of micro-installations, the best way of selecting power involves the annual balance approach, according to which the power of the panel should be suited in a way that minimises the difference between the annual energy demand of the single-family home and the energy that is produced by the installation [43].
In accordance with the above, this paper has assumed that the basis of calculating the value of investment outlays that are connected with the production of electricity with the use of solar panels was the annual demand of a single-family home for electricity. Analysis was conducted for an average household in Poland located in the countryside. According to Statistics Poland (GUS) [57], a typical household in the countryside is defined as a household counting 3.4 people inhabiting a single-family home with an area of 117.9 m2 that is heated with solid fuels. In 2018, 25.2% of all Polish households belonged to this group. In relation to all rural areas in Poland, this concerned 77.7% of households. The average consumption of electricity for 1 square metre of useable area in such households constitutes 25.5 kWh. This is a 23.7% higher consumption in comparison with the mean national average for all of the households. This is caused by a bigger average area and a high number of inhabitants per household. In addition, in almost 1/3 of households in the countryside, there is a separate freezer, rather than fridge-freezer. This is due to the way in which food is stocked, i.e., stocking food from own supplies or local producers, as well as lower accessibility to big supermarkets in the countryside.
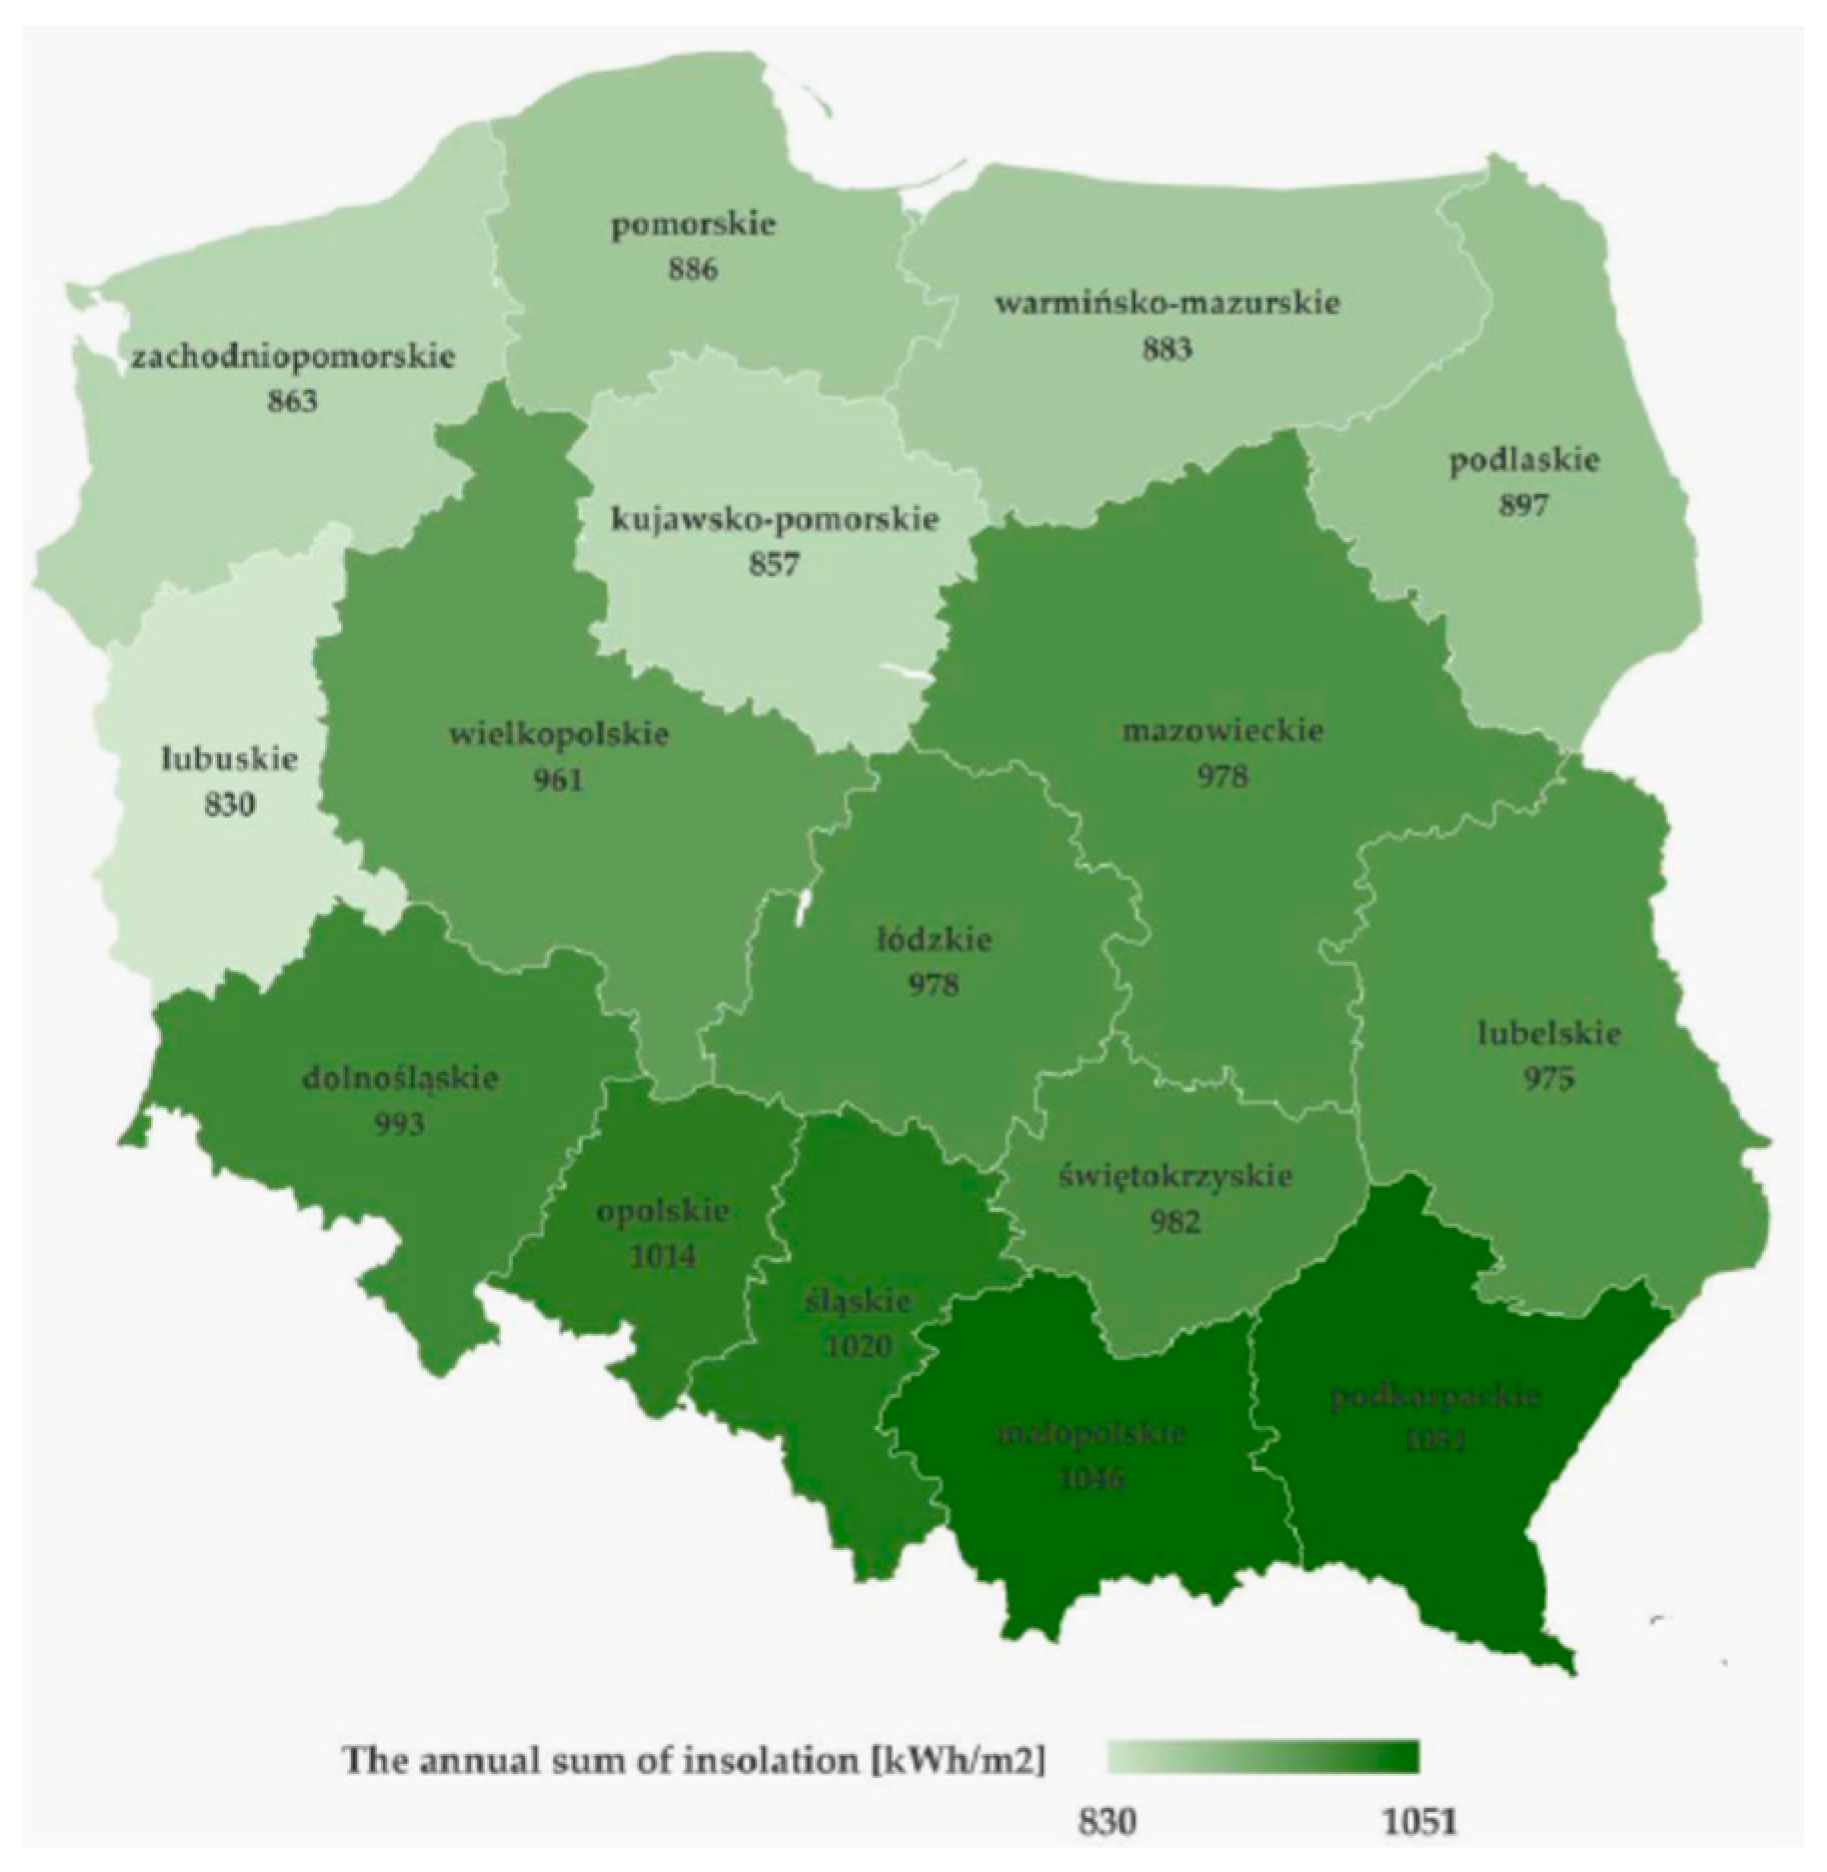
Based on the assumptions that were made, the established annual demand for electricity for the average Polish household that is located in rural areas constitutes 3006 kWh per year [57]. The huge potential of roofs on communal buildings means that this demand could, to a great extent, be met by producing energy with the use of photovoltaic panels. The foundation for defining the annual energy production in photovoltaic systems was the mean level of insolation, in particular, voivodships, as presented in Figure 1.
Poland’s insolation does not differ greatly from the insolation of Central European countries and areas in similar latitudes. From the point of view of using solar energy by photovoltaic installations, the most important parameter is the annual value of insolation, which defines the quantity of solar energy per unit of flat area in a specified period. When considering this parameter, it can be stated that the solar conditions in Poland differ greatly regionally—the annual density of irradiance fluctuates between 800 and 1200 kWh/m2. Such a number of sunrays is enough to meet 60% (in winter) and 100% (in summer months) of electricity demand [59].
2.3. Investment Outlays and Operational Costs of Photovoltaic Installations
In order to evaluate the economic efficiency of an undertaking, it is necessary to compare the level of income (benefits) that results from its implementation with its costs, including the investment outlays that are related to its creation, according to the NPV method. The evaluation presented in this paper was made with fixed current prices (level of prices from the first half of 2020). The calculations of values of other authors expressed at other levels were updated with the application of the consumer price index [60], as well as the European Union Consumer Price Index (CPI) [61]. The basis for calculating the conversion rate of PLN into Euro was the average exchange rate for the Euro for the first half of 2020 [62].
The value of investment outlays was established based on the level of insolation in a particular region of a given voivodship, in accordance with the values that are presented in Figure 1. The minimum number of panels necessary to meet the total annual demand for electricity, as calculated for the analysed variants fluctuates between eight and 12. Fixing such a number of panels, in accordance with the price estimate of a company conducting its business in the whole of Poland equals Euro 3450 (in the case of eight panels fixed to sloping roofs) and up to Euro 5430 (in the case of fixing 12 panels to sloping roofs).
Investments relating to solar panel investments are supported by public funds due to the significant social advantages that result from replacing the production of electric energy from coal with solar energy. This support is realised through a system of subsidies, tax relief and preferential loans. One of the support programmes is “My Electricity” (Mój Prąd), in the scope of which an investor receives subsidies in the sum of 50% of all installation costs, but no more than Euro 1125. Furthermore, as of 2019, natural persons investing in photovoltaic installations, apart from obtaining subsidies, have the possibility of receiving tax relief when settling their income tax. This solution enables the deduction of the total cost of purchasing and fixing solar panels from income tax, with a maximum sum of Euro 12,000 [63].
From a social perspective, subsidies and tax relief constitute a transfer of cash. As a result of this, when establishing effectiveness on the macroeconomic level, the total value of outlays incurred in the case of a lack of state support was considered. The adjustments of investment outlay values only concerned eliminating VAT.
Other than investment outlays, producing electricity with the use of PV panels involves incurring annual operational costs. From the perspective of the installation owner, the following operational costs are distinguished:
- Costs concerning the insurance of the installation—according to the general terms and conditions of insuring photovoltaic installations fixed to the roof of a communal building, the installation is considered to be an integral part of the building [64]. Therefore, the insurance sum results from the difference between the value of the building before and after installing the solar panels. The difference is equal to the investment outlays that were incurred with regard to fixing the installation. This paper assumes a uniform insurance contribution for the whole country equal to 0.12% of the insurance sum. This is the average value for Poland applied by a leading insurance company.
- Maintenance and breakdown service costs—in accordance with applicable Polish legal regulations concerning the fixture of PV panels on communal building roofs. There is no extra cost regarding the technical inspections of the building. However, it may be the case that the panels themselves get damaged, due to their inappropriate construction or inappropriate electrical installations to which the panels are connected. Therefore, in the scope of investor costs, the breakdown and maintenance service costs of PV installations have been considered. For the first 12 years of operation, such services are included in the warranty that is guaranteed by the company fixing the panels. Upon these 12 years, it is possible to prolong the warranty for a further two years. The cost of such a service is 30 Euro/year.
- The cost of panel disposal—upon the expiry date of the panels. They should be removed and disposed of. Currently, in Poland, there is only one company delivering the service of panel disposal. However, it may be assumed that, in the near future, due to a growing number of panels requiring disposal year-on-year, there will be increasing companies offering such services. In addition, it may be the case that it shall become a legal necessity to hand the panels over to recycling companies upon their expiry, as was the case with deregistered cars. The cost of panel disposal has been defined based on the current price list of the company offering the service in Poland and it equals 0.34 Euro/kg. It is necessary to add the cost of transport equal to 0.56 Euro/km [65]. For the sake of this paper, the average distance for panel disposal constitutes 100 km.
The abovementioned costs also constitute a calculation component on a macroeconomic level. VAT was excluded when including these costs in the macroeconomic calculation of efficiency.
2.4. Value of the Effects of Energy Production from PV Installations
From the perspective of the installation owner and society, the benefits that result from the investment are savings made on the purchase of electricity. Therefore, electricity prices and distribution are some of the key factors influencing the economic efficiency of PV installations. In Table 1, the current costs that are associated with the purchase of electricity depending on the subject distributing it are presented.
This paper assumes the following division of voivodships with regard to electricity distributor:
- the Pomeranian Voivodship, Warmińsko-mazurskie and Małopolskie voivodships–Energa;
- the Lower Silesia, Opolskie, Silesia and Małopolskie voivodships—Tauron;
- the Podlaskie, Lubelskie, Podkarpackie, Świętorzyskie, Mazowieckie and Łódzkie voivodships—PGE (Polska Grupa Energetyczna); and,
- the Lubuskie, Wielkopolskie and Zachodniopomorskie voivodships—ENEA.
When defining the efficiency of energy production with the use of PV systems, it is necessary to consider the fixed network fees, i.e., according to the tariffs of distributing electricity, the fixed fee and monthly subscription fee, as these are investment costs, regardless of the amount of electricity utilised. The owner of the PV installation is also responsible for the costs of network maintenance—just as other energy users. This results from the fact that the investor being connected to the electricity supply network—enabling the owner to purchase energy in periods when the own energy production is lower than the current demand—is obliged to participate in the costs that are connected with maintaining the electricity network.
The electricity that is produced with the use of PV installations, in the first place, is used to meet the ongoing demand of the household. If actual electricity production exceeds ongoing demand, the surplus is channelled to the energy network. According to the Act of 22 June 2016 on the amendments to the Act of 20 February 2015 on renewable energy sources [66], in the scope of so-called net-metering, a periodical settlement system, the owner of the installation may take back (in the case of max. 10 kW installations): 0.8 kWh per 1 kWh of energy being channelled to the network.
In the case a solar panel owner takes back the electricity that he/she had earlier produced, the owner does not incur purchase costs. The economic efficiency then depends on the amount of energy consumed directly in order to meet ongoing electricity needs. The energy, which is not directly used up by the producer, is channelled to the energy network, from which, excluding purchase fees, he/she may only retrieve 80%. The remaining amount of energy must be purchased in line with the tariff applied by specific distributors. According to the report on the PV market in Poland 2019 [67], the coefficient of energy auto-consumption that is supplied from own solar installations, in the case of households, on average, does not exceed 30%. This is the level assumed in this paper.
The maximum scale of energy production with the use of PV installations is not a fixed parameter throughout the whole period of panel utilisation. In further operational years, as a result of installation wear and tear—resulting from outside factors—the efficiency of panels decreases. The panel performance that is guaranteed by many manufacturers should not be lower than 90% after the first 10 years and 80% after 25 years of operation [68]. In line with these data, it has been assumed that the energy production performance in further years of operation shall drop linearly to 80% after 25 years.
As of the 90s, the coal sector in Poland has been the receiver of state support, which has impacted the price of coal. According to the report by the Office of Competition and Consumer Protection, in 2018, the amount of Euro 342.55 million [69] was allotted to coal mine liquidation, reclamation, and miner damages. When considering the scale of coal mining in Poland, this amount is equal to Euro 5.44 in state aid per 1 t of coal. When assuming the average calorific value of coal to be 24 MJ/kg [70] and the efficiency of coal power plants (η) to be 35% [71], it is possible to establish the average state subsidy to 1 MWh of energy produced from hard coal on the basis of the following formula:
where:
- 1/3.6—the coefficient enabling the conversion of MJ to kWh (1 J = 1/(3.6·10−6) kWh. In line with this 1 MJ = 1/3.6 kWh),Dopweg—the level of state subsidies to 1 kg of coal [Euro/kg], andDopel—the level of state subsidies to produce 1 kWh of electricity from hard coal [Euro/kWh].
The calculations that are based on the above formula define the level of state subsidies to produce electricity form hard coal at 2.31 Eurocent/kWh. Simultaneously, this is the unit value of social benefits that result from substituting coal energy with PV energy. By substituting coal energy production with solar energy, society saves this amount as an non-incurred expense from public funds that are allotted to coal mining.
Electricity production with the use of solar panels is also connected with lower, in comparison with coal energy, external costs. From a social perspective, substituting coal with renewable energy sources carries benefits in the form of fewer losses that result from environmental pollution. A review of contemporary research in the scope of external costs connected with energy production from various sources can be found in the work of Samadi [72]. On the basis of the included external cost estimate that results from the production of electricity from the combustion of hard coal and the use of PV panels, it is, as a difference, possible to calculate the unit value of social benefits that are gained from the improvement of environmental quality. The unit value of social benefits that result from substituting energy from combusted hard coal with solar energy constitutes 10.07 eurocent/kWh.
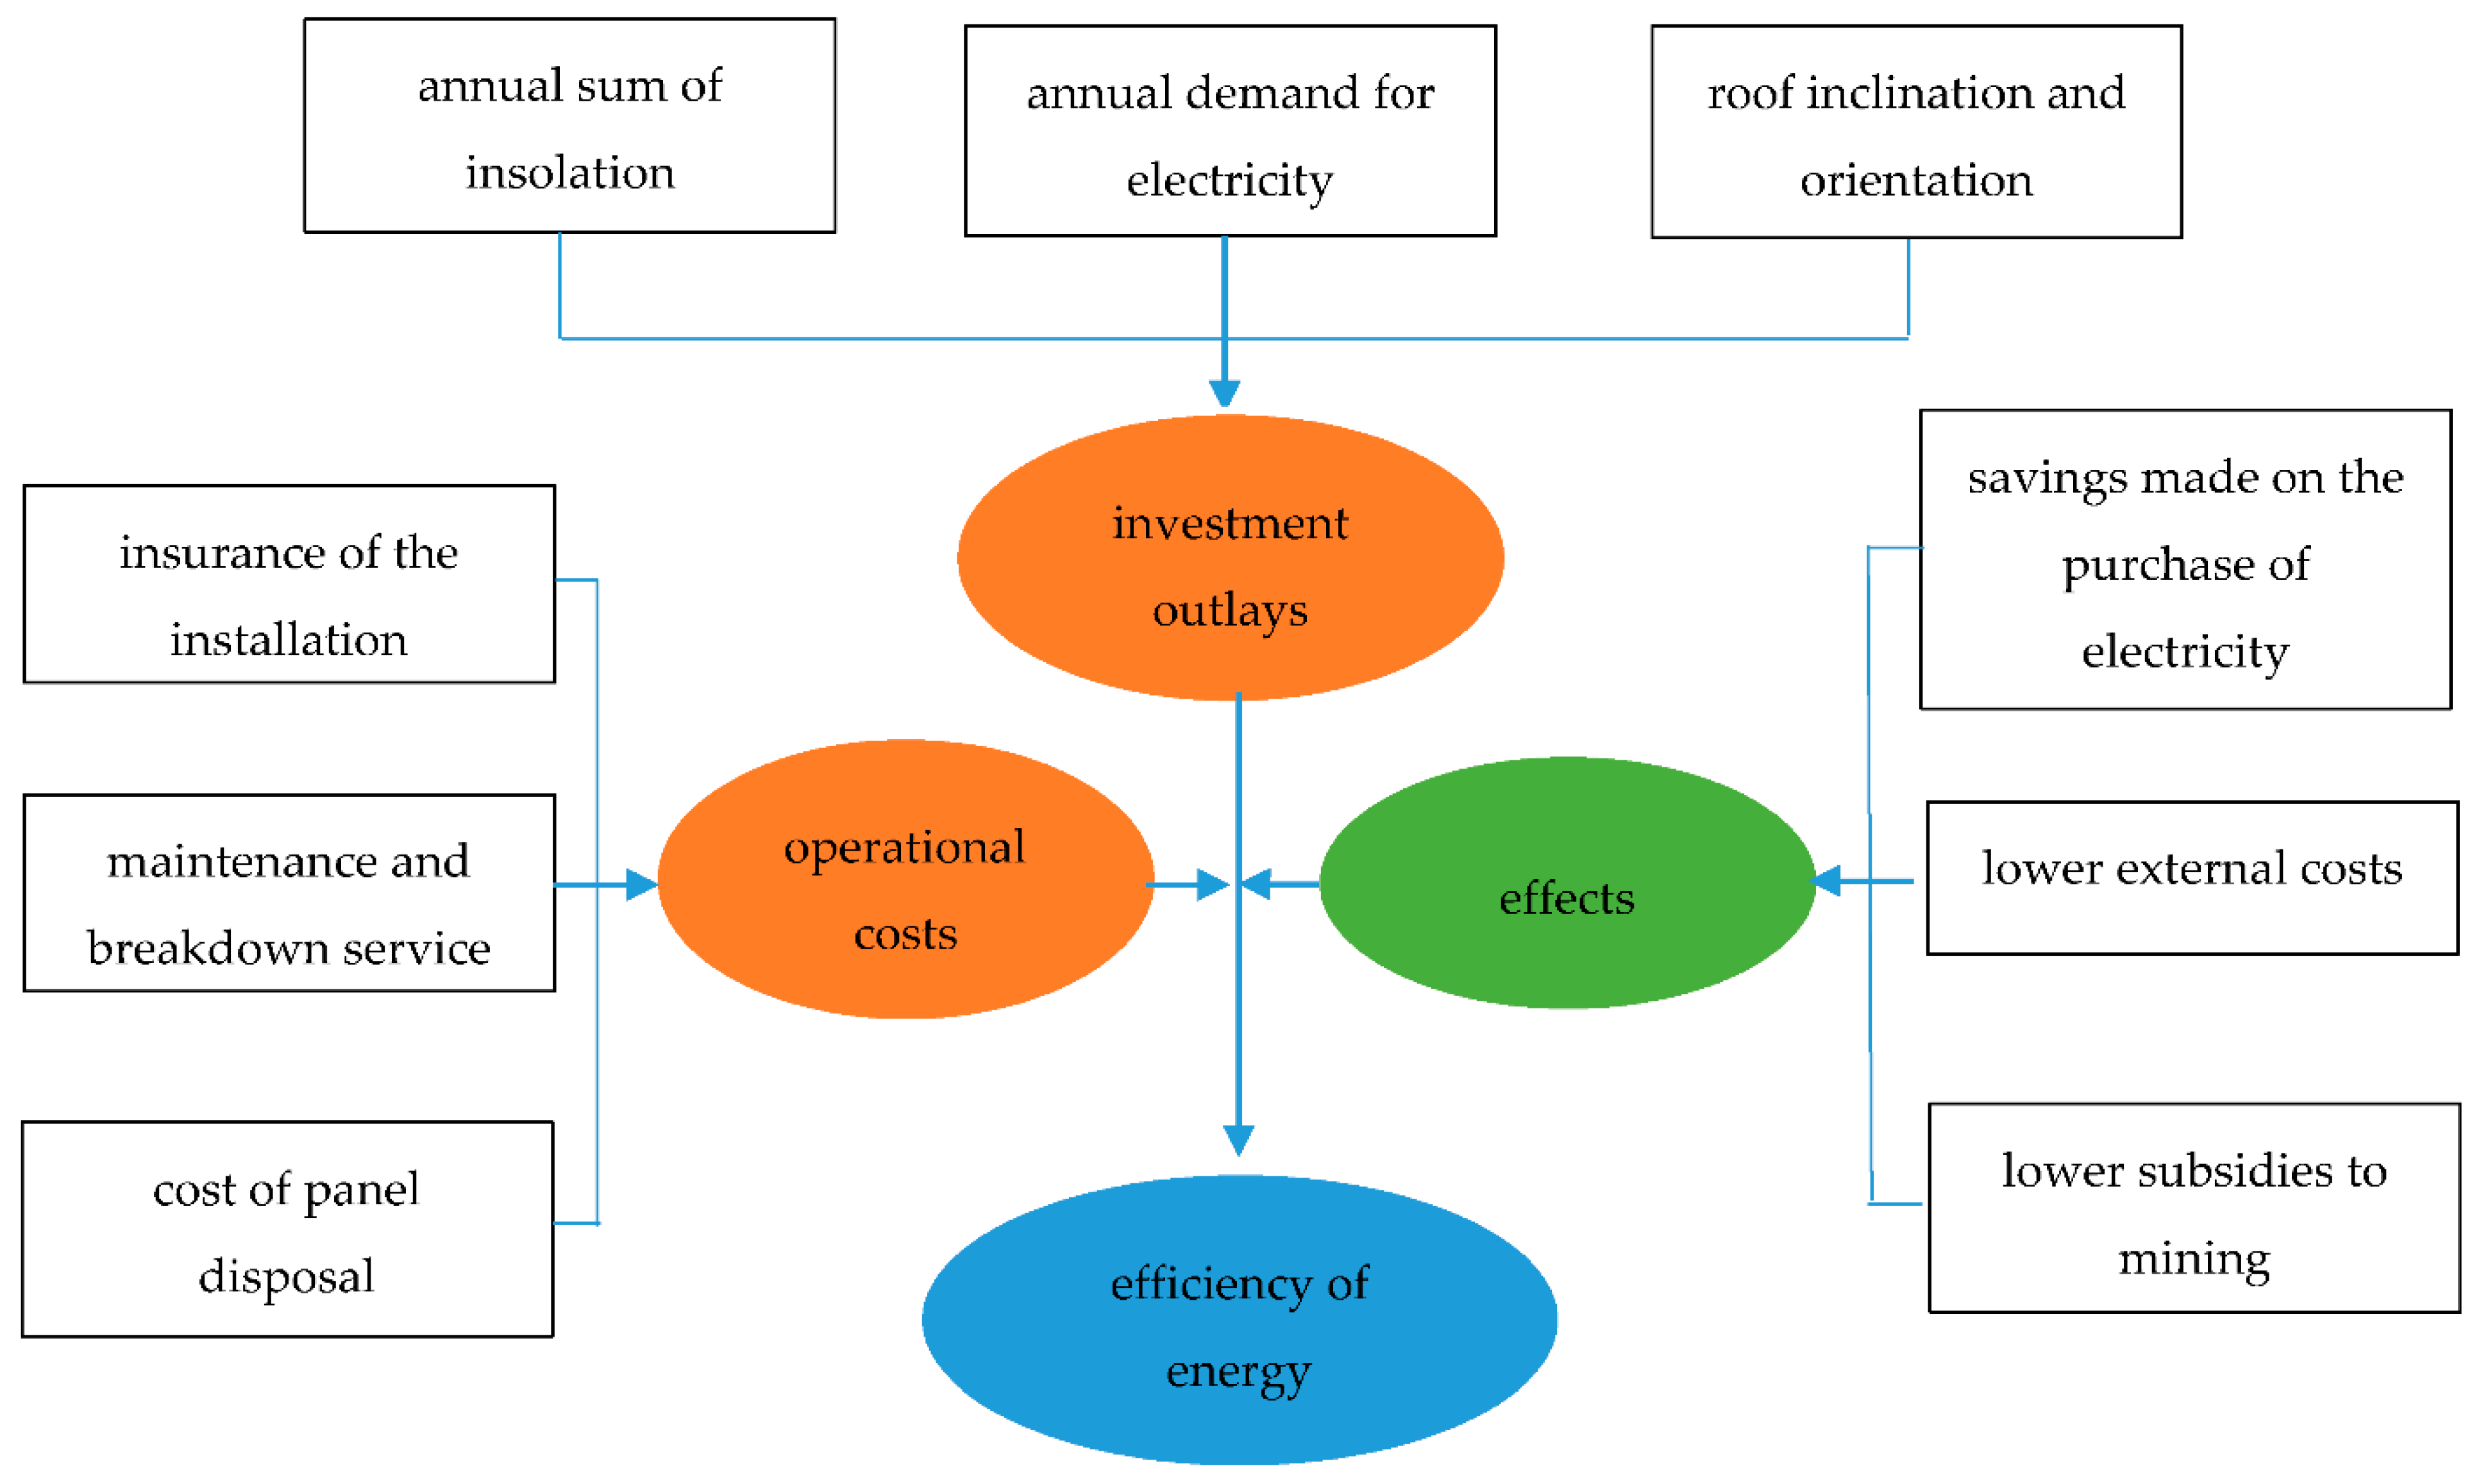
Figure 2 shows a block diagram of the adopted elements that were included in the calculation of the efficiency of energy production from PV installations.
3. Results
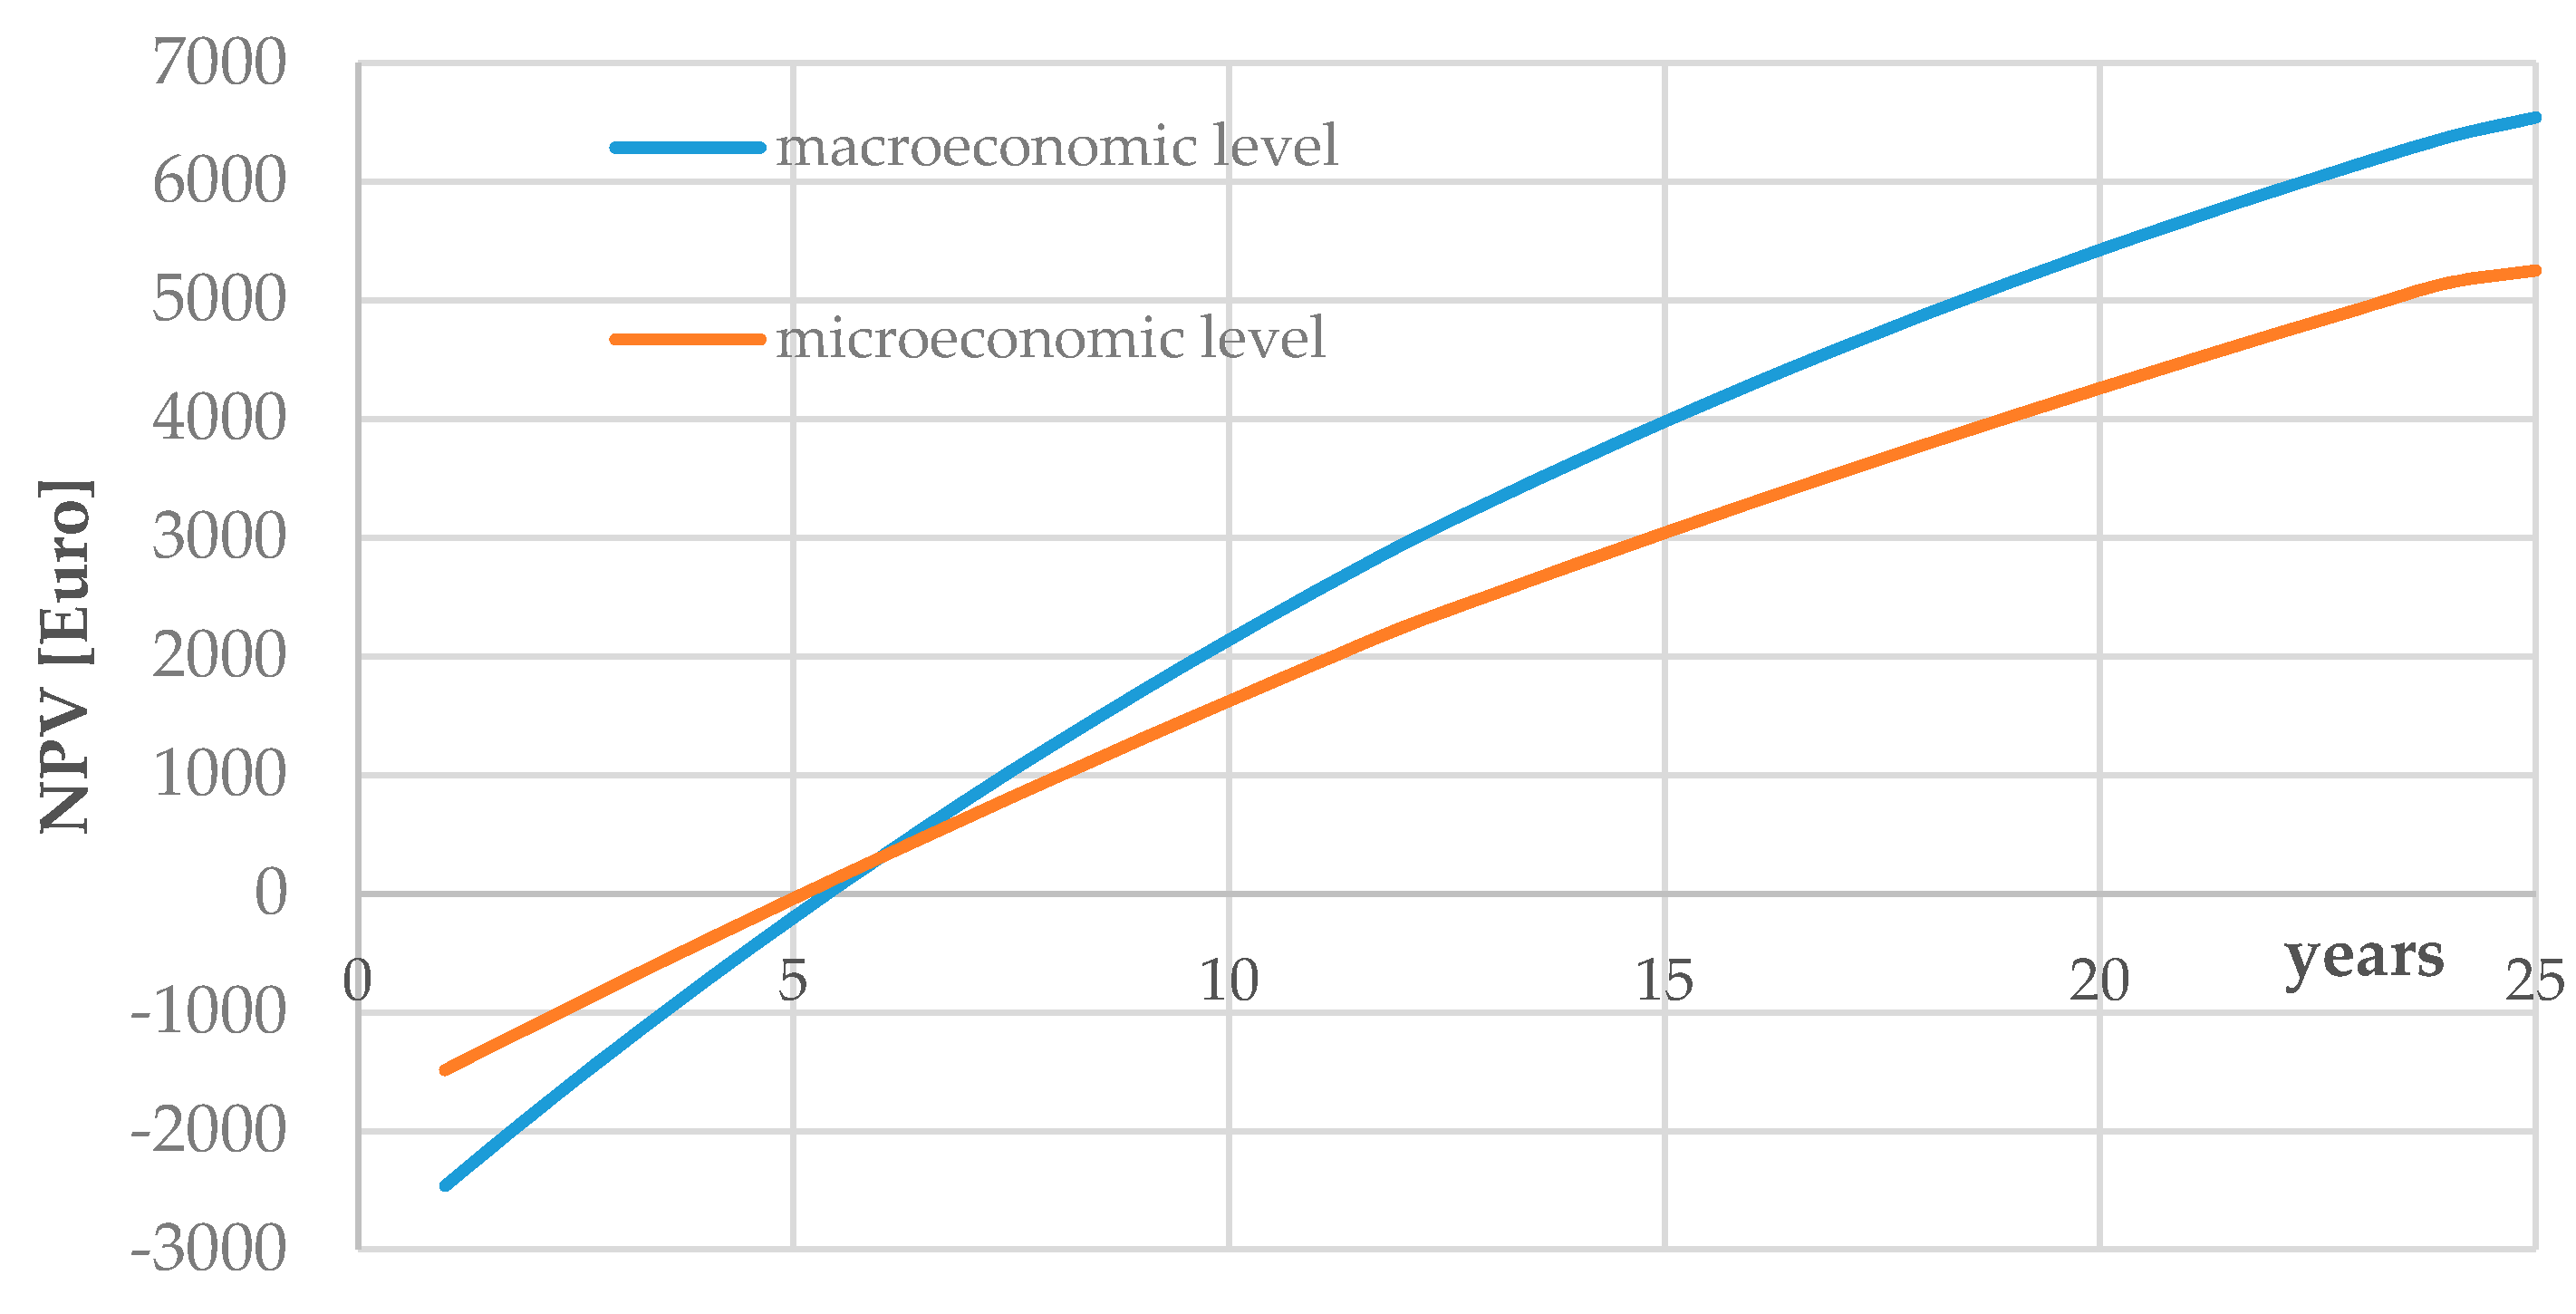
By comparing macroeconomic efficiency with an evaluation of efficiency from the perspective of an investor, it can be stated that, from a social perspective, the project is characterised by greater efficiency. Figure 3 presents the minimum and maximum NPV value on a micro- and macroeconomic level. The highest NPV value—almost Euro 6800—was reached by the variant with a location in the Łódzkie Voivodship, with a southern building orientation and roof inclination of 450. However, the lowest NPV value—Euro 3700—was reached by the variant with a location in the Lower Silesia Voivodship, with an eastern building orientation and a 600 angle roof inclination.
Depending on the calculation variant of the NPV value, on a macroeconomic level, it is 23–59% higher than on a microeconomic level. The higher evaluation results from the fact that it includes additional effects that result from benefits in the form of decreasing external costs and savings on public expenditure as a result of decreasing coal mining subsidies. The value of these effects is higher than the difference on a level of investment outlays on the macro- or microeconomic level. In the case of the microeconomic level, the value of investment outlays is lower—resulting from the possibility of obtaining subsidies for the installation construction and additional possibilities of benefitting from tax relief on income tax. A lower value of investment outlays on an investor level makes the microeconomic efficiency higher than the macroeconomic efficiency in the first years of the investment. A greater value of social effects in comparison with the benefits of the installation owner results in faster NPV growth on a macroeconomic level. Consequently, before the return-on-investment (point in Figure 3 at which the NPV value reaches 0), the macroeconomic efficiency surpasses the microeconomic efficiency.
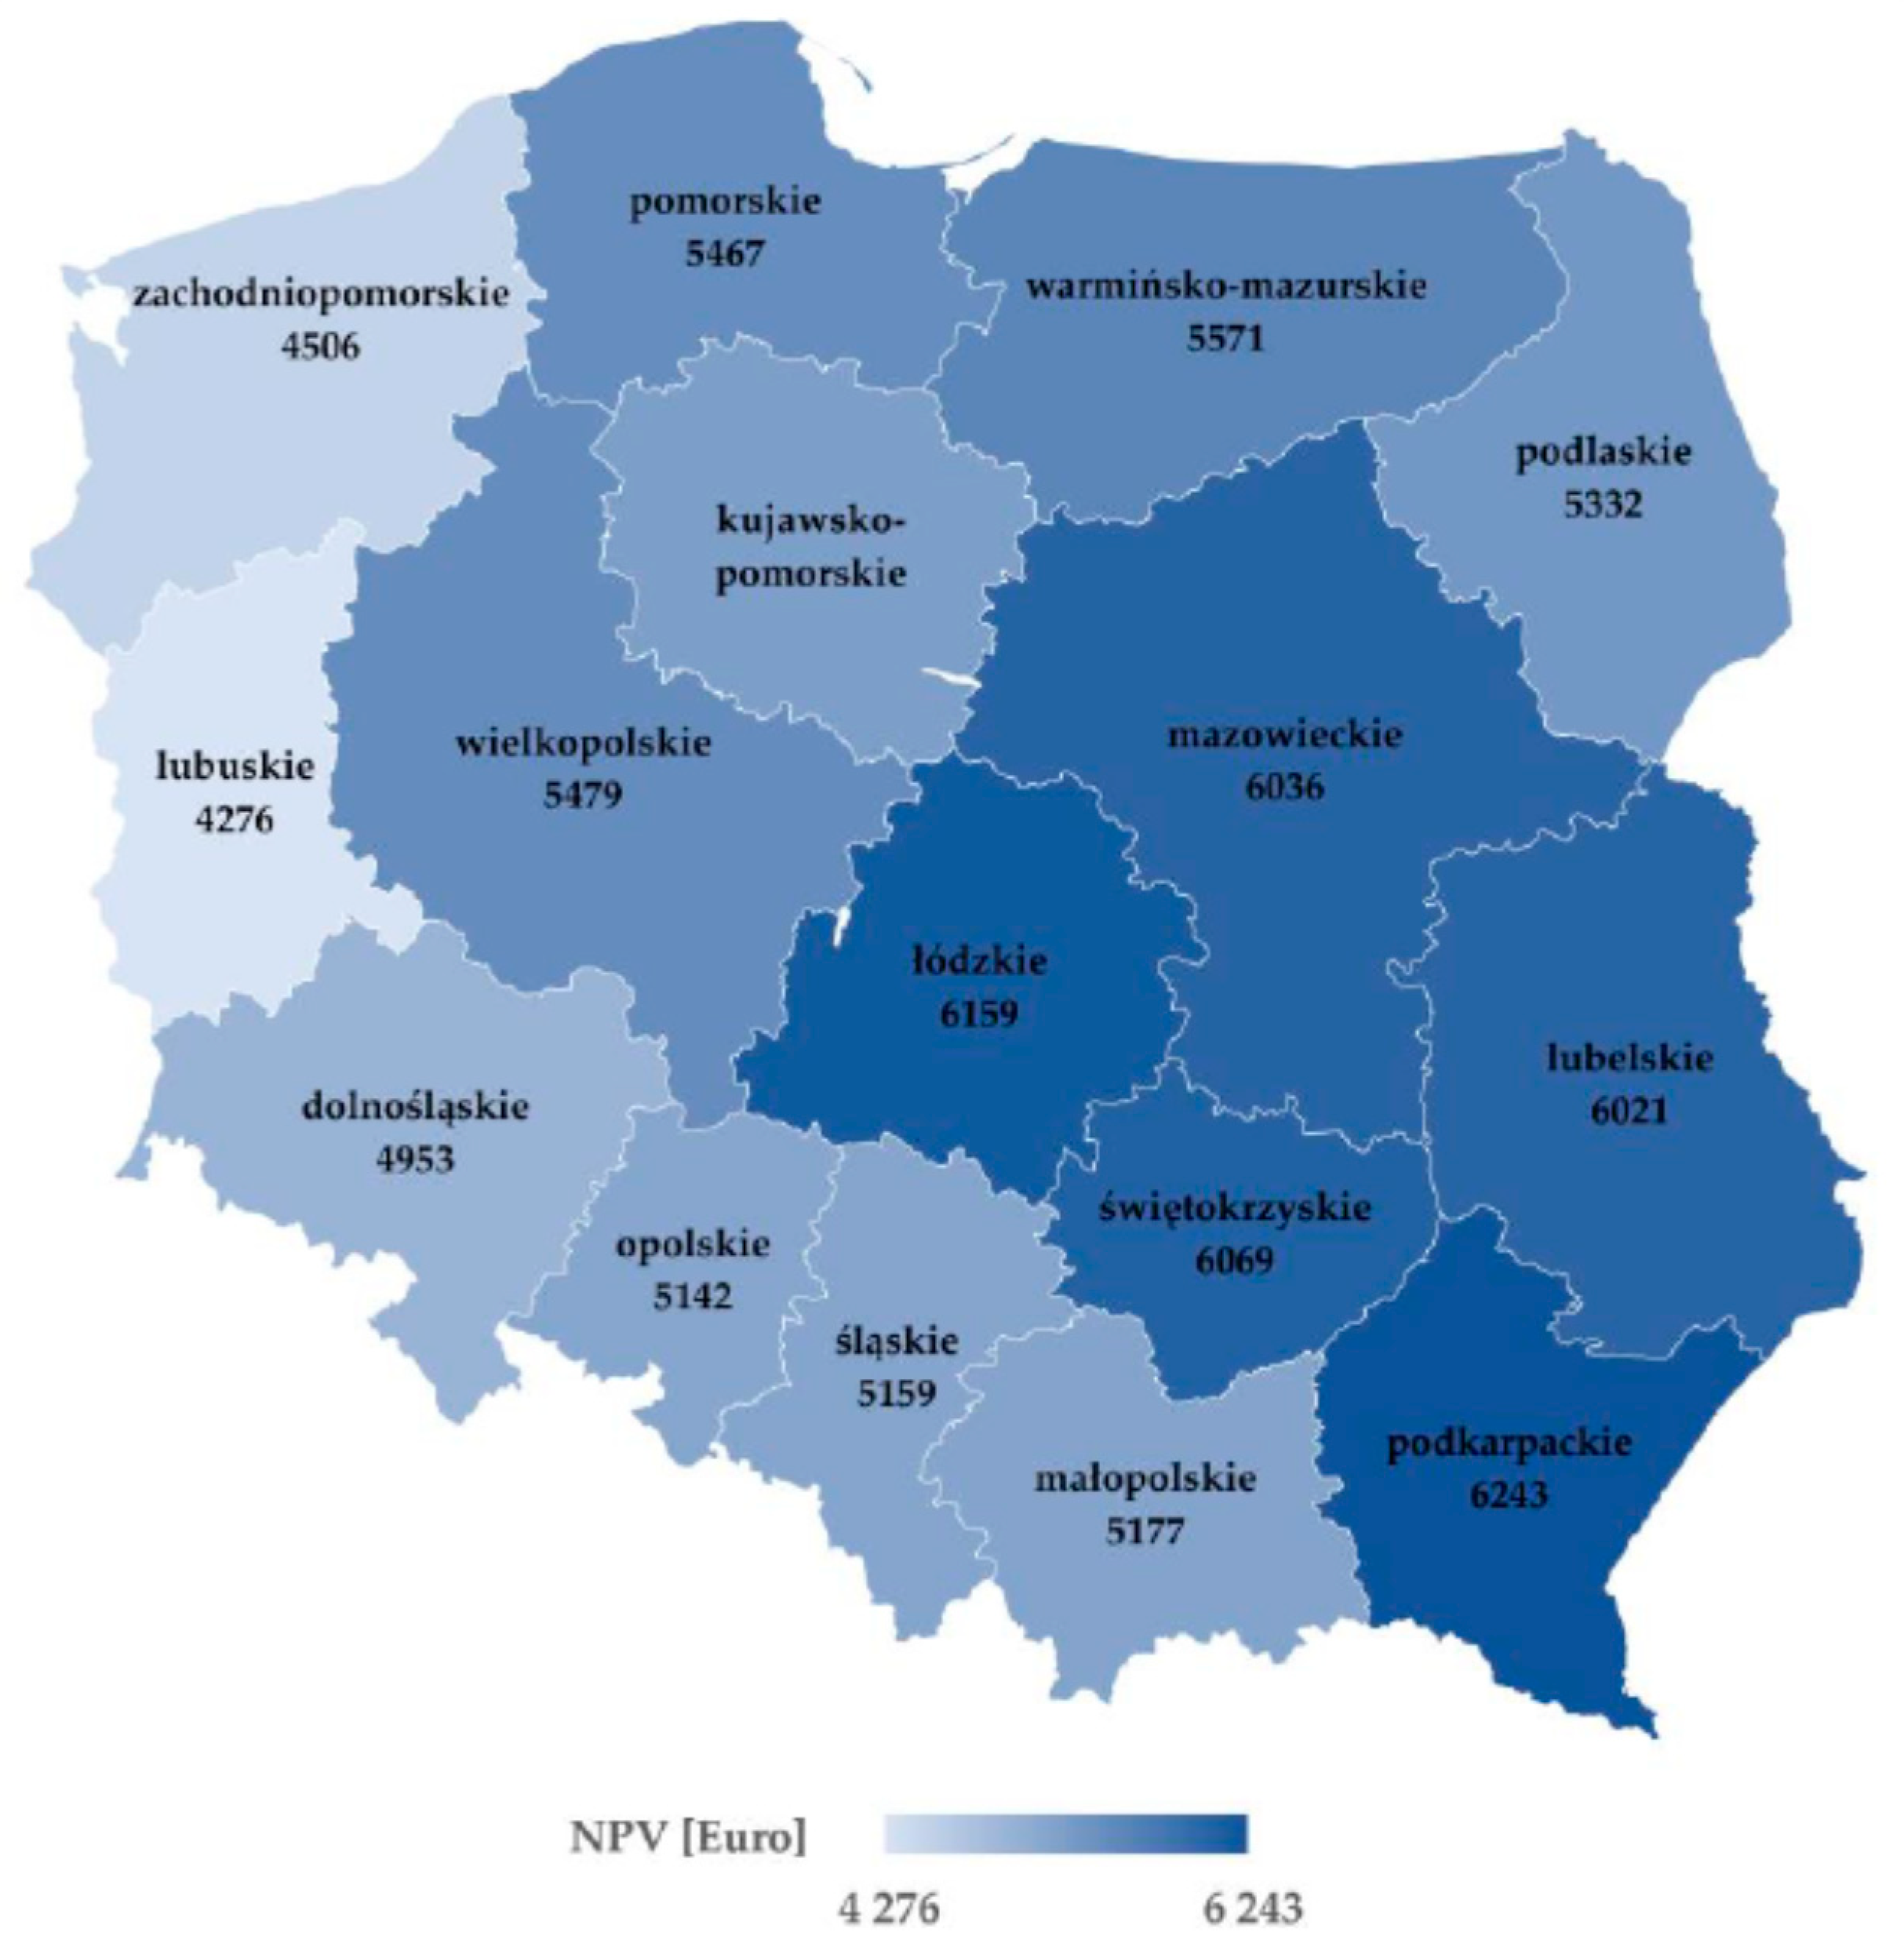
Table 2 presents the average NPV values on a macroeconomic level for particular voivodships, depending on the roof orientation. The mean was calculated as an arithmetic average that was defined for different roof inclination angles.
The results that are presented in Table 2 show that the production of electric energy with the use of PV installations is characterised by a differing macroeconomic efficiency, depending on the region, in which it is located and the orientation of the panels.
The most beneficial regions for investment from a social perspective are the following voivodships: Łódzkie, Świętokrzyskie, Mazowieckie, and Lubelskie. The average NPV value for these voivodships exceeded Euro 6000. However, the Lower Silesia, Lubuskie, and Zachodniopomorskie voivodships are the regions with the lowest NPV value on a macroeconomic level. The mean NPV value in these regions was no greater than Euro 5000 (Figure 4).
From the perspective of economic efficiency, the most beneficial roof orientation is a southern orientation, as well as a south-eastern and south-western one. The nationwide mean for the economic efficiency in the case of the southern orientation is 15% higher than the economic efficiency of the western orientation, and it is 12% higher for an eastern orientation. However, when comparing the mean efficiency for the southern orientation with the values obtained for south-eastern and south-western values, it can be stated that it is 2% higher than the south-eastern orientation and 4% higher than the south-western orientation (Figure 5).
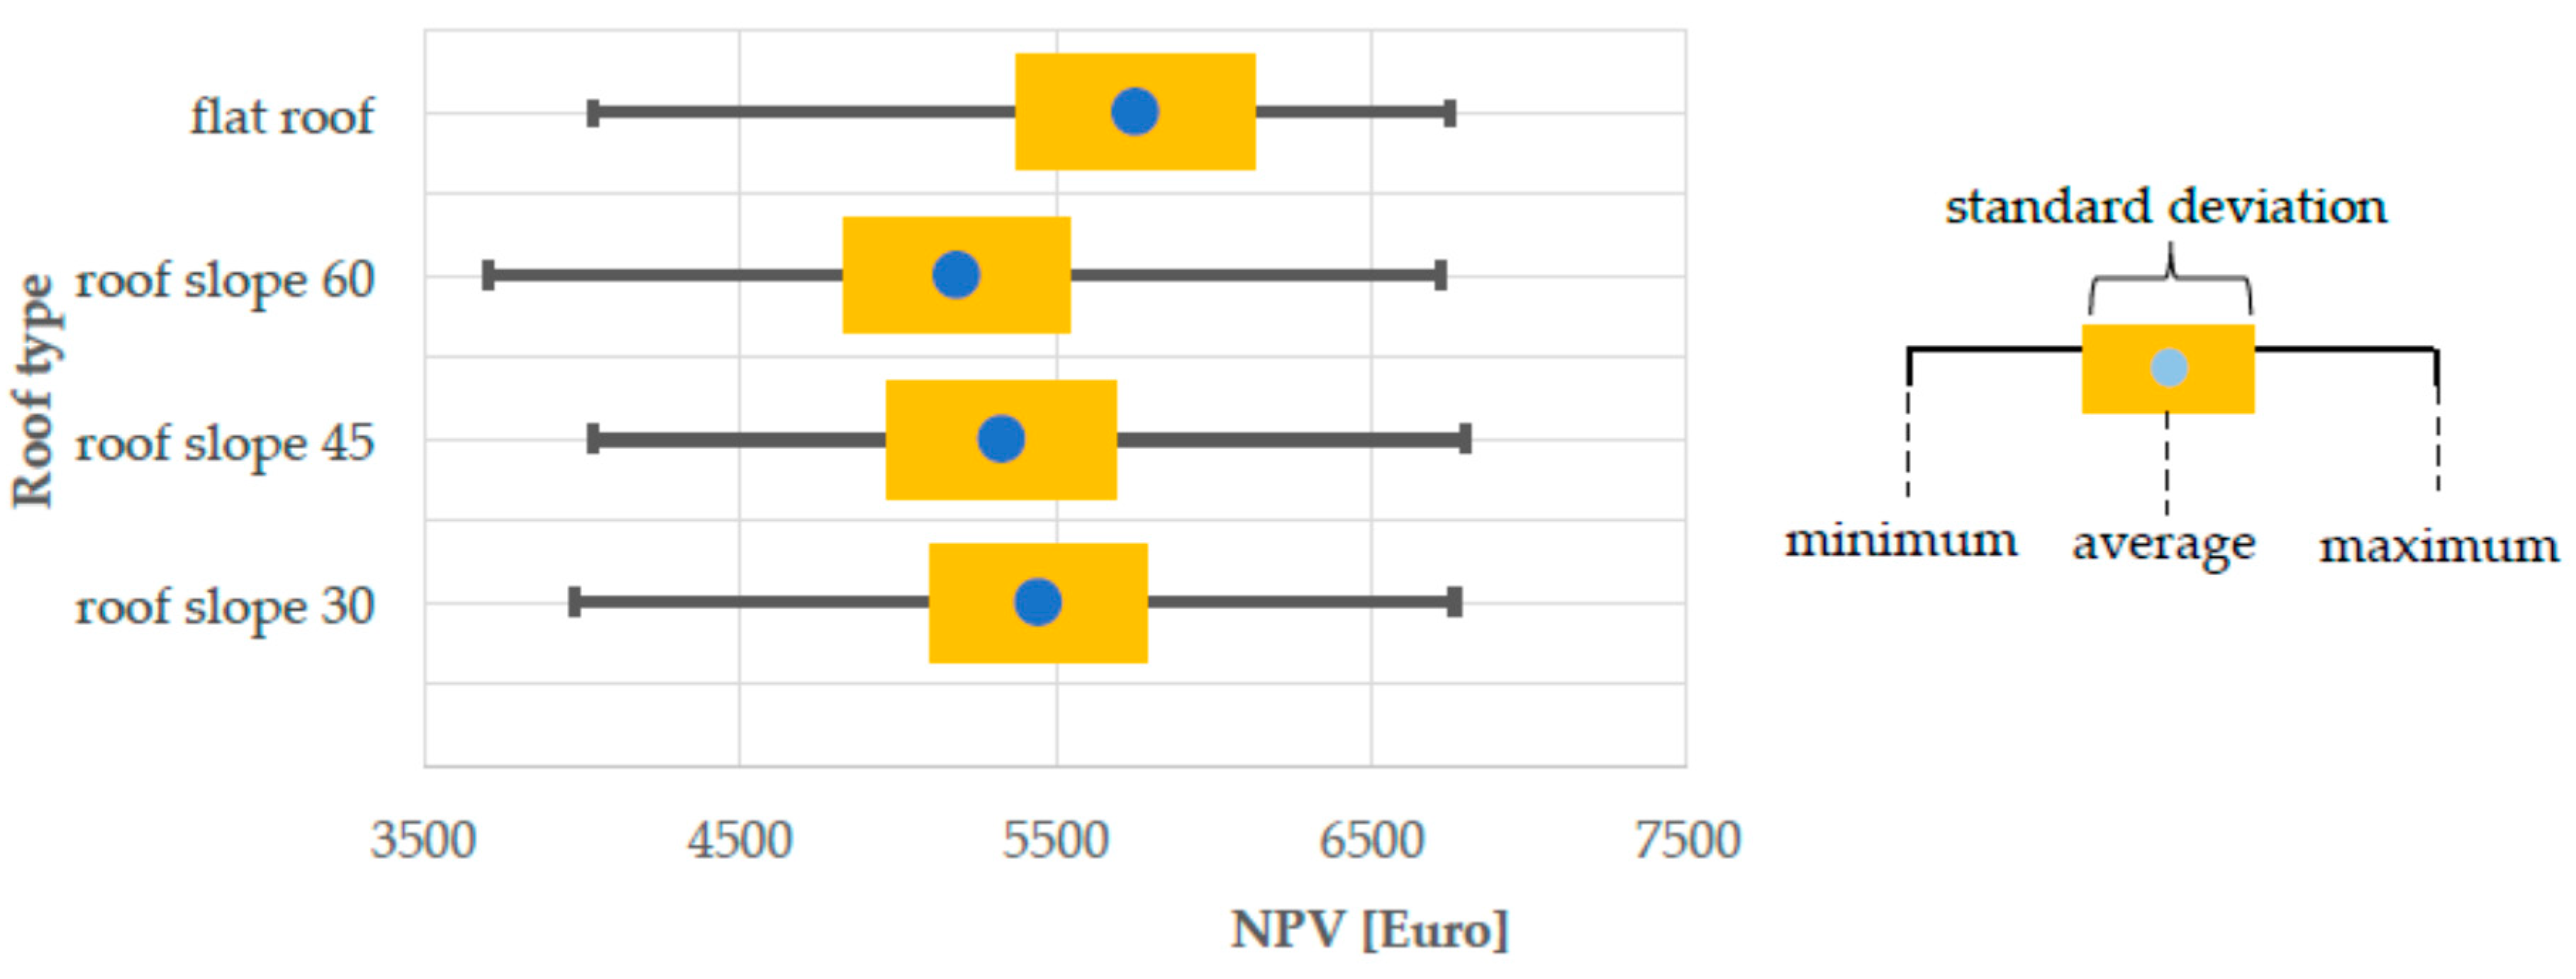
Another parameter influencing the economic efficiency of energy production while using PV panels is roof inclination, on which the installation is fixed (Figure 6). The greatest NPV values were obtained in the case of flat roofs. This type of roof construction enables optimal solar panel orientation, regardless of roof orientation. In the case of flat roofs, it is necessary to fix the PV installation on a supporting construction at a 30-degree angle. The necessity of making this type of construction increases the investment outlays. However, this additional cost is fully compensated by the benefits that result from the possibility of setting the orientation of the construction to an inclination optimal with regard to the sun. This is particularly important in the case of less beneficial roof inclinations, in other words, when the roof has an eastern or western inclination (Table 3). In the case of sloping roofs, no big differences were observed with regard to the economic efficiency for different inclination angles. An insignificant difference between maximum values that were obtained for different roof inclinations stems from the fact that the values were obtained for a southern roof orientation. This means that, with a southern building orientation, the angle of roof inclination does not significantly change the NPV value. With such an orientation, the edge flat roofs have over sloping roofs subsides and the calculated NPV value is found to be on a similar level for all of the inclination variants.
The return-on-investment period was another parameter of economic efficiency that was calculated in the study. This parameter is especially important to the investor, as it constitutes the time that must elapse for all incurred outlays (including investment outlays) to return as a result of the benefits of the undertaking. A long-Discounted Payback Period, together with doubts as to the future residence of an investor, are factors blocking the decision process with regard to fixing the PV panels. It is possible that the Discounted Payback Period does not take place before the change of abode and the seller does not retrieve the invested capital in the sale price of the estate. The calculated Discounted Payback Period, on the microeconomic level, depending on the calculation variant, is five to 11.5 years. In the case of most analysed variants (in 229 cases out of 320), the Discounted Payback Period, on a macroeconomic level, is shorter by 0.5–1.5 years in comparison with the Discounted Payback Period calculated for the installation owner. It is only in the case of investments with truly short Discounted Payback Periods of up to six years that the Discounted Payback Period, from a social perspective, is 2–3 months longer on a microeconomic level. However, this short-Discounted Payback Period does not enable the investment to be compensated by higher social benefits that are gained after the Discounted Payback Period. Figure 7 presents an example of such a calculation variant.
On a macroeconomic level, the Discounted Payback Period for PV investments is constituted by the time that must elapse for society to retrieve the incurred costs through the effects of the investment-primarily in the shape of lower external costs as well as lower subsidies for coal energy. Table 4 presents the results concerning the Discounted Payback Period, depending on investment location and roof orientation of the building.
As in the case of the NPV, the calculated Discounted Payback Periods are characterised by fluctuations, depending on the investment location and roof orientation of the building. The shortest Discounted Payback Period are for investments that are located in the region of the Podkarpackie Voivodship—the mean Discounted Payback Period is less than six years. This short-Discounted Payback Period results from the fact that:
- this voivodship is characterised by the most beneficial solar conditions—the annual mean average sum of irradiation in this region is 1050 kWh/m2, and
- this voivodship is characterised by some of the highest electricity prices—therefore the benefits resulting from savings made when purchasing electricity are greater.
The longest Discounted Payback Period, with regard to fixing installations, takes place in regions of the Lubuskie and Zachodniopomorskie voivodships—more than nine years. These voivodships are located in a region that is characterised by the lowest annual mean sum of irradiation (below 875 kWh/m2). A further factor contributing to the lower efficiency of PV investments are lower costs of purchasing electricity for RSEs—when only considering the variable costs, the price of energy in this region is 10% lower than in the case of the Podkarpackie Voivodship.
The Discounted Payback Period also depends on the orientation and roof inclination angle, as in the case of NPVs. The mean Discounted Payback Period in the case of the most beneficial southern orientation is around 1.5–2.5 years shorter than in the case of an eastern or western orientation. Only in the case of regions that are characterised by the worst solar conditions (Zachodniopomorskie, Lubuskie, and Kujawsko-Pomorskie voivodships), does the difference between Discounted Payback Periods for various roof orientations not exceed nine months.
When analysing the impact of the roof inclination angle on the Discounted Payback Period, it is observed that, in the case of a southern roof orientation, the roof inclination angle does not have any great effect on the Discounted Payback Period (Table 5). In the case of all other directions of building orientation, the best possible construction is the flat roof. This type of construction contributes to the shortening of the Discounted Payback Period, especially when the building has an eastern or western orientation.
The presented findings show that the factors influencing the economic efficiency of PV installations on a general social scale are: the investment location, building orientation, and roof inclination angle. The evaluation of the economic efficiency changes since the mean annual sum of irradiation energy and energy prices change, depending on the installation location. When the same amount of solar energy reaches the Earth, the efficiency of PV systems depends on the orientation of the absorption surface and its inclination angle. In such a situation, southern, south-eastern, and south-western orientations have an edge. This also holds true in the case of fixing installations on a flat roof on eastern and western orientations.
Another factor influencing the economic efficiency of PV installations is the number of panels that it holds. On the one hand, the number of panels defines the investment outlays; on the other hand, however, it influences the amount of produced electric energy. Together with an increase in the amount of energy produced, the number of benefits that go with it grows due to the saved cost of purchasing energy from a distributor and, additionally, on a social level, the benefits that stem from the fact that external costs are reduced as is the expenditure in the shape of subsidies for coal extraction.
When considering the abovementioned, the following econometric model has been designed while assuming the following variables and their scope of variability:
- variable Y explaining—NPV on a macroeconomic level [Euro];variables explainingX1—the mean annual sum of solar energy—the scope of variability being from 830 to 1051 [kWh/m2];X2—the number of panels constituting the PV installation—scope of variability from 8 to 12 [panels]; and,X3—parameter a is dependent on orientation and roof inclination. The parameter takes on the value of 1 for all roof types in the case of a southern, south-eastern, and south-western orientation, as well as in the case of a western or eastern orientation when it comes to flat roofs. For sloping roofs with an eastern or western orientation, the value of the parameter is 0.
As a result of applying the least squares method, the following regression equation was obtained:
The coefficient R2 for the above model equals 0.989, while the standard error of the estimate (Se) is 583.4. The assessment of quality of the structural parameters of the model indicates that all parameters were significantly different from zero at a significant level of α = 0.05. Therefore, it may be assumed that the variables for solar energy, panel number, and parameter a significantly affect the variable NPV. The presented results of the calculations indicate that the proposed model meets the accuracy criteria regarding compliance with empirical data as well as the assumptions concerning random components. It also confirms the impact of the amount of solar energy, size of installation, as well as orientation and roof inclination on the economic efficiency of PV installations on a macroeconomic level.
The final stage of data analysis indicated homogeneous regions with regard to the calculated NPV value on a macroeconomic level. For this purpose, the Duncan test was applied for a homogeneous population.
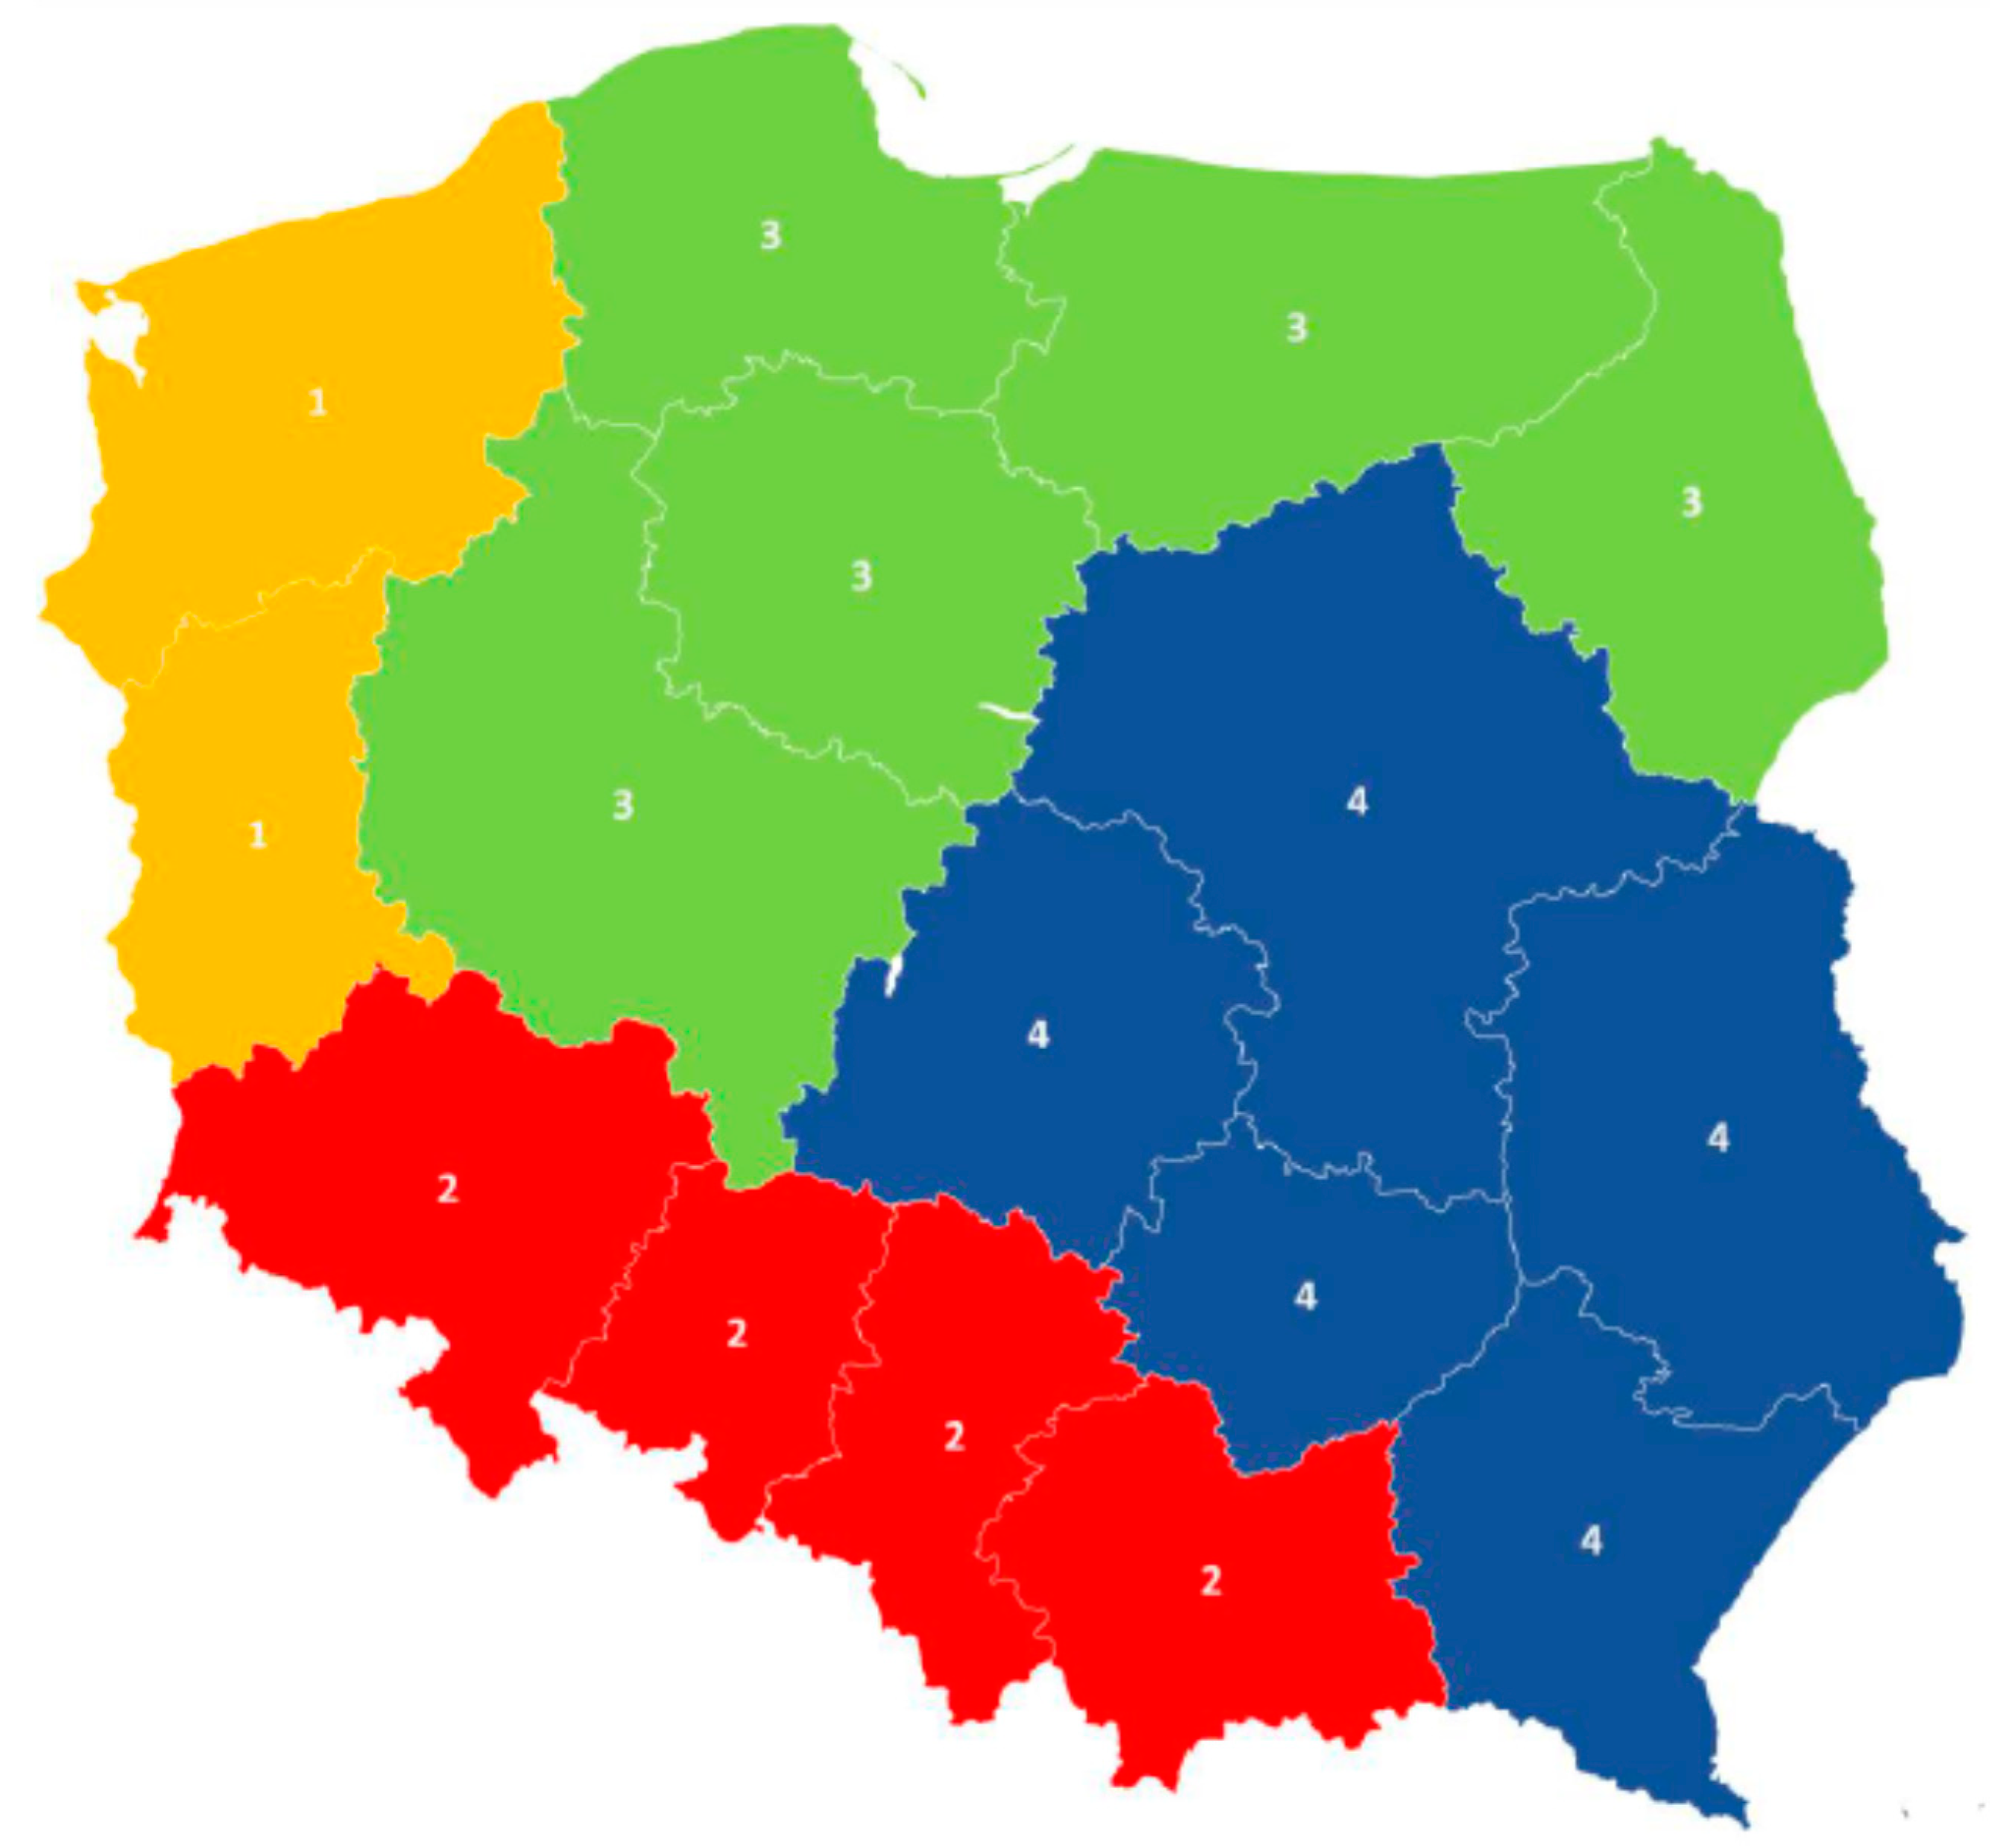
By applying the Duncan test, it was possible to determine the following four homogeneous groups with regard to NPV value on a macroeconomic level (Figure 8):
- Region 1—the least beneficial conditions for PV installation location, for which the NPV value on a social level is the lowest. This region encompasses the Lubuskie and Zachodniopomorskie Voivodships;
- Region 2—with average conditions for PV installation location encompassing the Lower Silesia, Opolskie, Silesia, and Małopolskie voivodships;
- Region 3—with good conditions for PV micro installation location encompassing the Kujawsko-pomorskie, Podlaskie, Pomorskie, Wielkopolskie, and Warmińsko-mazurskie voivodships; and,
- Region 4—with particularly good conditions for investing in PVs, for which the NPV value is the highest, encompassing the Lubelskie, Mazowieckie, Świętokrzyskie, Łódzkie, and Podkarpackie voivodships.
The above division results from the meteorological conditions that are determined by the mean annual solar irradiation energy as well as the differences in fees for electricity offered by different suppliers—in region 1, the encompassed voivodships are supplied with energy by Enea, in region 2—the voivodships encompassed are supplied with energy by Tauron, while, in region 4, the supplier of energy is the Polska Grupa Energetyczna. Only region 3 is not homogeneous when it comes to energy supplier. In this region, three different suppliers distribute energy: Enea, Energa, and Polska Grupa Energetyczna. Thus, accessible solar irradiation energy turned out to be the deciding factor of this region.
4. Discussion
The economic efficiency of investments in PV technologies, to a great extent, is dependent on regional conditions. That is why it is impossible to directly relate the obtained results to other studies by other authors [2]. However, what is worth noting, is the comparison of Discounted Payback Periods (Table 6).
The findings that were obtained in this study, on a microeconomic level, show that the Discounted Payback Period for PV installations aimed at meeting the demand for electricity of a household depends greatly and foremostly on the location and it is found to be between five and 11.5 years. The shorter Discounted Payback Period periods cited above result from the fact that the analyses carried out in our study take the perspective of the whole society into account, while previous studies concerned the installation owner’s perspective. Higher economic efficiency on a macroeconomic level (the perspective of society as a whole) results from the greater value of benefits for society. From the perspective of a PV installation owner, the only benefits that are reaped are in the shape of savings stemming from lower variable costs that are connected with the purchase of electricity. However, from the perspective of society as a whole, the production of electricity from RESs, including solar energy, carries benefits that result from the avoidance of ecological damage caused by obtaining and converting conventional energy sources. Additionally, in Polish conditions, increasing the share of RESs in producing electricity may contribute to a decrease in the level of expenditure from public funds on subsidies for mining, which was also taken into account in the conducted analysis. Another factor contributing to shorter Discounted Payback Periods, in comparison with previous studies, is the observed decline in the costs of installing panels.
When considering that electricity prices from non-renewable energy sources, in line with present trends, will continue to grow, while the prices of PV modules drop, we can expect an even shorter Discounted Payback Period of PV investments and lower risks involved [40]. On a macroeconomic level, another factor contributing to an increase in the efficiency of using solar energy is the anticipated decrease in the negative impact of panels on the environment, due to an increase in their performance, reduction in energy consumption during the modules production, and an improving recycling process [74].
PV installations with a power not exceeding 10 kWp fixed on rooftops of single-family homes to meet the household demand for electricity are greatly subsidized by society. Households are not interested in PVs when the cost of producing energy from traditional sources is far lower than the cost of utilising solar energy. That is why, in the opinion of Gulaliyev et al. [6], private companies and households should be supported with special programmes. The obtained results show that the mechanism serving to support the development of PV installations in Poland, based on subsidies and tax relief, is economically viable. Decreasing investment outlays, incurred in the process of PV investments, by implementing subsidies and tax relief will increase the possibility of undertaking such investments by households in Poland. Applying different kinds of support for such systems increases their microeconomic efficiency. Discounted Payback Periods, from the perspective of the investor and society (macroeconomic level), are similar, but the obtained NPV values on a macroeconomic level are 23–59% higher in comparison to the microeconomic level, which means that society is the beneficiary of such investments, rather than private investors. The obtained results indicate that the mechanism serving to support the development of PV installations in Poland, based on subsidies and tax relief, is economically viable. The added value of social benefits in the shape of fewer losses with regards to environmental pollution due to substituting the production of electricity from coal with solar energy is greater than the support that installation owners receive for investments from public funds. However, it is worth noting that the condition that needs to be met for environmental benefits to be reaped is for the production of energy by applying PV panels to result in appropriate limitations on the production of electricity in conventional power plants. This may only take place if continuous support is directed at developing RESs that aim to gain a greater share in Poland’s energy balance.
Further results that are worth highlighting are those that talk about the regional differentiation of macroeconomic efficiency in PV investments in Poland. The south-eastern and central part of the country have been indicated as regions with the most beneficial conditions for such investments. On the one hand, this stems from a more advantageous level of annual value of insolation; on the other hand, this part of Poland has the highest electricity fees applicable. In the case of higher fees for electricity, the value of effects that result from savings stemming from the purchase of electricity increase. The south-western region, from the perspective of macroeconomic efficiency, is the least beneficial for fixing PV installations on single-family home rooftops. It is caused by the lowest level of annual insolation value in this region, as well as the lowest electricity fees in the whole of Poland.
The presented results indicating regional differentiation and identifying uniform areas when it comes to economic efficiency of energy production using PV installations can be applied in order to formulate national policy in the scope of photoinstallations in Poland. One of the rules of public fund expenditure is efficiency, which translates into the idea that public funds are spent in such a way that the effects that result from their expenditure are as great as possible. From among the projects, which have obtained support in the scope of the first edition of the programme “My Electricity” (Mój Prąd), targeted at subsidising micro installations of 2–10 kWp, the highest indicator of power installed per 1000 inhabitants was obtained by the Podkarpackie Voivodship, while the lowest in the Zachodniopomorskie Voivodship [63]. This proves that public funds are being made use of appropriately—the greatest increase in power installed obtained from subsidies in the scope of the programme is found to be in the region where the macroeconomic efficiency of installations is the highest. In other words, state support has been taken advantage of in a region that has gained the most social benefits.
Canales et al. [75] pay attention to the fact that climate changes are having an impact on the RES sector in Poland. The observed air temperature increase, on the one hand, decreases the demand for heat; on the other hand, it increases the demand for cooling in the summertime. PV panels fixed onto the walls of buildings, besides producing electric energy, decrease the heat transfer coefficient through building partitions. In this way, panels improve the energy efficiency of the building [76]. By 2030, all existing communal buildings in Europe will be heated and cooled to at least 50% by thermal solar energy, and with regard to new buildings, it is assumed that solar energy will meet 100% of its demand, according to the ESTTP report [14,32,33]. In this situation, it is recommended to continue conducting further research into the economic efficiency of PV panel installations, not just as a way of meeting the demand for electric energy, but also as a way of heating and cooling rooms in single-family homes.
5. Conclusions
Research shows that the production of electricity with the use of PV installations that are fixed to the roofs of single-family houses in Poland are greatly economically efficient—both on a micro- and macroeconomic level. The NPV, on the macroeconomic level, depending on installation location, fluctuates between EUR 3700 and EUR 6800. For comparison, NPV on a microeconomic level was 20–60% lower. The assessment of efficiency that was carried out on the basis of the ROI period indicates that, on a macroeconomic level, this return constitutes five to 10 years, and it is shorter by about 0.5–1.5 years in comparison with the ROI period calculated on a microeconomic level. Greater economic efficiency on a macroeconomic level results from a greater value of benefits being obtained on this level, mainly including benefits in the form of avoiding ecological damage that is caused by obtaining and converting conventional energy sources.
Factors influencing the economic efficiency of PV installations are: the mean annual sum of solar energy, geographical location, the number of solar panels constituting the installation, the angle of inclination, as well as the orientation of the building on which the installation is fixed. Depending on the parameters that are adopted for these factors, the ROI period differed by 4.5 years
The presented results that indicate regional differentiation and identifying uniform areas when it comes to the economic efficiency of energy production with the application of PV installations may be used in order to shape the rules of national policy in the scope of support. They may also constitute encouragement for introducing support policies regarding PV installations in households in countries that are located in a similar climate zone to Poland, as well as other regions of the world.
Author Contributions
Conceptualization, M.B. and A.S.; literature review A.S.; methodology, M.B., J.M. and A.S.; formal analysis, M.B.; writing—original draft preparation, M.B. and A.S.; writing—review and editing, J.M. All authors have read and agreed to the published version of the manuscript.
Funding
This research received no external funding.
Institutional Review Board Statement
Not applicable.
Informed Consent Statement
Not applicable.
Data Availability Statement
Data is contained within the article.
Conflicts of Interest
The authors declare no conflict of interest.
References
- Kakaras, E.; Koumanakos, A.K.; Doukelis, A. Pressurized fluidized bed combustion (PFBC) combined cycle systems. In Combined Cycle Systems for Near-Zero Emission Power Generation; Elsevier: Amsterdam, The Netherlands, 2012; pp. 220–233. [Google Scholar]
- Knutel, B.; Pierzyńska, A.; Dębowski, M.; Bukowski, P.; Dyjakon, A. Assessment of Energy Storage from Photovoltaic Installations in Poland Using Batteries or Hydrogen. Energies 2020, 13, 4023. [Google Scholar] [CrossRef]
- Mondal, P.; Yadav, A. An overview on different methods of Domestic Waste Management and Energy generation in India. In Proceedings of the 2018 International Conference on Smart City and Emerging Technology (ICSCET), Mumbai, India, 5 January 2018; pp. 1–5. [Google Scholar]
- BP Statistical Review of World Energy, 68th ed.; 2019; Available online: https://www.bp.com/content/dam/bp/business-sites/en/global/corporate/pdfs/energy-economics/statistical-review/bp-stats-review-2019-full-report.pdf (accessed on 10 November 2020).
- Smil, V. 21st century energy: Some sobering thoughts. OECD Obs. 2006, 258–259, 22–24. [Google Scholar]
- Gulaliyev, M.G.; Mustafayev, E.R.; Mehdiyeva, G.Y. Assessment of Solar Energy Potential and Its Ecological-Economic Efficiency: Azerbaijan Case. Sustainability 2020, 12, 1116. [Google Scholar] [CrossRef] [Green Version]
- Jurasz, J.; Canales, F.A.; Kies, A.; Guezgouz, M.; Beluco, A. A review on the complementarity of renewable energy sources: Concept, metrics, application and future research directions. Sol. Energy 2020, 195, 703–724. [Google Scholar] [CrossRef]
- Kádár, P. Pros and cons of the renewable energy application. Acta Polytech. Hung. 2014, 11, 211–224. [Google Scholar]
- IEA. Key World Energy Statistics 2020, Statistics Report; International Energy Agency: Paris, France; Available online: https://www.iea.org/reports/key-world-energy-statistics-2020 (accessed on 10 November 2020).
- Hałacz, J.; Neugebauer, M.; Sołowiej, P.; Nalepa, K.; Wesołowski, M. Recycling Expired Photovoltaic Panels in Poland. In Renewable Energy Sources: Engineering, Technology, Innovation; Springer: Berlin/Heidelberg, Germany, 2020; pp. 459–470. [Google Scholar]
- Johansen, I.; Stoa, P. Ethical challenges in reducing global greenhouse gas emission. In Proceedings of the 2014 IEEE International Symposium on Ethics in Science, Chicago, IL, USA, 23–24 May 2014; Technology and Engineering. IEEE: Chicago, IL, USA, 2014; pp. 1–5. [Google Scholar]
- García-Álvarez, M.T.; Cabeza-García, L.; Soares, I. Assessment of energy policies to promote photovoltaic generation in the European Union. Energy 2018, 151, 864–874. [Google Scholar] [CrossRef]
- Pereira, M.G.; Sena, J.A.; Freitas, M.A.V.; Da Silva, N.F. Evaluation of the impact of access to electricity: A comparative analysis of South Africa, China, India and Brazil. Renew. Sustain. Energy Rev. 2011, 15, 1427–1441. [Google Scholar] [CrossRef]
- ESTTP. Solar Thermal Vision 2030; European Solar Thermal Technology Platform, 2006; Available online: https://silo.tips/download/solar-thermal-vision-2030 (accessed on 8 November 2020).
- Andenæs, E.; Jelle, B.P.; Ramlo, K.; Kolaas, T.; Selj, J.; Foss, S.E. The influence of snow and ice coverage on the energy generation from photovoltaic solar cells. Sol. Energy 2018, 159, 318–328. [Google Scholar] [CrossRef]
- Andrews, R.W.; Pollard, A.; Pearce, J.M. The effects of snowfall on solar photovoltaic performance. Sol. Energy 2013, 92, 84–97. [Google Scholar] [CrossRef] [Green Version]
- Heidari, N.; Gwamuri, J.; Townsend, T.; Pearce, J.M. Impact of snow and ground interference on photovoltaic electric system performance. IEEE J. Photovolt. 2015, 5, 1680–1685. [Google Scholar] [CrossRef] [Green Version]
- Mehleri, E.D.; Zervas, P.L.; Sarimveis, H.; Palyvos, J.A.; Markatos, N.C. Determination of the optimal tilt angle and orientation for solar photovoltaic arrays. Renew. Energy 2010, 35, 2468–2475. [Google Scholar] [CrossRef]
- Perovich, D.K. Light reflection and transmission by a temperate snow cover. J. Glaciol. 2007, 53, 201–210. [Google Scholar] [CrossRef] [Green Version]
- Quansah, D.A.; Adaramola, M.S. Ageing and degradation in solar photovoltaic modules installed in northern Ghana. Sol. Energy 2018, 173, 834–847. [Google Scholar] [CrossRef]
- Rowlands, I.H.; Kemery, B.P.; Beausoleil-Morrison, I. Optimal solar-PV tilt angle and azimuth: An Ontario (Canada) case-study. Energy Policy 2011, 39, 1397–1409. [Google Scholar] [CrossRef]
- Sohani, A.; Sayyaadi, H. Employing genetic programming to find the best correlation to predict temperature of solar photovoltaic panels. Energy Convers. Manag. 2020, 224, 113291. [Google Scholar] [CrossRef]
- Talaat, M.; Alsayyari, A.S.; Essa, M.A.; Yousef, M.A. Investigation of transparent pyramidal covers effect to PV power output using detected wireless sensors incident radiation. Measurement 2019, 136, 775–785. [Google Scholar] [CrossRef]
- Zdyb, A.; Gulkowski, S. Performance Assessment of Four Different Photovoltaic Technologies in Poland. Energies 2020, 13, 196. [Google Scholar] [CrossRef] [Green Version]
- Burgio, A.; Menniti, D.; Sorrentino, N.; Pinnarelli, A.; Leonowicz, Z. Influence and impact of data averaging and temporal resolution on the assessment of energetic, economic and technical issues of hybrid photovoltaic-battery systems. Energies 2020, 13, 354. [Google Scholar] [CrossRef] [Green Version]
- Peter, J. How does climate change affect electricity system planning and optimal allocation of variable renewable energy? Appl. Energy 2019, 252, 113397. [Google Scholar] [CrossRef]
- Dale, V.H.; Efroymson, R.A.; Kline, K.L. The land use–climate change–energy nexus. Landsc. Ecol. 2011, 26, 755–773. [Google Scholar] [CrossRef]
- De Prada-Gil, M.; Domínguez-García, J.L.; Trilla, L.; Gomis-Bellmunt, O. Technical and economic comparison of various electrical collection grid configurations for large photovoltaic power plants. IET Renew. Power Gener. 2016, 11, 226–236. [Google Scholar] [CrossRef]
- Fathi, M.; Abderrezek, M.; Grana, P. Technical and economic assessment of cleaning protocol for photovoltaic power plants: Case of Algerian Sahara sites. Sol. Energy 2017, 147, 358–367. [Google Scholar] [CrossRef]
- Mayer, M.J.; Gróf, G. Techno-economic optimization of grid-connected, ground-mounted photovoltaic power plants by genetic algorithm based on a comprehensive mathematical model. Sol. Energy 2020, 202, 210–226. [Google Scholar] [CrossRef]
- Zhang, Y.; Lundblad, A.; Campana, P.E.; Yan, J. Comparative study of battery storage and hydrogen storage to increase photovoltaic self-sufficiency in a residential building of Sweden. Energy Procedia 2016, 103, 268–273. [Google Scholar] [CrossRef]
- Bernal-Agustín, J.L.; Dufo-López, R. Economical and environmental analysis of grid connected photovoltaic systems in Spain. Renew. Energy 2006, 31, 1107–1128. [Google Scholar] [CrossRef]
- Duong, M.Q.; Tran, N.T.N.; Sava, G.N.; Tanasiev, V. Design, performance and economic efficiency analysis of the photovoltaic rooftop system. Rev. Roum. Sci. Techn. 2019, 64, 229–234. [Google Scholar]
- Grygierek, K.; Ferdyn-Grygierek, J.; Gumińska, A.; Baran, L.; Barwa, M.; Czerw, K.; Gowik, P.; Makselan, K.; Potyka, K.; Psikuta, A. Energy and Environmental Analysis of Single-Family Houses Located in Poland. Energies 2020, 13, 2740. [Google Scholar] [CrossRef]
- Kępa, A. Photovoltaic Panels in a Single-Family House. In Renewable Energy Sources: Engineering, Technology, Innovation; Springer: Berlin/Heidelberg, Germany, 2020; pp. 471–482. [Google Scholar]
- Orioli, A.; Di Gangi, A. Review of the energy and economic parameters involved in the effectiveness of grid-connected PV systems installed in multi-storey buildings. Appl. Energy 2014, 113, 955–969. [Google Scholar] [CrossRef] [Green Version]
- Bartecka, M.; Terlikowski, P.; Kłos, M.; Michalski, Ł. Sizing of prosumer hybrid renewable energy systems in Poland. Bull. Pol. Acad. Sci. Tech. Sci. 2020, 68, 721–731. [Google Scholar]
- Audenaert, A.; De Boeck, L.; De Cleyn, S.; Lizin, S.; Adam, J.-F. An economic evaluation of photovoltaic grid connected systems (PVGCS) in Flanders for companies: A generic model. Renew. Energy 2010, 35, 2674–2682. [Google Scholar] [CrossRef]
- Dobrzycki, A.; Kurz, D.; Mikulski, S.; Wodnicki, G. Analysis of the Impact of Building Integrated Photovoltaics (BIPV) on Reducing the Demand for Electricity and Heat in Buildings Located in Poland. Energies 2020, 13, 2549. [Google Scholar] [CrossRef]
- Górnowicz, R.; Castro, R. Optimal design and economic analysis of a PV system operating under Net Metering or Feed-In-Tariff support mechanisms: A case study in Poland. Sustain. Energy Technol. Assess. 2020, 42, 100863. [Google Scholar] [CrossRef]
- Kurdgelashvili, L.; Shih, C.-H.; Yang, F.; Garg, M. An empirical analysis of county-level residential PV adoption in California. Technol. Forecast. Soc. Chang. 2019, 139, 321–333. [Google Scholar] [CrossRef]
- Cho, Y.; Shaygan, A.; Daim, T.U. Energy technology adoption: Case of solar photovoltaic in the Pacific Northwest USA. Sustain. Energy Technol. Assess. 2019, 34, 187–199. [Google Scholar] [CrossRef]
- Soliński, B.; Kała, J. Efektywność ekonomiczna funkcjonowania mikroinstalacji fotowoltaicznych wykorzystywanych przez prosumenta. Probl. Drob. Gospod. Rol. 2017, 105–116. [Google Scholar] [CrossRef]
- Rekordowy Rok dla Fotowoltaiki. Available online: https://www.ure.gov.pl/pl/urzad/informacje-ogolne/aktualnosci/8771,Rekordowy-rok-dla-fotowoltaiki.html (accessed on 26 November 2020).
- Pepłowska, M.; Olczak, P. Problematyka doboru kąta posadowienia paneli fotowoltaicznych z uwzględnieniem profilu zapotrzebowania na energię. Zeszyty Naukowe Instytutu Gospodarki Surowcami Mineralnymi i Energią PAN 2018, 102, 91–100. [Google Scholar]
- Dusonchet, L.; Telaretti, E. Comparative economic analysis of support policies for solar PV in the most representative EU countries. Renew. Sustain. Energy Rev. 2015, 42, 986–998. [Google Scholar] [CrossRef]
- Dusonchet, L.; Telaretti, E. Economic analysis of different supporting policies for the production of electrical energy by solar photovoltaics in western European Union countries. Energy Policy 2010, 38, 3297–3308. [Google Scholar] [CrossRef]
- Sartori, D.; Catalano, G.; Genco, M.; Pancotti, C.; Sirtori, E.; Vignetti, S.; Bo, C. Guide to cost-benefit analysis of investment projects. In Economic Appraisal Tool for Cohesion Policy 2014–2020; Publications Office of the European Union: Luxembourg, 2014. [Google Scholar]
- Miłaszewski, R. Economic efficiency of investments in water and sewage management and water protection. In Materials for Studying Water Supply and Water Pollution Control Economics; Wydawnictwo Ekonomia i Środowisko: Białystok, Poland, 2008; p. 56. [Google Scholar]
- Solorzano, V.; García, L.; Ramos, M.; Vargas, O. Economic value added (EVA) as an indicator for financial decisions: An Application to the Province of Santa Elena, Ecuador. Ecorfan J. 2013, 4, 1077–1086. [Google Scholar]
- Manteuffel-Szoege, H. Problems of Environmental and Natural Resources Economics; Wydawnictwo SGGW: Warszawa, Poland, 2013. [Google Scholar]
- IFAD. Economic and Financial Analysis of Rural Investment Projects. IFAD’S Internal Guidelines; International Fund for Agricultural Development, 2015; Available online: https://www.ifad.org/documents/38711624/39761613/Economic+and+Financial+Analysis+of+rural+investment+projects.pdf/4b36c3cf-d465-44c7-9a76-ab1f6de43eb1 (accessed on 8 November 2020).
- ENERGY STAR® Building Upgrade Manual. 2008. Available online: https://www.energystar.gov/sites/default/files/buildings/tools/EPA_BUM_Full.pdf (accessed on 10 November 2020).
- Freeman, M.; Groom, B.; Spackman, M. Social discount rates for cost-benefit analysis: A report for HM Treasury. A Summary Report from Two Workshops on Recent Advances in Social Discounting Practice and Theory; 2018. Available online: https://assets.publishing.service.gov.uk/government/uploads/system/uploads/attachment_data/file/935551/Social_Discount_Rates_for_Cost-Benefit_Analysis_A_Report_for_HM_Treasury.pdf (accessed on 8 November 2020).
- BIS. Study on Photovoltaic Panels Supplementing the Impact Assessment for Recast of the WEEE Directive. Final Report; BIO Intelligence Service, 2011; Available online: https://ec.europa.eu/environment/waste/weee/pdf/Study%20on%20PVs%20Bio%20final.pdf (accessed on 8 November 2020).
- Mahesh, A.; Sandhu, K.S. Hybrid wind/photovoltaic energy system developments: Critical review and findings. Renew. Sustain. Energy Rev. 2015, 52, 1135–1147. [Google Scholar] [CrossRef]
- GUS. Zużycie Energii w Gospodarstwach Domowych w 2018 r.; Główny Urząd Statystyczny: Warszawa, Poland, 2019. Available online: https://stat.gov.pl/obszary-tematyczne/srodowisko-energia/energia/zuzycie-energii-w-gospodarstwach-domowych-w-2018-roku,2,4.html (accessed on 4 November 2020).
- Photovoltaics PV Calculator. Available online: https://www.hewalex.pl/fotowoltaika/kalkulator/ (accessed on 11 November 2020). (In Polish).
- Sala, K. Energetyka słoneczna jako czynnik rozwoju regionów i gmin w Polsce. Przedsiębiorczość-Edukacja 2018, 14, 125–138. [Google Scholar] [CrossRef]
- Half-yearly Price Indices of Consumer Goods and Services from 1989. Available online: https://stat.gov.pl/en/topics/prices-trade/price-indices/price-indices-of-consumer-goods-and-services/half-yearly-price-indices-of-consumer-goods-and-services-from-1989/ (accessed on 26 November 2020).
- European Union Consumer Price Index (CPI). Available online: https://tradingeconomics.com/european-union/consumer-price-index-cpi (accessed on 26 November 2020).
- Ocena Sytuacji na Rynku Euro w Roku 2020. Available online: https://eur-pln.pl/2020/ (accessed on 26 November 2020).
- Olczak, P.; Matuszewska, D.; Kryzia, D. ”Mój Prąd” as an example of the photovoltaic one off grant program in Poland. Polityka Energetyczna-Energy Policy J. 2020, 23, 123–138. [Google Scholar] [CrossRef]
- ING. Ogólne Warunki Ubezpieczenia Budynków i Lokali Mieszkalnych dla Kredytobiorców Kredytów Hipotecznych Udzielanych przez ING Bank Śląski S.A. 2015. Available online: https://www.ing.pl/_fileserver/item/1112384 (accessed on 8 November 2020).
- Recykling Modułów PV w Polsce Ile Kosztuje? Co się Odzyskuje? GLOBEnergia. Available online: https://globenergia.pl/recykling-modulow-pv-w-polsce-ile-kosztuje-co-sie-odzyskuje/ (accessed on 26 November 2020).
- Ustawa z Dnia 22 Czerwca 2016 r. o Zmianie Ustawy z dnia 20 lutego 2015 r. o Odnawialnych Źródłach Energii. Available online: https://www.google.com/search?q=Ustawa+z+dnia+22+czerwca+2016+r.+o+zmianie+ustawy+z+dnia+20+lutego+2015+r.+o+odnawialnych+%C5%BAr%C3%B3d%C5%82ach+energii&ie=utf-8&oe=utf-8 (accessed on 26 November 2020).
- IEO. Rynek Fotowoltaiki w Polsce. 2019 r.; Solar: Warszawa, Poland, 2019; p. 20. Available online: https://ieo.pl/pl/projekty/raport-rynek-fotowoltaiki-w-polsce-2019 (accessed on 10 November 2020).
- SRoeCo Solar. Compare Solar Efficiency Losses over Time. 2011. Available online: http://sroeco.com/solar/solar-efficiency-losses-over-time/ (accessed on 10 November 2020).
- Raport o Pomocy Publicznej w Polsce Udzielonej Przedsiębiorcom w 2018 Roku. Available online: https://www.uokik.gov.pl/raporty_i_analizy2.php (accessed on 26 November 2020).
- Coal (Solid Fossil Fuels and Manufactured Gases). Annual Questionnaire 2017–2021 and Historical Revisions. 2018. Eurostat. Available online: https://www.google.com/search?q=Coal+%28Solid+Fossil+Fuels+and+Manufactured+Gases%29.+Annual+questionnaire+2017-2021+and+historical+revisions.+%5B2018%5D+Eurostat&ie=utf-8&oe=utf-8 (accessed on 8 November 2020).
- Kimura, H.; Sato, T.; Bergins, C.; Imano, S.; Saito, E. Development of technologies for improving efficiency of large coal-fired thermal power plants. Hitachi Rev. 2011, 60, 365. [Google Scholar]
- Samadi, S. The social costs of electricity generation—Categorising different types of costs and evaluating their respective relevance. Energies 2017, 10, 356. [Google Scholar] [CrossRef] [Green Version]
- Gradziuk, P.; Gradziuk, B. Economic profitability of investment in a photovoltaic plant in south-east Poland. Ann. Pol. Assoc. Agric. Agrobusiness Econ. 2019, 21, 124–133. [Google Scholar] [CrossRef]
- Gerbinet, S.; Belboom, S.; Léonard, A. Life Cycle Analysis (LCA) of photovoltaic panels: A review. Renew. Sustain. Energy Rev. 2014, 38, 747–753. [Google Scholar] [CrossRef]
- Canales, F.A.; Jadwiszczak, P.; Jurasz, J.; Wdowikowski, M.; Ciapała, B.; Kaźmierczak, B. The impact of long-term changes in air temperature on renewable energy in Poland. Sci. Total Environ. 2020, 729, 138965. [Google Scholar] [CrossRef]
- Martín-Chivelet, N.; Gutiérrez, J.C.; Alonso-Abella, M.; Chenlo, F.; Cuenca, J. Building retrofit with photovoltaics: Construction and performance of a BIPV ventilated façade. Energies 2018, 11, 1719. [Google Scholar] [CrossRef] [Green Version]
Figure 1.
The annual sum of insolation in particular voivodships—data from [58].
Figure 1.
The annual sum of insolation in particular voivodships—data from [58].

Figure 2.
Block diagram of components considered in the calculation of macroeconomic efficiency.

Figure 3.
The minimum and maximum Net Present Value (NPV) value on a micro- and macroeconomic level.
Figure 3.
The minimum and maximum Net Present Value (NPV) value on a micro- and macroeconomic level.

Figure 4.
The mean NPV value on a macroeconomic level in particular voivodships [Euro].

Figure 5.
Statistical NPV values on a macroeconomic level depending on the installation orientation.
Figure 5.
Statistical NPV values on a macroeconomic level depending on the installation orientation.

Figure 6.
Statistical NPV values on a macroeconomic level depending on roof inclination.

Figure 7.
The Discounted Payback Period on a micro- and macroeconomic level for the calculation variant: location—Podkarpackie Voivodship; building orientation–southern; roof inclination angle—30°.
Figure 7.
The Discounted Payback Period on a micro- and macroeconomic level for the calculation variant: location—Podkarpackie Voivodship; building orientation–southern; roof inclination angle—30°.

Figure 8.
The division of Poland into homogeneous regions with regard to the NPV value on a macroeconomic level.
Figure 8.
The division of Poland into homogeneous regions with regard to the NPV value on a macroeconomic level.


Table 1.
A table of fees for electricity.
| Electricity Distributor | Trading Fee | Network Rate | Qualitative Stake | Cogeneration Rate | Subscription | Fixed Rate | Transitional Rate |
|---|---|---|---|---|---|---|---|
| Eurocent/ kWh | Eurocent/ kWh | Eurocent/ kWh | Eurocent/ kWh | Eurocent/ Month | Eurocent/ Month | Eurocent/ Month | |
| Energa | 6.540 | 5.364 | 0.300 | 0.031 | 35.607 | 112.230 | 7.437 |
| Tauron | 5.433 | 3.919 | 0.300 | 0.031 | 51.383 | 78.877 | 7.437 |
| PGE | 6.558 | 4.820 | 0.300 | 0.031 | 50.707 | 70.764 | 7.437 |
| ENEA | 6.490 | 3.818 | 0.300 | 0.031 | 43.270 | 97.131 | 7.437 |
Table 2.
The mean NPV value on a macroeconomic level depending on the region and roof orientation [Euro].
Table 2.
The mean NPV value on a macroeconomic level depending on the region and roof orientation [Euro].
| Voivodship | The Orientation of the Panel Surface Relative to the Geographic Direction | ||||
|---|---|---|---|---|---|
| S | S-E | S-W | E | W | |
| dolnośląskie | 5192 | 5440 | 5247 | 4613 | 4275 |
| kujawsko-pomorskie | 5436 | 5315 | 5231 | 5214 | 5005 |
| lubelskie | 6526 | 6426 | 6076 | 5695 | 5384 |
| lubuskie | 4283 | 4311 | 4470 | 4228 | 4088 |
| łódzkie | 6724 | 6572 | 6307 | 5736 | 5454 |
| małopolskie | 5335 | 5329 | 5286 | 5000 | 4935 |
| mazowieckie | 6572 | 6403 | 6252 | 5581 | 5370 |
| opolski | 5318 | 5586 | 5402 | 4862 | 4543 |
| podkarpackie | 6491 | 6270 | 6388 | 6097 | 5968 |
| podlaskie | 5798 | 5527 | 5269 | 5052 | 5014 |
| pomorskie | 5816 | 5508 | 5447 | 5326 | 5237 |
| śląskie | 5298 | 5573 | 5421 | 4885 | 4616 |
| świętokrzyskie | 6571 | 6442 | 6244 | 5715 | 5373 |
| warmińsko-mazurskie | 6038 | 5695 | 5510 | 5285 | 5329 |
| wielkopolskie | 6045 | 5846 | 5687 | 4944 | 4871 |
| zachodniopomorskie | 4762 | 4538 | 4457 | 4381 | 4392 |
| Poland | 5763 | 5674 | 5543 | 5163 | 4991 |
Table 3.
The mean NPV value on a macroeconomic level, depending on the orientation and inclination of the roof [Euro].
Table 3.
The mean NPV value on a macroeconomic level, depending on the orientation and inclination of the roof [Euro].
| Building Orientation | Roof Slope | |||
|---|---|---|---|---|
| 30 | 45 | 60 | Flat Roof | |
| S | 5769 | 5809 | 5719 | 5754 |
| S-E | 5689 | 5677 | 5575 | 5754 |
| S-W | 5555 | 5483 | 5382 | 5754 |
| E | 5228 | 4979 | 4694 | 5754 |
| W | 4980 | 4690 | 4555 | 5738 |
Table 4.
The mean Discounted Payback Period on a macroeconomic level, depending on the region and roof orientation [years].
Table 4.
The mean Discounted Payback Period on a macroeconomic level, depending on the region and roof orientation [years].
| Voidvoship | Roof Geographic Orientation | Average | ||||
|---|---|---|---|---|---|---|
| S | S-E | E-W | E | W | ||
| dolnośląskie | 6.41 | 6.34 | 6.50 | 7.94 | 8.76 | 7.19 |
| kujawsko-pomorskie | 8.00 | 8.12 | 8.26 | 8.39 | 8.67 | 8.29 |
| lubelskie | 5.67 | 5.73 | 6.36 | 7.06 | 7.80 | 6.52 |
| lubuskie | 9.21 | 9.24 | 9.16 | 9.52 | 9.88 | 9.40 |
| łódzkie | 5.55 | 5.64 | 5.82 | 7.04 | 7.74 | 6.36 |
| małopolskie | 6.21 | 6.29 | 6.32 | 7.15 | 7.21 | 6.64 |
| mazowieckie | 5.64 | 5.75 | 5.85 | 7.54 | 7.76 | 6.51 |
| opolski | 6.30 | 6.22 | 6.37 | 7.27 | 8.04 | 6.84 |
| podkarpackie | 5.43 | 5.57 | 5.56 | 6.28 | 6.39 | 5.85 |
| podlaskie | 6.56 | 7.54 | 7.79 | 8.08 | 8.25 | 7.64 |
| pomorskie | 7.30 | 7.94 | 7.99 | 8.29 | 8.38 | 7.98 |
| śląskie | 6.31 | 6.23 | 6.35 | 7.25 | 7.95 | 6.82 |
| świętokrzyskie | 5.64 | 5.72 | 5.86 | 7.05 | 7.76 | 6.41 |
| warmińsko-mazurskie | 6.38 | 7.41 | 7.58 | 7.93 | 7.99 | 7.46 |
| wielkopolskie | 5.97 | 6.11 | 6.24 | 8.13 | 8.28 | 6.95 |
| zachodniopomorskie | 8.64 | 8.90 | 9.00 | 9.28 | 9.32 | 9.03 |
| Poland | 6.58 | 6.80 | 6.94 | 7.76 | 8.14 | 7.24 |
Table 5.
The mean Discounted Payback Period on a macroeconomic level, depending on the orientation and inclination angle of the roof (years).
Table 5.
The mean Discounted Payback Period on a macroeconomic level, depending on the orientation and inclination angle of the roof (years).
| Building Orientation | Roof Slope | |||
|---|---|---|---|---|
| 30 | 45 | 60 | Flat Roof | |
| S | 6.53 | 6.40 | 6.80 | 6.56 |
| S-E | 6.84 | 6.84 | 6.94 | 6.56 |
| S-W | 6.94 | 7.00 | 7.24 | 6.56 |
| E | 7.50 | 8.13 | 8.85 | 6.56 |
| W | 8.15 | 8.67 | 9.11 | 6.61 |
| Average | 7.19 | 7.41 | 7.79 | 6.57 |
Table 6.
The comparison of Payback Periods.
| Author | Country | Payback Period [years] |
|---|---|---|
| Bernal-Augustin and Dufo-Lopez [32] | Spain | over 25 (without subsidies) 10–9 (with a subsidies 20–40%) |
| Duong et al. [33] | Vietnam | 8–13 (without subsidies) |
| Gulaliyev et al. [6] | Azerbaijan | over 25 (without subsidies) |
| Soliński and Kała [43] | Poland | over 15 (without subsidies) 10–9 (with a subsidies 40%) |
| Bartecka et al. [37] | Poland | 9–19 (without subsidies) |
| Górnowicz and Castro [40] | Poland | 6–11 (without subsidies) |
| Gradziuk and Gradziuk [73] | Poland | 13 (without subsidies) 9 (with a subsidies) |
Publisher’s Note: MDPI stays neutral with regard to jurisdictional claims in published maps and institutional affiliations. |
© 2020 by the authors. Licensee MDPI, Basel, Switzerland. This article is an open access article distributed under the terms and conditions of the Creative Commons Attribution (CC BY) license (http://creativecommons.org/licenses/by/4.0/).
Share and Cite
MDPI and ACS Style
Bukowski, M.; Majewski, J.; Sobolewska, A. Macroeconomic Electric Energy Production Efficiency of Photovoltaic Panels in Single-Family Homes in Poland. Energies 2021, 14, 126. https://0-doi-org.brum.beds.ac.uk/10.3390/en14010126
AMA Style
Bukowski M, Majewski J, Sobolewska A. Macroeconomic Electric Energy Production Efficiency of Photovoltaic Panels in Single-Family Homes in Poland. Energies. 2021; 14(1):126. https://0-doi-org.brum.beds.ac.uk/10.3390/en14010126
Chicago/Turabian StyleBukowski, Marcin, Janusz Majewski, and Agnieszka Sobolewska. 2021. "Macroeconomic Electric Energy Production Efficiency of Photovoltaic Panels in Single-Family Homes in Poland" Energies 14, no. 1: 126. https://0-doi-org.brum.beds.ac.uk/10.3390/en14010126
Note that from the first issue of 2016, this journal uses article numbers instead of page numbers. See further details here.