Article

Unfolding the Success of Positive Human Interventions in Combating Land Degradation

1
State Key Laboratory of Remote Sensing Science, Aerospace Information Research Institute, Chinese Academy of Sciences, Beijing 100101, China
2
University of Chinese Academy of Sciences, Beijing 100094, China
3
Ministry of Education Key Laboratory for Earth System Modeling, Department of Earth System Science, Institute for Global Change Studies, Tsinghua University, Beijing 100084, China
4
School of Geographic Science, East China Normal University, Shanghai 200241, China
*
Author to whom correspondence should be addressed.
Submission received: 12 April 2022 / Revised: 14 May 2022 / Accepted: 18 May 2022 / Published: 24 May 2022
(This article belongs to the Section Forest Inventory, Modeling and Remote Sensing)

Abstract

:
A global challenge to sustainable development is land degradation, and to achieve land degradation neutrality, monitoring, mapping, and impact assessment of ongoing ecological restoration efforts is necessary. Here, we analyze the desertification process and role of restoration projects at a spatial and temporal scale in Mu Us Desert from 2001 to 2018. We used 17 years of data to (1) assess the vegetation trend including its significance and map land degradation based on Sustainable Development Goal Indicator 15.3.1 (2) address how vegetation activity has changed under the influence of restoration programs and climate change (3) estimate how successful are the positive human interventions to achieve Land degradation neutrality. Results showed an overall increasing vegetation trend (85.69% significant increasing) and a partial decreasing vegetation trend (1.33% significant decreasing) in Mu Us desert. Ecological restoration activities are found to be one of the key driving forces of vegetation restoration in the desert, however, limited impact of climatic factors on vegetation cover change was observed. Results revealed that 41.42% of total significant restoration is attributed to ecological restoration programs out of which 40.42% area has shown improvement in all three sub-indicators of land degradation.

Graphical Abstract

1. Introduction

Loss of productive capacity of land or land degradation is a global challenge for the present and future that affects people and the ecosystem throughout the planet. Land degradation adversely affects people’s livelihood [1] through climate change, food insecurity, environmental hazards, and the loss of biological productivity and ecosystem services [2]. In some regions, land productivity has decreased by 50% due to desertification and soil erosion [3]. Land degradation contributes to climate change and at the same time affected by it [4]. Climate change introduces new patterns of degradation by exacerbating the rate and magnitude of several ongoing land deterioration processes whereas, through the emission of greenhouse gases and reduction in carbon uptake, land degradation contributes to climate change [5]. By 2050, the world’s population is projected to number between 9.4 and 10.1 billion [6], boosting demands for agricultural products such as food, feed, fiber, and fuel. Land degradation is projected to cause a change in productivity and harms ecosystem services [7]. In the driest parts of the planet, the situation is particularly severe. Dryland landscapes support 2 billion people and more than 40% of the world’s population receives food from them [8]. To restore degraded land and halt land degradation there have been a lot of targets and initiatives on a regional and global scale since 2010. These include the 2030 agenda for sustainable development, which was adopted by 193 countries including China at United Nations General Assembly in New York and includes 17 sustainable development goals (SDG) [9].
Monitoring and mapping land degradation is a key aspect of land degradation neutrality and governance. In early desertification, monitoring statistical methods and model simulations were widely used [10]. Since the 1970s, international research on monitoring desertification via satellite-based remote sensing has begun [11]. Initially, Normalized Difference Vegetation Index (NDVI) was used by researchers to monitor land degradation [12,13]. To identify the vegetation condition and to determine desertification dynamics, NDVI has been considered a key biophysical parameter [14]. However, some researchers found that to measure desertification, monitoring vegetation dynamics and land use is not the only way [15] and developed indicators based on non-vegetation characteristics and integration of vegetation [16]. They found that multi-dimensional remote sensing indicators have clear biophysical importance and have the capacity to reflect the changes in land desertification thus, these indicators have widely been used [15].
United Nations statistical commission adopted the official indicator to “combat desertification, restore degraded land and soil, including land affected by desertification, drought, and floods, and strive to achieve a land degradation-neutral world” [9]. The official Indicator sustainable development Goal (SDG) 15.3.1 was approved by the General assembly in 2017 [9]. In this study, we used trends.earth platform to monitor land degradation. It is a desktop and cloud-based system developed by conservation international (http://trends.earth/docs/en/ (accessed on 20 June 2020)) which enables the calculation of SDG indicator 15.3.1 including its sub-indicators (land productivity, land cover change, and soil organic carbon (SOC)). Trends.earth spatially combines the three sub-indicators to calculate the degraded land over the total area (SDG 15.3.1). In addition, ecological restoration projects aim to increase vegetation activity in an area [17] therefore, the success or failure of restoration programs can be assessed by the increase or decrease in vegetation activity (such as vegetation coverage and leaf area index) [18]. Several researchers have used NDVI as a proxy of vegetation activity due to its robust relationship with vegetation production [18,19,20].
The key arid and semi-arid regions of the country are situated on the north-western side of China, including Inner Mongolia [21]: at the end of 2009, approximately 27.3% of the country’s total land area have been affected by desertification [22]. The forestry policy in China has been rapidly and extensively changing since 2000 [18] and the investments in forest division have surpassed the total investments during 1949–1999 [23]. All over the world, afforestation projects in the country are the largest in their scale, the magnitude of investment, and the number of participants [21,24,25]. The most pronounced ecological restoration programs include the Three-North Shelterbelt Forest conservation project [26], the Sand Control Programs for areas near Beijing and Tianjin [27], the Grain for Green Program [28], Fast-Growing and High-Yielding Timber Base Construction Program [29], the Natural Forest Conservation Program [30], and the Wildlife Protection and Nature Reserve Development Program [31]. In China from Ordos Plateau to Loess Plateau, Mu Us desert’s ecological transition zone is considered an ecologically fragile zone and is characterized as an ecotone of forest, agriculture, and pasture [32]. Most of the land in this area has been threatened by desertification for many years and exhibits different degrees of desertification, hence this region has been a focus of national policy [33].
The ecological restoration projects of China are controversial to a certain extent and there is an ongoing debate on their effectiveness [18,34]. Many social scientists and researchers believe that the outcomes of restoration projects in arid and semi-arid regions may be exaggerated [34], and the large-scale afforestation efforts produced largely unfavorable results in Three Norths [35]. Ref. [36] believe that these afforestation efforts could lead to increased deterioration of the ecosystem as they are not been tailored to local environmental conditions. Ref. [37] further asserted that there is little evidence to support the huge investments and benefits of the Three-North Shelterbelt Forest Construction Project in combating desertification and its importance seems to have been overstated. Monitoring and mapping the effectiveness of ecological restoration projects addresses the question of how successful the positive human interventions are at restoring the ecosystem and how effective these projects are to achieve Land degradation neutrality. Moreover, it is necessary to address a key question that how vegetation has changed under the influence of restoration programs and ongoing changes in climate [18]. Therefore, it is essential to monitor and map vegetation dynamics in Mu Us desert as it has been a focus of national policy. This study aims to (1) assess the vegetation trend including its significance and map land degradation based on SDG indicator 15.3.1 (2) address how vegetation activity has changed under the influence of restoration programs and climate change (3) estimate how successful are the positive human interventions to achieve Land degradation neutrality.

2. Materials and Methods
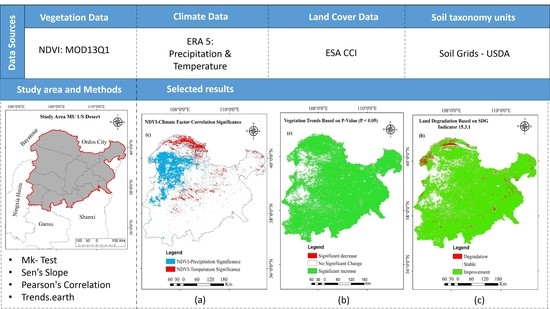
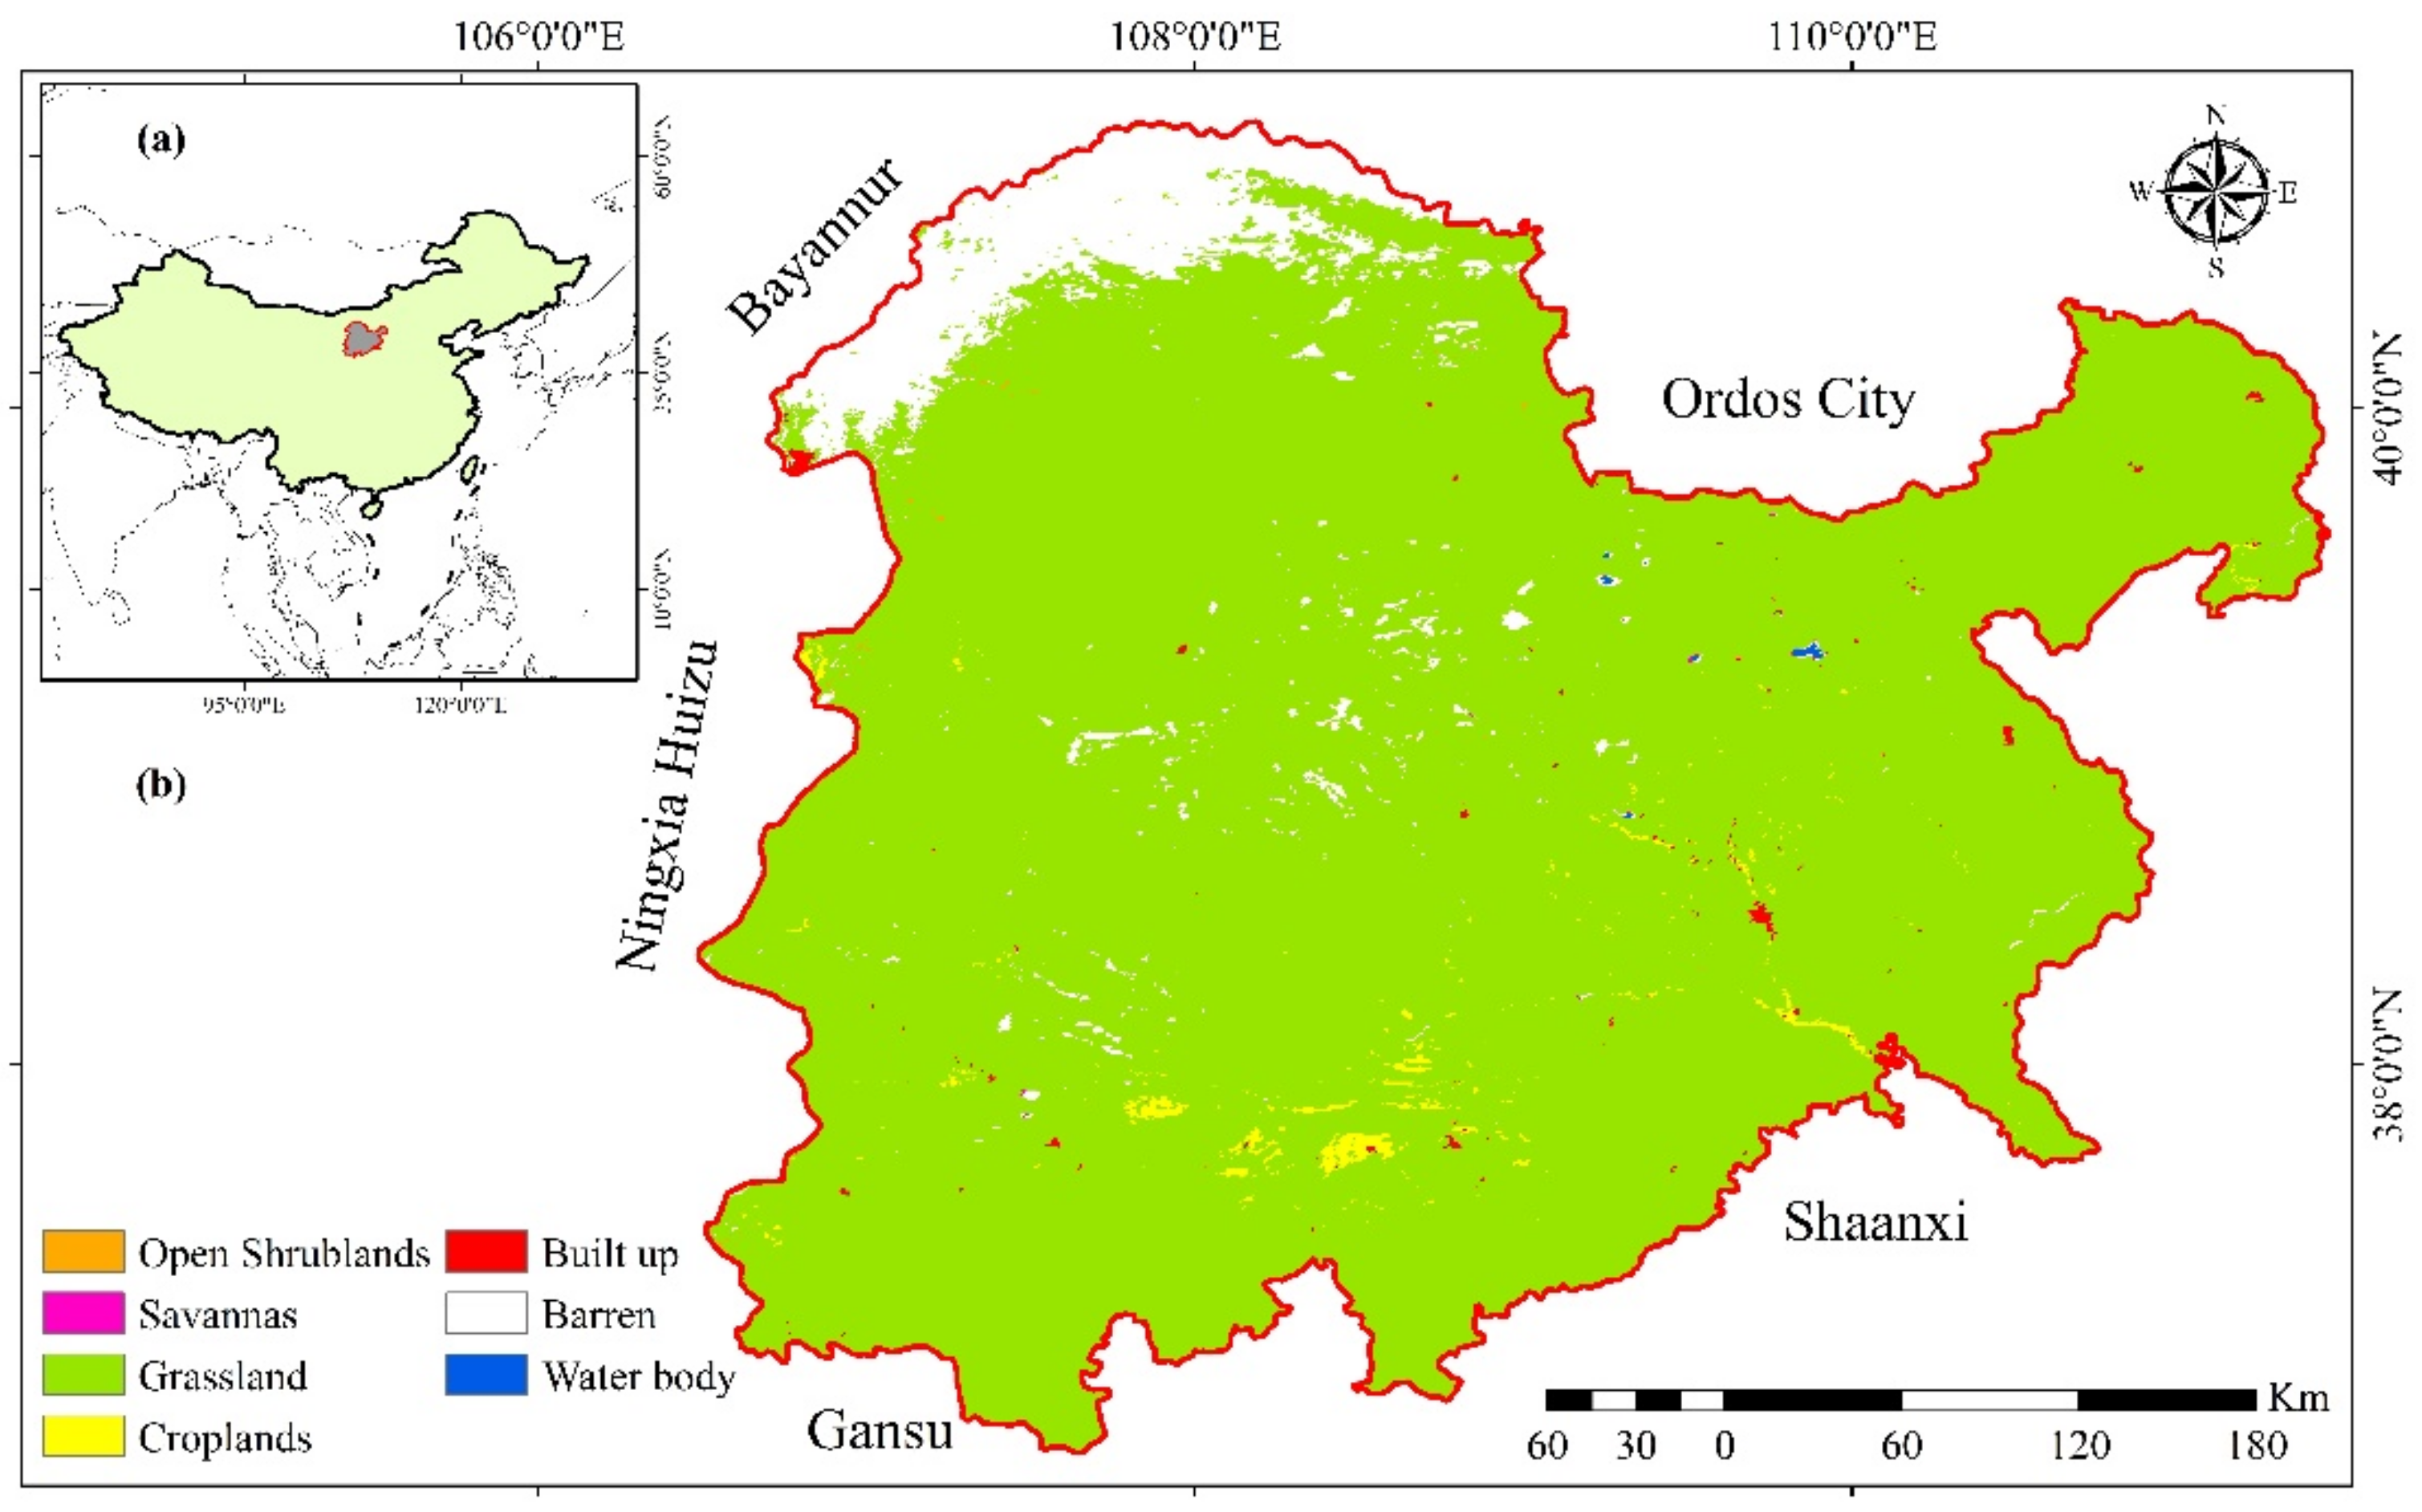
2.1. Study Area

The Mu Us (Figure 1) or Maowusu Desert is situated in the transitional zone between animal grazing and agricultural farming in Northern China and is surrounded by the Yellow River in the east and west and the Kubuqi desert in the north [38]. The southern boundary of the Mu Us desert is crossed by the Great Wall of China which marks the boundary between the Loess Plateau and the desert. From southwest to northeast, the study area’s topography is undulating to some extent, and the elevation changes from 1000 m in the southeast to 1600 m in the northwest. The average annual precipitation in Mu Us desert varies from 250 mm to 400 mm following a northwest-southeast trend. The total precipitation and mean annual temperature trends are given in Figure 2. In this region different ecological restoration programs including the Three Norths Shelter Forest Program in 1978, Combating of Desertification Program in 1995, Natural Forest Protection Project in 1999, and Grain for Green Project in 1999 have been implemented [32]. The total area of Mu Us Desert in China that is under consideration in this study is an area of 115,381.5 km2.

2.2. Data Sources

MODIS NDVI data “MOD13Q1” [39] with 16-day temporal and 250 m spatial resolution that was calculated from atmospherically corrected, surface reflectance was used in this research. For each 16-day composite, maximum quality pixels were selected and these images have been masked out by heavy aerosols, water, cloud, and cloud shadows [40]. Eighteen years of data from 2001 to 2018 is used to conduct this study. To obtain annual NDVI data for each year (2001 to 2018), the NDVI values were averaged. Trends.earth [41] uses 300 m spatial resolution land cover maps of the European space agency climate change initiative (ESA CCI) [42] from 2001 to 2018 as the default dataset. Soil taxonomy units using the United States Department of Agriculture (USDA) system [43] and carbon stocks [43] for the first 30 cm of the soil profile provided by Soil Grids at 250 m resolution were also used in this study. Soil Grids uses information from a variety of data sources ranging from many years to produce carbon stocks dataset, therefore assigning a date for calculations purposes could cause inaccuracies in the stock change calculations to see [44] for justification. For climatic and weather research, European Centre for Medium-Range Weather Forecasts (ECMWF) reanalysis is valuable atmospheric data [45]. The monthly gridded time-series data ERA5 [46], reanalysis precipitation, and air temperature (2 m aboveground) with a spatial resolution of 0.25° were downloaded from Google Earth Engine and used to analyze their relationship with NDVI variation from 2001 to 2018. For each year, average temperature, and total precipitation were calculated to analyze their correlation with annual NDVI. Using the bilinear resampling technique [47], average annual temperature and precipitation data were resampled to 250 m for data harmonization [48,49]. The details are given in Table 1.

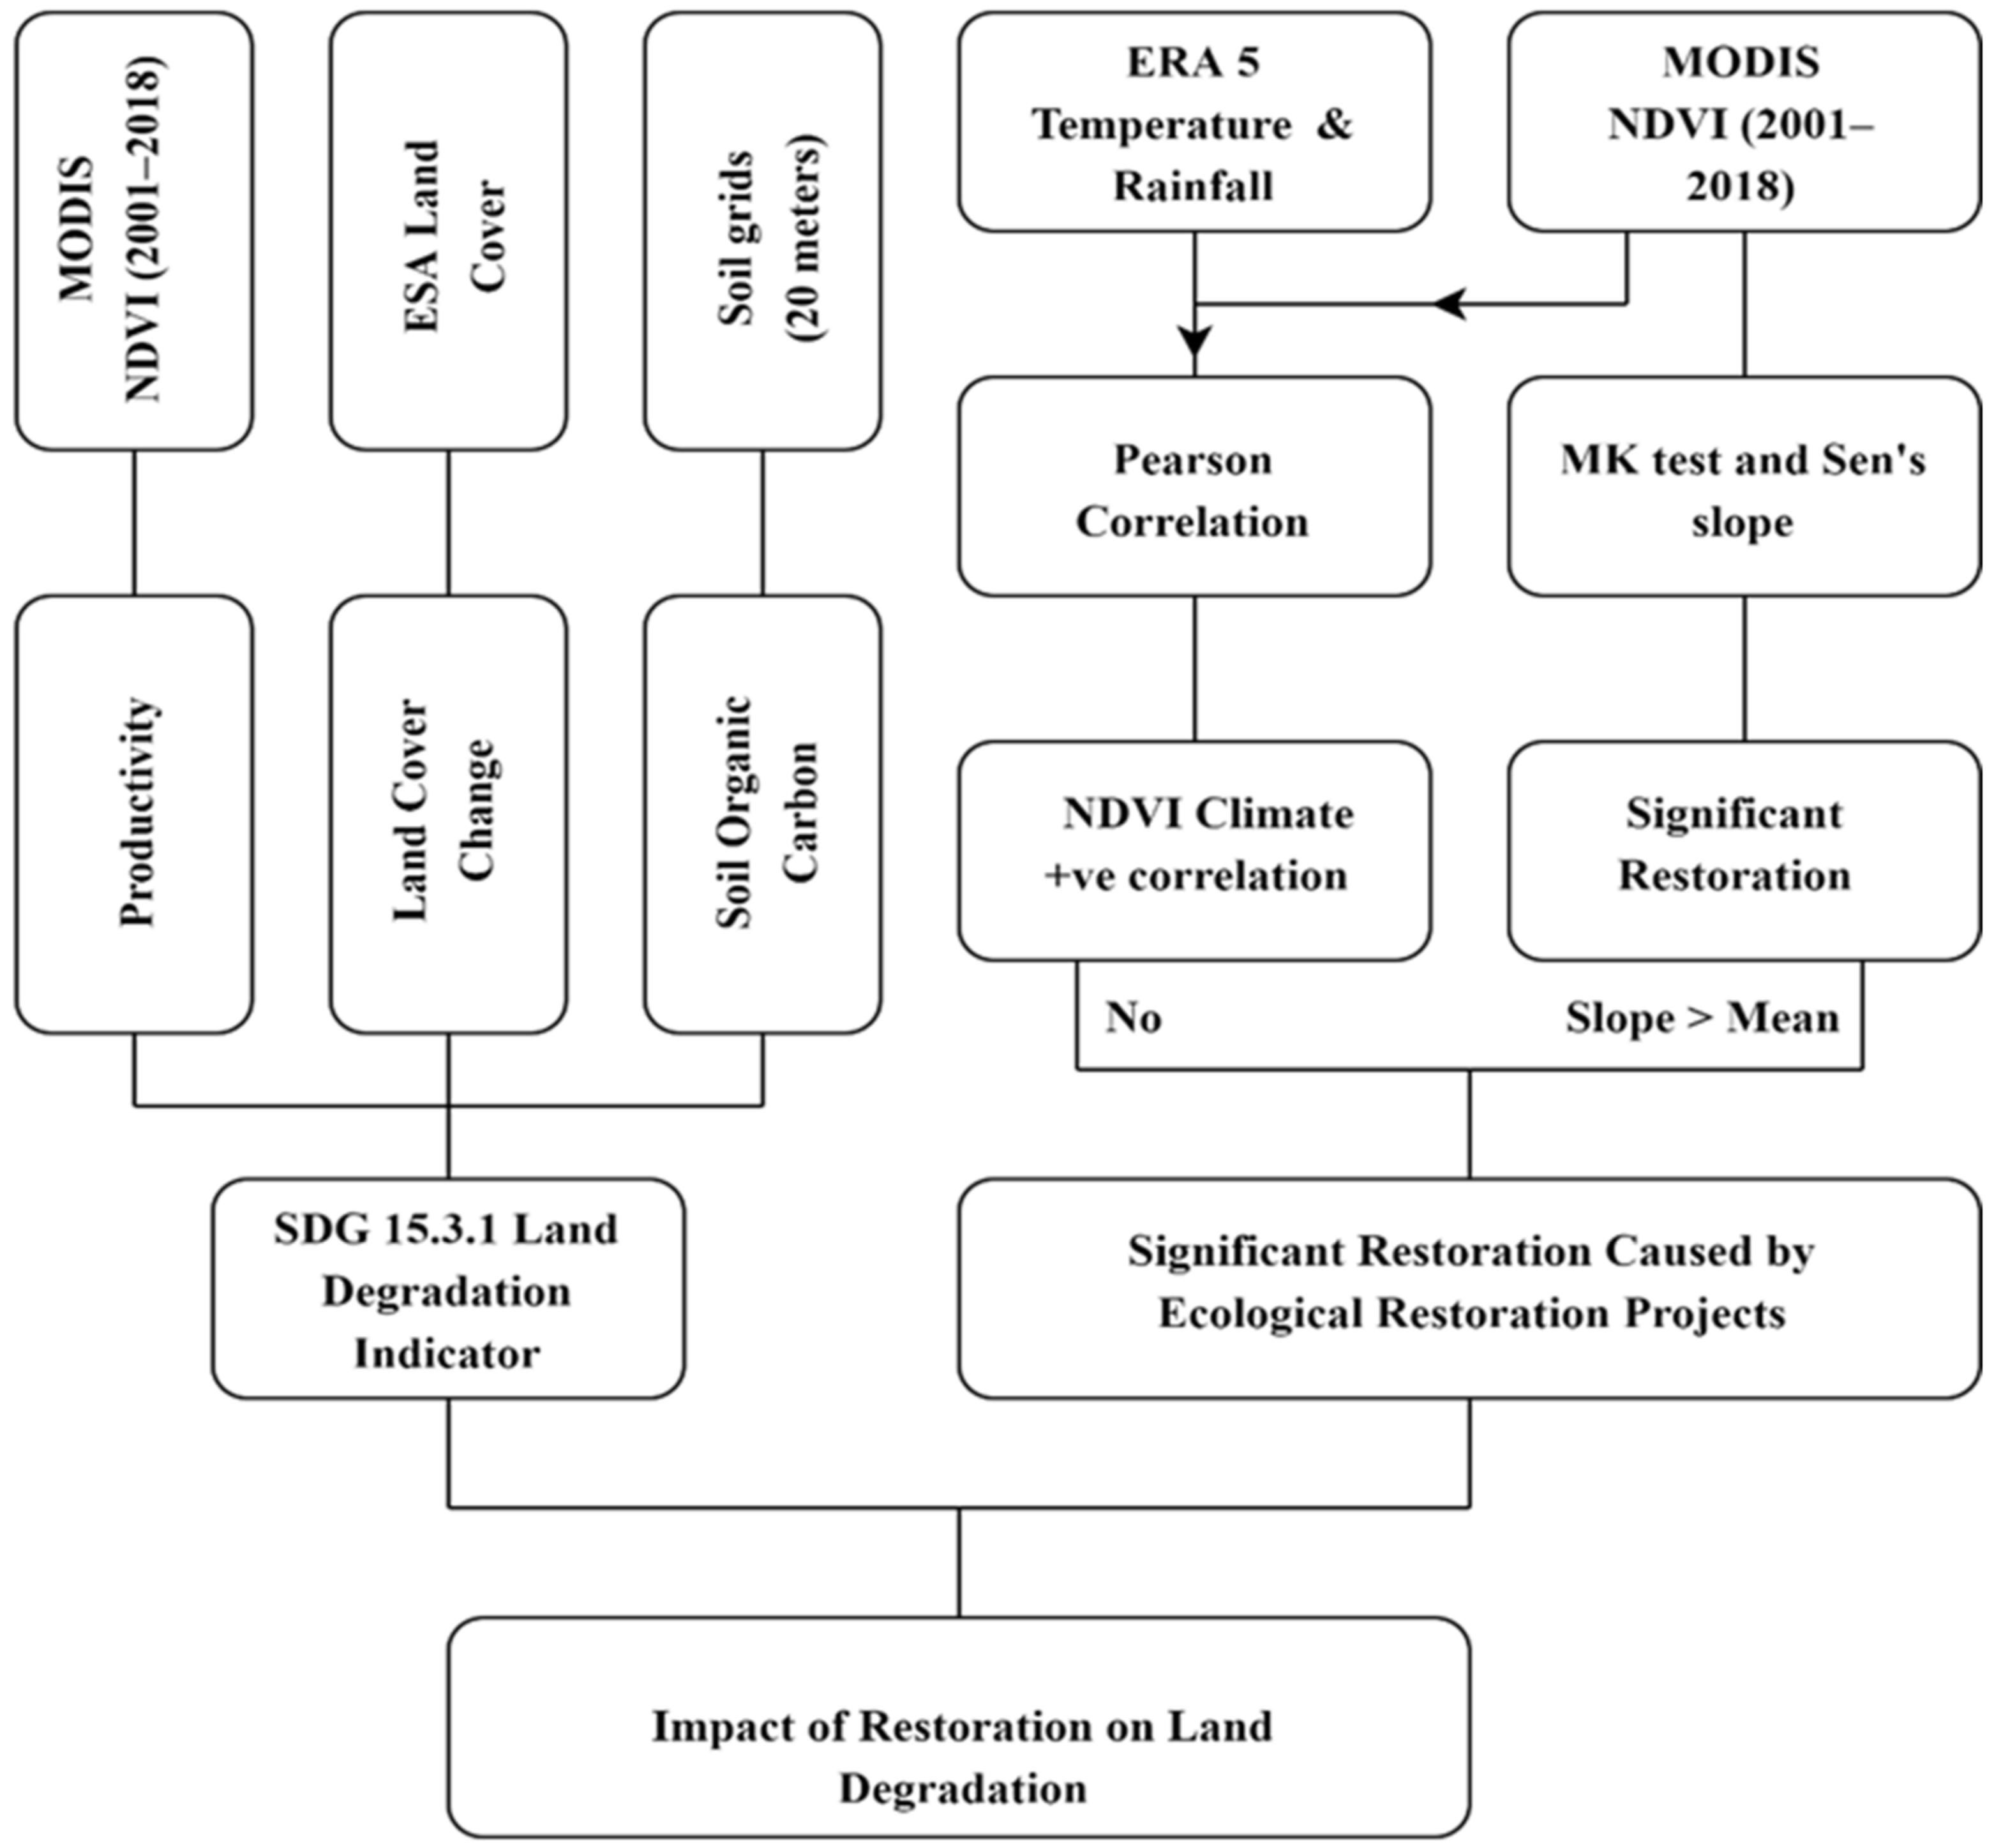
2.3. Sustainable Development Goal 15.3.1: Land Degradation

SDG Indicator 15.3.1 uses information from three sub-indicators (vegetation productivity, land cover, and soil organic carbon) to access the progress towards a land degradation neutral world. These 3 sub-indicators can be calculated and then integrated into Land degradation Indicator using Trends.earth (a plugin for the QGIS desktop application). The methodological flow chart is shown in Figure 3.

2.3.1. Productivity

Land productivity is the land’s biocapacity to support and sustain life [50]. Land productivity can be estimated from net primary productivity (NPP), but site measurements of NPP are time-consuming and expansive which leads to the development of indicators using remotely sensed information [51]. Usually remotely sensed normalized difference vegetation index (NDVI) is used as surrogates of NPP [52]. Trends.earth plugin was used to estimate land productivity using three measures of change (trajectory, state, and performance) driven from time-series data of NDVI.
(a)
Productivity Trajectory
The trajectory is the rate at which primary productivity changes with time. Linear regression was applied to the annual mean NDVI time series (2001–2018) to identify the spatiotemporal fluctuations in primary productivity. To determine the significance of the change, Mann-Kendall nonparametric test was applied. p-value ≤ 0.05 that the existing change is significant. Significant positive trends indicate improvement while a significant negative trend means potential degradation in vegetation coverage [53].
(b)
Productivity State
The productivity state detects the change in recent primary productivity as compared to a predefined base period [41]. These recent changes are usually undetected by trajectory indicators. To compute the productivity state, NDVI time-series data was divided into two periods, a base period (2001 to 2015) and a comparison period (2016 to 2018). A frequency distribution was computed by using annual NDVI integrals for each unit. The mean NDVI value of each unit for the base and comparison period was compared to the frequency distribution base period in that pixel. Depending on the difference between base and comparison pixels state was classified as improvement (difference ≥ +2), no change (−1 to 1), and potential degradation (≤−2).
(c)
Productivity performance
Productivity performance indicates local productivity comparative to similar bioclimatic regions within the study area [41]. Trends.earth calculates the mean NDVI of each pixel in the time series for a defined analysis period. Ecologically similar units were defined as the unique combination of soil units and land cover. A frequency distribution was created using mean NDVI values of each pixel and the 90th percentile (considered as maximum productivity) value was determined. The ratio between the mean observed value and maximum productivity was computed to estimate the performance indicator. A pixel is considered potentially degraded if performance is less than 0.5.
To generate the final productivity dynamic indicator trajectory, state and performance were combined and classified into 3 classes (Improvement, Degradation, and Stable). The classification scheme is given in Table A1 of Appendix A.

2.3.2. Land Cover

Land cover maps of the study area were divided into baseline and target. Land cover maps were reclassified into 7 classes (forest, cropland, bare land, water, wetland, grassland, and artificial area) and land cover transition analysis was applied in order to assess land cover dynamics at a pixel scale. Keeping the default settings of trends.earth, the land cover transition was classified as degradation, improvement, and no change.

2.3.3. Soil Organic Carbon

Soil organic carbon can be used as a proxy to estimate land degradation as the soils hold the largest carbon amounts [54,55]. To compute the indicator SOC reference values were determined and the land cover maps were reclassified into 7 classes. To identify degraded areas, trends.earth uses a combined land cover and soil organic method. The combined method is used to address some limitations like high spatial variability of soil properties. United Nations to combat desertification (UNCCD) and Intergovernmental Panel on Climate Change (IPCC) recommend carbon conversion coefficients to estimate carbon stocks in the absence of national SOC data (see [56] for justification). The coefficients used by trends.earth are a result of UNCCD’s extensive literature review [44] (Table A2 Appendix A). The plugin calculates a relative difference between baseline SOC and the target period. An area is considered degraded if SOC loss is >10% and an area that gains >10% SOC is considered improved.
The one-out-all-out rule was applied to calculate the final SDG Indicator 15.3.1. An area is considered degraded if that area was recognized as degraded by any of the sub-indicator.

2.3.4. Drivers of Ecological Restoration

The vegetation trends in the study area were evaluated by using annual mean NDVI time-series data at both temporal and spatial levels. Theil-Sen (Sen) slope [57] was used to analyze NDVI trends as it is a robust nonparametric method that is resistant to outliers [58]. The formula to calculate Sen’s equation is as follows:
β = Median   N D V I j N D V I i j i
Mann–Kendall (MK) significance test was used to test the statistical significance of Sen’s slope. MK test is also resistant to outliers [59] and is less sensitive to missing values in the data. The formulas to estimate the MK test are as follows:
Z = S 1 s S                   S > 0                   0                     S = 0 S + 1 s S                   S < 0 S = j = 1 n 1 i = j = 1 n s n g N D V I j N D V I i s n g N D V I j N D V I i =           1             N D V I j N D V I i > 0           0               N D V I j N D V I i = 0 1             N D V I j N D V I i < 0
where in the above equations, NDVI pixel values of ith and jth years are represented by NDVIi and NDVIj, sng is the sign function and the length of time series is represented by n. The trend’s slope is represented by β and the Median represents the median of the sequence. Positive and negative slope values indicate an increase or decrease in vegetation and the magnitude of the change in vegetation was assessed at a 95% confidence level. Based on slope and p-value NDVI trends are categorized into three classes [60]: significant Increase (slope > 0 and p < 0.05), no significant change (p ≥ 0.05), and significant decrease (slope < 0 and for trend significance p < 0.05). The data used was normally distributed and have continuous intervals, therefore person’s correlation was applied on a pixel basis to compute the correlations between NDVI and each climatic factor (temperature and precipitation) for the period of 2001 to 2018. The statistical significance was tested at a 95% confidence level. Pixels are considered as significantly positively correlated if the Pearson correlation coefficient (R) is positive and the level of significance (p-value) is less than 0.05.
The impact of climatic factors and restoration projects on vegetation dynamic activity was separated from each other by threshold segmentation [18]. It is considered that if ecological restoration projects drive vegetation restoration, then the area with no vegetation should have changed to a vegetation cover area or the area should have changed from low vegetation cover to high vegetation cover. Ecological restoration projects are considered a key force to drive vegetation restoration if NDVI increased significantly, though NDVI is not significantly positively correlated with climatic factors in the region and the annual slope of NDVI is greater than the mean value of the area under consideration.

3. Results

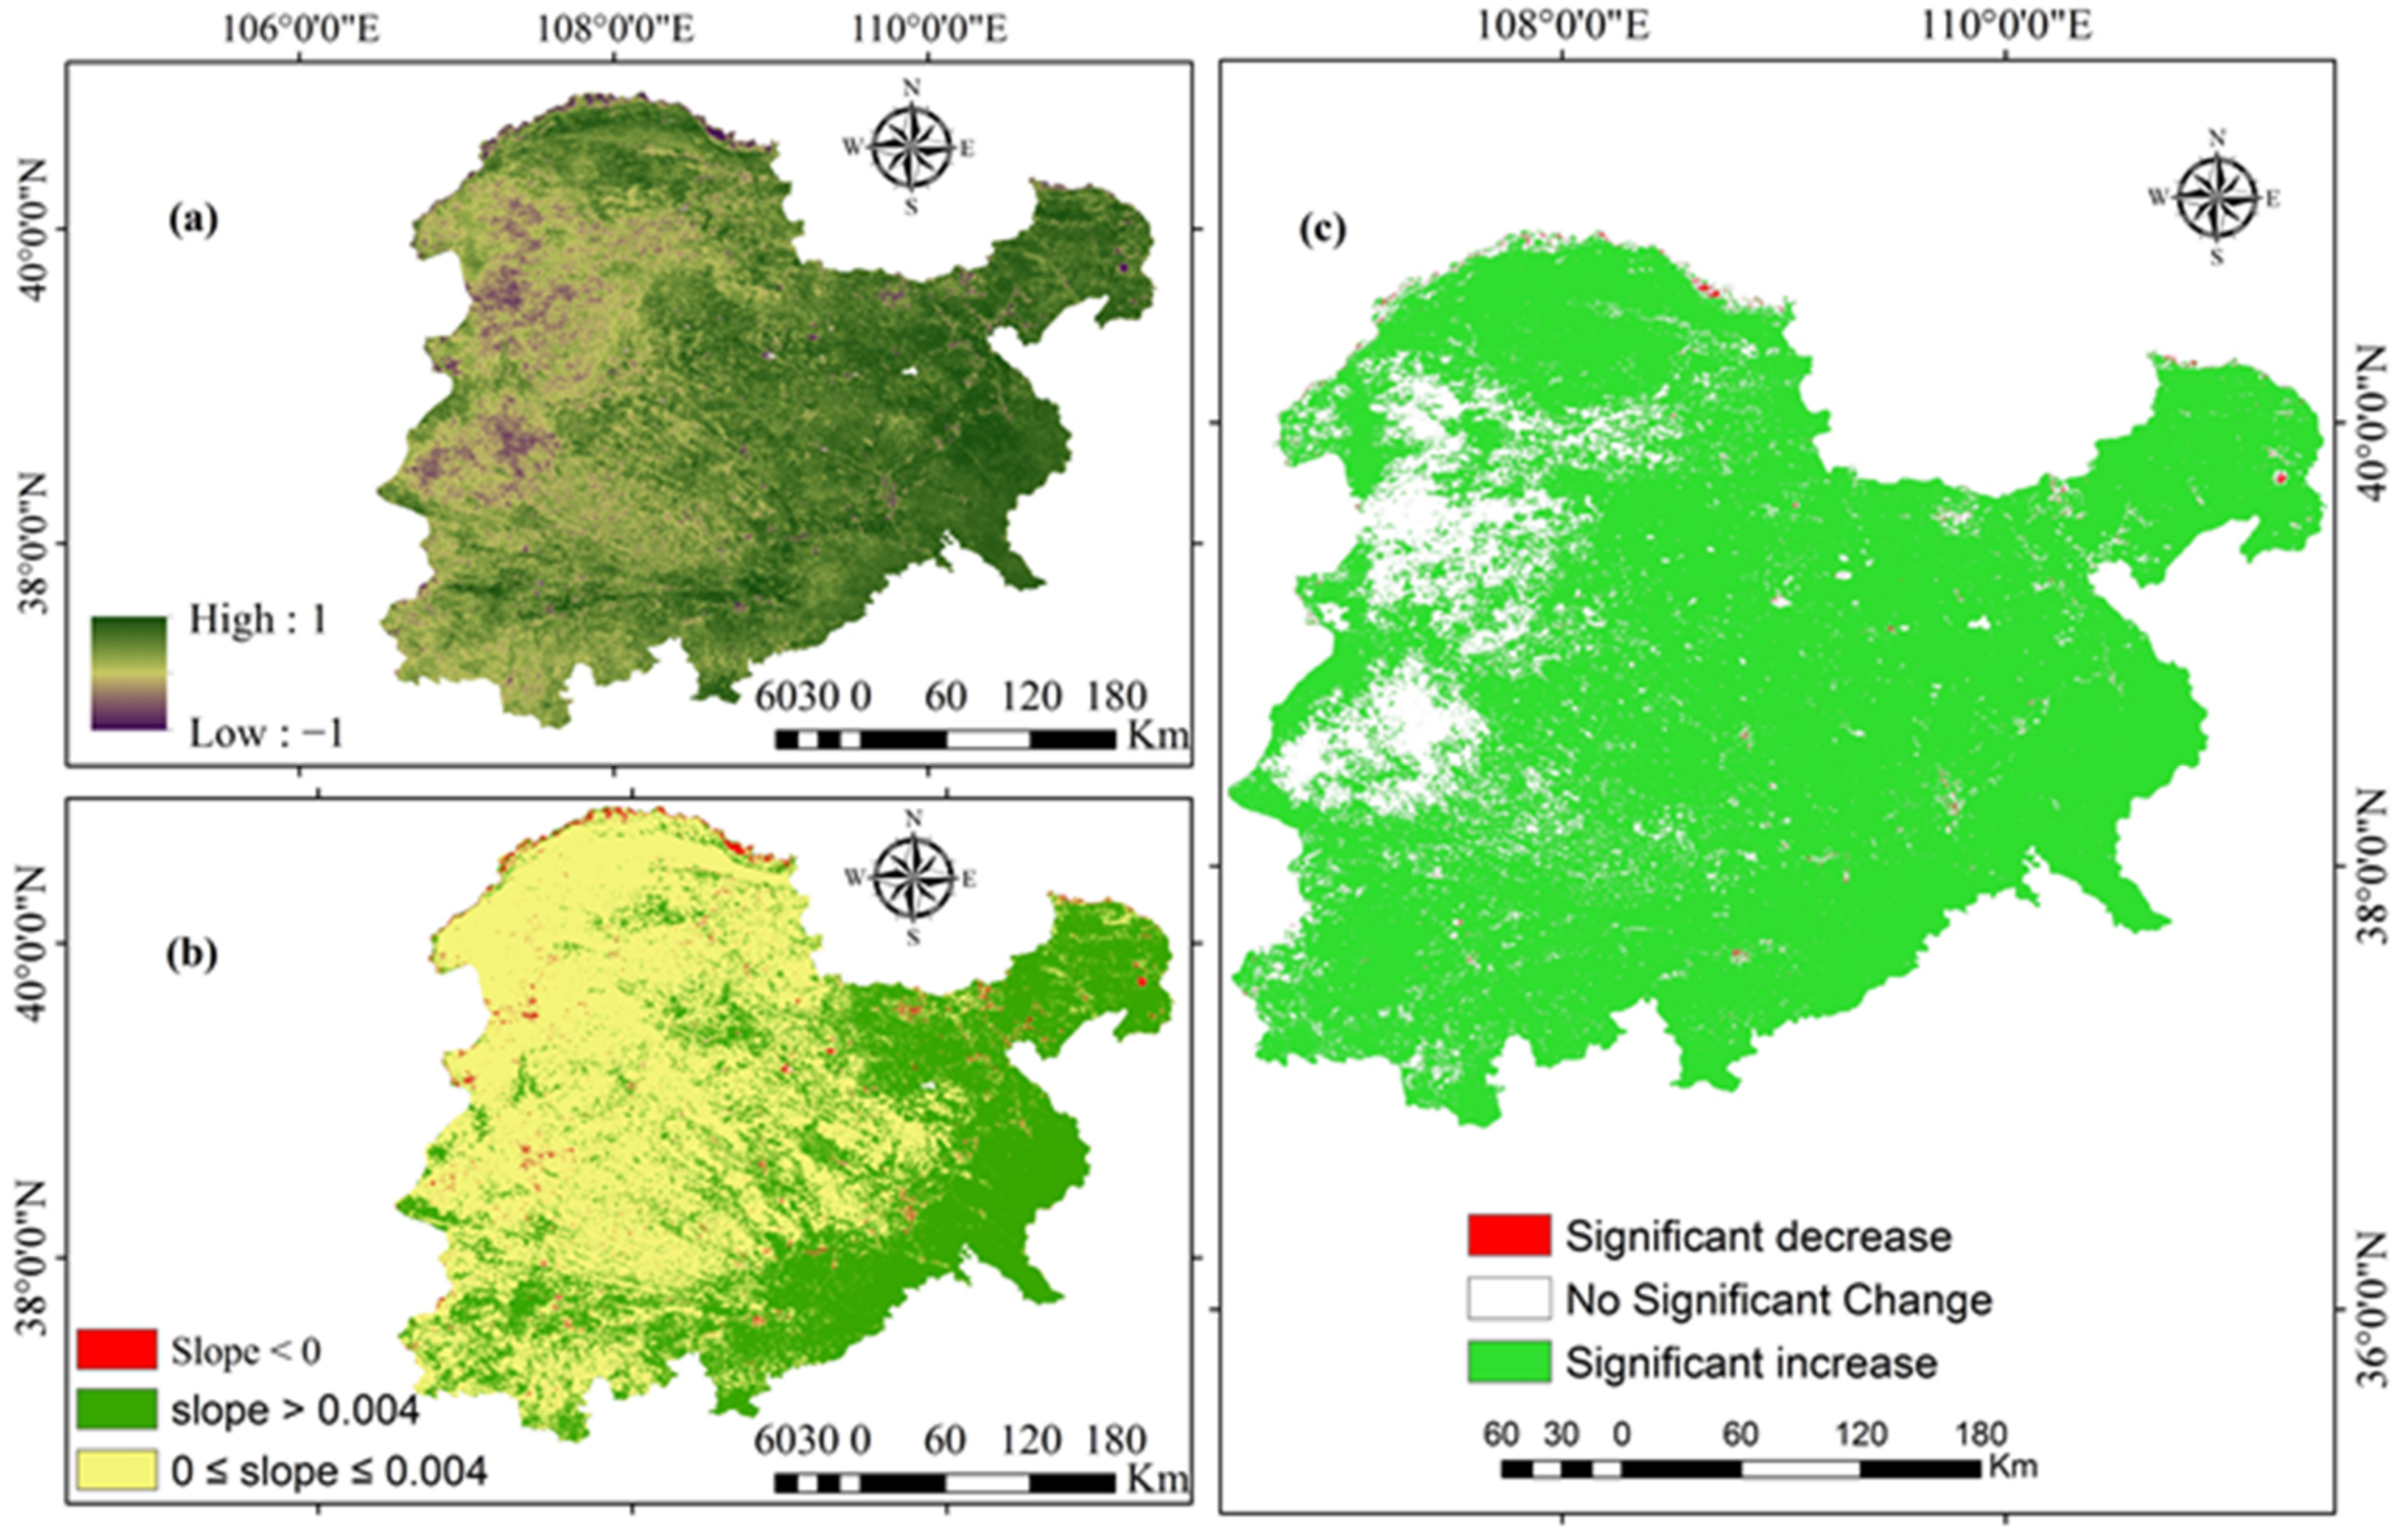
3.1. Vegetation Dynamic Trend and Driving Forces Analysis

The average annual NDVI was 0.18 for Mu Us from 2001 to 2018, varying between land cover classes. The slope was estimated for each pixel in the time series. The overall Theil–Sen’s slope of annual NDVI for Mu Us was 0.004. Positive trends can be observed in the region under consideration, which indicates a major increase in vegetation with time. Results revealed (Figure 4) that in 18 years (2001–2018) 98.66% of the total area of Mu Us showed an upward trend out of which 85.69% is significant whereas only 1.33% of the area showed a downward trend out of which 0.2% is significant. 14.11% of the total area of Mu Us showed no significant trend from 2001–2018.

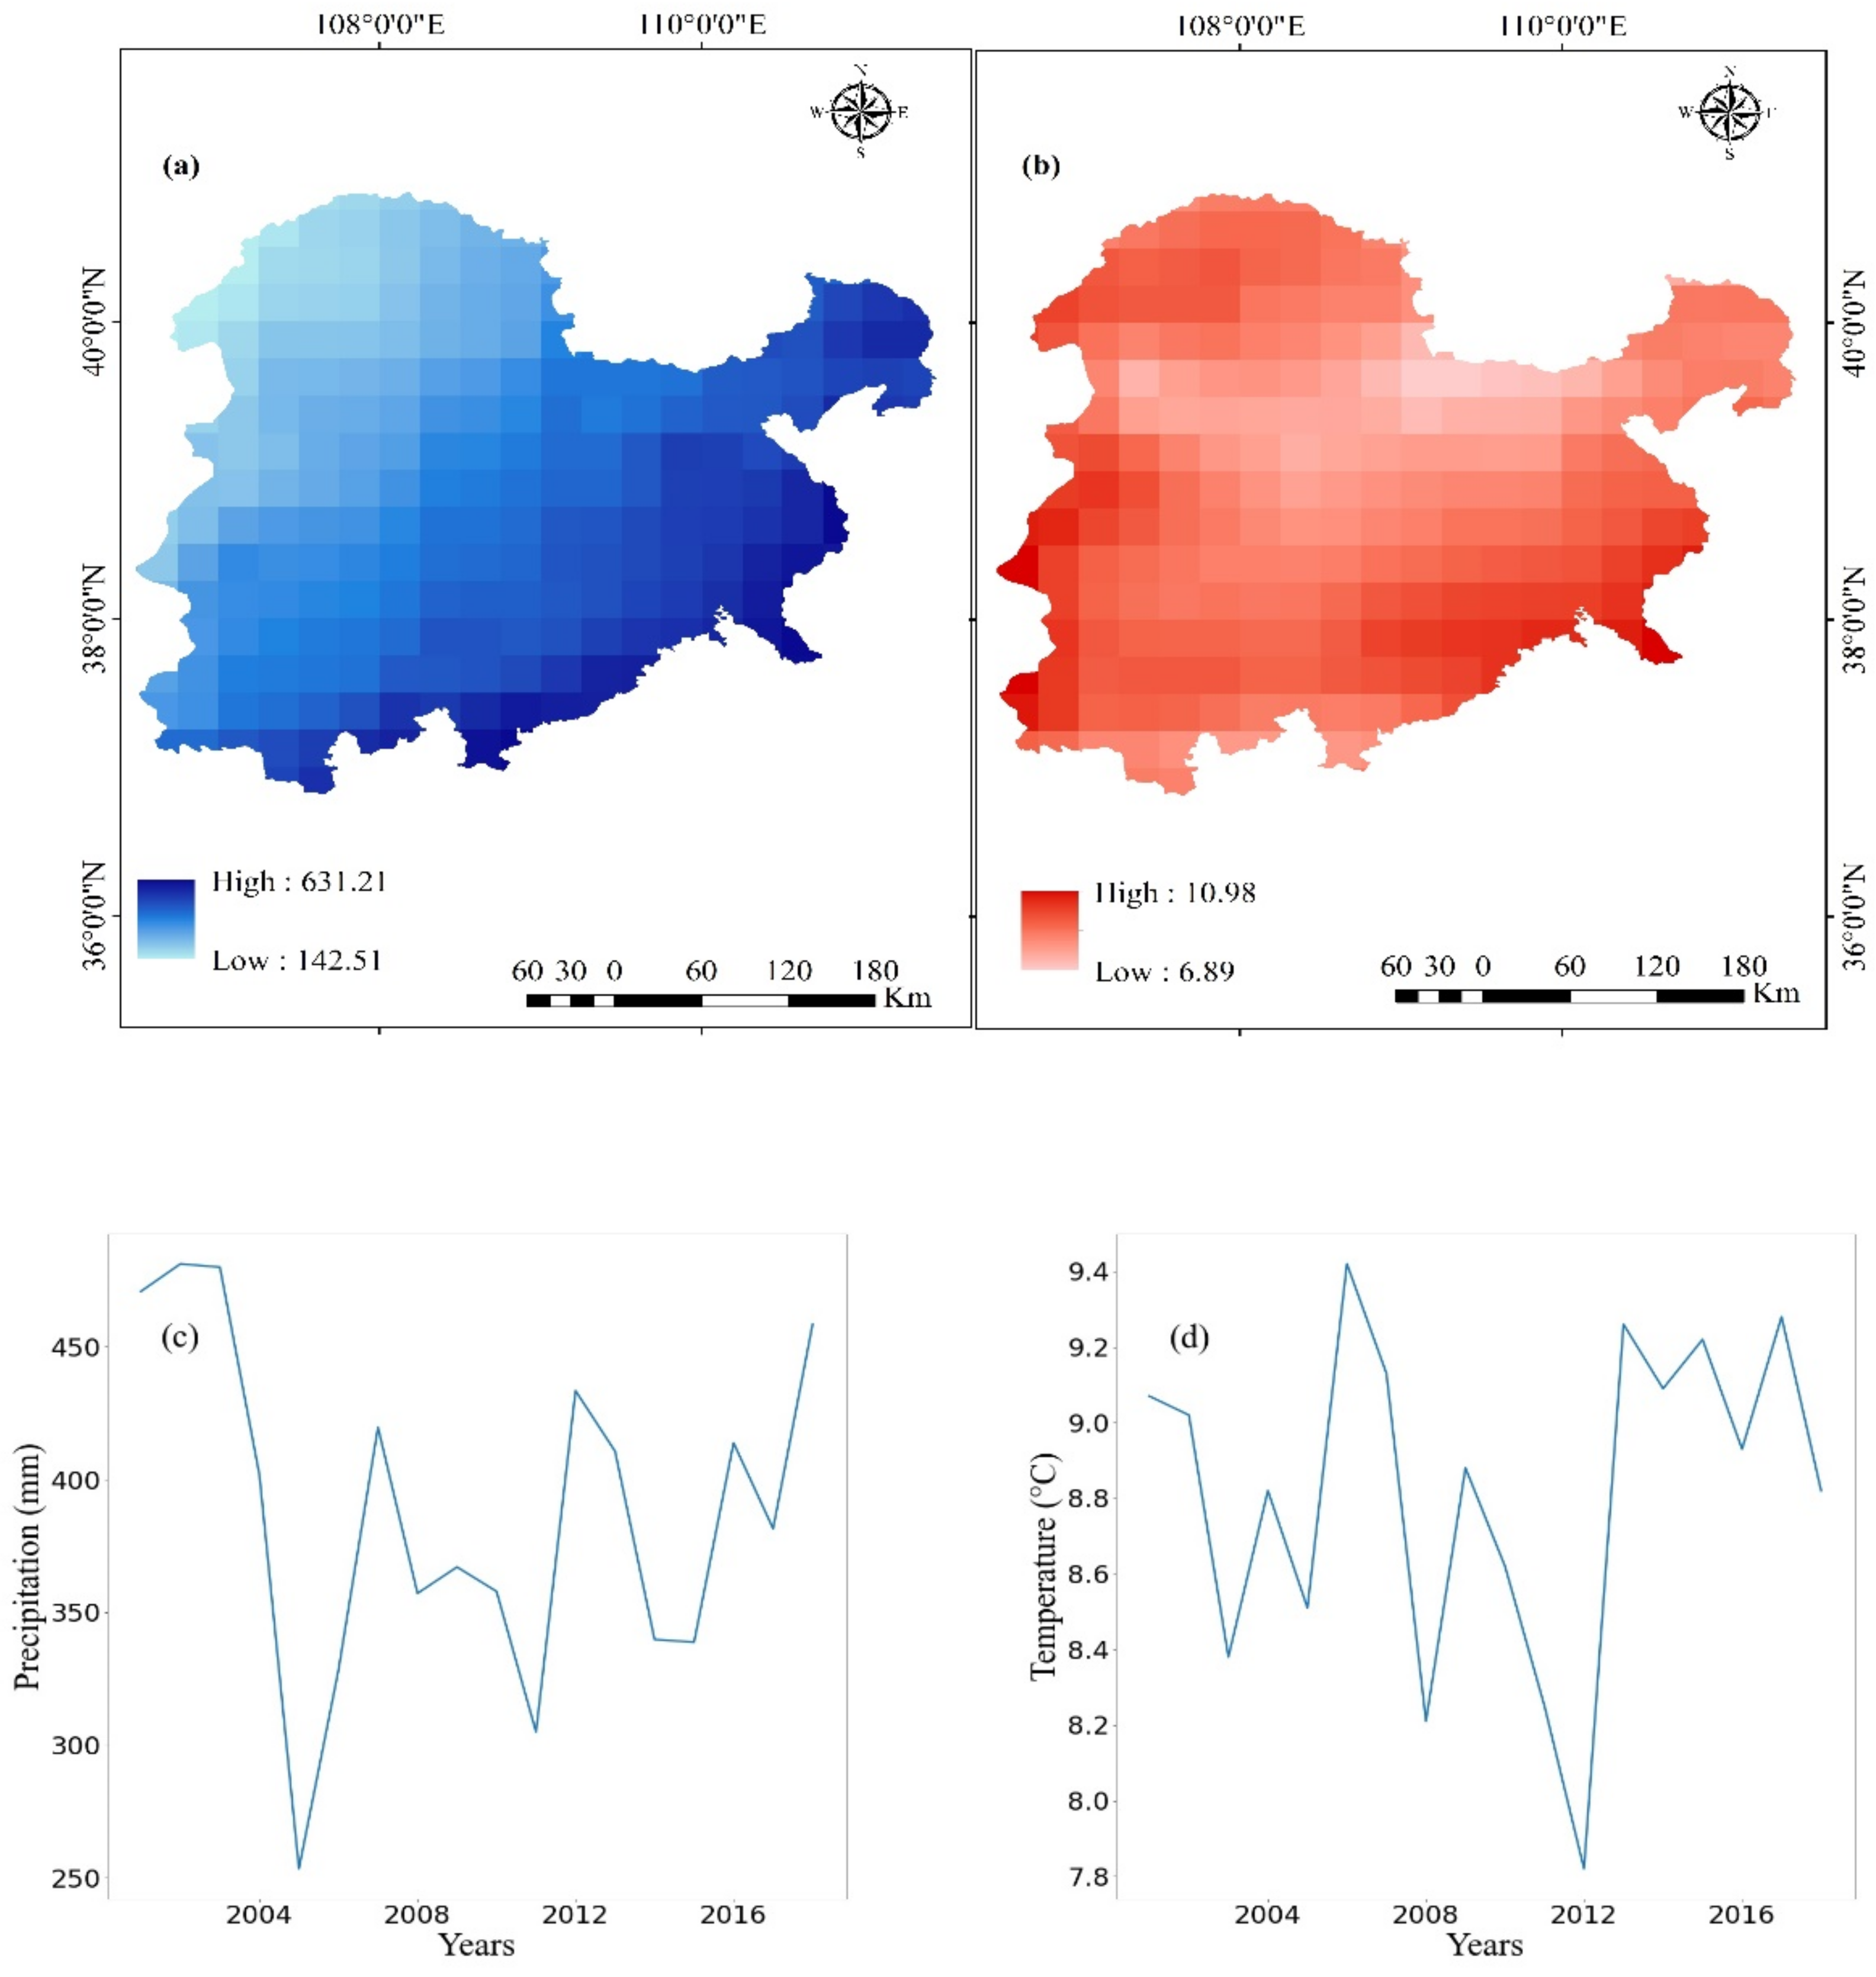
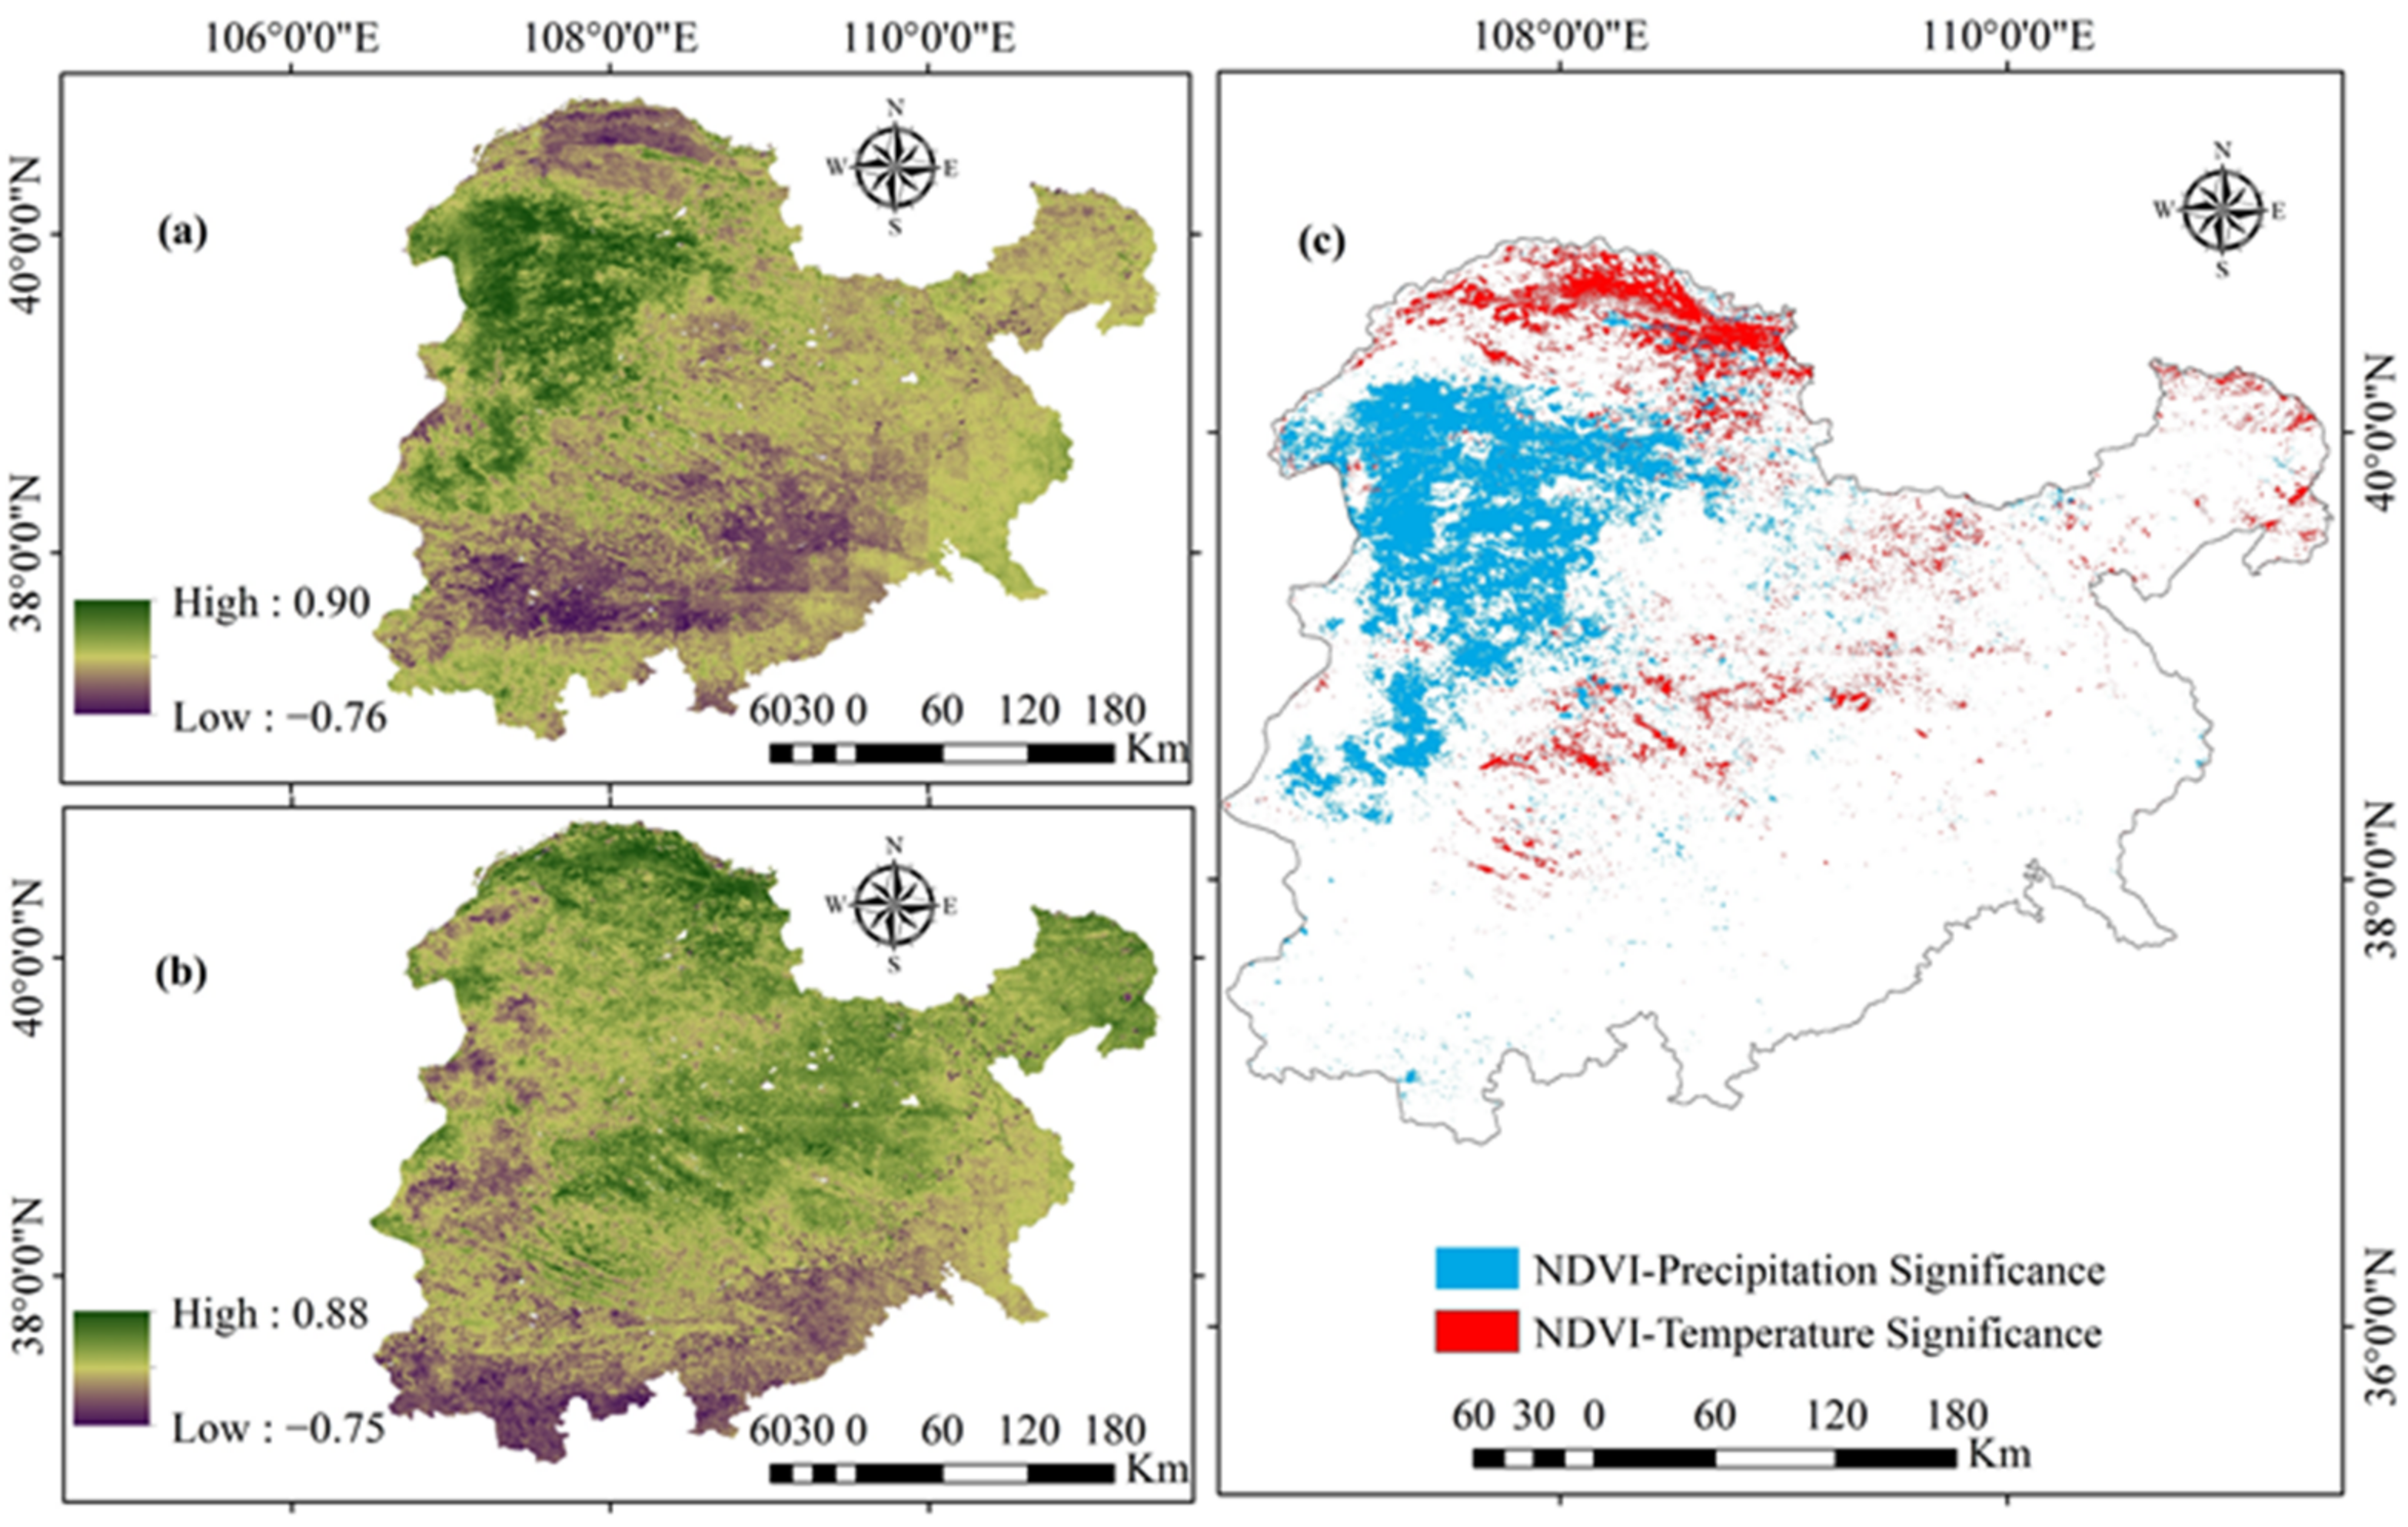
3.2. Relationship between NDVI and Climatic Factors

In some parts of Mu Us significant positive correlations (p < 0.05) between annual NDVI and climatic factors (temperature and precipitation) were observed (Figure 5). Results revealed that annual NDVI is more strongly and positively correlated with precipitation than with temperature during the study period. 9.58% of the total study area showed a significant positive correlation between annual NDVI and precipitation. Only 3.32% area of Mu Us showed a significant positive correlation between annual NDVI and temperature while a huge 87.1% area showed no significant relationship between annual NDVI and climatic factors (precipitation and temperature). The spatial distribution of pixels that showed a significant positive correlation between NDVI and each climatic factor can be seen in Figure 5.

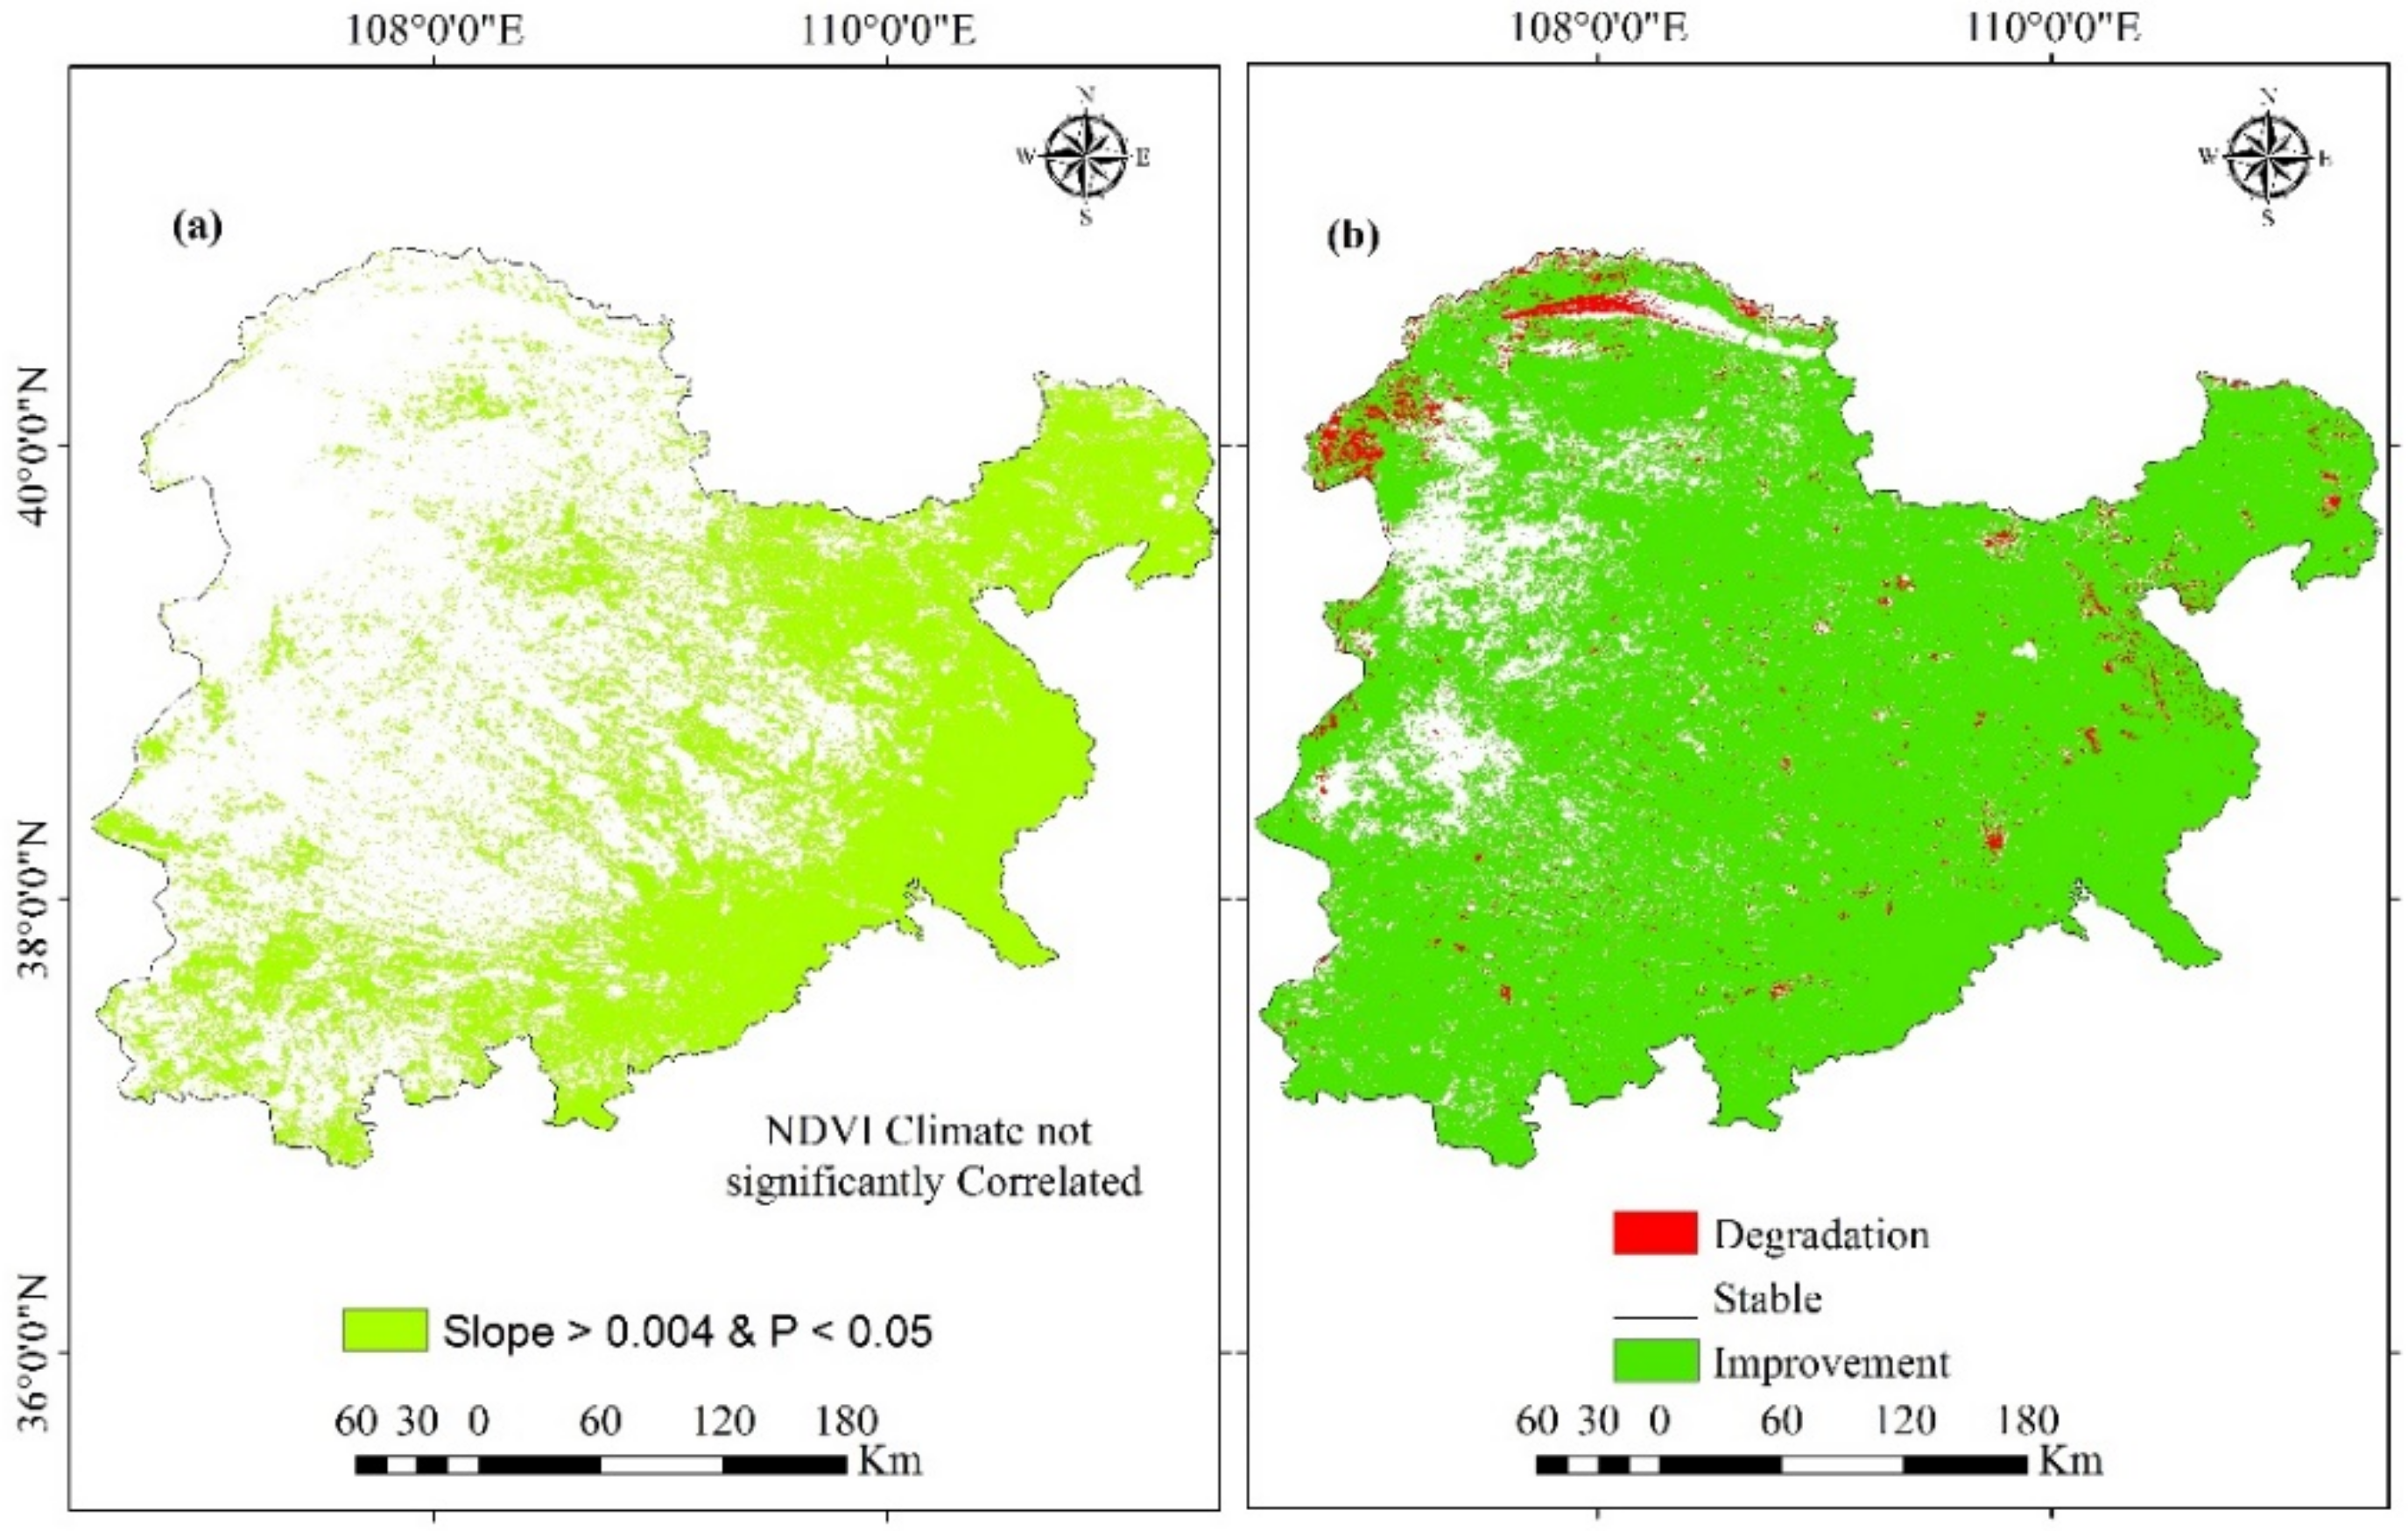
3.3. Restoration Caused by Ecological Restoration Programs and Land Degradation

Results revealed that in 18 years (2001–2018) 41.21% of the total significant restoration is attributed to the positive human interventions i.e., ecological restoration programs. A significant increasing vegetation trend was observed in the 41.21% area of the Mu Us desert. In this region, the slope of annual NDVI is greater than its mean value (0.004) and there is no significant correlation between NDVI and climatic factors. The spatial distribution of results can be seen in Figure 6a. These results indicate that the ecological restoration efforts have shown satisfactory results in restoring vegetation activity in Mu Us desert.
As shown in Figure 6b and illustrated in Table 2 below, it can be observed that 84.74% area of Mu Us has improved, 12.30% area is stable and out of the total land area only 2.91% is degraded. The results revealed that in the analyzed period the land area has improved in all aspects i.e., Land productivity, Soil Organic Carbon, and Land Cover change.
In terms of Land cover change 2.17% of the total area showed improvement, 96.91% stable and only 0.92% of the land area is degraded. Table 3 shows the land cover area change matrix which indicates that the gains made in cropland (2.44%) were from grassland whereas gains made by grassland (2.28%) were mostly from other lands. During the study period, most of the land cover types remained unchanged and does not show transition on large scale.
Land productivity (Table 4) shows the highest significant change among all three sub-indicators of land degradation. 85.19% land area of Mu Us shows improved productivity, 12.80% stable whereas a land area with degraded productivity is only 1.97%. Trends in land productivity for pixels with unchanged land cover revealed that grassland (64.60% of the total study area) has the highest improvement in land productivity followed by cropland (14.34%), other lands (3.68%), wetlands (0.03%), artificial areas (0.02%) and tree-covered area (0.01%). Results of change in soil organic carbon reveal that 1.14% of the land area showed improvements in soil organic carbon, 0.29% degraded and 98.57% of the area showed no change in soil organic carbon.

4. Discussion

Land degradation is listed in the sustainable development goals as one of the biggest threats to the environment. To address land degradation sustainable development goals proposed that land degradation neutrality should be given priority [61,62,63]. To achieve land degradation neutrality there must be an improvement in all three sub-indicators (Land Productivity, Land cover change, and Soil organic carbon) [64]. The main focus of scientific research on land degradation includes monitoring and evaluation, restoration and identification of driving forces. The most important countries for International research cooperation are China, the United States, and the United Kingdom in the field of land degradation [65]. In the past 20 years, the ecological restoration programs of China have played a leading role in the greening of the world. Grain for Green project of China is among one of the most pronounced programs of the 20th century. Restoration activities such as the return of cropland to woodland and the return of grazing land to grass were involved in this project [64]. Based on our results 84.74% of the land area has improved. During the study period, 96.91% of the land cover area shows no transition and remains stable. At a small scale, land use transitions were observed in grassland and croplands and these results are in line with the results of previous studies [66] which indicate that ecologically fragile regions of China such as Mu Us, grassland experienced a restoration process in the last decade. From 2001 to 2018 the grassland area has increased by 1127.50 km2. Another study has also stated that from 2010 to 2015 411.29 km2 was reclaimed by grassland [67].
To evaluate the quality of soil [68] and measure land degradation [69], soil organic carbon is the most appropriate indicator. SOC is linked with soil structure, plant health, productivity, and water holding capacity which are the most fundamental soil properties and functions [70,71,72,73]. Soil organic carbon in the current study does not show any change at a large scale and only 1.14% area showed improvement in terms of soil organic carbon. Only 0.93% change was observed in soil organic carbon storage from baseline to target year.
Results indicate that net primary productivity has improved over 96.91% area in Mu Us desert. The significant increase in primary productivity could be the result of ongoing ecological restoration projects [74]. Since the end of the 1990s, in the Horqin desert and Mu Us desert, extensive restoration projects have been implemented to control desertification [75]. Ref. [34] also attributed the significant increase in net primary productivity in the ago-pastural transitional zone of northern China to positive human interventions such as the Grain for Green ecological restoration program.
Numerous studies [32,76] have discussed the driving forces of desertification in Mu Us Desert. Ref. [77] suggested that climate trends and fluctuation are the main drivers of the desertification in the Mu Us desert. Ref. [78] found that unsustainable human activities like overgrazing, reclamation, and deforestation are the key driving forces of desertification in the Mu Us Desert. However, desertification monitoring showed that there were fluctuations in desertification in the region during the past several decades [76]. Previous studies discussed that desertification occurred in the region in the 1970s and 1980s, while restoration occurred in the 1990s [76,79,80].
ECMWF reanalysis of precipitation, and air temperature data was used in this research to understand the relationship between climatic factors and NDVI. Some previous studies evaluated the performance of ERA 5 data within China and found inconsistent performance in different regions. Ref. [81] stated that in mainland China during the summer season ERA 5 precipitation was slightly overestimated but it can capture seasonal and annual patterns of precipitation with high accuracy. The study also reported that at lower elevations ERA 5 precipitation is estimated well and the trends are consistent with observations at the seasonal and annual scale. As compared to ERA-interim data, ERA 5 reanalysis data have higher spatiotemporal resolution and it provides comparatively better quality precipitation data. Another study [82] stated that satellite data and ERA 5 climate reanalysis data are easily available as compared to weather station data which provide scattered temperature data, therefore as a substitute for recorded data, ERA 5 data can be used conveniently.
Ref. [83] stated that from 2006 to 2015 the main factors of desertification reversal in northern china are ecological restoration policies. Supporting the results of [83], another study [32] reported that the implementation of restoration projects plays a key role in desertification reversal at the whole desert scale. In line with the results of [32,83] this study, suggested that the ecological restoration projects are the key drivers and have achieved remarkable results throughout the study area. Results reveal that 85.69% area shows a significant increase in vegetation. In our study, the role of climatic factors in driving vegetation trends is limited [84]. Only 12.9% area of the Mu Us desert shows a significant positive correlation with climatic factors (precipitation and temperature). Human interventions such as ecological restoration projects are found to be the drivers of vegetation change in this study as 41.21% of vegetation restoration is attributed to ecological restoration programs. Interestingly, in the areas where vegetation restoration is attributed to the ecological restoration efforts, land area has also improved in terms of land degradation. 40.42% out of 41.21% of the area under ecological restoration programs showed improvement in all three indicators of land degradation (vegetation productivity, Soil Organic Carbon, and Landcover).

5. Conclusions

This study analyzed the impact of positive human interventions (ecological restoration projects) on land degradation in the Mu Us Desert on a spatial and temporal scale from 2001–2018 and differentiate between the impact of human-induced restoration and restoration caused due to climatic factors. Based on the above investigation the following conclusions could be drawn:
  • Desertification reversal in Mu Us is obvious as most of the land area has shown improvement in vegetation condition, soil organic carbon, and land cover transition. Despite the limited impact of climatic factors on vegetation cover change, vegetation has increased especially on the eastern side of the desert. Ecological restoration activities are found to be the key driving forces of vegetation restoration.
  • The condition of land has improved significantly in regions where vegetation restoration is attributed to ecological restoration programs. 41.21% of vegetation restoration in Mu Us is accredited to ecological restoration efforts, out of which 40.42% area has shown improvement in all three sub-indicators of land degradation and the rest 0.79% of this region is stable and has no signs of land degradation.
  • This study has quantified the contribution and revealed the importance of ecological restoration programs in land degradation reversal in the Mu Us desert. It can be concluded that successful restoration projects in Mu Us are a win-win strategy and a positive step toward implementing Sustainable Development Goal 15.3.1 to achieve a land degradation-neutral world.

Author Contributions

B.B.: Conceptualization, Methodology, Investigation, Visualization, Writing—original draft, Writing—review & editing. C.C.: Supervision, Funding acquisition. B.X.: Formal analysis. Y.C.: Writing—review & editing. Z.H.: Writing—original draft. X.L.: Funding acquisition, Resources. H.N.G.: Resources. F.M.: Writing—review & editing and Resources. R.S.D.: Formal analysis, Investigation. A.A.: Formal analysis. T.H.: Writing—review & editing. All authors have read and agreed to the published version of the manuscript.

Funding

This work was supported by the project of the National Key R & D Program of China (Grant number 2021YFB3901104), the National Natural Science Foundation of China (grant number: 41971394), and Forest and grass science and technology innovation development and research project of the State Forestry and grassland administration of China (grant number: 2020132108).

Data Availability Statement

Soil Grids can be downloaded from www.soilgrids.org (accessed on 20 June 2020) and are available under the Open Database License (ODbl) v1.0. SoilGrids250m data has already been released in July 2016 (see: http://www.isric.org/content/isric-releases-upgraded-soilgrids-system-two-times-improved accuracy-predictions (accessed on 20 June 2020)).

Acknowledgments

Barjeece Bashir acknowledges the University of Chinese Academy of Sciences (UCAS) and China Scholarship Council for awarding Chinese Government Scholarship and support to carry out this research.

Conflicts of Interest

The authors declare no conflict of interest. The funders had no role in the design of the study; in the collection, analyses, or interpretation of data; in the writing of the manuscript, or in the decision to publish the results.

Appendix A

Table A1. Aggregating the productivity sub-indicators.
TrajectoryStatePerformanceClasses
ImprovementImprovementStableImprovement
ImprovementImprovementDegradationImprovement
ImprovementStableStableImprovement
ImprovementStableDegradationImprovement
ImprovementDegradationStableImprovement
ImprovementDegradationDegradationDegradation
StableImprovementStableStable
StableImprovementDegradationStable
StableStableStableStable
StableStableDegradationDegradation
StableDegradationStableDegradation
StableDegradationDegradationDegradation
DegradationImprovementStableDegradation
DegradationImprovementDegradationDegradation
DegradationStableStableDegradation
DegradationStableDegradationDegradation
DegradationDegradationStableDegradation
DegradationDegradationDegradationDegradation
Table A2. Conversion coefficients for changes in land use.
LU CoefficientsForestGrasslandsCroplandsWetlandsArtificial AreasBare LandsWater Bodies
Forest11f10.10.11
Grasslands11f10.10.11
Croplands1/f1/f11/0.710.10.11
Wetlands11o.7110.10.11
Artificial areas2222111
Bare lands2222111
Water bodies1111111
Changes in SOC are better studied for land cover transitions [41] involving agriculture, and for that reason there is a different set of coefficients for each of the main global climatic regions: Temperate Dry (f = 0.80), Temperate Moist (f = 0.69), Tropical Dry (f = 0.58), Tropical Moist (f = 0.48), and Tropical Montane (f = 0.64). Trends.earth determines the climate region itself from pixel-based information.

References

  1. Gashu, K.; Muchie, Y. Rethink the interlink between land degradation and livelihood of rural communities in Chilga district, Northwest Ethiopia. J. Ecol. Environ. 2018, 42, 139–149. [Google Scholar] [CrossRef]
  2. Kang, J.; Zhang, Y.; Biswas, A. Land Degradation and Development Processes and Their Response to Climate Change and Human Activity in China from 1982 to 2015. Remote Sens. 2021, 13, 3516. [Google Scholar] [CrossRef]
  3. Eswaran, H.; Lal, R.; Reich, P. Land degradation: An overview. Responses to Land Degradation. In Proceedings of the 2nd International Conference on Land Degradation and Desertification, Khon Kaen, Thailand, 25–29 January 1999; Bridges, E., Hannam, I., Oldeman, L., De Vries, F.P., Scherr, S., Sompatpanit, S., Eds.; Oxford Press: New Delhi, India, 2001. [Google Scholar]
  4. Talukder, B.; Ganguli, N.; Matthew, R.; VanLoon, G.W.; Hipel, K.W.; Orbinski, J. Climate change-triggered land degradation and planetary health: A review. Land Degrad. Dev. 2021, 32, 4509–4522. [Google Scholar] [CrossRef]
  5. Mirzabaev, A.; Wu, J.; Evans, J.; Garcia-Oliva, F.; Hussein, I.; Iqbal, M.; Kimutai, J.; Knowles, T.; Meza, F.; Nedjroaoui, D. Desertification. In Climate Change and Land: An IPCC Special Report on Climate Change, Desertification, Land Degradation, Sustainable Land Management, Food Security, and Greenhouse Gas Fluxes in Terrestrial Ecosystems; Shukla, P.R., Skea, J., Buendia, E.C., Masson-Delmotte, V., Pörtner, H.-O., Roberts, D.C., Zhai, P., Slade, R., Connors, S., Van Diemen, R., et al., Eds.; IPCC: Geneva, Switzerland, 2019; in press; Available online: https://www.ipcc.ch/site/assets/uploads/sites/4/2021/07/210714-IPCCJ7230-SRCCL-Complete-BOOK-HRES.pdf (accessed on 25 January 2022).
  6. Da Cunha Dias, T.A.; Lora, E.E.S.; Maya, D.M.Y.; Del Olmo, O.A. Global potential assessment of available land for bioenergy projects in 2050 within food security limits. Land Use Policy 2021, 105, 105346. [Google Scholar] [CrossRef]
  7. Liu, Q.; Zhao, Y.; Zhang, X.; Buyantuev, A.; Niu, J.; Wang, X. Spatiotemporal patterns of desertification dynamics and desertification effects on ecosystem Services in the Mu Us Desert in China. Sustainability 2018, 10, 589. [Google Scholar] [CrossRef] [Green Version]
  8. Bashir, B.; Cao, C.; Naeem, S.; Zamani Joharestani, M.; Bo, X.; Afzal, H.; Jamal, K.; Mumtaz, F. Spatio-Temporal Vegetation Dynamic and Persistence under Climatic and Anthropogenic Factors. Remote Sens. 2020, 12, 2612. [Google Scholar] [CrossRef]
  9. Sims, N.C.; England, J.R.; Newnham, G.J.; Alexander, S.; Green, C.; Minelli, S.; Held, A. Developing good practice guidance for estimating land degradation in the context of the United Nations Sustainable Development Goals. Environ. Sci. Policy 2019, 92, 349–355. [Google Scholar] [CrossRef]
  10. Paylore, P.; McGinnies, W. Desert Research: Selected References 1965–1968; Arizona Univ Tucson Inst of Arid Lands Research: Tucson, AZ, USA, 1969. [Google Scholar]
  11. Basso, F.; Bove, E.; Dumontet, S.; Ferrara, A.; Pisante, M.; Quaranta, G.; Taberner, M. Evaluating environmental sensitivity at the basin scale through the use of geographic information systems and remotely sensed data: An example covering the Agri basin (Southern Italy). Catena 2000, 40, 19–35. [Google Scholar] [CrossRef]
  12. Geerken, R.; Ilaiwi, M. Assessment of rangeland degradation and development of a strategy for rehabilitation. Remote Sens. Environ. 2004, 90, 490–504. [Google Scholar] [CrossRef]
  13. Wessels, K.J.; Van den Bergh, F.; Scholes, R. Limits to detectability of land degradation by trend analysis of vegetation index data. Remote Sens. Environ. 2012, 125, 10–22. [Google Scholar] [CrossRef]
  14. Tucker, C.J.; Dregne, H.E.; Newcomb, W.W. Expansion and contraction of the Sahara Desert from 1980 to 1990. Science 1991, 253, 299–300. [Google Scholar] [CrossRef]
  15. Wei, H.; Wang, J.; Cheng, K.; Li, G.; Ochir, A.; Davaasuren, D.; Chonokhuu, S. Desertification information extraction based on feature space combinations on the Mongolian Plateau. Remote Sens. 2018, 10, 1614. [Google Scholar] [CrossRef] [Green Version]
  16. Zheng, Y.; Xie, Z.; Robert, C.; Jiang, L.; Shimizu, H. Did climate drive ecosystem change and induce desertification in Otindag sandy land, China over the past 40 years? J. Arid. Environ. 2006, 64, 523–541. [Google Scholar] [CrossRef]
  17. Cai, B. Monitoring and Evaluating of Major Forestry Ecological Project Based on Remote Sensing—A Case Study of “Three North” Shelter Forest Project; Graduate University of Chinese Academy of Sciences: Beijing, China, 2008. (In Chinese) [Google Scholar]
  18. Tian, H.; Cao, C.; Chen, W.; Bao, S.; Yang, B.; Myneni, R.B. Response of vegetation activity dynamic to climatic change and ecological restoration programs in Inner Mongolia from 2000 to 2012. Ecol. Eng. 2015, 82, 276–289. [Google Scholar] [CrossRef]
  19. Jobbágy, E.G.; Sala, O.E.; Paruelo, J.M. Patterns and controls of primary production in the Patagonian steppe: A remote sensing approach. Ecology 2002, 83, 307–319. [Google Scholar]
  20. Boschetti, M.; Nutini, F.; Brivio, P.A.; Bartholomé, E.; Stroppiana, D.; Hoscilo, A. Identification of environmental anomaly hot spots in West Africa from time series of NDVI and rainfall. ISPRS J. Photogramm. Remote Sens. 2013, 78, 26–40. [Google Scholar] [CrossRef]
  21. Liu, J.; Diamond, J. China’s environment in a globalizing world. Nature 2005, 435, 1179–1186. [Google Scholar] [CrossRef]
  22. State Forestry Administration of the People’s Republic of China. A Bulletin of Status Quo of Desertification and Sandification in China; State Forestry Administration of the People’s Republic of China: Beijing, China, 2011.
  23. Wang, G.; Innes, J.L.; Lei, J.; Dai, S.; Wu, S.W. China’s forestry reforms. Sci. N. Y. Wash. 2007, 318, 1556. [Google Scholar] [CrossRef] [Green Version]
  24. Zhang, P.; Shao, G.; Zhao, G.; Le Master, D.C.; Parker, G.R.; Dunning, J.B.; Li, Q. China’s forest policy for the 21st century. Science 2000, 288, 2135–2136. [Google Scholar] [CrossRef] [Green Version]
  25. Uchida, E.; Xu, J.; Rozelle, S. Grain for green: Cost-effectiveness and sustainability of China’s conservation set-aside program. Land Econ. 2005, 81, 247–264. [Google Scholar] [CrossRef]
  26. Li, H.; Xu, F.; Li, Z.; You, N.; Zhou, H.; Zhou, Y.; Chen, B.; Qin, Y.; Xiao, X.; Dong, J. Forest Changes by Precipitation Zones in Northern China after the Three-North Shelterbelt Forest Program in China. Remote Sens. 2021, 13, 543. [Google Scholar] [CrossRef]
  27. Zhao, Y.; Xin, Z.; Ding, G. Spatiotemporal variation in the occurrence of sand-dust events and its influencing factors in the Beijing–Tianjin Sand Source Region, China, 1982–2013. Reg. Environ. Chang. 2018, 18, 2433–2444. [Google Scholar] [CrossRef]
  28. Song, X.; Peng, C.; Zhou, G.; Jiang, H.; Wang, W. Chinese Grain for Green Program led to highly increased soil organic carbon levels: A meta-analysis. Sci. Rep. 2014, 4, 4460. [Google Scholar] [CrossRef] [PubMed] [Green Version]
  29. Zhang, P.; He, Y.; Feng, Y.; De la Torre, R.; Jia, H.; Tang, J.; Cubbage, F. An analysis of potential investment returns of planted forests in South China. New For. 2019, 50, 943–968. [Google Scholar] [CrossRef] [Green Version]
  30. Cao, S.; Wang, X.; Song, Y.; Chen, L.; Feng, Q. Impacts of the Natural Forest Conservation Program on the livelihoods of residents of Northwestern China: Perceptions of residents affected by the program. Ecol. Econ. 2010, 69, 1454–1462. [Google Scholar] [CrossRef]
  31. Wang, H.; He, M.; Ran, N.; Xie, D.; Wang, Q.; Teng, M.; Wang, P. China’s Key Forestry Ecological Development Programs: Implementation, Environmental Impact and Challenges. Forests 2021, 12, 101. [Google Scholar] [CrossRef]
  32. Liu, Q.; Zhang, Q.; Yan, Y.; Zhang, X.; Niu, J.; Svenning, J.-C. Ecological restoration is the dominant driver of the recent reversal of desertification in the Mu Us Desert (China). J. Clean. Prod. 2020, 268, 122241. [Google Scholar] [CrossRef]
  33. Li, S.; Wang, T.; Yan, C. Assessing the role of policies on land-use/cover change from 1965 to 2015 in the Mu Us Sandy Land, northern China. Sustainability 2017, 9, 1164. [Google Scholar] [CrossRef] [Green Version]
  34. Jiang, H.; Xu, X.; Guan, M.; Wang, L.; Huang, Y.; Jiang, Y. Determining the contributions of climate change and human activities to vegetation dynamics in agro-pastural transitional zone of northern China from 2000 to 2015. Sci. Total Environ. 2020, 718, 134871. [Google Scholar] [CrossRef]
  35. Jiang, G. It is inappropriate for afforestation in the “Three North” regions. Sci. Decis. Mak. 2005, 11, 40–42. [Google Scholar]
  36. Cao, S. Why Large-Scale Afforestation Efforts in China Have Failed to Solve the Desertification Problem; ACS Publications: Washington, DC, USA, 2008. [Google Scholar]
  37. Wang, X.; Zhang, C.; Hasi, E.; Dong, Z. Has the Three Norths Forest Shelterbelt Program solved the desertification and dust storm problems in arid and semiarid China? J. Arid. Environ. 2010, 74, 13–22. [Google Scholar] [CrossRef]
  38. Liang, P.; Yang, X. Landscape spatial patterns in the Maowusu (Mu Us) Sandy Land, northern China and their impact factors. Catena 2016, 145, 321–333. [Google Scholar] [CrossRef]
  39. Didan, K. MOD13Q1: MODIS/Terra vegetation indices 16-day L3 global 250 m grid SIN V006. NASA EOSDIS Land Process. DAAC 2014, 6. [Google Scholar] [CrossRef]
  40. Vermote, E.F.; El Saleous, N.Z.; Justice, C.O. Atmospheric correction of MODIS data in the visible to middle infrared: First results. Remote Sens. Environ. 2002, 83, 97–111. [Google Scholar] [CrossRef]
  41. Trends.Earth. Conservation International. Available online: http://trends.earth (accessed on 20 June 2020).
  42. ESA. Land Cover CCI Product User Guide Version 2; Technical Report; ESA: Paris, France, 2017. [Google Scholar]
  43. Hengl, T.; Mendes de Jesus, J.; Heuvelink, G.B.; Ruiperez Gonzalez, M.; Kilibarda, M.; Blagotić, A.; Shangguan, W.; Wright, M.N.; Geng, X.; Bauer-Marschallinger, B. SoilGrids250m: Global gridded soil information based on machine learning. PLoS ONE 2017, 12, e0169748. [Google Scholar] [CrossRef] [Green Version]
  44. Sims, N.; Green, C.; Newnham, G.; England, J.; Held, A.; Wulder, M.; Herold, M.; Cox, S.; Huete, A.; Kumar, L. Good Practice Guidance. SDG Indicator 15.3.1, Proportion of Land That Is Degraded over Total Land Area; United Nations Convention to Combat Desertification (UNCCD): Bonn, Germany, 2021. [Google Scholar]
  45. Hwang, S.-O.; Park, J.; Kim, H.M. Effect of hydrometeor species on very-short-range simulations of precipitation using ERA5. Atmos. Res. 2019, 218, 245–256. [Google Scholar] [CrossRef]
  46. Hersbach, H.; Bell, B.; Berrisford, P.; Hirahara, S.; Horányi, A.; Muñoz-Sabater, J.; Nicolas, J.; Peubey, C.; Radu, R.; Schepers, D. The ERA5 global reanalysis. Q. J. R. Meteorol. Soc. 2020, 146, 1999–2049. [Google Scholar] [CrossRef]
  47. Baboo, S.S.; Devi, M.R. An analysis of different resampling methods in Coimbatore, District. Glob. J. Comput. Sci. Technol. 2010, 10, 61–66. [Google Scholar]
  48. Hashimoto, H.; Nemani, R.R.; Bala, G.; Cao, L.; Michaelis, A.R.; Ganguly, S.; Wang, W.; Milesi, C.; Eastman, R.; Lee, T. Constraints to vegetation growth reduced by region-specific changes in seasonal climate. Climate 2019, 7, 27. [Google Scholar] [CrossRef] [Green Version]
  49. Iegorova, L.V.; Gibbs, J.P.; Mountrakis, G.; Bastille-Rousseau, G.; Paltsyn, M.Y.; Ayatkhan, A.; Baylagasov, L.V.; Robertus, Y.V.; Chelyshev, A.V. Rangeland vegetation dynamics in the Altai Mountain region of Mongolia, Russia, Kazakhstan and China: Effects of climate, topography, and socio-political context for livestock herding practices. Environ. Res. Lett. 2019, 14, 104017. [Google Scholar] [CrossRef] [Green Version]
  50. Gonzalez-Roglich, M.; Zvoleff, A.; Noon, M.; Liniger, H.; Fleiner, R.; Harari, N.; Garcia, C. Synergizing global tools to monitor progress towards land degradation neutrality: Trends. Earth and the World Overview of Conservation Approaches and Technologies sustainable land management database. Environ. Sci. Policy 2019, 93, 34–42. [Google Scholar] [CrossRef]
  51. Yengoh, G.T.; Dent, D.; Olsson, L.; Tengberg, A.E.; Tucker, C.J., III. Use of the Normalized Difference Vegetation Index (NDVI) to Assess Land Degradation at Multiple Scales: Current Status, Future Trends, and Practical Considerations; Springer: Cham, Switzerland, 2015. [Google Scholar]
  52. Tucker, C.J. Red and photographic infrared linear combinations for monitoring vegetation. Remote Sens. Environ. 1979, 8, 127–150. [Google Scholar] [CrossRef] [Green Version]
  53. Nzabarinda, V.; Bao, A.; Xu, W.; Uwamahoro, S.; Jiang, L.; Duan, Y.; Nahayo, L.; Yu, T.; Wang, T.; Long, G. Assessment and Evaluation of the Response of Vegetation Dynamics to Climate Variability in Africa. Sustainability 2021, 13, 1234. [Google Scholar] [CrossRef]
  54. Raich, J.W.; Schlesinger, W.H. The global carbon dioxide flux in soil respiration and its relationship to vegetation and climate. Tellus B 1992, 44, 81–99. [Google Scholar] [CrossRef] [Green Version]
  55. Duarte-Guardia, S.; Peri, P.L.; Borchard, N.; Ladd, B. Soils need to be considered when assessing the impacts of land-use change on carbon sequestration. Nat. Ecol. Evol. 2019, 3, 1642. [Google Scholar] [CrossRef]
  56. Mattina, D.; Erdogan, H.E.; Wheeler, I.; Crossman, N. Default Data: Methods and Interpretation; A Guidance Document for the 2018 UNCCD Reporting; United Nations Convention to Combat Desertification (UNCCD): Bonn, Germany, 2018. [Google Scholar]
  57. Sen, P.K. Estimates of the regression coefficient based on Kendall’s tau. J. Am. Stat. Assoc. 1968, 63, 1379–1389. [Google Scholar] [CrossRef]
  58. Kasimati, A.; Espejo-Garcia, B.; Vali, E.; Malounas, I.; Fountas, S. Investigating a Selection of Methods for the Prediction of Total Soluble Solids Among Wine Grape Quality Characteristics Using Normalized Difference Vegetation Index Data from Proximal and Remote Sensing. Front. Plant Sci. 2021, 12, 1118. [Google Scholar] [CrossRef]
  59. Ukey, R.; Rai, A.C. Impact of global warming on heating and cooling degree days in major Indian cities. Energy Build. 2021, 244, 111050. [Google Scholar] [CrossRef]
  60. Huang, C.; Yang, Q.; Huang, W. Analysis of the Spatial and Temporal Changes of NDVI and Its Driving Factors in the Wei and Jing River Basins. Int. J. Environ. Res. Public Health 2021, 18, 11863. [Google Scholar] [CrossRef]
  61. Akhtar-Schuster, M.; Stringer, L.C.; Erlewein, A.; Metternicht, G.; Minelli, S.; Safriel, U.; Sommer, S. Unpacking the concept of land degradation neutrality and addressing its operation through the Rio Conventions. J. Environ. Manag. 2017, 195, 4–15. [Google Scholar] [CrossRef]
  62. Orr, B.; Cowie, A.; Castillo Sanchez, V.; Chasek, P.; Crossman, N.; Erlewein, A.; Louwagie, G.; Maron, M.; Metternicht, G.; Minelli, S. Scientific Conceptual Framework for Land Degradation Neutrality. A Report of the Science-Policy Interface; United Nations Convention to Combat Desertification (UNCCD): Bonn, Germany, 2017; pp. 1–98. [Google Scholar]
  63. Shen, Y.; Zhang, C.; Wang, X.; Zou, X.; Kang, L. Statistical characteristics of wind erosion events in the erosion area of Northern China. Catena 2018, 167, 399–410. [Google Scholar] [CrossRef]
  64. Jiang, C.; Zhang, H.; Zhao, L.; Yang, Z.; Wang, X.; Yang, L.; Wen, M.; Geng, S.; Zeng, Q.; Wang, J. Unfolding the effectiveness of ecological restoration programs in combating land degradation: Achievements, causes, and implications. Sci. Total Environ. 2020, 748, 141552. [Google Scholar] [CrossRef]
  65. Xie, H.; Zhang, Y.; Wu, Z.; Lv, T. A bibliometric analysis on land degradation: Current status, development, and future directions. Land 2020, 9, 28. [Google Scholar] [CrossRef] [Green Version]
  66. Gang, C.; Zhao, W.; Zhao, T.; Zhang, Y.; Gao, X.; Wen, Z. The impacts of land conversion and management measures on the grassland net primary productivity over the Loess Plateau, Northern China. Sci. Total Environ. 2018, 645, 827–836. [Google Scholar] [CrossRef]
  67. Li, S.; Yan, C.; Wang, T.; Du, H. Monitoring grassland reclamation in the Mu Us Desert using remote sensing from 2010 to 2015. Environ. Earth Sci. 2019, 78, 311. [Google Scholar] [CrossRef]
  68. Bünemann, E.K.; Bongiorno, G.; Bai, Z.; Creamer, R.E.; De Deyn, G.; De Goede, R.; Fleskens, L.; Geissen, V.; Kuyper, T.W.; Mäder, P. Soil quality—A critical review. Soil Biol. Biochem. 2018, 120, 105–125. [Google Scholar] [CrossRef]
  69. Lorenz, K.; Lal, R.; Ehlers, K. Soil organic carbon stock as an indicator for monitoring land and soil degradation in relation to United Nations’ Sustainable Development Goals. Land Degrad. Dev. 2019, 30, 824–838. [Google Scholar] [CrossRef]
  70. Wander, M. Soil organic matter fractions and their relevance to soil function. Soil Organic Matter in Sustainable Agriculture; CRC Press: Boca Raton, FL, USA, 2004; pp. 67–102. [Google Scholar]
  71. Comerford, N.B.; Franzluebbers, A.J.; Stromberger, M.E.; Morris, L.; Markewitz, D.; Moore, R. Assessment and evaluation of soil ecosystem services. Soil Horiz. 2013, 54, 1–14. [Google Scholar] [CrossRef] [Green Version]
  72. Murphy, B. Impact of soil organic matter on soil properties—A review with emphasis on Australian soils. Soil Res. 2015, 53, 605–635. [Google Scholar] [CrossRef]
  73. Grilli, E.; Carvalho, S.C.; Chiti, T.; Coppola, E.; D’Ascoli, R.; La Mantia, T.; Marzaioli, R.; Mastrocicco, M.; Pulido, F.; Rutigliano, F.A. Critical range of soil organic carbon in southern Europe lands under desertification risk. J. Environ. Manag. 2021, 287, 112285. [Google Scholar] [CrossRef]
  74. Bao, G.; Chen, J.; Chopping, M.; Bao, Y.; Bayarsaikhan, S.; Dorjsuren, A.; Tuya, A.; Jirigala, B.; Qin, Z. Dynamics of net primary productivity on the Mongolian Plateau: Joint regulations of phenology and drought. Int. J. Appl. Earth Obs. Geoinf. 2019, 81, 85–97. [Google Scholar] [CrossRef]
  75. Zhang, G.; Dong, J.; Xiao, X.; Hu, Z.; Sheldon, S. Effectiveness of ecological restoration projects in Horqin Sandy Land, China based on SPOT-VGT NDVI data. Ecol. Eng. 2012, 38, 20–29. [Google Scholar] [CrossRef]
  76. Wang, X.; Cheng, H.; Li, H.; Lou, J.; Hua, T.; Liu, W.; Jiao, L.; Ma, W.; Li, D.; Zhu, B. Key driving forces of desertification in the Mu Us Desert, China. Sci. Rep. 2017, 7, 3933. [Google Scholar] [CrossRef] [PubMed] [Green Version]
  77. Wang, X.; Chen, F.H.; Dong, Z.; Xia, D. Evolution of the southern Mu Us Desert in North China over the past 50 years: An analysis using proxies of human activity and climate parameters. Land Degrad. Dev. 2005, 16, 351–366. [Google Scholar] [CrossRef]
  78. Wang, T.; Xue, X.; Zhou, L.; Guo, J. Combating aeolian desertification in northern China. Land Degrad. Dev. 2015, 26, 118–132. [Google Scholar] [CrossRef]
  79. Zhong, D. Dynamic Evolution of Sand Deserts in China; Gansu Culture Press: Lanzhou, China, 1998; 224p. [Google Scholar]
  80. Tao, W.; Wei, W.; Xian, X. Time-space evolution of desertification land in northern China. J. Desert Res. 2003, 23, 230. [Google Scholar]
  81. Jiao, D.; Xu, N.; Yang, F.; Xu, K. Evaluation of spatial-temporal variation performance of ERA5 precipitation data in China. Sci. Rep. 2021, 11, 17956. [Google Scholar] [CrossRef]
  82. Oses, N.; Azpiroz, I.; Marchi, S.; Guidotti, D.; Quartulli, M.; Olaizola, I.G. Analysis of copernicus’ era5 climate reanalysis data as a replacement for weather station temperature measurements in machine learning models for olive phenology phase prediction. Sensors 2020, 20, 6381. [Google Scholar] [CrossRef]
  83. Guo, Q.; Fu, B.; Shi, P.; Cudahy, T.; Zhang, J.; Xu, H. Satellite monitoring the spatial-temporal dynamics of desertification in response to climate change and human activities across the Ordos Plateau, China. Remote Sens. 2017, 9, 525. [Google Scholar] [CrossRef] [Green Version]
  84. Tong, X.; Wang, K.; Brandt, M.; Yue, Y.; Liao, C.; Fensholt, R. Assessing future vegetation trends and restoration prospects in the karst regions of southwest China. Remote Sens. 2016, 8, 357. [Google Scholar] [CrossRef] [Green Version]
Figure 1. (a) Location of Mu Us Desert (b) Different land use classes.
Forests 13 00818 g001
Figure 2. (a) Total Precipitation (2001–2018) (b) Annual Mean Temperature (2001–2018) (c) Total Precipitation Time Series (2001–2018) (d) Annual mean Temperature Time Series (2001–2018).
Forests 13 00818 g002
Figure 3. Conceptual approach of the study to detect the impact of restoration on land degradation.
Forests 13 00818 g003
Figure 4. (a) MK trend test of MU US region from 2001–2018 (b) Classified Sen’s slope of annual NDVI of MU US region (1/year) (c) Trend significance of MU US region based on sen’s slop and MK-trend significance (p < 0.05).
Forests 13 00818 g004
Figure 5. (a) NDVI-Precipitation Correlation in MU US (2001–2018) (b) NDVI-Temperature Correlation in MU US (2001–2018) (c) NDVI Climatic Factors Significance (R > 0 & p < 0.05).
Forests 13 00818 g005
Figure 6. (a) Significant Restoration in MU-SU caused by Ecological restoration Programs (2001–2018) (b) Land degradation in Mu Us based on SDG Indicator 15.3.1.
Forests 13 00818 g006
Table 1. Dataset used in this study—Variables, Sensors, temporal, and spatial resolution.
VariableSensor/DatasetTemporalSpatial
NDVIMOD13Q12001–2018250 m
Land coverESA CCI2001–2018300 m
Soil taxonomic unitsSoil Grids—USDAStatic250 m
Carbon StocksSoil GridsN/A250 m
2 m Air temperatureERA 52001–20180.25°
PrecipitationERA 52001–20180.25°
Table 2. Sustainable Development Goals 15.3.1: Land Degradation Neutrality in Mu Us.
Summary of SDG 15.3.1 Indicator
Area (km2)Percent of Total Land Area
Land area improved97,772.3084.74%
Land area stable14,197.1012.30%
Land area degraded3354.102.91%
Land area with no data580.05%
Total land area115,381.5100.00%
Table 3. Land cover area change matrix (km2).
Land cover type in naseline
Year
Land Cover in Target Year
Tree-Covered AreasGrasslandsCroplandsWetlandsArtificial AreasOther Land
Tree-covered areas17.573.790.100.000.530.00
Grasslands0.0088,266.23433.770.00301.75386.22
Croplands0.00277.9317,340.590.0074.350.83
Wetlands0.000.000.00139.810.530.00
Artificial areas0.000.000.000.0054.220.00
Other lands0.002069.153.260.009.955999.31
Table 4. Trends in land productivity or functioning (for pixels with unchanged land cover) (km2).
Land cover typeNet Land Productivity Dynamics
DecliningModerate DeclineDeclinedStableIncreasingNo Data
Tree-covered areas0.050.003.101.7912.540.10
Grasslands215.54278.951292.0811,905.6374,537.9536.09
Croplands83.2277.3915.78605.7316,553.754.73
Wetlands2.621.3439.3745.9642.737.78
Artificial areas4.820.200.0515.9833.120.05
Other lands2.257.80108.831628.004250.382.05
Publisher’s Note: MDPI stays neutral with regard to jurisdictional claims in published maps and institutional affiliations.

