


Soil Erosion and Landslide Susceptibility Mapping in Western Attica, Greece: A Rock Engineering System Approach


Regional Authority of Attica/Directorate of Technical Works, Department of Technical Support of Attica’s Region Municipal Islands, 185 45 Piraeus, Greece
Geosciences 2023, 13(11), 338; https://0-doi-org.brum.beds.ac.uk/10.3390/geosciences13110338
Submission received: 7 October 2023
/
Revised: 20 October 2023
/
Accepted: 26 October 2023
/
Published: 3 November 2023
(This article belongs to the Special Issue Soil Erosion and Shallow Landslides: Prediction of the Phenomena and Measures of Sediments Delivery)
Abstract
:Two of the eight main soil degradation processes with which soils worldwide are confronted are soil erosion and landslides. Specifically, landslides are a major threat in particular areas across Europe, often leading to serious impacts on population, property, and infrastructure. Regarding the abovementioned processes, the case study of the fatal Mandra flash flood (November 2017) in the Attica Region (Greece), which caused 24 deaths, and much infrastructure and building damage, is presented with the intention of assessing the relationship between soil erosion and landslide incidents. Investigations were executed from 2018 to 2022, and their outcomes were taken into consideration by the Technical Authority of the Attica Region. Soil erosion lines were delineated in a GIS and were validated using a previously generated regional Web-GIS landslide susceptibility map. The study presents soil erosion types from the Mandra fatal flash flood event and correlates them with already existing landslide susceptibility analyses for the Attica Region. The produced susceptibility map is a cartographic product on a regional scale (1:100,000) generated via a semiquantitative heuristic methodology named the Rock Engineering System (RES). The way in which both soil erodibility and landslide susceptibility maps were generated and validated could be the basis for proposing modeling approaches that can respond to new developments in European landslide policies.
1. Introduction
Soil erosion is a crucial triggering factor in land degradation worldwide [1,2] and specifically at the European level, with serious financial implications. To this end, the European Commission’s Thematic Strategy for Soil Protection recognizes soil erosion as a serious threat to the European Union’s (EU) soil resources [3]. Focusing more on soil erosion types, soil erosion by water and gully erosion are two typical causes of land degradation that subsequently lead to slope failures. For these reasons, different stakeholders need easy access to soil data and information of various types and scales to assess the state of soils [4]. To date, many researchers have used a variety of qualitative and quantitative techniques with erosion models integrating GIS applications to cope with soil erosion and land degradation issues [5,6,7,8]. To be more specific, soil erosion prediction models have been used to predict the hazard of soil erosion [9,10]. In addition, the most common erosion models are the Universal Soil Loss Equation (USLE) and its revised version (RUSLE), which estimate long-term average annual soil loss [11,12,13]. Considering spatial distribution, USLE/RUSLE models have limitations, which have been addressed using geospatial applications [14]. On the other hand, soil erosion assessment in large-scale field measurements may have some drawbacks, such as being time-consuming, expensive, or nearly impossible due to limited resources [15,16]. In addition to this, soil erosion assessmentmodels such as RUSLE/USLE have some drawbacks when predicting sediment pathways from hill slopes to water bodies, and in gully assessment [17].
Moreover, regarding gully erosion, which is a major land degradation process and probably the most severe type of water erosion [18] (and this type of erosion appears to occur very often in the broader study area of Mandra city), gully erosion susceptibility mapping is a valuable tool, as it is beneficial for identifying the spatial probability of gully incidents.
Traditional statistical models have been implemented to estimate gully erosion susceptibility mapping, such as analytical hierarchical process (AHP) [19], frequency ratio (FR) [20], logistic regression (LR) [21], and weight of evidence [22], but the prediction accuracy is relatively low when using these methods [23,24,25]. However, gully erosion susceptibility mapping prediction accuracy has been greatly improved using machine learning algorithms compared with traditional statistical models [26,27]. In particular, different machine learning algorithms have been used for gully erosion [28,29,30,31].
To be more specific, Eustace et al. [28] used random forest (RF) to model the relationship between gully erosion and some characteristic parameters, and they found that the the predictive capability of the generated model was modest.
Rahmati et al. [29] compared the behaviors of seven machine learning models (RF, BRT (boosted regression tree), BRANN (Bayesian regularized artificial neural network), L-SVM (Lagrangian support vector machine), RBF (Radial Basis Function)-SVM, P-SVM (parallelizing support vector machine), S-SVM (structured SVM)) in order to model the gully presence at the Kashkan–Poldokhtar watershed in Iran. They concluded that RF, RBF-SVM, BRT, and BP-ANN (backpropagation artificial neural network) can be implemented as machine learning models for gully erosion susceptibility mapping.
Arabameri et al. [30] used the random forest model, and found that the precision accuracy of the confusion matrix for this model was equal to 88.89%.
Finally, Pourghasemi et al. [31] used the combination of SVM and ANNs to model a gully pattern, and they concluded that these two algorithms could be useful tools for gully erosion modeling.
On the other hand, the application of machine learning algorithms to gully susceptibility mapping in large areas using very high-resolution datasets also has limitations regarding computing efficiency (e.g., pixel-by-pixel prediction is needed). In such a case, the spatial resolution must be reduced to improve the abovementioned computing efficiency. As a result, this procedure may reduce prediction accuracy [32]. In Table 1, a summary of the above-described methodologies is presented.
Thus, to predict soil erosion types (gullies included) with high accuracy, especially in areas where severe phenomena (e.g., extremely heavy rainfall, such as that which happened in Mandra on 14–15 November 2017) may occur, a more practical methodology still needs to be invented.
In this context, as land degradation (e.g., landslides) is associated with soil erosion, it is believed that finding tools and methodologies to cope with slope failures automatically succeeds in addressing issues caused by soil erosion. This statement is strengthened by the fact that researchers have obtained more reliable soil erosion susceptibility outcomes by using slope failure events, and soil erosion conditioning factors have been used in landslide susceptibility prediction [33].
Based on the high intensity of the Mandra fatal flash (with short duration) flood event of 14–15 November 2017, the erosivity of the rainfall and the runoff were (among other parameters) the main causes loosening the soil (and the weathering mantle of decomposed–fragmented rocks), resulting in weakening the slopes and as a result leading to the mass movements of solid and semisolid materials [34,35].
In addition, fires, which have recently manifested in the broader area of Mandra, can be a catalyst for erosion and landslides [36]. Thus, the consequences of fires, the fact that in the broader area of Mandra improper urban expansion has taken place in the last 40 years, as well as the triggering factor of heavy rainfall of 14–15 November 2017, have intensified the extension of gullies (soil erosion) and landslides. Another characteristic point that relates landslides to soil erosion and particularly gullies in the study area is slope modifications via human interference (e.g., cut and fill or artificial drains) [17,37].
Several researchers have noted the correlation between slope failure phenomena and soil erosion processes [8,38,39,40,41,42,43,44,45,46,47,48,49]. In addition, Lin et al. [50], Kou et al. [51] and Deljouei et al. [52] emphasized the role of vegetation in the interaction of slope stability and soil erosion.
Regarding the examined area, two characteristic types of slope failures have been recorded—(i) earth falls and (ii) rock falls, according to the Varnes classification [53]—whereas in the broader area of the Attica Region, there are also debris falls, earth slumps, earth slides and rockslide–debris avalanches [53]. Analyses of these slope failures have been developed by Tavoularis et al. [54].
Based on the abovementioned, a case study from the Mandra fatal flash flood (which took place on 14–15 November 2017) in the Attica Region (Greece) is presented with the intention of exploring the role of soil erosion in relation to land degradation (e.g., landslides). The combination of the high rapidity of the rainfall episode manifested on 14–15 November 2017 along with the industrialized character of Mandra city constitutes the basic reason why this flood and study area were chosen. Investigations performed by different stakeholders have been executed between 2018 and 2022, and the outcomes of these have been taken into consideration by the Technical Authority (Directorate of Technical Works) of the Attica Region in designing and implementing a priori mitigation measures (for debris flows and rainfall-induced soil erosion processes) against potential upcoming extreme rainfall episodes. Using a variety of tools, soil erosion types are defined and delineated in GIS maps and afterwards validated using the regional Web-GIS landslide susceptibility map of the Attica Region (DIAS project), which was completed in June 2021 by a research team [54], implementing a semiquantitative methodology named Rock Engineering System (RES). This map identifies specific zoning areas that are more susceptible to slope failure. The way this landslide susceptibility map is generated can offer a basis for modeling approaches that can respond to new developments in European policies (e.g., data, maps, technical reports), such as those of the European landslide susceptibility map version 2 ((ELSUS v2) and ELSUSv2_six_datasets and metadata) [55], or can contribute to the improvement of large-scale assessments, which can further generate landslide hazard and risk maps. Thus, the objective of this study is to explore the relation of soil erosion to landslides using methodologies that have been implemented in landslide susceptibility modeling. As per the author’s knowledge, no one else has predicted (at least at the Greek and European levels) soil erosion susceptibility using a semiquantitative methodology such as RES. Thus, implementing methodologies that have already been used in landslide susceptibility mapping can help us identify and estimate soil erosion hazards.
Soil movement is a sign of a soil erosion hazard. This includes riverbank erosion, gully erosion, debris-falls, rock-falls, and general slope failures that can damage the environment and human beings [5]. Annually, thousands of lives are lost due to mass soil movements worldwide [56]. However, Blaschke et al. [57] mentioned that the impacts of mass movements on soil erosion and land productivity are underestimated in the literature. Thus, less attention has been given in the research to soil erosion due to mass movement. Most soil erosion hazards prevail during a rainy season or after heavy rain [58,59]. Therefore, realizing susceptibility to soil erosion is very important for mitigation and hazard–risk minimization.
The current article is organized as follows: A brief description of the fatal flash flood that occured in Mandra (November of 2017) is first presented. Then, the soil erosion types that arose in that area are described. In addition, landslide susceptibility for the Attica Region is also briefly analyzed via a semiquantitative heuristic methodology named the Rock Engineering System (RES). The outcomes (e.g., soil erodibility and landslide susceptibility map) of this methodology are depicted to validate the correlation between landslide occurrences and soil erosion events manifested in the Mandra area. Moreover, some characteristic mitigation measures that have been designed are addressed against potential upcoming extreme rainfall episodes. The paper is concluded with suggestions for future research.
2. Materials and Methods
2.1. Location of the Study Area
The landscape characteristics of the study area are very diverse, due to its large land cover. The whole area is a mosaic of forested areas with dense vegetation cover consisting mainly of pine forest, lowland agricultural areas, areas of residential density (small settlements, settlement areas, etc.) and areas of industrial activity. The study area also presents a great diversity of topography, with hilly outcrops alternating with hollows and lowland sections, crossed by a number of small and larger streams that contribute to the main streams of the catchment areas into which the study area is divided [60].
In western Attica, in which the wider area of interest can be found, the prevailing winds are westerly. Geomorphological uplift prevents the movement of winds to the east, resulting in the condensation of water vapor and the occurrence of significant rainfall. According to the precipitation map of Greece, the area of flooding is located in the region reflected by the annual precipitation curves of approximately 400 mm and 600 mm rainfall height [60].
The study concerns the area upstream of the residential area of Mandra and extends from the ridge of the adjacent mountain range (Pateras Mountain), with an altitude of 841 m, to the settlement of Mandra (Figure 1). The study area covers the catchment areas of the two streams Agia Aikaterini and Soures (covered area equal to 45 km2) located upstream of the settlement of Mandra (latitude: 38°4′30.1548″ N, longitude: 23°30′3.0636″ E, elevation above sea level: 79 m).
The altitude of the Agia Aikaterini basin ranges from 171 m to 838 m. The lowest altitudes are found in the eastern–southeastern part of the basin and the highest altitudes can be found in the western and southwestern parts. The gradients found vary, with the steepest gradients occurring to the west, east and north, and the gentlest gradients occurring to the northwest, northeast and south [60].
The altitude of the Soures basin ranges from 100 m to 674 m. The lowest altitudes cn be found in the eastern part of the basin and the highest altitudes in the western and northwestern parts. The gradients found vary, with the steepest gradients found in the westnorthwest, southeast and northeast and the gentlest gradients in the central and eastern parts of the basin [60].
According to the Koppen classification, the climate of the study area belongs to the Csa category, i.e., Mediterranean climate type with warm summers [60]. In addition, it is noted that: (a) The average air temperature ranges from 5.89 °C (January) to 26.36 °C (July). The minimum monthly temperature is 1.52 °C (January) while the maximum monthly air temperature is 32.04 °C (July). (b) The annual rainfall is 538.89 mm. The monthly rainfall ranges from 10.11 mm (July) to 85.88 mm (December).
A characteristic of the climate of the study area and the region of Western Attica (where the study area is located) is the high rapidity of rainfall. The rainfall duration–intensity–return period curves, constructed with data from the study area (Laboratory of Hydrology and Water Resources Utilization, NTUA), show a rainfall intensity of 33.2 mm/h for 2 h of rainfall (rainfall height 66 mm) with a return period of 100 years [60].
Taking into account the climatic Atlas of Greece in the period 1971–2000 constructed by the National Meteorological Service (EMY, http://climatlas.hnms.gr/sdi/ (accessed on 6 October 2023)) for the wider area where flood phenomena occured (Soures catchment area), the annual rainfall ranges from 396 mm in the east (Mandra) to 635 mm in the west (Mount Pateras) [60].
2.2. The Fatal Flash Flood Event of Mandra (11/2017)
On Tuesday 14 November 2017, heavy rainfall occurred in the wider area of western Attica (in Greece), which continued at high intensity into Wednesday 15 November 2017. The total amount of rainfall during the core of the event (Pateras Mountain) exceeded 200 mm over a period of 6 h, with the highest intensity mainly at 5:00 to 8:00 on 15/11, representing a very heavy and relatively short period of rainfall. A remarkable fact of the flooding episode was the great rapidity that was recorded. This rainfall corresponds to approximately 1/3 of the total annual rainfall of the western part of the basin (Mount Pateras) of the two streams and 1/2 of the annual rainfall of the eastern part of the basin in the area of the city of Mandra [62]. As a result, increased water flow and the consequent erosion and solid discharges entered the settlement of Mandra, causing extensive damage to houses and roads and the deaths of twenty-four (24) people. The study area (a part of it is depicted in Figure 2) covers the catchment area of the two streams Agia Aikaterini and Soures located upstream of the settlement of Mandra (e.g., the Soures catchment area is equal to 23.0 km2 and the Agia Aikaterini catchment area is equal to 22.0 km2) [63].
2.3. Geological Setting
The main lithostratigraphic characteristics of the formations found in the study area, listed from the most recent to the oldest, are as follows: (a) alluvial deposits; (b) modern lateral deposits; (c) old alluvial deposits; (d) marls, clays, sandstones, travertines, marly limestones and conglomerates; (e) limestones; (f) dolomitic limestones [61]. In addition, the study area contains some faults and a well-developed hydrographic network. The geological mapping of the catchments of the two streams that run through and north of the settlement of Mandra have provided useful information about the geological formations, their specific physical characteristics and their tectonic stress. This information is decisive for determining the extent of the contribution of each formation to the creation of flood conditions and the increased supply of sediments of various sizes in the area. More specifically, the largest part of the catchments, which is the mountainous part, is made up of dolomites and dolomitic limestones, which are highly fragmented, resulting in crumbling and mantles of alteration. The fractures and foliations of the fragmented rocks decrease their mechanical strength and increase their capacity to generate loose geomaterials, which lead to the formation of soil through the process of erosion. In addition, the erosivity of rainfall and runoff were the main causes for the loosening of the weathered mantle of decomposed–fragmented rocks, resulting in the weakening of the slopes and, as a result, leading to mass movements of solid and semisolid materials. All these materials can be easily eroded, and in the event of heavy rainfall they can provide materials for transport by water through streams.
2.4. On Site Geological Findings
The smoothest parts of the catchment areas (lowland) consist of deposits, i.e., materials that have been deposited in these areas in an earlier geological time (Upper Pleistocene) (Figure 3), and their deposition process is similar to the process that deposited the sedimentary materials during the flood event of 15 November 2017 [61]. That is, it was found that there were several successive flood events in the area in the recent geologic past that created the deposits in the lowland sections. These materials—by water movement and by mechanical means—have been welded together, forming very cohesive horizons, which are impervious to water, but also very resistant to erosion. These cohesive horizons are found in the lowlands at depths ranging from a few centimeters (20–50), i.e., below the soil mantle, to a maximum of 1 to 3–4 m. The presence of these cohesive horizons prevents streams from digging their beds deeper, so that in the event of increased flow, their cross-section is insufficient to drain the water. Consequently, they overflow, and the water flows uncontrollably over the surface of the adjacent areas, resulting in the creation of many furrows or small depressions that erode the soil mantle, adding new material to the solids [61]. Based on the above observations, it is considered appropriate to provide interventions at critical points in the hydrographic network that will limit the potential for erosion caused by streams and the downstream transport of erosion materials. In addition, in the lowland parts of the basins, where streams are unable to create a bed of sufficient cross-section due to the cohesive underlying materials, or where the bed is almost nonexistent, it is necessary to define the stream and to regulate it by creating a bed of sufficient cross-section. This can be done either by excavation or by creating artificial raised walls on the sides of the streams. The geological engineering characteristics of the formations that form the basin of the Mandra area, as well as their susceptibility to erosion, were studied to estimate the solid transport. The assessment of solid transport is very important for the planning and management of protection measures. The approximation of the total solid transport of the considered catchments is based on the calculation of the loss of soil mass by means of the measured erosion forms, and on the other hand on the calculation of the total volume of the flood deposits, the extent of which has been mapped by means of high-resolution satellite imagery and in situ measurements [61].
2.5. Causes of the Mandra Flood
The main causes of the catastrophic flood were [61]:
- (1)
- Urbanization, which significantly increases flood risk as it leads to the impairment of critical stream cross-sections;
- (2)
- The complete disappearance of small watercourses or their conversion into roads or parking places;
- (3)
- The construction of sub-dimensioning projects, which cannot take the hydraulic load in cases of heavy rainfall, as in the case of Mandra;
- (4)
- The dramatic reduction in the capacity of the soil to absorb part of the rainwater;
- (5)
- The very high concentration of atmospheric precipitation in a small area (such as that of Mandra) and the intensity of the rainfall.
This localized rainfall, which occurred in the mountainous parts of the region, caused a flash flood in the catchments of the area, and specifically the streams that flow into the lowland area of Mandra and the industrialized area of Mandra. These streams activated alluvial riffles formed by the supply of sediments within the Quaternary, resulting in flooding with a large amount of sediment. The areas inundated by water are located on top of the geological formations of the ripples. The development of settlements perpendicular to the water flow and on these alluvial ridges cut off the smooth drainage of water to the sea, resulting in water flooding the settlements. The development of roads and railways perpendicular to the flow is also estimated to have cut off the smooth drainage, resulting in the floodwaters being amplified in width.
2.6. Soil Erosion—Erodibility
Soil erosion or soil loss is the amount of soil or rock material that becomes detached under the influence of rainfall and subsequent surface runoff over a given period [14]. In our case, the soil erosion process occured due to extremely heavy rainfall, runoff, and gravity [61]. Research claims that soil erosion is extremely sensitive to rainfall [65,66]. The process of water erosion leads to the decomposition, transportation and deposition of sediment in a separate place. Erosion depends on factors such as [61]: (i) the erosivity of the water (rainfall intensity, volume and kinetic energy of the flow); (ii) morphological gradients; (iii) the presence or absence of vegetation cover; (iv) the resistance of the soil to erosion (erodibility); (v) climatic conditions and (vi) human interference—natural soil erosion is locally accelerated with anthropogenic interventions (road construction in stream beds, embankments, etc.), which disturb the soil structure and produce loose materials. The total land loss during the flood event of November 2017 amounted to more than 150,000 m3 [61]. The heavy rainfall that led to the catastrophic flood of 15 November 2017 in the urban area of Mandra was also accompanied by extensive soil erosion in large parts of the examined catchments. Soil erosion by water includes two main phases: the detachment of soil particles and their subsequent transport by water flow. When the transport energy of the water is reduced (reduction in flow rate, reduction in flow surface slope, etc.), the deposition phase of the transported materials follows. The typical forms of soil erosion that have occurred in the Mandra catchments and have led to extensive solid transport are as follows [61]: (a) surface (sheet) erosion, (b) rill erosion, (c) gully erosion, and (d) slope and subslope erosion.
2.6.1. Surface (Sheet) Erosion
Surface erosion is caused by the detachment of aggregates or soil components by raindrops [61]. Some of the detached particles move through the hydrological network, while others are deposited lower down. The erosive capacity of raindrops depends on their kinetic energy and momentum, which is a function of the size of the droplets combined with the direction and intensity of the rainfall, and its final velocity. The resistance of soils to erosion (erodibility) also plays an important role in the action of raindrops. Non-weathered rocks and cohesive soils have a low susceptibility not only to surface erosion, but also to all forms of erosion. Soils covered by vegetation are largely protected from erosion. Soil loss also increases significantly with the increase in the slopes of the morphological relief. Surface erosion, although less visible, is an important factor contributing to soil loss due to the destruction of the soil structure, which is then easily washed away by surface runoff. Although the calculation of the total soil loss due to surface erosion in the Mandra catchments requires systematic measurements over a super annual period, it is estimated that its contribution to the production of solids during the phase of the intense rainfall episode (15 November 2017) was much lower compared to the following forms of erosion. The reason is that the topographically higher parts of the catchments, where the rainfall intensity is highest, are structured by carbonate rocks, which generally exhibit low erodibility. In addition, most of the basins are covered by vegetation, which acts as a protection against surface erosion.
2.6.2. Rill Erosion
Rill erosion is the development of surface (sheet) erosion and is caused by the concentration of rainwater, which cannot percolate down to the subsoil, in small soil cavities, which progressively overflow and form irregular longitudinal surface runoff [61]. As the volume of runoff gradually increases, both the carrying capacity of the already extracted material and the potential for new material to be extracted along the water path increase. The erosive power of water depends on the volume, velocity, and rate of supply of surface runoff, slope gradient and soil erodibility. This creates many small and shallow (<1 m) rills that follow the direction of the maximum slope of the soil surface, forming water flow axes of usually triangular crosssections. The resulting sedimentary material is coarser than that produced by surface erosion and consists mainly of medium-sized gravels and coarse sand. The development of rill erosion in the catchment area of Mandra is particularly pronounced in areas structured by the engineering geological unit of Holocene deposits, where vegetation is also absent (Figure 4).
2.6.3. Gully Erosion
This type of erosion is developed by the flow of water along the axes of the maximum slope gradient of the slopes, where gullies of more than one meter in depth are formed [61]. The mechanism of their formation is similar to that of rill erosion, but on a larger scale, due to the greater concentration of water and the increase in its erosive and transport energy. The cross-section of the trenches depends on the erodibility of the soil with depth. In easily corroded materials, there is usually continuous dredging, and the cross-section is typically triangular, but deep erosion slows down considerably when the bottom of the trench reaches a corrosion-resistant formation. In this case, erosion progresses mainly laterally, and the cross-section of the gully is U-shaped. In the catchments of the Mandra rivers (e.g., Agia Aikaterini and Soures), intense trench erosion developed after the heavy rainfall that occurred on 15 November 2017, which contributed significantly to the production of fine and medium-sized sediments. Gully erosion developed in the upper and mainly middle elevations of the two basins, especially along valleys with a strong gradient, where the increased water volume significantly increased its erosive energy. Typical forms of gully erosion in the Mandra catchments are shown, which were developed mainly within the Holocene deposits (Figure 5).
2.6.4. Slope and Subslope Erosion (Riverbank Erosion)
In the central beds of the streams of the two catchments of the Mandra, as the elevations and gradients decrease, gully erosion develops into slope and subslope erosion, taking the form of a riverbank erosion feature (Figure 6). The strong flow of stream water detaches and carries materials from the foot of the slopes downstream, widening or deepening the bed [61]. The amount of erosion depends on the force of the water, the slopes of the bed, the meanders and bends it creates, and the erodibility of the geological formations through which the stream flows. The presence of vegetation or the local accumulation of coarse material in the streambed often diverts the main flow of the stream towards the slope, resulting in severe erosion. Slope and subslope erosion can be localized, as they usually develop perpendicular to the flow direction of the stream. Subslope erosion is also created in the beds of streams, in places of abrupt changes in elevation, where small waterfalls are formed. These forms of erosion can be observed in almost all the main and some secondary branches of the hydrological network of the Mandra catchment areas. The intense runoff that caused the major flooding in Mandra in November 2017 led to extensive slope and subslope erosion, resulting in the large widening of stream valleys and the removal of large volumes of material that were transported downstream. The slope and subslope erosions in the Mandra basin primarily affect the Holocene deposits of the stream slopes, but also affect the Pleistocene deposits, with differential erosion of the less cohesive horizons.
2.7. Modelling of Soil Erosion
2.7.1. Susceptibility to Soil Erosion
To investigate the intensity of the erosion that can be seen in the examined area of Mandra, a particular methodology was implemented by the Regional Authority of Attica/Directorate of Technical Works, and the Hellenic Survey of Geological and Mining Exploration (H.S.G.M.E) [61], as follows.
First, the erosivity of surface runoff (such as that derived from the flash flood on 14–15 November 2017), as well as the erodibility of the geological formations in the broader area of Mandra, determine how susceptible the geoenvironment is to the creation of gullies [20,21], a type of soil erosion that appears in the examined area of Mandra.
A soil erosion map was derived by a research project that was accomplished by the Hellenic Survey for Geology and Mineral Exploration (H.S.G.M.E.) in 2018, under the auspices of the Technical Authority of the Attica Region, which supervised this project (e.g., checking, reviewing, and approving the deliverables (e.g., technical reports and cartographic products)). The process of how those soil erosion lines were delineated is described more analytically in the following lines. The soil erosion map was produced based on the synthesis of three individual maps: (a) the engineering geological map, (b) the vegetation map, and (c) the morphological (slope) map.
Concerning the first map, the engineering geological map examined and classified the formations that structure the area, according to their lithological composition and hydrogeological behavior. The influence of tectonics was considered using the existing hydrographic network. Geological data were taken from the literature and are supplemented by field surveys. For the soil erodibility map, the roles of lithological composition, infiltration capacity and permeability were considered.
Infiltration is a property of soils. Continuous infiltration can result in the saturation of the soil cover or the weathering of the mantle. In the area under consideration, this property is very important, because Neogene formations and the weathering mantle can be saturated by prolonged rainfall and then become loose and easily eroded.
There should be no confusion between the concepts of permeability (which is a measure of the ability of the formation to allow water to pass through its mass) and infiltration, i.e., the ability of water to percolate through the soil mass without necessarily moving to the depth required to reach the water table. Infiltration refers to soils and not to rocks, and usually, if infiltration is present, it is referred to as deep percolation. In soils, continuous infiltration leads to saturation. The role of the soil cover on the rocks, which is usually a decomposed, clayey mantle with permeability, is therefore very important. The existence and thickness of the ground cover were estimated from field observations, particularly in areas recently affected by extensive forest fires, and from the 1:50,000 scale soil maps of the Institute of Forestry Research [61,68].
Regarding the second (vegetation) map, land use is based on mechanical and hydrological characteristics, as well as vegetation to control the slope’s stability [69,70,71]. During rainfall, land use influences the behavior of the soil as well as the magnitude of potential geomaterial that is about to move. In this case study, the land use classification from the research of Tavoularis et al. was used [54], wherein five classes are identified: (i) barren areas, (ii) urban areas, (iii) forest areas, (iv) shrubby areas—natural grassland and (v) cultivated areas. For the requirements of this work, the barren area class was implemented to estimate the soil erosion susceptibility.
Finally, considering the third (morphological/slope) map, the value of the slope was set as 5%, because this value is mentioned in the literature as the limit of the processes of deposition of fractional materials under conditions of diffuse flow (mudflow) and sedimentation on the surface of the earth (creation of cones of craters). The slope map distinguishes between areas with a slope of more than 5%, where erosion processes are more intensive, and areas with a slope of less than 5%, where erosion processes are less severe [61,68].
Thus, the susceptibility to erosion of the geological formations of Mandra was assessed based on the observations derived from technical geological mapping of the erosion phenomena observed and recorded in the wider catchment area (from technical site investigations in 2017 [67], 2018 [61], 2022 [62]), combined with the physical and mechanical characteristics of the geological formations. The grading of the units was carried out based on their physical and mechanical characteristics and estimated permeability.
In the present case study, the most interesting unit (associated with the highest soil erodibility) was the Holocene deposits, which cover an area of 2.05 km2 [61]. Those geomaterials derived from river deposits are brown to reddish-brown in color, and generally loose to slightly cohesive, covering the smooth parts of the catchment. They originate from the erosion of older formations and deposition via surface runoff and gravity. They comprise mixed phases of materials, with a corresponding average proportion of coarse to fine-grained materials and rapid changes in grain size during both horizontal and vertical development. In places, they may represent lateral or alluvial deposits. Their thickness varies locally from a few centimeters to two meters, but is usually on the order of 50 cm. The coarse phase consists mainly of mudstones, gravels, and coarse-grained sands of mainly dolomitic and calcareous composition. The fine phase, which is the binder, consists mainly of sandy to silty sands (CL, SC) with a variable but generally small proportion of clay. They are characterized as soft to medium cohesive soils and are rarely very soft or stiff. The plasticity of the soils is generally low. They are characterized by low to medium water permeability and very high erodibility.
The above (three) parameters are the criteria used for assessing the susceptibility to soil erosion, and assuming equivalent weighting and linear correlation between them, the thematic maps were superimposed and corresponding susceptibility maps of the Agia Aikaterini and Soures catchments were obtained. Moreover, the previously mentioned findings are in line with those derived in the Hydroment Associate’s site work (2021) undertaken on those two examined watersheds (Agia Aikaterini and Soures), which was executed under the auspices of the Region of Attica’s Authority, which is responsible for designing and implementing mitigation measures against flooding [62]. The combination of the three final maps produced an erosivity map, part of which is depicted as soil erosion lines in the following map (Figure 7).
The described soil erosion lines were validated not only on-site by technical visits executed by the Technical Authority of the Attica Region (2017, 2022), but also using a pre-existent web-GIS landslide susceptibility map, the creation of which was accomplished via a research project briefly entitled “DIAS” [54]. Specifically, the generated soil erosion lines overlaid on the landslide susceptibility map show that those lines achieve a consistent coincidence with the zones of “Extremely high (slope failure) susceptibility” and “Landslide”.
The abovementioned soil erosion types recorded during the in-field site investigation were validated through a previously generated landslide susceptibility map [54], which is briefly described in the next section. In this map, a strong correlation was found between the defined soil erosion lines and the landslide susceptibility zones that were produced via a semiquantitative methodology named the Rock Engineering System (RES).
2.7.2. Rock Engineering System (RES) Methodology
This approach is mainly based on the correlation of mechanisms between landslide parameters through a matrix table and uses slope failure factors that can potentially be identified during the preparation phase of a civil engineering project. The purpose of using RES is to generate a landslide susceptibility map after the estimation of a landslide instability index [54]. RES is a semiquantitative approach, and the principal tool for representing the selected parameters and their interaction mechanisms (Figure 8). It is based on a matrix that depicts the key parameters as leading diagonal terms, and their binary interaction mechanisms as off-diagonal terms. The RES was developed by Hudson in 1992 [72] to determine the interaction of different rock engineering parameters and calculate the instability index for rock slopes. Since then, it has been applied to different aspects of geotechnical engineering such as rock stability problems, landslide susceptibility analysis and rock engineering [73]. Thus, by implementing the RES methodology, experts select the most important causative and triggering factors responsible for slope failures, rate their interactions, estimate their weighted coefficients, and calculate the instability index of the examined slope.
The calculation of the landslide susceptibility index is based on the following actions: (a) selection and rating of parameters, (b) generation of interaction matrix, (c) rating of the interactions among the selected parameters, (d) construction of a cause–effect diagram (the use of a cause–effect diagram can help the expert to understand the role of each independent landside factor in slope stability), (e) calculation of the weighting coefficient of each parameter and (f) estimation of the landslide instability index. In Tavoularis et al. [54], ten parameters were used as independent agents (e.g., thematic layers) to model the landslide susceptibility, implementing the RES approach. These parameters were: (i) distance from roads, (ii) land use, (iii) slope inclination, (iv) slope orientation (aspect), (v) lithology, (vi) hydrogeological conditions, (vii) rainfall, (viii) elevation, (ix) distance from streams and (x) distance from tectonic elements.
The landslide susceptibility map was generated in ArcGIS 10.2.2, using the abovementioned thematic layers, based on geodata provided by the Hellenic Survey of Geological and Mineral Exploration and the Digital Elevation Model from Hellenic Cadastre S.A. [54].
Afterwards, every data layer was digitized and converted into grids (cell size: 20 × 20 m). Furthermore, taking into consideration the RES methodology, weights and rank values were assigned to the reclassified raster layers and to the classes of each layer. Finally, the weights of the raster thematic maps were multiplied by the corresponding weights and added up (through “weighted sum”, which is a tool of the GIS environment) to generate a landslide susceptibility map, wherein each cell has a particular index value. After the reclassification of the above map, the final susceptibility map of Attica Region was generated and divided into five susceptibility zones according to Brabb et al.’s classification [76]: “Low–Middle”, with Instability index (Ii) < 25, “High” with 25 < Ii < 42, “Very High” with 42 < Ii < 53, “Extremely High” with 53 < Ii < 70”, and “Landslide” with Ii > 70%. From this classification, the main conclusion is that the higher the LSI is, the more susceptible the area is to landslides (instability index higher than 70%). The overall methodology is depicted in Figure 9.
The generated landslide susceptibility maps can be combined with the zoning maps of potential high-flood-hazard areas already produced for the Attica Region, authorized by the Greek Ministry of Environment and Energy, and with the flooded area maps delivered by the Copernicus Emergency Management Service Mapping [63]. The outcome of the DIAS project is accessible to the public, through open-access web-based platforms (https://gis.attica.gov.gr/en/node/1216 (accessed on 1 May 2023), https://maps.nccs.nasa.gov/arcgis/apps/experiencebuilder/experience/?id=29bd25e78fff45f0a6dbfd0328b4d03e (accessed on 6 October 2023)), to aid awareness of landslides among different stakeholders (e.g., landslide experts, government authorities, planners, decision-makers, citizens). Moreover, the DIAS project can facilitate the work of Civil Protection Authorities by providing inputs for prevention and preparedness. For further details on the methodology briefly described here, readers are kindly encouraged to read the following relevant research [54,73,74,75].
3. Results
The landslide susceptibility map generated for the entire county of the Attica Region is shown in Figure 10. The map has been validated using a confusion matrix and 220 slope failures [54].
Mapping Performance Evaluation
The aforementioned soil erosion types were subjected to expert-based cross-checks and validated through on-screen visual interpretation of the generated landslide susceptibility map of the Attica Region. The soil erosion types are depicted as lines and have been overlaid on the landslide susceptibility map (on landslide susceptibility zones) to identify the correlation of potential slope failure zones with soil erosion lines (Figure 11). It was found that there is a consistent coincidence between all of the derived soil erosion lines and the areas that are characterized, regarding landslide susceptibility, as “very high susceptibility”, “extremely high susceptibility” and “landslides”, based on the generated landslide susceptibility map of the Attica Region.
The verification was executed by implementing a frequency ratio statistical analysis, where the relationship between the spatial distribution of landslide susceptibility zones and soil erosion lines was studied. Specifically, the ratio is that of the area where soil erosion lines manifested to a particular landslide susceptibility zone. According to Pradhan et al. [39], a value of 1 is an average value. A value lower than 1 means a lower correlation of soil erosion lines, whereas a value greater than 1 means a higher correlation.
All the derived soil erosion lines were found to be in the “very high susceptibility”, “extremely high susceptibility” and “landslide” zones. To estimate the frequency ratio, the frequency distribution of soil erosion lines was calculated for each landslide susceptibility zone of the Mandra area. Moreover, the area ratio for each landslide susceptibility zone (measured in pixels) as well as the meter ratio for each soil erosion line were computed. Finally, the frequency ratios for soil erosion lines associated with the “very high susceptibility”, “extremely high susceptibility” and “landslide” zones were calculated by dividing the frequency of soil erosion lines by the landslide susceptibility zone area (measured in pixels).
The frequency ratio generated for the Mandra area is shown in Table 2. For a lower probability of landslide occurrences (e.g., 42 < Ii (instability index) < 53), the frequency ratio is equal to 0.05, which indicates a poor relationship between the soil erosion lines and the generated landslide susceptibility zones. For extremely high landslide susceptibility (e.g., 53 < Ii < 70) and beyond (e.g., 70 < Ii < 100), the frequency ratio is found to be greater than 1, which indicates strong relationship between landslide susceptibility zones and soil erosion lines.
Taking into consideration the abovementioned factors, this kind of landslide susceptibility model (e.g., DIAS project) could be used as a soil erosion prediction model. Since soil erodibility reflects the soil’s susceptibility to erosion, the accurate mapping of susceptibility to erosion hazards is crucial to avoid economic losses and life losses. Thus, implementing the outcomes of landslide susceptibility mapping in validating soil erosion areas can help in identifying and consequently estimating soil erosion hazards and vulnerability.
4. Discussion
Although Kue et al. [51] reported that quantitative characterizations of the interaction between soil erosion and landslides are rare, in the present study, an attempt was made to quantitatively characterize the interaction between soil erosion and landslides using the RES methodology. Kue et al. [51] calculated the area and volume of 5420 shallow loess landslides and compared these results against the Chinese Soil Loss Equation (CSLE)-derived soil erosion rates of 15 subcatchments. Their analysis revealed satisfactory linear fitting between the areas of landslides and soil erosion. In this study, based on a heuristic approach, RES can be used to combine different parameters and study the interactions of those parameters to quantitatively estimate the instability index of an examined slope that can be associated with landslide susceptibility zones. In our case study, some of those zones coincided with soil erosion lines. These lines were derived not only from site investigations (in three different chronological periods: 2017, 2018, 2022), but also from a particular methodology (e.g., soil erosion susceptibility, which is described in detail in the manuscript).
In the studies of Lee et al. [38] and Pradhan et al. [39], the soil erosion map was verified using landslide locations via the integration of USLE with GIS to model the potential for soil erosion. In Rozos et al. [8], the Revised Universal Soil Loss Equation (RUSLE) was implemented to predict sites susceptible to slope failures caused by soil erosion. In those three papers, the verification that followed was the same as in the present study, which means that the generated soil erosion map was verified by comparing the soil erosion hazard zones with the spatial distribution of slope failures. Furthermore, one additional common characteristic is that the assessment of the dynamic soil erosion process can be correlated with another equally important and related threat of landslides [47]. Finally, from the abovementioned studies, considering the present study, it can clearly be said that, by adjusting the factors that are responsible for soil erosion such as lithology and land use, the rate of soil erosion can be minimized. As a result, gully and landslide inventory maps are very useful in identifying the distribution of sediment sources and the landscape characteristics that are connected to their existence [47]. By defining that distribution, this study could contribute to monetary estimates regarding the cost of removing sediments, while trying to implement flood mitigation measures for new potential heavy rainfall episodes.
In Tavoularis et al. [54], different types of slope failures [77] were found to manifest in the entire region of Attica, such as falls, rockfalls, slides, and debris. Among them, regarding the Mandra area, shallow landslides are the most prominent type that affects that region. Shallow landslides are very much related to gradual soil erosion, since they easily affect soil materials transposed by erosion [78]. Thus, the interaction of soil erosion and slope failure processes contributes to the loss of fertility, and the alteration of the landscape, not to mention damage to infrastructure and human facilities. Moreover, soil erosion and shallow slope failures are important geological issues, so specific studies are crucial to generate models to cope with hazards and vulnerability to these phenomena [79]. Taking into consideration the abovementioned factors, a well-structured landslide susceptibility map, such as that previously described, may be helpful in identifying and characterizing areas (in this study on a regional scale) of potentially increased land degradation. Therefore, it is important to gather and study spatial information on soil loss interacting with slope failures.
4.1. Prevention and Control Actions
It is scientifically documented, legally established and empirically proven that, to be effective in dealing with the flooding action of a stream, the study of flood control works should focus on the entire catchment area and include the necessary forestry works of stream regulation, which have the following positive results [61,62]:
- A reduction in the amount of solid material transported, with a corresponding reduction in the erosive capacity of the flood waters and the volume of the flood wave;
- The velocity of the flood wave is reduced, resulting in a delay in its occurrence downstream and a reduction in its destructive momentum;
- The effects of erosion on unprotected soils are reduced;
- The natural environment is protected and enhanced, especially through planting and soil protection projects;
The types of projects proposed include the following:
- Construction of small dams to grade the bed and retain the slopes;
- Construction of dams for the retention of debris;
- Construction of culverts in places where the existing road network is eroded by streams in the study area;
- Settlement of part of the hydrographic network of the study area by constructing an artificial bed with a dike;
- Implementation of horticultural works;
- Forestry measures for the management of the overall forest complex in the study area;
- Opening of forest roads to reach the sites of the proposed projects.
Particularly, given that the purpose of the interventions is to reduce flood risk and prevent catastrophic events, it was considered appropriate to limit the proposed measures to small dams, which are mainly of a preventive nature and aim to manage runoff effectively. These measures were considered to be the most appropriate proposal for the area, at least because they meet the requirements of being as cheap as possible and having a very short implementation time. To be more specific, the types of recommended dams are as follows (Figure 12):
- (a)
- The sediment barriers are intended to be between 3 m and 8 m high, with a reinforced concrete or unreinforced concrete construction material. The purpose of these dams is to counteract the axial erosion of the bottom of the streambed, by reducing the drag force of the water and retaining the sediment;
- (b)
- Construction of graduation dams–slope stabilization—these dams are proposed to be made of concrete (reinforced or unreinforced) or of reinforced wire mesh (e.g., sarsenet). The construction of the dams will be carried out either in places where there is evidence of gradual erosion, or in places where there is axial erosion of the bottom of the bed, in combination with the abovementioned sediment barriers. The height of these dams according to the theoretical assessment carried out is proposed to be between 1 m and 2 m.
4.2. Research Implications, Limitations, and Future Directions
To the author’s knowledge, the relationship between soil erosion and landslide events has not yet been approached using an expert semiquantitative methodology, named the Rock Engineering System (RES). Apart from the already known models that have been implemented before today (e.g., USLE, RUSLE, etc.), and which models have limitations (as was mentioned in the Section 1 (Introduction)), soil erosion identification can also be approached via a tool such as that of RES in conjunction with landslide susceptibility mapping, which, in our case study, has been generated for a region of approximately 3800 km2. This map has already been validated by 220 slope failures recorded in the last 60 years (1960–2020) in the entire region of Attica. The validation via too many slope failure incidents, along with the possibility that different experts can rate the selected parameters and code their interactions through their expertise and experience to reduce subjectivity, make the RES approach a simple and reliable tool in investigating quickly and in a scientifically appropriate manner the susceptibility of land degradation. In this direction, the implementation of geographical information systems technology enables the continuous monitoring and evaluation of soil erosion susceptibility to hazard reduction.
In addition, this study could assist the local authorities of the Mandra municipality in defining areas susceptible to soil erosion, and as a result it can contribute to the development of resilience for future flooding protection, and minimize further damage or prevent the occurrence of phenomena such as slope failures.
This study could also contribute to some quantified monetary estimates about the costs of removing sediments during the process of implementing mitigation measures against upcoming potential flood episodes.
In conclusion, the implementation of the landslide susceptibility model in this study can contribute to the online repository of scientific information in the EU Soil Observatory of the European Soil Data Centre (e.g., datasets, maps).
In this direction, the implementation of artificial intelligence and machine learning methodologies using (free) open-access Web-GIS platforms (such as those of the DIAS project), accompanied by a variety of geo (including soil) data, could lead to the further validation of the European Landslide Susceptibility Map (ELSUS), offering more accurate regional susceptibility maps through the evaluation of information downloaded from the European Soil Data Centre (ESDAC), further permitting the identification, correlation and quantification between land degradation and soil erosion.
5. Conclusions
This study investigated the correlation between soil erosion and land degradation in the Mandra area (Attica, Greece). In particular, soil erosion types were depicted on a soil erodibility map over an area that suffered from a disastrous flash flood (November 2017). The reliability of this map was assessed by comparing the slope failure predictions generated in a research project (DIAS) and validated via several field works focused on designing flood mitigation measures under the auspices of the Directorate of Technical Works of Attica Region. The main conclusions of this work can be summarized as follows: (a) There is a very strong correlation between soil erosion and potential landslide susceptibility zones. (b) The landslide susceptibility model (DIAS) could be used as a (preliminary) guide for investigating and identifying soil erosion issues. Based on the abovementioned, we can offer an alternative way to identify soil erosion. Thus, implementing the RES approach could be of great use to different stakeholders in designing appropriate mitigation measures against floods and landslides.
Funding
This research received no external funding.
Data Availability Statement
Data are unavailable due to privacy and ethical restrictions.
Acknowledgments
The authors are grateful to the Regional Authority of Attica (Directorate of Technical Works) and Hellenic Survey for Geology and Mineral Exploration (H.S.G.M.E.), for providing valuable technical reports as well as crucial digital geodata records.
Conflicts of Interest
The author declares no conflict of interest.
References
- Abdi, E.; Saleh, H.; Majnonian, B.; Deljouei, A. Soil fixation and erosion control by Haloxylon persicum roots in arid lands, Iran. J. Arid Land 2019, 11, 86–96. [Google Scholar] [CrossRef]
- Karimi, Z.; Abdi, E.; Deljouei, A.; Cislaghi, A.; Shirvany, A.; Schwarz, M.; Hales, T.C. Vegetation-induced soil stabilization in coastal area: An example from a natural mangrove forest. Catena 2022, 216, 106410. [Google Scholar] [CrossRef]
- Borrelli, P.; Poesen, J.; Vanmaerckee, M.; Ballabiof, C.; Hervás, J.; Maerkera, M.; Scarpa, S.; Panagos, P. Monitoring gully erosion in the European Union: A novel approach based on the Land Use/Cover Area frame survey (LUCAS). Int. Soil Water Conserv. Res. 2021, 10, 17–28. [Google Scholar] [CrossRef]
- Panagos, P.; Van Liedekerke, M.; Jones, A.; Montanarella, L. European Soil Data Centre: Response to European policy support and public data requirements. Land Use Policy 2012, 29, 329–338. [Google Scholar] [CrossRef]
- Senanayake, S.; Pradhan, B.; Huete, A.; Brennan, J. A review on assessing and mapping soil erosion hazard using geo-informatics technology for farming system management. Remote Sens. 2020, 12, 4063. [Google Scholar] [CrossRef]
- Brandolini, F.; Kinnaird, T.C.; Srivastava, A.; Turner, S. Modelling the impact of historic landscape change on soil erosion and degradation. Sci. Rep. 2023, 13, 4949. [Google Scholar] [CrossRef] [PubMed]
- Gharechaee, H.; Samani, A.N.; Sigaroodi, S.K.; Baloochiyan, A.; Moosavi, M.S.; Hubbart, J.A.; Sadeghi, S.M.M. Land Subsidence Susceptibility Mapping Using Interferometric Synthetic Aperture Radar (InSAR) and Machine Learning Models in a Semiarid Region of Iran. Land 2023, 12, 843. [Google Scholar] [CrossRef]
- Rozos, D.; Skilodimou, H.; Loupasakis, C.; Bathrellos, G. Application of the revised universal soil loss equation model on landslide prevention. An example from N. Euboea (Evia) Island, Greece. Env. Earth Sci. 2013, 70, 3255–3266. [Google Scholar] [CrossRef]
- Karydas, C.G.; Panagos, P.; Gitas, I.Z. A classification of water erosion models according to their geospatial characteristics. Int. J. Digit. Earth 2014, 7, 229–250. [Google Scholar] [CrossRef]
- Teng, H.; Liang, Z.; Chen, S.; Liu, Y.; Viscarra Rossel, R.A.; Chappell, A.; Yu, W.; Shi, Z. Current and future assessments of soil erosion by water on the Tibetan Plateau based on RUSLE and CMIP5 climate models. Sci. Total Environ. 2018, 635, 673–686. [Google Scholar] [CrossRef]
- Wischmeier, W.; Smith, D. Predicting Rainfall Erosion Losses: A Guide to Conservation Planning. Agricultural Handbook No. 537; US Department of Agriculture: Washington, DC, USA, 1978.
- Renard, K.G.; Foster, G.R.; Weesies, G.A.; McCool, D.K.; Yoder, D.C. Predicting Soil Erosion by Water: A Guide to Conservation Planning with the Revised Universal Soil Loss Equation (RUSLE), Agricultural Handbook 703; US Department of Agriculture: Washington, DC, USA, 1997; p. 404.
- Panagos, P.; Borrelli, P.; Poesen, J.; Ballabio, C.; Lugato, E.; Meusburger, K.; Montanarella, L.; Alewell, C. The new assessment of soil loss by water erosion in Europe. Environ. Sci. Policy 2015, 54, 438–447. [Google Scholar] [CrossRef]
- Senanayake, S.; Pradhan, B.; Huete, A.; Brennan, J. Assessing soil erosion hazards using land-use change and landslide frequency ratio method: A case study of Sabaragamuwa Province, Sri Lanka. Remote Sens. 2020, 12, 1483. [Google Scholar] [CrossRef]
- Batista, P.V.G.; Davies, J.; Silva, M.L.N.; Quinton, J.N. On the evaluation of soil erosion models: Are we doing enough? Earth Sci. Rev. 2019, 197, 102898. [Google Scholar] [CrossRef]
- Gholami, V.; Sahour, H.; Hadian, A.; Mohammad, A. Soil erosion modeling using erosion pins and artificial neural networks. Catena 2021, 196, 104902. [Google Scholar] [CrossRef]
- Cohen, M.J.; Shepherd, K.D.; Walsh, M.G. Empirical reformulation of the universal soil loss equation for erosion risk assessment in a tropical watershed. Geoderma 2005, 124, 235–252. [Google Scholar] [CrossRef]
- Poesen, J. Soil Erosion in the Anthropocene: Research Needs. Earth Surf. Process. Landf. 2018, 43, 64–84. [Google Scholar] [CrossRef]
- Arabameri, A.; Pradhan, B.; Rezaei, K.; Yamani, M.; Pourghasemi, H.R.; Lombardo, L. Spatial modelling of gully erosion using evidential belief function, logistic regression, and a new ensemble of evidential belief function-logistic regression algorithm. Land Degrad. Dev. 2018, 29, 4035–4049. [Google Scholar] [CrossRef]
- Conforti, M.; Aucelli, P.P.C.; Robustelli, G.; Scarciglia, F. Geomorphology and GIS analysis for mapping gully erosion susceptibility in the Turbolo stream catchment (Northern Calabria, Italy). Nat. Hazards 2011, 56, 881–898. [Google Scholar] [CrossRef]
- Conoscenti, C.; Angileri, S.; Cappadonia, C.; Rotigliano, E.; Agnesi, V.; Märker, M. Gully erosion susceptibility assessment by means of GIS-based logistic regression: A case of Sicily (Italy). Geomorphology 2014, 204, 399–411. [Google Scholar] [CrossRef]
- Arabameri, A.; Cerda, A.; Tiefenbacher, J.P. Spatial pattern analysis and prediction of gully erosion using novel hybrid model of entropy-weight of evidence. Water 2019, 11, 1129. [Google Scholar] [CrossRef]
- Arabameri, A.; Cerda, A.; Pradhan, B.; Tiefenbacher, J.P.; Lombardo, L.; Bui, D.T. A methodological comparison of head-cut based gully erosion susceptibility models: Combined use of statistical and artificial intelligence. Geomorphology 2020, 359, 107136. [Google Scholar] [CrossRef]
- Meliho, M.; Khattabi, A.; Mhammdi, N. A GIS-based approach for gully erosion susceptibility modelling using bivariate statistics methods in the Ourika watershed, Morocco. Environ. Earth Sci. 2018, 77, 655. [Google Scholar] [CrossRef]
- Rahmati, O.; Haghizadeh, A.; Pourghasemi, H.R.; Noormohamadi, F. Gully erosion susceptibility mapping: The role of GIS-based bivariate statistical models and their comparison. Nat. Hazards 2016, 82, 1231–1258. [Google Scholar] [CrossRef]
- Angileri, S.E.; Conoscenti, C.; Hochschild, V.; Märker, M.; Rotigliano, E.; Agnesi, V. Water erosion susceptibility mapping by applying Stochastic Gradient Treeboost to the Imera Meridionale River Basin (Sicily, Italy). Geomorphology 2016, 262, 61–76. [Google Scholar] [CrossRef]
- Svoray, T.; Michailov, E.; Cohen, A.; Rokah, L.; Sturm, A. Predicting gully initiation: Comparing data mining techniques, analytical hierarchy processes and the topographic threshold. Earth Surf. Process. Landf. 2012, 37, 607–619. [Google Scholar] [CrossRef]
- Eustace, A.H.; Pringle, M.J.; Denham, R.J. A risk map for gully locations in central Queensland, Australia. Eur. J. Soil Sci. 2011, 62, 431–441. [Google Scholar] [CrossRef]
- Rahmati, O.; Tahmasebipour, N.; Haghizadeh, A.; Pourghasemi, H.R.; Feizizadeh, B. Evaluation of different machine learning models for predicting and mapping the susceptibility of gully erosion. Geomorphology 2017, 298, 118–137. [Google Scholar] [CrossRef]
- Arabameri, A.; Rezaei, K.; Cerda, A.; Lombardo, L.; Rodrigo-Comino, J. GIS-based groundwater potential mapping in Shahroud plain, Iran. A comparison among statistical (bivariate and multivariate), data mining and MCDM approaches. Sci. Total Environ. 2019, 658, 160–177. [Google Scholar] [CrossRef]
- Pourghasemi, H.R.; Yousefi, S.; Kornejady, A.; Cerdà, A. Performance assessment of individual and ensemble data-mining techniques for gully erosion modeling. Sci. Total Environ. 2017, 609, 764–775. [Google Scholar] [CrossRef]
- Yang, A.; Wang, C.; Pang, G.; Long, Y.; Wang, L.; Cruse, R.M.; Yang, Q. Gully Erosion Susceptibility Mapping in Highly Complex Terrain Using Machine Learning Models. ISPRS Int. J. Geo-Inf. 2021, 10, 680. [Google Scholar] [CrossRef]
- Huang, F.; Chen, J.; Du, Z.; Yao, C.; Huang, J.; Jiang, Q.; Chang, Z.; Li, S. Landslide susceptibility prediction considering regional soil erosion based on machine-learning models. ISPRS Int. J. Geo-Inf. 2020, 9, 377. [Google Scholar] [CrossRef]
- Brunsden, D.; Prior, D.B. Slope Instability; Wiley: Singapore, 1984. [Google Scholar]
- Lim, R.P.; Lee, S.W. Hill development. In Proceedings of the Seminar, Malaysian Nature Society, Kuala Lumpur, Malaysia, 1 July–12 August 1992. [Google Scholar]
- Gartner, J.E.; Bigio, E.R.; Cannon, S.H. Compilation of Postwildfire Runoff-Event Data from the Western United States. Open- File Report (United States Geological Survey) 04-1085. 2004. Available online: http://pubs.usgs.gov/of/2004/1085.html (accessed on 6 October 2023).
- Nyssen, J.; Poesen, J.; Moeyersons Layeten, E.; Veyret-Picot, M.; Deckers, J.; Haile, M.; Govers, G. Impact of Road Building on Gully Erosion Risk: A Case Study from the Northern Ethiopian Highlands. Earth Surf. Process. Landf. 2002, 1283, 1267–1283. [Google Scholar] [CrossRef]
- Lee, S. Soil erosion assessment and its verification using the universal soil loss equation and geographic information system: A case study at Boun, Korea. Environ. Geol. 2004, 45, 457–465. [Google Scholar] [CrossRef]
- Pradhan, B.; Chaudhari, A.; Adinarayana, J.; Buchroithner, M.F. Soil erosion assessment and its correlation with landslide events using remote sensing data and GIS: A case study at Penang Island, Malaysia. Environ. Monit Assess 2012, 184, 715–727. [Google Scholar] [CrossRef] [PubMed]
- Yuan-jun, J.; Alam, M.; Li-Jun, S.; Umar, M.; Sadiq, S.; Jia, L.J.; Rahman, M. Effect of root orientation on the strength characteristics of loess in drained and undrained triaxial tests. Eng. Geol. 2022, 296, 106459. [Google Scholar] [CrossRef]
- Lian, B.; Peng, J.; Zhan, H.; Huang, Q.; Wang, X.; Hu, S. Formation mechanism analysis of irrigation-induced retrogressive loess landslides. Catena 2020, 195, 104441. [Google Scholar] [CrossRef]
- Swanson, F.J.; Dyrness, C. Impact of clear-cutting and road construction on soil erosion by landslides in the western Cascade Range, Oregon. Geology 1975, 3, 393–396. [Google Scholar] [CrossRef]
- Wang, X.; Wang, J.; Zhan, H.; Li, P.; Qiu, H.; Hu, S. Moisture content effect on the creep behavior of loess for the catastrophic Baqiao landslide. Catena 2020, 187, 104371. [Google Scholar] [CrossRef]
- Shen, P.; Zhang, L.M.; Chen, H.; Gao, L. Role of vegetation restoration in mitigating hillslope erosion and debris flows. Eng. Geol. 2017, 216, 122–133. [Google Scholar] [CrossRef]
- Wu, L.; Zhang, L.M.; Zhou, Y.; Xu, Q.; Yu, B.; Liu, G.; Bai, L. Theoretical analysis and model test for rainfall-induced shallow landslides in the red-bed area of Sichuan. Bull. Eng. Geol. Environ. 2018, 77, 1343–1353. [Google Scholar]
- Acharya, G.; Cochrane, T.; Davies, T.; Bowman, E. Quantifying and modeling post-failure sediment yields from laboratory-scale soil erosion and shallow landslide experiments with silty loess. Geomorphology 2011, 129, 49–58. [Google Scholar] [CrossRef]
- Belayneh, L.; Dewitte, O.; Gulie, G.; Poesen, J.; O’Hara, D.; Kassaye, A.; Endale, T.; Kervyn, M. Landslides and Gullies Interact as Sources of Lake Sediments in a Rifting Context: Insights from a Highly Degraded Mountain Environment. Geosciences 2022, 12, 274. [Google Scholar] [CrossRef]
- Mackey, B.H.; Roering, J.J. Sediment Yield, Spatial Characteristics, and the Long-Term Evolution of Active Earthflows Determined from Airborne LiDAR and Historical Aerial Photographs, Eel River, California. Bull. Geol. Soc. Am. 2011, 123, 1560–1576. [Google Scholar] [CrossRef]
- Kubwimana, D.; Ait Brahim, L.; Nkurunziza, P.; Dille, A.; Depicker, A.; Nahimana, L.; Abdelouafi, A.; Dewitte, O. Characteristics and Distribution of Landslides in the Populated Hillslopes of Bujumbura, Burundi. Geosciences 2021, 11, 259. [Google Scholar] [CrossRef]
- Lin, W.T.; Lin, C.Y.; Chou, W.C. Assessment of vegetation recovery and soil erosion at landslides caused by a catastrophic earthquake: A case study in Central Taiwan. Ecol. Eng. 2006, 28, 79–89. [Google Scholar] [CrossRef]
- Kou, P.; Xu, Q.; Yunus, A.; Liu, J.; Xu, Y.; Wang, C.; Li, H.; Wei, Y.; Dong, X. Landslide-controlled soil erosion rate in the largest tableland on the Loess Plateau, China. Hum. Ecol. Risk Assess. Int. J. 2019, 26, 2478–2499. [Google Scholar] [CrossRef]
- Deljouei, A.; Cislaghi, A.; Abdi, E.; Borz, S.A.; Majnounian, B.; Hales, T.C. Implications of hornbeam and beech root systems on slope stability: From field and laboratory measurements to modelling methods. Plant Soil 2023, 483, 547–572. [Google Scholar] [CrossRef]
- Varnes, D.J. Slope Movement Types and Processes. In Landslides, Analysis and Control, Transportation Research Board; Special Report No. 176; Schuster, R.L., Krizek, R.J., Eds.; National Academy of Sciences: Washington, DC, USA, 1978; pp. 11–33. [Google Scholar]
- Tavoularis, N.; Papathanassiou, G.; Ganas, A.; Argyrakis, P. Development of the landslide susceptibility map of Attica Region, Greece based on the method of rock engineering system. Land J. 2021, 10, 148. [Google Scholar] [CrossRef]
- Wilde, M.; Günther, A.; Reichenbach, P.; Malet, J.P.; Hervás, J. Pan-European landslide susceptibility mapping: ELSUS Version 2. J. Maps 2018, 14, 97–104. [Google Scholar] [CrossRef]
- Li, Y.; Mo, P. A unified landslide classification system for loess slopes: A critical review. Geomorphology 2019, 340, 67–83. [Google Scholar] [CrossRef]
- Blasche, P.M.; Trustrum, N.A.; Hicks, D.L. Impacts of mass movement erosion on land productivity: A review. Prog. Phys. Geogr. Earth Environ. 2000, 24, 21–52. [Google Scholar] [CrossRef]
- Ayanlade, A.; Jegede, M.O.; Borisade, P.B. Geoinformatics in eco-climatic studies. In Encyclopedia of Information Science and Technology, 3rd ed.; Information Resources Management Association: Hershey, PA, USA, 2014; pp. 3136–3144. [Google Scholar]
- Dang, K.; Sassa, K.; Konagai, K.; Karunawardena, A.; Bandara, R.M.S.; Hirota, K.; Tan, Q.; Ha, N.D. Recent rainfall-induced rapid and long-traveling landslide on 17 May 2016 in Aranayaka, Kagelle District, Sri Lanka. Landslides 2019, 16, 155–164. [Google Scholar] [CrossRef]
- Stathis, D.; Karapidakis, E. Preliminary Reconnaissance Study of Hydrological and Forestry Works Torrent Management in the Wider Forest Area of Pateras Mountain, in the Area of Fichthi, Agios Dimitrios, Agios Vlasios (Mandra) & The Water Basin of the Volis Field of the Municipality of Megara; Forestry Directorate of Western Attica, Laboratory of Mountain Hydrology of the Department of Forestry and Natural Environment of the Faculty of Geotechnical Sciences of the Aristotle University of Thessaloniki: Thessaloniki, Greece, 2019. [Google Scholar]
- Regional Authority of Attica/Directorate of Technical Works, H.S.G.M.E. Integrated Geological Survey for the Reduction of Flood Risk in the Wider Region of Mandra, Attica–Measures for the Prevention and Mitigation of Flooding Phenomena, (Hellenic Survey for Geology and Mineral Exploration (H.S.G.M.E.)–Deliverable II (unpublished). 2018.
- Greece Republic, Region of Attica, Directorate for flood protection works, Hydroment Consulting Engineers S.A.–Kritsotakis G. Delimitation, Settlement and Damming of the Soures and Agia Aikaterini Streams North of the Town of Mandra, Unpublished technical report. 2021.
- COPERNICUS–Emergency Management Service–Mapping. EMSR257: Flood in Attika, Greece. Available online: https://emergency.copernicus.eu/mapping/list-of-components/EMSR257/ALL/EMSR257_01MANDRA (accessed on 6 October 2023).
- Lekkas, E.; Voulgaris, N.; Lozios, S. Flash Flood in West Attica (Mandra, Nea Peramos) 15 November 2017. Newsletter of Environmental, Disaster and Crisis Management Strategies Issue No 5, Hellenic Republic National & Kapodistrian University of Athens. Available online: https://edcm.edu.gr/images/docs/newsletters/Newsletter201705_Mandra-Floods-eng.pdf (accessed on 6 October 2023).
- Li, Z.; Fang, H. Impacts of climate change on water erosion: A review. Earth Sci. Rev. 2016, 163, 94–117. [Google Scholar] [CrossRef]
- Labrière, N.; Locatelli, B.; Laumonier, Y.; Freycon, V.; Bernoux, M. Soil erosion in the humid tropics: A systematic quantitative review. Agric. Ecosyst. Environ. 2015, 203, 127–139. [Google Scholar] [CrossRef]
- Tavoularis, N.; Bakogiorgos, E.; Bazis, L.; Pavlakos, G. Minutes of the 2nd Committee (Region of Attica, Directorate of Technical Works) for the monitoring and recording of the condition of streams after the floods of 15 November 2017 in Mandra, Attica (Unpublished Report). 2017. [Google Scholar]
- Marinos, P.; Plessas, S.; Valadaki-Plessa, K. Thematic maps on the risk assessment of erosion and sediment production in Attica. In Proceedings of the 4th Panhellenic Geographical Conference, Athens, Greece, 11–13 November 1998; pp. 584–616. [Google Scholar]
- Glade, T. Landslide occurrence as a response to land use change: A review of evidence from New Zealand. Catena 2003, 51, 297–314. [Google Scholar] [CrossRef]
- Reichenbach, P.; Galli, M.; Cardinali, M.; Guzzetti, F.; Ardizzone, F. Geomorphological mapping to assess landslide risk: Concepts, methods and applications in the Umbria region of central Italy. In Landslide Hazard and Risk; John Wiley & Sons Ltd.: Hoboken, NJ, USA, 2004; pp. 429–468. [Google Scholar]
- Vianello, D.; Vagnon, F.; Bonetto, S.; Mosca, P. Debris flow susceptibility mapping using the Rock Engineering System (RES) method: A case study. Landslides 2023, 20, 735–756. [Google Scholar] [CrossRef]
- Hudson, J. Rock Engineering Systems: Theory and Practice; Ellis Horwood Limited: Chichester, UK, 1992. [Google Scholar]
- Hudson, J. A Review of Rock Engineering Systems (RES) Applications over the Last 20 Years; Department of Earth Science and Engineering, Imperial College: London, UK, 2013. [Google Scholar]
- Tavoularis, N.; Koumantakis, I.; Rozos, D.; Koukis, G. An implementation of rock engineering system (RES) for ranking the instability potential of slopes in Greek territory. An application in Tsakona area (Peloponnese–Prefecture of Arcadia). Bull. Geol. Soc. Greece 2015, XLIX, 38–58. [Google Scholar] [CrossRef]
- Tavoularis, N.; Koumantakis, I.; Rozos, D.; Koukis, G. The contribution of landslide susceptibility factors through the use of Rock Engineering System (RES) to the prognosis of slope failures. An application in Panagopoula and Malakasa landslide areas in Greece. Geotech. Geol. Eng. J. 2018, 36, 1491–1508. [Google Scholar] [CrossRef]
- Brabb, E.; Bonilla, M.G.; Pampeyan, E. Landslide Susceptibility in San Mateo County, California, US Geological Survey Miscellaneous Field Studies, Map MF-360, Scale 1:62,500; US Geological Survey: Reston, VA, USA, 1972; reprinted in 1978.
- Varnes, D. IAEG Commission on Landslides and Other Mass-Movements. In Landslide Hazard Zonation: A Review of Principles and Practice; UNESCO Press: Paris, France, 1984; 63p. [Google Scholar]
- Gunther, A.; Reichenbach, P.; Wilde, M.; Jurchescu, M.; Malet, J.P.; Hervas, J. New perspectives on the Europe-wide landslide susceptibility assessment (ELSUS). In Proceedings of the 2nd EU Soil Observatory Stakeholders Forum, Virtual, 24–26 June 2022. [Google Scholar]
- Reichenbach, P.; Gunther, A.; Rossi, M. Susceptibility to mass movements at different scales. In Proceedings of the 2nd EU Soil Observatory Stakeholders Forum, Virtual, 24–26 June 2022. [Google Scholar]
- Tavoularis, N. Soil erosion and landslide susceptibility mapping using Rock Engineering System methodology. The case of Mandra fatal flash flood (2017) in Western Attica, Greece. In Proceedings of the 2nd EU Soil Observatory Stakeholders Forum, Virtual, 24–26 June 2022; Available online: https://esdac.jrc.ec.europa.eu/euso/presentations-2nd-euso-stakeholders-forum (accessed on 6 October 2023).
Figure 1.
The case study of the Mandra fatal flash flood (2017). The boundaries of the catchment areas in the wider study area are presented “Adapted with permission from Ref. [61]. 2018, Regional Authority of Attica/Directorate of Technical Works, H.S.G.M.E.”. The flooded area of Mandra city is depicted in a rectangular shape. In addition, the characteristic paths of the water and debris flow row from the upper part of the Pateras Mountain towards the Mandra city are appeared by blue arrows.

Figure 2.
Two views from the study area. A picture of the broader area of Mandra city is depicted, “Adapted with permission from Ref. [63]. 2017, Copernicus Emergency Management Service Mapping” and on the bottom right a characteristic view of the flooded Mandra–Elefsina road “Adapted with permission from Ref. [64]. 2017, Newsletter of Environmental, Disaster and Crisis Management Strategies Issue No 5, Hellenic Republic National & Kapodistrian University of Athens”.

Figure 3.
Geological map of the Mandra area.

Figure 4.
This photo shows rill erosion on Holocene deposits of the Mandra hydrological basin, and it is located in Figure 1 [67].

Figure 5.
These photos (a,b) show typical forms of gully erosion developed on Holocene deposits of the Mandra hydrological basin also shown in Figure 1 [67].

Figure 6.
Those photos (a–e), show typical forms of slope and subslope erosion developed on Holocene deposits of the Mandra hydrological basin, and they are also shown in Figure 1 [67].

Figure 7.
Soil erodibility map of the Mandra study area. Soil erosion lines were generated by the synthesis of three individual maps: (a) the engineering geological map, (b) the vegetation map, and (c) the morphological (slope) map “Adapted with permission from Ref. [61]. 2018, Hellenic Survey for Geology and Mineral Exploration (H.S.G.M.E.)”.


Figure 9.
The overall methodology used for the compilation of the landslide susceptibility map of the Attica Region.
Figure 9.
The overall methodology used for the compilation of the landslide susceptibility map of the Attica Region.

Figure 10.
Landslide susceptibility map of the Attica Region. The landslide susceptibility index (LSI) values in the susceptibility map were classified into five categories [76]: “Low–Middle”, with instability index (Ii) < 25 (light green color zone in the map), “High” with 25 < Ii < 42 (green color zone), “Very High” with 42 < Ii < 53 (yellow color zone), “Extremely High” with 53 < Ii < 70” (orange color zone), and “Landslide” with Ii > 70% (red color zone), [54]. The area inside the black rectangular scheme corresponds to the present study (Mandra area).

Figure 11.
Close-up of the area depicted in the rectangular shape on the previous (landslide susceptibility) map. Relation between soil erosion lines in black and the “High“, “Very High” and “Landslide” susceptibility zones.
Figure 11.
Close-up of the area depicted in the rectangular shape on the previous (landslide susceptibility) map. Relation between soil erosion lines in black and the “High“, “Very High” and “Landslide” susceptibility zones.

Figure 12.
From a characteristic broader view of the Mandra area, a partly soil erosion-degraded area (located west of the capital city of Athens, Greece) where a small dam is going to be constructed to cope with future (flash) flood events [80].
Figure 12.
From a characteristic broader view of the Mandra area, a partly soil erosion-degraded area (located west of the capital city of Athens, Greece) where a small dam is going to be constructed to cope with future (flash) flood events [80].


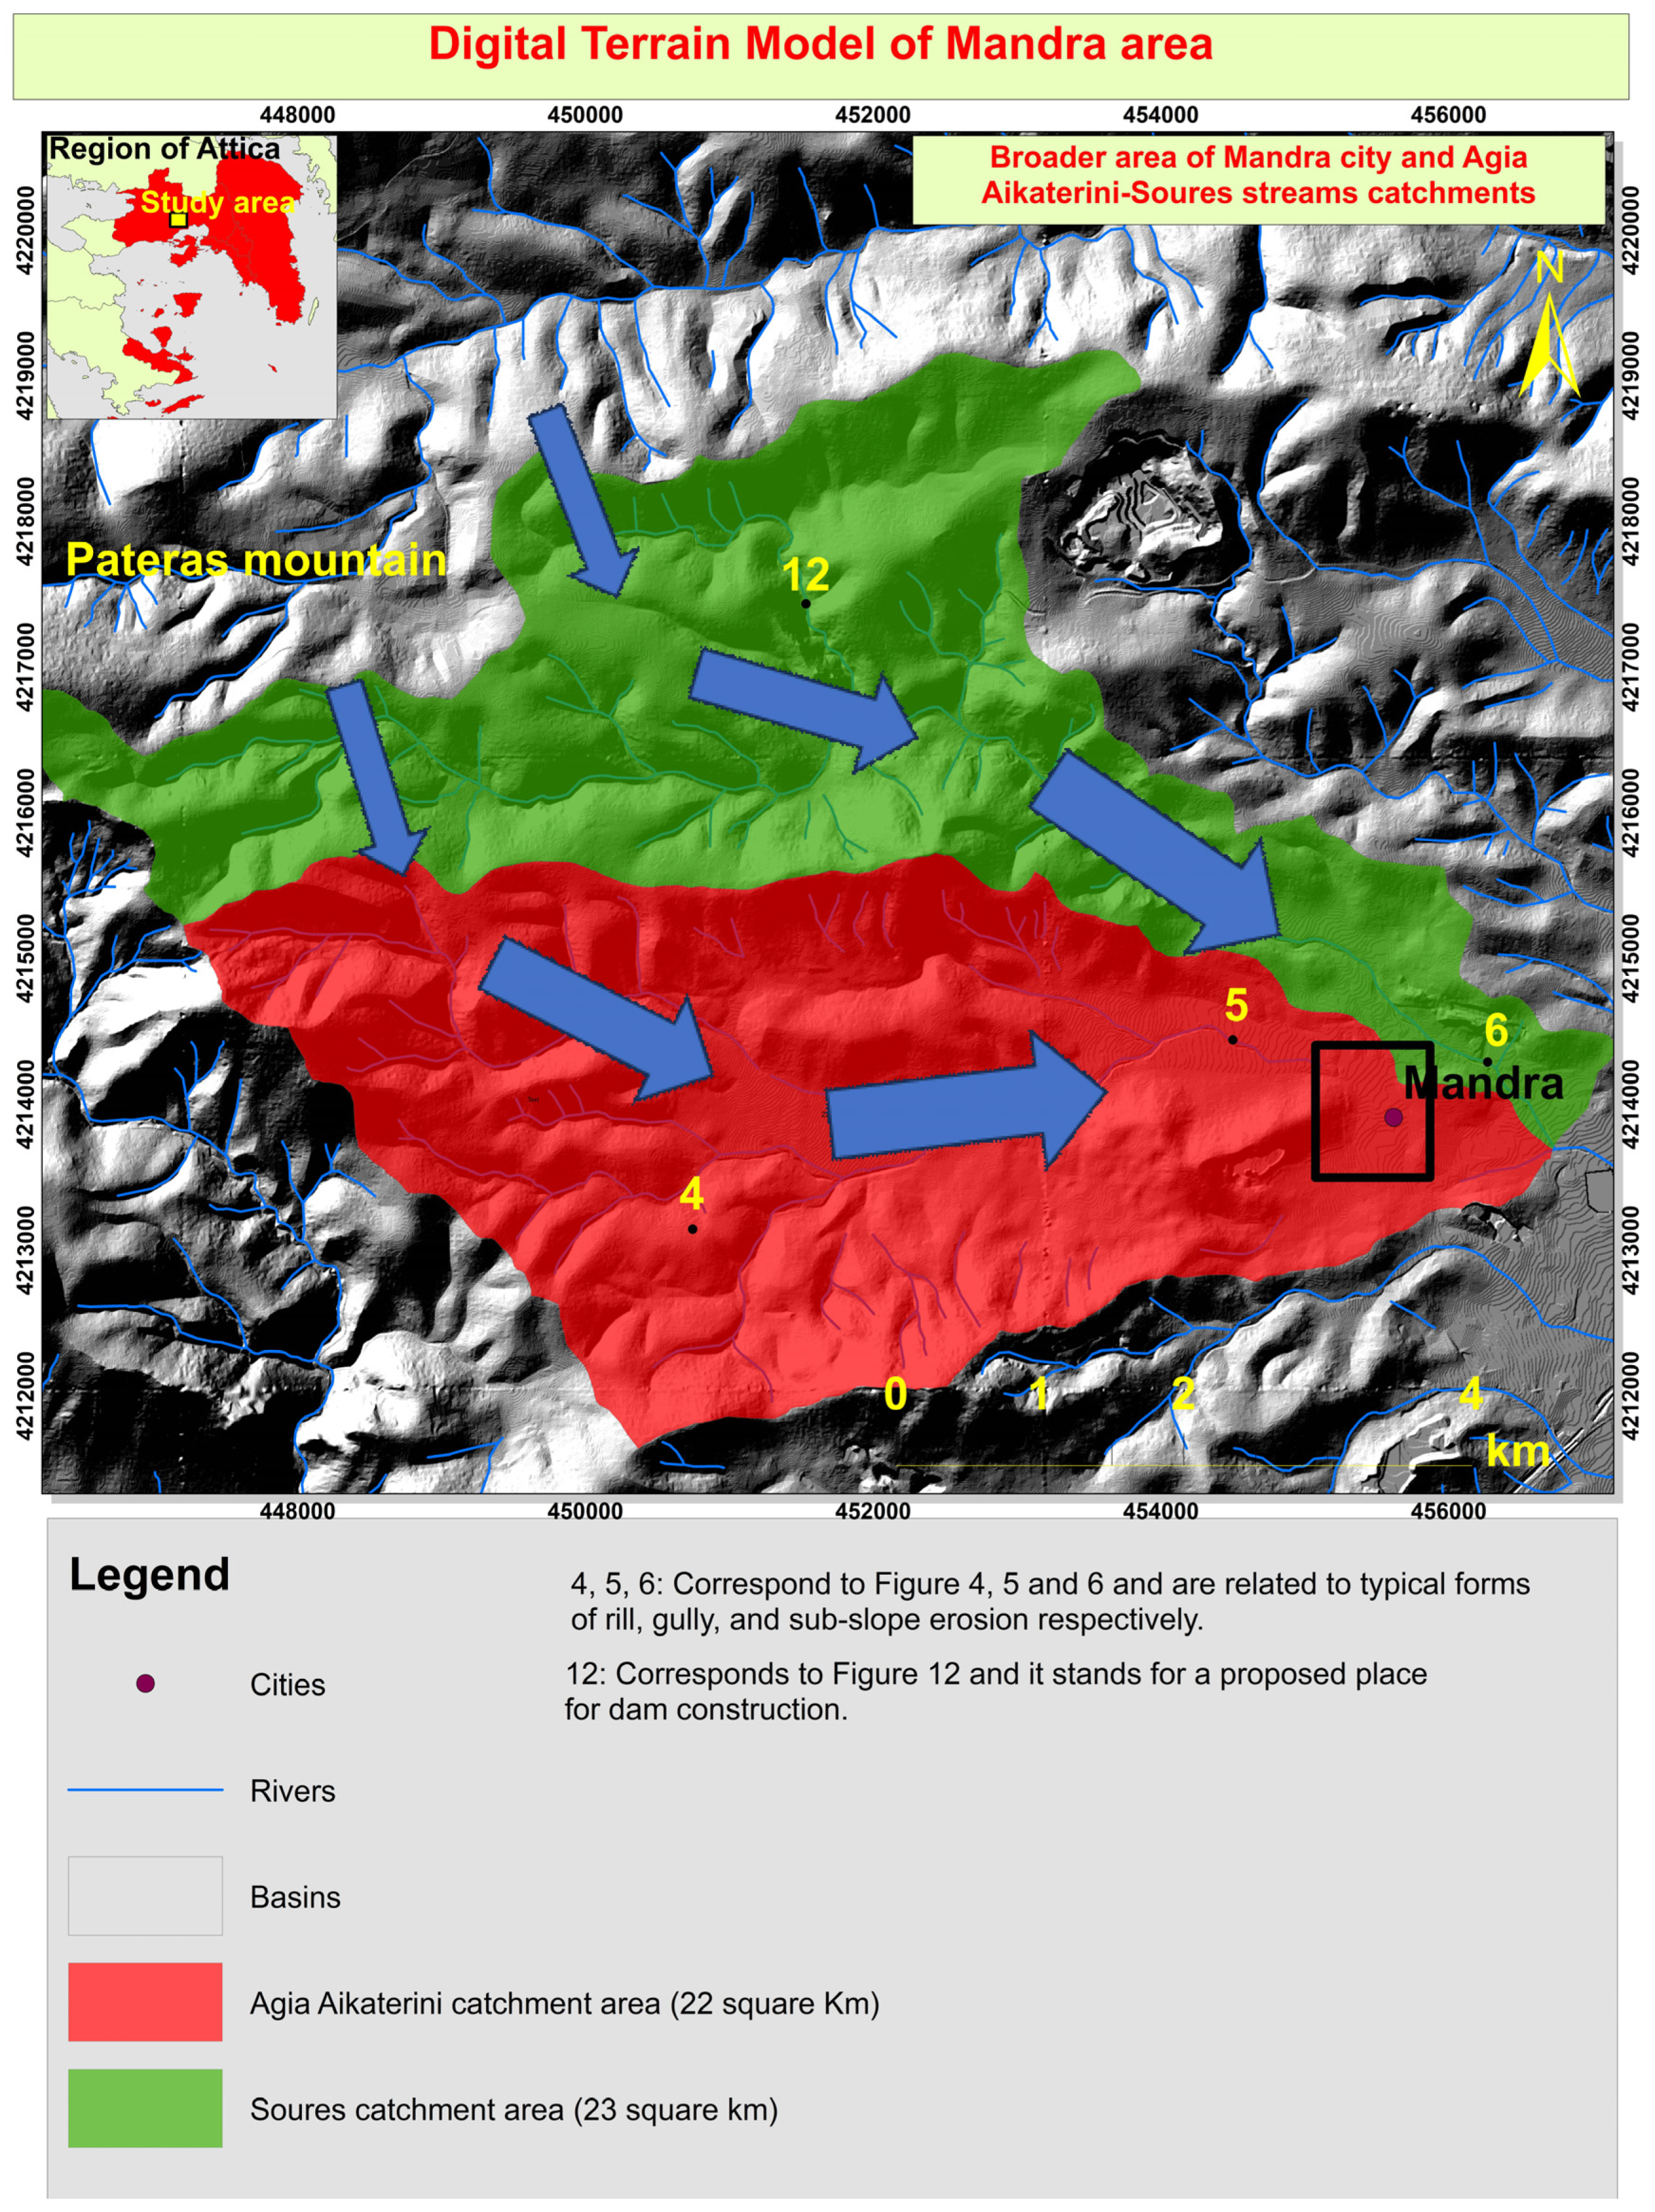
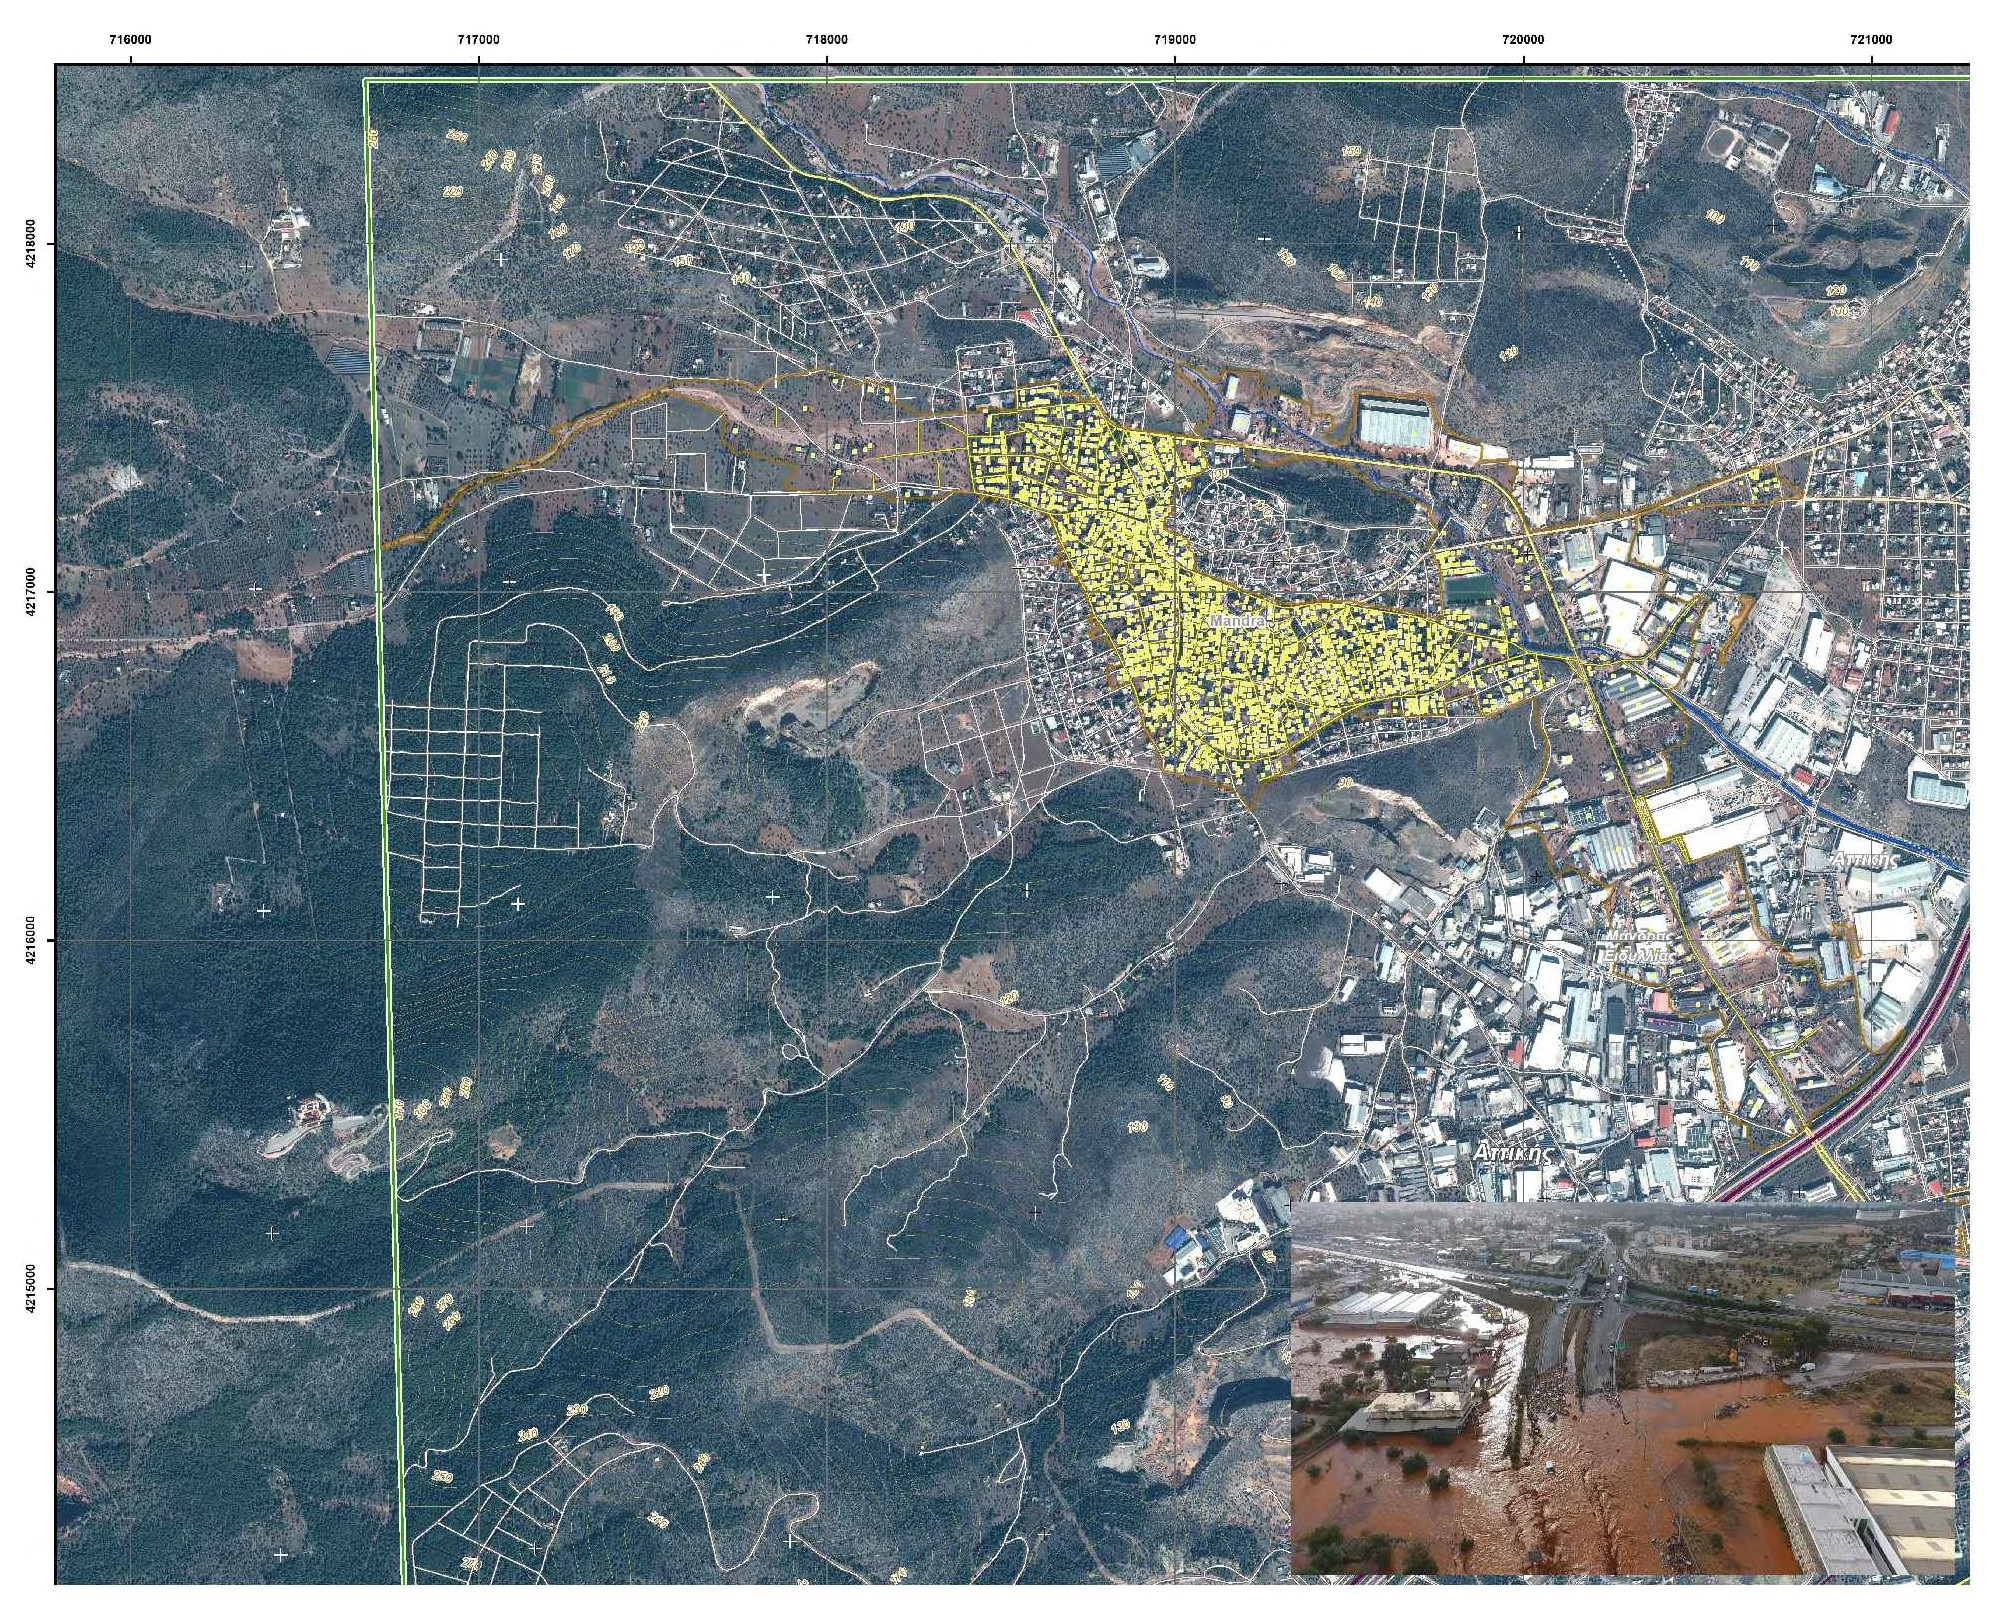
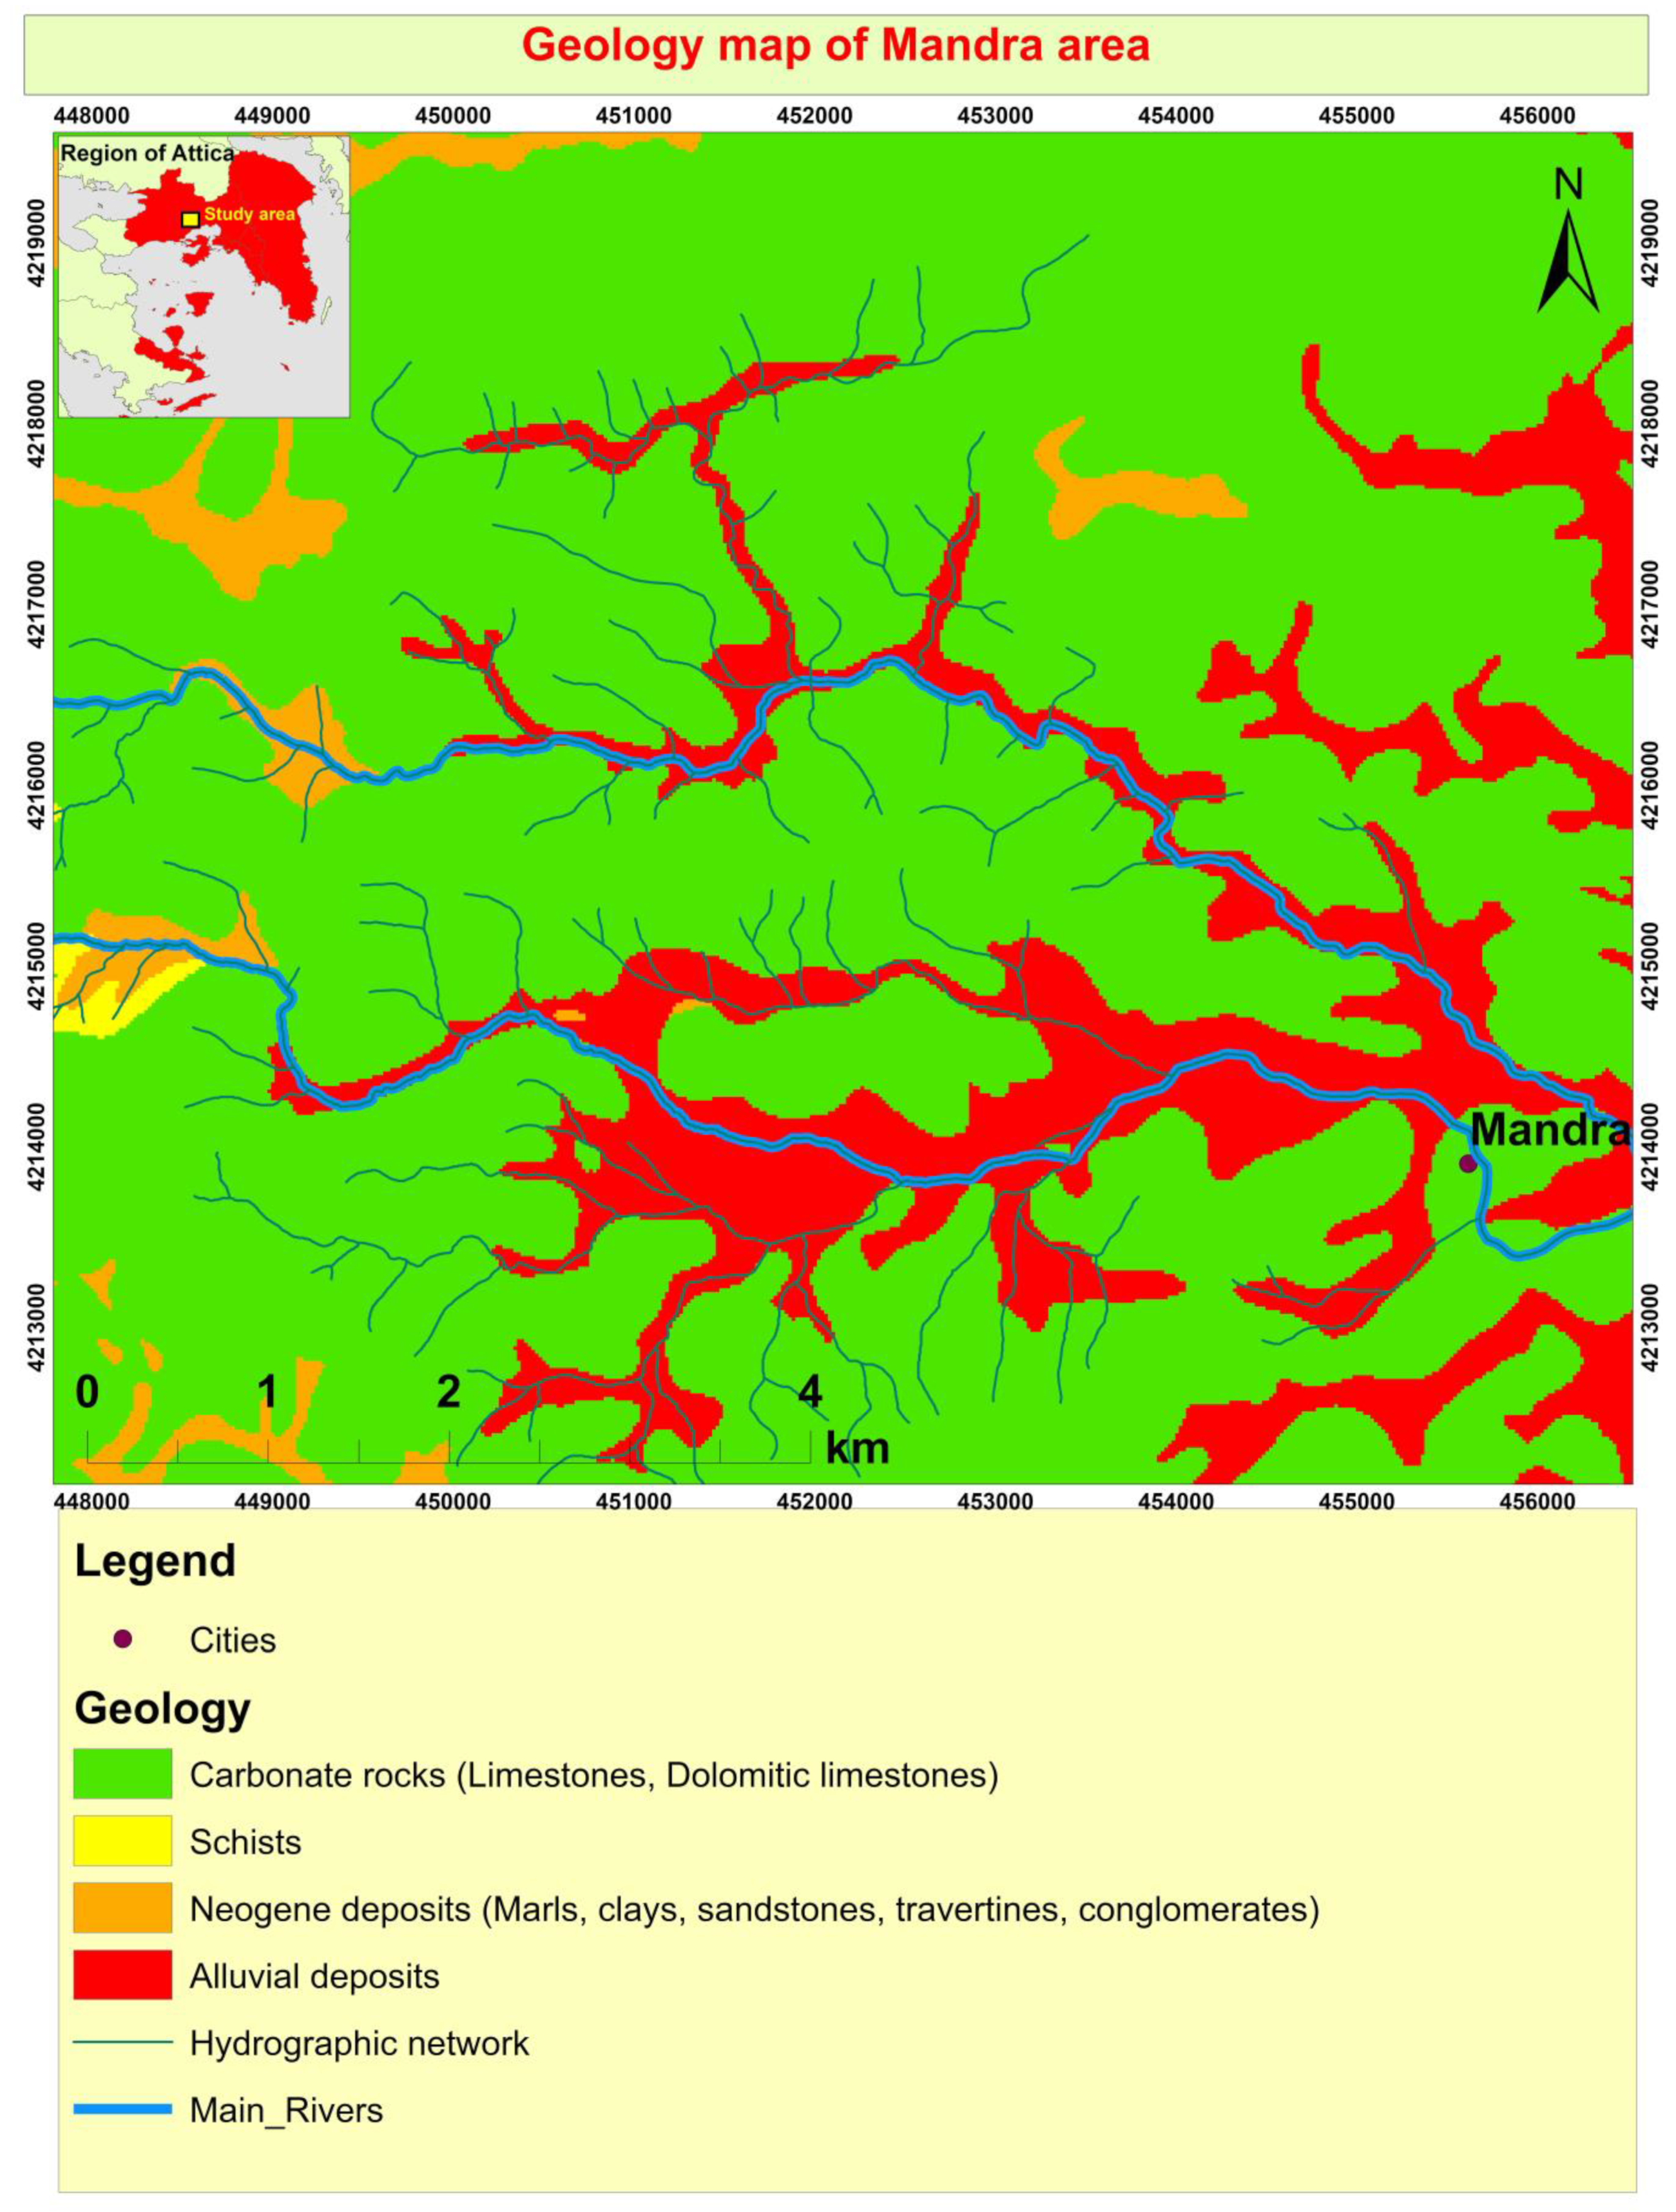
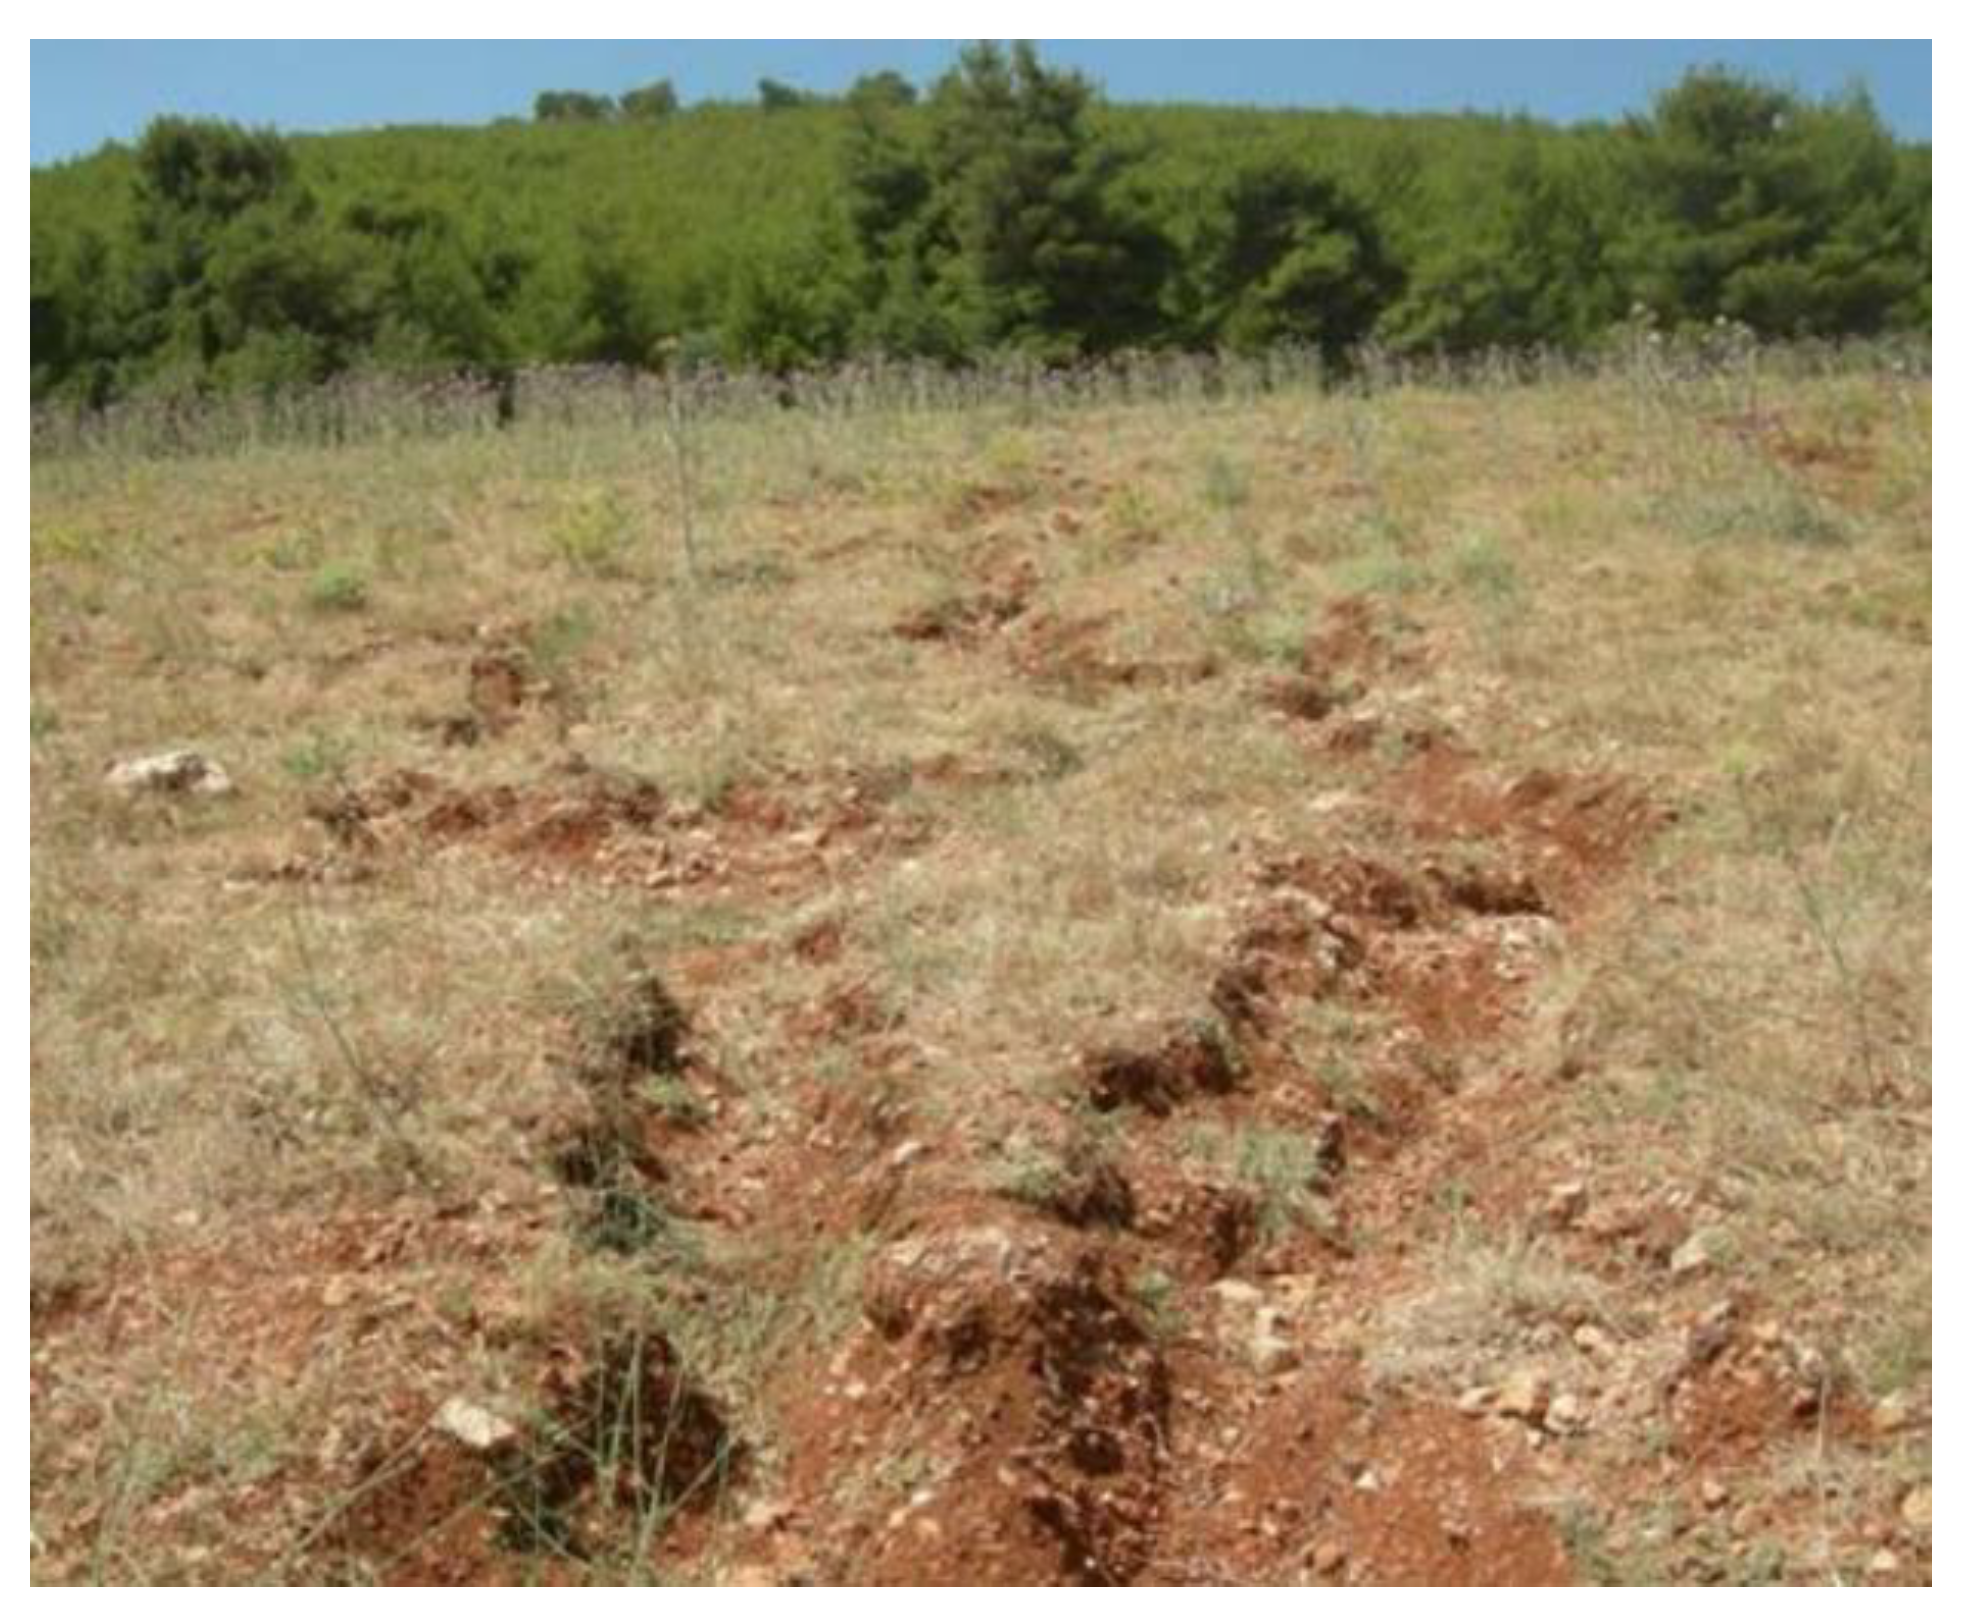
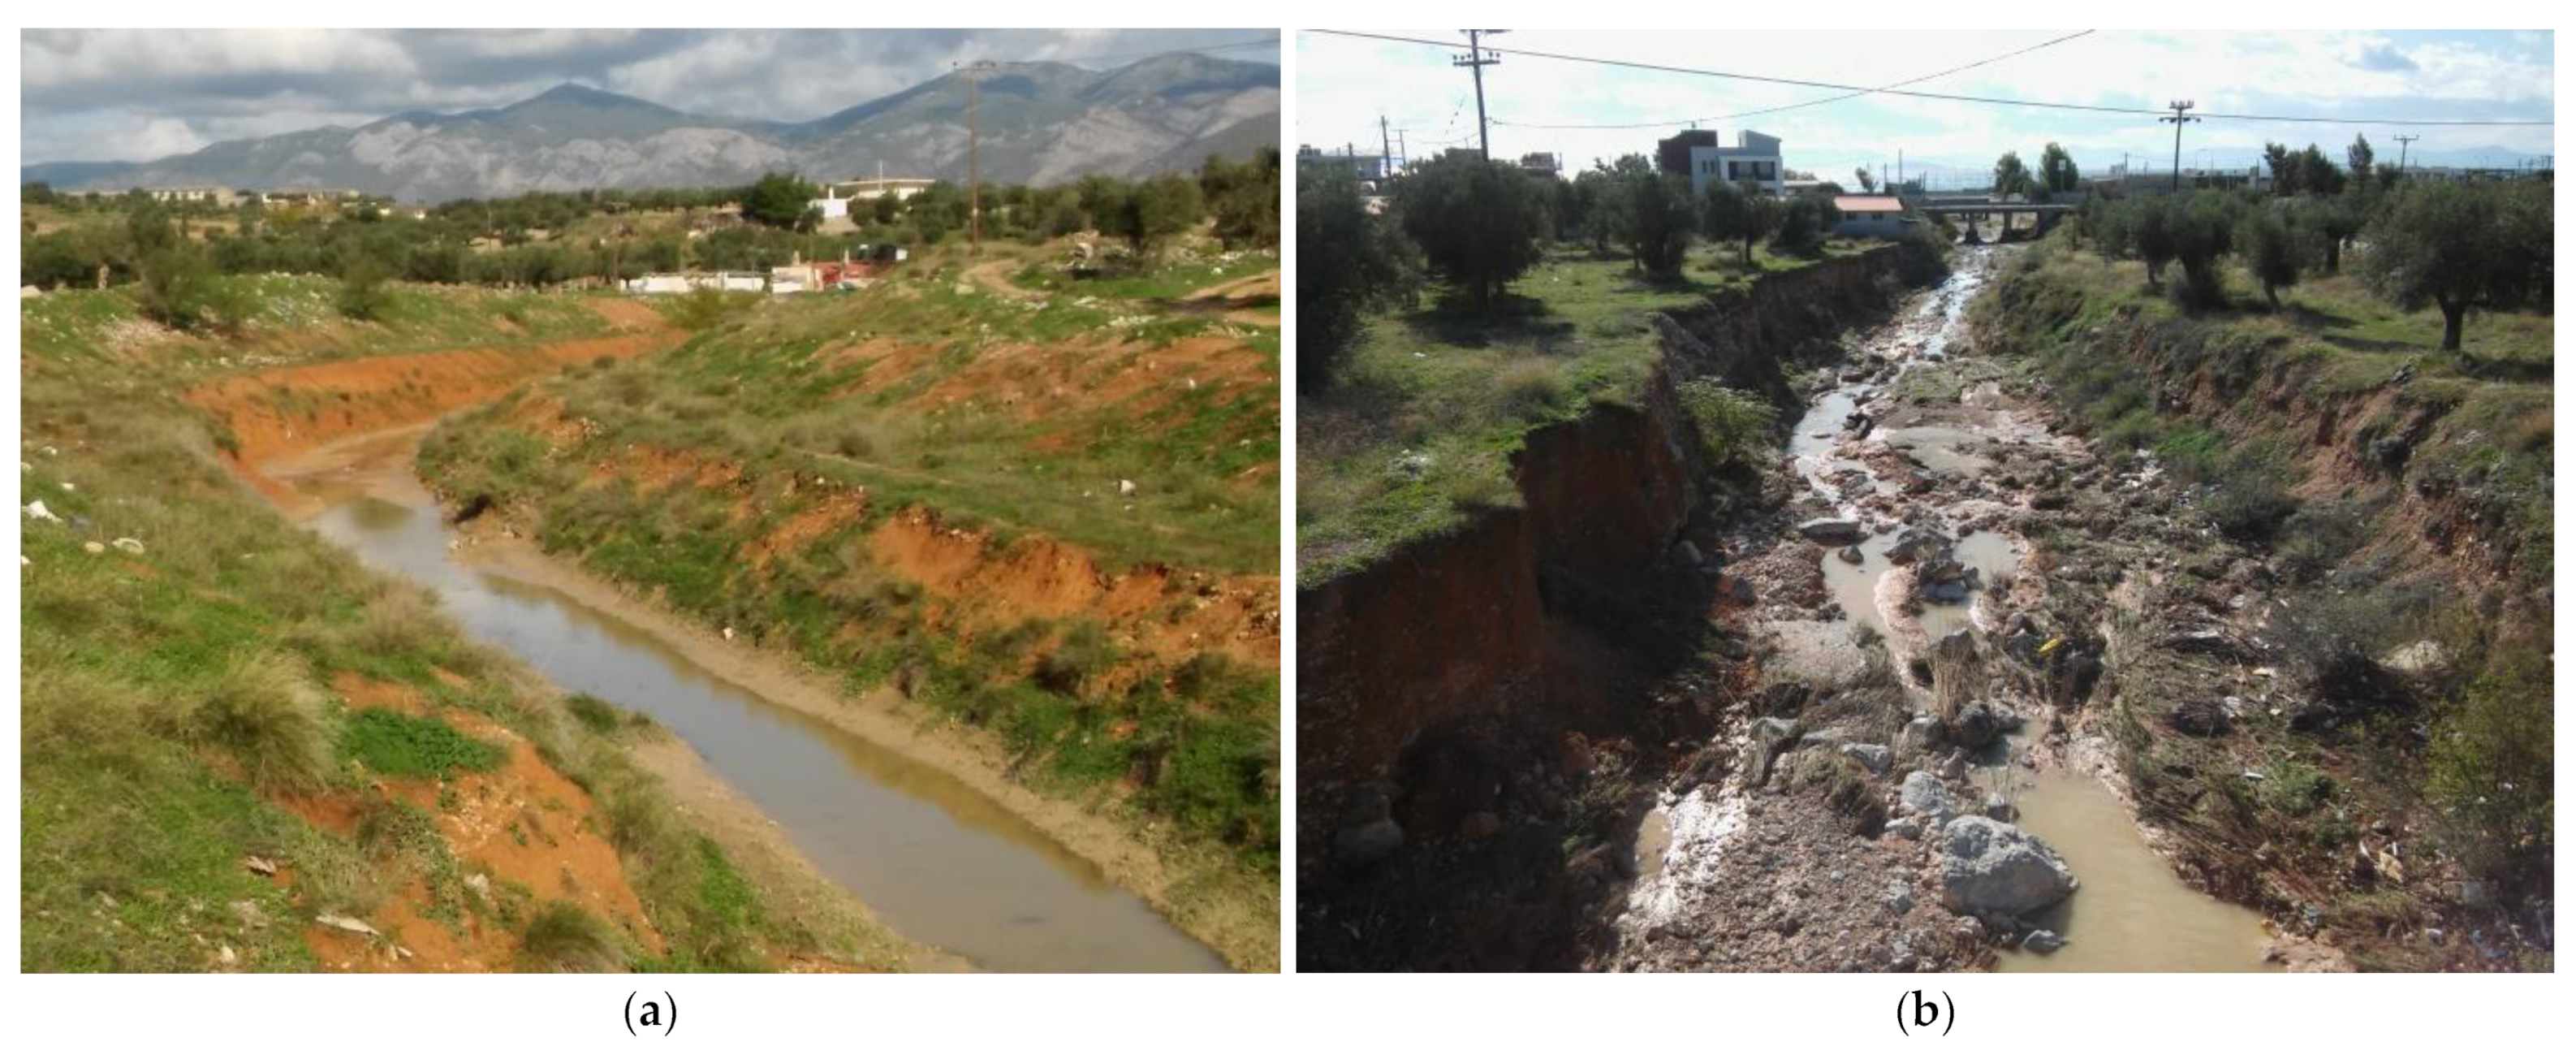
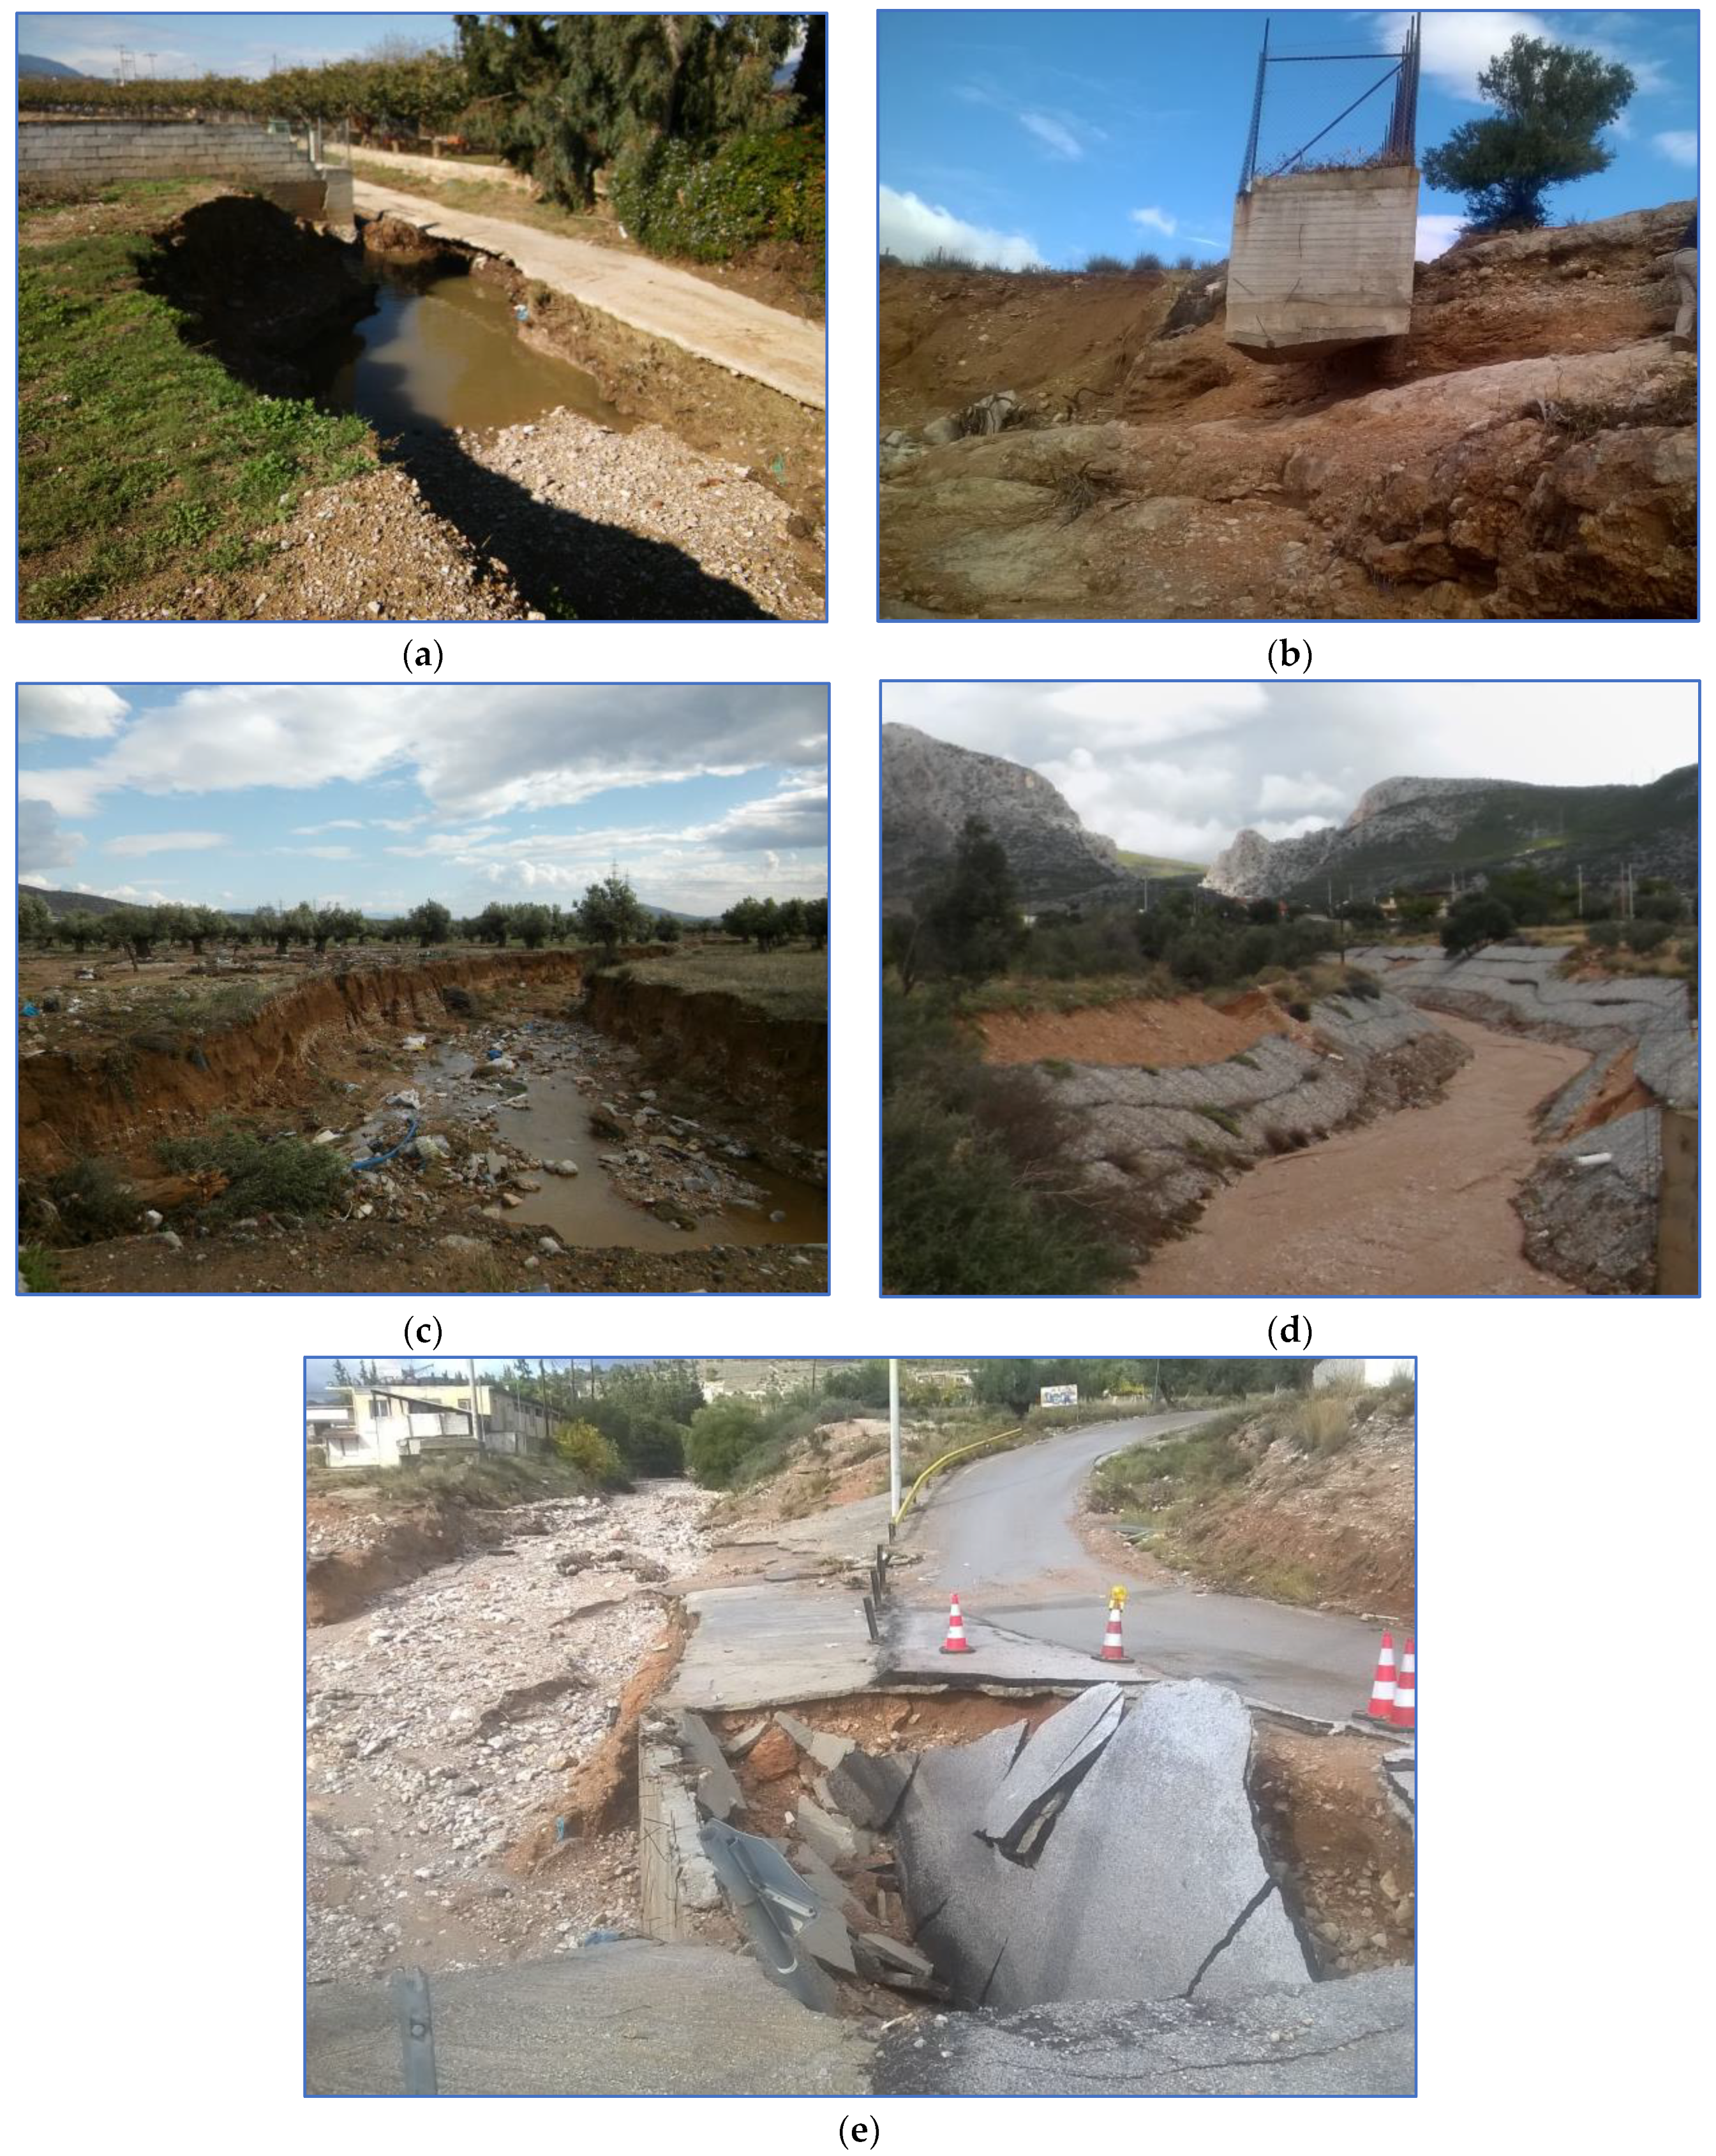
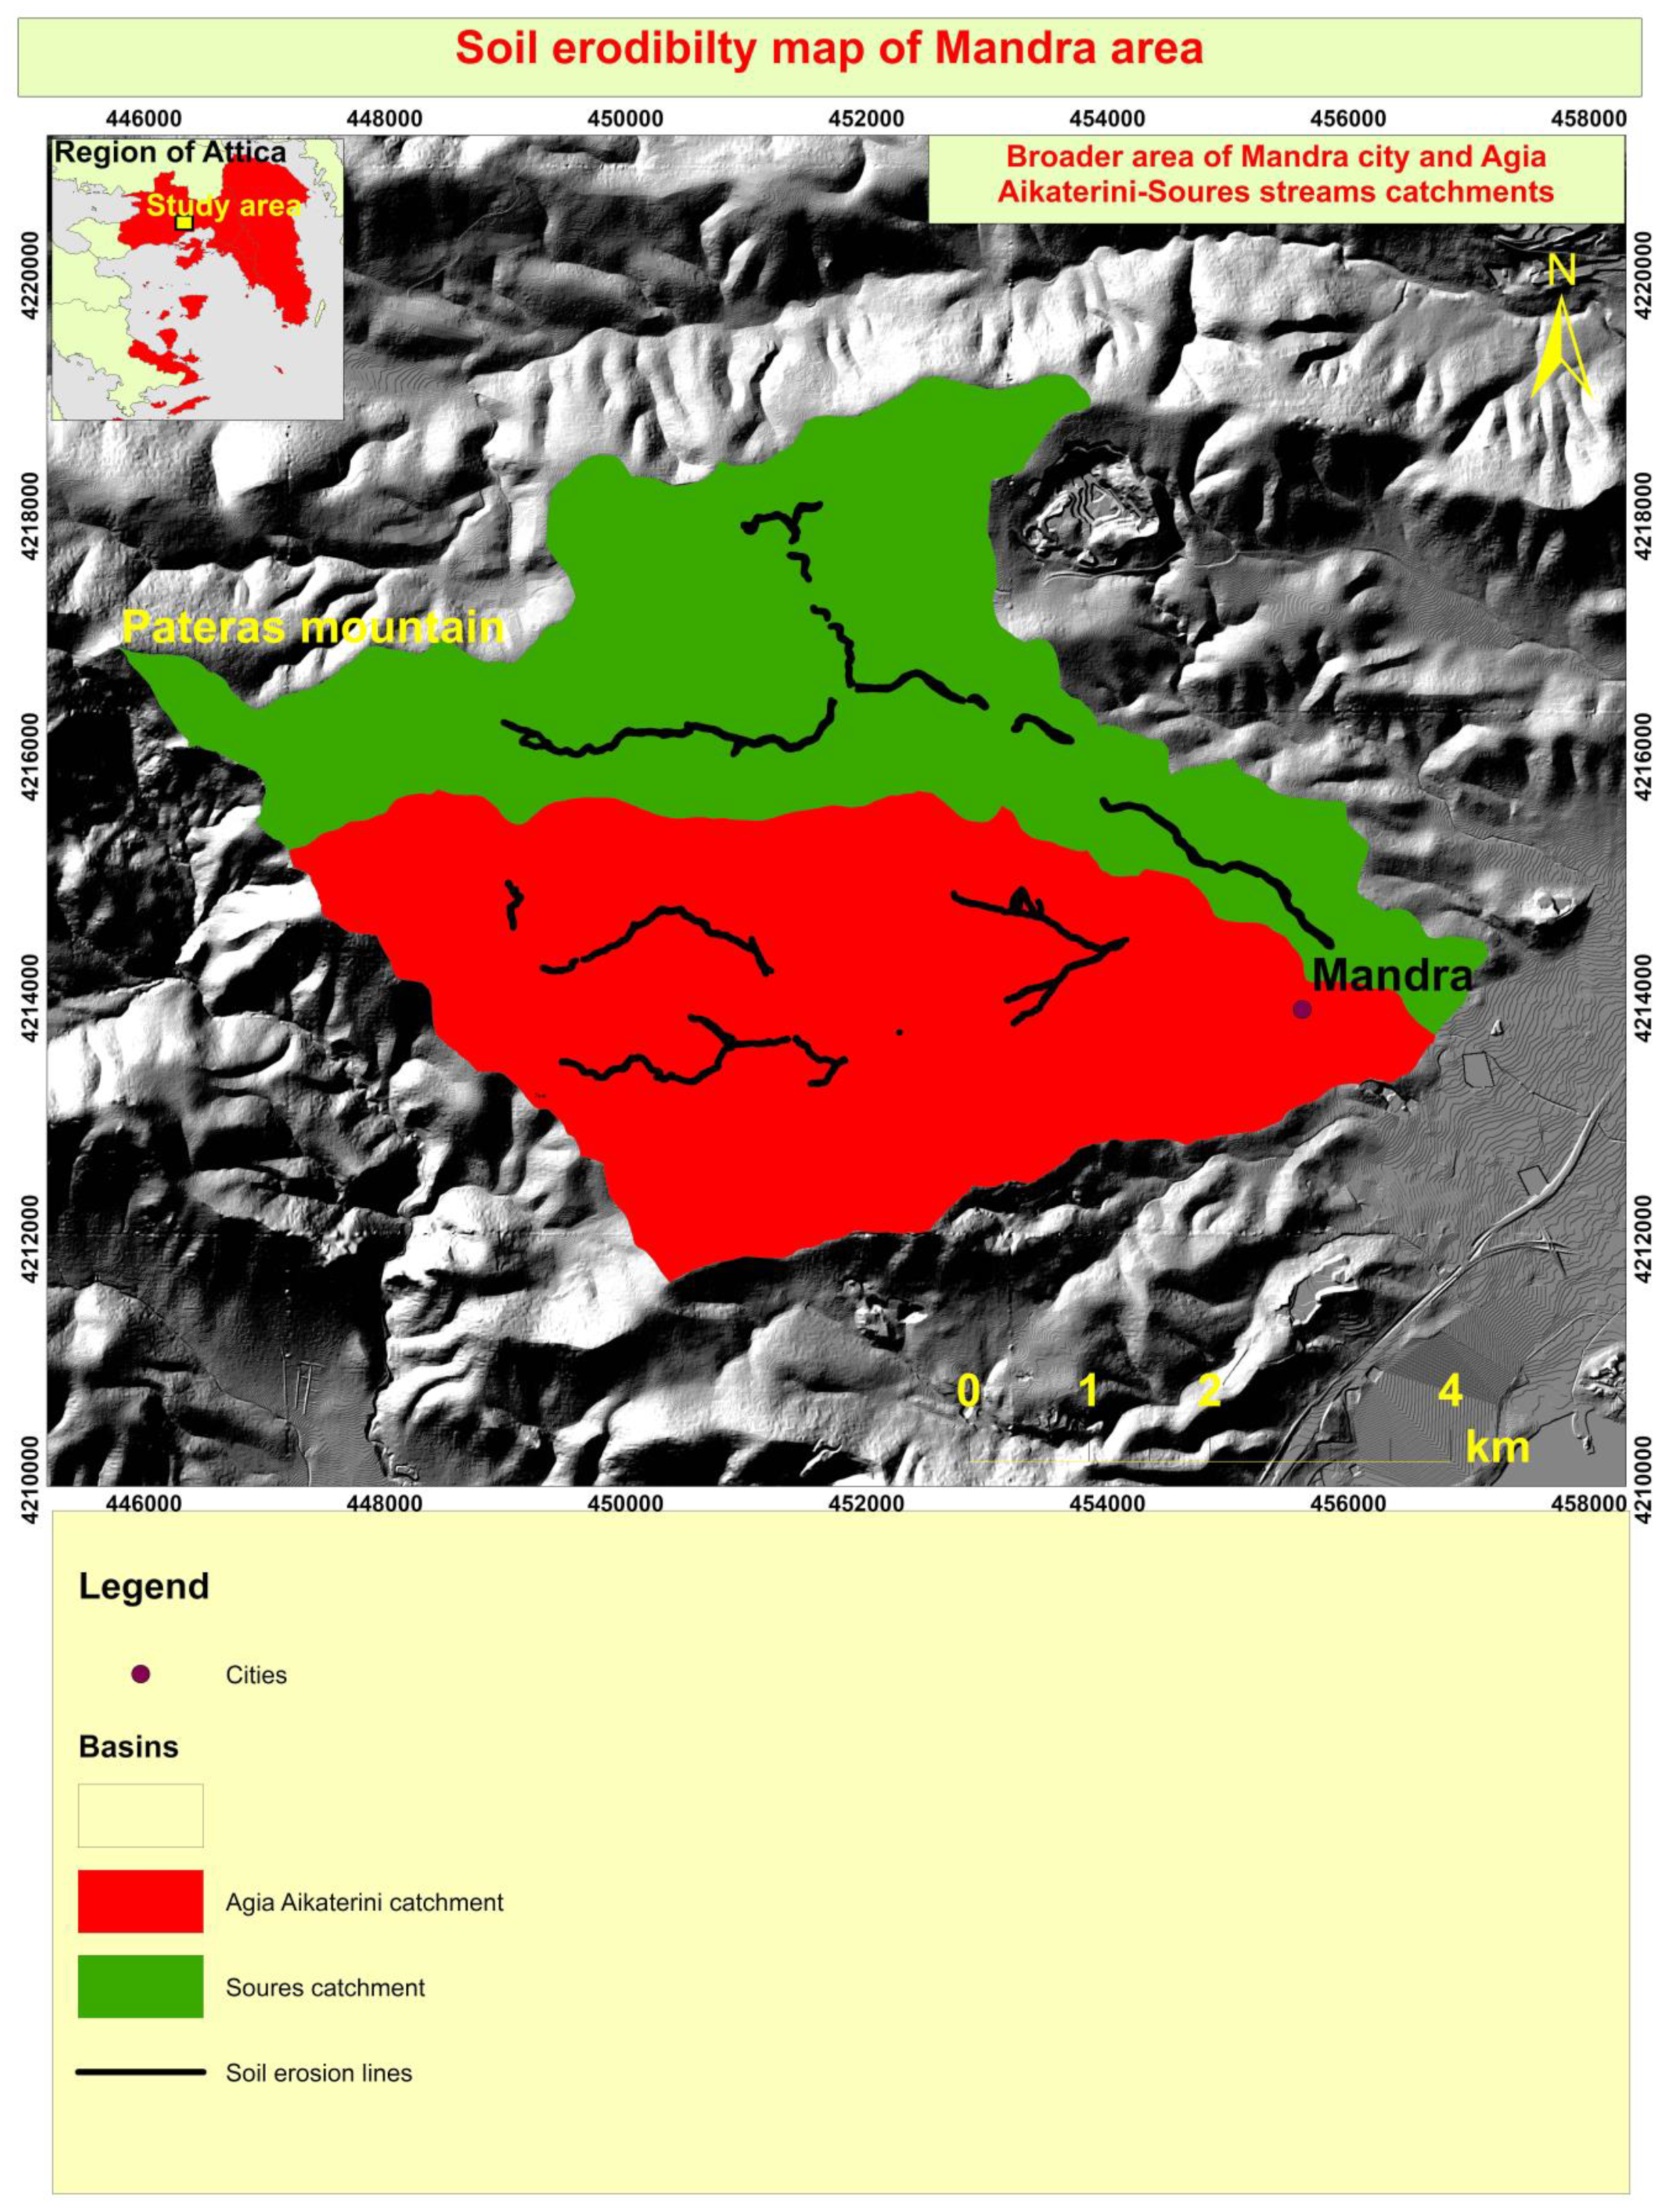
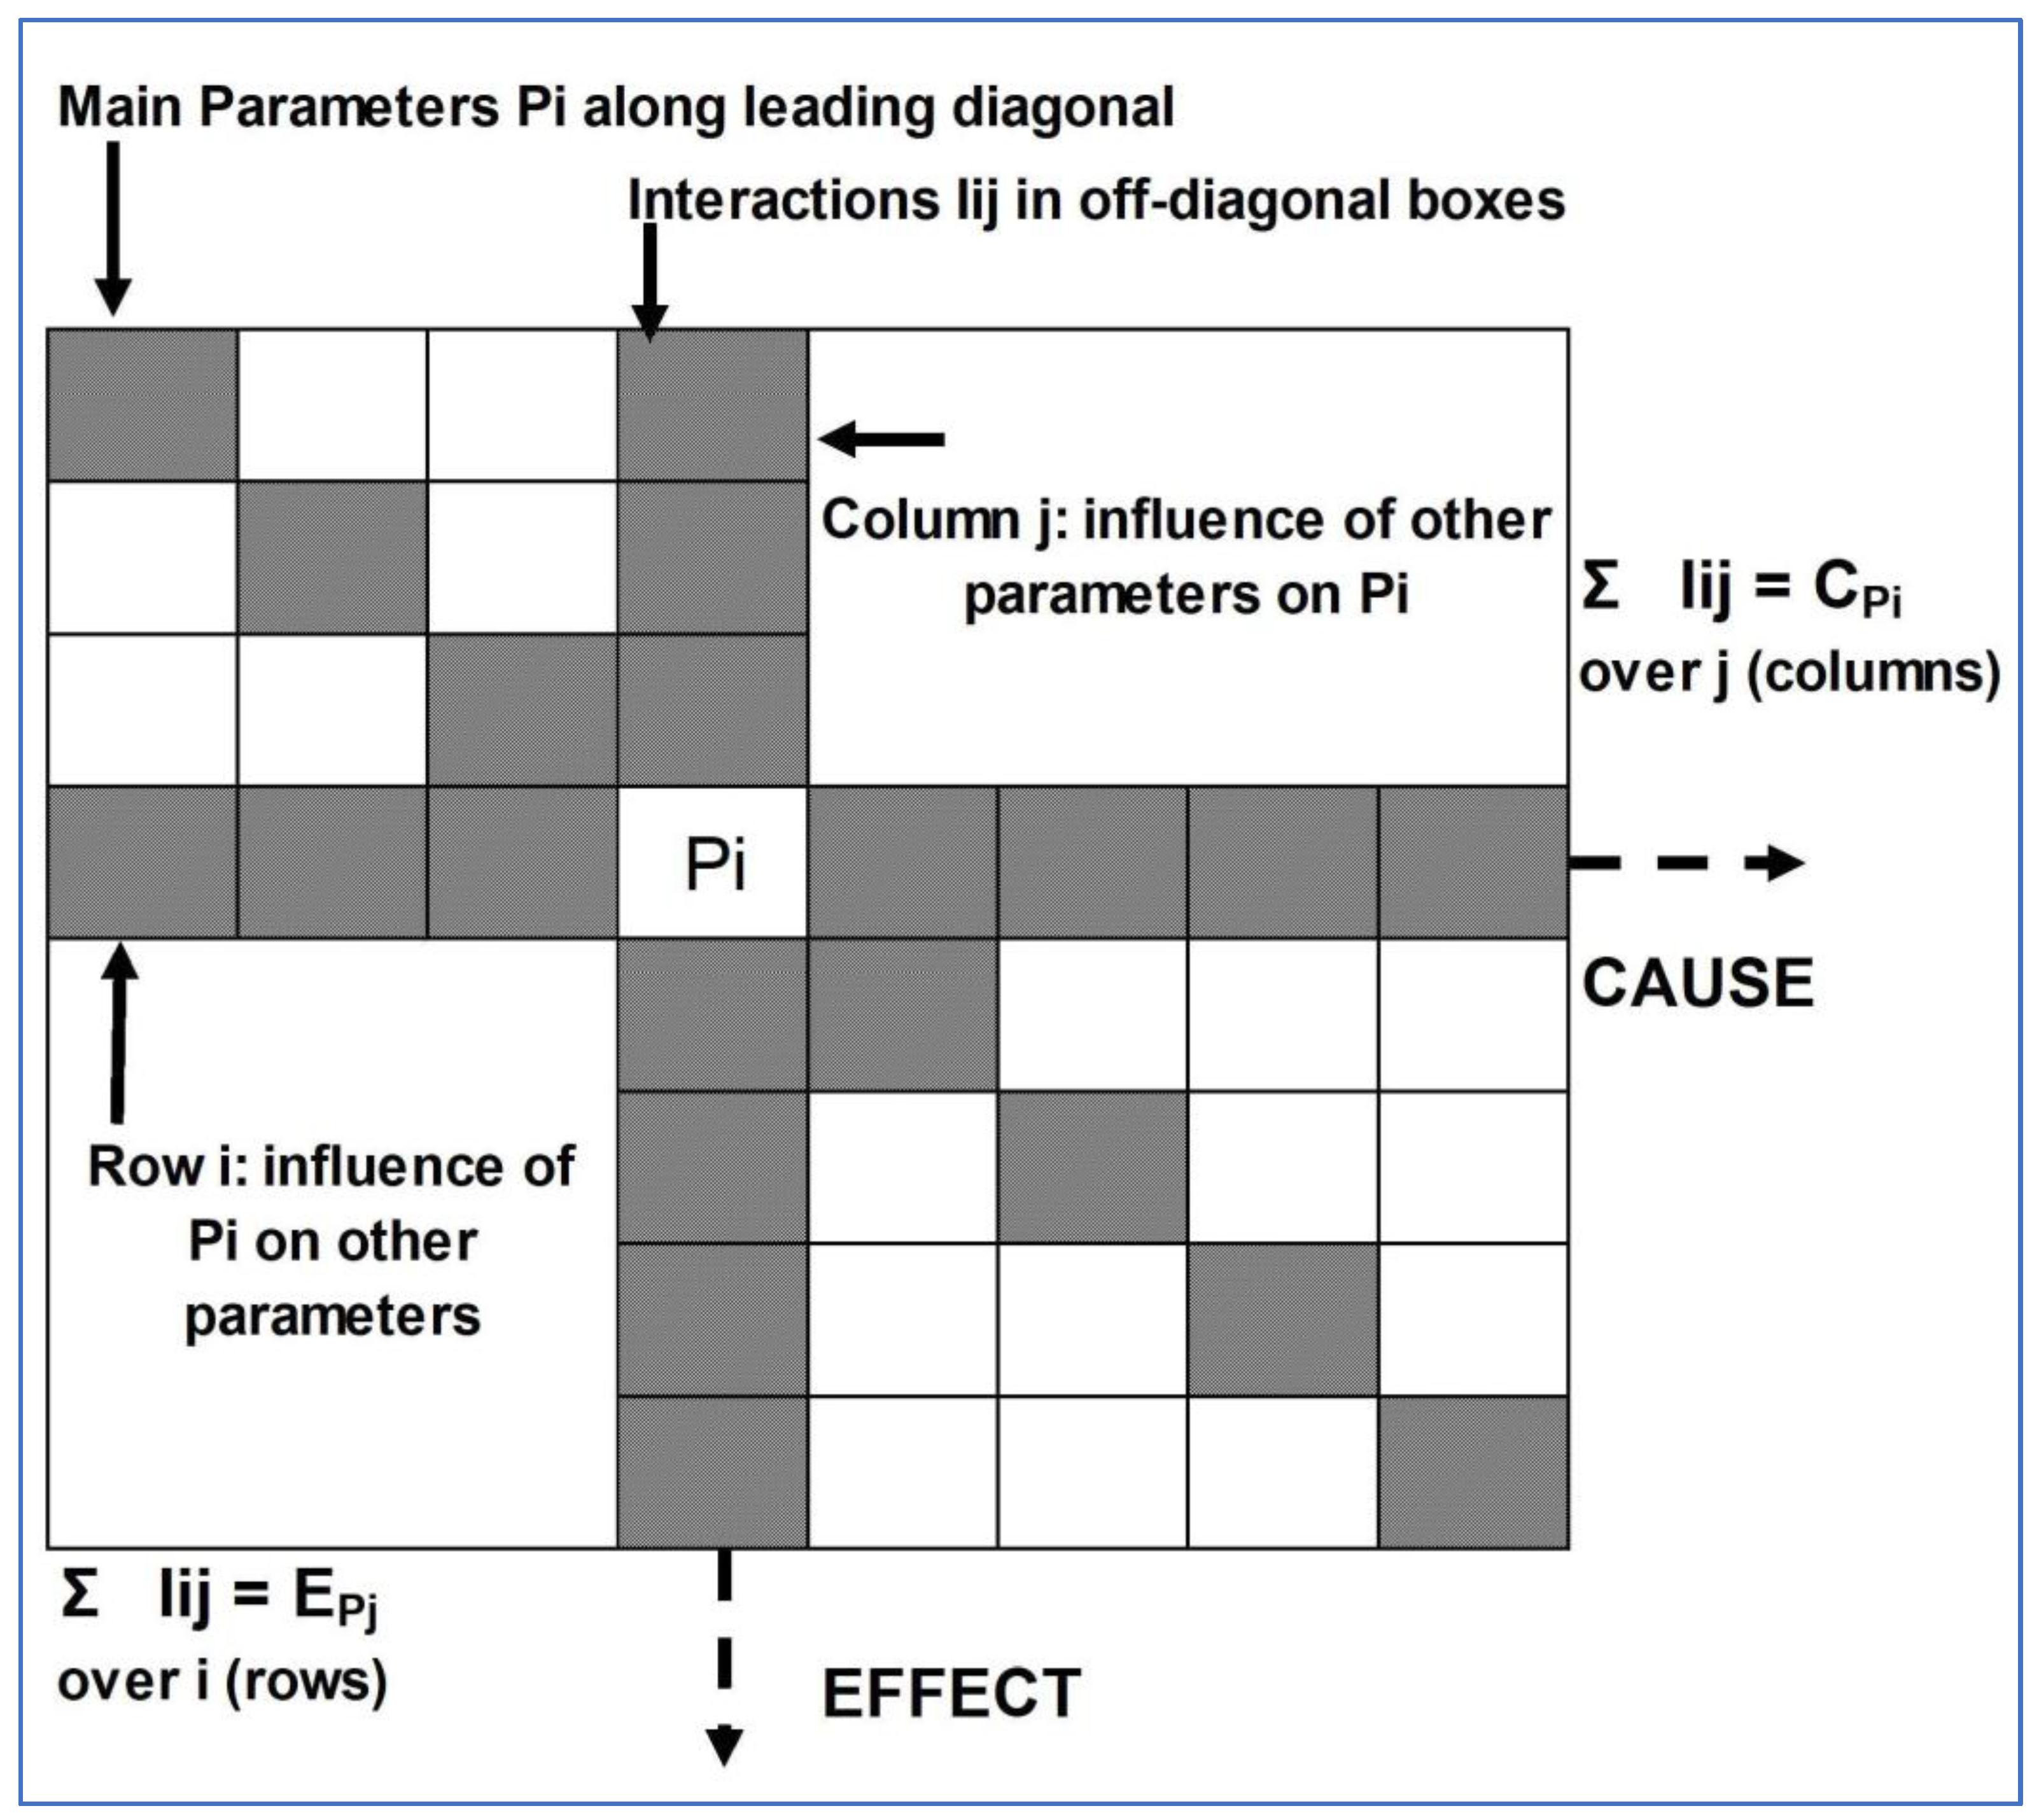
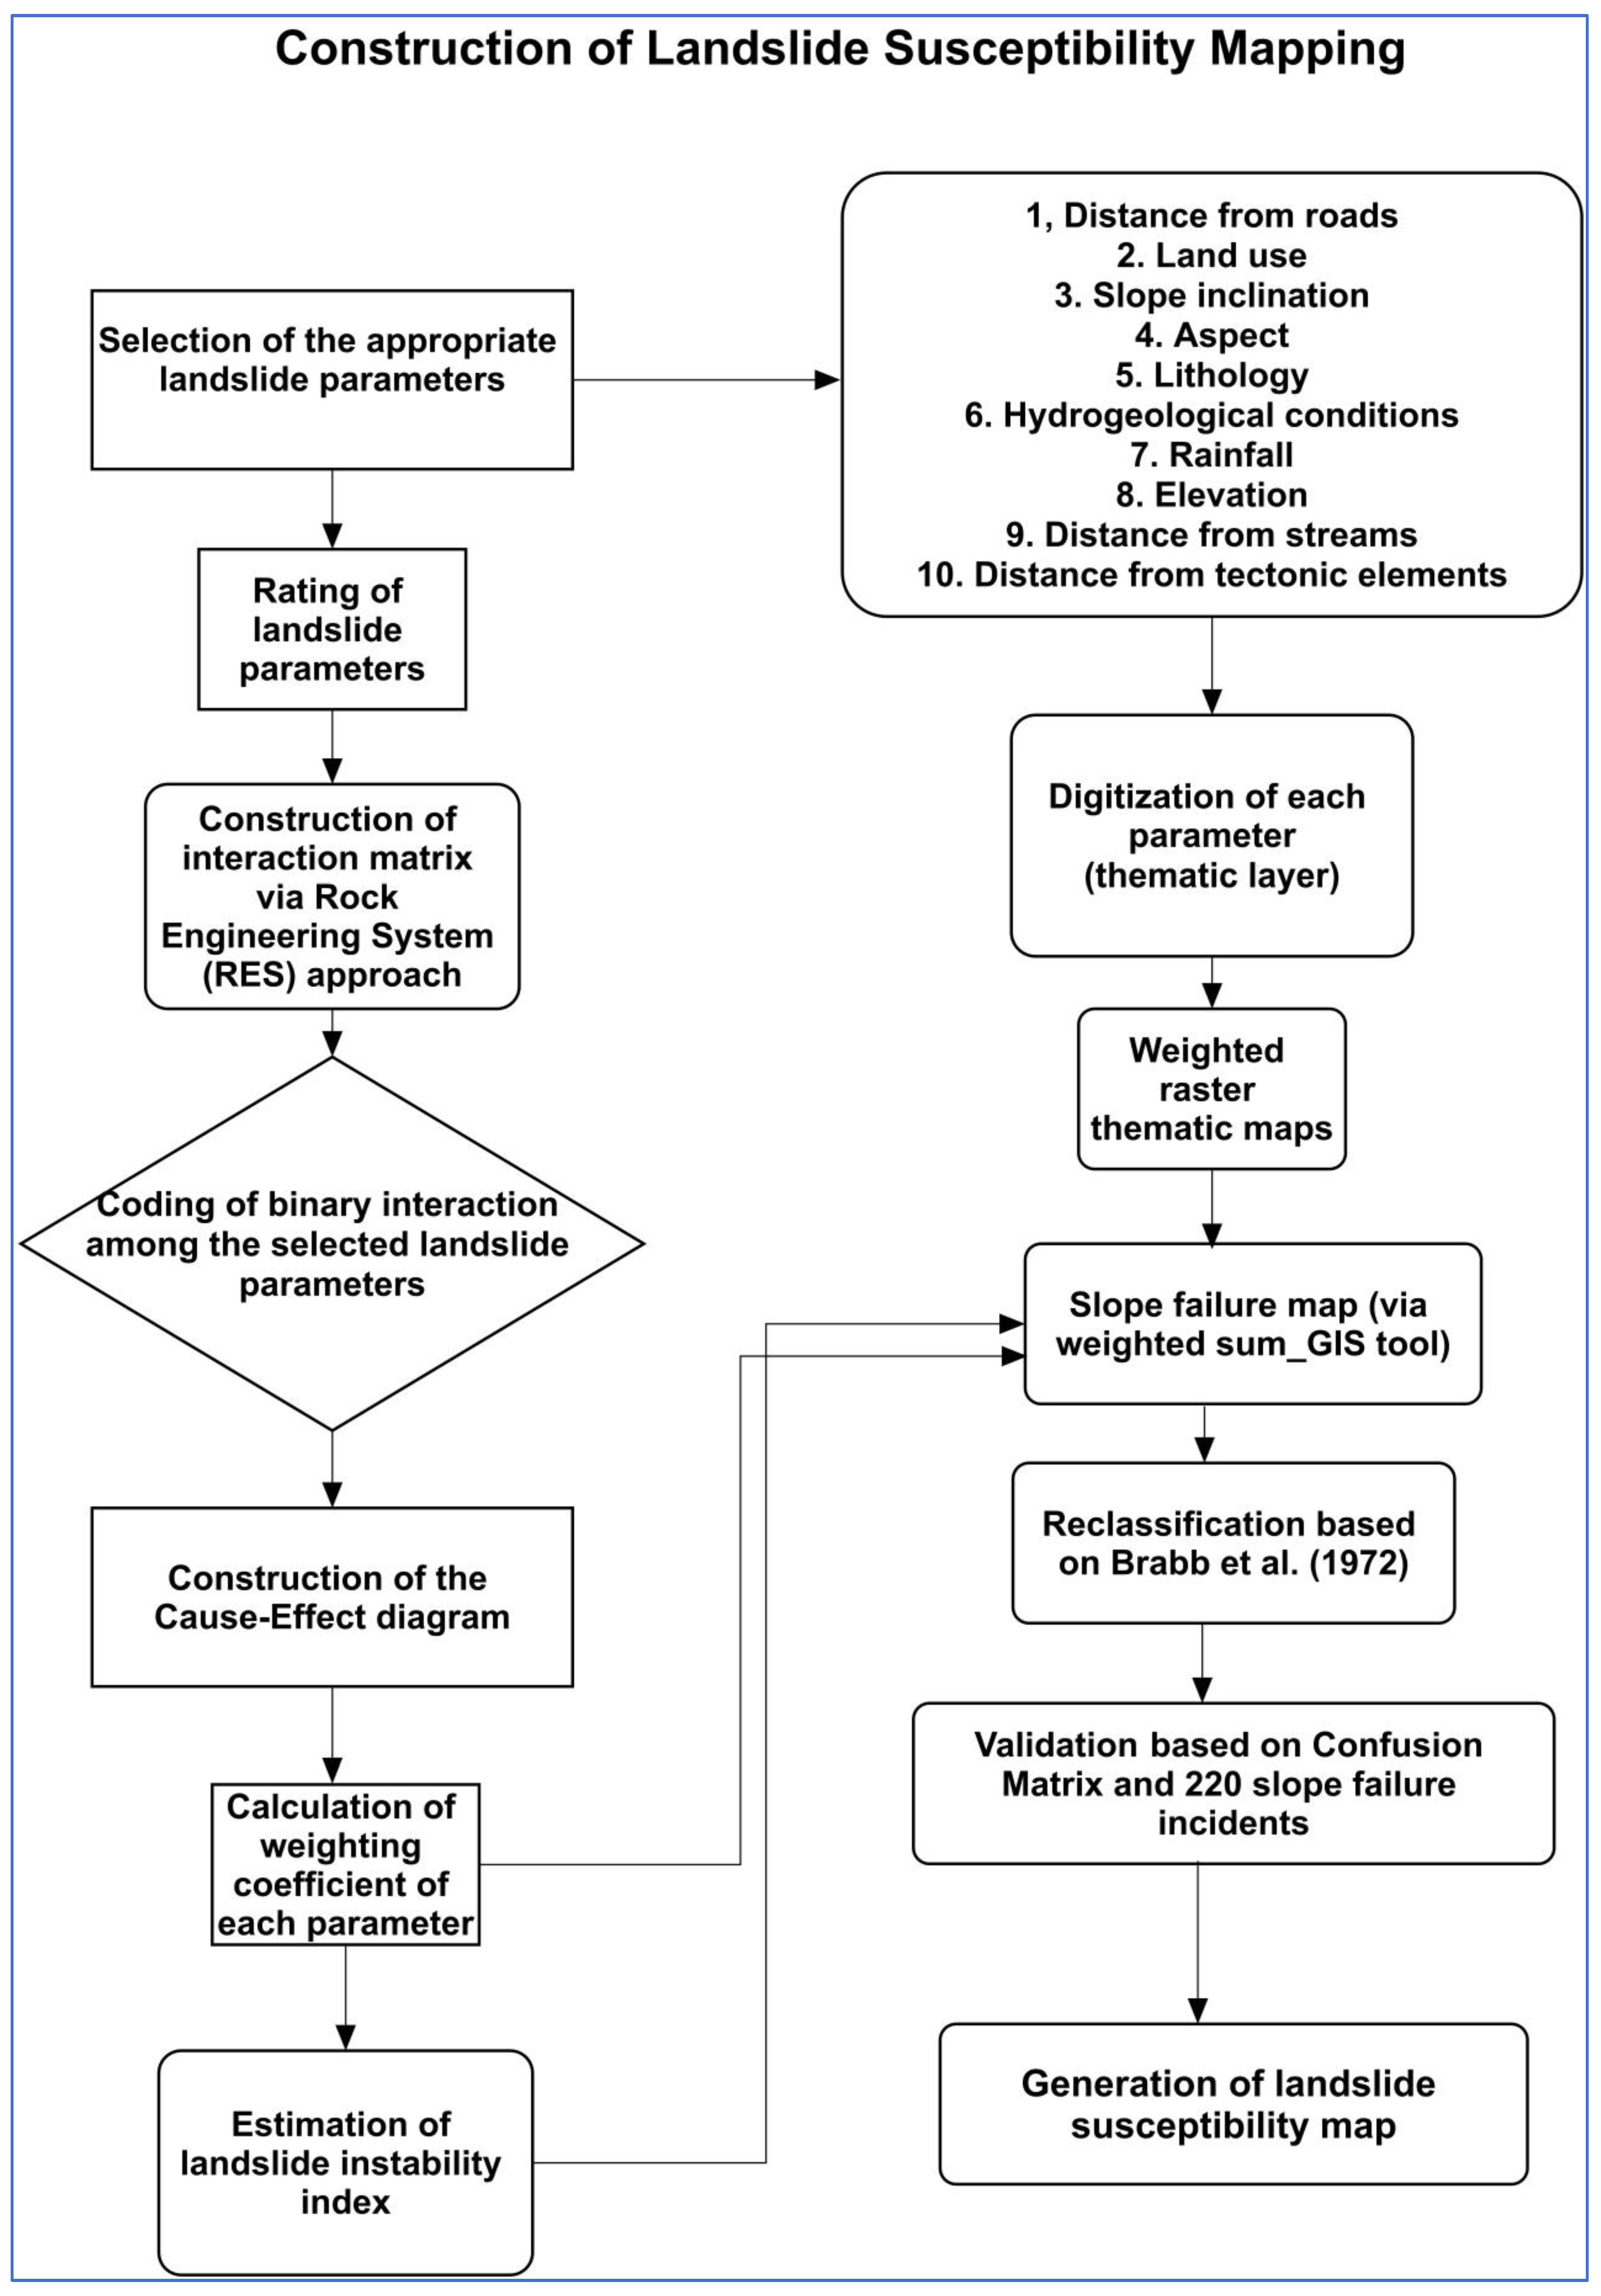
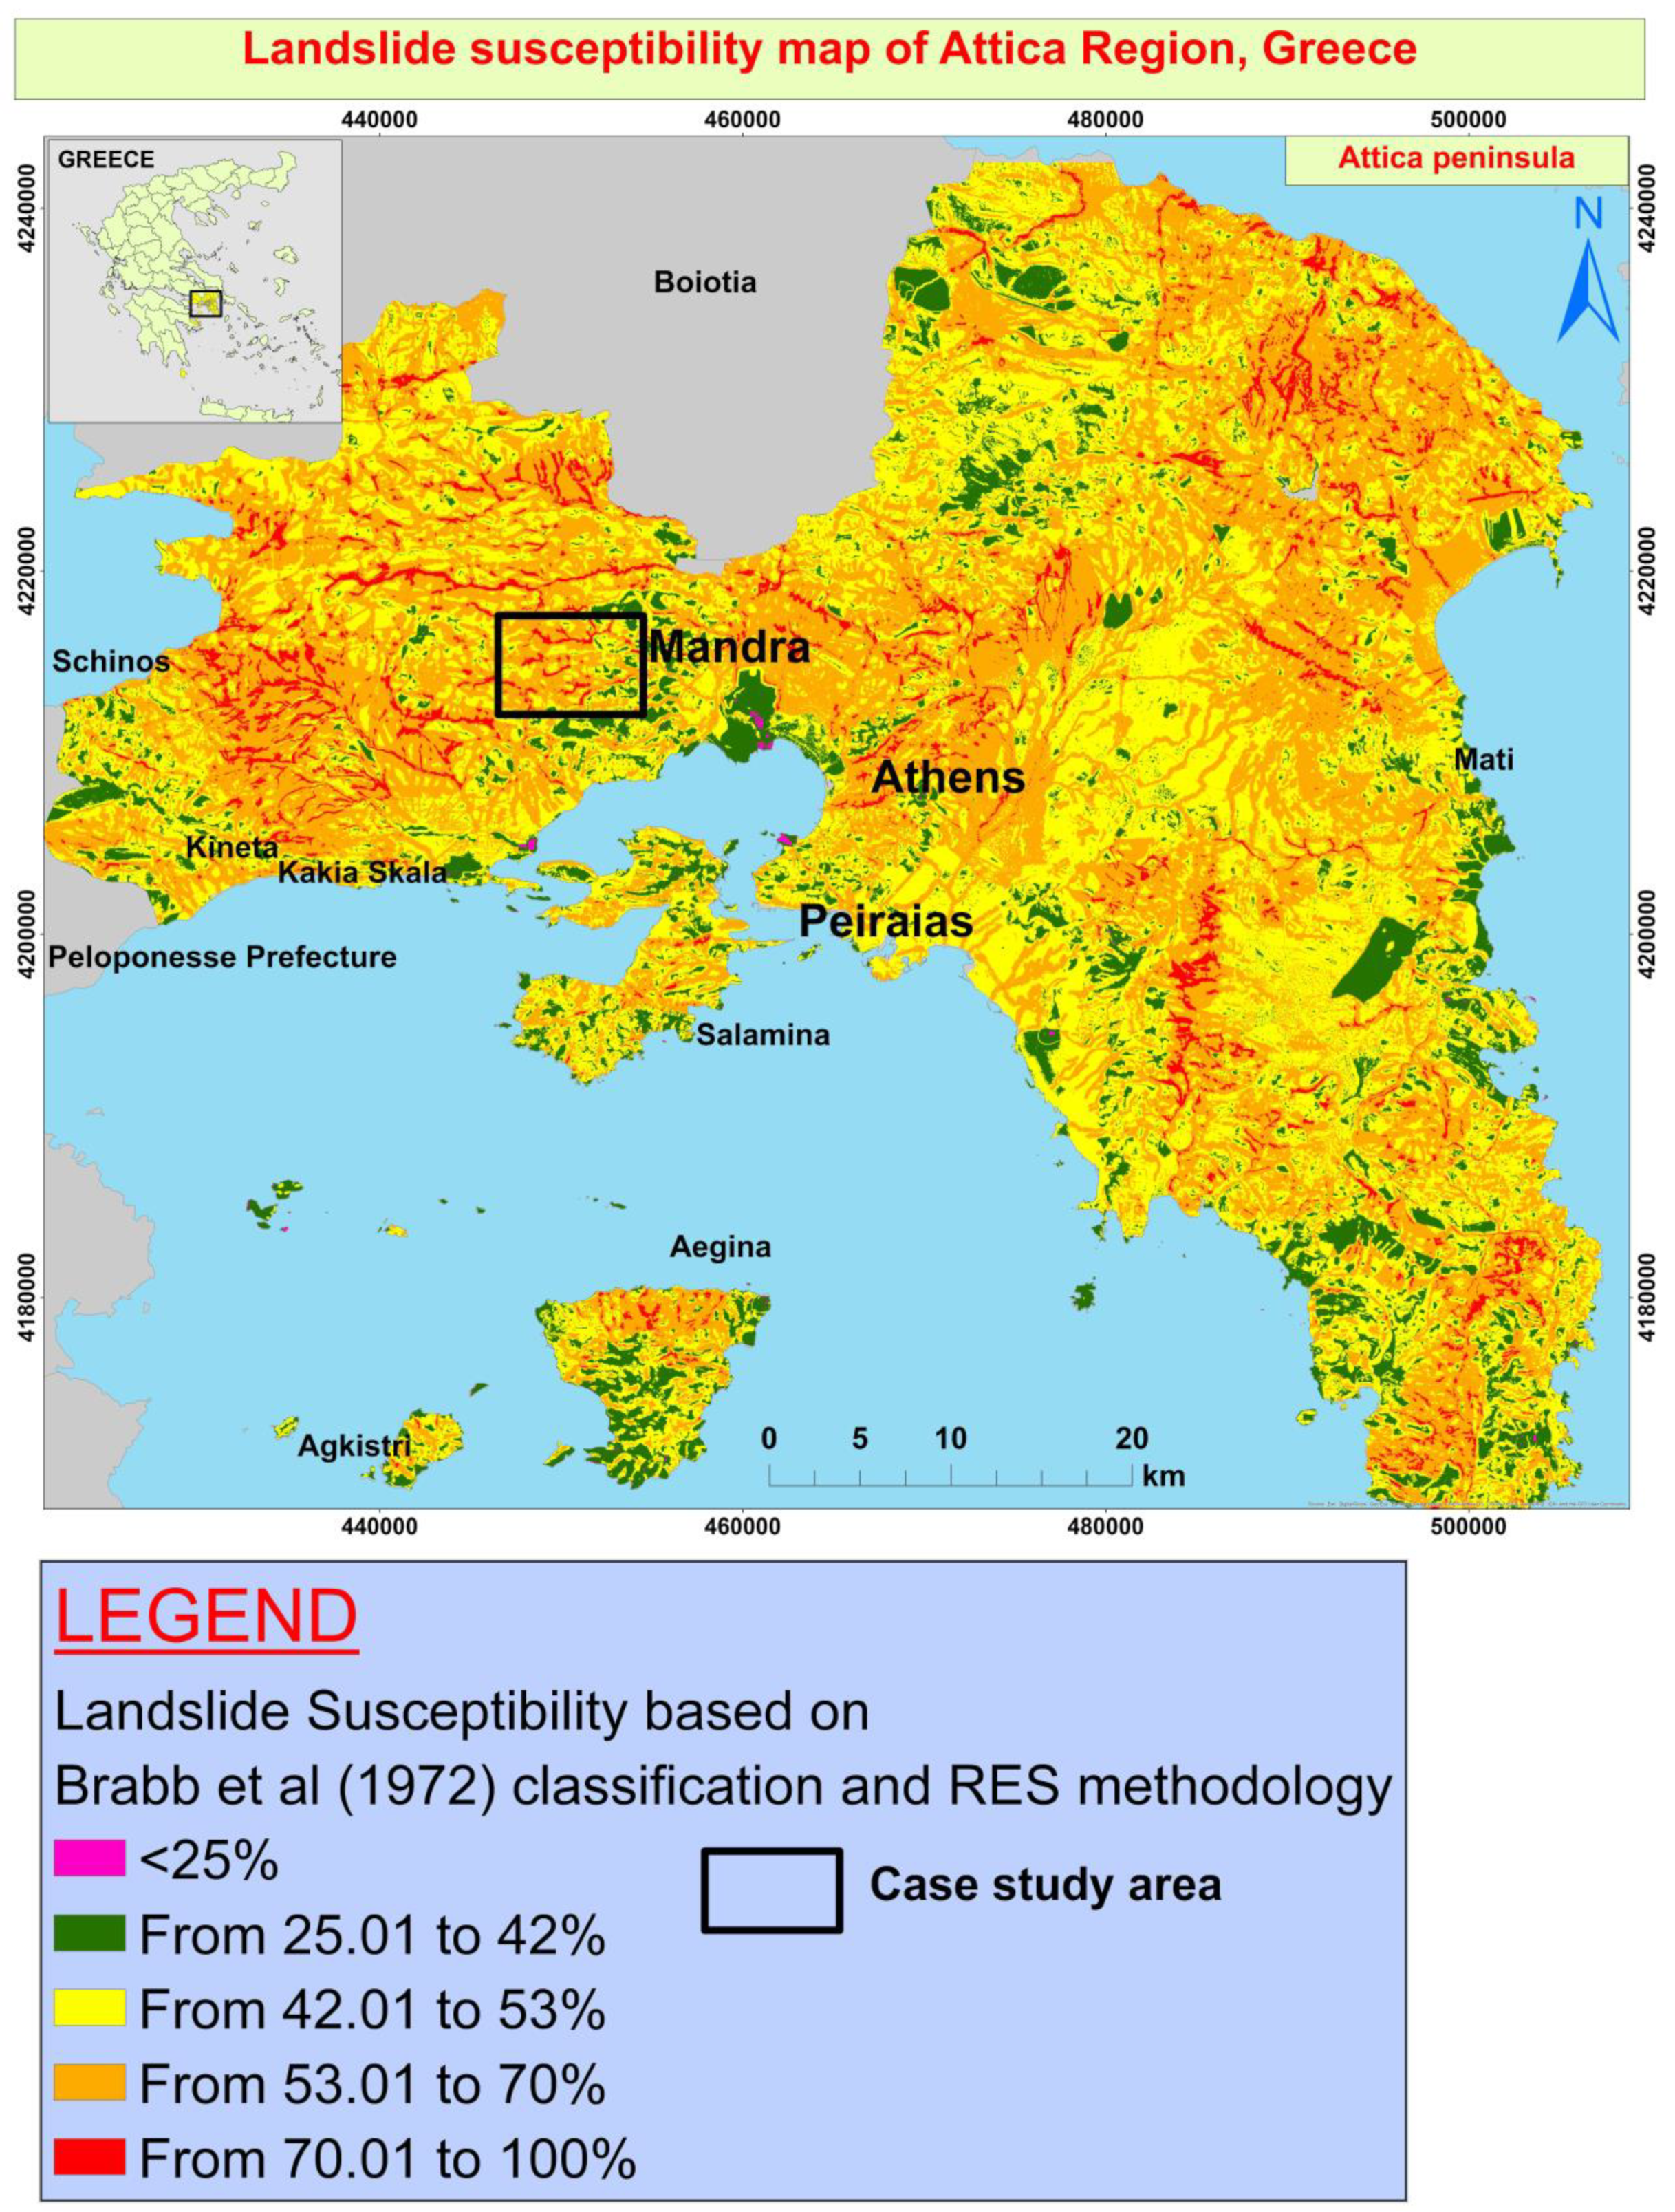
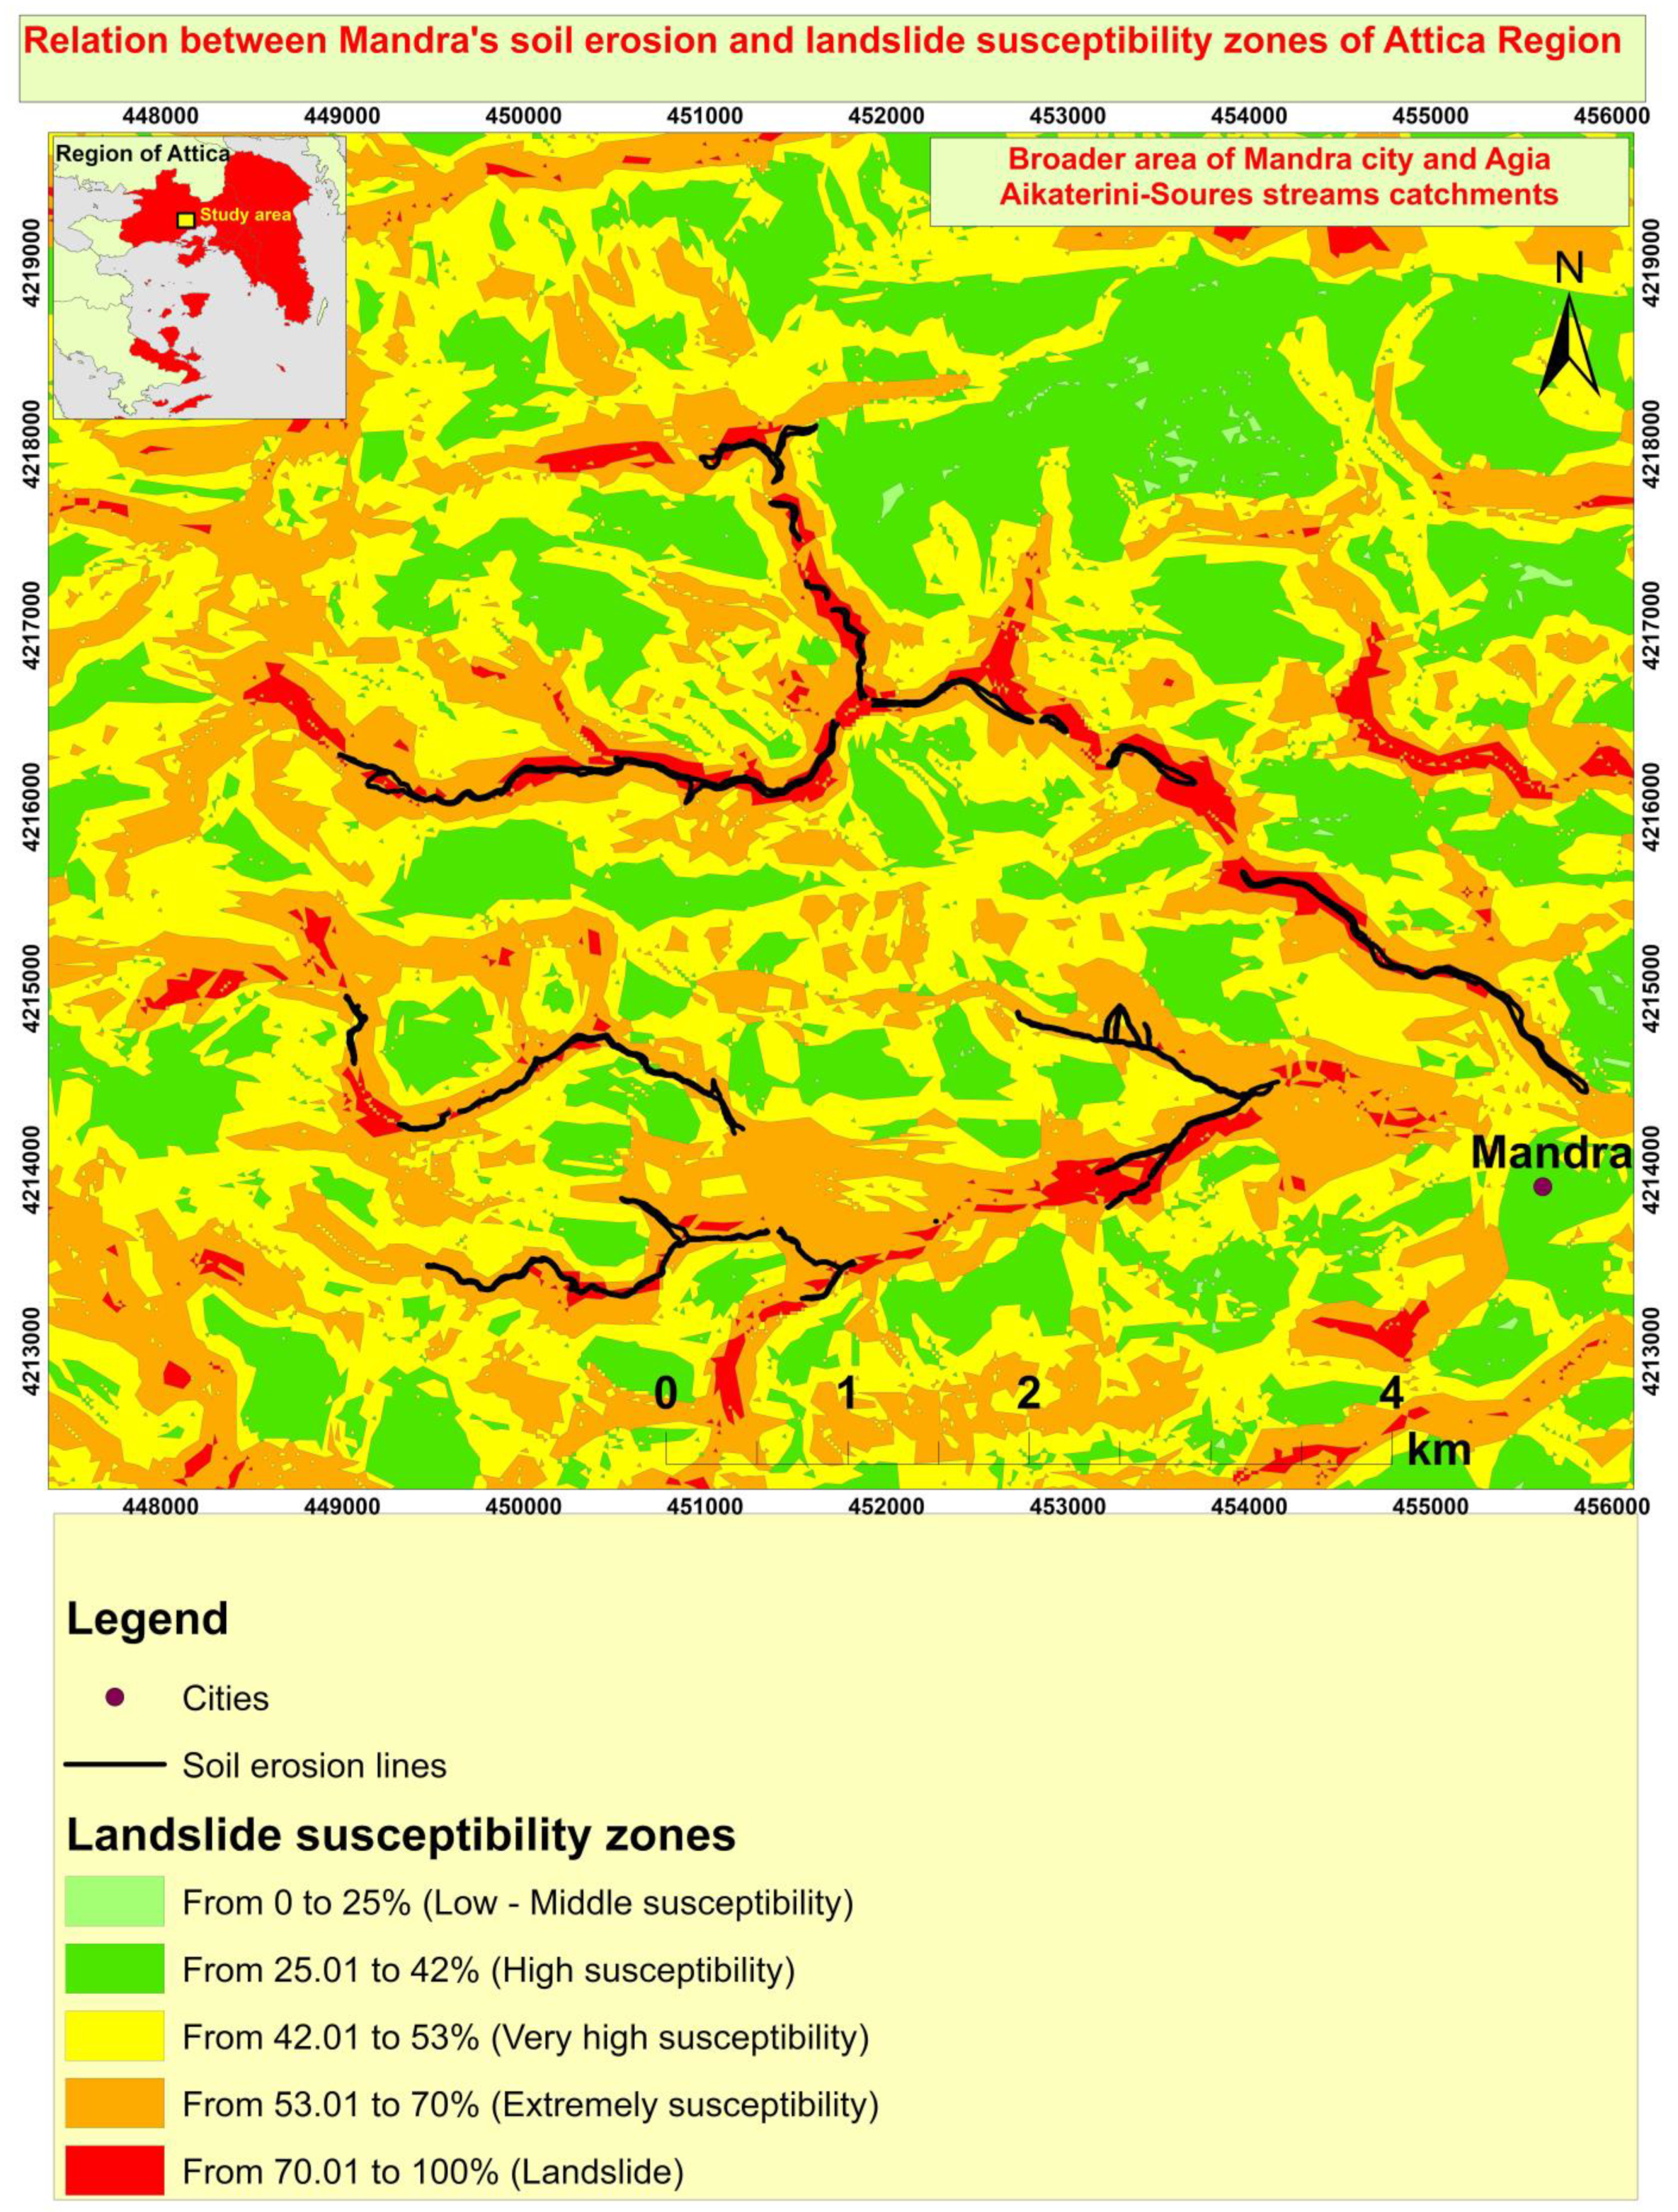
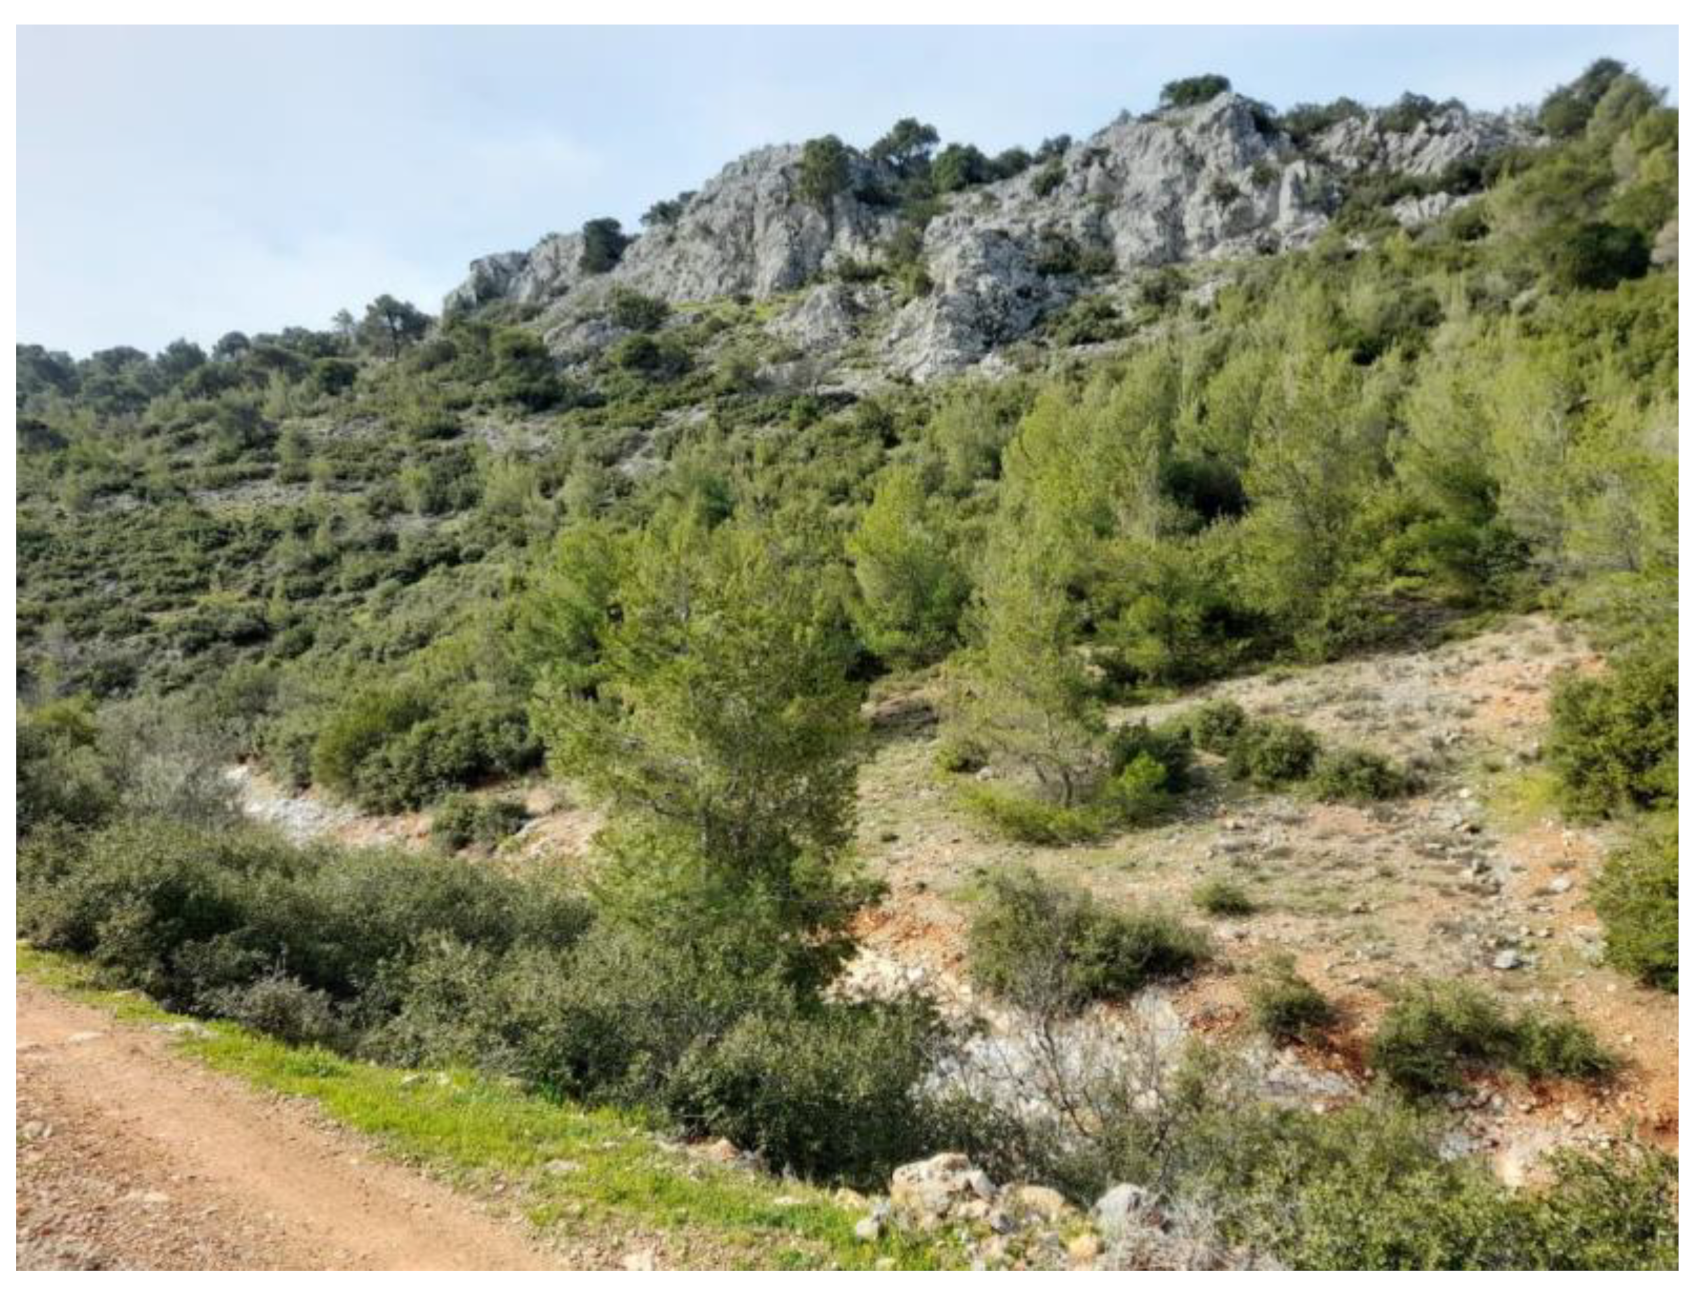
Table 1.
Some characteristic methodologies for the assessment of different types of soil erosion.
| Methodologies for the Assessment of Different Types of Soil Erosion | Researchers | Number of References |
|---|---|---|
| Universal Soil Erosion Equation (USLE) | Wischmeier and Smith (1978), Panagos et al. (2015) | [11,13] |
| Revised USLE | Renard et al. (1997), Panagos et al. (2015) | [12,13] |
| Frequency ratio (FR) | Conforti et al., 2011 | [20] |
| Logistic regression (LR) | Conoscenti et al., 2014 | [21] |
| Analytical hierarchical process (AHP) | Arabameri et al., 2018 | [19] |
| Weight of evidence (WoE) | Arabameri et al., 2019 | [22] |
| Machine learning algorithms | Eustace et al., 2011; Rahmati et al., 2017; Arabameri et al., 2019; Pourghasemi et al., 2017 | [22,28,29,31] |
Table 2.
Frequency ratio values of soil erosion lines to landslide susceptibility zones.
| Landslide Susceptibility Zones | Pixel in Domain | Pixels (%) (a) | Soil Erosion Lines (m) | Pixels (%) (b) | Frequency Ratio (b/a) |
|---|---|---|---|---|---|
| 42–53% | 777.203 | 42.32 | 917.35 | 2.3 | 0.05 |
| 53.01–70% | 933.057 | 50.81 | 21.920 | 55.11 | 1.08 |
| 70.01–100% | 126.032 | 6.87 | 16.935 | 42.59 | 6.2 |
| Total | 1836.292 | 100.00 | 39.772 | 100.00 | 1 |
Disclaimer/Publisher’s Note: The statements, opinions and data contained in all publications are solely those of the individual author(s) and contributor(s) and not of MDPI and/or the editor(s). MDPI and/or the editor(s) disclaim responsibility for any injury to people or property resulting from any ideas, methods, instructions or products referred to in the content. |
© 2023 by the author. Licensee MDPI, Basel, Switzerland. This article is an open access article distributed under the terms and conditions of the Creative Commons Attribution (CC BY) license (https://creativecommons.org/licenses/by/4.0/).
Share and Cite
MDPI and ACS Style
Tavoularis, N. Soil Erosion and Landslide Susceptibility Mapping in Western Attica, Greece: A Rock Engineering System Approach. Geosciences 2023, 13, 338. https://0-doi-org.brum.beds.ac.uk/10.3390/geosciences13110338
AMA Style
Tavoularis N. Soil Erosion and Landslide Susceptibility Mapping in Western Attica, Greece: A Rock Engineering System Approach. Geosciences. 2023; 13(11):338. https://0-doi-org.brum.beds.ac.uk/10.3390/geosciences13110338
Chicago/Turabian StyleTavoularis, Nikolaos. 2023. "Soil Erosion and Landslide Susceptibility Mapping in Western Attica, Greece: A Rock Engineering System Approach" Geosciences 13, no. 11: 338. https://0-doi-org.brum.beds.ac.uk/10.3390/geosciences13110338
Note that from the first issue of 2016, this journal uses article numbers instead of page numbers. See further details here.