Article

Assessing Soil Erosion Hazards Using Land-Use Change and Landslide Frequency Ratio Method: A Case Study of Sabaragamuwa Province, Sri Lanka

1
The Centre for Advanced Modelling and Geospatial Information Systems (CAMGIS), Faculty of Engineering and IT, University of Technology Sydney, Sydney 2007, Australia
2
Department of Energy and Mineral Resources Engineering, Sejong University, Choongmu-gwan, 209 Neungdong-ro, Gwangjin-gu, Seoul 05006, Korea
*
Author to whom correspondence should be addressed.
Submission received: 3 April 2020 / Revised: 25 April 2020 / Accepted: 30 April 2020 / Published: 7 May 2020

Abstract

:
This study aims to identify the vulnerable landscape areas using landslide frequency ratio and land-use change associated soil erosion hazard by employing geo-informatics techniques and the revised universal soil loss equation (RUSLE) model. Required datasets were collected from multiple sources, such as multi-temporal Landsat images, soil data, rainfall data, land-use land-cover (LULC) maps, topographic maps, and details of the past landslide incidents. Landsat satellite images from 2000, 2010, and 2019 were used to assess the land-use change. Geospatial input data on rainfall, soil type, terrain characteristics, and land cover were employed for soil erosion hazard classification and mapping. Landscape vulnerability was examined on the basis of land-use change, erosion hazard class, and landslide frequency ratio. Then the erodible hazard areas were identified and prioritized at the scale of river distribution zones. The image analysis of Sabaragamuwa Province in Sri Lanka from 2000 to 2019 indicates a significant increase in cropping areas (17.96%) and urban areas (3.07%), whereas less dense forest and dense forest coverage are significantly reduced (14.18% and 6.46%, respectively). The average annual soil erosion rate increased from 14.56 to 15.53 t/ha/year from year 2000 to 2019. The highest landslide frequency ratios are found in the less dense forest area and cropping area, and were identified as more prone to future landslides. The river distribution zones Athtanagalu Oya (A-2), Kalani River-south (A-3), and Kalani River- north (A-9), were identified as immediate priority areas for soil conservation.

Graphical Abstract

1. Introduction

Land-use change is one of the threats to soil erosion, and it worsens the global environmental problem. Soil erosion is one of the main reasons of land degradation [1,2]. Soil erosion is a natural phenomenon that is defined as detachment of the soil particles and transport due to the action of an erosive agent such as wind, water, gravity, or anthropogenic perturbations [3,4,5]. Soil erosion by water is known as water erosion. There are several types of water erosion: splash erosion, sheet or interrill, rill, gully or ravine [6,7]. Gully erosion is a vital indicator to identify the soil erosion hazard [8]. The kinetic energy of water drops detaches the soil particles and water flows on the surface by creating narrow cannels. Gully erosion can be described as accumulated surface runoff in narrow cannels and removal of the soil from considerable depths [9].
Land-use change and soil erosion can be accelerated by human activities, such as expansion of agricultural activities, urbanization, and deforestation. This situation is exacerbated by unpredictable rainfall patterns with high-intensity rainfall [10,11,12]. These changes ultimately contribute to sedimentation in water bodies and landslides in vulnerable slope lands. Land-use land-cover (LULC) dynamics can help explain the present situation of soil erosion and land vulnerability for future planning [13,14]. Moreover, Pradhan et al. [15] highlighted that soil erosion could be minimized by adjusting certain factors, such as LULC changes.
Geo-informatics is an efficient technology and can be used to integrate various datasets and assess ecosystem dynamics, such as soil erosion [15,16]. Geo-informatics and modelling-based approaches have been successfully incorporated to reduce the challenges and quantify the assessment process due to the complex nature of soil erosion assessment [15,16,17,18,19]. Subsequently, a good deal of soil erosion models have been developed and integrated with geo-informatics to assess soil erosion in agricultural landscapes. Nampak et al. [18] proposed the revised universal soil loss equation (RUSLE) model, which was initially developed by Renard et al. [20], to easily incorporate geo-informatics techniques with digitally available data, such as satellite images and elevation and rainfall data, to generate highly precise outcomes. An integrated approach that utilizes the RUSLE model and geo-informatics can provide cost-effective support to resource inventory [1].
Researchers have observed that soil erosion initiates landslides due to irreversible threats of slope stability and ecosystem functionality [13,14,21]. The rate of landslides can be minimized by adjusting the factors responsible for soil erosion hazard, such as LULC [15,22]. Moreover, several researchers observed the correlation between soil erosion rate and the land-use change [14,18,19]. The frequency ratio probability algorithm has been widely applied in geographic information systems (GIS) and remote sensing environments for landslide susceptibility analysis [23,24,25,26]. In addition, several soil erosion hazard assessments were conducted by combining the RUSLE model and frequency ratio method [8,27]; and the USLE model and frequency ratio method [23]. The frequency ratio has been employed in several studies to assess the relationship between soil erosion hazard and land-use classes [14,22,28].
Soil erosion is one of the main problems of agricultural development in Sri Lanka. Weather-related natural disasters, such as landslides and flood events, have remarkably increased recently; these disasters have been severely influenced by the soil erosion process [29]. The Central Highlands of Sri Lanka is vulnerable to soil erosion hazard [21,29,30,31]. Hewawasam [30] reported that gully formation is common in poorly maintained tea lands at Central Highlands of Sri Lanka, and numerous landslides occurred in agricultural hillslopes. Hence, gully erosion is one of the causes to create more vulnerable hillslopes for landslides in Central Highlands of Sri Lanka. Poesen [2] stated water erosion induces the environmental hazards such as landslides in tropical hillslopes. Hemasinghe et al. [32] concurred with the idea that land-use changes are strongly related to slope failure occurrences. Hence, land-use change, soil erosion hazard related to landslide incidence needs to be assessed for soil conservation.
In recent years, several soil erosion assessments and landslide hazard assessments were conducted in Central Highlands of Sri Lanka to identify the causative factors and severity of the situation [12,33,34,35]. Most of these studies applied the RUSLE model for soil erosion assessments in different watersheds i.e., Kotmale watershed [33], Kelani river basin [12], Kiridi Oya river basin [36], and Kalu ganga river basin [37]. The landslide susceptibility assessments have been explored and suggested the spatial prediction of landslides using geo-informatics technology, i.e., logistic regression [32,38], analytic hierarchy process [39,40], entropy method [31], and spatial multi criteria evaluation [39]. Although numerous factors such as slope, elevation, aspect, profile curvature, topography were evaluated, rainfall and land-use change were recognized as a significant contribution on landslide initiation in Central Highlands of Sri Lanka [29,32,41]. However, none of the studies conducted identified and prioritized highly susceptible areas for soil erosion.
Furthermore, Diyabalanage et al. [34] found that the LULC structure and composition in Central Highlands have been changed during last few decades due to expansion of infrastructure development programs. Hewawasam [30] revealed severe soil erosion could be observed due to deforestation and different agricultural practices in Central Highlands during the last four decades. In contrast, soil erosion can be controlled by planning and implementing proper watershed development plans and land-use management practices [42]. Therefore, highly susceptible areas need to be identified and prioritized prior to the implementation of soil conservation practices. Hence, the present study aims to identify the vulnerable landscape areas using frequency ratio and land-use change associated with soil erosion hazard. The selected study site is Sabaragamuwa Province in the Central Highlands of Sri Lanka. This study focuses on overall soil erosion assessment, including gully erosion. Land-use change and soil erosion hazard and their associated dynamics are assessed using geospatial data and the RUSLE model combined with a GIS environment. Intense soil erosion leads to a state of extremely hazardous environmental disturbance. Hence, the present study assesses the intensity of soil erosion in Sabaragamuwa Province by using the RUSLE model. In terms of research originality, this study provides a new approach in landscape vulnerability assessment by combining three methods: landslide frequency ratio method, soil erosion severity, and land-use change assessments. In particular, the study used this new approach to identify the spatial distribution of soil erosion hazard during the period of 2000–2019. Furthermore, landslide frequency ratio, erosion hazard class, and land-use change were used to prioritize the vulnerable areas for soil conservation in Sabaragamuwa Province in the Central Highlands of Sri Lanka.

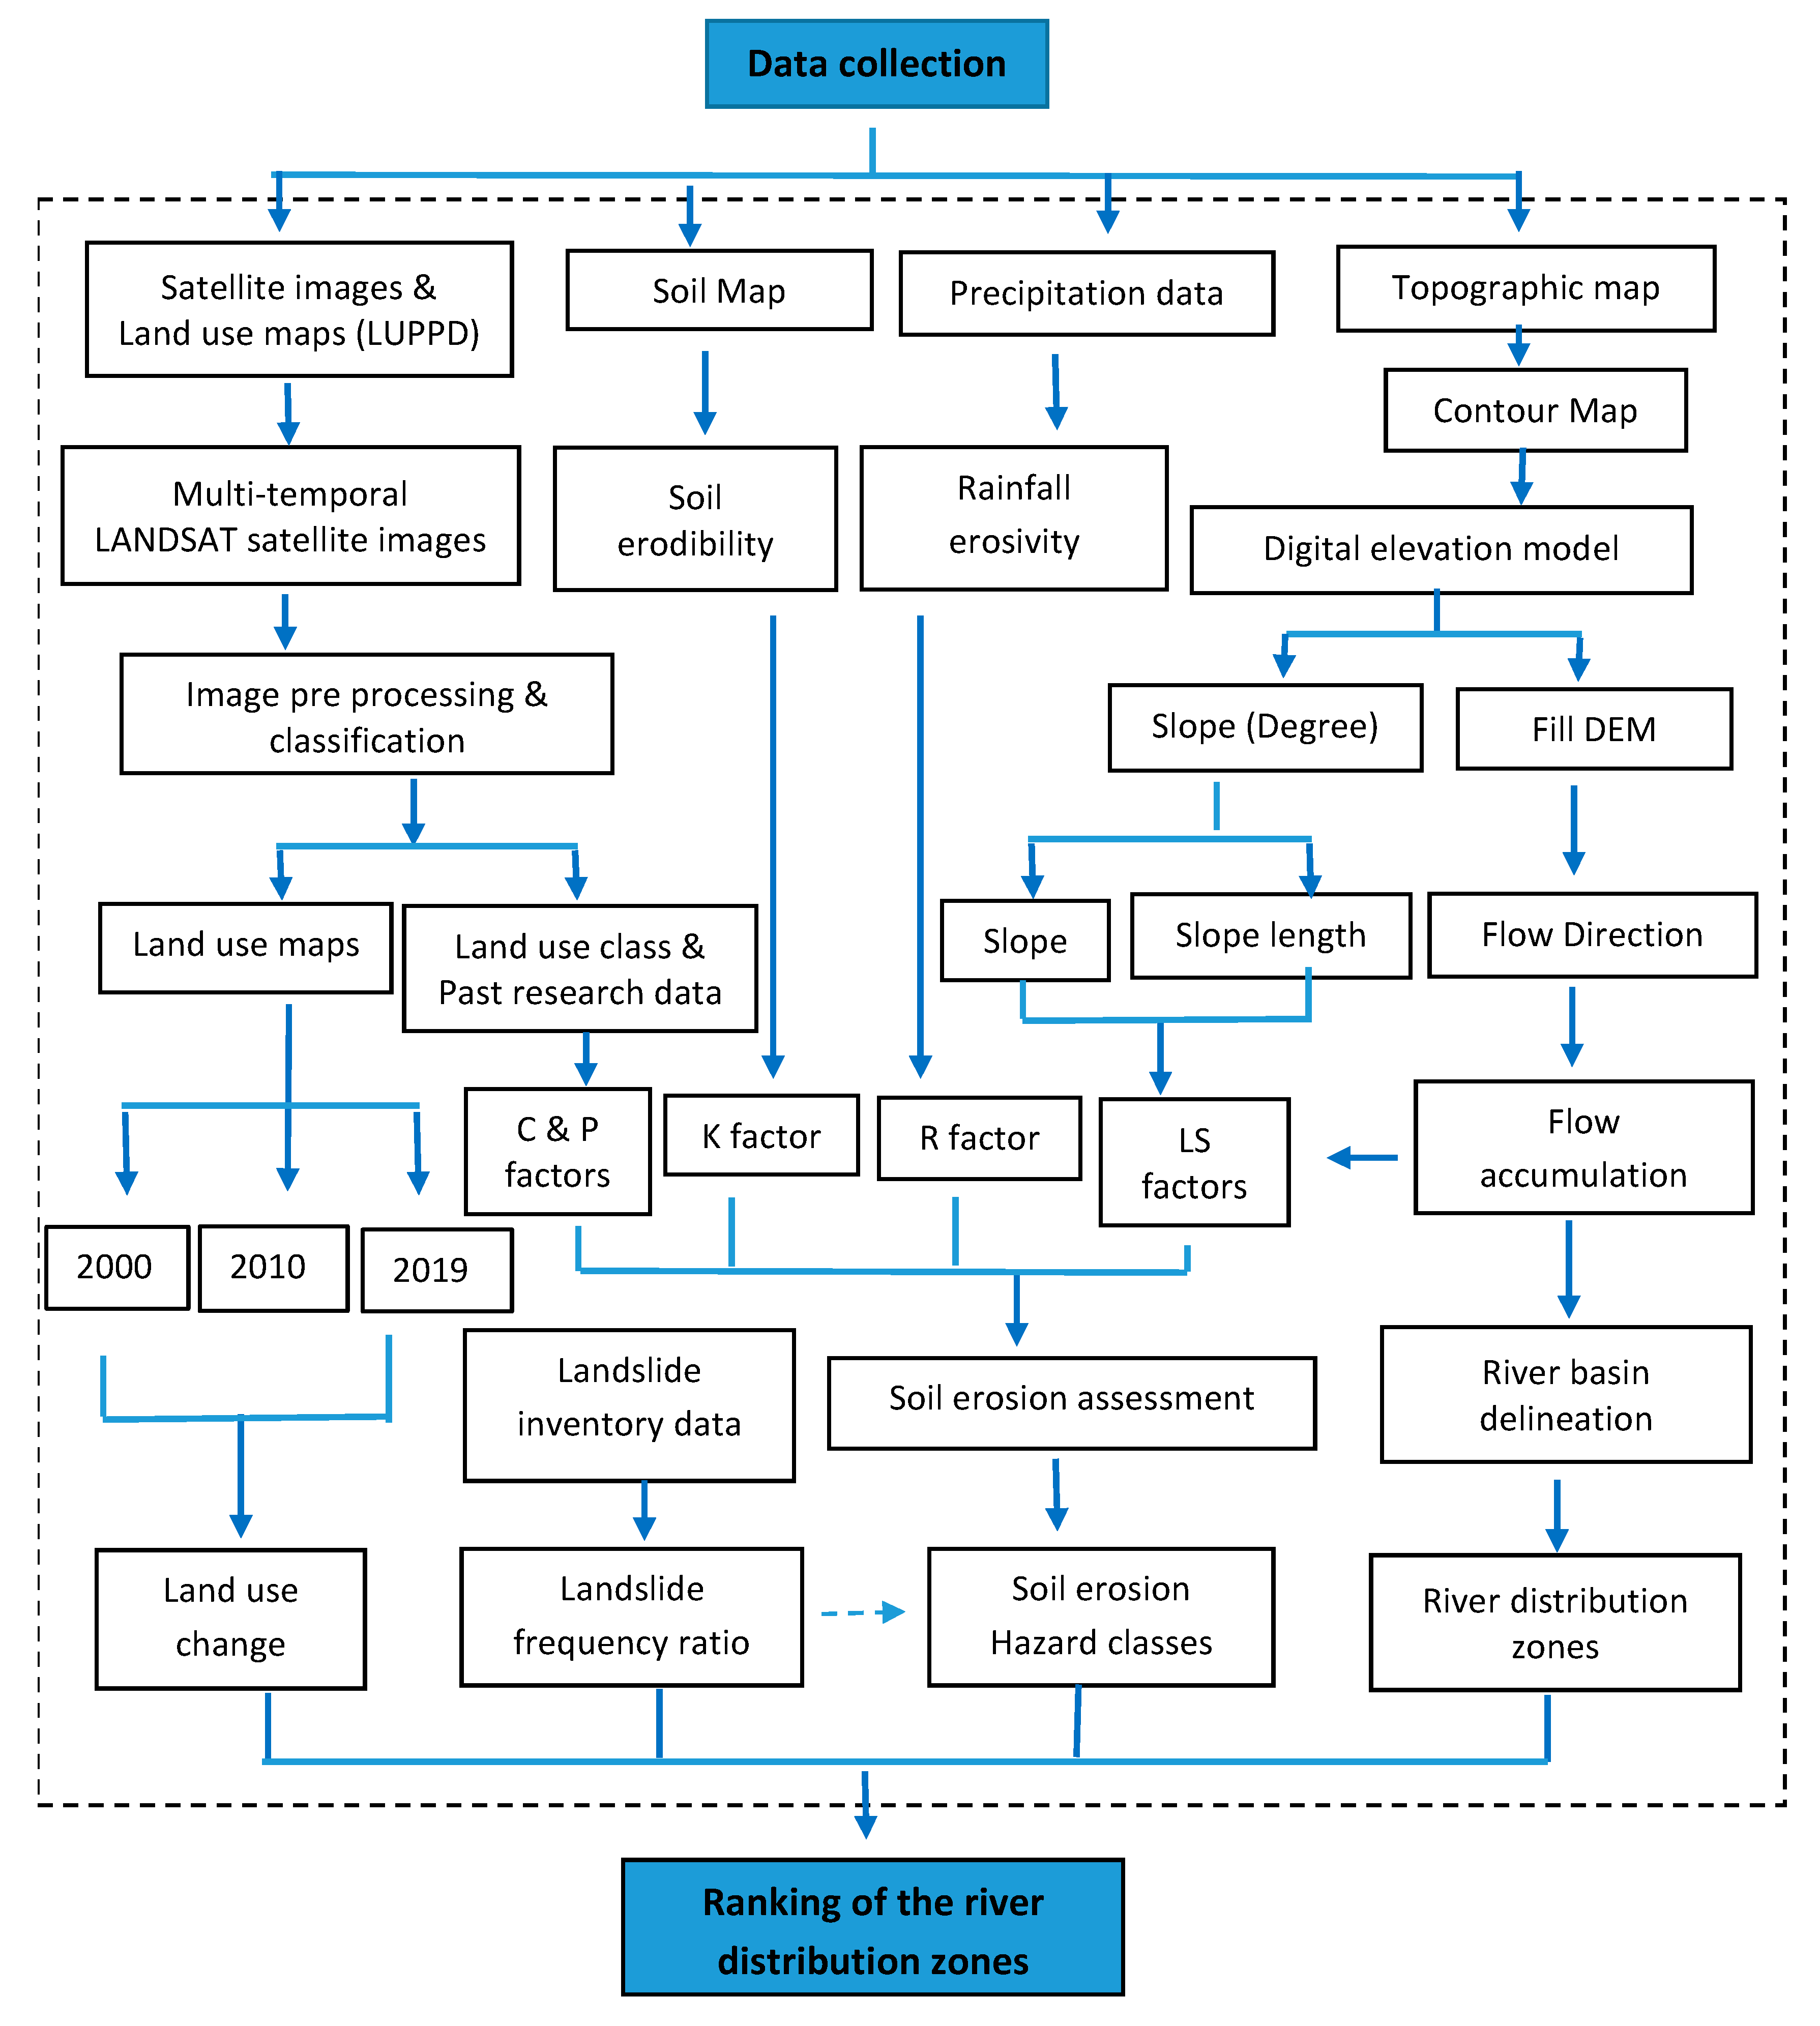
2. Materials and Methods
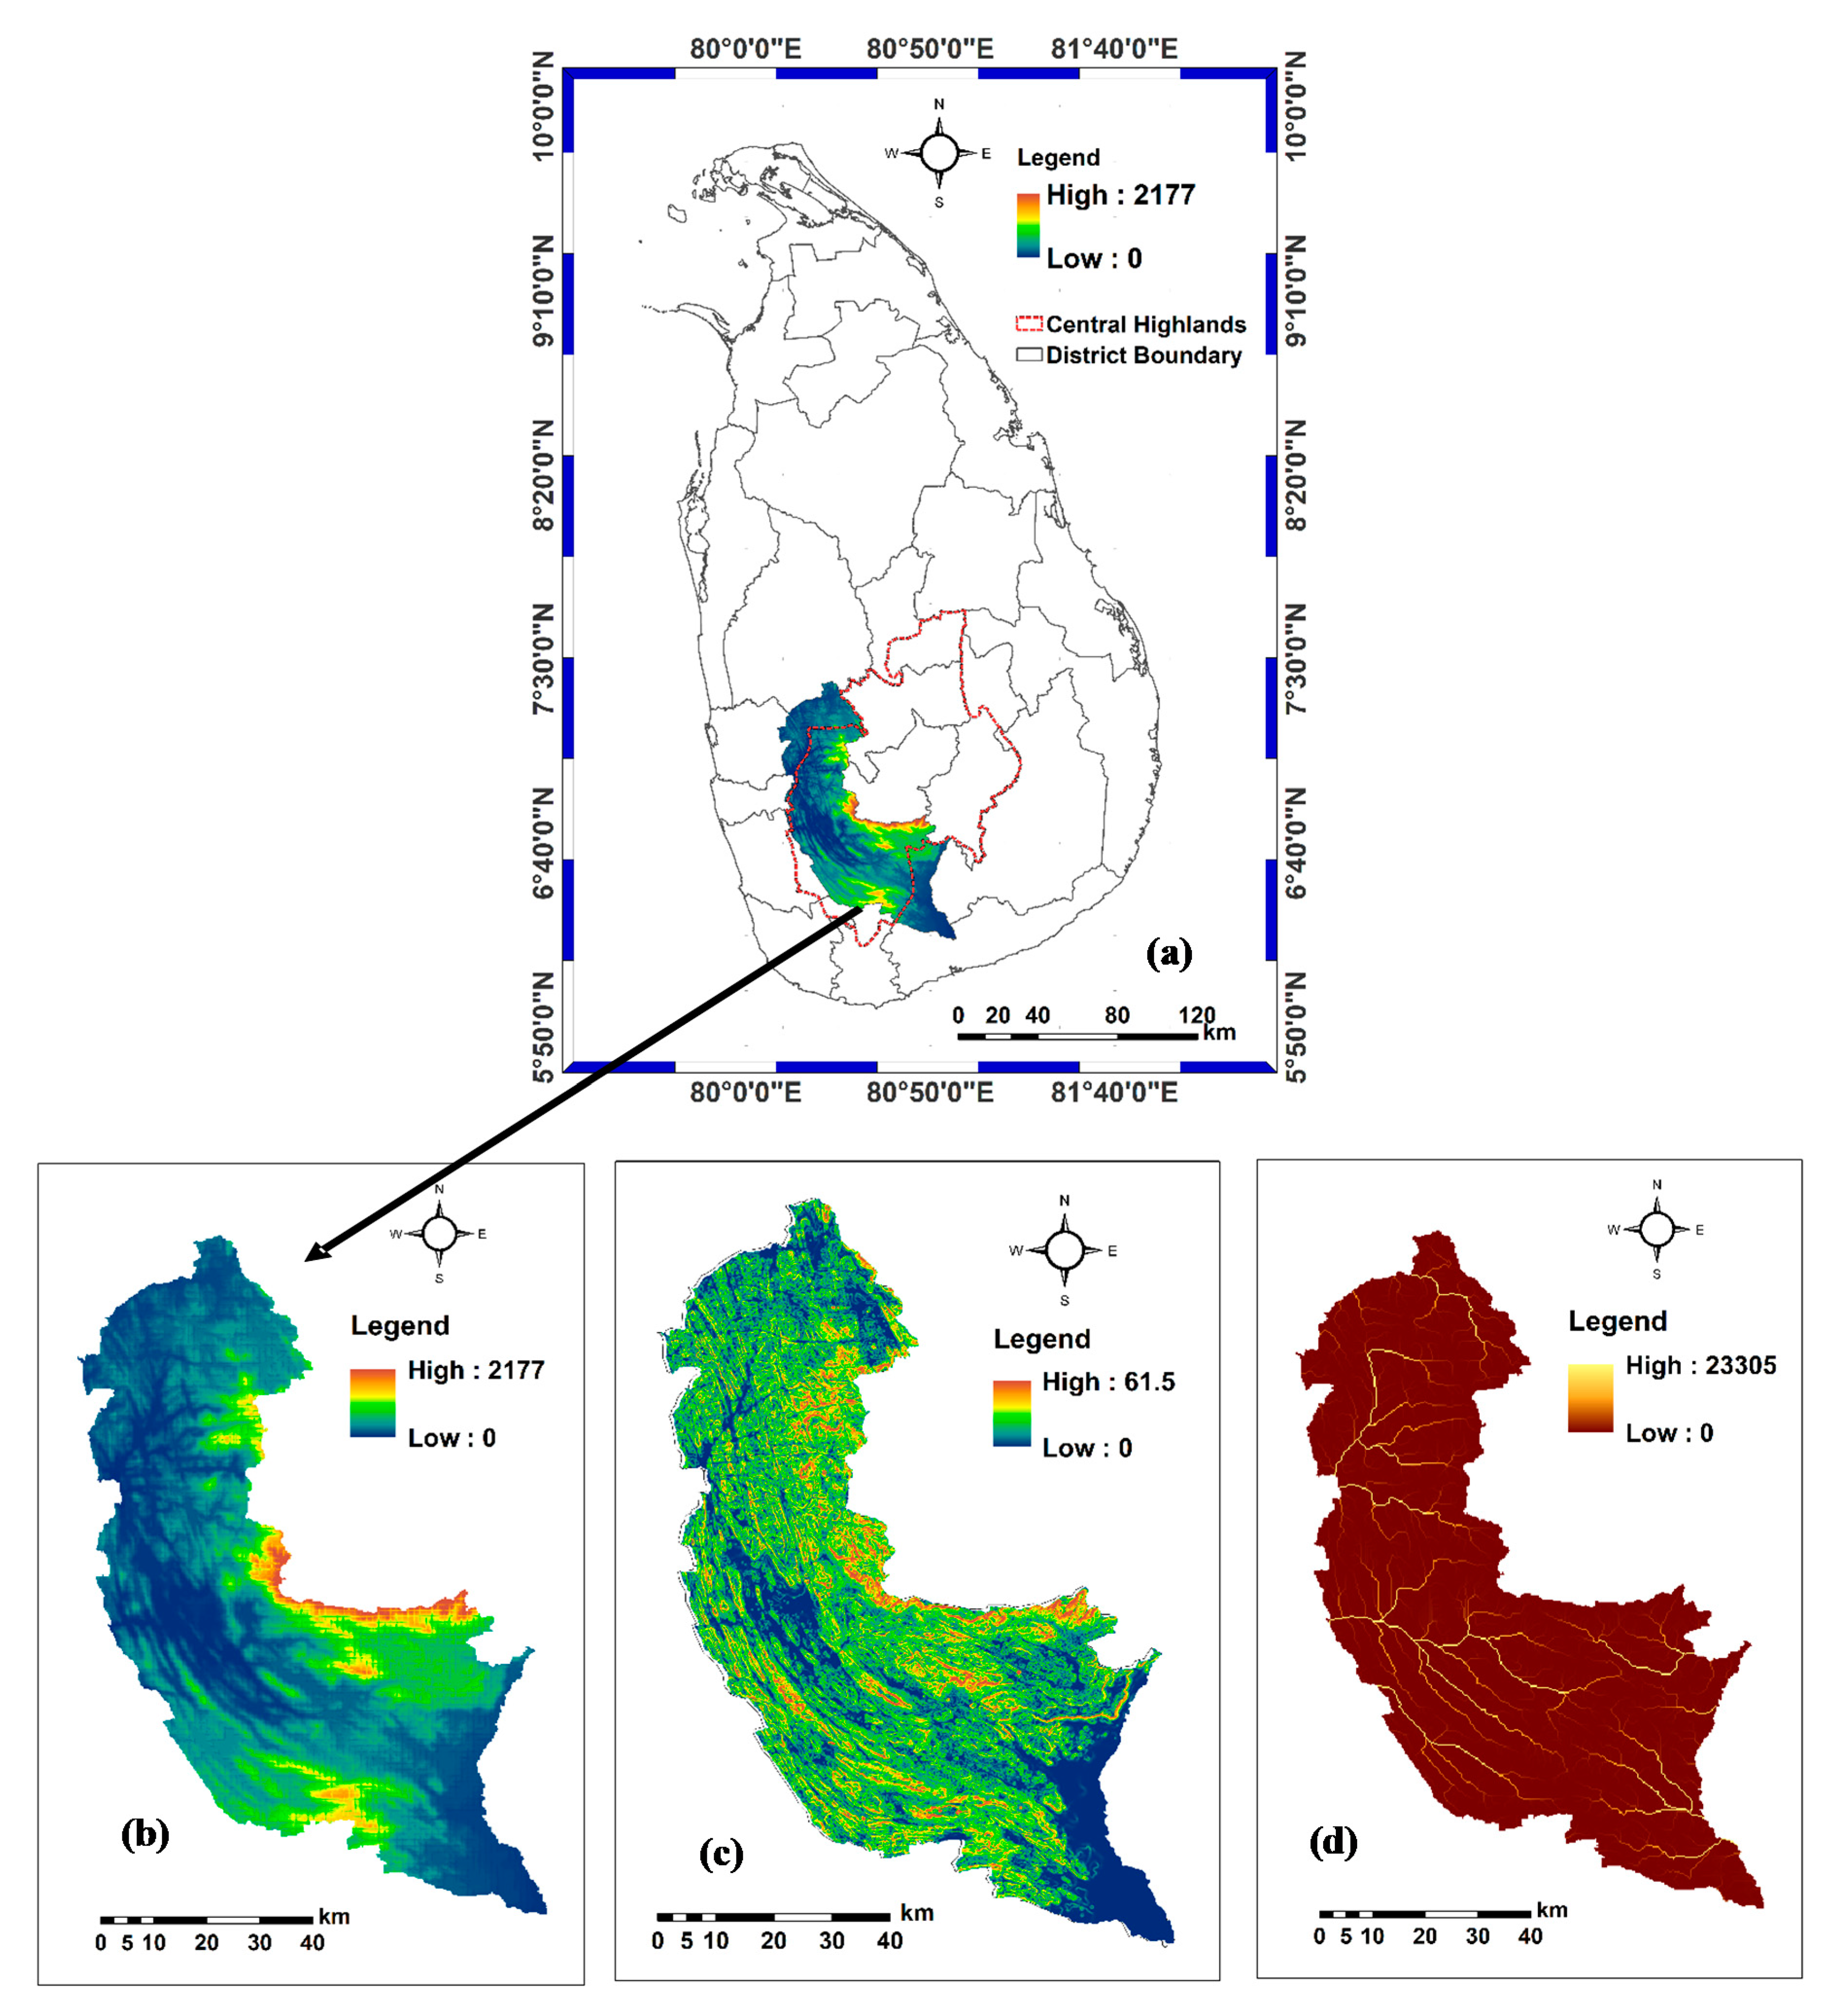
2.1. Study Area

Sabaragamuwa, which is one of the Provinces in the southwestern side of the Central Highlands in Sri Lanka, is a highly sensitive area for environmental deterioration and natural disasters [29]. Its coverage is 4952 km2, and it is located between the longitude of 80°12′3″ E and 80°56′12″ E and between the latitude of 7°22′28″ N and 6°13′59″ N. The altitude of the study area ranges from 0 to 2177 m above mean sea level. The mean altitude is approximately 1085.5 m. Sabaragamuwa consists of two districts, namely, Ratnapura and Kegalle. The climate is characterized as humid with tropical monsoon weather. The annual average rainfall is greater than 3200 mm [10]. Most of the rainfall (southwest monsoon and second inter-monsoon) occurs in May–August, October, and November. The province has 16 agro-ecological regions covering all the three major climate zones (wet, dry, and intermediate zones). Tropical rain forests, such as parts of ‘Sinharaja’ and ‘SriPada’, are also located in this province. Sabaragamuwa is drained by four major rivers, namely, the Kelani, Kalu, Gin, and Walawe rivers, located at the western and southern parts of the country. Kelani river, which is one of the major rivers, provides water supply to the capital city of Colombo and sourcing water for other purposes, including power generation [12]. The location map of Sabaragamuwa Province in Sri Lanka is shown in Figure 1a, and a digital elevation map (Figure 1b), slope angle map (Figure 1c), and river distribution map (Figure 1d).

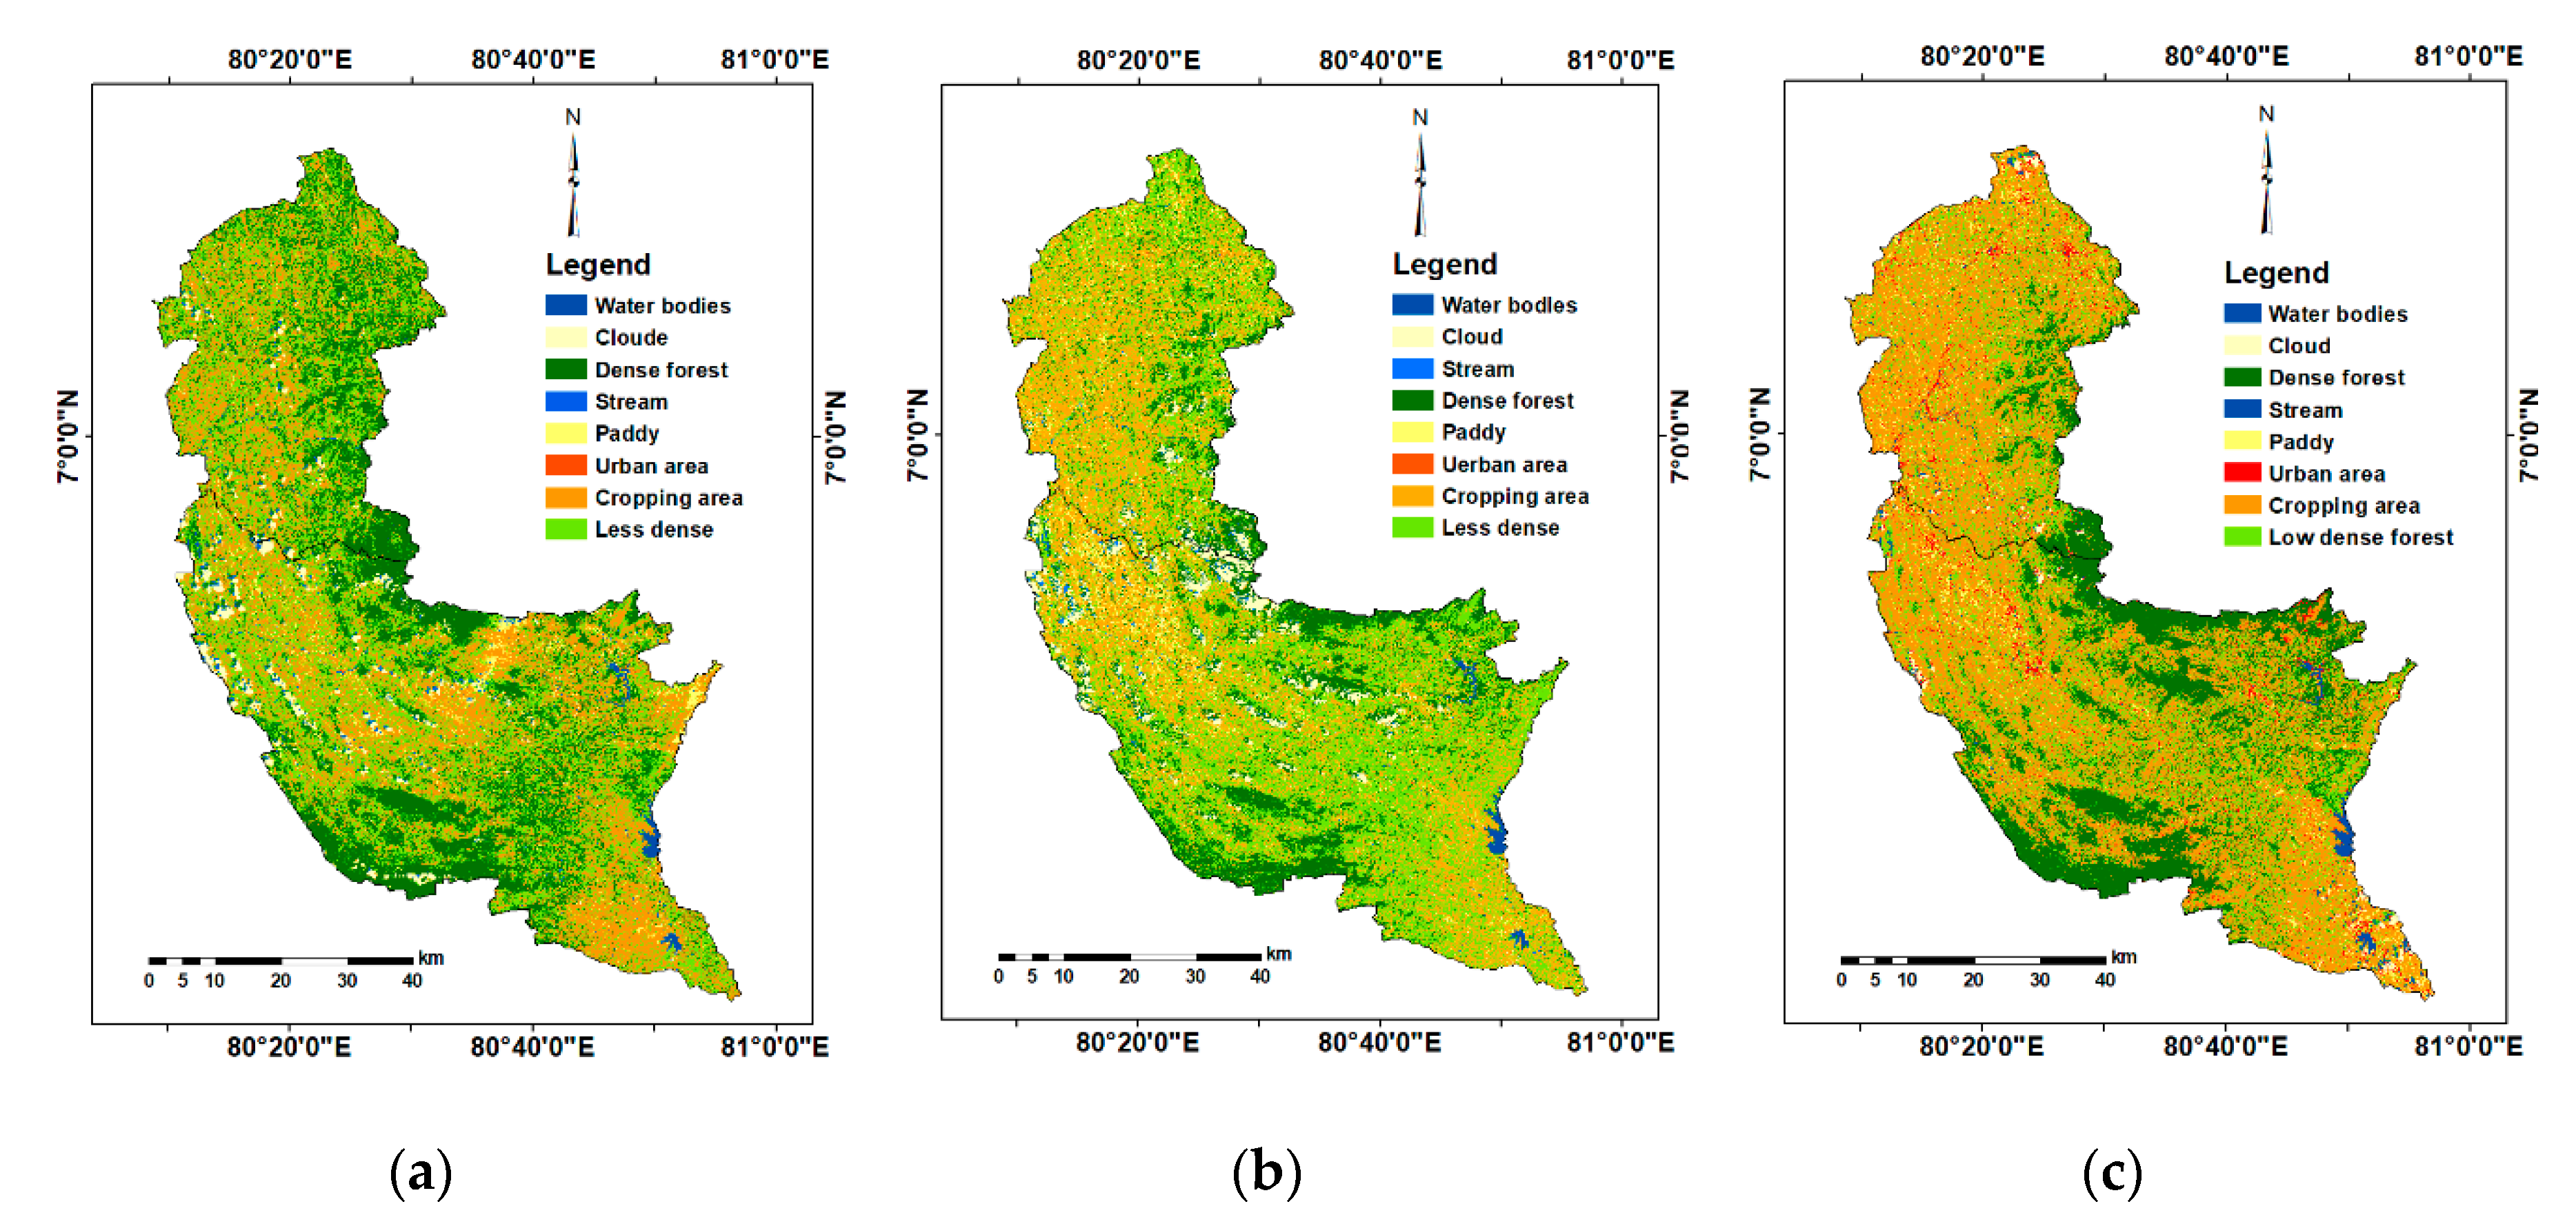
2.2. Remote Sensing Data and Image Processing

Landsat dataset from Landsat 5, 7, and 8 (path 141, row 56) for the years 2000, 2010, and 2019 were downloaded from the website of the USGS Earth Explorer (https://earthexplorer.usgs.gov/) and used to delineate the LULC classes of the region. Nay, Burchfield, and Gilligan [43] have highlighted that Sri Lanka is one of the cloudiest places in the world. In this context, three different satellites were used to acquire the dataset. Two images of each year from same satellite were considered covering the whole study area. Six images, two images on the same day, were used to create a mosaic for image classification [17]. The image analysis tool in ArcGIS 10.4 was used for image processing. The radiometric and atmospheric correction for each acquired image was applied. Then, the mosaic datasets were geometrically corrected and registered as a WGS 84 datum for UTM zone 44N projection. The pan-sharpening method was employed by merging multispectral and panchromatic subsets to enhance the spatial resolution of the image [18,19]. The multi-spectral data with 30 m pixel resolution and four spectral bands (blue, green, red, and near infrared) were used for image classification. The details of the downloaded Landsat dataset are given in Table 1.

2.3. Land-Use Land-Cover Change

The image analysis technique was applied to delineate the LULC classes from the satellite images. The image analysis algorithms can be divided into two categories: pixel-based image classifiers and object-based image classifiers [18]. The object-based image classification method has been used as a robust and accurate method for image classification [17,18]. The selection of optimum segmentation is one of the challenges in the object-based image classification method [19]. Hence, the mixed method was used to classify the images [17]. The images’ multi-temporal Landsat 7 (ETM+) and 8 (OLI) bands (5, 4, and 3) and Landsat 5 (TM) bands (4, 3, and 2) with false-color composites were used to distinguish the different land-cover types and classify the land area into homogenized groups. An interactive supervised classification method was used to classify the images initially. The tool entails a supervised classification method that can speed up the classification process. On average 80 training data sets were considered for each LULC class. Seven land-use classes were defined from the classified images, prior knowledge of the area, and the LULC map of the Land Use Policy Planning Department (LUPPD) of Sri Lanka. The land use classes were classified according to the Anderson classification scheme, as in Burian et al. [44]. Table 2 shows the details of the land use classes. The same methodology was employed to create other image layers for land-use change detection. The time-series of the multispectral datasets of the study area was analyzed. The land-use classes were retrieved for 2000, 2010, and 2019, respectively, from the Landsat images. The LULC change was investigated from 2000 to 2019 and quantified the change during this period. An accuracy assessment is required to ensure the correctness of information on the LULC change driven from the Landsat images. Thus, image classification accuracy assessment was performed using approximately 289 ground control points for each image. The field data, google map, and land-use maps produced by the LUPPD were used for further validation and verification by the above land-use classes generated from the Landsat satellite image dataset. The image accuracy was quantified with a confusion matrix by computing user’s accuracy (accounting for errors of commission), producer’s accuracy (accounting for errors of omission), overall accuracy, and the Kappa coefficient for each corresponding image. This method for the accuracy assessment is widely used by other researchers in similar studies [45,46].

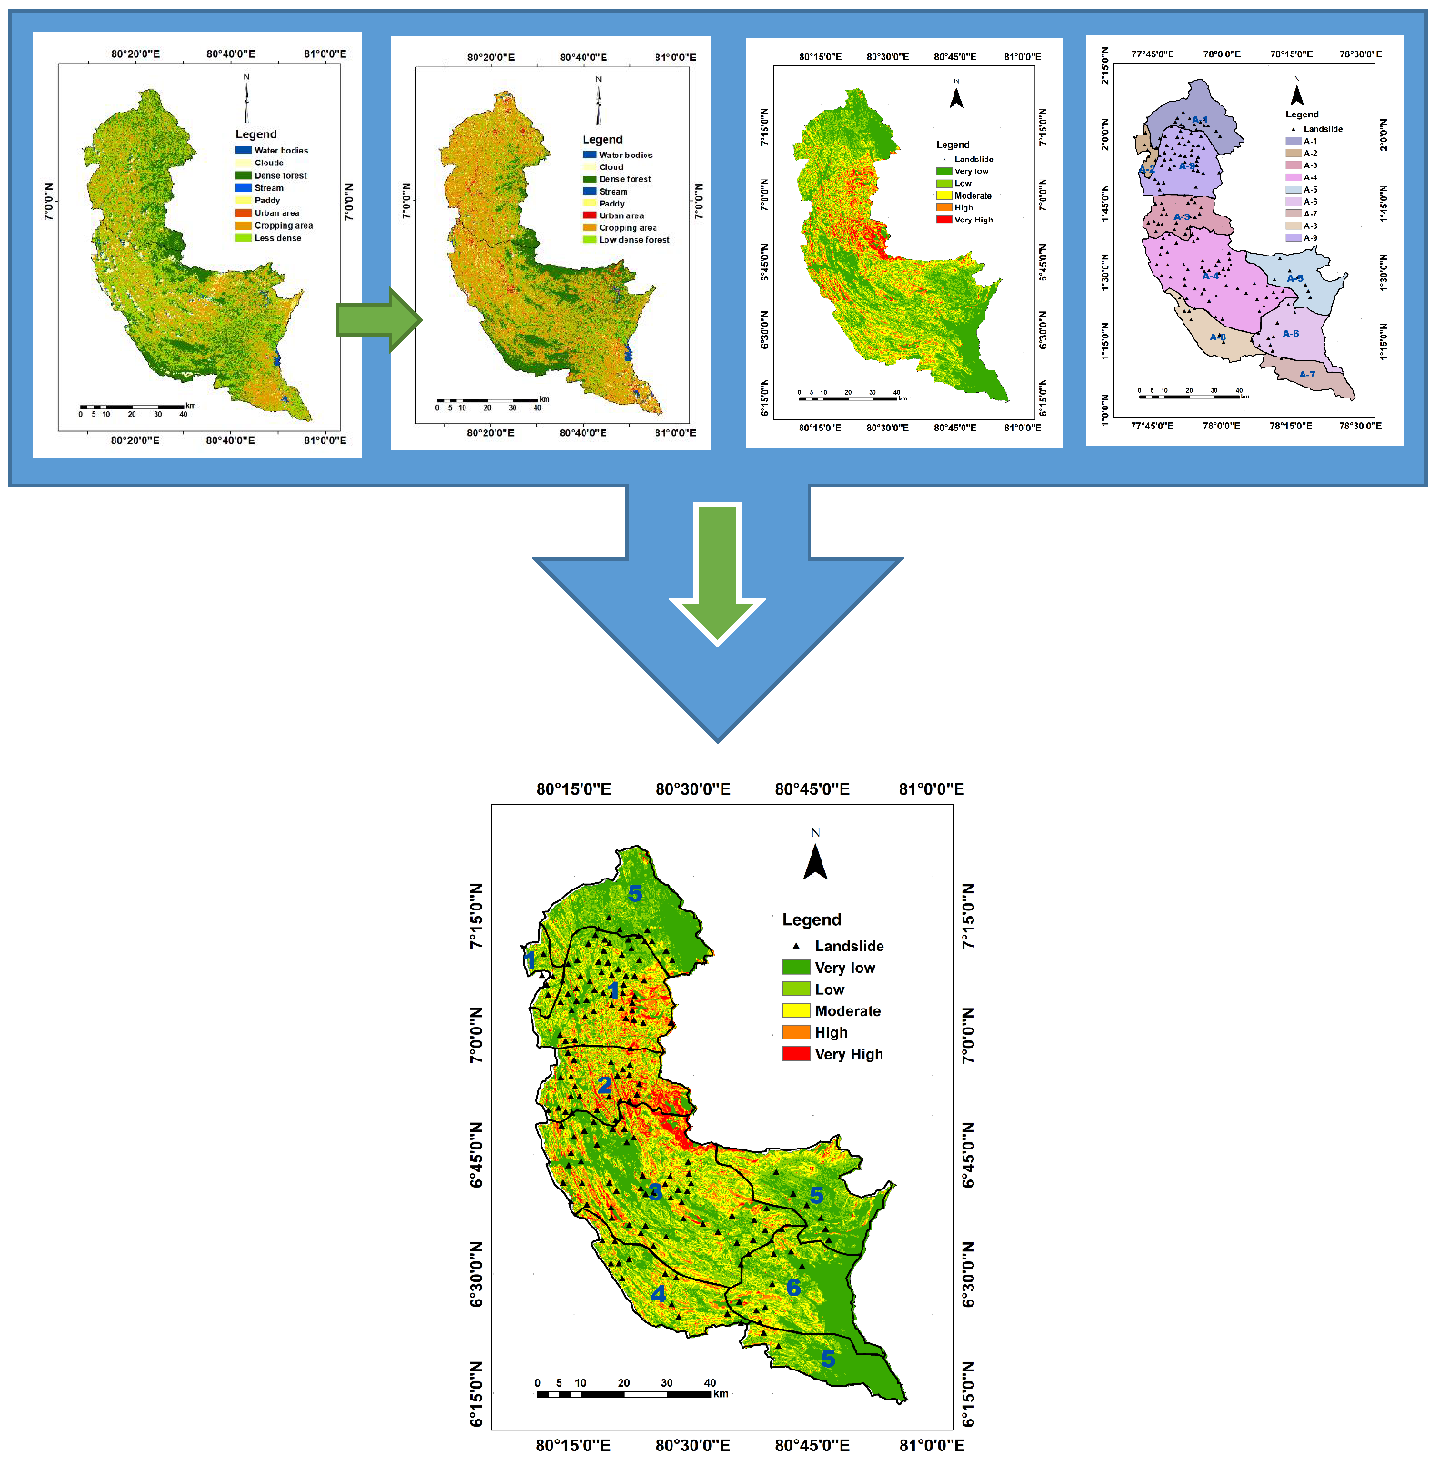
2.4. Soil Erosion Assessment

Soil erosion can be examined using various soil erosion models. The most popular empirical base models are the universal soil loss equation (USLE) model [47] and the RUSLE model [20,48]. These models are widely employed in agricultural and hilly watershed applications [12,16,18,33]. In this study, the RUSLE model (Equation (1)) is employed with geo-informatics techniques to assess the average annual soil loss rate. The RUSLE model [20] can be mathematically expressed as given in Equation (1):
A = R × K × LS × C × P
The RUSLE model (Equation (1)) uses the average annual soil erosion rate (A) in soil mass per unit area per year (tons/ha/year). The R is rainfall erosivity factor (MJ mm ha−1 h−1yr−1), K represents soil erodibility factor (t ha h MJ−1mm−1), LS is slope length and steepness factor (dimensionless), C indicates crop management factor (dimensionless) while P denotes land management factor (dimensionless). The RUSLE model is often used as an index method to determine the relationship amongst climate (R-factor), soil (K-factor), topography (LS-factor), land use (C-factor), and land management (P-factor) and how each factor affects soil erosion caused by raindrop impact on surface runoff [15,16,49].
Geo-spatial input data on rainfall, soil, and terrain factors and land cover and management practices were used for soil erosion hazard classification and mapping. All spatial layers were generated in raster format with 60 m resolution by using grid-based GIS analysis. Rainfall erosivity (R-factor) was calculated using 30 years of precipitation data, whilst soil erodibility (K-factor) was derived using a soil map with the local soil conditions prepared by the Department of Irrigation (1984). The L and S-factors, which are also known as topographic parameters (slope length, steepness, and shape), were derived from the digital elevation model (DEM) [50]. The crop management (C-factor) and conservation practices (P-factor) were computed from the values using the recent literature [12,36,42].

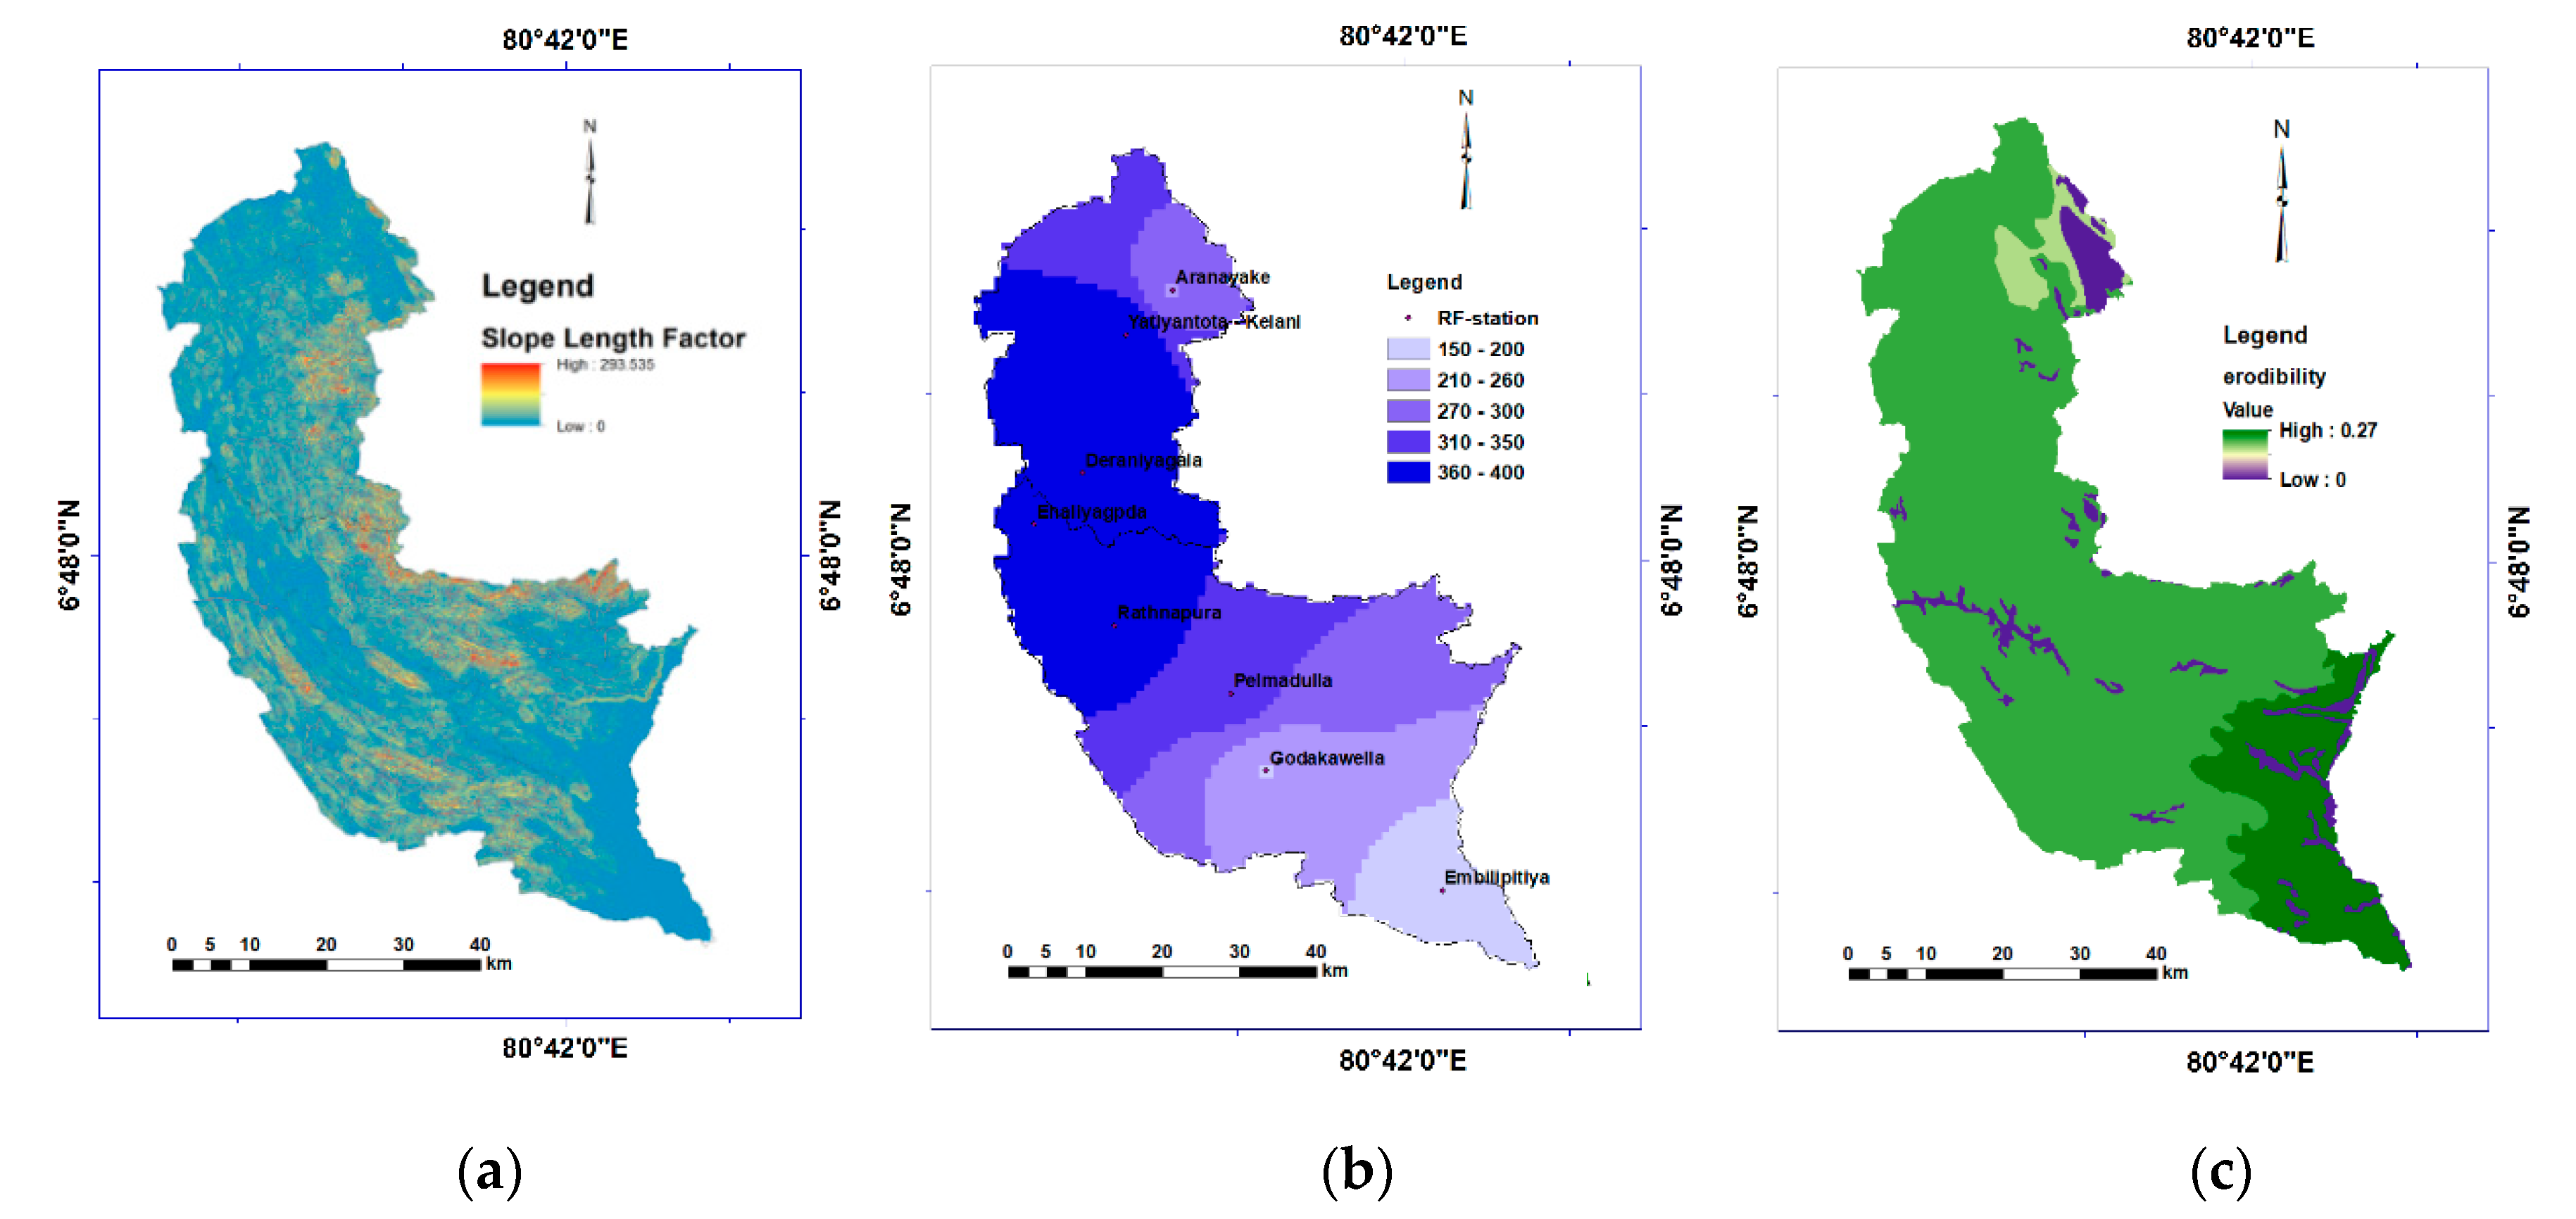
2.5. Data Processing for Factor Generation

The rainfall erosivity (R-factor) represents the influence of rainfall on soil erosion [47,51]. Thirty years of daily rainfall data (1988–2018) from eight rain-gauge stations (Aranayake, Deraniyagala, Ratnapura, Pelmadulla, Yatiyantota, Ehaliyagoda, Embilipitiya, and Godakawela) were collected from the Department of Meteorology and the Department of Agriculture in Sri Lanka. The mean annual precipitation can be found in the Supplementary Material (Table S1 and Figure S1). R-factor estimation was performed using the following (Equation (2)), as proposed by Wickramasinghe and Premalal in 1988 [52] for the Sri Lankan condition [33,53]:
R = (972.75 + 9.95 × P)/100
where, R is the annual rainfall erosivity (MJ mm ha−1 h−1 yr−1), and P is the mean annual precipitation (mm). The calculated R factor for each station was converted to a raster surface with a 60 m grid cell by using interpolation techniques (IWD) for the spatial analysis in ArcGIS. A similar method was employed by the Wijesundara, Abeysingha, and Dissanayake [36] in Kiridi Oya river basin, Fayas et al. [12] in Kelani river basin and Dissanayake, Morimoto, and Ranagalage [33] in Kotmale watershed. The R-factor ranges between 152.5 to 399 MJ mm ha−1 h−1yr−1. The higher value indicates high capability of rainfall to cause soil erosion while lower value shows low capability of rainfall to cause soil erosion [54].
The soil erodibility (K-factor) indicates the soil susceptibility to erosion, which is dependent on soil type and properties of the soil, such as texture, organic matter, and permeability [15]. The K-factors in this study were obtained from the previous studies of Wijesekera and Samarakoon [53] and Senanayake, Munasinghe, and Wickramasinghe [42]. The most prominent soil type in Sabaragamuwa is the red-yellow Podzolic soil with steeply dissected hilly and rolling terrain characteristics. The K-factors of the different types of local soil are given in Table 3. The values of these factors were used to generate the K-factor map of the Province. The K-factor values range from 1 to 0.27 t ha h MJ−1mm−1. The soil erosion susceptibility increases with higher K-factor values [55].
Pradhan et al. [15] reported that topographic factors represent the length (L) and steepness (S) of a slope. These factors can provide the terrain characteristics of a given site, and they are considered altogether to identify the combined effect of the slope angle and the slope length. The DEM, which can be used to identify the terrain characteristics (slope length and steepness) for this study, was generated using the digital contour map (1:50,000) from the Survey Department of Sri Lanka (Figure 1b). Equation (3) adopted from Moore and Burch [56,57] was used to compute the slope length and steepness (LS-factor). Slope angle and flow accumulation were extracted from DEM by using ArcGIS (Figure 1c,d). The LS-factor is dimensionless. The LS-factor values range between 0 and 293.5. The higher LS-factor value means a higher impact on soil loss while lower value means lower impact on soil loss [15,58].
LS = (Flow accumulation × Cell size/22.13)0.4 × sin (Slope angle in degrees/0.0896)1.3
The crop management (C-factor) corresponds to ground cover management, such as the effect of soil disturbance due to changes in land-use pattern. The C-factor map was developed using the LULC image classification map derived from Landsat satellite data. The values for each land-use class (Table S2) in the study area were drawn from past studies [42,59]. The C-factor is dimensionless and its values vary between 0 and 1. The C-factor value closer to zero means well protected land cover while this value reaches 1 for barren land [16]. The present study’s values ranged from a minimum value of 0.2 to maximum value of 0.73. The conservation practice (P-factor) entails the use of the soil loss ratio with a specific conservation practice, particularly soil loss due to tillage practices [20,53]. P-factor is the conservation support-practices factor which is also dimensionless [58,60]. The values of the P-factor range from 0 to 1, in which high values were assigned to steep areas with no conservation practices, whilst low values correspond to built-up-land and plantation areas with strip and contour cropping [58,61]. This means the higher values indicate no conservation while lower values indicate sufficient conservation practices. P-factor values of this study ranged from 0 to 1. In this study, the P factor was attributed from past studies. Table S2 in the Supplementary Material provides the details of C-factor and P-factor values for each land-use class.
The R, K, LS, C, and P-factor maps were computed by means of the ArcGIS environment. The spatial analyst extension and the raster calculator in ArcGIS 10.4 software were employed to estimate soil erosion loss (ton/ha/year) by using the RUSLE model and generated the soil erosion hazard map for the years of 2000 and 2019. These soil erosion hazard maps were reclassified into five classes: very low (0–5 t/ha/year), low (5–10 t/ha/year), moderate (10–20 t/ha/year), high (20–50 t/ha/year), and very high (>50 t/ha/year) in accordance with the previous classifications of Vrieling, Sterk, and Beaulieu [62] and Pradhan et al. [15]. The soil erosion rates for years 2000 and 2019 were calculated separately to find out the change during this period.

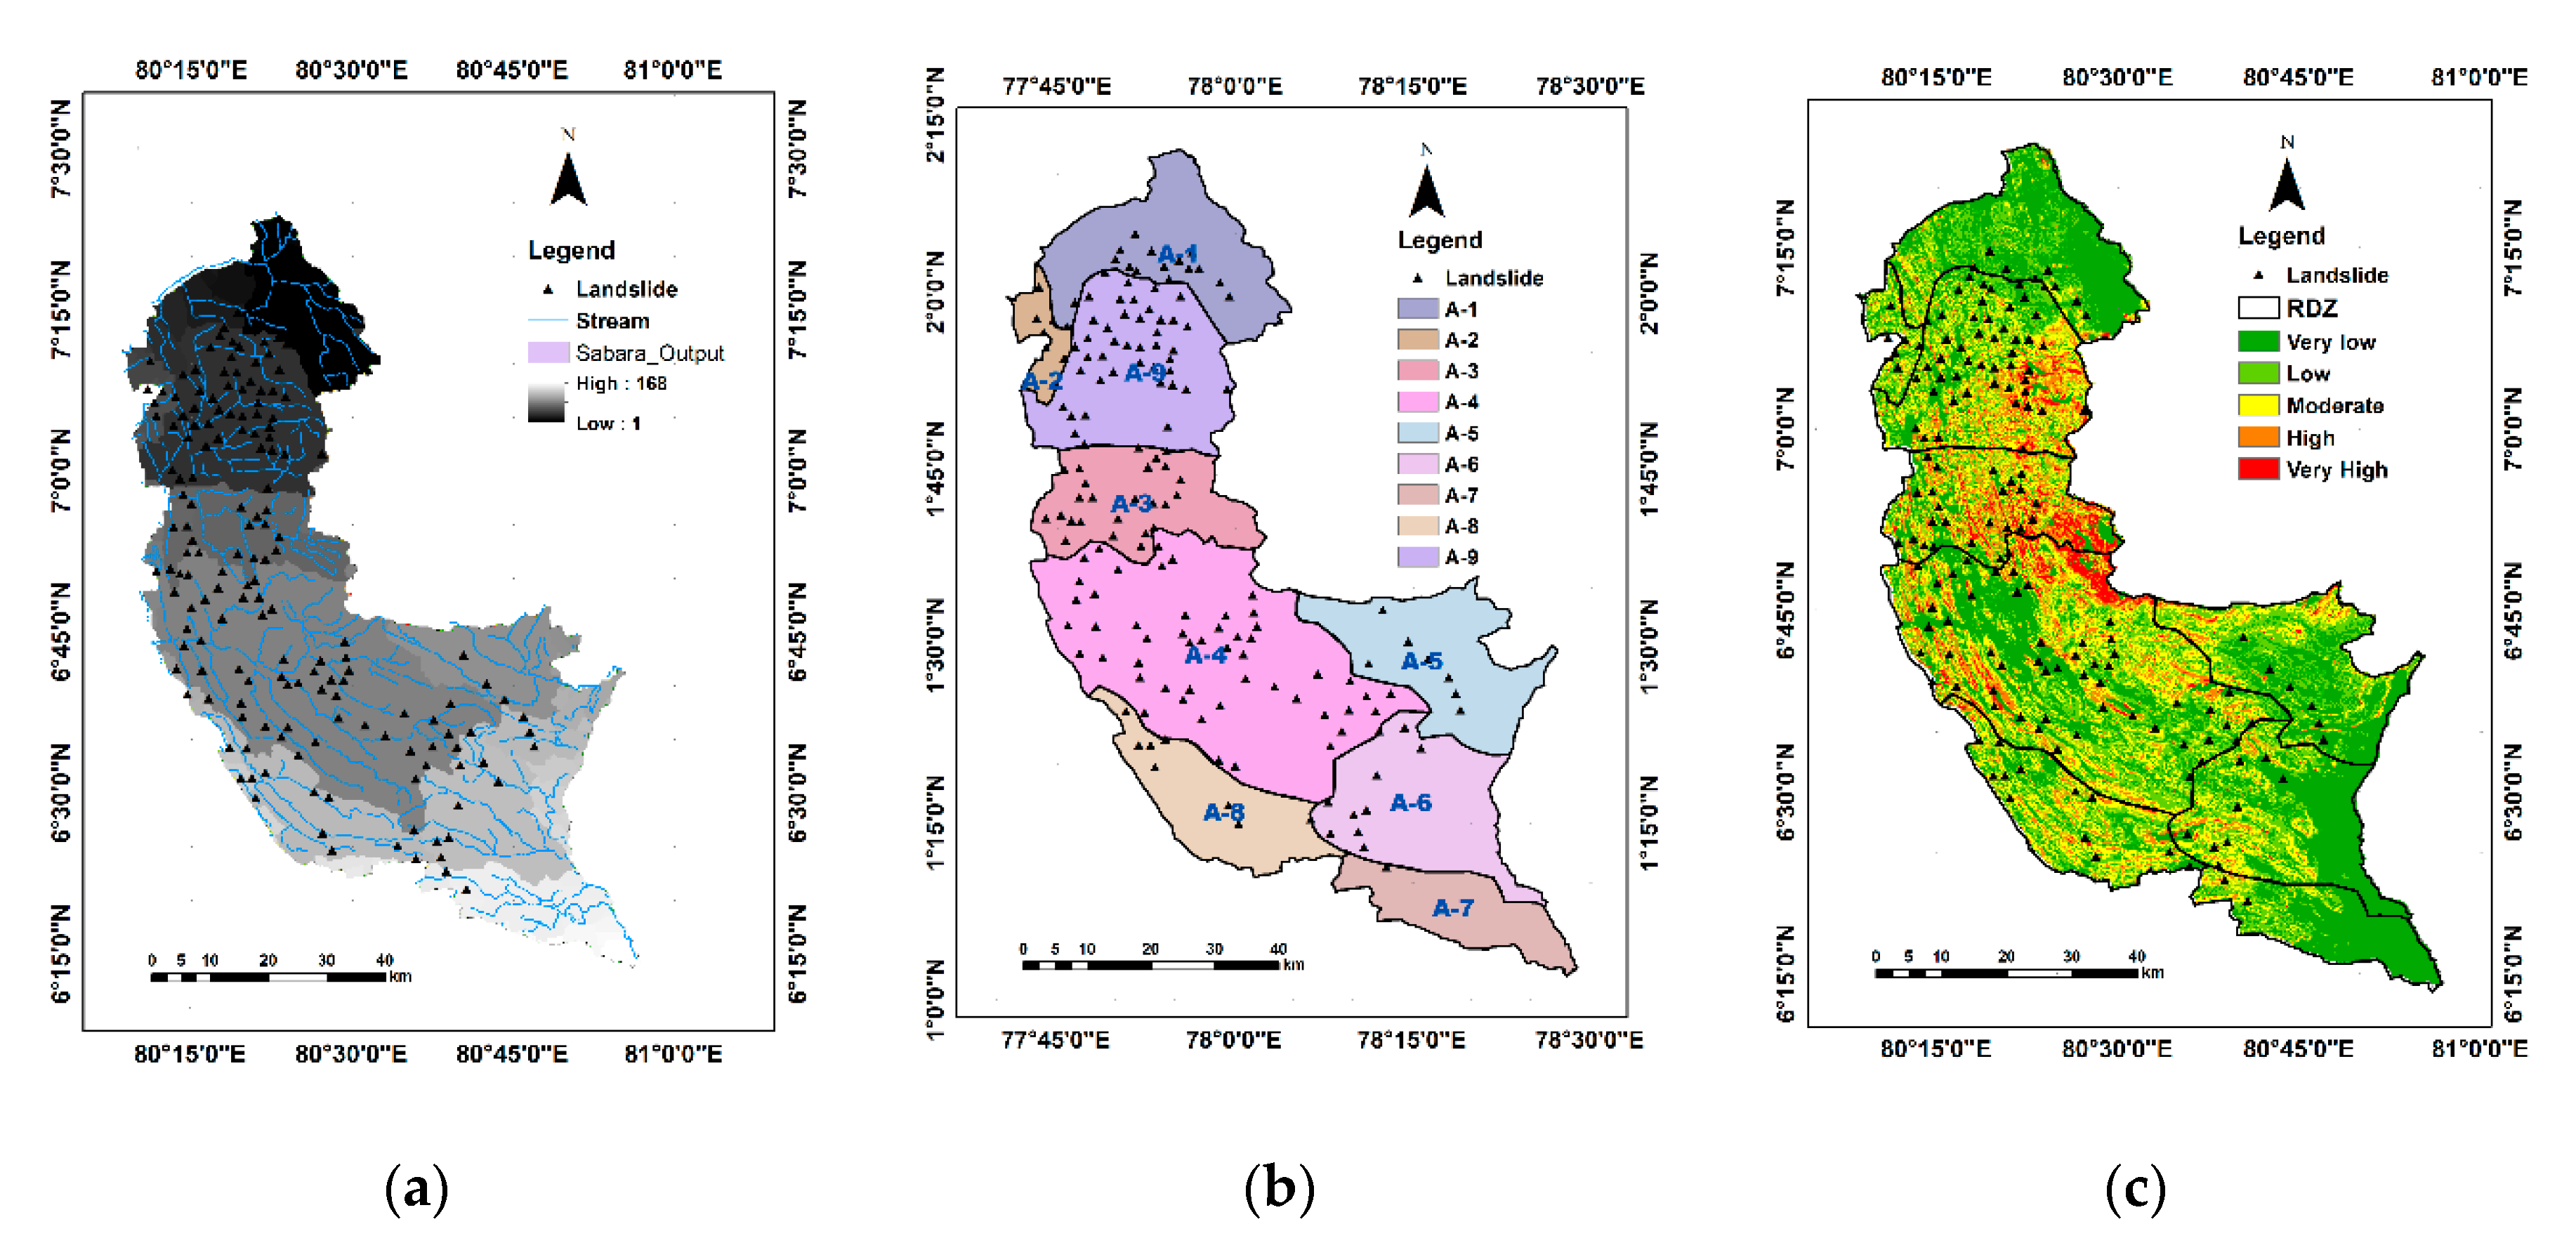
2.6. Landslide Inventory Map and Frequency Ratio Calculation

Based on the severity of the damages (number of deaths and injured from the landslide event) 163 landslides incidents were selected from the ‘Desinventar’ disaster information system of the United Nations International Strategy for Disaster Reduction (http://www.desinventar.lk:8081/DesInventar/) for the period from 2000 to 2019 to develop a landslide inventory map in GIS environment, to assess the relationship between the landslide incidents and soil erosion. The frequency ratio model is a probabilistic model with a reasonably high-prediction accuracy, and it is simple to use [63]. Landslide frequency ratio (LFR) can be computed using following equation (Equation (4)) as described by several researchers [22,64,65,66].
LFR = N ( Si ) / N ( Ni ) N ( Si ) / N ( Ni )
where,
N(Si): the number of pixels containing landslides in class (i),
N(Ni): total number of pixels having class (i),
ΣN(Si): total number of pixels containing landslide,
ΣN(Ni): total number of pixels in the whole area of basin.
The frequency ratio method was employed to evaluate the correlation between soil erosion hazard and land use change of the study area. The frequency ratio was computed for each land-use class and soil erosion hazard class. The landslide incidents were overlaid on the erosion hazard map and land-use map to identify the correlation on landslide incidents. According to Shahabi and Hashim [66] and Meena, Ghorbanzadeh, and Blaschke [22] the average value of the landslide frequency ratio is 1 for the occurrence of landslide incidents in a particular area. The frequency ratio more than 1 (>1) refers to higher spatial correlation and less than 1 (<1) refers to lower spatial correlation, regarding the occurrence of landslide incidents.
Furthermore, the landscape vulnerability was assessed and ranked based on the frequency ratio, soil erosion rates, and land-use change for soil conservation. The ranking was applied for each river distribution zone (RDZ). This study considered the flowing area of respective rivers within the administrative boundary (Sabaragamuwa Province) as a river distribution zone. The DEM was used to extract RDZs of the study area as per the drainage characteristics (as shown in Figure 2) and delineated into nine RDZs for prioritization. These nine delineated RDZs are coded as A-1 (Area-1), A-2 (Area-2), A-9 (Area-9). Moreover, this study explored the land-use change at RDZs level due to its importance for soil conservation. The number of landside incidents in each RDZ was used to compute the LFR. The soil erosion hazard classes and land-use change together with LFR were used to rank the RDZs. The overall methodology is illustrated in Figure 2.

3. Results

3.1. LULC Change

Olofsson et al. [67] emphasized the importance of a validation process to achieve good study outcomes. Here, the confusion matrix was employed to assess the overall accuracy of the image classification. The overall accuracy is 86.89% for 2000, 96.70% for 2010, and 84.4% for 2019, with Kappa coefficients of 0.8438, 0.9150, and 0.8152, respectively. The confusion matrix between ground truth data and land-use classes for 2019 are given in Table 4 and respective values of commission, omission, producer accuracy and user’s accuracy are given in Table 5. The rest of the confusion matrix tables for 2000 and 2010 are given in the Supplementary Material (Tables S3 and S4).
The land-use classes were categorized according to the land-use classes level-II, of the Anderson classification scheme [19] namely, dense forest, less dense forest, water body, stream, paddy, cropping area, and urban area. Tea and rubber plantations and home gardens, as per LUPPD classification, cannot be clearly distinguished in the images; hence, they were considered as cropping areas. The processed LULC maps for 2000, 2010, and 2019 are given in Figure 3a–c. The respective findings from the analysis are given in Table 6.
The overall LULC change is deduced by comparison. The cropping areas and the urban areas in Sabaragamuwa Province have increased by 17.96% and 3.07%, respectively. Simultaneously, the less dense forest and the dense forest in the Province have decreased by 14.18% and 6.46%, from 2000 to 2019, respectively. Anthropogenic activities, such as expansion of agriculture activities in cropping areas, soil tillage, crop harvesting, land levelling and trench digging during quarrying [2,68], urban and infrastructure development, deforestation, and abandonment of agricultural lands due to low productivity are the likely reasons of LULC change in this period. For instance, the extent of tea plantations in Sabaragamuwa Province has increased by 58.71 km2 from 2008 to 2015, according to the land-use statistics of LUPPD.

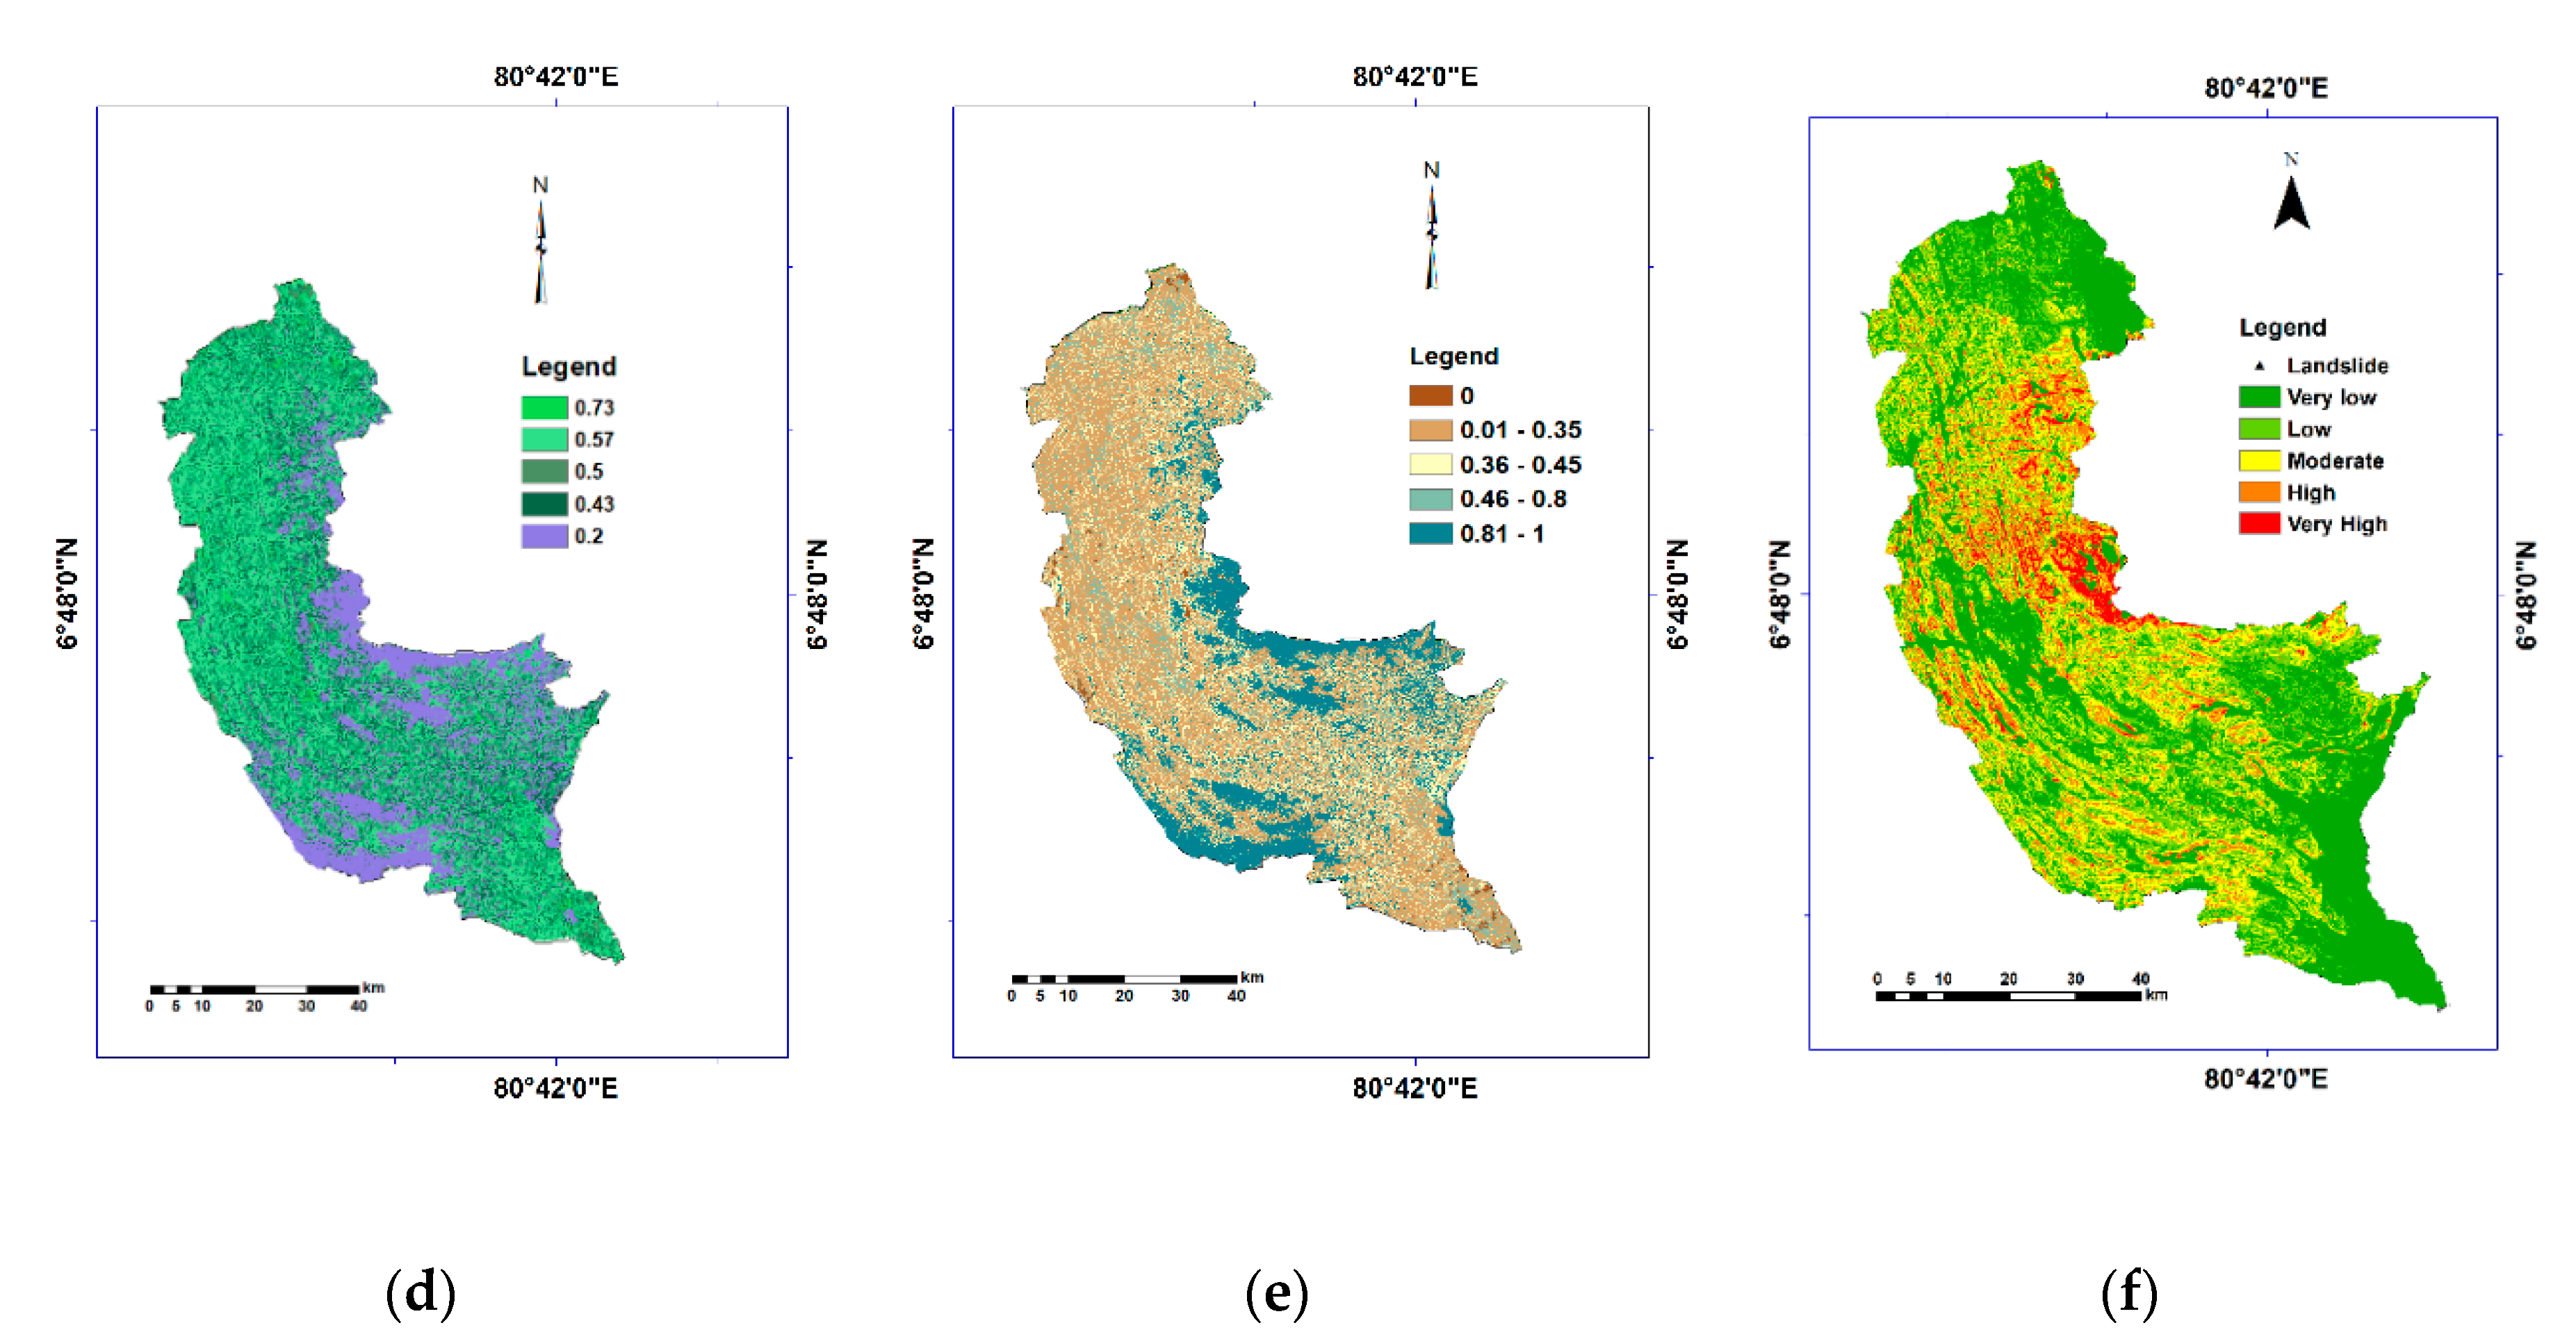
3.2. Soil Erosion Hazard

The slope length and steepness factor (LS-factor) map generated by Equation (3) is shown in Figure 4a. The rainfall erosivity (R-factor) map covering 30 years is shown in Figure 4b. The soil erodibility (K-factor) map is shown in Figure 4c. The crop management (C-factor) map and the conservation practice (P-factor) map are shown in Figure 4d, and Figure 4e, respectively. The generated soil erosion hazard map for the year 2019 can be found in Figure 4f.
The soil erosion hazard map of Sabaragamuwa Province (Figure 4f) shows 9.5% of the area in the high-erosion hazard category and 3.4% in the very-high category. This finding indicates that approximately 13% of the total land area of Sabaragamuwa Province is highly vulnerable to soil erosion. In addition, approximately 22% of the total land area is moderately vulnerable to soil erosion. Findings further reveal the average annual soil erosion is 14.56% in the year 2000 and it has increased to 15.53% in the year 2019 (Table 7). Literature shows the average soil erosion rate for a tropical region is often less than 10 t ha−1 year −1 [69]. However, findings indicate higher soil erosion rates than the average of a tropical region. The details of soil erosion category, rate, and respective land area are given in Table 7.
Jayasinghe, Wijekoon, and Gunatilake [38] reported that landslides frequently occur in cultivated agricultural lands with red-yellow Podzolic soil types and steeply dissected, hilly, and rolling terrains.

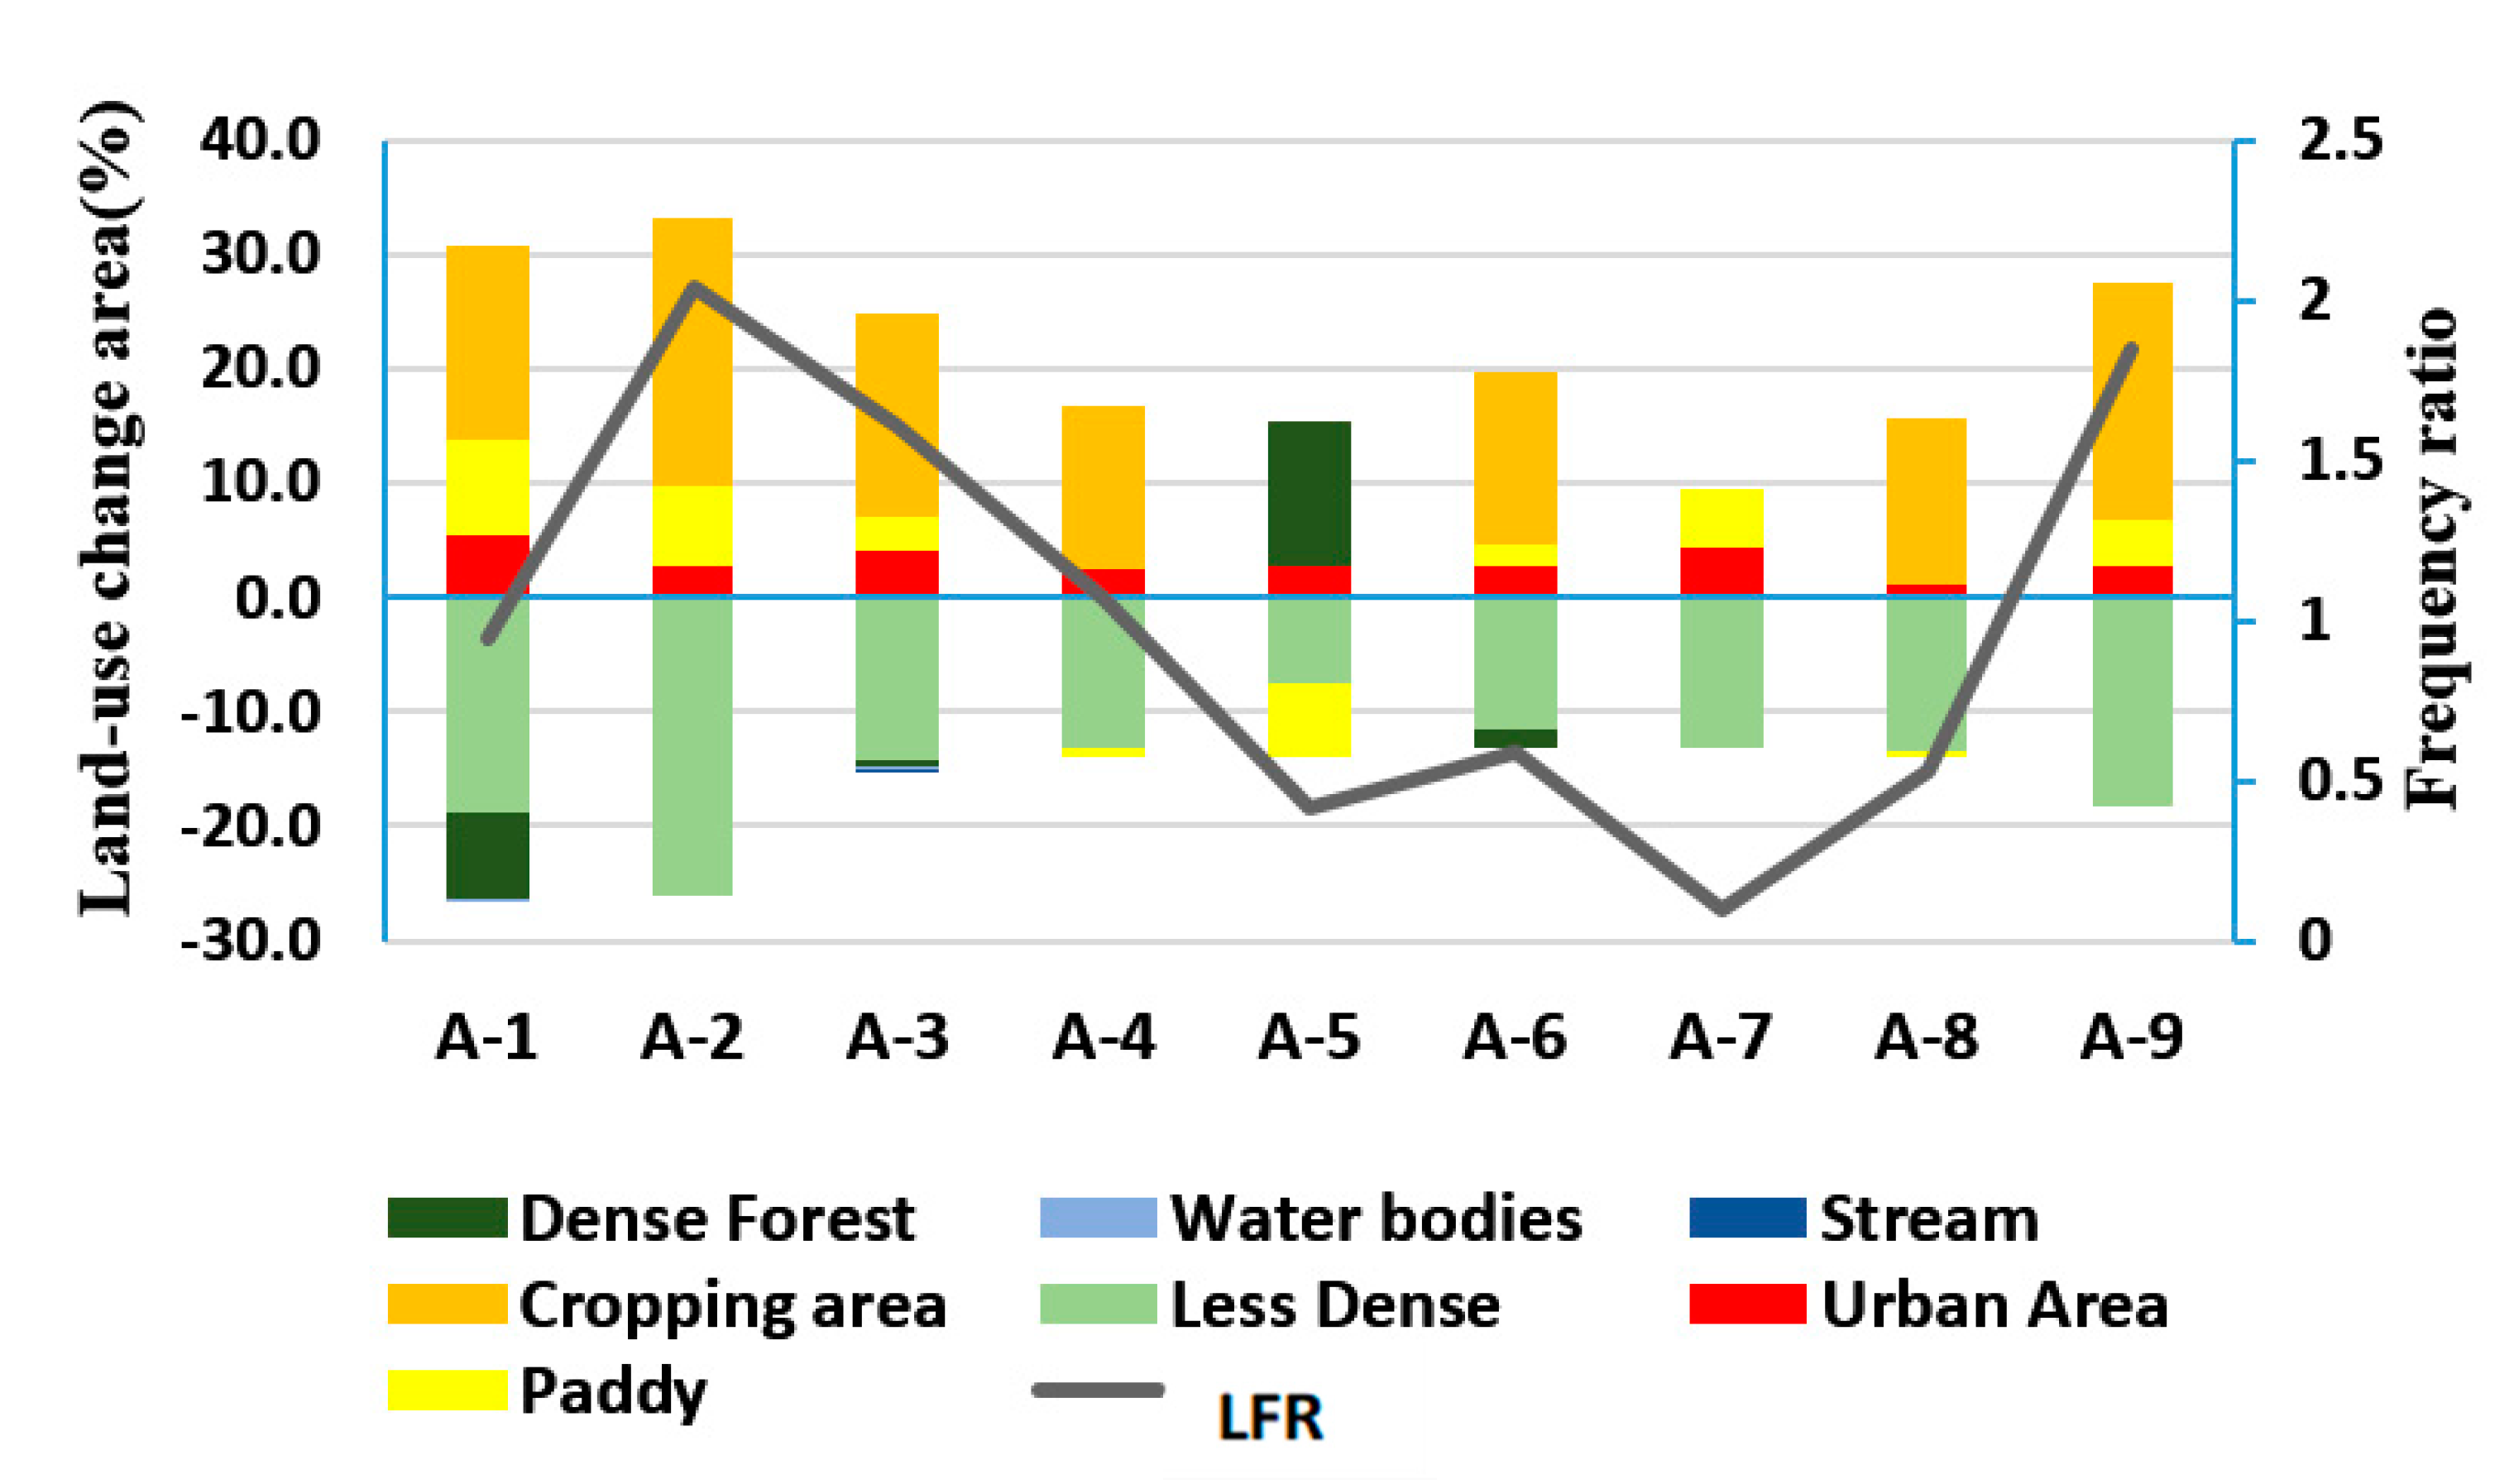
3.3. Land-Use Change and Its Correlation with Landslides

This study estimated the LFR for each land-use class in 2019. The LFR of each land-use class can be found in Table 8. The higher LFR (>1) was observed in a less dense forest area, cropping area, streams, and urban areas. The findings indicate higher correlation between these land-use classes and landslide incidents [22,66,70].
The prominent land-use change in each RDZ was calculated to find out the correlation between land-use change and landslide incidents. The land-use change in each RDZ is provided in Supplementary Material Table S5. The most prominent land-use changes of RDZs are observed in cropping area and less dense forest classes. As revealed in Table 7, LFR is greater than 1 in cropping area (1.16) and less dense forest classes (1.18). The LFR is greater than 1 indicating a higher correlation between land-use change and landslide incidents [22,71]. Furthermore, Figure 5 shows the percentage of land-use change and LFR over each RDZ. The following RDZs, A-2, A-3, A-4, and A-9, show the LFR is greater than 1. Overall, these results indicate that increasing cropping area may contribute to inducing the landslide occurrence at RDZs (Figure 6a).

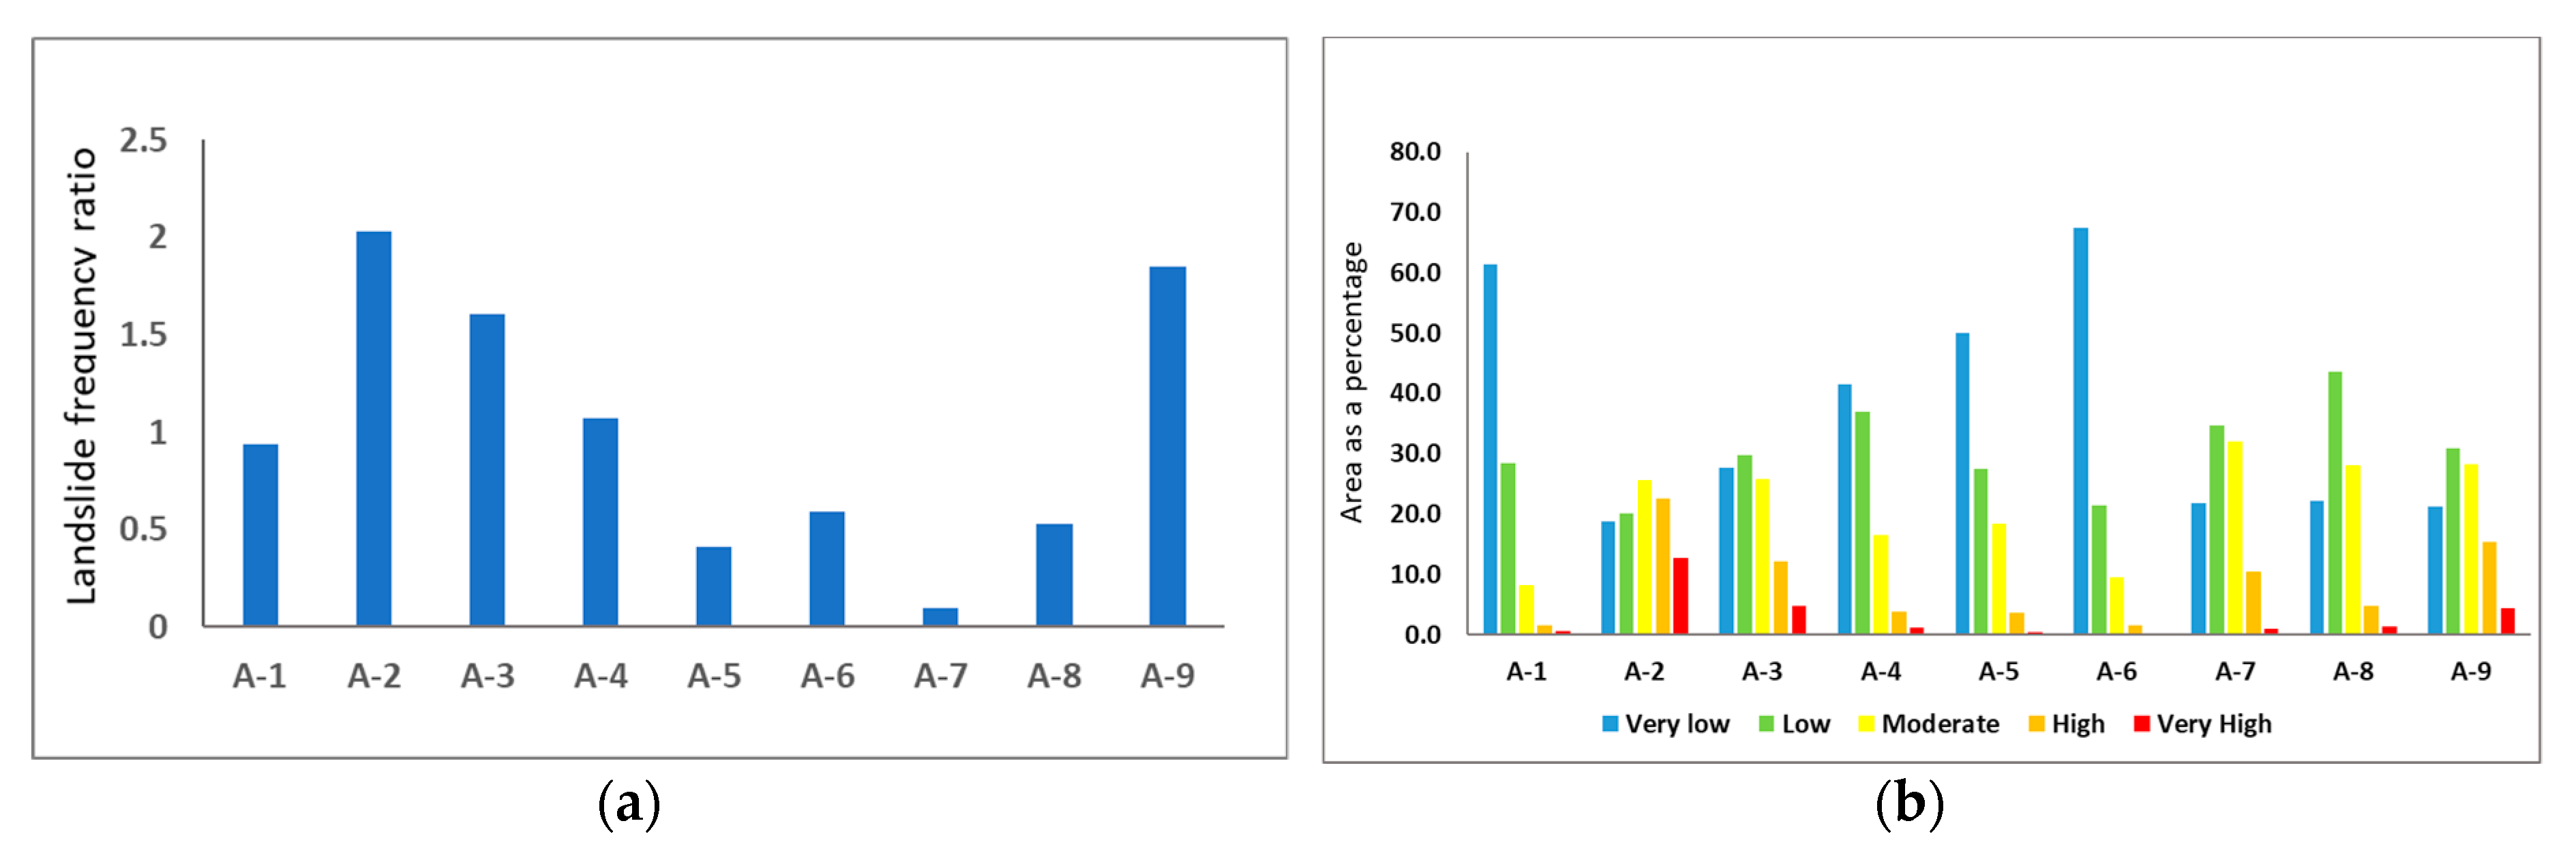
3.4. Soil Erosion Hazard and Its Correlation with Landslide

Areas highly susceptible to soil erosion need to be identified and prioritized for the implementation of soil conservation practices. A map of the RDZs is presented in Figure 6a. A landslide inventory map was also developed (Figure 6b). The soil erosion hazard map was overlaid with the landslide inventory and RDZ map, as shown in Figure 6c. Then, from Figure 6c, the areas under the different classes of erosion hazard were computed for each RDZ to obtain the corresponding landslide frequency ratio.
The soil erosion hazard class of each RDZ is correlated with the LFR as a method of statistical analysis. The utilization of the frequency ratio is based on ‘the observed relationships between the distribution of landslides and soil erosion hazard classes to reveal the correlation between these two related phenomena in the study area’ [71,72]. The LFR was calculated from the analysis of the land extent of the RDZ and the number of landslide incidents. The LFR of RDZs are given in Table 9.
The LFR in each of the RDZ was plotted to examine their relationships. Figure 7a shows the distribution of the LFRs amongst the RDZs. The extent of the soil erosion hazard classes was computed for each RDZ. The soil erosion hazard classes were plotted against the extent of each RDZ in percentages based on the computed values. The plot output is given in Figure 7b.
As shown in Figure 7a, the highest landslide frequency ratios, with values near 2, are for A-2, A-9, and A-3. The land-use class of these RDZs is prominently a cropping area (Table S5). The highest percentage extent of ‘high’ and ‘very-high’ soil erosion categories fall within A-2, A-3, and A-9 RDZs (Figure 7b). Pradhan et al. [15] reported a rise in LFR for areas in the ‘high’ and ‘very-high’ soil erosion classes; the current study is in line with the previous study. They also revealed that if the landslide frequency ratio is greater than 2, more landslides are likely to occur.
Other studies have shown that a few of the critical areas are responsible for the heavy-load sediment yields in the watersheds [35,73]. Hence, priority should be given to RDZs with high categories of soil erosion hazard for conservation, as these RDZs can significantly reduce the total sediment yield. The priority rankings of the RDZs were based on LFR, average soil erosion rate, and area of land-use change. As shown in Figure 5 and Figure 7a,b and Table 10, land-use change, the values of LFR, and soil erosion rate are ranging from high to very high for RDZs of A-3 (Kelani River-south), A-2 (Attenagalu Oya), and A-9 (Kelani River-north). Hence, A-2, A-3, and A-9 are the priority RDZs for soil conservation. The list of prioritized RDZs in Sabaragamuwa Province for soil conservation is shown in Table 10.

4. Discussion

In this study, LULC change, soil erosion hazard, and their associated dynamics of Sabaragamuwa Province were evaluated using the RUSLE model combined with a GIS environment. The study employed a new approach by combining three methods: landslide frequency ratio method, soil erosion severity, and land-use change assessments. Results reveal that nearly 13% of the total land area of the province is highly vulnerable to soil erosion and around 22% of the total land area is moderately vulnerable to soil erosion. Findings further indicate the average soil erosion rate in years 2000 and 2019 are also higher than the average of tropical countries (<10 t ha−1year−1) [33]. The assessment of LULC change shows higher correlation between land-use classes and landslide incidents. In addition, RDZs of A-2, A-3, and A-9 reported the highest landslide frequency ratios. Overall, these results are in line with previous studies [12,39]. Landslides occur frequently in Sri Lanka. Approximately 30.7% of its total land area is highly susceptible to landslides [30,32]. The Sabaragamuwa Province has been declared as one of the landslide-prone areas in the country [31,32,74]. Hewawasam [30] reported that 35%, 20%, 10%, 13%, and 8% of the landslides occurred in tea, rubber, coconut, paddy, and vegetable cultivated lands, respectively, by analyzing 200 landslides in the Central Highlands. The present study shows a change in land-use, particularly the increase in cropping areas, including tea and rubber plantations, while decreasing the dense and less dense forest cover in Sabaragamuwa Province from 2000 to 2019. Hence, increasing cropping area may contribute to induce landslide occurrence at RDZs. This rapid change of land-use may affect erosion hazard levels and landslide vulnerability. The soil may be permanently damaged due to inappropriate land levelling, causing a decrease in soil quality during extensive agricultural activities. In most cases, land levelling results in increased surface and subsurface soil erosion, due to the soil erodibility of newly exposed subsoil. In addition, land levelling may increase the landslide susceptibility of sloping lands [2]. Hence, implementation of soil conservation strategies with appropriate land-use planning practices are more important to reduce erosion hazards. Dissanayake, Morimoto, and Ranagalage [33] have also claimed a similar result and recommend soil conservation on agricultural lands to reduce soil erosion for food security. Thereby, the priority should be given to RDZs of A-2, A-3, and A-9 for soil conservation. In addition, socio-economic factors, such as land ownership problems and high cost of land preparation, affect farmers who seldom use soil conservation practices in hilly areas. Therefore, soft engineering conservation and management practices, such as ecological farming practices, planning, and prioritizing areas for soil conservation to reduce the risk of landslide vulnerability, should have to be considered for a sustainable land-use management system. The proper identification of land-use systems, appropriate soil conservation practices and techniques can help to minimize soil erosion. Future research could be focused on investigating the pattern of average soil erosion rate and total estimated soil erosion against LFR at RDZ level, using a statistical method to predict the effect of soil erosion rates on the occurrence of landslide incidents at RDZ level. Furthermore, high-intensity tropical rainfall within a short duration due to the effect of climate variation is also another influential factor of soil erosion hazard. Assessments on soil erosion hazard under the impact of rainfall variation (i.e., amount and intensity) in the Central Highlands are recommended for further study. In addition, the factors on geological and tectonic details, such as distance to faults, lithology, and profile curvature, also need to be considered for future studies.

5. Conclusions

Freely available multi-temporal satellite data can be successfully employed for land-use mapping and change detection, subsequently providing data for soil erosion hazard modelling in a GIS environment. The proposed approach can help effectively, to produce landscape vulnerability assessment and prioritize the area for soil conservation as part of the sustainable land-use management process. This study reveals substantial evidence for the correlation between land-use change and landslide incidents through the LFRs. Furthermore, the highest LFRs are found for A-2, A-3, and A-9, indicating their immediate prioritization for soil conservation. The land-use class of these RDZs is prominently a ‘cropping area’, such as tea and rubber plantations. The change of forest lands into cultivation areas can be regarded an important factor of landslide initiation. The present study provides a policy direction for soil conservation at the RDZs level for the sustainable management of land resources in the Central Highlands of Sri Lanka.

Supplementary Materials

The following are available online at https://0-www-mdpi-com.brum.beds.ac.uk/2072-4292/12/9/1483/s1, Figure S1. Average annual rainfall at Sabaragamuwa Province of Sri Lanka, Table S1. The details of average annual rainfall of the area, Table S2. C-factor values and conservation practices (P-factor) values as per land-cover class and land slope class, Table S3. The confusion matrix between ground truths and classified land use classes for 2000, Table S4. The confusion matrix between ground truths and classified land-use classes for 2010, Table S5. The major land-use types in each zone.

Author Contributions

Conceptualization, S.S. and B.P.; methodology, S.S.; software, S.S.; validation, S.S.; formal analysis, S.S.; writing—original draft preparation, S.S.; writing—review and editing, S.S., B.P., A.H. and J.B.; supervision, B.P., A.H. and J.B.; funding acquisition, B.P. All authors have read and agreed to the published version of the manuscript.

Funding

The research is supported by the Centre for Advanced Modelling and Geospatial Information Systems (CAMGIS), University of Technology Sydney under grant numbers: 323930, 321740.2232335; 321740.2232424 and 321740.2232357.

Acknowledgments

The authors are grateful to the anonymous reviewers for their valuable constructive comments to improve the quality of this paper.

Conflicts of Interest

The authors declare no conflict of interest.

References

  1. Panagos, P.; Borrelli, P.; Meusburger, K.; Yu, B.; Klik, A.; Lim, K.J.; Yang, J.E.; Ni, J.; Miao, C.; Chattopadhyay, N. Global rainfall erosivity assessment based on high-temporal resolution rainfall records. Sci. Rep. 2017, 7, 4175. [Google Scholar] [CrossRef] [Green Version]
  2. Poesen, J. Soil erosion in the Anthropocene: Research needs. Earth Surf. Process. Landf. 2018, 43, 64–84. [Google Scholar] [CrossRef]
  3. Lal, R. Soil degradation by erosion. Land Degrad. Dev. 2001, 12, 519–539. [Google Scholar] [CrossRef]
  4. Segura, C.; Sun, G.; Mcnulty, S.; Zhang, Y. Potential impacts of climate change on soil erosion vulnerability across the conterminous United States. J. Soil Water Conserv. 2014, 69, 171–181. [Google Scholar] [CrossRef]
  5. Puente, C.; Olague, G.; Trabucchi, M.; Arjona-Villicaña, P.D.; Soubervielle-Montalvo, C. Synthesis of Vegetation Indices Using Genetic Programming for Soil Erosion Estimation. Remote Sens. 2019, 11, 156. [Google Scholar] [CrossRef] [Green Version]
  6. Morgan, R.P.C. Soil Erosion and Conservation; John Wiley & Sons: Oxford, UK, 2009. [Google Scholar]
  7. Broz, B.; Pfost, D.L.; Thompson, A.L. Controlling Runoff and Erosion at Urban Construction Sites; Extension publications (MU): University of Missouri: Columbia, MO, USA, 2003. [Google Scholar]
  8. Gayen, A.; Pourghasemi, H.R.; Saha, S.; Keesstra, S.; Bai, S. Gully erosion susceptibility assessment and management of hazard-prone areas in India using different machine learning algorithms. Sci. Total Environ. 2019, 668, 124–138. [Google Scholar] [CrossRef]
  9. Poesen, J.; Vandekerckhove, L.; Nachtergaele, J.; Oostwoud Wjdenes, D.; Verstraetraeten, G.; Wesemael, V. Gully Erosion in Dryland Environments; John Willey & Sons Ltd.: West Sussex, UK, 2002. [Google Scholar]
  10. Burt, T.; Weerasinghe, K. Rainfall distributions in Sri Lanka in time and space: An analysis based on daily rainfall data. Climate 2014, 2, 242–263. [Google Scholar] [CrossRef] [Green Version]
  11. Ighodaro, I.D.; Lategan, F.S.; Yusuf, S.F. The impact of soil erosion on agricultural potential and performance of Sheshegu community farmers in the Eastern Cape of South Africa. J. Agric. Sci. 2013, 5, 140. [Google Scholar] [CrossRef] [Green Version]
  12. Fayas, C.M.; Abeysingha, N.S.; Nirmanee, K.G.S.; Samaratunga, D.; Mallawatantri, A. Soil loss estimation using rusle model to prioritize erosion control in KELANI river basin in Sri Lanka. Int. Soil Water Conserv. Res. 2019, 7, 130–137. [Google Scholar] [CrossRef]
  13. Abdulkareem, J.; Pradhan, B.; Sulaiman, W.; Jamil, N. Prediction of spatial soil loss impacted by long-term land-use/land-cover change in a tropical watershed. Geosci. Front. 2019, 10, 389–403. [Google Scholar] [CrossRef]
  14. Persichillo, M.G.; Bordoni, M.; Meisina, C. The role of land use changes in the distribution of shallow landslides. Sci. Total Environ. 2017, 574, 924–937. [Google Scholar] [CrossRef] [PubMed]
  15. Pradhan, B.; Chaudhari, A.; Adinarayana, J.; Buchroithner, M.F. Soil erosion assessment and its correlation with landslide events using remote sensing data and GIS: A case study at Penang Island, Malaysia. Environ. Monit. Assess. 2012, 184, 715–727. [Google Scholar] [CrossRef] [PubMed]
  16. Ganasri, B.; Ramesh, H. Assessment of soil erosion by RUSLE model using remote sensing and GIS-A case study of Nethravathi Basin. Geosci. Front. 2016, 7, 953–961. [Google Scholar] [CrossRef] [Green Version]
  17. Leh, M.; Bajwa, S.; Chaubey, I. Impact of land use change on erosion risk: An integrated remote sensing, geographic information system and modeling methodology. Land Degrad. Dev. 2013, 24, 409–421. [Google Scholar] [CrossRef]
  18. Nampak, H.; Pradhan, B.; Mojaddadi Rizeei, H.; Park, H.J. Assessment of land cover and land use change impact on soil loss in a tropical catchment by using multitemporal SPOT-5 satellite images and Revised Universal Soil Loss Equation model. Land Degrad. Dev. 2018, 29, 3440–3455. [Google Scholar] [CrossRef]
  19. Rizeei, H.M.; Saharkhiz, M.A.; Pradhan, B.; Ahmad, N. Soil erosion prediction based on land cover dynamics at the Semenyih watershed in Malaysia using LTM and USLE models. Geocarto Int. 2016, 31, 1158–1177. [Google Scholar] [CrossRef]
  20. Renard, K.G.; Foster, G.R.; Weesies, G.; McCool, D.; Yoder, D. Predicting Soil Erosion by Water: A Guide to Conservation Planning with the Revised Universal Soil Loss Equation (RUSLE); United States Department of Agriculture: Washington, DC, USA, 1997.
  21. Gunatilaka, A. Role of basin-wide landslides in the formation of extensive alluvial gemstone deposits in Sri Lanka. Earth Surf. Process. Landf. J. Br. Geomorphol. Res. Group 2007, 32, 1863–1873. [Google Scholar] [CrossRef]
  22. Meena, S.R.; Ghorbanzadeh, O.; Blaschke, T. A comparative study of statistics-based landslide susceptibility models: A case study of the region affected by the gorkha earthquake in nepal. ISPRS Int. J. Geo-Inf. 2019, 8, 94. [Google Scholar] [CrossRef] [Green Version]
  23. Pradhan, B. Remote sensing and GIS-based landslide hazard analysis and cross-validation using multivariate logistic regression model on three test areas in Malaysia. Adv. Space Res. 2010, 45, 1244–1256. [Google Scholar] [CrossRef]
  24. Shahabi, H.; Khezri, S.; Ahmad, B.B.; Hashim, M. Landslide susceptibility mapping at central Zab basin, Iran: A comparison between analytical hierarchy process, frequency ratio and logistic regression models. Catena 2014, 115, 55–70. [Google Scholar] [CrossRef]
  25. Jana, S.K.; Sekac, T.; Pal, D.K. Geo-spatial approach with frequency ratio method in landslide susceptibility mapping in the Busu River catchment, Papua New Guinea. Spat. Inf. Res. 2019, 27, 49–62. [Google Scholar] [CrossRef]
  26. Solaimani, K.; Mousavi, S.Z.; Kavian, A. Landslide susceptibility mapping based on frequency ratio and logistic regression models. Arab. J. Geosci. 2013, 6, 2557–2569. [Google Scholar] [CrossRef]
  27. Rozos, D.; Skilodimou, H.D.; Loupasakis, C.; Bathrellos, G.D. Application of the revised universal soil loss equation model on landslide prevention. An example from N. Euboea (Evia) Island, Greece. Environ. Earth Sci. 2013, 70, 3255–3266. [Google Scholar] [CrossRef]
  28. Pirasteh, S.; Li, J. Probabilistic frequency ratio (PFR) model for quality improvement of landslides susceptibility mapping from LiDAR point clouds. Geoenvironmental Disaster J. 2017, 4, 19. [Google Scholar] [CrossRef] [Green Version]
  29. Ratnayake, U.; Herath, S. Changing rainfall and its impact on landslides in Sri Lanka. J. Mt. Sci. 2005, 2, 218–224. [Google Scholar] [CrossRef]
  30. Hewawasam, T. Effect of land use in the upper Mahaweli catchment area on erosion, landslides and siltation in hydropower reservoirs of Sri Lanka. J. Natl. Sci. Found. Sri Lanka 2010, 38, 3–14. [Google Scholar] [CrossRef]
  31. Perera, E.; Jayawardana, D.; Jayasinghe, P.; Ranagalage, M. Landslide vulnerability assessment based on entropy method: A case study from Kegalle district, Sri Lanka. Model. Earth Syst. Environ. 2019, 5, 1635–1649. [Google Scholar] [CrossRef]
  32. Hemasinghe, H.; Rangali, R.; Deshapriya, N.; Samarakoon, L. Landslide susceptibility mapping using logistic regression model (a case study in Badulla District, Sri Lanka). Procedia Eng. 2018, 212, 1046–1053. [Google Scholar] [CrossRef]
  33. Dissanayake, D.M.S.L.B.; Morimoto, T.; Ranagalage, M. Accessing the soil erosion rate based on RUSLE model for sustainable land use management: A case study of the Kotmale watershed, Sri Lanka. Model. Earth Syst. Environ. 2019, 5, 291–306. [Google Scholar] [CrossRef]
  34. Diyabalanage, S.; Samarakoon, K.; Adikari, S.; Hewawasam, T. Impact of soil and water conservation measures on soil erosion rate and sediment yields in a tropical watershed in the Central Highlands of Sri Lanka. Appl. Geogr. 2017, 79, 103–114. [Google Scholar] [CrossRef] [Green Version]
  35. Hewawasam, T.; Illangasinghe, S. Quantifying sheet erosion in agricultural highlands of Sri Lanka by tracking grain-size distributions. Anthropocene 2015, 11, 25–34. [Google Scholar] [CrossRef] [Green Version]
  36. Wijesundara, N.; Abeysingha, N.; Dissanayake, D. GIS-based soil loss estimation using RUSLE model: A case of Kirindi Oya river basin, Sri Lanka. Model. Earth Syst. Environ. 2018, 4, 251–262. [Google Scholar] [CrossRef]
  37. Panditharathne, D.L.D.; Abeysingha, N.S.; Nirmanee, K.G.S.; Mallawatantri, A. Application of Revised Universal Soil Loss Equation (Rusle) Model to Assess Soil Erosion in; “Kalu Ganga”; River Basin in Sri Lanka. Appl. Environ. Soil Sci. 2019, 2019, 4037379. [Google Scholar] [CrossRef] [Green Version]
  38. Jayasinghe, G.; Wijekoon, P.; Gunatilake, J. Landslide susceptibility assessment using statistical models: A case study in Badulla district, Sri Lanka. Ceylon J. Sci. 2017, 46, 26–41. [Google Scholar] [CrossRef]
  39. Perera, E.; Jayawardana, D.; Ranagalage, M.; Jayasinghe, P. Spatial multi criteria evaluation (SMCE) model for landslide hazard zonation in tropical hilly environment: A case study from Kegalle. Geoenvironmental Disasters 2018, 5, 1–12. [Google Scholar] [CrossRef]
  40. Ranasinghe, A.K.R.N.; Bandara, R.; Puswewala, U.G.A.; Dammalage, T.L. Efficacy of using radar-derived factors in landslide susceptibility analysis: Case study of Koslanda, Sri Lanka. Nat. Hazards Earth Syst. Sci. 2019, 19, 1881–1893. [Google Scholar] [CrossRef]
  41. Dang, K.; Sassa, K.; Konagai, K.; Karunawardena, A.; Bandara, R.; Hirota, K.; Tan, Q.; Ha, N.D. Recent rainfall-induced rapid and long-traveling landslide on 17 May 2016 in Aranayaka, Kagelle District, Sri Lanka. Landslides 2019, 16, 155–164. [Google Scholar] [CrossRef]
  42. Senanayake, S.; Munasinghe, M.; Wickramasinghe, W. Use of erosion hazard assessments for regional scale crop suitability mapping in the Uva Province. Ann. Sri Lanka Dep. Agric. 2013, 15, 127–141. [Google Scholar]
  43. Nay, J.; Burchfield, E.; Gilligan, J. A machine-learning approach to forecasting remotely sensed vegetation health. Int. J. Remote Sens. 2018, 39, 1800–1816. [Google Scholar] [CrossRef]
  44. Burian, S.J.; Brown, M.J.; McPherson, T.N.J.W.S. Technology, Evaluation of land use/land cover datasets for urban watershed modeling. Water Sci. Technol. 2002, 45, 269–276. [Google Scholar] [CrossRef]
  45. Ranagalage, M.; Wang, R.; Gunarathna, M.; Dissanayake, D.; Murayama, Y.; Simwanda, M. Spatial forecasting of the landscape in rapidly urbanizing hill stations of South Asia: A case study of Nuwara Eliya, Sri Lanka (1996–2037). Remote Sens. 2019, 11, 1743. [Google Scholar] [CrossRef] [Green Version]
  46. Dissanayake, D.; Morimoto, T.; Murayama, Y.; Ranagalage, M. Impact of landscape structure on the variation of land surface temperature in sub-saharan region: A case study of Addis Ababa using Landsat data (1986–2016). Sustainability 2019, 11, 2257. [Google Scholar] [CrossRef] [Green Version]
  47. Wischmeier, W.H.; Smith, D.D. Predicting rainfall erosion losses-a guide to conservation planning. Predict. Rainfall Eros. Losses-A Guide Conserv. Plan. 1978, 537, 62–67. [Google Scholar]
  48. Morgan, R.; Morgan, D.; Finney, H. A predictive model for the assessment of soil erosion risk. J. Agric. Eng. Res. 1984, 30, 245–253. [Google Scholar] [CrossRef]
  49. Lee, S. Soil erosion assessment and its verification using the universal soil loss equation and geographic information system: A case study at Boun, Korea. Environ. Geol. 2004, 45, 457–465. [Google Scholar] [CrossRef]
  50. Demirci, A.; Karaburun, A. Estimation of soil erosion using RUSLE in a GIS framework: A case study in the Buyukcekmece Lake watershed, northwest Turkey. Environ. Earth Sci. 2012, 66, 903–913. [Google Scholar] [CrossRef]
  51. Kayet, N.; Pathak, K.; Chakrabarty, A.; Sahoo, S. Evaluation of soil loss estimation using the RUSLE model and SCS-CN method in hillslope mining areas. Int. Soil Water Conserv. Res. 2018, 6, 31–42. [Google Scholar] [CrossRef]
  52. Wickramasinghe, L.A.; Premalal, R. Development of Rainstom Erosivity Map for Sri Lanka; ResearchGate: Bangkok, Thailand, 1988; pp. 441–450. [Google Scholar]
  53. Wijesekera, N.T.S.; Samarakoon, L. Extraction of Parameters and Modelling Soil Erosion using GIS in a GRID Environment. In Proceedings of the 22nd Asian Conference in Remote Sensing National University of Singapore, Singapore, 5–9 November 2001; National University of Singapore: Singapore, 2001; pp. 34–39. [Google Scholar]
  54. Uddin, K.; Abdul Matin, M.; Maharjan, S.J.S. Assessment of land cover change and its impact on changes in soil erosion risk in Nepal. Sustainability 2018, 10, 4715. [Google Scholar] [CrossRef] [Green Version]
  55. Adornado, H.A.; Yoshida, M.; Apolinares, H. Erosion Vulnerability Assessment in REINA, Quezon Province Philippines with Raster-based Tool Built within GIS Environment. Agric. Inf. Res. 2009, 18, 24–31. [Google Scholar] [CrossRef] [Green Version]
  56. Moore, I.; Burch, G. Modelling erosion and deposition: Topographic effects. Trans. ASAE 1986, 29, 1624–1630. [Google Scholar] [CrossRef]
  57. Moore, I.D.; Burch, G.J. Physical basis of the length-slope factor in the universal soil loss equation 1. Soil Sci. Soc. Am. J. 1986, 50, 1294–1298. [Google Scholar] [CrossRef]
  58. Prasannakumar, V.; Vijith, H.; Abinod, S.; Geetha, N.J.G.F. Estimation of soil erosion risk within a small mountainous sub-watershed in Kerala, India, using Revised Universal Soil Loss Equation (RUSLE) and geo-information technology. Geosci. Front. 2012, 3, 209–215. [Google Scholar] [CrossRef] [Green Version]
  59. Munasinghe, M.A.K.; Pushpakumara, V.; Bandara, T.M.J.; Herath, H.M.B. Use of Information Systems for Soil Erosion Hazard Assessment of the Central Province of Sri Lanka; Department of Agriculture, Sri Lanka: Peradeniya, Sri Lanka, 2001; pp. 148–151.
  60. Yang, X. State and trends of hillslope erosion across New South Wales, Australia. Catena 2020, 186. [Google Scholar] [CrossRef]
  61. Koirala, P.T.; Joshi, S.; Chauhan, R. Estimation of Soil Erosion in Nepal Using a RUSLE Modeling and Geospatial Tool. Geosciences 2019, 9, 147. [Google Scholar] [CrossRef] [Green Version]
  62. Vrieling, A.; Sterk, G.; Beaulieu, N. Erosion risk mapping: A methodological case study in the Colombian Eastern Plains. J. Soil Water Conserv. 2002, 57, 158–163. [Google Scholar]
  63. Shinde, V.; Tiwari, K.; Singh, M. Prioritization of micro watersheds on the basis of soil erosion hazard using remote sensing and geographic information system. Int. J. Water Resour. Environ. Eng. 2010, 5, 130–136. [Google Scholar] [CrossRef] [Green Version]
  64. Lee, S.; Talib, J.A. Probabilistic landslide susceptibility and factor effect analysis. Environ. Geol. 2005, 47, 982–990. [Google Scholar] [CrossRef]
  65. Shahabi, H.; Ahmad, B.B.; Khezri, S. Application of satellite remote sensing for detailed landslide inventories using frequency ratio model and GIS. Int. J. Comput. Sci. 2012, 9, 108–117. [Google Scholar] [CrossRef] [Green Version]
  66. Shahabi, H.; Hashim, M. Landslide susceptibility mapping using GIS-based statistical models and Remote sensing data in tropical environment. Sci. Rep. 2015, 5, 9899. [Google Scholar] [CrossRef] [Green Version]
  67. Olofsson, P.; Foody, G.M.; Stehman, S.V.; Woodcock, C.E. Making better use of accuracy data in land change studies: Estimating accuracy and area and quantifying uncertainty using stratified estimation. Remote Sens. Environ. 2013, 129, 122–131. [Google Scholar] [CrossRef]
  68. Bandara, J.S.; Coxhead, I. Can trade liberalization have environmental benefits in developing country agriculture? A Sri Lankan case study. J. Policy Model. 1999, 21, 349–374. [Google Scholar] [CrossRef] [Green Version]
  69. FAO. Global Soil Status, Processes and Trends. Status of the World’s Soil Resources (SWSR)—Main Report of the Food and Agriculture Organization; The Food and Agriculture Organization: Rome, Italy, 2015. [Google Scholar]
  70. Regmi, A.; Meade, B. Demand side drivers of global food security. Glob. Food Secur. 2013, 2, 166–171. [Google Scholar] [CrossRef] [Green Version]
  71. Pradhan, B.; Lee, S. Delineation of landslide hazard areas on Penang Island, Malaysia, by using frequency ratio, logistic regression, and artificial neural network models. Environ. Earth Sci. 2010, 60, 1037–1054. [Google Scholar] [CrossRef]
  72. Pradhan, B.; Lee, S.; Buchroithner, M.F. Remote sensing and GIS-based landslide susceptibility analysis and its cross-validation in three test areas using a frequency ratio model. Photogramm. Fernerkund. Geoinf. 2010, 2010, 17–32. [Google Scholar] [CrossRef]
  73. Tripathi, M.; Panda, R.; Raghuwanshi, N. Identification and prioritisation of critical sub-watersheds for soil conservation management using the SWAT model. Biosyst. Eng. 2003, 85, 365–379. [Google Scholar] [CrossRef]
  74. Bhandari, R.K.; Herath, N.; Thayalan, N. Landslide hazard zonation mapping in Sri Lanka—A Holistic approach. In National Symposium on Landslide in Sri Lanka; National Building Research Organisation: Colombo, Sri Lanka, 1994; pp. 271–284. [Google Scholar]
Figure 1. (a) Location map of Sabaragamuwa Province in Sri Lanka; (b) digital elevation map; (c) slope angle map; (d) river distribution map.
Remotesensing 12 01483 g001
Figure 2. The overall methodology of the study.
Remotesensing 12 01483 g002
Figure 3. Land-use land-cover (LULC) maps: (a) 2000; (b) 2010; (c) 2019.
Remotesensing 12 01483 g003
Figure 4. Factor maps of Sabaragamuwa Province: (a) slope length and steepness (LS)-factor; (b) rainfall erosivity (R)-factor; (c) soil erodibility (K)-factor; (d,e) crop management (C) -factor and conservation practice (P)-factor; (f) soil erosion hazard map.
Remotesensing 12 01483 g004aRemotesensing 12 01483 g004b
Figure 5. The percentage of land-use change and landslide frequency ratio (LFR) over the river distribution zones (RDZs).
Remotesensing 12 01483 g005
Figure 6. (a) River distribution zones map; (b) landslide inventory map; (c) soil erosion hazard map with landslide locations.
Remotesensing 12 01483 g006
Figure 7. (a) Landslide frequency ratio of each RDZ; (b) the area covered by soil erosion hazard classes of each RDZ.
Remotesensing 12 01483 g007
Table 1. Landsat imagery for the years 2000, 2010, and 2019.
Satellite ImageCloud Cover (%)Data Acquisition DateResolution (m)
LC08_L1TP_141055_20190220_20190222_01_T1.tar15.8520-02-201930 × 30
LC08_L1TP_141056_20190220_20190222_01_T1.tar9.32
LT05_L1TP_141055_20100126_20161017_01_T1.tar11.0026-01-201030 × 30
LT05_L1TP_141056_20100126_20161017_01_T1.tar2.00
LE07_L1TP_141055_20000123_20170213_01_T1.tar7.0023-01-200030 × 30
LE07_L1TP_141056_20000123_20170213_01_T1.tar8.00
Table 2. The details of land-use classes.
Land Use TypeDescription
Dense forestPrimary forest in Sabaragamuwa Province: lowland evergreen rainforest, lower montane forest, and upper montane forest such as part of “Sinharaja” Forest and part of “SriPadha” Peak wildness sanctuary
Less dense forestThe forest shorter than the primary forest or secondary forest such as shrubs and bushes
Cropping areaThe area used to cultivate agricultural crops such as tea, rubber, coconut export agriculture crops, horticultural crops, and home gardens.
PaddyThe area used to grow paddy cultivation
Urban areaThe urban area including roads, buildings, and settlements
StreamsThe area represents streams and tributaries
Water bodiesThe area consists of tanks and reservoirs
Table 3. Details of the soil erodibility values (t ha h MJ−1mm−1) adopted from Fayas et al. [12]; Senanayake, Munasinghe, and Wickramasinghe [42]; Wijesekera and Samarakoon [53].
Soil Type K-Factor Value
Reddish-Brown Latasolic 0.17
Reddish-Brown Earth 0.27
Alluvial soils0.31
Red-Yellow Latasol 0.33
Non-Calsic Brown 0.35
Table 4. Confusion matrix between ground truths and land-use classes.
Land-Use Dataset Ground Truth Data
ABCDEFGTotal
AWater bodies29 2 132
BDense forest 40 1647
CStreams3 20 23
DPaddy 12911133
EUrban area 12301 34
FCropping area11 4250967
GLess dense forest 1 64653
Total33412436335963289
Table 5. Respective values of commission, omission, producer accuracy, and user’s accuracy for classified land-use classes for 2019.
CommissionOmissionProducer AccuracyUser’s Accuracy
Water bodies9.412.187.990.6
Dense forest14.92.497.685.1
Streams13.016.783.387.0
Paddy12.119.480.687.9
Urban area11.89.190.988.2
Cropping area25.415.384.774.6
Less dense forest13.227.073.086.8
Table 6. Land-use change between 2000 and 2019.
Land Use Classes2019201020002019–2000
Area (km2)%Area (km2)%Area (km2)%Area (km2)%
Dense forest971.8419.631064.5421.511292.0926.09−320.25−6.46
Less dense forest1124.8722.721930.2439.001827.0036.90−702.13−14.18
Cropping area2379.2348.051483.9729.981490.2030.09889.0317.96
Paddy230.114.65284.55.75155.133.1374.981.52
Urban area154.93.1396.211.943.210.06151.693.07
Water bodies24.220.4926.840.523.860.480.360.01
Streams34.250.6945.780.9259.201.20−24.95−0.51
Other (due to cloud cover)32.420.6519.50.39101.152.04
4951.831004951.581004951.84100
Table 7. The details of soil erosion category, rates, and land area.
Category20002019
Erosion RateArea km2%Area km2%
Very low0–51871.6937.7971761.2435.566
Low5–101479.2929.8731452.2829.327
Moderate10–201055.5921.3161095.8622.130
High20–50442.478.935472.129.534
Very high>50102.962.079170.53.443
4952.00100.004952.00100.00
Average annual soil erosion14.56 t/ha/year15.53 t/ha/year
Table 8. The landslide frequency ratio for each land-use type.
Land-Use ClassArea (Km2)PercentageNo of LandslidesPercentageLFR
Dense forest area971.8419.631411.020.56
Water bodies24.220.4900.000.00
Streams34.250.6910.791.14
Cropping area2379.2348.057155.911.16
Less dense forest1124.8722.723426.771.18
Urban area154.903.1343.151.01
Paddy area230.114.6521.570.34
Table 9. Landslide frequency ratios of the RDZ.
IDRDZ CodeName of the RDZExtent (km2)Extent % (a)No of LandslidesLandslide Occurrence % (b)Frequency Ratio (b/a)
1A-1Maha Oya549.0211.091710.430.94
2A-2Athtanagalu Oya89.191.8063.682.04
3A-3Kalani River-south453.809.162414.721.61
4A-4Kalu River1388.0128.034930.061.07
5A-5Weli Oya522.7910.5674.290.41
6A-6Welawe River-north565.6911.42116.750.59
7A-7Welawe River-south306.186.1810.610.10
8A-8Kuda Oya405.048.1874.290.53
9A-9Kalani River-north672.4413.584125.151.85
Total 4952.16100.00163
Table 10. Prioritization of RDZ in Sabaragamuwa Province.
RDZ CodeName of RDZMinimum Elevation (m)Maximum Elevation (m)Landslide Frequency RatioSign of Land-Use ChangeAverage Erosion Rate (t/ha/yr.)Priority
A-1Maha Oya46.861023.640.94Cropping area, less dense forest 7.75
A-2Athtanagalu Oya36.25395.642.04Cropping area, less dense forest27.51
A-3Kelani River- south1.141906.151.61Cropping area, dense forest18.92
A-4Kalu River−6.582057.91.07Cropping area, less dense11.93
A-5Weli Oya79.822177.380.41Dense forest, less dense10.65
A-6Welawe River- north 49.261341.450.59Cropping area, dense forest 6.66
A-7Welawe River- south29.4913200.1Less dense forest, cropping area 17.85
A-8Kuda Oya−2.001354.130.53Cropping area, urban area15.94
A-9Kelani River- north4.921299.021.85Cropping area, paddy area20.61

