
Trade-Off and Projecting Effects of Land Use Change on Ecosystem Services under Different Policies Scenarios: A Case Study in Central China

 ,
,  ,
,
Abstract
:1. Introduction
2. Materials and Methods
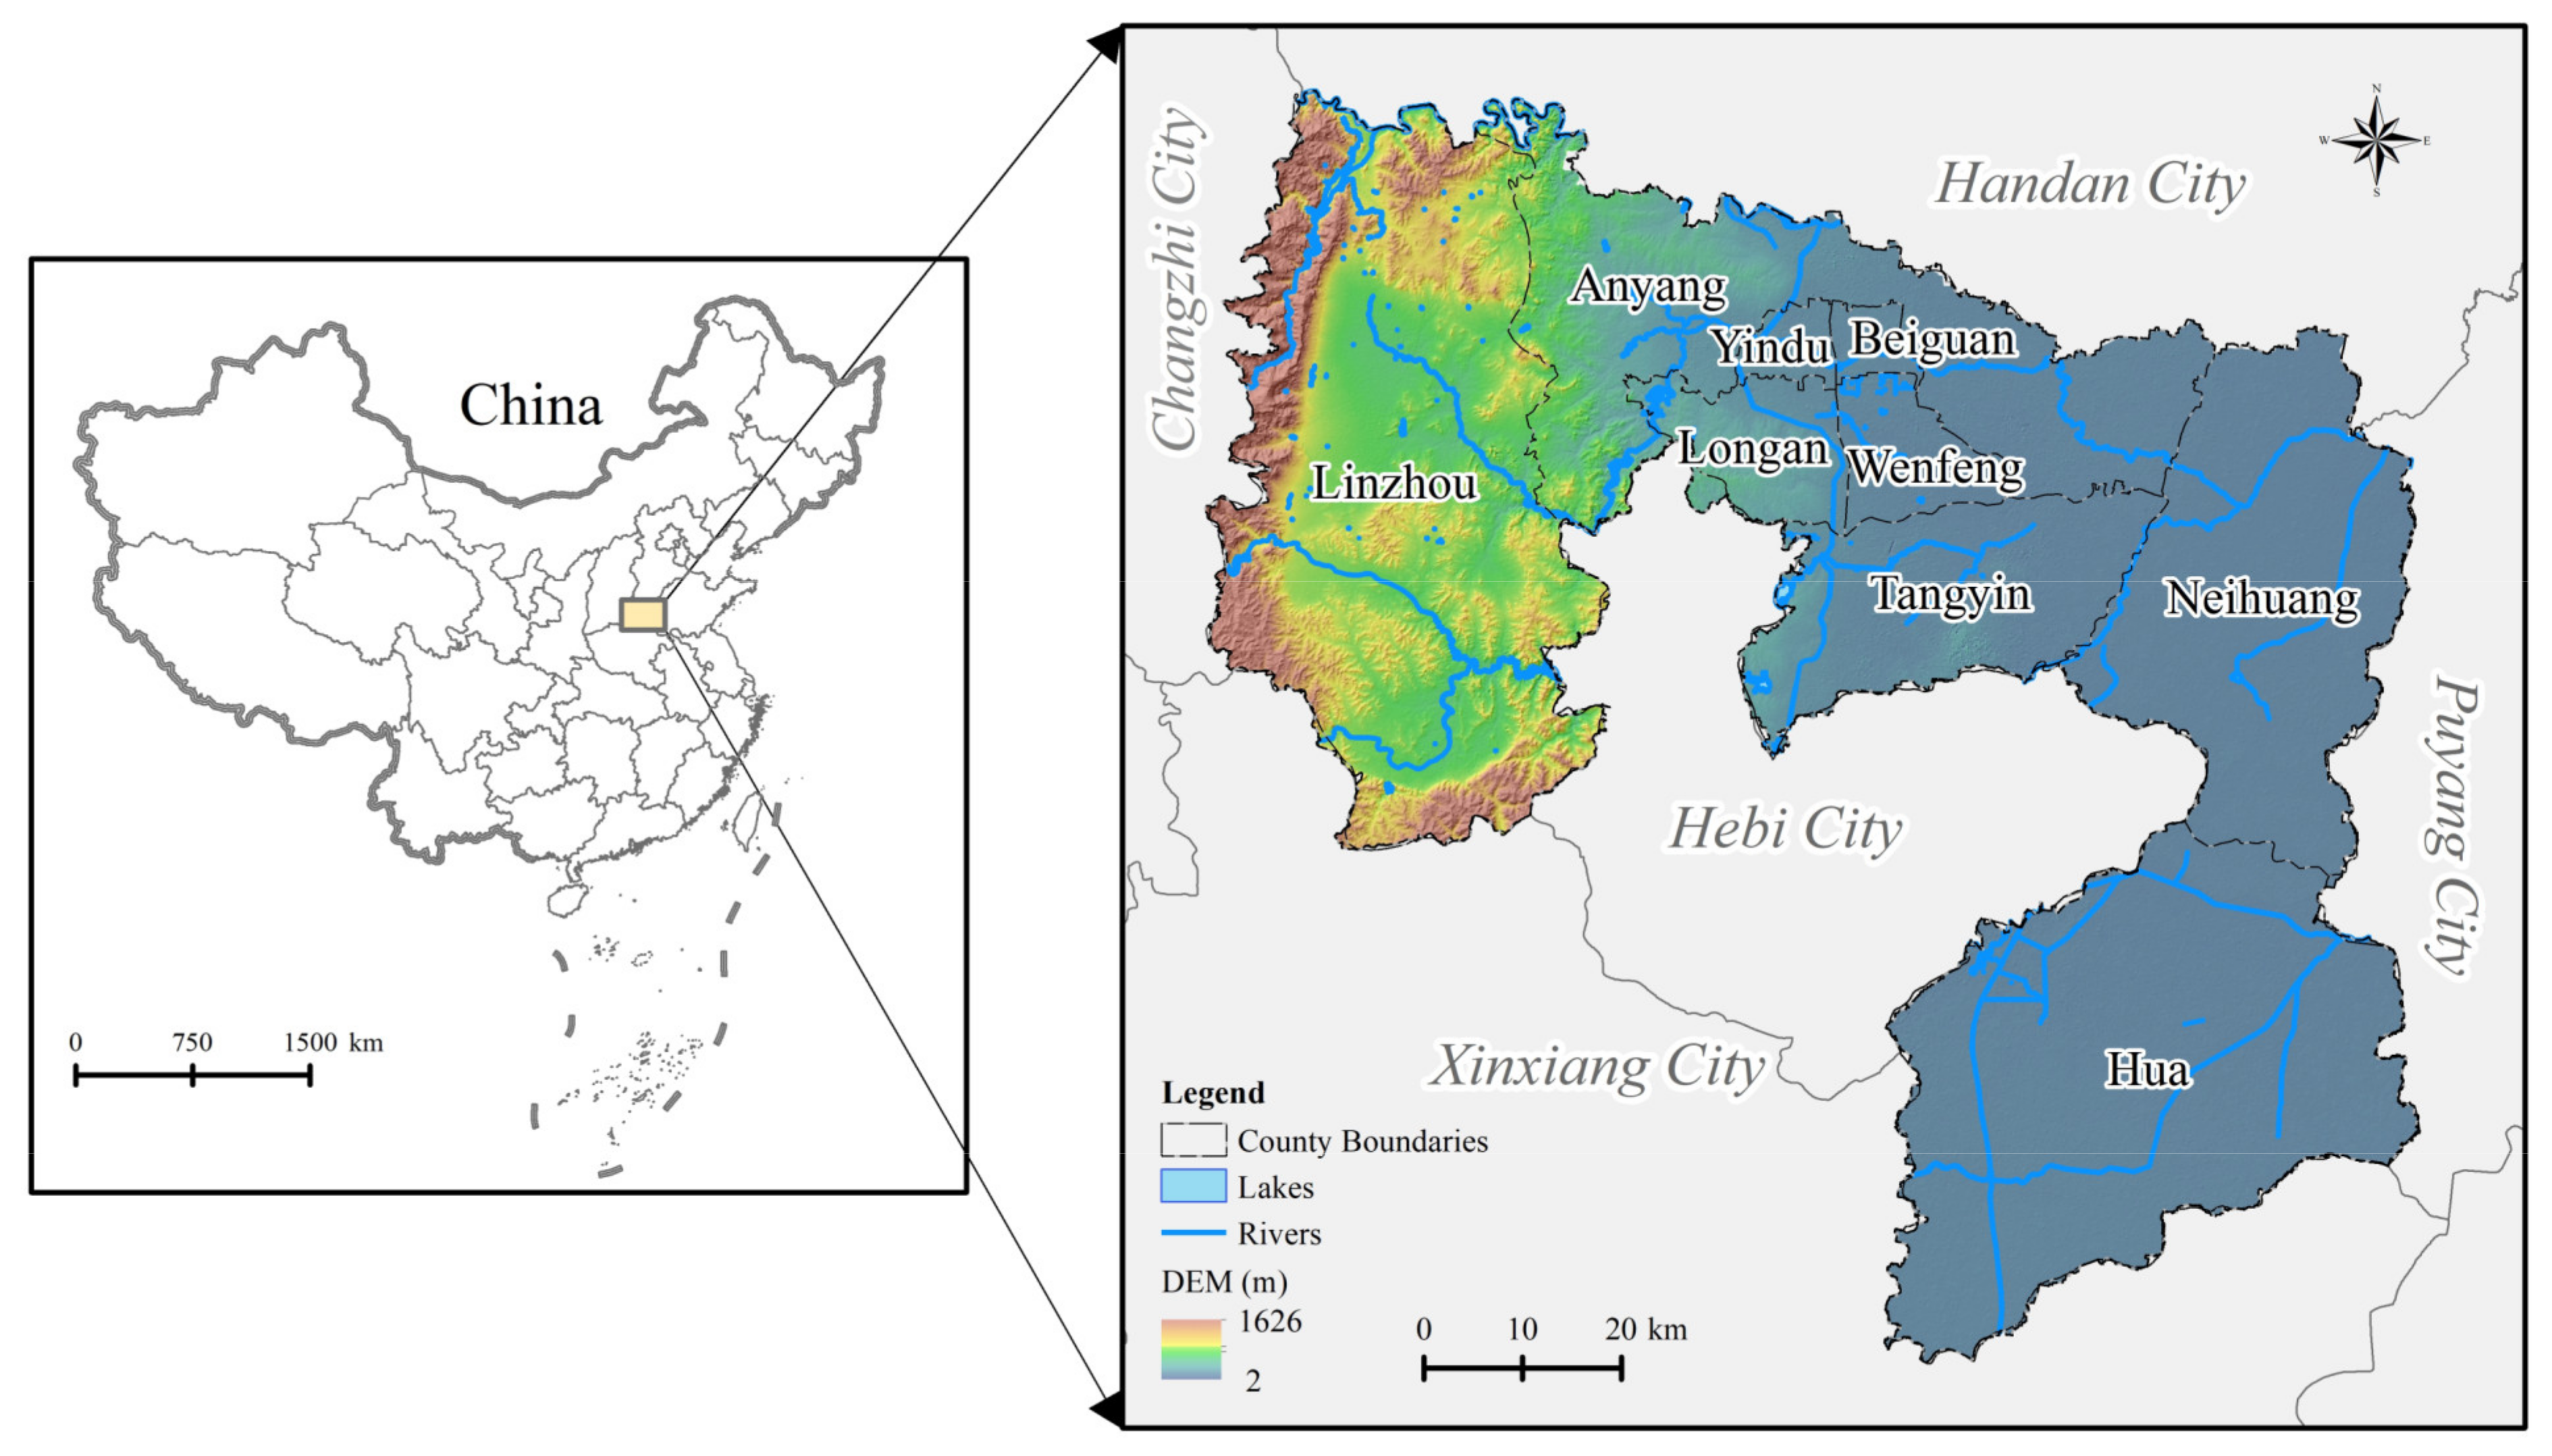
2.1. The Study Area
2.2. Data Sources
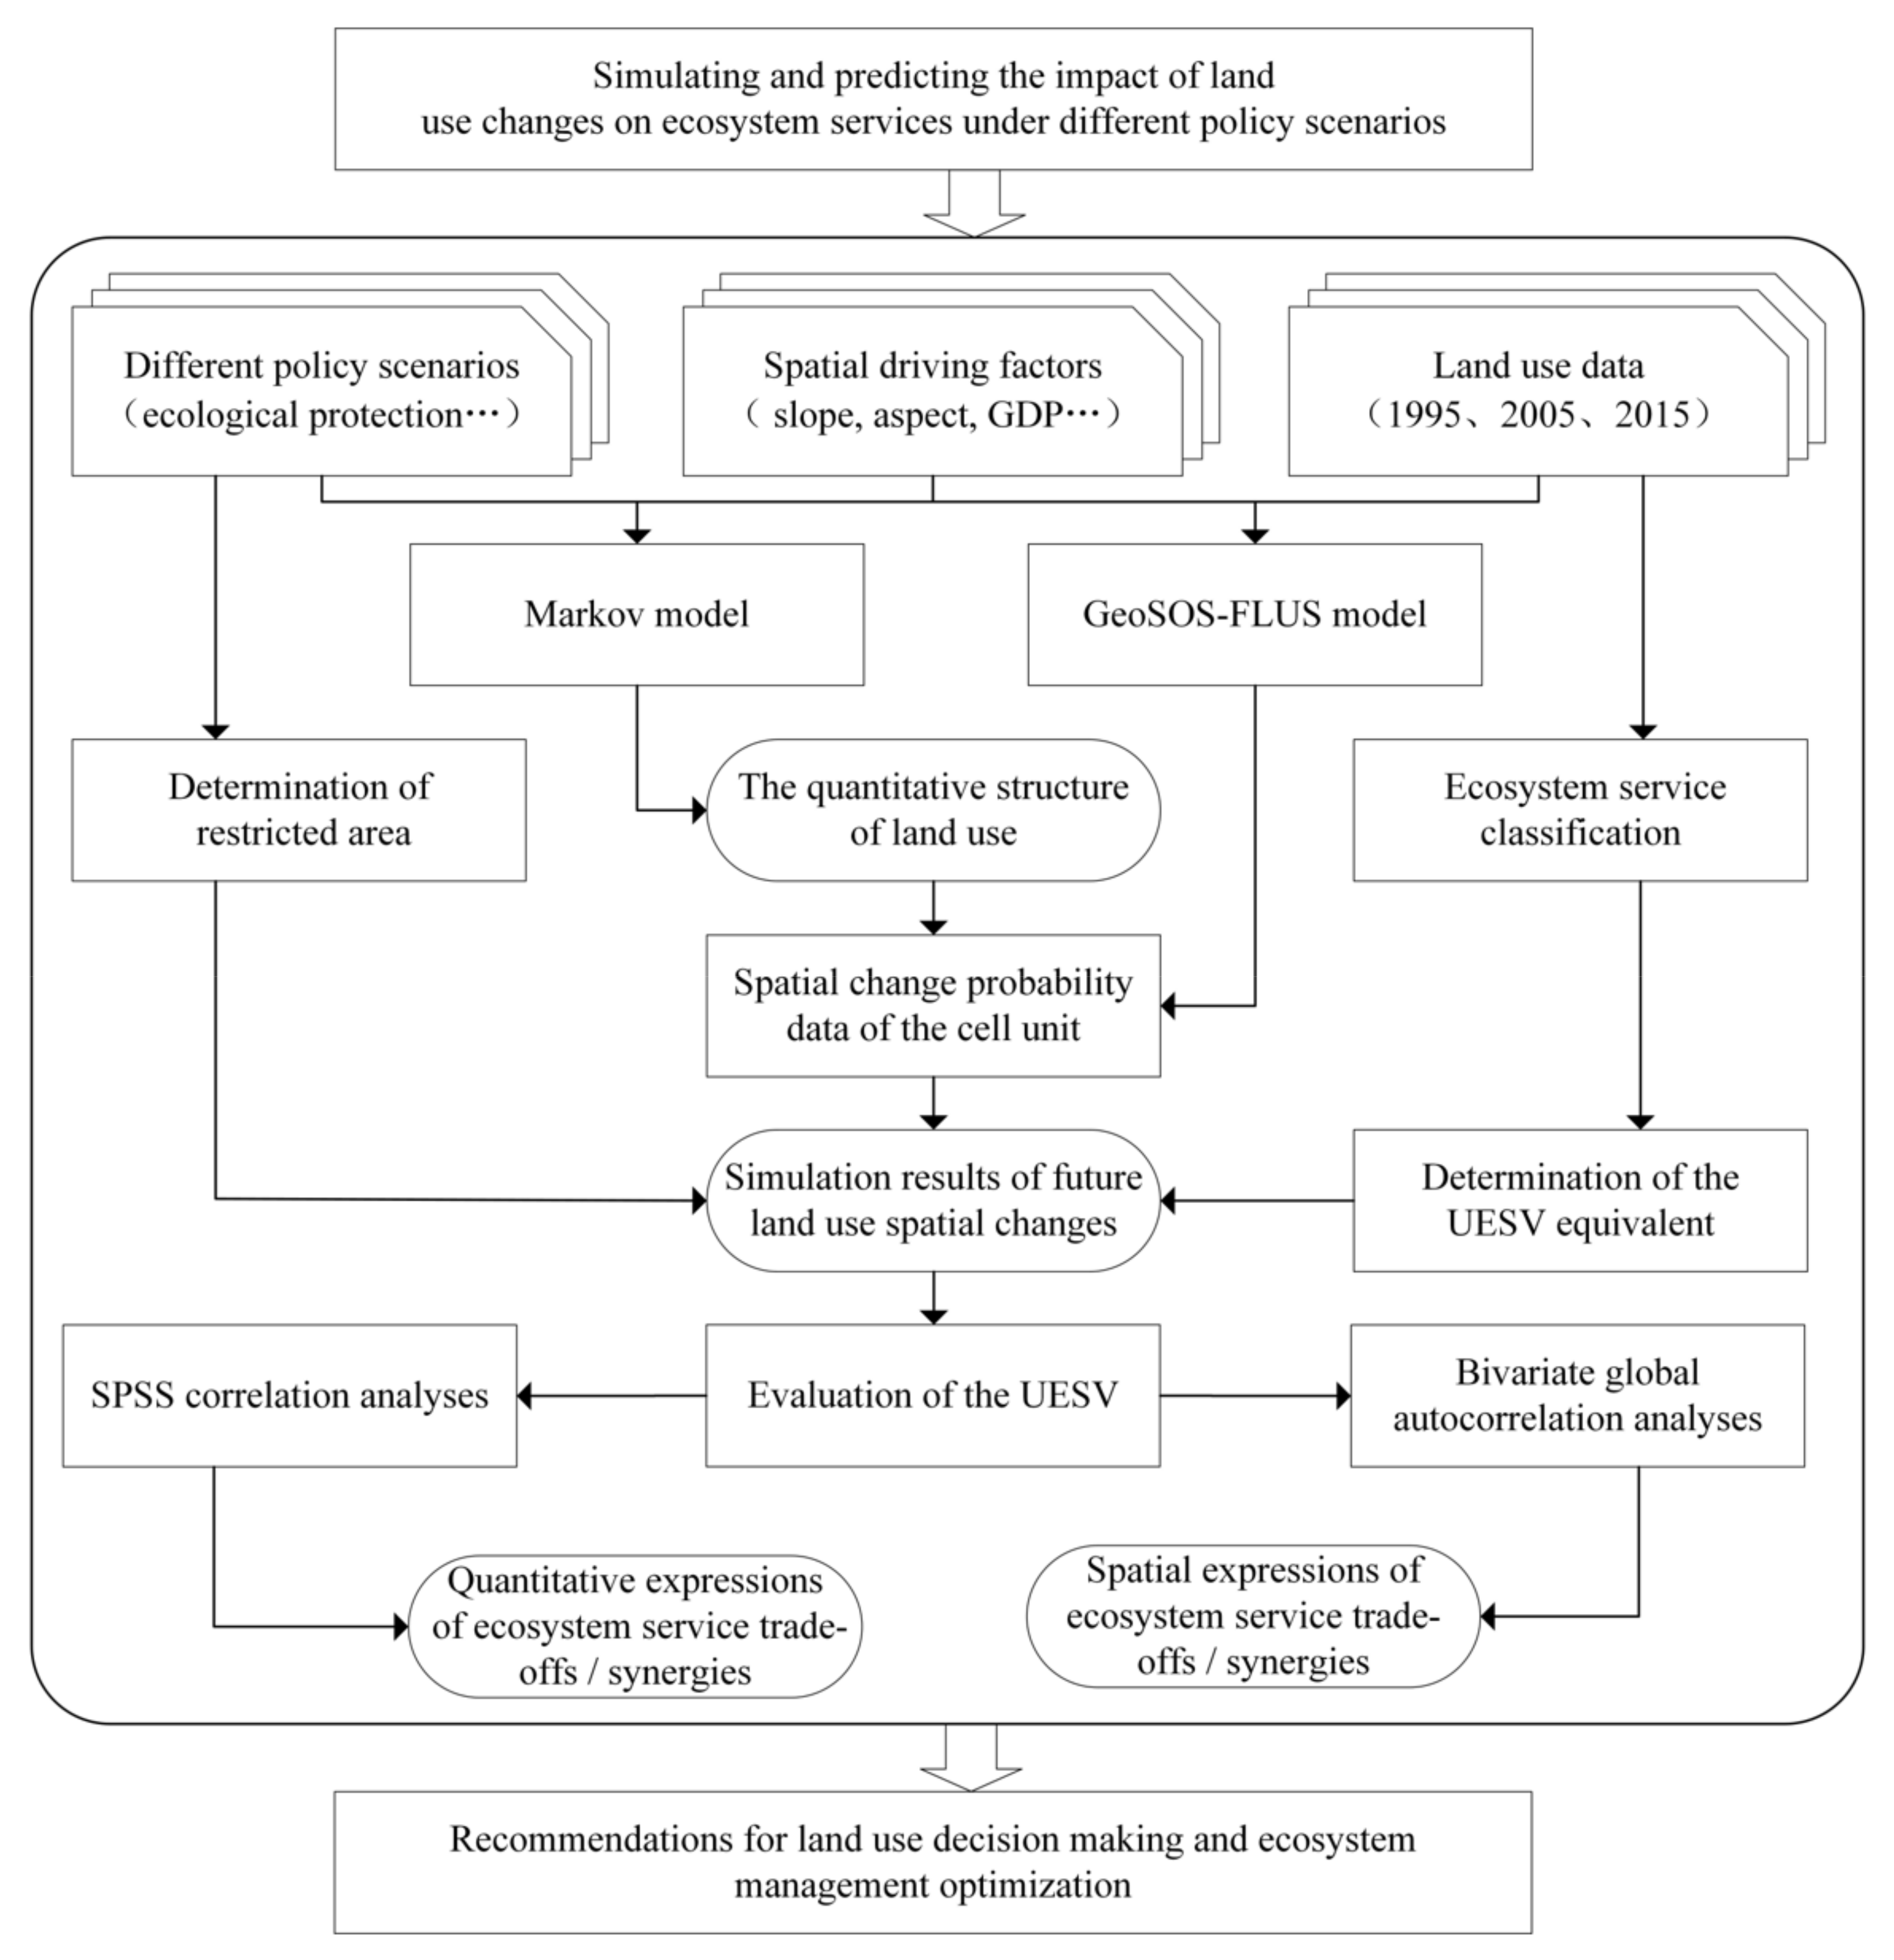
2.3. Research Framework
2.4. Methods
2.4.1. GeoSOS-FLUS Model
2.4.2. Ecosystem Service Classification and Value Evaluation
2.4.3. Determination of the Equivalent UESV of Anyang
2.4.4. Quantitative and Spatial Explicit of Ecosystem Service Trade-Offs and Synergies
3. Results
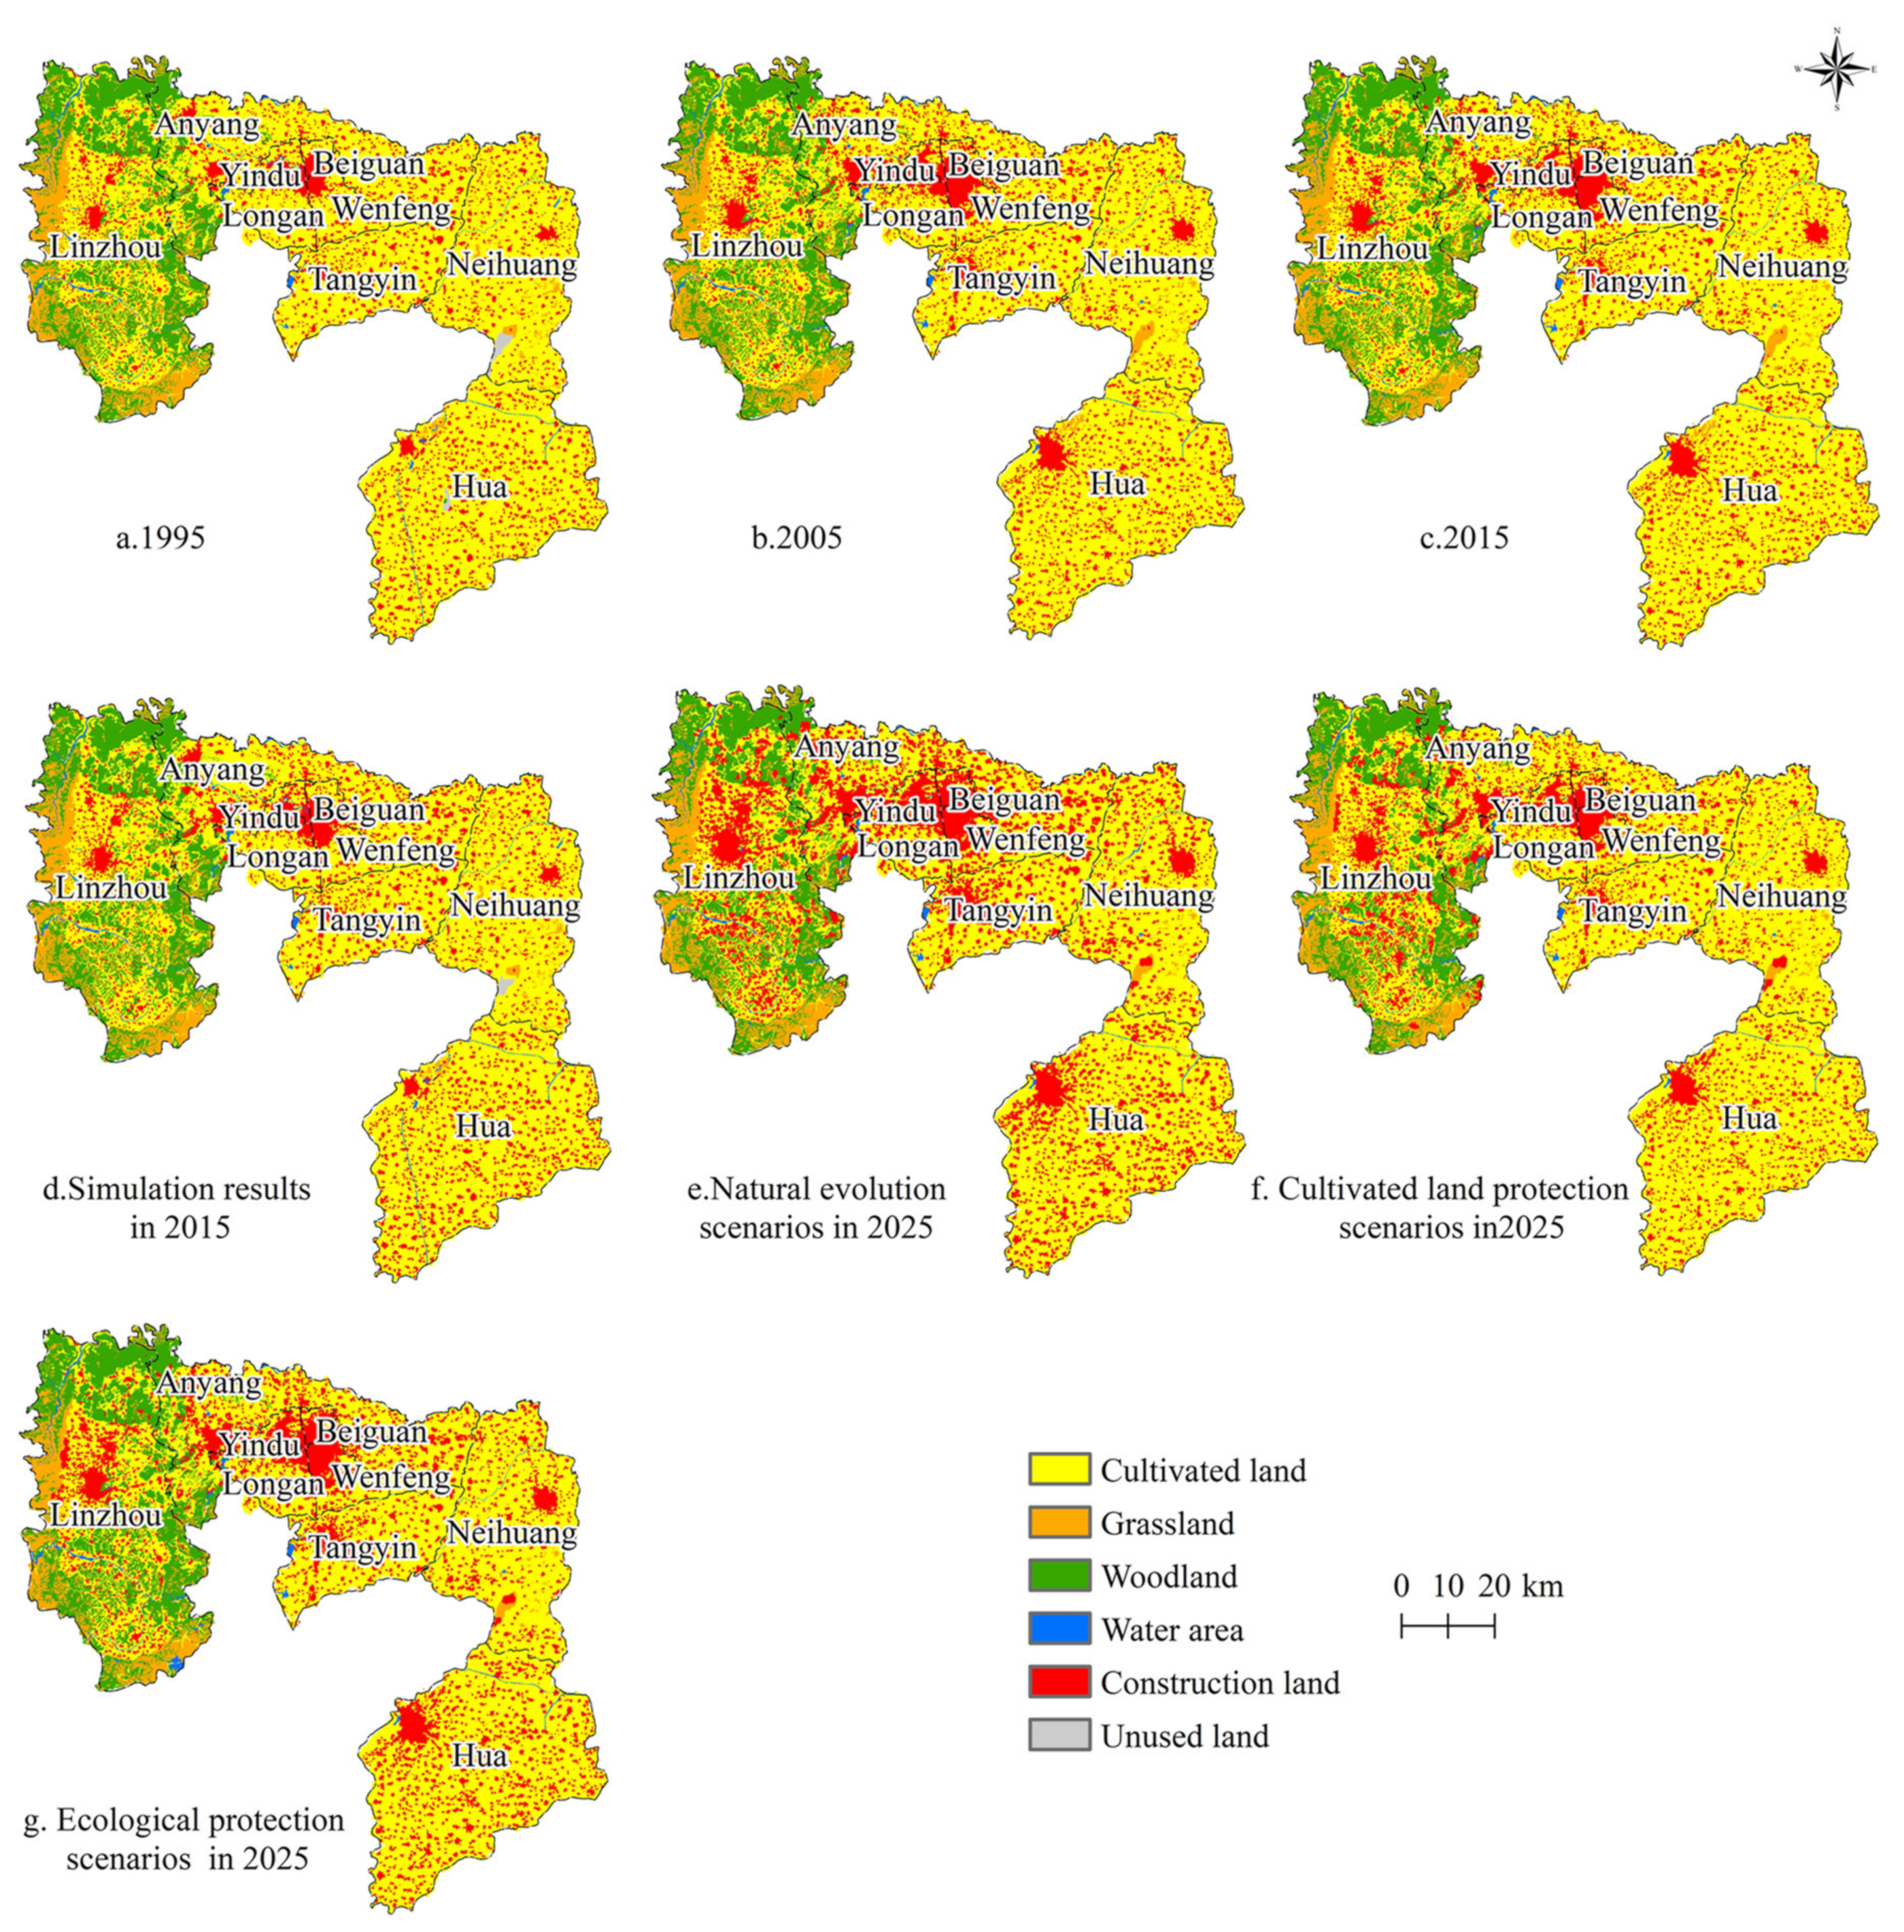
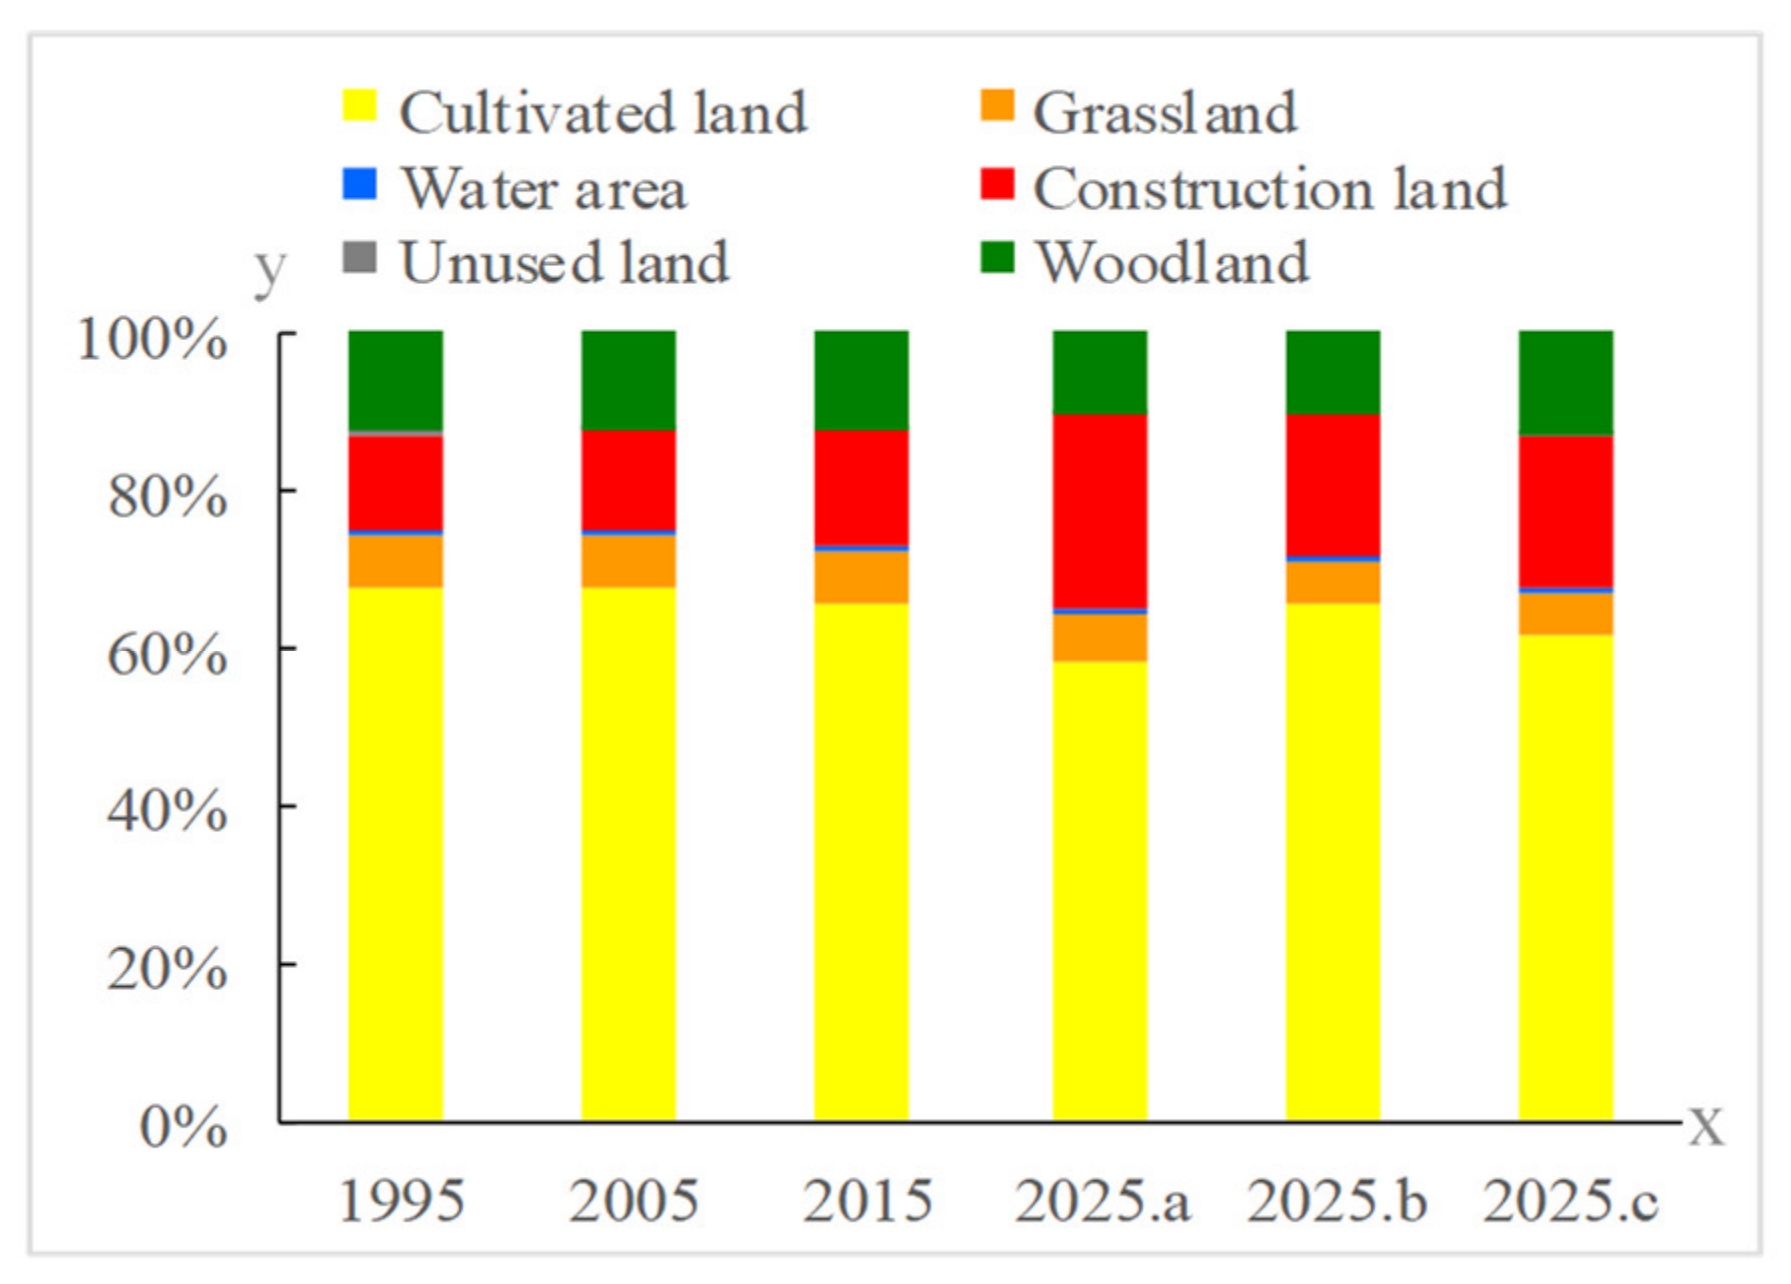
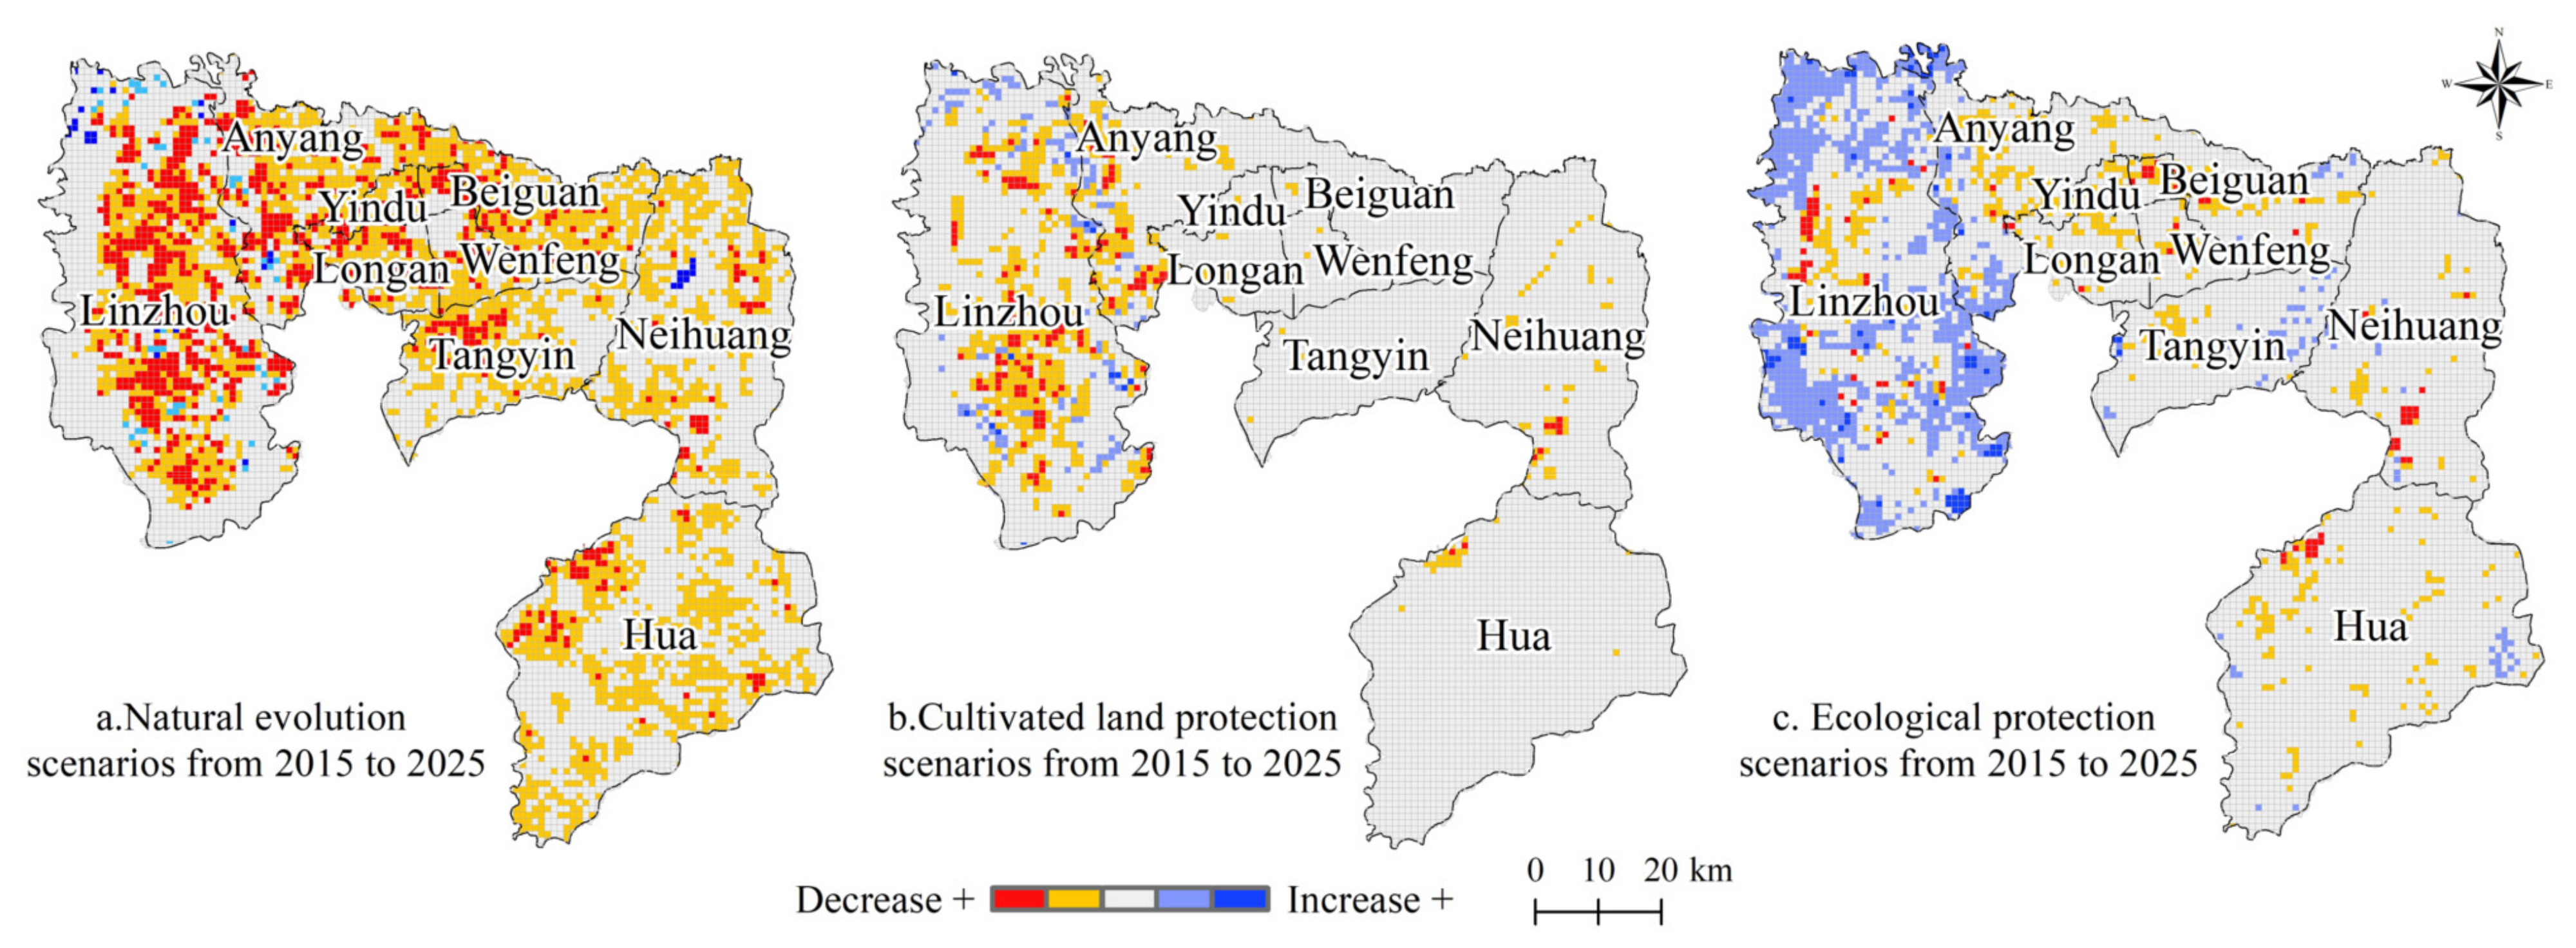
3.1. Land Use Change and Scenarios Simulation in Anyang
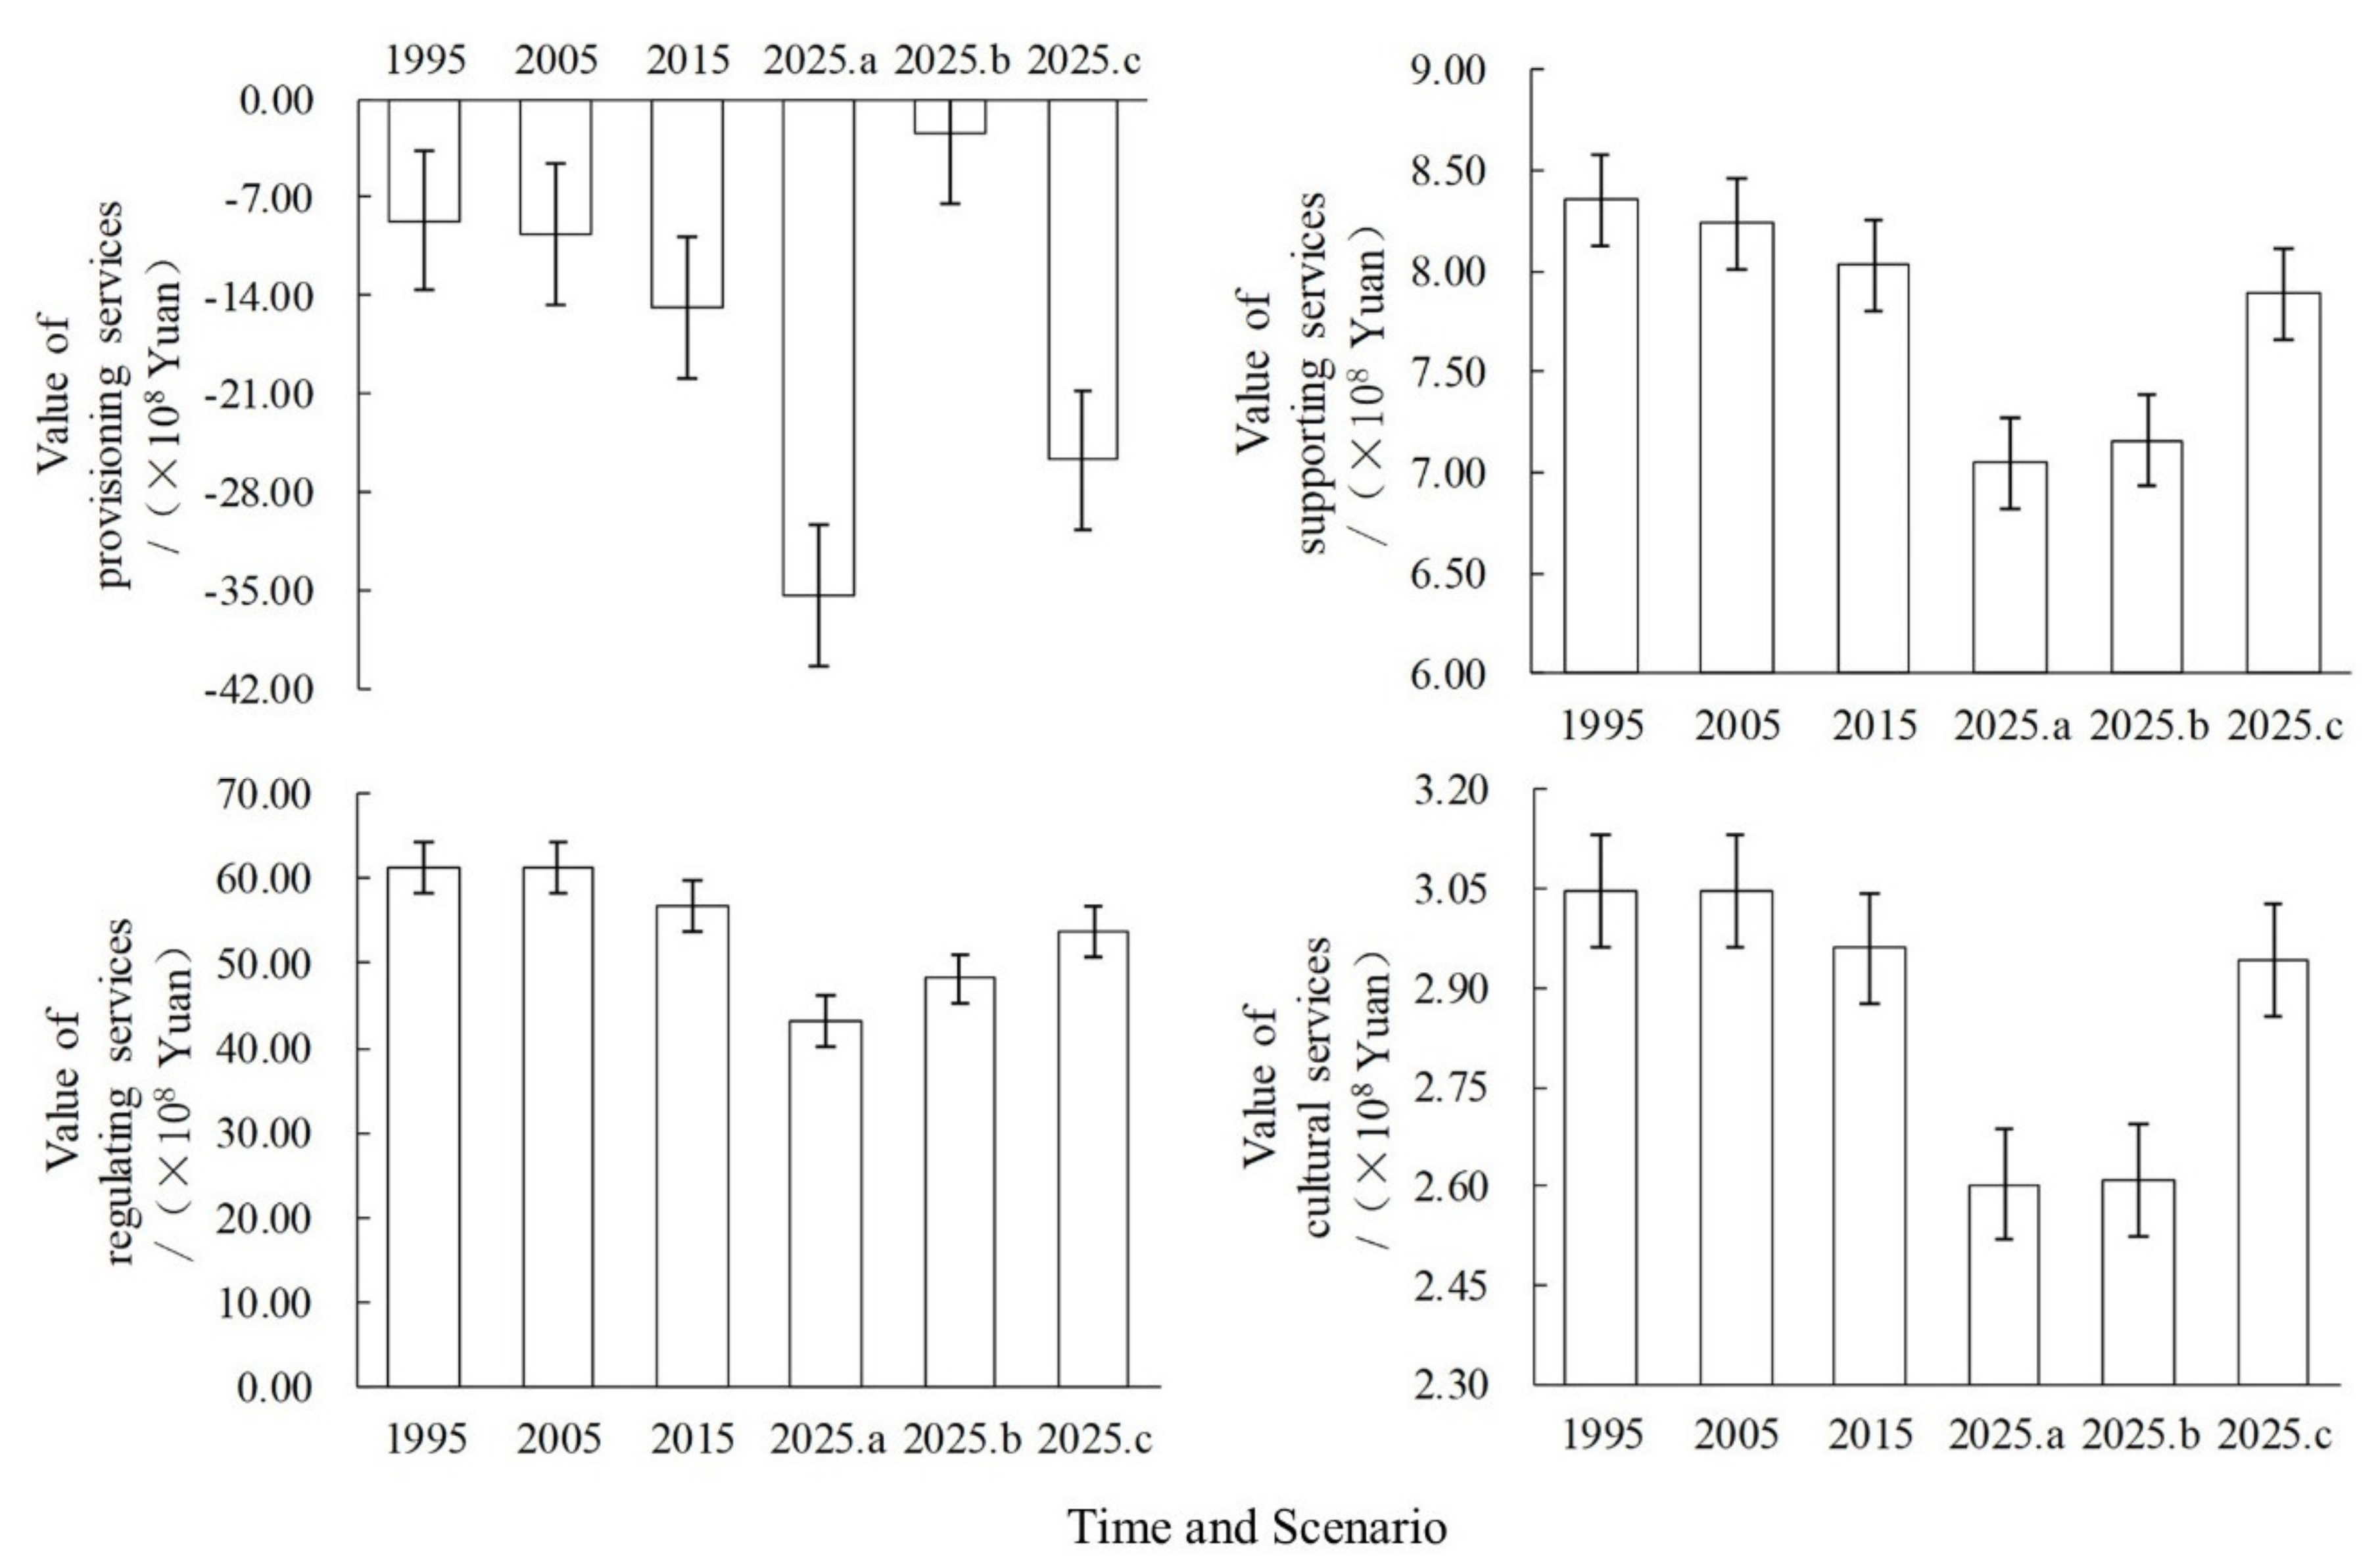
3.2. ESV Change and Scenarios Simulation in Anyang
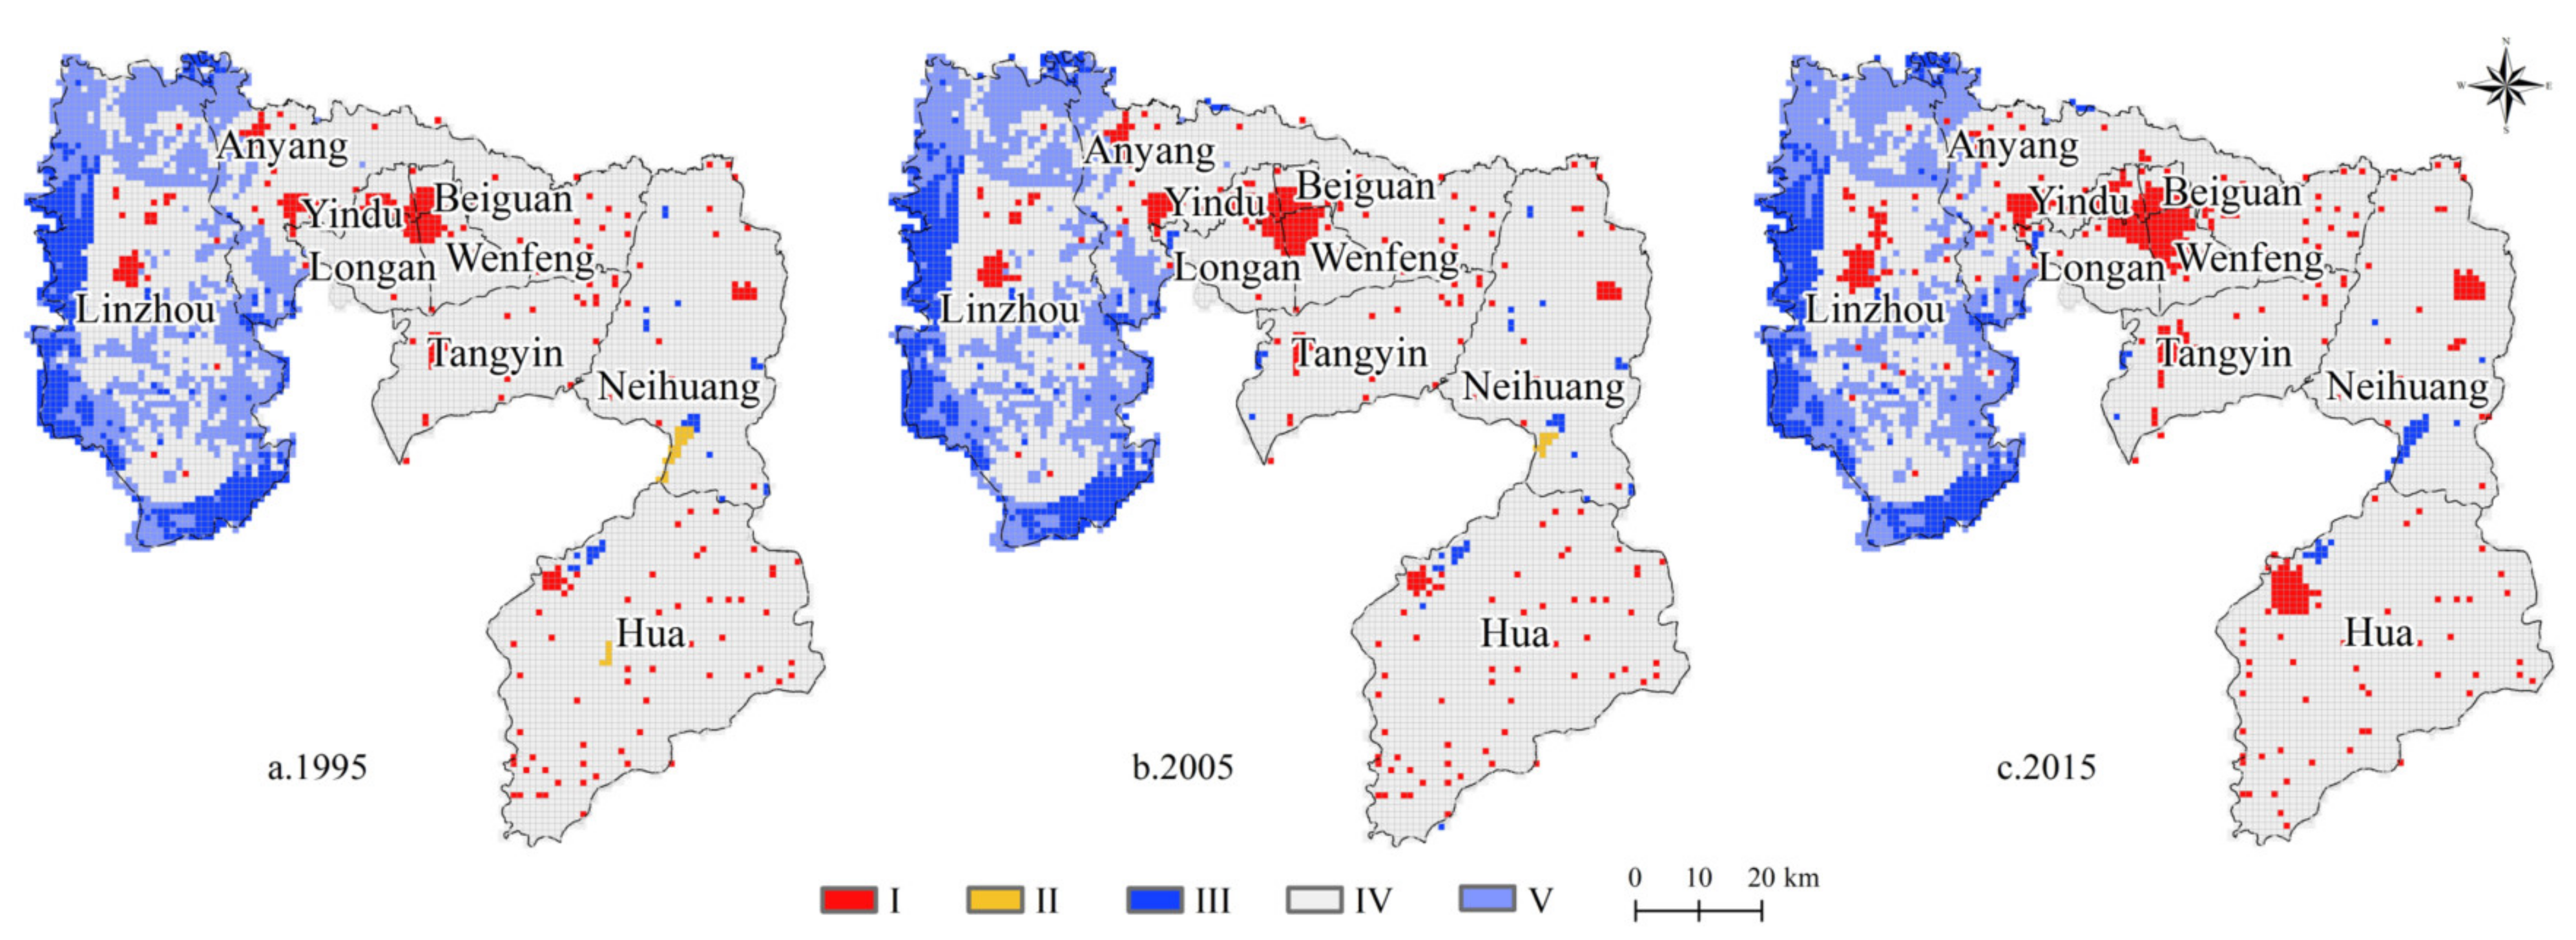
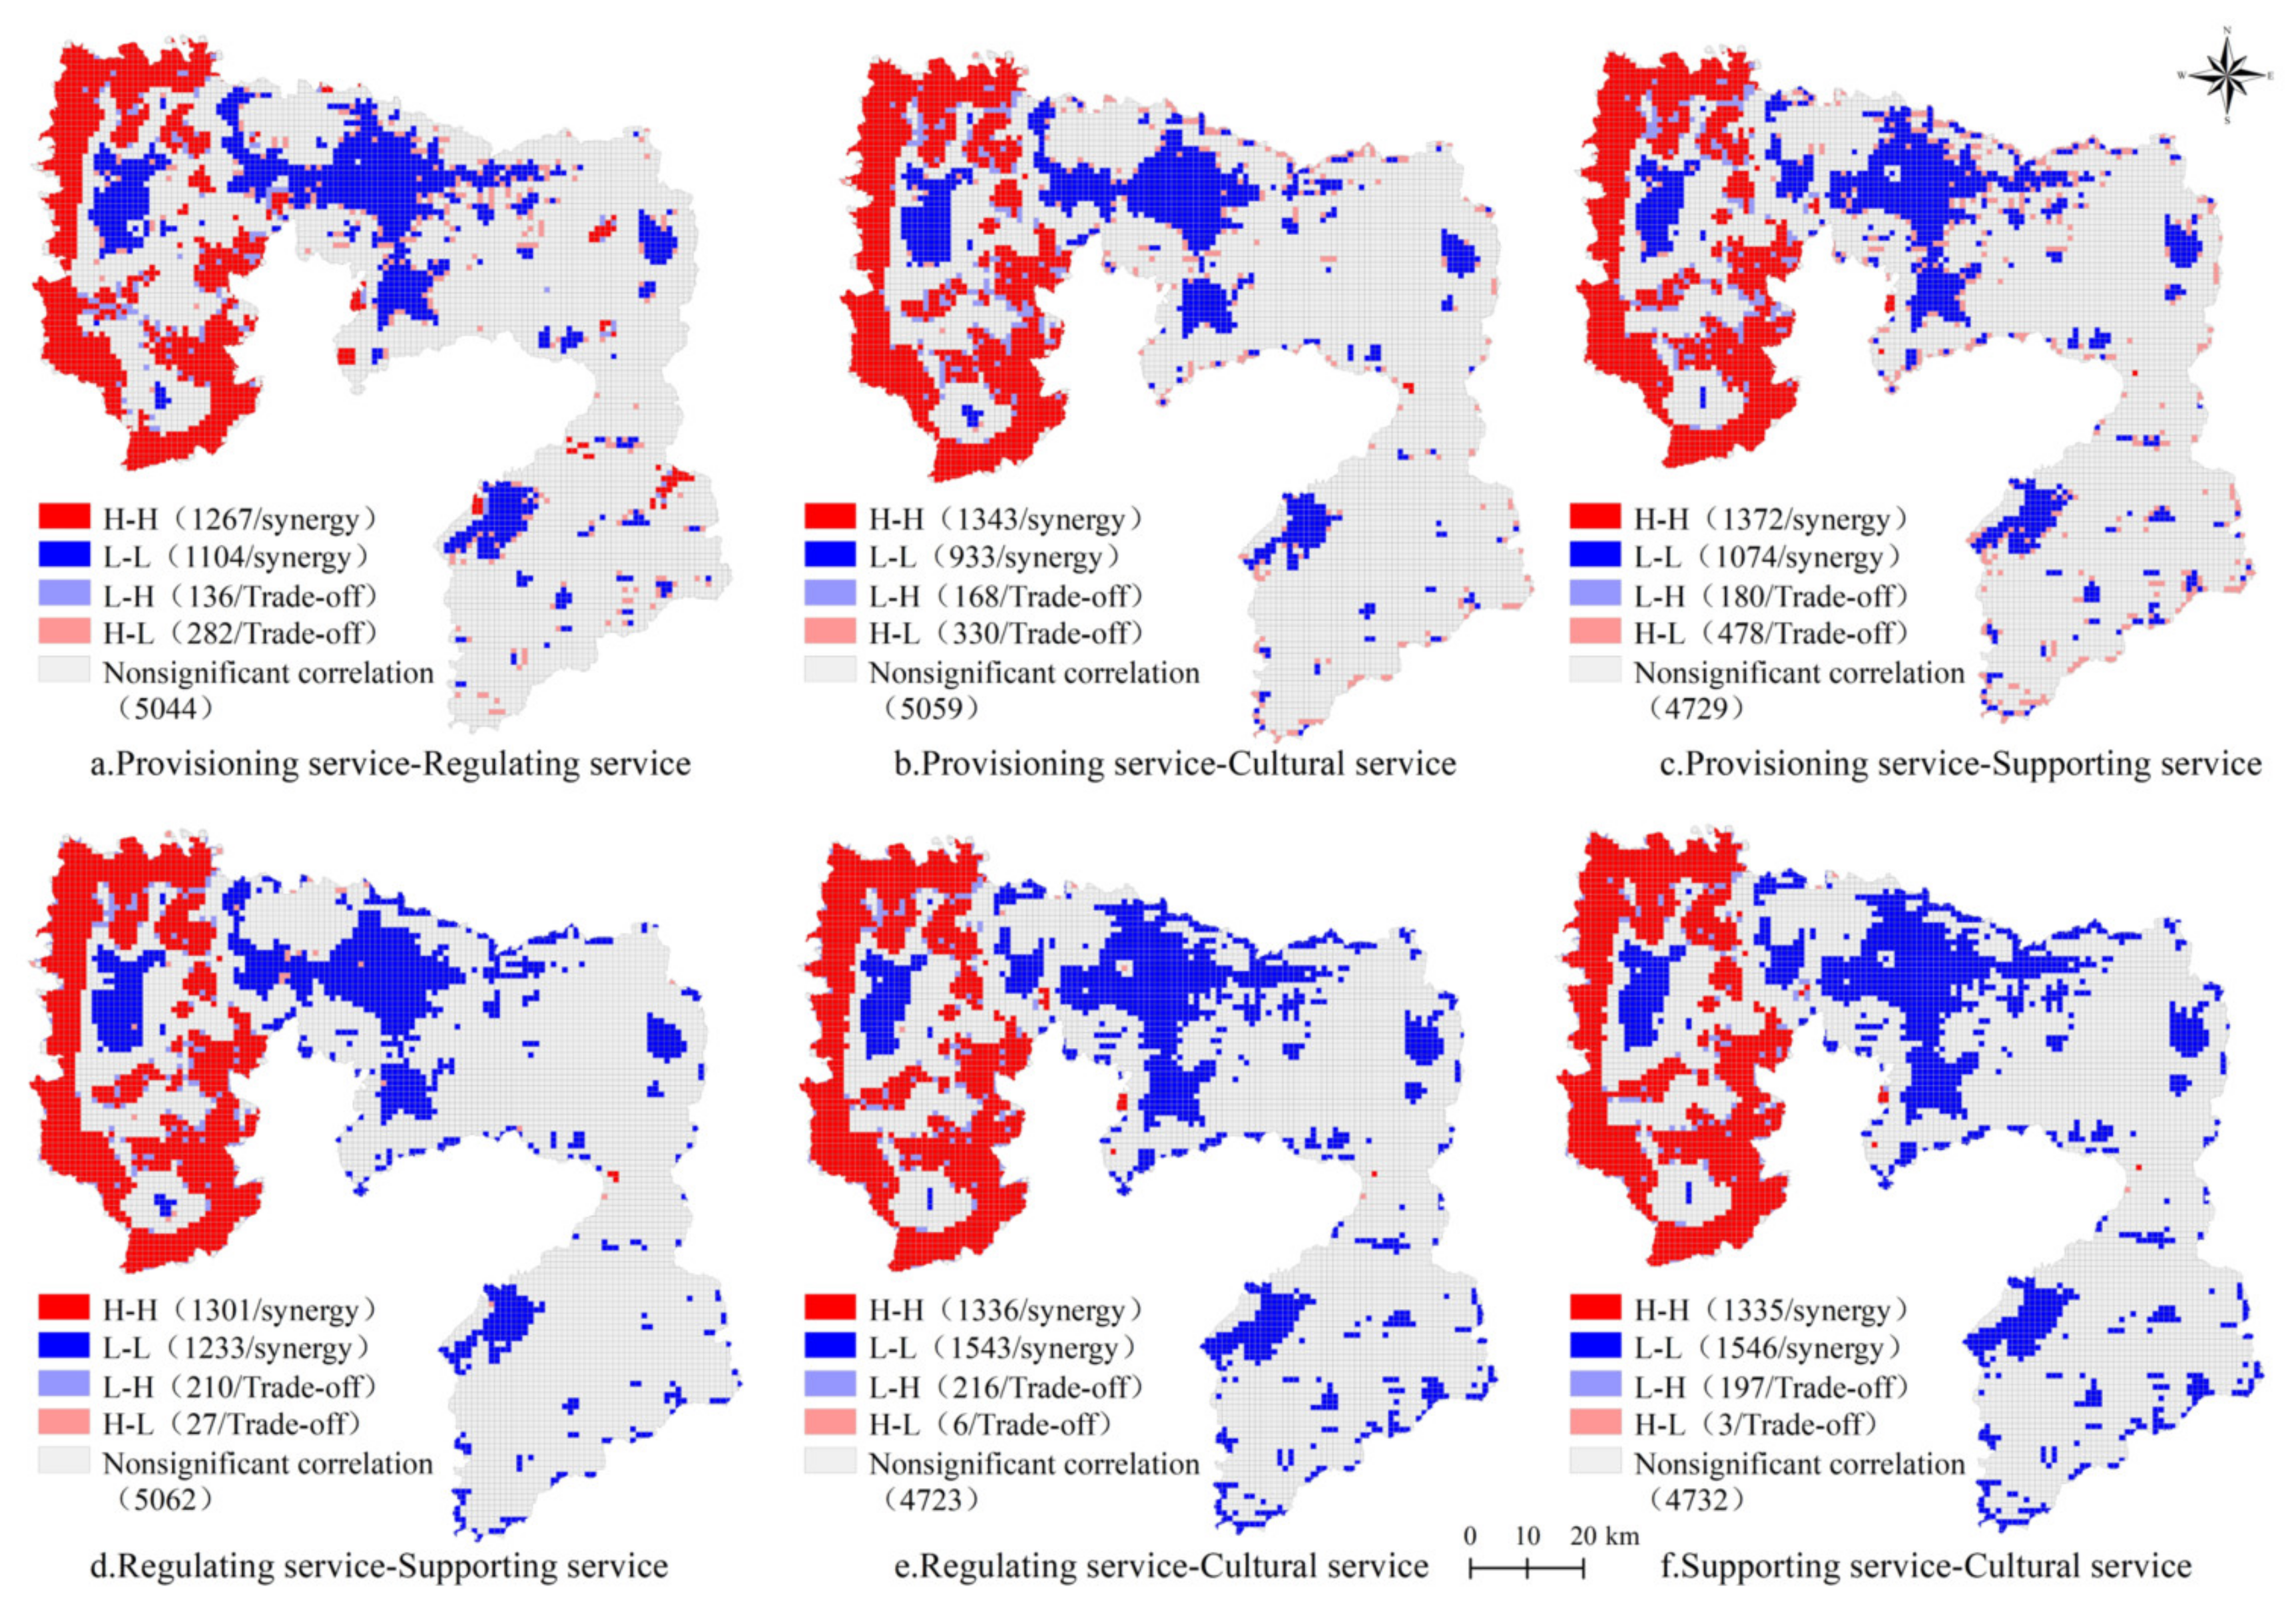
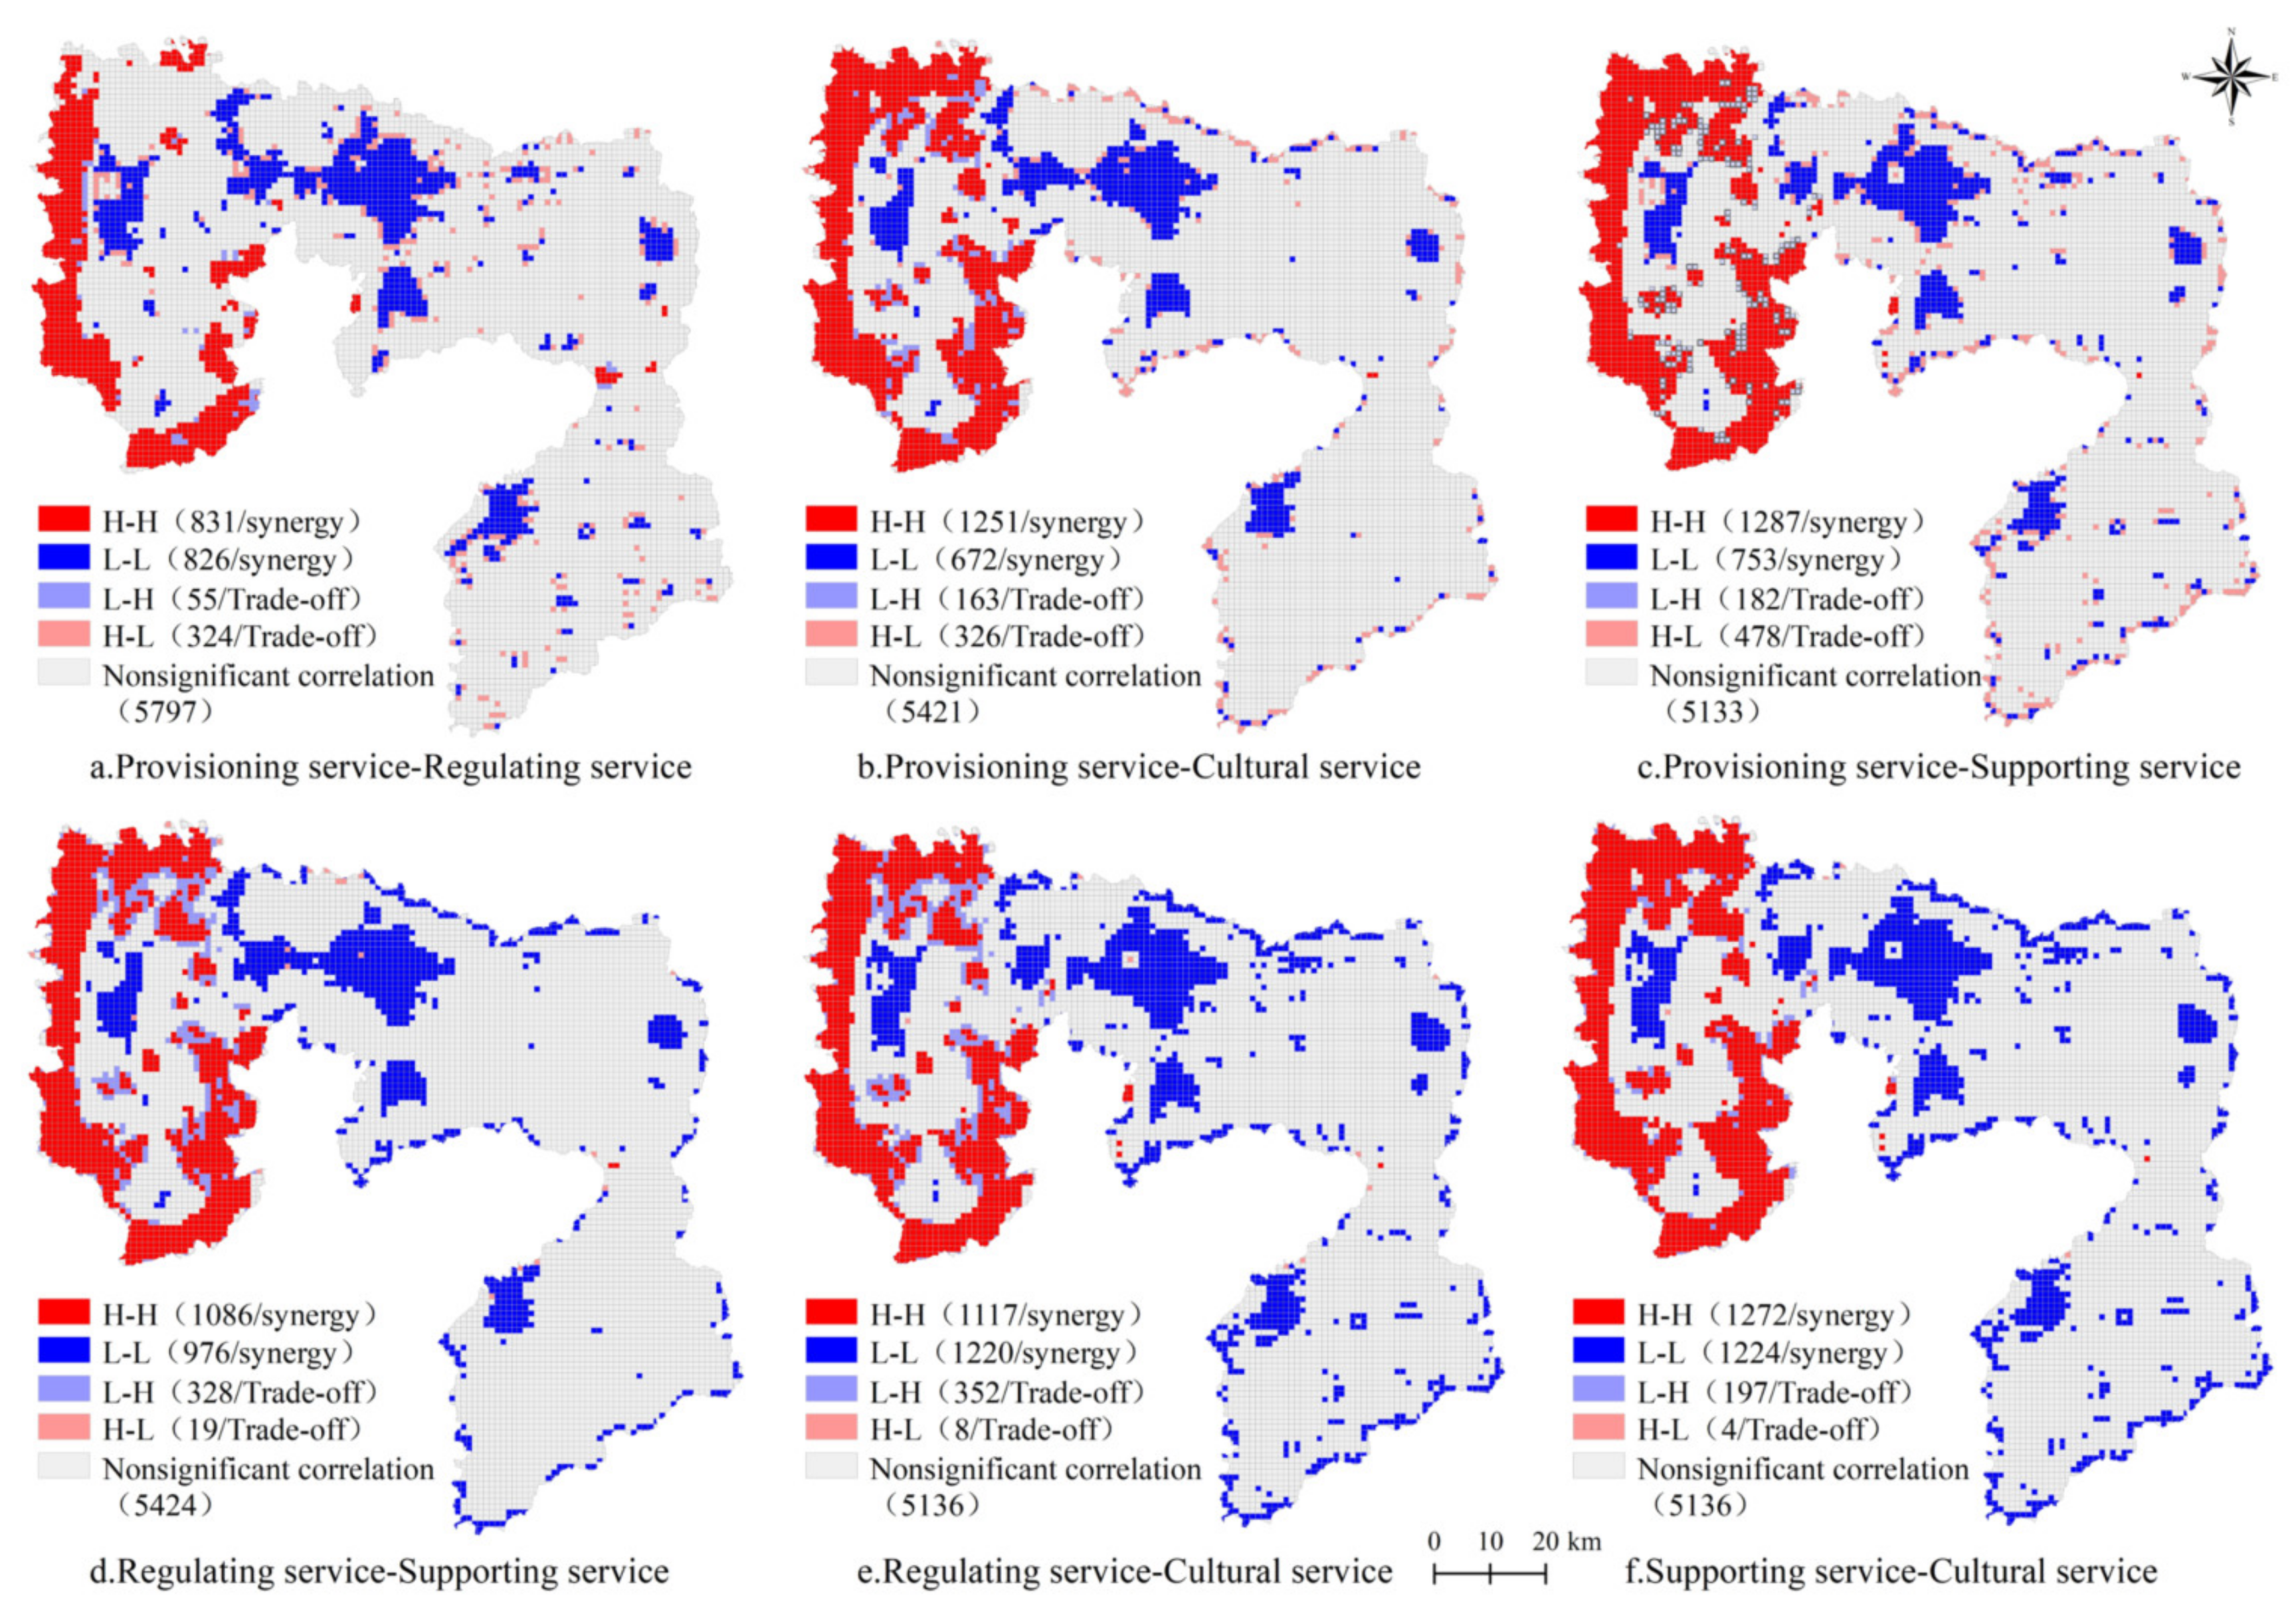
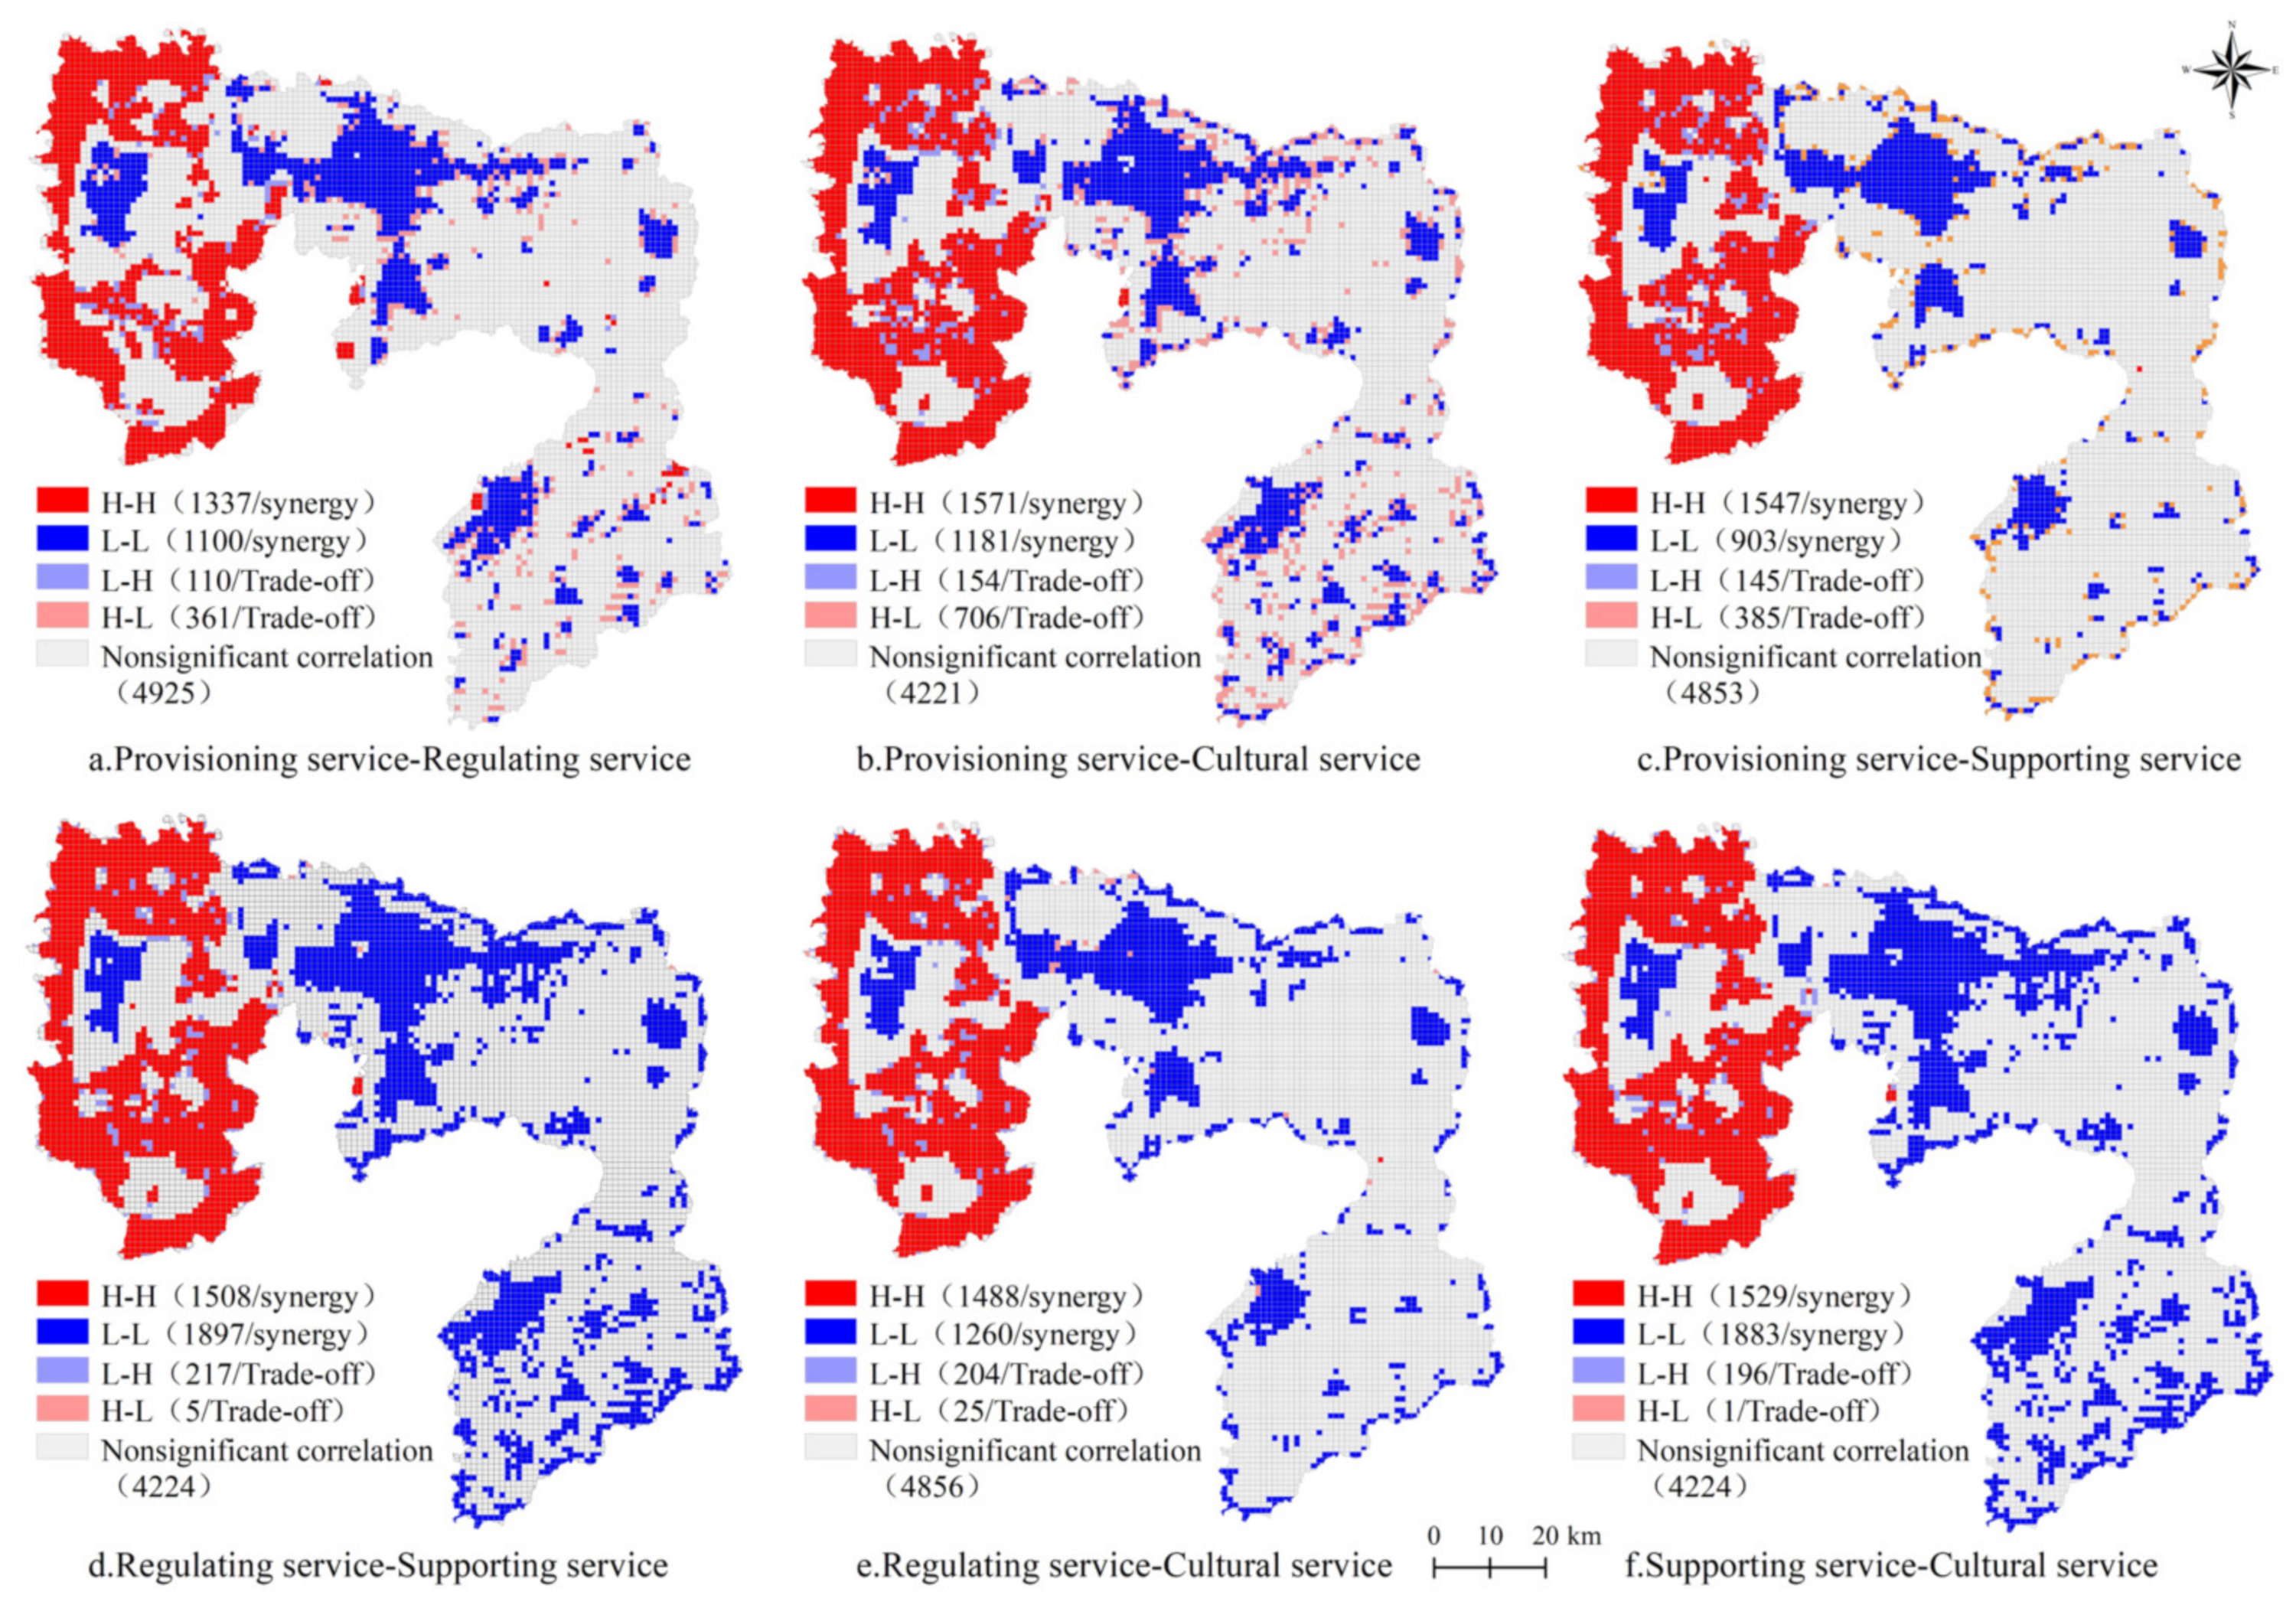
3.3. Trade-Offs and Synergies among Different Ecosystem Services Across Different Scenarios
4. Discussion
4.1. Framework of Simulating Effects of Land Use Changes on Ecosystem Services
4.2. Policy Enlightenments
4.3. Methodological Concerns
5. Conclusions
Author Contributions
Funding
Institutional Review Board Statement
Informed Consent Statement
Data Availability Statement
Conflicts of Interest
References
- Costanza, R.; D’Arge, R.; de Groot, R.; Farber, S.; Grasso, M.; Hannon, B.; Limburg, K.; Naeem, S.; O’Neill, R.V.; Paruelo, J.; et al. The value of the world’s ecosystem services and natural capital. Nature 1997, 387, 253–260. [Google Scholar] [CrossRef]
- Daily, G. Nature’s Services: Societal Dependence on Natural Ecosystems; Island Press: Washington, DC, USA, 1997. [Google Scholar]
- De Groot, R.S.; Alkemade, R.; Braat, L.; Hein, L.; Willemen, L. Challenges in integrating the concept of ecosystem services and values in landscape planning, management and decision making. Ecol. Complex. 2010, 7, 260–272. [Google Scholar] [CrossRef]
- Millennium Ecosystem Assessment (MEA). Ecosystems and Human Well-Being: Health Synthesis; Island Press: Washington, DC, USA, 2005. [Google Scholar]
- Mooney, H.; Duraiappah, A.; Larigauderie, A. Evolution of natural and social science interactions in global change research programs. Proc. Natl. Acad. Sci. USA 2013, 110, 3665–3672. [Google Scholar] [CrossRef] [Green Version]
- Wang, X.; Dong, X.; Liu, H.; Wei, H.; Fan, W.; Lu, N.; Xu, Z.; Ren, J.; Xing, K. Linking land use change, ecosystem services and human well-being: A case study of the Manas River Basin of Xinjiang, China. Ecosyst. Serv. 2017, 27, 113–123. [Google Scholar] [CrossRef]
- Hao, F.; Lai, X.; Ouyang, W.; Xu, Y.; Wei, X.; Song, K. Effects of Land Use Changes on the Ecosystem Service Values of a Reclamation Farm in Northeast China. Environ. Manag. 2012, 50, 888–899. [Google Scholar] [CrossRef]
- Balázsi, Á.; Dänhardt, J.; Collins, S.; Schweiger, O.; Hartel, T. Understanding cultural ecosystem services related to farmlands: Expert survey in Europe. Land Use Pol. 2021, 100, 104900. [Google Scholar] [CrossRef]
- Jiang, Z.; Sun, X.; Liu, F.; Shan, R.; Zhang, W. Spatio-temporal variation of land use and ecosystem service values and their impact factors in an urbanized agricultural basin since the reform and opening of China. Environ. Monit. Assess. 2019, 191, 739. [Google Scholar] [CrossRef] [PubMed]
- He, Y.; Wang, W.; Chen, Y.; Yan, H. Assessing spatio-temporal patterns and driving force of ecosystem service value in the main urban area of Guangzhou. Sci. Rep. 2021, 11, 3027. [Google Scholar] [CrossRef]
- Woldeyohannes, A.; Cotter, M.A.; Biru, W.D.; Kelboro, G. Assessing changes in ecosystem service values over 1985–2050 in response to land use and land cover dynamics in Abaya-Chamo Basin, Southern Ethiopia. Land 2020, 9, 37. [Google Scholar] [CrossRef] [Green Version]
- Polasky, S.; Nelson, E.; Pennington, D.; Johnson, K.A. The Impact of Land-Use Change on Ecosystem Services, Biodiversity and Returns to Landowners: A Case Study in the State of Minnesota. Environ. Resour. Econ. 2011, 48, 219–242. [Google Scholar] [CrossRef]
- Kindu, M.; Schneider, T.; Teketay, D.; Knoke, T. Changes of ecosystem service values in response to land use/land cover dynamics in Munessa–Shashemene landscape of the Ethiopian highlands. Sci. Total Environ. 2016, 547, 137–147. [Google Scholar] [CrossRef] [PubMed]
- Russo, D.; Bosso, L.; Ancillotto, L. Novel perspectives on bat insectivory highlight the value of this ecosystem service in farmland: Research frontiers and management implications. Agric. Ecosyst. Environ. 2018, 266, 31–38. [Google Scholar] [CrossRef]
- Lin, J.; Huang, J.; Prell, C.; Bryan, B.A. Changes in Supply and Demand Mediate the Effects of Land-Use Change on Freshwater Ecosystem Services Flows. Sci. Total Environ. 2020, 763, 143012. [Google Scholar] [CrossRef] [PubMed]
- Cui, F.A.; Wang, B.; Zhang, Q.; Tang, H.; De Maeyer, P.; Hamdi, R.; Dai, L. Climate change versus land-use change—What affects the ecosystem services more in the forest-steppe ecotone? Sci. Total Environ. 2020, 759, 143525. [Google Scholar] [CrossRef]
- Kasimu, Y.; Yang, S.; Simayi, Z. Impact of land use change on ecosystem service value in Ebinur Lake Basin, Xinjiang. Trans. Chin. Agric. Eng. 2019, 35, 260–269. (In Chinese) [Google Scholar]
- Arowolo, A.O.; Deng, X.; Olatunji, O.A.; Obayelu, A.E. Assessing changes in the value of ecosystem services in response to land-use/land-cover dynamics in Nigeria. Sci. Total Environ. 2018, 636, 597–609. [Google Scholar] [CrossRef]
- Hu, M.; Li, Z.; Wang, Y.; Jiao, M.; Li, M.; Xia, B. Spatio-temporal changes in ecosystem service value in response to land-use/cover changes in the Pearl River Delta. Resour. Conserv. Recycl. 2019, 149, 106–114. [Google Scholar] [CrossRef]
- Guo, C.; Gao, S.; Zhou, B.; Gao, J. Effects of land use change on ecosystem service value in Funiu Mountain based upon a grid square. Acta Ecol. Sin. 2019, 39, 3482–3493. (In Chinese) [Google Scholar]
- Song, W.; Deng, X. Land-use/land-cover change and ecosystem service provision in China. Sci. Total Environ. 2017, 576, 705–719. [Google Scholar] [CrossRef]
- Poelmans, L.; Van Rompaey, A. Complexity and performance of urban expansion models. Comput. Environ. Urban Syst. 2010, 34, 17–27. [Google Scholar] [CrossRef]
- Güneralp, B.B.T.E.; Perlstein, A.A.V.E.; Seto, K.K.S.Y. Balancing urban growth and ecological conservation: A challenge for planning and governance in China. Ambio 2015, 44, 532–543. [Google Scholar] [CrossRef] [PubMed] [Green Version]
- Zorrilla-Miras, P.; Palomo, I.; Oacute, G.; Mez-Baggethun, E.; Iacute, M.; Oacute, N.; Pez, B.; Lomas, P.L.; Montes, C. Effects of land-use change on wetland ecosystem services: A case study in the Doñana marshes (SW Spain). Landsc. Urban Plan. 2014, 122, 160–174. [Google Scholar] [CrossRef]
- Mendoza-Gonzalez, G.; Martinez, M.L.; Lithgow, D.; Perez-Maqueo, O.; Simonin, P. Land use change and its effects on the value of ecosystem services along the coast of the Gulf of Mexico. Ecol. Econ. 2012, 82, 23–32. [Google Scholar] [CrossRef]
- Wang, Y.; Gao, J.; Wang, J.; Qiu, J. Value Assessment of Ecosystem Services in Nature Reserves in Ningxia, China: A Response to Ecological Restoration. PLoS ONE 2014, 9, e89174. [Google Scholar] [CrossRef]
- Gashaw, T.; Tulu, T.; Argaw, M.; Worqlul, A.W.; Tolessa, T.; Kindu, M. Estimating the impacts of land use/land cover changes on Ecosystem Service Values: The case of the Andassa watershed in the Upper Blue Nile basin of Ethiopia. Ecosyst. Serv. 2018, 31, 219–228. [Google Scholar] [CrossRef]
- Mamat, A.; Wang, J.; Ma, Y. Impacts of Land-Use Change on Ecosystem Service Value of Mountain–Oasis–Desert Ecosystem: A Case Study of Kaidu–Kongque River Basin, Northwest China. Sustainability 2021, 13, 140. [Google Scholar] [CrossRef]
- Xiao, R.; Lin, M.; Fei, X.; Li, Y.; Zhang, Z.; Meng, Q. Exploring the interactive coercing relationship between urbanization and ecosystem service value in the Shanghai–Hangzhou Bay Metropolitan Region. J. Clean. Prod. 2020, 253, 119803. [Google Scholar] [CrossRef]
- Athukorala, D.; Estoque, R.; Murayama, Y.; Matsushita, B. Impacts of Urbanization on the Muthurajawela Marsh and Negombo Lagoon, Sri Lanka: Implications for Landscape Planning Towards a Sustainable Urban Wetland Ecosystem. Remote Sens. 2021, 13, 316. [Google Scholar] [CrossRef]
- Wu, F.; Wang, X.; Ren, Y. Urbanization’s Impacts on Ecosystem Health Dynamics in the Beijing-Tianjin-Hebei Region, China. Int. J. Environ. Res. Public Health 2021, 18, 918. [Google Scholar] [CrossRef] [PubMed]
- Ye, Y.; Bryan, B.A.; Zhang, J.; Connor, J.D.; Chen, L.; Qin, Z.; He, M. Changes in land-use and ecosystem services in the Guangzhou-Foshan Metropolitan Area, China from 1990 to 2010: Implications for sustainability under rapid urbanization. Ecol. Indic. 2018, 93, 930–941. [Google Scholar] [CrossRef]
- Liang, J.; Zhong, M.; Zeng, G.; Chen, G.; Hua, S.; Li, X.; Yuan, Y.; Wu, H.; Gao, X. Risk management for optimal land use planning integrating ecosystem services values: A case study in Changsha, Middle China. Sci. Total Environ. 2017, 579, 1675–1682. [Google Scholar] [CrossRef]
- Jing, Y.; Chang, Y.; Cheng, X.; Wang, D. Land-use changes and ecosystem services under different scenarios in Nansi Lake Basin, China. Environ. Monit. Assess. 2021, 1, 21. [Google Scholar] [CrossRef]
- Landuyt, D.; Broekx, S.; Engelen, G.; Uljee, I.; Van der Meulen, M.; Goethals, P.L.M. The importance of uncertainties in scenario analyses—A study on future ecosystem service delivery in Flanders. Sci. Total Environ. 2016, 553, 504–518. [Google Scholar] [CrossRef] [PubMed]
- Smeraldo, S.; Bosso, L.; Fraissinet, M.; Bordignon, L.; Brunelli, M.; Ancillotto, L.; Russo, D. Modelling risks posed by wind turbines and power lines to soaring birds: The black stork (Ciconia nigra) in Italy as a case study. Biodivers. Res. Conserv. 2020, 29, 1959–1976. [Google Scholar] [CrossRef]
- Liu, X.; Liang, X.; Li, X.; Xu, X.; Ou, J.; Chen, Y.; Li, S.; Wang, S.; Pei, F. A future land use simulation model (FLUS) for simulating multiple land use scenarios by coupling human and natural effects. Landsc. Urban Plan. 2017, 168, 94–116. [Google Scholar] [CrossRef]
- Liang, X.; Liu, X.; Li, X. Delineating multi-scenario urban growth boundaries with a CA-based FLUS model and morphological method. Landsc. Urban Plan. 2018, 117, 47–63. [Google Scholar] [CrossRef]
- Cao, S.; Jin, X.; Yang, X.; Sun, J.; Liu, J.; Han, B.; Xu, W.; Zhou, Y. Coupled MOP and GeoSOS-FLUS models research on optimization of land use structure and layout in Jintan district. J. Nat. Resour. 2019, 34, 1171–1185. (In Chinese) [Google Scholar]
- Xie, G.; Zhen, L.; Lu, C.; Xiao, Y.; Chen, C. Expert Knowledge Based Valuation Method of Ecosystem Services in China. J. Nat. Resour. 2008, 23, 911–919. (In Chinese) [Google Scholar]
- Xie, G.; Zhang, C.; Zhang, C.; Xiao, Y.; Lu, C. The value of ecosystem services in China. Resour. Sci. 2015, 37, 1740–1746. (In Chinese) [Google Scholar]
- Wang, P.; Sun, H.; Hua, B.; Fan, S. Evaluation and Dynamic Simulation of Ecosystem Service Value in Coastal Area of Fuzhou City. Trans. CSAM 2020, 51, 249–257. (In Chinese) [Google Scholar]
- Bian, Z.; Lu, Q. Ecological effects analysis of land use change in coal mining area based on ecosystem service valuing: A case study in Jiawang. Environ. Earth Sci. 2013, 68, 1619–1630. [Google Scholar] [CrossRef]
- Shao, Y.; Yuan, X.; Ma, C.; Ma, R.; Ren, Z. Quantifying the Spatial Association between Land Use Change and Ecosystem Services Value: A Case Study in Xi’an, China. Sustainability 2020, 12, 4449. [Google Scholar] [CrossRef]
- Gao, X.; Wang, J.; Li, C.; Shen, W.; Song, Z.; Nie, C.; Zhang, X. Land use change simulation and spatial analysis of ecosystem service value in Shijiazhuang under multi-scenarios. Environ. Sci. Pollut. Res. 2021. [Google Scholar] [CrossRef]
- Crouzat, E.; Mouchet, M.; Turkelboom, F.; Byczek, C.; Meersmans, J.; Berger, F.; Verkerk, P.J.; Lavorel, S. Assessing bundles of ecosystem services from regional to landscape scale: Insights from the French Alps. J. Appl. Ecol. 2015, 52, 1145–1155. [Google Scholar] [CrossRef] [Green Version]
- Lin, M.; Lin, T.; Sun, C.; Jones, L.; Sui, J.; Zhao, Y.; Liu, J.; Xing, L.; Ye, H.; Zhang, G.; et al. Using the Eco-Erosion Index to assess regional ecological stress due to urbanization? A case study in the Yangtze River Delta urban agglomeration. Ecol. Indic. 2020, 111, 106028. [Google Scholar] [CrossRef]
- Zhang, T.; Tian, Y.; Xu, S.; Tang, L.; Guo, W. The evolvement of land use patterns in coastal cities and its influence on ecosystem service values. Acta Ecol. Sin. 2018, 38, 7572–7581. (In Chinese) [Google Scholar]
- Li, X.; Zhu, Y.; Zhao, L.; Tian, J.; Li, J. cosystem services value change in Qinglong County from dynamically ad-justed value coefficients. Chin. J. Eco-Agric. 2015, 23, 373–381. (In Chinese) [Google Scholar]
- Zhang, J. Optimization of Land Use Structure Based on Ecosystem Service Value; Northwest University: Xi’an, China, 2008. (In Chinese) [Google Scholar]
- Xiao, Y.; Xie, G.; An, K. Economic value of ecosystem services in Mangcuo Lake drainage basin. Chin. J. Appl. Ecol. 2003, 14, 676–680. (In Chinese) [Google Scholar]
- Ding, L.; Wang, Q.; Chen, S.; Tang, K. The responses of ecosystem services to land-use change in Dianshan Lake area from 1984 to 2014. Acta Ecol. Sin. 2019, 39, 2973–2985. (In Chinese) [Google Scholar]
- Li, S.; Zhang, C.; Liu, J.; Zhu, W.; Ma, C.; Wang, Y. The tradeoffs and synergies of ecosystem services: Research progress, development trend, and themes of geography. J. Geogr. Sci. 2013, 32, 1379–1390. (In Chinese) [Google Scholar]
- Zhao, J.; Li, C. Investigating spatiotemporal dynamics and trade-off/synergy of multiple ecosystem services in response to land cover change: A case study of Nanjing city, China. Environ. Monit. Assess. 2020, 192, 701. [Google Scholar] [CrossRef]
- Qiu, L.; Zhang, M.; Zhou, B.; Cui, Y.; Yu, Z.; Liu, T.; Wu, S. Economic and ecological trade-offs of coastal reclamation in the Hangzhou Bay, China. Ecol. Indic. 2021, 125, 107477. [Google Scholar] [CrossRef]
- Wei, H.; Xu, Z.; Liu, H.; Ren, J.; Fan, W.; Lu, N.; Dong, X. Evaluation on dynamic change and interrelations of ecosystem services in a typical mountain-oasis-desert region. Ecol. Indic. 2018, 93, 917–929. [Google Scholar] [CrossRef]
- Haase, D.; Schwarz, N.; Strohbach, M.; Kroll, F.; Seppelt, R. Synergies, Trade-offs, and Losses of Ecosystem Services in Urban Regions: An Integrated Multiscale Framework Applied to the Leipzig-Halle Region, Germany. Ecol. Soc. 2012, 17, 102–123. [Google Scholar] [CrossRef]
- Shi, M.; Wu, H.; Fan, X.; Jia, H.; Dong, T.; He, P.; Baqa, M.F.; Jiang, P. Trade-Offs and Synergies of Multiple Ecosystem Services for Different Land Use Scenarios in the Yili River Valley, China. Sustainability 2021, 13, 1577. [Google Scholar] [CrossRef]
- Guo, J.; Xu, H.; Zhang, G.; Yuan, K.; Ling, H. The Enhanced Management of Water Resources Improves Ecosystem Services in a Typical Arid Basin. Sustainability 2020, 12, 8802. [Google Scholar] [CrossRef]
- Rukundo, E.; Liu, S.; Dong, Y.; Rutebuka, E.; Asamoah, E.F.; Xu, J.; Wu, X. Spatio-temporal dynamics of critical ecosystem services in response to agricultural expansion in Rwanda, East Africa. Ecol. Indic. 2018, 89, 696–705. [Google Scholar] [CrossRef]
- Pan, J.; Wei, S.; Li, Z. Spatiotemporal pattern of trade-offs and synergistic relationships among multiple ecosystem services in an arid inland river basin in NW China. Ecol. Indic. 2020, 114, 106345. [Google Scholar] [CrossRef]
- Raffini, F.; Bertorelle, G.; Biello, R.; D’Urso, G.; Russo, D.; Bosso, L. From Nucleotides to Satellite Imagery: Approaches to Identify and Manage the Invasive Pathogen Xylella fastidiosa and Its Insect Vectors in Europe. Sustainability 2020, 11, 4508. [Google Scholar] [CrossRef]
- Cheng, J.; Bambrick, H.; Yakob, L.; Devine, G.; Frentiu, F.D.; Williams, G.; Li, Z.; Yang, W.; Hu, W. Extreme weather conditions and dengue outbreak in Guangdong, China: Spatial heterogeneity based on climate variability. Environ. Res. 2021, 196, 110900. [Google Scholar] [CrossRef] [PubMed]
- Ji, Z.; Xu, Y.; Wei, H. Identifying Dynamic Changes in Ecosystem Services Supply and Demand for Urban Sustainability: Insights from a Rapidly Urbanizing City in Central China. Sustainability 2020, 12, 3428. [Google Scholar] [CrossRef] [Green Version]
- Hoque, M.Z.; Cui, S.; Islam, I.; Xu, L.; Tang, J. Future Impact of Land Use/Land Cover Changes on Ecosystem Services in the Lower Meghna River Estuary, Bangladesh. Sustainability 2020, 12, 2112. [Google Scholar] [CrossRef] [Green Version]
- Wang, Z.; Cao, J. Assessing and Predicting the Impact of Multi-Scenario Land Use Changes on the Ecosystem Service Value: A Case Study in the Upstream of Xiong’an New Area, China. Sustainability 2021, 13, 704. [Google Scholar] [CrossRef]
- Babbar, D.; Areendran, G.; Sahana, M.; Sarma, K.; Raj, K.; Sivadas, A. Assessment and prediction of carbon sequestration using Markov chain and InVEST model in Sariska Tiger Reserve, India. J. Clean. Prod. 2021, 278, 123333. [Google Scholar] [CrossRef]
- Huang, J.; Tang, Z.; Liu, D.; He, J. Ecological response to urban development in a changing socio-economic and climate context: Policy implications for balancing regional development and habitat conservation. Land Use Pol. 2020, 97, 104772. [Google Scholar] [CrossRef]
- Gong, J.; Hu, Z.; Chen, W.; Liu, Y.; Wang, J. Urban expansion dynamics and modes in metropolitan Guangzhou, China. Land Use Pol. 2018, 72, 100–109. [Google Scholar] [CrossRef]
- Chaudhuri, G.; Clarke, K.C. Modeling an Indian megalopolis—A case study on adapting SLEUTH urban growth model. Comput. Environ. Urban Syst. 2019, 77, 101358. [Google Scholar] [CrossRef] [Green Version]
- Li, B.; Liu, Y.; Zhang, B.; Huang, J.; Guo, X. Multi-scenario land use change simulation in Caidian using CLUE-S based on Tietenberg Modeling. Resour. Sci. 2017, 39, 1739–1752. (In Chinese) [Google Scholar]
- Li, L.; Wu, D.; Wang, F.; Liu, Y.; Liu, Y.; Qian, Y. Prediction and tradeoff analysis of ecosystem service value in the rapidly urbanizing Foshan City of China: A case study. Acta Ecol. Sin. 2020, 40, 9023–9036. (In Chinese) [Google Scholar]
- Wang, X.; Ma, B.; Li, D.; Chen, K.; Yao, H. Multi-scenario simulation and prediction of ecological space in Hubei province based on FLUS mode. J. Nat. Resour. 2020, 35, 230–242. (In Chinese) [Google Scholar]
- Wang, C.; Liu, C.; Wu, Y.; Liu, Y. Spatial pattern, tradeoffs and synergies of ecosystem services in loess hilly region: A case study in Yuzhong County. Chin. J. Ecol. 2019, 38, 521–531. (In Chinese) [Google Scholar]
- Yan, F.; Luo, Z.; Wu, J.; Qi, S.; Cao, L.; Cai, Z.; Chen, Y. Spatiotemporal patterns of the trade-off and synergy relationship among ecosystem services in Poyang Lake Region, China. Chin. J. Appl. Ecol. 2019, 30, 995–1004. (In Chinese) [Google Scholar]
- Din, J.U.; Nawaz, M.A.; Norma-Rashid, Y.; Ahmad, F.; Hussain, K.; Ali, H.; Adli, D.S.H. Ecosystem Services in a Snow Leopard Landscape: A Comparative Analysis of Two High-elevation National Parks in the Karakoram–Pamir. Mt. Res. Dev. 2020, 40, R11–R19. [Google Scholar] [CrossRef]
- Jing, M.; Jia, F.; Yao, Y. Land Use Ecosystem Service Value Evaluation and Correction in Regional Areas: A Case Study on Shaping Village in Hequ County of Shanxi. Ecol Econ. 2012, 28, 150–152. (In Chinese) [Google Scholar]
- Zhang, P.; Liu, Y.; Wang, P.; Li, S. Research on County Ecological Compensation Mechanism in the Process of Beijing-Tianjin-Hebei Integration: A Case Study of Dingxing County in Baoding City. J. Ecol. Rural Environ. 2019, 35, 747–755. (In Chinese) [Google Scholar]
- Lei, J.; Chen, Z.; Wu, T.; Li, X.; Yang, Q.; Chen, X. Spatial autocorrelation pattern analysis of land use and the value of ecosystem services in northeast Hainan island. Acta Ecol. Sin. 2019, 39, 2366–2377. (In Chinese) [Google Scholar]
- Wang, P.; Zhang, L.; Li, Y.; Jiao, L.; Wang, H.; Yan, J.; Lv, Y.; Fu, B. Spatio-temporal characteristics of the trade-off and synergy relationships among multiple ecosystem services in the Upper Reaches of Hanjiang River Basin. Acta Geogr. Sin. 2017, 72, 2064–2078. (In Chinese) [Google Scholar]


| Data Type | Data Content | Data Sources | Data Usage |
|---|---|---|---|
| Remote sensing data | Landsat-TM images in 1995, 2005 and 2015 (30 m × 30 m grid) | Geospatial Data Cloud Platform | Model basic input data |
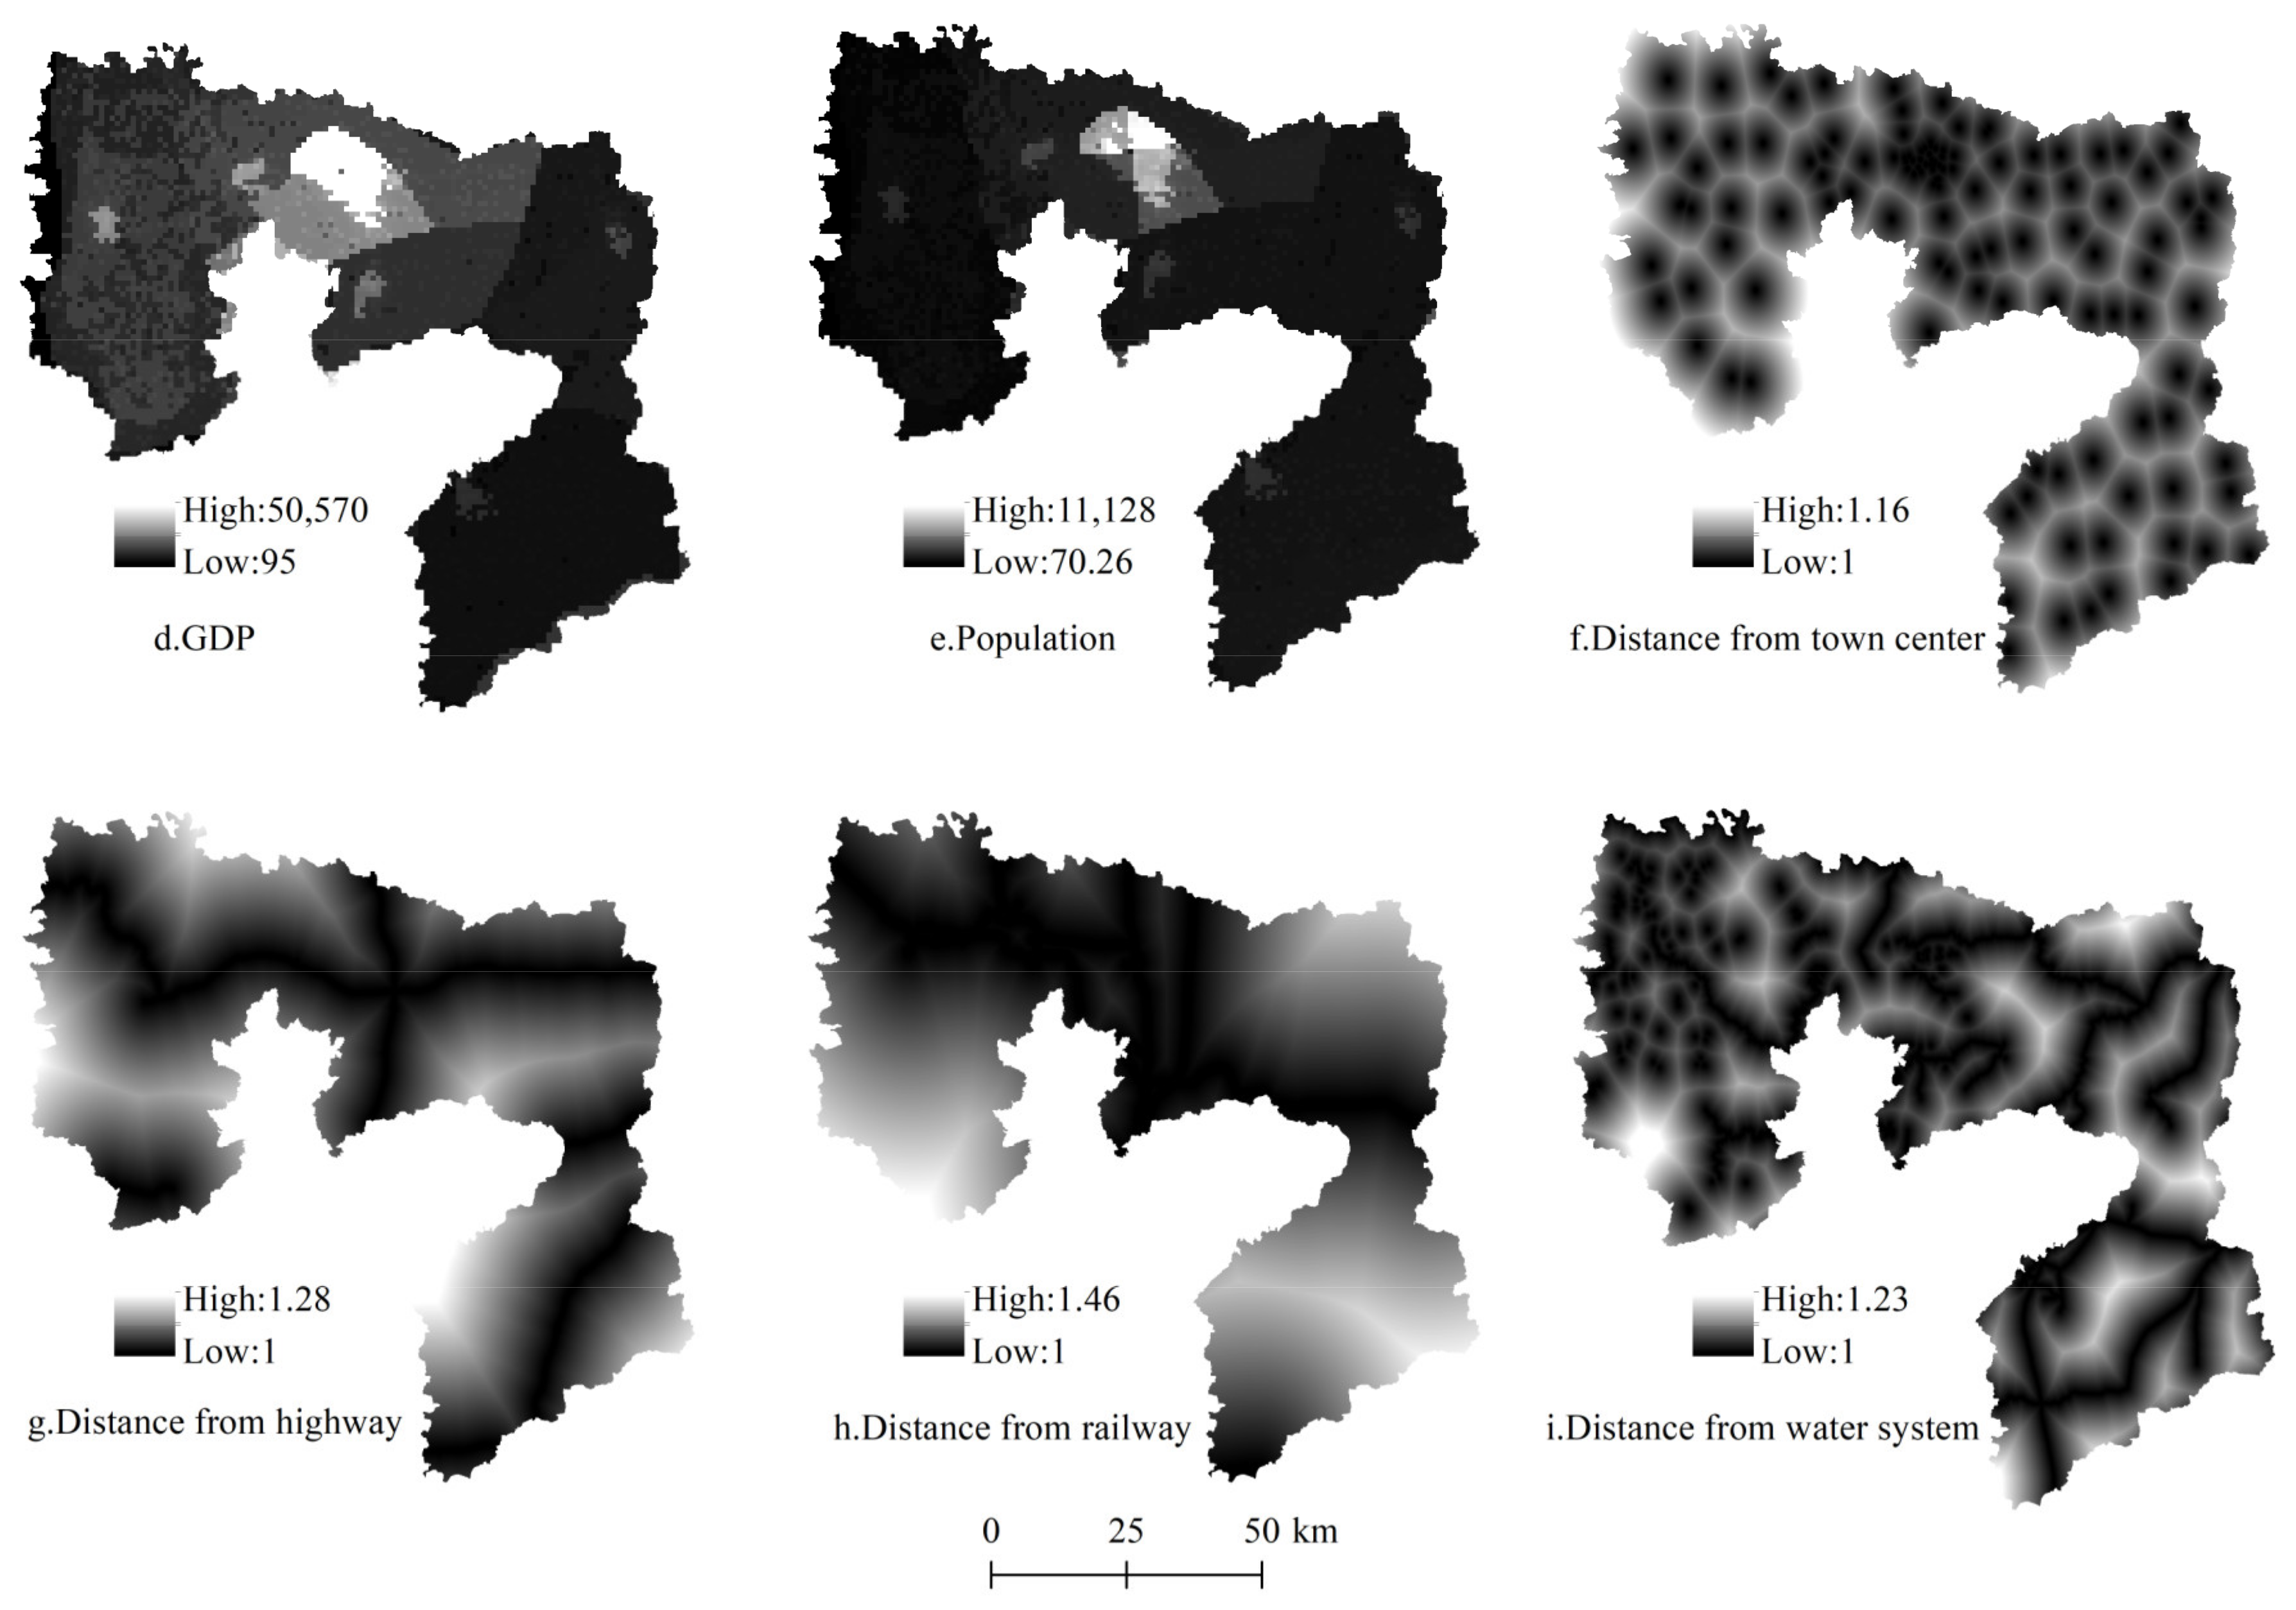
| Statistical data | Population data, food production, GDP, etc. |
Anyang Statistical Yearbook (1996, 2006 and 2016) | ESV (Ecosystem service value) calculation |
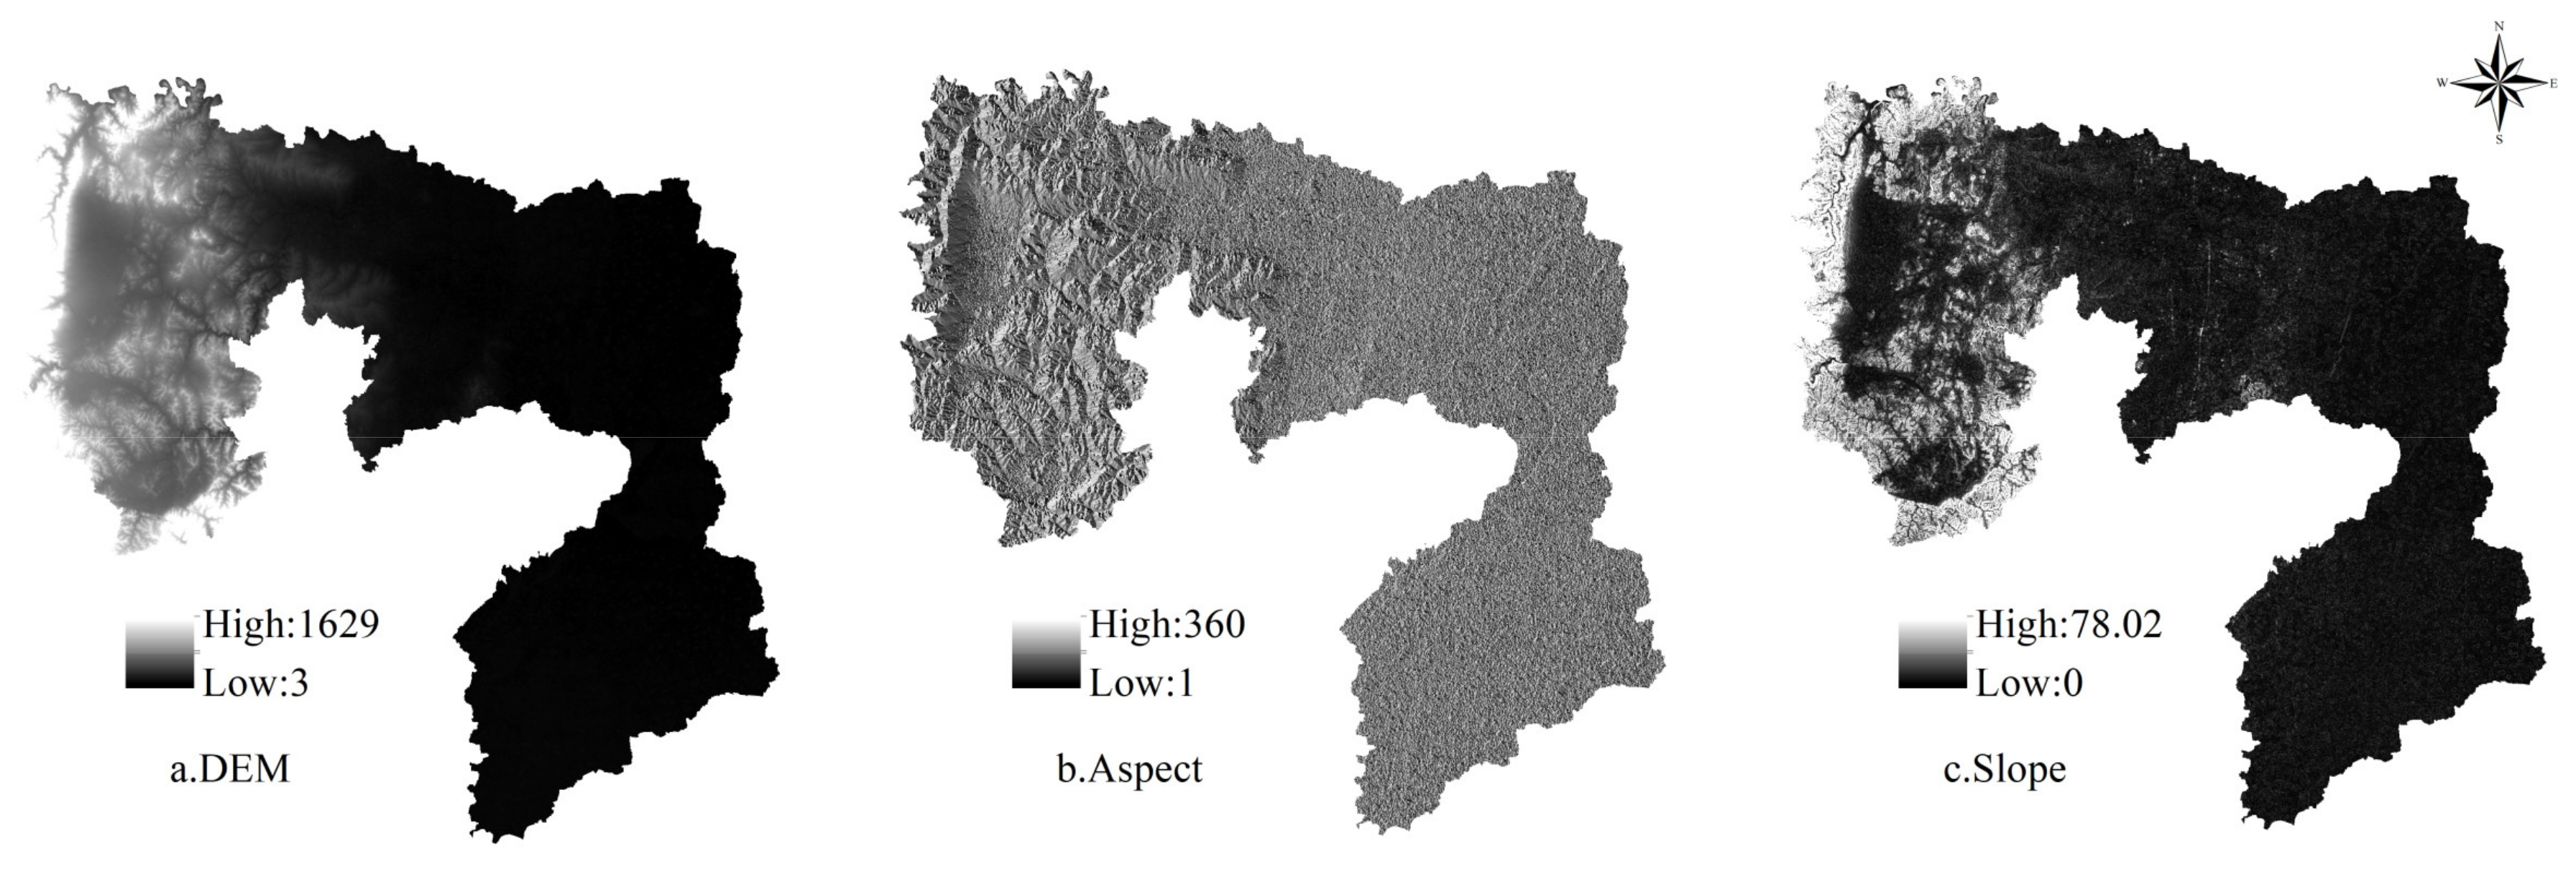
| Topographic data | Elevation (DEM) (30 m × 30 m grid) | Geospatial Data Cloud Platform | Natural terrain driving force factor |
| Traffic data | National highways, provincial highways, highways, etc. (vector) | AMAP (AutoNavi map) | Traffic location driving force factor |
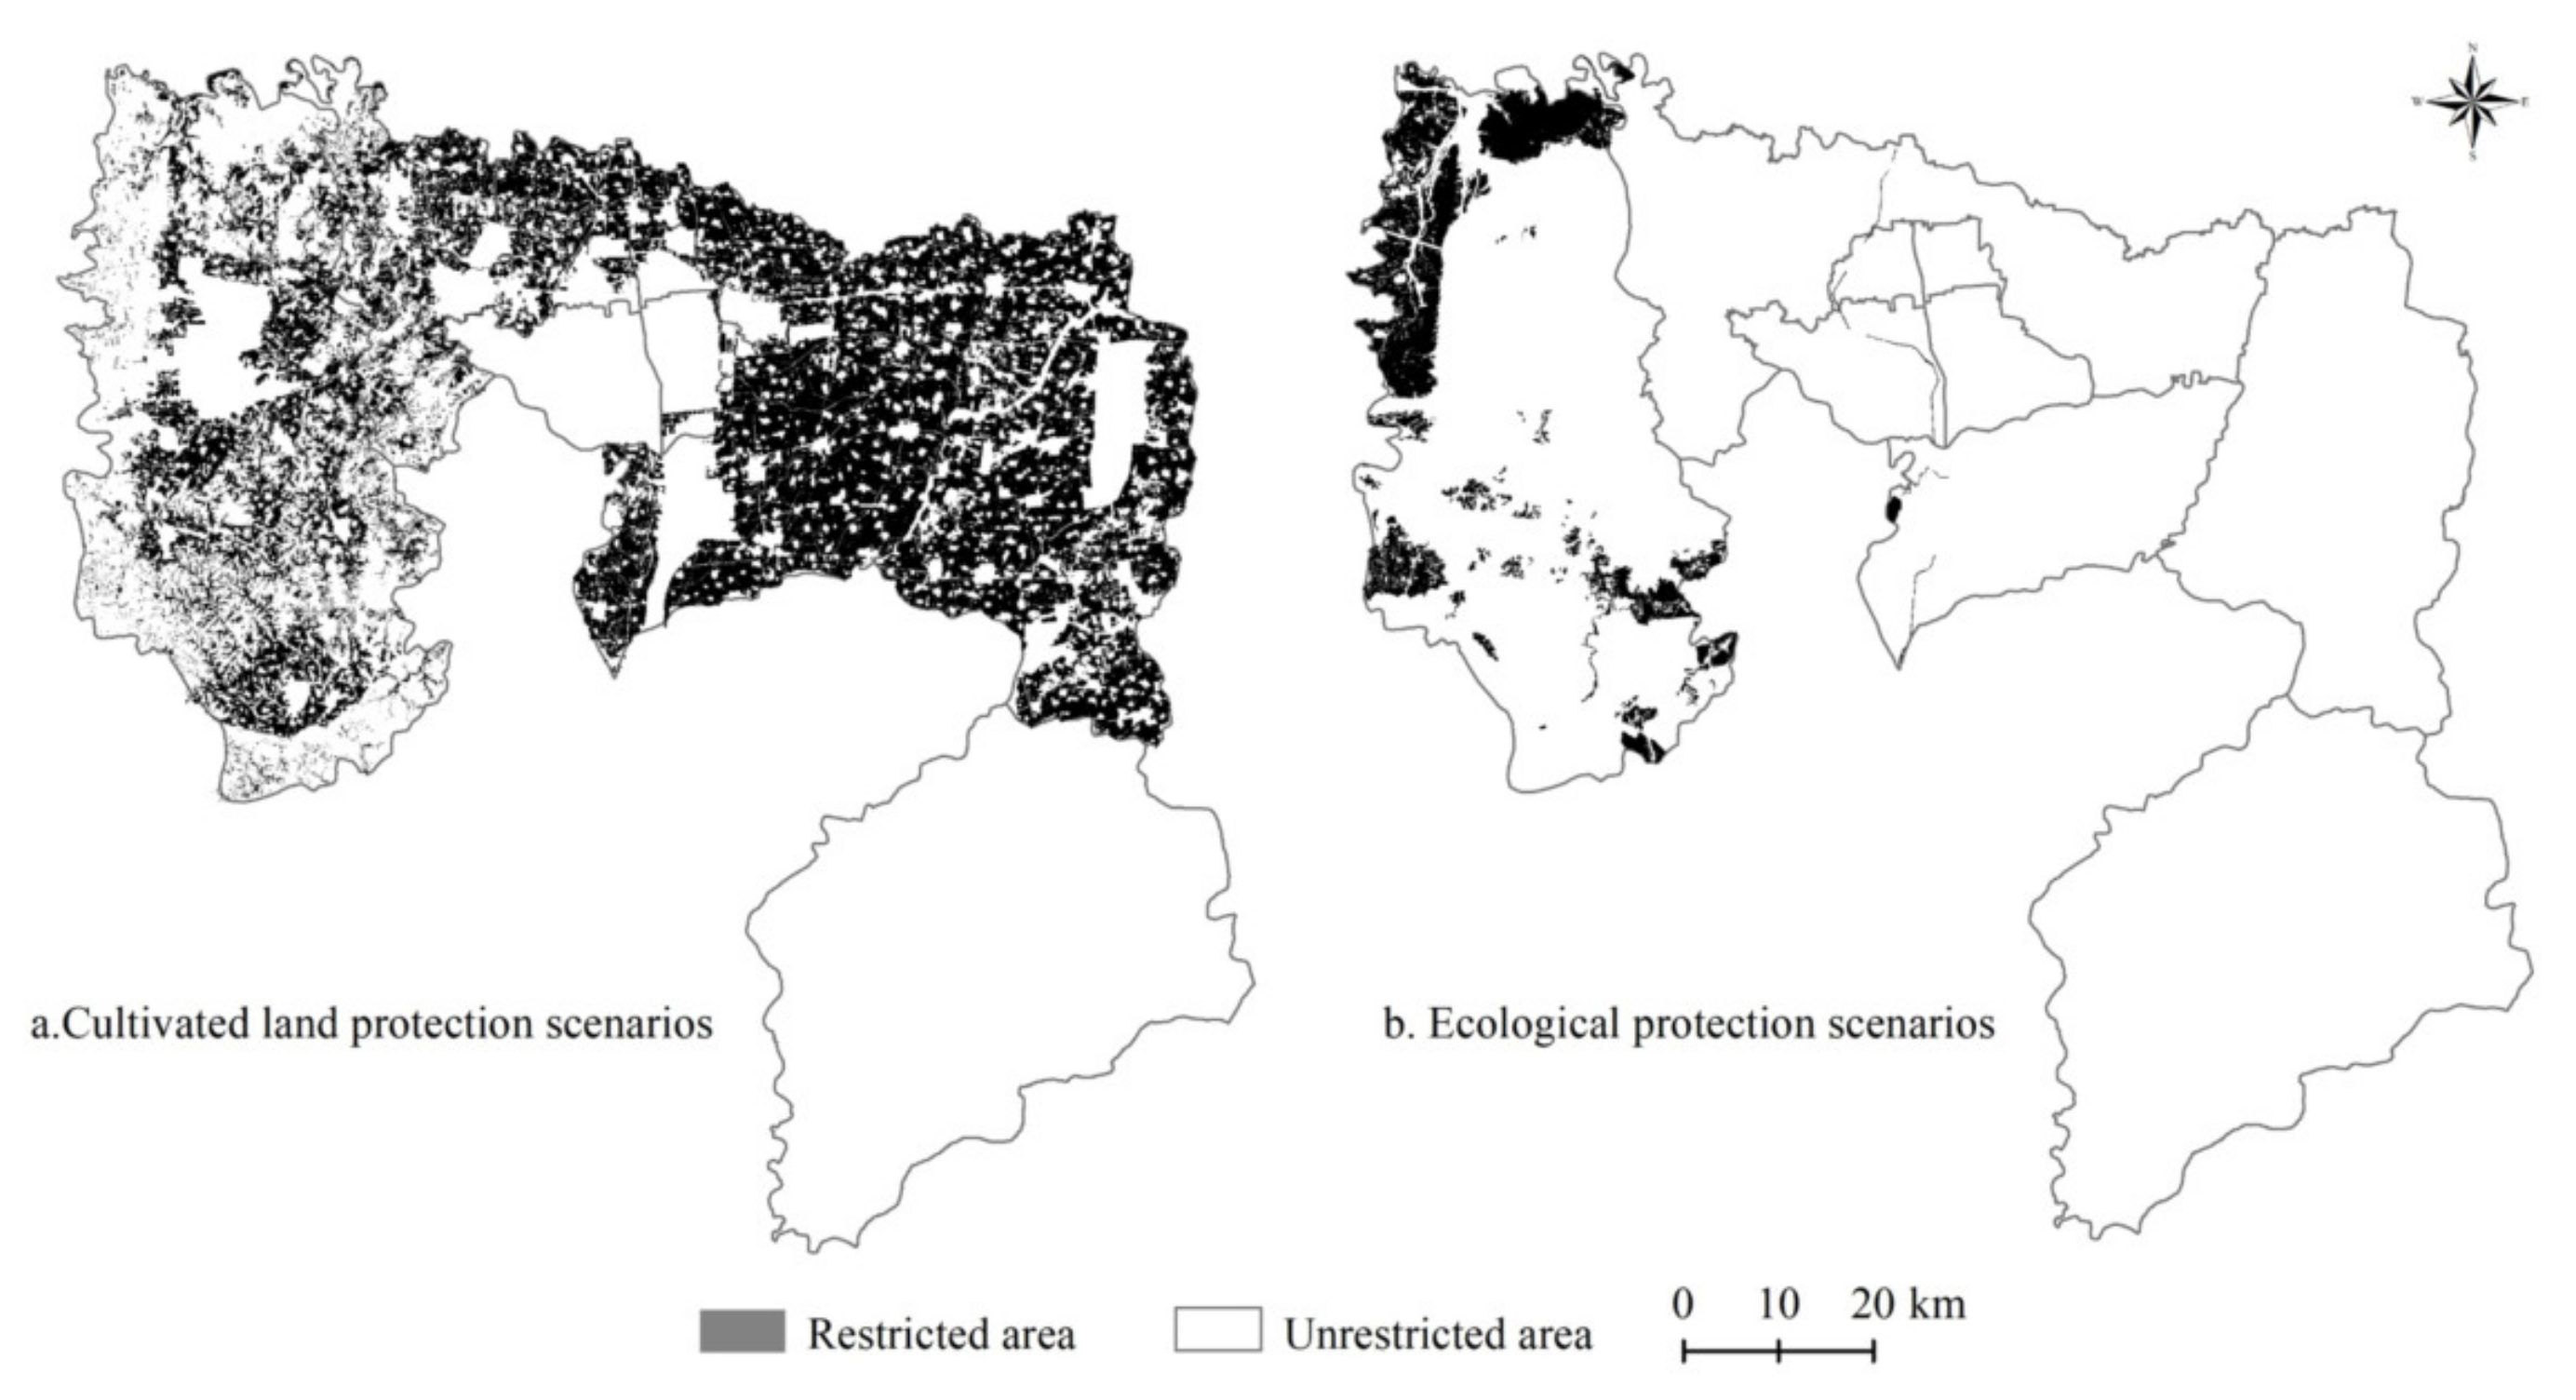
| Basic farmland data | Basic farmland database of Anyang (vector) | Anyang Natural Resources Bureau | Restricted conversion area |
| Planning data | Anyang Ecological Reserve (vector) | Anyang Natural Resources Bureau | Restricted conversion area |
| Crop type | Variety | Sown Area (hm2) | Grain Yield (10,000 tons) | Average Unit price (Yuan/t) |
|---|---|---|---|---|
| Cereals | Wheat | 308,968 | 5.84 | 2413 |
| Maize | 236,884 | 5.57 | 1771 | |
| Sorghum | 17,000 | 3.20 | 2400 | |
| Beans | Soybean | 5206 | 2.64 | 3529 |
| Miscellaneous beans | 464 | 1.44 | 3488 | |
| Potatoes | Sweet potatoes | 8127 | 6.59 | 2000 |
| Ecosystem Classification | Cultivated Land | Grassland | Woodland | Water | Built Land | Unused Land | |
|---|---|---|---|---|---|---|---|
| Provisioning services | Food production | 14.68 | 10.01 | 5.35 | 13.82 | 0.00 | 0.00 |
| Raw materials production | 6.91 | 9.59 | 12.26 | 3.97 | 0.00 | 0.00 | |
| Water resources supply | 0.35 | 3.37 | 6.39 | 143.19 | −268.66 | 0.00 | |
| Regulating services | Gas regulation | 11.57 | 26.08 | 40.59 | 13.3 | −45.6 | 0.35 |
| Climate regulation | 6.22 | 63.82 | 121.43 | 39.56 | 0.00 | 0.00 | |
| Environment purification | 1.73 | 18.05 | 34.37 | 95.87 | −46.35 | 1.73 | |
| Hydrology regulation | 46.64 | 32.65 | 60.63 | 1766.01 | 0.00 | 0.52 | |
| Supporting services | Soil maintenance | 17.79 | 33.6 | 49.4 | 16.06 | 0.00 | 0.35 |
| Maintaining nutrient circulation | 2.07 | 2.94 | 3.80 | 1.21 | 0.00 | 0.00 | |
| Biological diversity | 2.25 | 23.58 | 44.91 | 44.05 | 0.00 | 0.35 | |
| Cultural services | Aesthetic landscape | 1.04 | 10.36 | 19.69 | 32.65 | 0.00 | 0.17 |
| Category | Pearson Coefficient | Moran’s I | ||||
|---|---|---|---|---|---|---|
| Natural Evolution | Cultivated Land Protection | Ecological Protection | Natural Evolution | Cultivated Land Protection | Ecological Protection | |
| Rps | 0.552 | 0.306 | 0.519 | 0.354 | 0.232 | 0.346 |
| Rpc | 0.511 | 0.441 | 0.490 | 0.358 | 0.289 | 0.365 |
| Rrs | 0.397 | 0.334 | 0.398 | 0.303 | 0.235 | 0.322 |
| Rrc | 0.748 | 0.645 | 0.710 | 0.540 | 0.499 | 0.533 |
| Rsc | 0.826 | 0.662 | 0.813 | 0.580 | 0.526 | 0.590 |
| Rpr | 0.963 | 0.963 | 0.963 | 0.712 | 0.705 | 0.729 |
Publisher’s Note: MDPI stays neutral with regard to jurisdictional claims in published maps and institutional affiliations. |
© 2021 by the authors. Licensee MDPI, Basel, Switzerland. This article is an open access article distributed under the terms and conditions of the Creative Commons Attribution (CC BY) license (http://creativecommons.org/licenses/by/4.0/).
Share and Cite
Ji, Z.; Wei, H.; Xue, D.; Liu, M.; Cai, E.; Chen, W.; Feng, X.; Li, J.; Lu, J.; Guo, Y. Trade-Off and Projecting Effects of Land Use Change on Ecosystem Services under Different Policies Scenarios: A Case Study in Central China. Int. J. Environ. Res. Public Health 2021, 18, 3552. https://0-doi-org.brum.beds.ac.uk/10.3390/ijerph18073552
Ji Z, Wei H, Xue D, Liu M, Cai E, Chen W, Feng X, Li J, Lu J, Guo Y. Trade-Off and Projecting Effects of Land Use Change on Ecosystem Services under Different Policies Scenarios: A Case Study in Central China. International Journal of Environmental Research and Public Health. 2021; 18(7):3552. https://0-doi-org.brum.beds.ac.uk/10.3390/ijerph18073552
Chicago/Turabian StyleJi, Zhengxin, Hejie Wei, Dong Xue, Mengxue Liu, Enxiang Cai, Weiqiang Chen, Xinwei Feng, Jiwei Li, Jie Lu, and Yulong Guo. 2021. "Trade-Off and Projecting Effects of Land Use Change on Ecosystem Services under Different Policies Scenarios: A Case Study in Central China" International Journal of Environmental Research and Public Health 18, no. 7: 3552. https://0-doi-org.brum.beds.ac.uk/10.3390/ijerph18073552