
An Equity Evaluation on Accessibility of Primary Healthcare Facilities by Using V2SFCA Method: Taking Fukuoka City, Japan, as a Case Study

1
Graduate School of Human-Environment Studies, Kyushu University, 744 Motooka Nishi-ku, Fukuoka 819-0395, Japan
2
Faculty of Human-Environment Studies, Kyushu University, 744 Motooka Nishi-ku, Fukuoka 819-0395, Japan
*
Author to whom correspondence should be addressed.
Land 2022, 11(5), 640; https://0-doi-org.brum.beds.ac.uk/10.3390/land11050640
Submission received: 28 March 2022
/
Revised: 21 April 2022
/
Accepted: 24 April 2022
/
Published: 26 April 2022
(This article belongs to the Special Issue Efficient Land Use and Sustainable Urban Development)
Abstract
:The primary healthcare facilities are among the most basic needs of the residents, huge in quantity and widespread. Their distributions are directly related to people’s health, which affects the sustainable development of cities. The accessibility calculation of primary level healthcare facilities and the equity evaluation of accessibility from the perspective of medical service category and urban population is very important for the decision-making of layout and configuration but has been ignored for a long time. This study took the primary healthcare facilities of Fukuoka city in Japan as research objects; it first used the variable two-step floating catchment area (V2SFCA) method to calculate the healthcare catchment areas (HCAs) of medical service providers and the population catchment area (PCAs) of medical demand locations, and then obtained the accessibility to primary healthcare facilities. Finally, the spatial disparities of accessibility were evaluated from three aspects: overall space distribution by using Global and Local Moran’s I, service quality, and the population to be served. The results showed that HCAs were from 500 m to 6400 m, PCAs ranged from 500 m to 3000 m, the use of variable catchments can improve the accuracy of accessibility assessment results; the accessibility of primary healthcare facilities was clustered and had significant spatial differences, which were high in urban center and low in suburban area; the obvious differences in the accessibility distribution characteristics of clinics in differential diagnosis and treatment departments led to different degrees of unsaturation in the types of medical services obtained by residents; although the elderly’s demand for basic medical care was many times higher than that of other age groups, the accessibility in high-demand areas was generally low, and the situation in severely high-demand areas was more serious. This work puts forward a multi-dimensional realistic evaluation system for equality accessibility of primary healthcare facilities, providing the data support for the medical resources and facilities’ allocation and the intensive land use.
1. Introduction
Current and future public health are related to the sustainable development of cities. The governments guide and intervene in public health through comprehensive land planning, policy guidance, and other measures [1]. The impact of land use planning on health is reflected in many aspects. For instance, through the intervention of land use, people are encouraged to change their travel mode to waling or other low emissions public traffic, which indirectly affects the overall health of the population [2,3]. Improve the quality of life and well-being through the spatial layout of parks, cultural venues, sports facilities, and other leisure activities [4,5,6]. The most direct intervention is reflected in the layout and allocation of health-related facilities, especially medical facilities [7]. The reasonable distribution of limited medical resources is the greatest protection of public health [8]. Medical facilities are important social resources that are directly related to the health level of the population. At present, the research mainly focused on the following aspects: (1) The efficiency of the medical service can be divided into technical efficiency and management efficiency. The former is related to the utilization of medical resources [9], while the latter affects the quality of medical services and patient satisfaction [10,11]. (2) The reasons for the gap in residents’ access to medical services are not limited to the factors at the individual level, such as race, income, and education level [12,13], as well as the impact of socio-economic indicators and public policies in a larger geographical area [14]. (3) Discussion on the spatial distribution of medical facilities [15,16], as well as the distribution of the specific indicators (such as hospital beds) in medical facilities [17,18]. (4) Research on the accessibility of medical facilities within a certain region, including the comparison of the accessibility of medical facilities at different levels and different geographical regions [19,20,21], the accessibility of emergency medical facilities [22]. Access to medical facilities is the key to medical success. The equity of access to health care is not only the central objective for the medical system and the medical resources allocation [23], but also the embodiment of the principle of justice in medical ethics [24]. For residents, the accessibility of medical facilities reflects the adequacy and difficulty of obtaining medical services. Therefore, a realistic description of the accessibility and equity evaluation of medical facilities is the key for planners to make facility layout and configuration decisions. At present, the research objects of accessibility of medical facilities are mostly hospitals [25,26], and the evaluation of accessibility mostly expounds on its differences and imbalance [15,27] from the perspective of space. There is a lack of multi-dimensional evaluation of the accessibility and equity of primary healthcare facilities at the clinic level.
The necessity for research on primary medical facilities is also related to Japan’s medical system. Japan implements a hierarchical medical system and sets up three-level medical areas with clear levels and functions to promote the appropriate allocation of medical resources. The highest level is the tertiary medical area, which mainly provides high-precision and rare disease medical and hospitalization services. The secondary medical area mainly provides inpatient services for several municipalities. Ministry of Health, Labour and Welfare (MHLW) showed that there were 52 tertiary medical areas and 349 secondary medical areas in 2010 [28]. The primary medical areas mainly provide basic medical services for residents in the city. The providers of medical services in the first two medical areas are mainly special functioning hospitals and regional medical care support hospitals. Their clients are not limited to the local and often accept the patients from the other medical areas [29]. Significantly, different from the phenomenon that large hospitals in many countries open directly to outpatient visits, patients in Japan need a referral letter from primary medical institutions to free access to advanced-medical hospitals. Therefore, for residents, the medical facilities where they can see doctors directly are the clinics and some general hospitals in the primary medical area [30]. According to the survey on medical facilities by the MHLW in 2019, the number of clinics far exceeded that of general hospitals, about 14 times [31]. Meanwhile, clinics are more widely distributed in commercial, residential, and many other areas of the city. Because of the clinics’ large number and wide distribution, they have become the main carrier of primary medical services. The services of the primary healthcare facilities are seen as one of the most important contributors to public health. It is necessary to do research on the study of the spatial distribution, service scope, accessibility, and equity evaluation of clinics.
Japan is suffering from a serious aging population, and this phenomenon continues to deteriorate. The white paper on the aging society of the Cabinet Office predicts that the population aging rate will reach 37.7% in 2050 [32]. According to the comprehensive survey of living conditions by MHLW in 2019, 433 of every thousand elderly people (over 65 years old) have subjective symptoms and need health management and treatment. About 20% to 30% of working-age people (15–54 years old) also have health problems [33]. Basic medical services have become a very important part of daily needs. The accessibility and equity of primary medical facilities are related to the normal quality of life. While facing the challenge of population aging, Japan is also confronted with the problem of population reduction. Aware of the seriousness of urban recession caused by population reduction, the government implemented an urban planning policy named Location Normalization Plan in 2014 to form compact urban structures at a national level [34]. This plan introduces urban functional facilities such as medical facilities, including clinics in the urban function-induced zone to serve residents and attract a new population into the residence-induced zone [35], so as to achieve the purpose of a compact city after long-term development. The calculation and evaluation of the service scope and accessibility of facilities are also conducive to providing a basis for designating residence-induced zones. In general, the calculation and evaluation of the accessibility of primary healthcare facilities can help to deal with the increase in medical demand caused by population aging. On the other hand, it can also provide a basis for the designation of function-induced zones so as to achieve the goals of ensuring residents’ health and promoting urban renewal and development. In addition, according to the survey by the department of economic and social affairs of the United Nations, most countries in the world are or will soon enter an aging society [36]. The research on primary medical facilities in a country with severe population aging will also provide data and experience support when other countries and regions deal with the same problems in the future. Therefore, this study plan to take the primary healthcare facilities at the clinic level of a Japanese city as research objects, explore the relationship between population and medical resources and provide methods and references for the allocation of medical facilities. Specifically, this work aims to achieve the following three purposes: (1) Quantify the service scope of primary healthcare facilities, and the search scope of residents’ access to medical care (2) Put forward the quantitative method and results of accessibility of primary healthcare facilities based on the interaction between providers and demanders, the core of the medical relationship. (3) Make a multi-dimensional evaluation of the equity of accessibility from the perspective of the characteristics of specific diagnosis and treatment departments of Japanese clinics and the high medical demand brought by the aging population, combined with the spatial distribution.
In order to address these issues, this work takes the Fukuoka city as a case study area, the clinics as the research objects, and the smallest census tracks as the research units and is organized into the following chapters. First, the literature review has combed the main research related to accessibility. Second, the research methods chapter and study area chapter elaborated the model for calculating and evaluating the accessibility and the basic information of the database. Then, in the results chapter, the experiment results for the HCAs, PCAs, and accessibility scores based on the V2SFCA method are presented. The equity evaluation of the accessibility to medical facilities from three aspects: spatial distribution, the quantity and quality of medical services, and high-demand groups. Finally, the discussion chapter and conclusion chapter summarizes the main findings, the contributions, and limitations.
2. Literature Review
There are many explanations for the concept of accessibility based on different use scenarios and application fields [37,38]. The concept of accessibility has been long used in the research of transportation and related planning, referring to the difficulty of reaching an activity location from a certain place through some modes of transportation [39,40]. For the public facilities, including medical facilities, the accessibility mainly focuses on the interaction between the demanders and service providers based on spatial distance [41]. The popular methods for evaluating the spatial accessibility of the public facilities are provider-to-population ratios, distance to nearest provider, the average distance to a set of providers, and gravitational models of provider influence [42,43,44,45]. These methods do not or only consider distance, do not consider the scale of supply and demand points, or do not set an effective search radius. The two-step floating catchment area (2SFCA) method is a recent development and has formed a series of models [46]. Compared with the above methods, the 2SFCA method evaluates the access to medical services in terms of the scale of the provisions and needs as well as the travel time between the service site to the demand location [47,48].
There are three main improvements in the 2SFCA methods. The first is about the cost between the service and demand, including the consideration of attenuation distance [49] and the calculation of the distance under multiple travel modes [50]. When calculating the distance, usually refer to walking distance. The walkability index [51,52] proposed based on the consideration of physical health and sustainable spatial development can help to further measure the walking distance. Mcgrail (2012) has evaluated whether and what the distance–decay function is used when using the 2SFCA method to calculate the accessibility of medical services for five different population size groupings, metropolitan, large rural, medium rural, small rural, and very small rural. The results show that the application of the distance–decay function has a great impact on metropolitan [49]. The second is about the search radius, such as using fixed, variable and dynamic catchment areas [53]. The third is the quantification of supply and demand considering the object selection probability, such as using the Huff model [54].
At present, the main methods used in the analysis of the equity and equilibrium accessibility are the Lorenz curve and Gini coefficient [20], Theil index [15], linear regression and spatial regression [55], and spatial statistical analysis methods such as spatial autocorrelation [15]. The difference in the accessibility of different regions can be reflected by comparing the values of the coefficient and index. Furthermore, the results of accessibility and spatial distribution can be more intuitively displayed through map visualization and classification [56]. Spatial analysis such as spatial autocorrelation can represent the spatial relationship between accessibility units.
3. Research Methods
3.1. Generalized 2SFCA Model
The generalized 2SFCA method can be divided into two steps. The first step is to search all demand locations within a certain catchment for each service site and calculate the supply-demand ratio; the second step is to search for the service supplies within a certain catchment for each demand location to compute the accessibility. In this study, the full-time doctors in clinics provide the service. For demands, we used the centroid of the urban built-up land in the chome to represent the population location. As a community-level medical facility, primary healthcare mainly serves the surrounding residents. The survey of the housing and living environments for the elderly by the Cabinet Office in 2018 showed that clinics were the main destinations for the elderly [57]. Walking for 10 min is a reasonable and ideal distance for the elderly who need medical treatment and health care. Therefore, this study took 500 m as the initial travel time and used the 2SFCA method to evaluate the facilities’ supply and demand and accessibility.
Step1: For each clinic location j, search all population locations k that are within an initial travel time d0 (d0 = 500 m) of the clinic location j, to compute the supply-to-demand ratio, :
where is the number of full-time doctors in the clinic j.
Step2: For each population location i, search all clinic locations j that are within the ideal catchment d0 (d0 = 500 m) of the population location i. To sum up, the supply-to-demand ratio as the accessibility score, :
3.2. V2SFCA Model Introduces the Distance–Decay Functions
There are differences in the distribution of the primary healthcare facilities and the residents in Fukuoka city. In order to overcome the problems the clinics cannot form an effective supply scale due to the dispersion of the demand points, and the residents cannot be satisfied the basic demand caused by the dispersion of the supply points under a single travel time. This study used the V2SFCA model to calculate the reasonable travel times and reevaluated the accessibility of the primary health facilities in Fukuoka. Based on the principle of health equity, each clinic has a theoretical population threshold that needs to provide services. Generally, the population threshold is the average value of the population covered by the initial catchments [53], which is 9934 in this study. We first screened out the facilities with the population in initial travel time (d0) below the threshold. Then we increased the travel time gradually to meet the condition. Similarly, in order to obtain equal access opportunity to medical services, residents of each population location need to pay different distance costs to search for medical facilities. The population locations have the threshold value of the medical services provided by doctors. In this study, we used the value of all clinics’ full-time doctors to the population as the threshold, which was 1.238 (one doctor per 807 people). We still increased the search radius to make the medical services available to population settlements reach this threshold.
When allocating medical resources, it is hard to consider the differences between doctors, so it is difficult to estimate their impacts on residents’ choice of whether to go to this clinic. We believed that each doctor was homogeneous and had the same possibility of being selected by residents. The opportunity of acquiring healthcare services for the residents is induced by space. The factor that can affect the residents’ choice of whether to go to this clinic is the time cost. The farther the distance, the less likely the clinic is to be selected by residents. Therefore, for the search process beyond the initial travel time, we take the distance decay into consideration. In summary, this study used the V2SFCA model introduced the distance–decay. The models and their specific operation steps are as follows:
Step1: By increasing the travel time by a small increment Δd (Δd =) and repeating this process until the residents covered by reached the population threshold, this catchment (dh) are the healthcare catchment areas (HCAs) of the clinic. is the supply-to-demand ratio using the variable catchments HCAs.
where f is the distance–decay function, introduce the Gaussian function(g).
Step2: By changing the travel time by a small increment Δd (Δd =) until the number of doctor–population in the catchment reaches the threshold value, the obtained range is the population catchment area (PCAs), the actual search catchment (c) of medical services for residents. is the accessibility score using variable catchments:
3.3. Spatial Autocorrelation
Spatial autocorrelation consists of the global spatial autocorrelation and the local spatial autocorrelation. The former can be used to describe the overall distribution of accessibility in the whole region and reveal its spatial characteristics: aggregation, dispersion, and randomness. This paper applies the Global Moran’s I index, which is widely used to describe global spatial autocorrelation. Global Moran’s I index value is often distributed in [−1, 1]. On the premise of rejecting the null hypothesis, the index greater than 0 indicates a positive spatial association, and the greater the value, the more the accessibility is clustered in space; on the contrary, if the index is less than 0, it indicates a negative spatial association, and the greater the value, the more the accessibility is dispersed; when the index is 0, the accessibility is randomly distributed in space. The calculation formula of Global Moran’s I index is as follows [58]:
where and are the accessibility value at population locations i and j. is the spatial weight matrix, representing the spatial relationship between population locations. is the sum of all spatial weight matrixes.
The Local Moran’s I index is generally used to measure the local spatial autocorrelation and reveal some local features. We use it to identify the spatial clusters or spatial outliers for the accessibility locations. The calculation can be described as follows [59]:
where is the variance of accessibility .
3.4. Research Process
Firstly, the study evaluated the supply-to-demand ratio and the accessibility within the fixed catchment, which is the scope of initial travel time. Then we used the 2SFCA method introduced the distance–decay function to calculate the HCAs and the PCAs for the clinics and population locations that could not reach the thresholds, respectively. The specific method was increasing 1, 2… n small increments (100 m) gradually on the basis of the initial travel time distance until the resident population and the ratio of doctors to residents in these two kinds of new travel time areas reached the preset threshold separately. The catchment areas corresponding to the newly obtained travel time distances were HCAs and PCAs. Finally, we evaluated the spatial inequity of the accessibility calculated by the V2SFCA model using variable catchments. Specifically, we used the Global Moran’s I index and the Local Moran’s I index to describe the spatial autocorrelation of the accessibility in the whole city and among different population locations. Based on the inequity of accessibility from the perspective of space, we evaluated the accessibility to different types of clinics and the accessibility for high-demand populations. These steps were realized by ArcGIS Pro software.
4. Study Area
In order to study the allocation of primary medical facilities in cities, this paper takes Fukuoka city, Japan, as the study area. Fukuoka city is the largest city as well as the economic, cultural, and transportation center on Kyushu, which is the third-largest island and located in the southernmost part of Japan. Fukuoka is not only the capital of Fukuoka Prefecture but also one of the 20 Designated Cities of Japan, which has the right of local autonomy. There are Higashi-Ku, Hakata-Ku, Chūō-Ku, Sawara-Ku, Jōnan-Ku, Minami-Ku, and Nishi-Ku, seven administrative districts in Fukuoka city. The study area mainly refers to the mainland of the city, excluding the islands (Figure 1). Population Census 2020 showed that the total population in Fukuoka was 1.61 million. Compared with 2015, the population of Fukuoka city has finished a growth of 4.8%. Fukuoka has a large population, ranking fifth among the 20 Designated Cities with a population ranging from 0.69 million (Shizuoka city) to 3.77 million (Yokohama city). The elderly population (over 65 years old) in Fukuoka City accounted for 22.1% of the total population in 2020, an increase of 1.4% over 2015. Fukuoka had entered the super-aged society. It is worth noting that the growth rate of the elderly in Fukuoka is the highest among the Designated Cities. Similar to other cities in Japan, the proportion of the elderly in Fukuoka continues to increase. The city faces the problem of population aging.
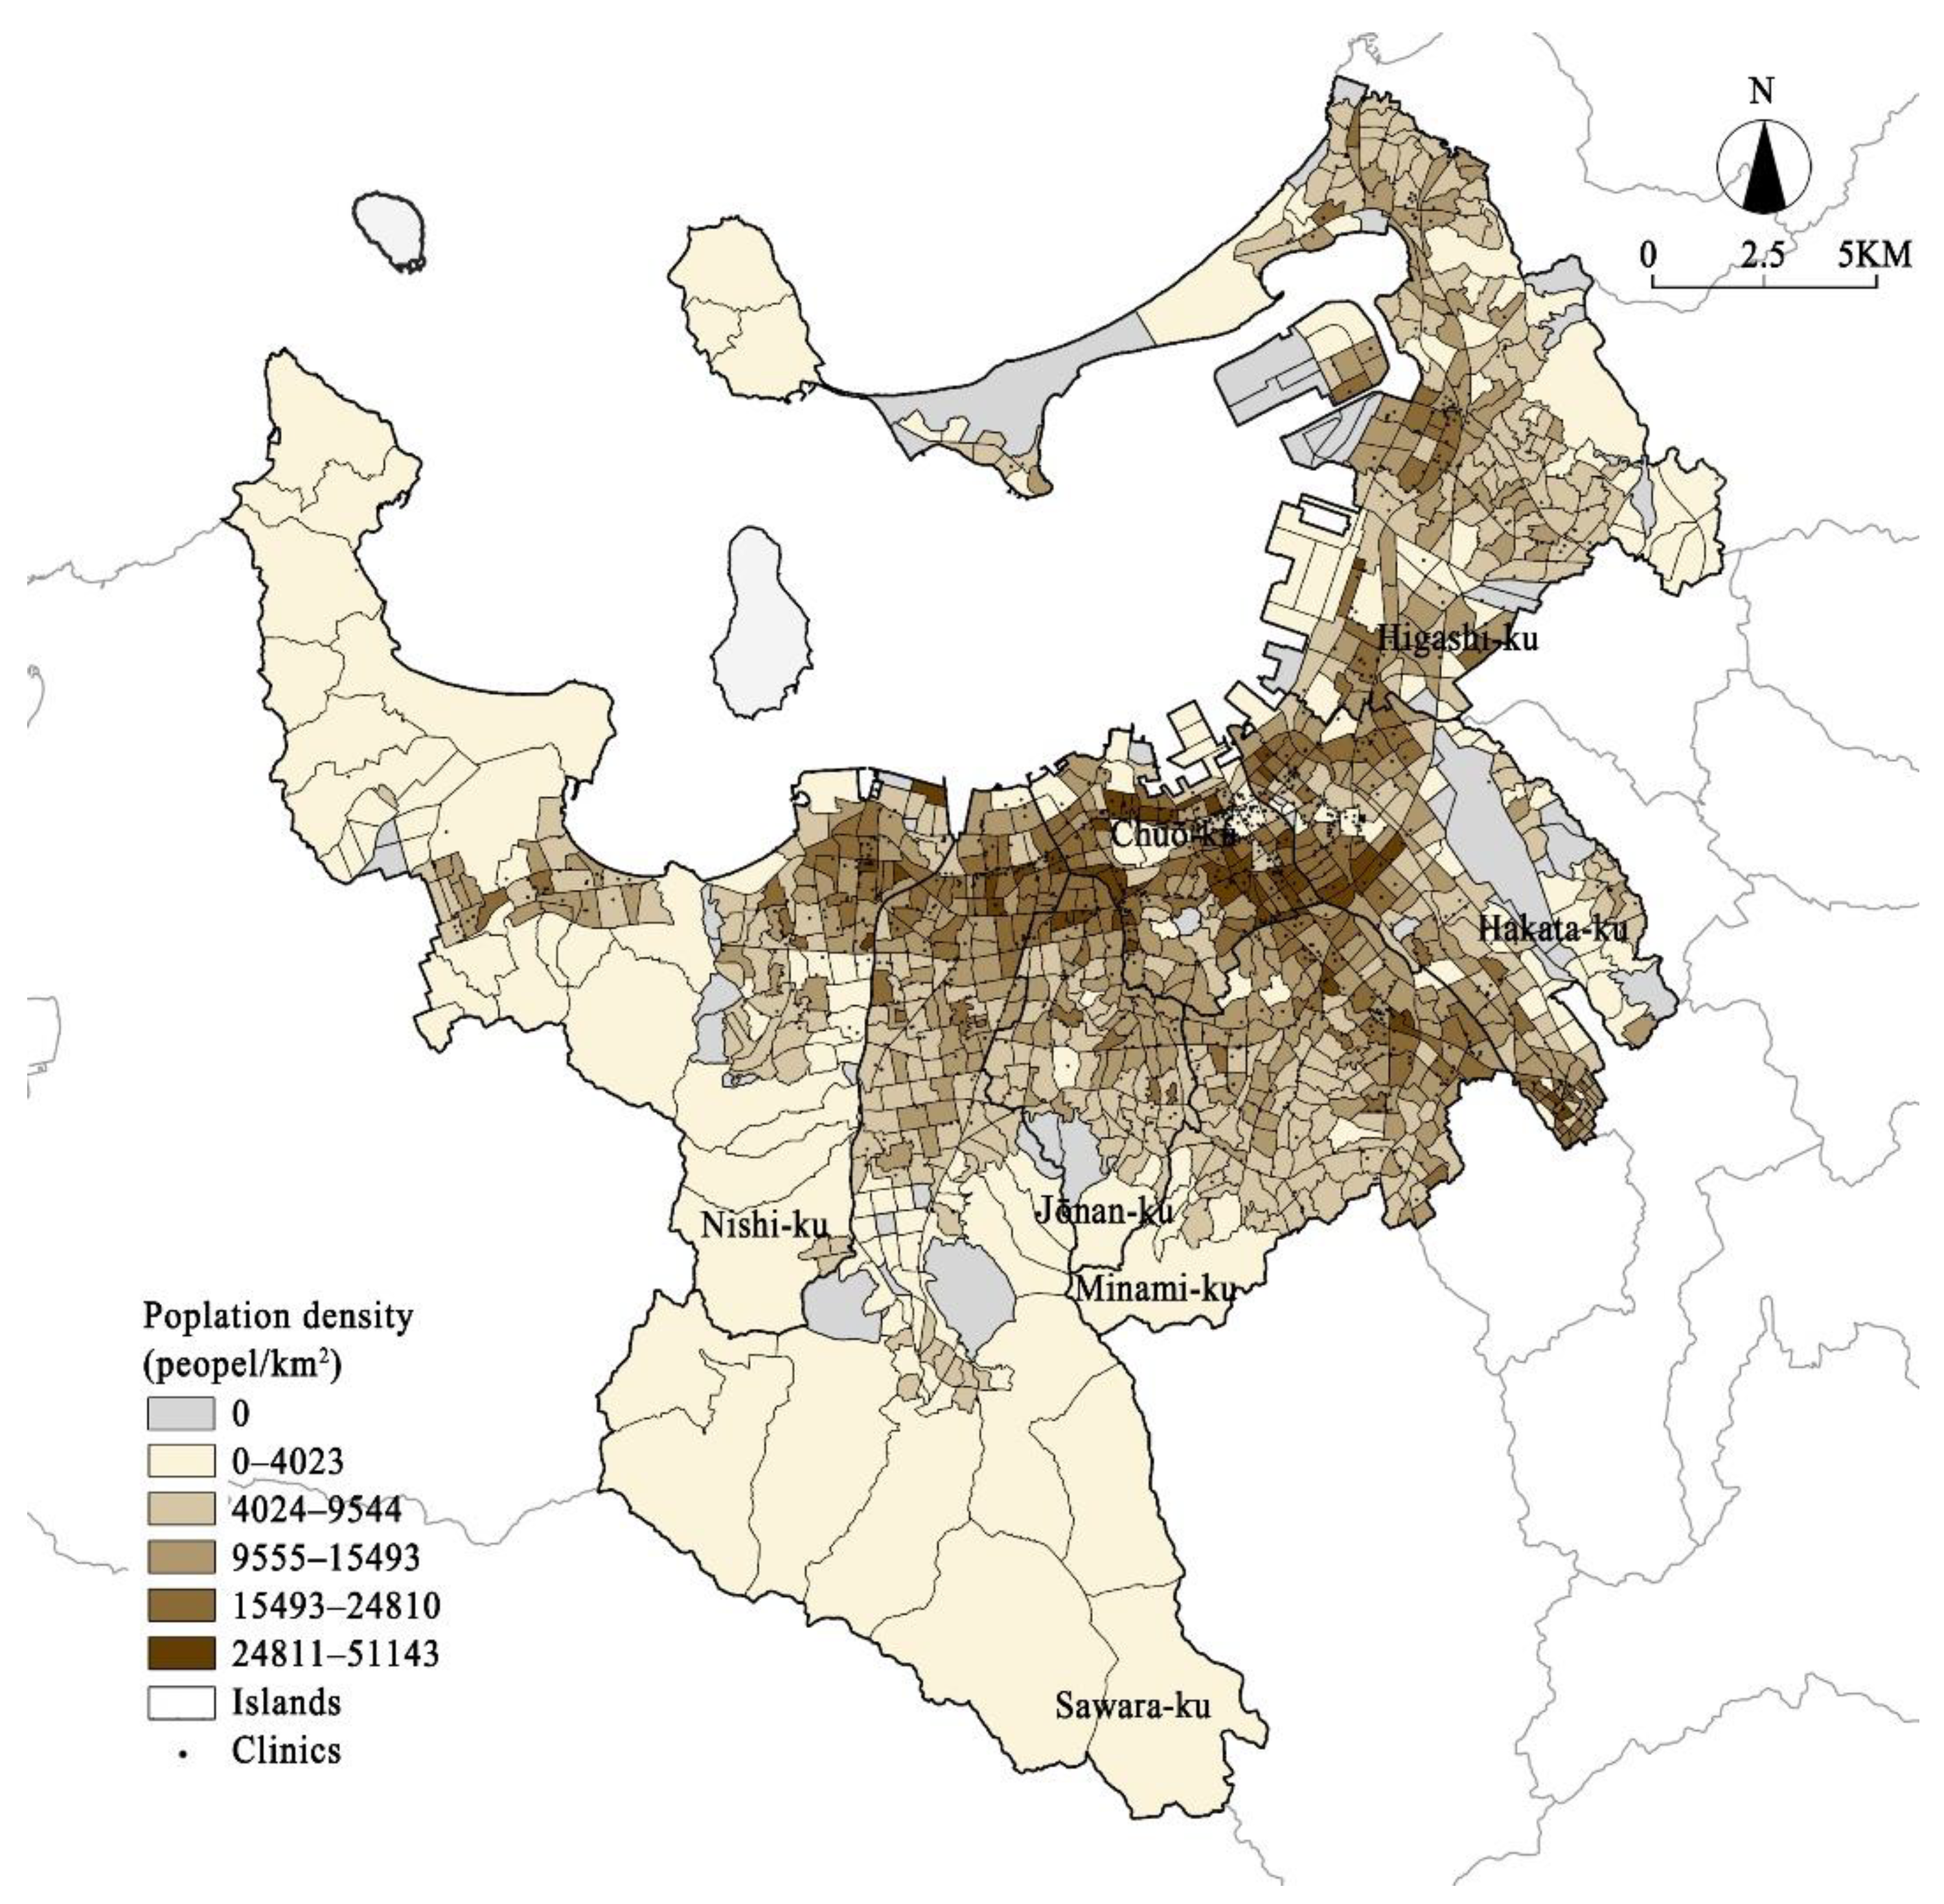
The research objects of this study are the clinics, the primary medical facilities in the city, aimed at community residents. Therefore, the calculating of the medical supply-demand and spatial accessibility will also be measured at the community level, a smaller geographic unit. Fukuoka city had 1606 clinics in 2020. Excluding the staff-only clinics and the no full-time doctor clinics, there are 1430 clinics as the research objects. Chome is the minimum statistical unit of the Japanese census, with the most complete, comprehensive, and accurate population data. There are 1092 chomes with a resident population in Fukuoka, and their population density showed in Figure 2.
The process of the calculation relied on the following two key data items: primary care services and the resident population. The first category is the medical-related data, including: (1) The data of the name, characteristics, and location of clinics in Fukuoka city, which are obtained from Medical Facilities Data (2020) on National Land Information Division, MLIT of Japan. (2) The data on the number of full-time doctors who can provide medical services in the clinics. These are obtained from the Japan Medical Analysis Platform and Fukuoka Medical Information Net. The second category is population and city-related data, including: (1) The data of the total population and age structure of the smallest census tracts. These data come from the survey of the population in small areas (chome level) in Fukuoka on Population Census 2020. (2) One-kilometer mesh data of the land use is from the National Land Information Division, MLIT of Japan.
5. Results
5.1. Result of Accessibility
From the perspective of the result of the initial travel time, the supply-to-demand ratios of the clinics were from 0.037 to 3.702. There were 775 clinics that did not reach the threshold service population and were required to expand the service area. The spatial accessibility of the clinics in Fukuoka varied from 0 to 35.107; the average value was 1.263 (see Table 1). The descriptive statistic was showed that 70% of the population locations below the average level. There were 187 population locations unable to access the clinics within 500 meters’ travel time. The population locations with the accessibility of 0 are mostly distributed in the urban fringe areas, mostly located in Higashi-Ku, Nishi-Ku, and Sawara-Ku. Except for these population locations, the access scores of the primary healthcare facilities were classified into five levels by using the Jenks Natural Breaks method (Figure 3). The spatial distribution characteristics showed that the accessibilities of the clinics in the central urban area were the highest. The population locations with the accessibility over the moderate levels are all concentrated in Chūō-Ku and Hakata-Ku. The accessibility of the Jōnan-Ku and Sawara-Ku were all below the medium level. The Higashi-Ku had the greatest number of the lowest reachability settlements. Three-quarters of the population in this district had difficulty in obtaining adequate primary medical services within 500 m areas. In addition to the urban center in Chūō-Ku, the other six districts were all inconvenient, causing problems with receiving medical services in the initial travel time.
The HCAs and PCAs were calculated by continuously changing the travel time until the coverage population in step1 and the doctor-to-population ratio in step2 reached the threshold, respectively. Following these practices, the HCAs ranged from 500 m to 6400 m, but almost within 1000 m. HCA sizes for clinic locations in Figure 4a suggested that: First, the clinics with 500 m service areas were located in the Chūō-Ku, Hakata-Ku, and Sawara-Ku. They were distributed along the horizontal and vertical subway lines in Fukuoka, forming a curve belt in the city. Second, the number of the HCAs from 500 m to 700 m was almost equal to that of 500 m. Chūō-Ku had the largest number of these HCAs. The other HCAs were almost evenly distributed in the other five districts. From the perspective of the urban space, they surrounded the 500 m-HCA clinics. Third, HCAs from 700 to 1000 m were almost located in Higashi-Ku and Nishi-Ku. HCAs above 1600 m were all distributed in these two districts. In general, the spatial structure of different sized HCAs presented circle spatial characters in the city. The closer to the fringe of the city, the greater the size of HCA. The biggest change in the clinics’ service areas was in Higashi-Ku. More than three-quarters of the clinics were required to expand the search radius to cover adequate residents. Their average size of HCAs was 723 m, which was the largest scope of all administrative districts. With the change of HCAs, the supply-to-demand ratio had also changed. The supply-to-demand ratio of the clinics with expanded catchments averagely decreased by 16.9%. Among these clinics, 36% of them had changed more than the average level and were mostly distributed in Hakata-Ku, Hakata-Ku, and Chūō-Ku.
The PCAs ranged from 500 m to 3000 m, and almost three-quarters within 800 m. PCA sizes for population locations of Figure 4b suggested that: First, the population location with 500 m catchments could be found in every district, mostly in Chūō-Ku and Hakata-Ku. Usually, several chomes were connected with each other and clustered together into different-sized groups. There was the biggest group in the center of the city. Second, over half of the chomes with the PCAs from 500 m to 1000 m were in Higashi-Ku, Minami-Ku, and Hakata-Ku. They commonly accompanied the outside of the 500 m PCAs’ groups, which were completely surrounded by. Third, the chomes with the PCAs of 1000–1500 m, 1500–2000 m, and 2000–2500 m alternated in urban fringe areas. The population locations with PCAs above 2500 m were concentrated in northwest, southwest, and northeast of the city, belonged to Nishi-Ku, Higashi-Ku, and Sawara-Ku separately. The same with HCAs, the most numbers of the changes of the PCAs also occurred in Higashi-Ku, followed by Nishi-Ku and Minami-Ku. More than three-quarters of the population locations in these three districts expanded their PCAs. The change of the PCAs in Chūō-Ku was the least, accounting for 44%. People in Chūō-Ku could obtain enough primary medical service with an average travel time of 600 m. However, people who lived in Nishi-Ku, Higashi-Ku, and Sawara-Ku should invest travel time over 900 m. It is different from the HCAs, the PCAs varied greatly in each district.
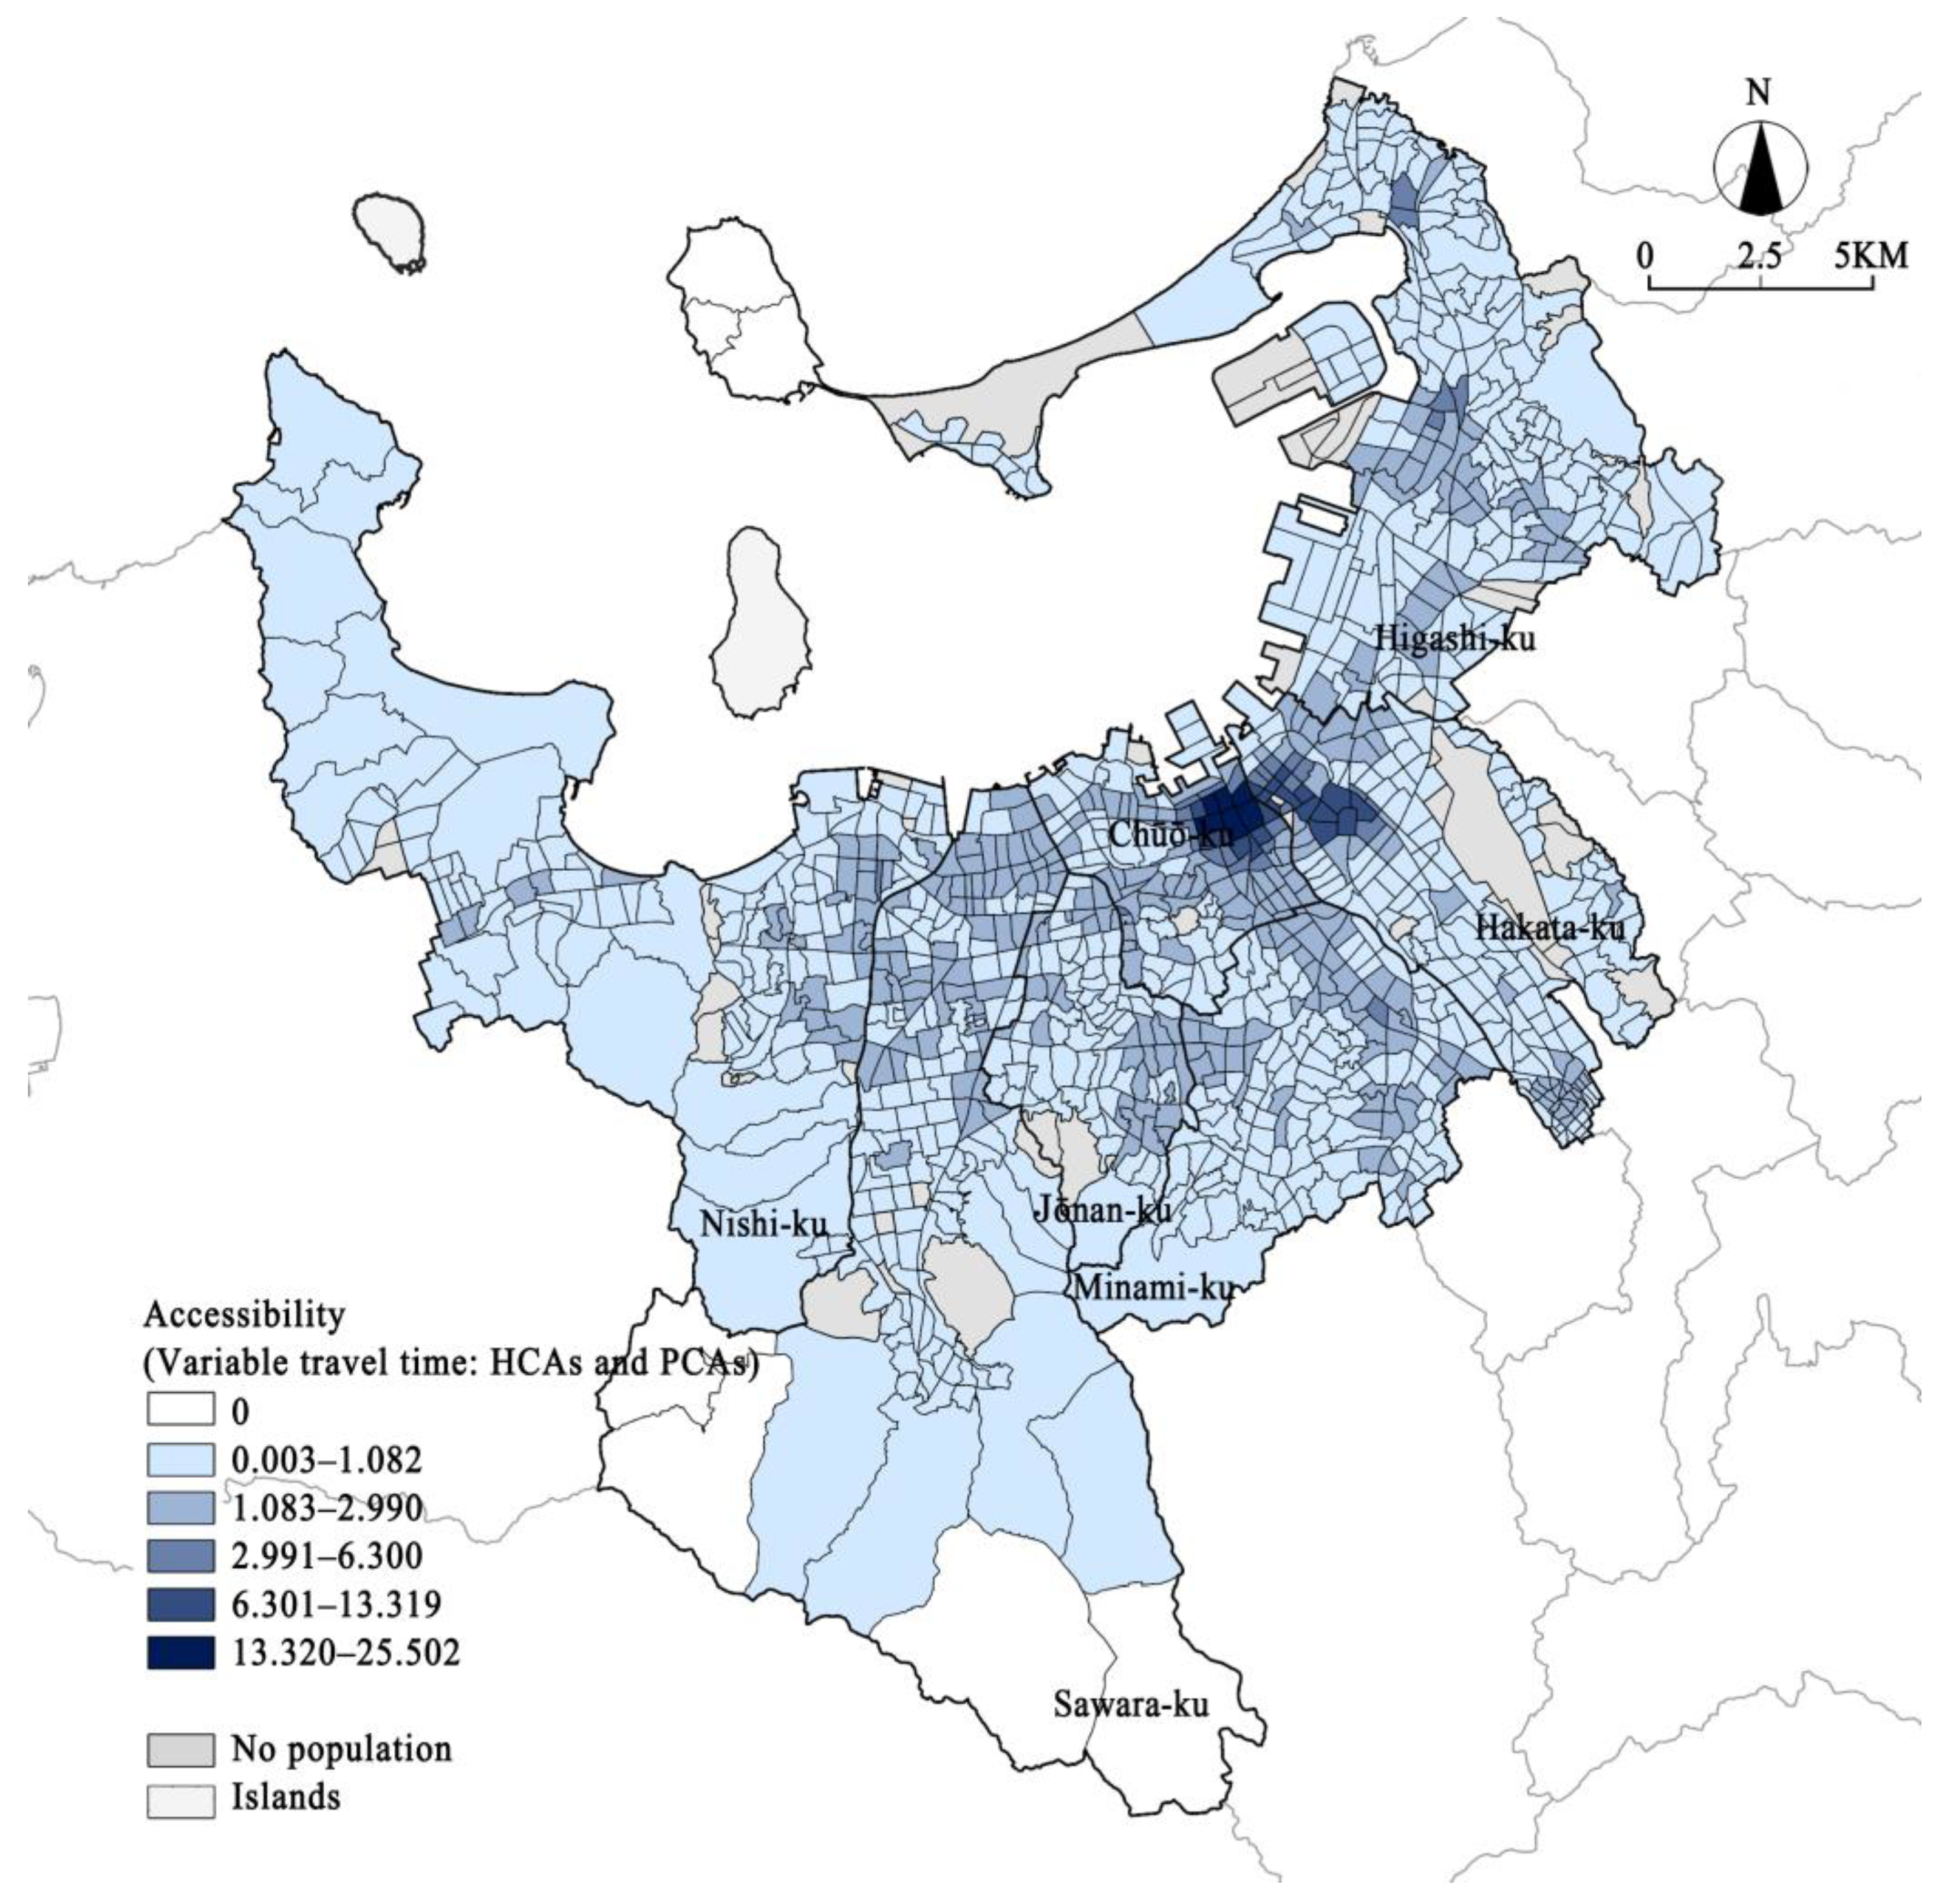
Figure 5 shows the spatial distribution of the accessibility of primary healthcare in Fukuoka city using the variable catchments sizes both for doctors and population locations. Note that distance decay had also been considered in this case. The accessibility to primary healthcare was from 0 to 28.502, and the average value was 1.224 (Table 2). Compared with the fixed catchment size, the accessibility scores evaluated with variable catchments were more agglomerated, indicated by the standard deviation. The regional variations of the medical accessibility had been reduced in all seven districts, especially in the two districts on the edge of the city: Nishi-Ku and Higashi-Ku, and then followed by Hakata-Ku and Chūō-Ku located in the interior of the city. For the population locations that remained to pay initial travel time to go to the clinics, their accessibilities were also decreased to some extent. The accessibilities evaluated by the fixed catchment were overestimated. The changes in the HCAs had led to an increase in the number of people accessing medical services, resulting in a decline in the supply-to-demand ratio of the clinic. This phenomenon was reflected in the decrease in accessibility in urban settlements, as well as the elimination of some underserved population locations in urban fringe areas. Doctors in the urban fringe area usually need a larger service scope, as well as the elimination of some underserved population locations in urban fringe areas. If we use the fixed catchment with initial travel time, the population they can serve will be underestimated, resulting in higher accessibility scores. If we use the fixed catchment for the population locations in the urban fringe area, there are few or no clinics they can obtain medical services. Overall, using the variable catchments method could make the evaluation of accessibility more reasonable.
5.2. Spatial Inequality Analysis of the Accessibility to Primary Healthcare Facilities
Here, we focus on further examinations of the inequality of accessibility from the perspective of spatial distribution, clinic type, and the high-demand group.
In terms of the spatial distribution, we used univariate Global Moran’s I and univariate Local Moran’s I to describe the spatial autocorrelation of the accessibility in the entire city and among the different chomes, respectively [15,60]. We used the inverse distance squared as the conceptualization of spatial relationships, the Euclidean distance measure as the distance method, and 3000 m as the threshold distance. See Figure 6, the Moran’s I index was 0.431, the z-score was 43.128, and the p-value was 0 (less than 0.001), reaching the conclusion that the global autocorrelation of the accessibility was positive and significant. The spatial distribution of access to primary healthcare facilities in Fukuoka city is clustered. When combining with the statistical results, the accessibility was highly concentrated in the central area of the city. Figure 7 shows the spatial cluster and outliers of accessibility by Local Moran’s I, which can be divided into five types: High-High (HH), High-Low (HL), Low-High (LH), Low-Low (LL), and not significant. HH cluster chomes are mostly distributed in the central urban area, the east area of Chūō-Ku, and northwest of Hakata-Ku. Apart from that, there are some HH clusters in the junction areas between the Chūō-Ku and Jōnan-Ku, Chūō-Ku and Minami-Ku, Hakata-Ku and Higashi-Ku. LL clusters are in the suburban areas. HL clusters are small-sized patches and scatter in LL areas. LH clusters are around the periphery of the HH clusters. There are large areas of insignificant spatial correlation between the south and west of the HH and LH areas and the north and east of the LL area. Overall, from the perspective of the space, there exists inequality for the residents accessing the primary healthcare facilities. The accessibility is highest in the urban center. A ring-shaped area of relatively low accessibility formed in the urban area at the junction of the urban center. The accessibility diversity in the urban area is not significant in space. The accessibility of urban suburbs is generally low and clustered. However, there are some patches with high accessibility in urban suburbs.
Different from the general practitioner in European and American countries, general clinics in Japan are generally specialist clinics [61]. They are serving the role of concentrating on providing professional diagnosis and treatment of specific content. Therefore, the types of clinics accessible to the residents are of vital importance to the quality of medical services they can obtain. Japan Medical Association made the diagnosis and treatment departments of general clinics into eight categories: Internal Medicine (IM), General Surgery (GS), Obstetrics and Gynecology (OB/GYN), Pediatrics (PEDS), Psychiatry (PSY), Ophthalmology (OPH), Otorhinolaryngology (ORL), Dermatology (DERM). We used the unique or the most significant department to represent the type of the clinic. The IM clinics are the most numerous, accounting for 46% of the objective clinics in this study. The second-largest number of clinics are GS clinics, followed by DERM, OPH, PSY, PEDS, ORL, and OB/GYN. It has been proved that almost all population locations in Fukuoka are under the service of clinics. However, the quantities, types of the clinics, and the accessibility to the specific departments are different for residents. Figure 8 shows what percentage of population locations in each district the clinic provided specific diagnosis and treatment services.
The dark gray and orange parts represented the proportion of the population catchment areas with and without particular types of clinics, respectively. The IM clinics almost covered all populations, while the OB/GYN clinics had the lowest coverage, about 35%. Nearly 90% of the population locations could be served by the GS clinics. Chūō-Ku and Jōnan-Ku were almost fully covered, but Higashi-Ku had 27% PCAs without SG clinics. Although PEDS clinics were the second to the last in quantity, the coverage rate was more than 50%, which is the most efficient of all types of clinics. The OPH, ORL, and DERM clinics also served more than 50% of the population locations. The coverage of the OPH and ORL clinics in each district is similar.
There were differences in the quantity and the number of the types of clinics in the search scope of each population location (see Table 3). The types of clinics in PCAs reflect the complexity of the medical services received by the population locations. We divided the complexity into four levels: PCA had 1–2, 3–4, 5–6, and 7–8 types of clinics. The quantities of clinics in PCAs were also divided into four categories by quartiles. Table 4 suggests that 33% of the population points have access to more comprehensive medical services with a relatively small number of clinics. However, there were still 24% population points. Although there were a large number of clinics, the types of the clinics were still relatively single. The number and type of clinics were not evenly distributed. Figure 9 shows the results of the hotspot analysis (Getis-Ord Gi *) for the accessibility of population locations to different types of clinics, using the fixed distance band as the conceptualization of spatial relationships and 3000 m as the threshold distance realized by ArcGIS Pro. The high accessibility areas to IM, GS, OB/GYN, PSY, and DERM were clustered in the urban center. Meanwhile, there are obvious and large clusters of low accessibility areas to IM, GS, and PSY, which were in the west, east, and south suburban, respectively. Population locations with high accessibility to PEDS, OPH, and ORL formed two hot spots areas in the city. It is worth integrating that the high accessibility cluster to PEDS is not in the urban center. The cold spots area of these three departments were scattered in the southwest and northeast of the urban fringe.
The research on the present state and future of the medical supply system in the region produced by the Japan Medical Association Research Institute conjectured the medical needs of different age groups according to the medical expenses [62]. This research took the volume of medical needs of middle-aged people from 40 to 64 years old as the reference. The medical needs of the elderly from 65 to 74 and over 75 years old are 2.3 and 3.9 times greater than the reference value, respectively. The medical demands of young people (under 14 years old) and 15–39 years old working-age people were 0.4 and 0.6 lower than the reference. The medical needs of people over the age of 65 far exceed those of other age groups. Therefore, the accessibilities for the high-demand population to primary healthcare facilities are significant for realizing medical equality. First, we calculated the population density and proportion of people aged 65–74 and over 75 in Fukuoka. Then we identified the chomes where both population density and proportion were higher than the overall level of the city. These population locations were recognized as the high-demand areas. Figure 10 shows that there are 105 and 78 high-demand population locations for people aged 65–74 (Type1) and over 74 years old (Type2), respectively. In addition, up to 297 population locations have reached the standard of high demand in both elderly age groups (Type3). We further divided these types of areas into three levels: slightly high-demand, generally high-demand, and severely high-demand areas. Finally, the accessibility performance and distribution for these three kinds of high-demand areas were as follows: (a) The average accessibility for Type1 areas was 1.144, which is a higher level. They were evenly distributed in all administrative districts and formed a small group in the south of Hakata-Ku. The accessibility of slightly high-demand and severely high-demand areas was close. The average score of the latter was 0.940, which was the lowest in Type1, 30% less than that of the generally high-demand areas. (b) The average accessibility for Type2 areas was 1.033, an intermediate level. Three levels of areas of Type2 presented a dispersed distribution and relatively inequality. Different from Type1, the accessibility of slightly high-demand areas and generally high-demand areas were close. The same as Type1, the area with the lowest accessibility to clinics was still the severely high-demand area, whose average value was only 0.702 and 40% less than that of the generally high-demand area. (c) The average accessibility for Type3 areas was 0.900, the lowest of these three types. They were relatively continuous in the spatial distribution in all districts, especially in Minami-Ku. Although there was little difference in accessibility between different levels of areas in Type3, the severely high-demand area was still with the lowest accessibility. By superimposing the hot spot map of the accessibility with the high-demand area (Figure 10), we can see that a large number of high-demand areas are located inside or on the edge of the cold spot areas. The suburb in the southwest of the city had the largest cold spot area. Among them, the cold spot cluster with 99% confidence was almost formed by the severely high-demand areas. Cold spot clusters with 95% and 90% confidence were almost composed of the slightly high-demand, generally high-demand areas. Only 10% of high-demand areas were located in hot spot areas of the accessibility to primary healthcare facilities. Overall, the accessibility for the high-demand population to medical facilities generally is low. High-demand areas are under-served to a certain extent, especially in the severely high-demand areas.
6. Discussion
6.1. Study Innovations and Implications
This research mainly has the following academic contributions:
- (1)
- The research on the planning of medical facilities mostly focuses on high-level medical facilities such as hospitals or multi-level medical systems [19,20,21,25,26,27]. This research on small-scale medical facilities at the clinic level has improved the structure of the research on the medical facilities hierarchy. Provide data support for comprehensive medical facility planning. Primary medical facilities are related to people’s daily health and are important functional facilities in cities. At the same time, because of the hierarchical medical system, clinics have become the main carrier of primary healthcare in Japan. The equal allocation of the clinics affects the urban health level to a certain extent. In addition, the number of primary healthcare facilities is huge, so their reasonable distributions are not only the effective use of medical resources but also conducive to the sustainable use of land resources. In the research of small-scale medical facilities, we use small-scale urban spatial units accordingly. In the process of calculating accessibility, the selection of distance parameters is based on walking distance. In recent years, the concept of 15-min city and 20-min city proposed under the concept of urban livability, energy conservation, and emission reduction advocates increasing the interactive relationship between residents and urban functions at the community scale [63] and responds to urban equity issues including health services [64]. The research on the accessibility equity of small-scale urban space to the small-scale medical facilities in this paper can be related to the problem of service inequality in the 15- or 20-min city.
- (2)
- In the research method, using the 2SFCA model with variable catchments can avoid the situation that the accessibility of some areas is overestimated or underestimated by the ordinary 2SFCA method and then avoid the neglect of areas that are really facing the shortage of medical services. The estimation of the healthcare catchment areas and the population catchment areas is based on the necessity of residents’ demand for primary healthcare services. For the estimation of service and demand catchments, this method can adjust the threshold according to different research scenarios and obtain the results in line with the actual situation of individuals. The setting of thresholds in this work is related to current practices of the medical resources and population. Service scopes calculated based on thresholds can help directly judge the underserved areas in the city. At the same time, it is easier to trigger the adjustment of medical resources according to the change in population. The method of variable catchments can also be further used in the dynamic allocation of medical resources.
- (3)
- This work also attempts to put forward a comprehensive evaluation method for the inequity distribution of accessibility of primary medical facilities. Existing studies mostly reflect on medical equity from the perspective of spatial equity. This work measures the distribution of accessibility from the perspective of service quality equity and social equity. This provides more accurate support for the formulation of corresponding urban policies and spatial planning. Specifically, service quality refers to the types of medical services that residents can obtain, which is based on the consideration that most clinics in Japan are a single diagnosis and treatment department operated by a medical specialist. Research shows that equity is gradually integrated into spatial development policies [65]. The polycentric system is regarded as a tool to narrow regional disparities [66]. This work showed that there exist different aggregation characteristics in space for different kinds of clinics. The high accessibility areas of the Pediatrics, Ophthalmology, and Otorhinolaryngology clinics appears in the form of multiple centers in spatial distribution. This result provides enforceability for supporting urban polycentric system development [67]. In recent years, there has been a phenomenon that multiple independent clinics are located in the same or similar physical space in Japan. Such clinics groups are called medical malls [9], which is a spontaneous response to the regional medical quality inequality. It also provides support for small-scale regional activation activities guided by medical facilities [35]. The spatial inequity analysis for the service quality is a more detailed consideration of medical resources, making all kinds of clinics more targeted in the process of planning and layout. The consideration of the population to be served is mainly put forward for the increasing phenomenon of population aging. The assessment of the accessibility of high-demand groups is conducive to accurately grasping the condition of the areas with insufficient services and further providing guidance for the layout of facilities. In general, the layout of medical resources and facilities is a process that requires comprehensive decision-making. Focusing on the core relationship of medical facility allocation: supply from the medical resources and demand of the population, this paper makes a more in-depth evaluation of the spatial difference of accessibility from the two aspects of quantity and quality, which are in line with the trend of land use refinement and sustainable development.
6.2. Limitations
There are some potential limitations in this study. First, limited to existing data, the thresholds used in the calculation of HCAs and PCAs are based on the common setting in most studies. In the future, the threshold more adapted to the actual situation may be further speculated through the reception of clinics and residents’ medical habits in combination with the use of insurance and field investigation. In addition, for the population locations adjacent to other cities, they may choose the medical facilities in other cities, so the medical accessibility in these areas is likely to be underestimated. Finally, the calculation of accessibility is based on the consideration of walking distance. In the future, this study will try to evaluate accessibility based on a variety of transportation modes, including public transportation and private cars. In addition, the distance–decay function will be further considered based on different transportation modes. People’s use of transportation means any combination of transportation modes affects the travel time and the choices of destination facilities and then relates to the changes in various environmental indexes and the sustainable development of the environment [68,69]. Therefore, the relationship between the layout of medical facilities based on different modes of transportation and environmentally sustainable development will be one of the research directions in the future.
7. Conclusions
With the help of the V2SFCA models introduced the distance–decay functions, this study calculated the accessibility for residents to the primary healthcare facilities, conducting a detailed case study in Fukuoka city. Through the spatial inequality analysis of the accessibility from the aspects of the spatial distribution, clinic types, and the high-demand people, this study further evaluated the disparity in receiving primary healthcare. Based on these analyses, the following conclusions can be obtained:
From the construction logic and calculation results, the V2SFCA method can more accurately evaluate the accessibility of primary healthcare facilities than the generalized 2SFCA model. Due to the uneven distribution of clinics and population, the fixed catchments cannot accurately reflect the actual service scope of clinics and the actual treatment scope of residents. On the one hand, the served population in the fixed catchment of some clinics is seriously underestimated, resulting in the overestimation of the finally calculated accessibility. On the other hand, fixed catchments make the number of areas that cannot obtain medical resources seriously overestimated. If the accessibility calculated based on the fixed catchments is used as evidence for the allocation of medical facilities, it will lead to the waste of medical resources. This work verified that using variable catchments could avoid these problems to a certain extent. Apart from that, this work also considered the attenuation effect of distance. It was concluded that the HCA range of Fukuoka city is 500 m to 6400 m, basically showing a gradual trend of expanding from the city center to the urban fringe. The range of PCA was 500 m to 3000 m. The PCAs within 500 m formed some plates in the city, with 500–1000 m PCAs surrounding their periphery. The PCAs above 1000 m alternately appeared in the suburban areas. The estimates of HCAs and PCAs are more in line with the actual medical supplies and demands. At the same time, it also has certain significance for urban planners to understand the impact scope of medical facilities and people’s travel scope. Further consideration can be given to the guidance of allocation of the facilities in urban function-induced zones.
Spatial inequalities in the residents’ accessibilities to the primary healthcare facilities are demonstrated. (1) From the perspective of the spatial distribution, the accessibilities in Fukuoka city were clustered. The accessibilities to clinics were highest in the central urban area, surrounded by some low accessibility areas all around. The accessibilities for the population locations in suburban areas were commonly low and clustered, while the interior of the cluster had some small patches composed of some higher accessibilities’ chomes. (2) In terms of medical quality, this work mainly considered the difference in residents’ accessibility to different types of clinics. Fukuoka had the largest number of IM clinics, which could be taken with full advantage to meet the needs of all regions. SG clinics took the second in quantity and could provide services for 90% of the population locations. Other kinds of clinics had different degrees of unsaturation in each district. By comparing the number and proportion of population points that can receive the services of the specific type of clinic, we can see whether the distribution of different types of clinics at this stage can serve more residents to the greatest extent. Pediatrics was a positive representative, covering relatively larger population areas with a small quantity. In addition, the quantity of the medical services types available to different population locations was different. About 24% of the population points had few types of medical services, although there were a large number of clinics within the PCAs. There are too many same-type clinics in these areas, which may lead to the possibility of inducing competition among clinics. The accessibility of clinics in different departments has its own characteristics and obvious differences. This can provide recommendations for the allocation of clinics that are accurate to specific diagnosis and treatment departments. (3) For the population served, nearly 80% of the settlements in Fukuoka city were facing the problem of population aging to varying degrees. The accessibilities for high-demand areas to medical facilities were generally low, especially in areas where the aging degree of the population aged 65–74 and over 75 both exceeded the average level of the city. In addition, the accessibility of severely high-demand areas was lower than that of slightly and generally high-demand areas. The phenomenon of low accessibility in high-demand areas also reflected the inequity distribution of medical resources. Overall, the results in Fukuoka confirmed the inequities that occurred not only in the spatial distribution but also in the medical quality and high-demand population. Measuring inequities of accessibility at different aspects is instrumental in reallocating the healthcare resources and elaborating on medical facilities planning.
Author Contributions
Conceptualization, M.D. and S.Z.; methodology, M.D.; software, M.D.; validation, M.D. and S.Z.; formal analysis, M.D.; investigation, M.D.; resources, M.D. and S.Z.; data curation, M.D.; writing—original draft preparation, M.D.; writing—review and editing, M.D. and S.Z.; visualization, M.D. and S.Z.; supervision, S.Z.; project administration, S.Z.; funding acquisition, M.D. and S.Z. All authors have read and agreed to the published version of the manuscript.
Funding
This research was funded by JSPS (Japan Society for the Promotion of Science) Grants-in-Aid for Scientific Research, grant number JP22K04457.
Institutional Review Board Statement
Not applicable.
Informed Consent Statement
Not applicable.
Data Availability Statement
Not applicable.
Conflicts of Interest
The authors declare no conflict of interest.
References
- Tonne, C.; Adair, L.; Adlakha, D.; Anguelovski, I.; Belesova, K.; Berger, M.; Brelsford, C.; Dadvand, P.; Dimitrova, A.; Giles-Corti, B.; et al. Defining pathways to healthy sustainable urban development. Environ. Int. 2021, 146, 106236. [Google Scholar] [CrossRef]
- Stevenson, M.; Thompson, J.; de Sá, T.H.; Ewing, R.; Mohan, D.; McClure, R.; Roberts, I.; Tiwari, G.; Giles-Corti, B.; Sallis, J.; et al. Land use, transport, and population health: Estimating the health benefits of compact cities. Lancet 2016, 388, 2925–2935. [Google Scholar] [CrossRef] [Green Version]
- Zhou, H.; He, S.; Cai, Y.; Wang, M.; Su, S. Social inequalities in neighborhood visual walkability: Using street view imagery and deep learning technologies to facilitate healthy city planning. Sustain. Cities Soc. 2019, 50, 101605. [Google Scholar] [CrossRef]
- Liu, S.; Long, Y.; Zhang, L.; Liu, H. Quantifying and Characterizing Urban Leisure Activities by Merging Multiple Sensing Big Data: A Case Study of Nanjing, China. Land 2021, 10, 1214. [Google Scholar] [CrossRef]
- Chen, K.; Zhang, T.; Liu, F.; Zhang, Y.; Song, Y. How Does Urban Green Space Impact Residents’ Mental Health: A Literature Review of Mediators. Int. J. Environ. Res. Public Health 2021, 18, 11746. [Google Scholar] [CrossRef]
- Poortinga, W.; Bird, N.; Hallingberg, B.; Phillips, R.; Williams, D. The role of perceived public and private green space in subjective health and wellbeing during and after the first peak of the COVID-19 outbreak. Landsc. Urban Plan. 2021, 211, 104092. [Google Scholar] [CrossRef]
- Zhang, W.; Cao, K.; Liu, S.; Huang, B. A multi-objective optimization approach for health-care facility location-allocation problems in highly developed cities such as Hong Kong. Comput. Environ. Urban Syst. 2016, 59, 220–230. [Google Scholar] [CrossRef]
- Rahman, S.U.; Smith, D.K. Use of location-allocation models in health service development planning in developing nations. Eur. J. Oper. Res. 2000, 123, 437–452. [Google Scholar] [CrossRef]
- Du, M.; Zhao, S. Efficiency Evaluation and Influence Factor Analysis of Medical Malls-Taking Fukuoka City, Japan as a Case Study. Int. Rev. Spat. Plan. Sustain. Dev. 2022, 10, 73–91. [Google Scholar] [CrossRef]
- Shohet, I.M.; Lavy, S. Healthcare facilities management: State of the art review. Facilities 2004, 22, 210–220. [Google Scholar] [CrossRef] [Green Version]
- Amankwah, O.; Choong, W.-W.; Mohammed, A.H. Modelling the influence of healthcare facilities management service quality on patients satisfaction. J. Facil. Manag. 2019, 17, 267–283. [Google Scholar] [CrossRef]
- Towne, S.D. Socioeconomic, geospatial, and geopolitical disparities in access to health care in the US 2011–2015. Int. J. Environ. Res. Public Health 2017, 14, 573. [Google Scholar] [CrossRef]
- Lasser, K.E.; Himmelstein, D.U.; Woolhandler, S. Access to Care, Health Status, and Health Disparities in the United States and Canada: Results of a Cross-National Population-Based Survey. Am. J. Public Health 2006, 96, 1300–1307. [Google Scholar] [CrossRef]
- Marmot, M.; Sharon Friel, S.; Bell, R.; Houweling, T.A.; Taylor, S. Closing the gap in a generation: Health equity through action on the social determinants of health. Lancet 2008, 372, 1661–1669. [Google Scholar] [CrossRef]
- Yin, C.; He, Q.; Liu, Y.; Chen, W.; Gao, Y. Inequality of public health and its role in spatial accessibility to medical facilities in China. Appl. Geogr. 2018, 92, 50–62. [Google Scholar] [CrossRef]
- Yang, N.; Chen, S.; Hu, W.; Wu, Z.; Chao, Y. Spatial Distribution Balance Analysis of Hospitals in Wuhan. Int. J. Environ. Res. Public Health 2016, 13, 971. [Google Scholar] [CrossRef] [PubMed] [Green Version]
- Pan, J.; Shallcross, D. Geographic distribution of hospital beds throughout China: A county-level econometric analysis. Int. J. Equity Health 2016, 15, 179. [Google Scholar] [CrossRef] [PubMed] [Green Version]
- Horev, T.; Pesis-Katz, I.; Mukamel, D.B. Trends in geographic disparities in allocation of health care resources in the US. Health Policy 2004, 68, 223–232. [Google Scholar] [CrossRef]
- Jin, M.; Liu, L.; Tong, D.; Gong, Y.; Liu, Y. Evaluating the Spatial Accessibility and Distribution Balance of Multi-Level Medical Service Facilities. Int. J. Environ. Res. Public Health 2019, 16, 1150. [Google Scholar] [CrossRef] [Green Version]
- Zhang, D.; Zhang, G.; Zhou, C. Differences in Accessibility of Public Health Facilities in Hierarchical Municipalities and the Spatial Pattern Characteristics of Their Services in Doumen District, China. Land 2021, 10, 1249. [Google Scholar] [CrossRef]
- Fu, S.; Liu, Y.; Fang, Y. Measuring the Differences of Public Health Service Facilities and Their Influencing Factors. Land 2021, 10, 1225. [Google Scholar] [CrossRef]
- Tajima, M.; Kikuchi, H.; Ohuchi, H. Study on optimal location planning using regional information in emergency medical system- Study on Construction of Areal Guidelines Statistical Distribution of Population Using GIS/GPS. J. Archit. Plan. (Trans. AIJ) 2008, 73, 1929–1937. [Google Scholar] [CrossRef] [Green Version]
- Goddard, M.; Smith, P. Equity of access to health care services: Theory and evidence from the UK. Soc. Sci. Med. 2001, 53, 1149–1162. [Google Scholar] [CrossRef]
- Beauchamp, T.L.; James, F.C. Justice. In Principles of Biomedical Ethics, 4th ed.; Oxford University Press: Oxford, UK, 1994; pp. 361–365. [Google Scholar]
- Xu, F.F.; Zhao, S.C.; Yamamoto, R. Exploring the Supply and Demand Relationship of Medical Services for Each Diagnosis-related Group. J. Archit. Plan. (Trans. AIJ) 2020, 85, 637–646. [Google Scholar] [CrossRef]
- Wang, J.; Du, F.; Huang, J.; Liu, Y. Access to hospitals: Potential vs. observed. Cities 2020, 100, 102671. [Google Scholar] [CrossRef]
- Cheng, G.; Zeng, X.; Duan, L.; Lu, X.; Sun, H.; Jiang, T.; Li, Y. Spatial difference analysis for accessibility to high level hospitals based on travel time in Shenzhen, China. Habitat Int. 2016, 53, 485–494. [Google Scholar] [CrossRef] [Green Version]
- Overview of Medical Care Plan 2010. Available online: https://www.mhlw.go.jp/stf/shingi/2r9852000000zc42-att/2r9852000000zc72.pdf (accessed on 7 November 2021).
- Hosokawa, R.; Ojima, T.; Myojin, T.; Aida, J.; Kondo, K.; Kondo, N. Associations between Healthcare Resources and Healthy Life Expectancy: A Descriptive Study across Secondary Medical Areas in Japan. Int. J. Environ. Res. Public Health 2020, 17, 6301. [Google Scholar] [CrossRef]
- Kato, D.; Ryu, H.; Matsumoto, T.; Abe, K.; Kaneko, M.; Ko, M.; Irving, G.; Ramsay, R.; Kondo, M. Building primary care in Japan: Literature review. J. Gen. Fam. Med. 2019, 20, 170–179. [Google Scholar] [CrossRef] [PubMed] [Green Version]
- Survey on Dynamics of the Medical Institution 2019. Available online: https://www.mhlw.go.jp/toukei/saikin/hw/iryosd/m19/dl/is1905_01.pdf (accessed on 10 November 2021).
- Annual Report on the Ageing Society [Summary] FY2021. Available online: https://www8.cao.go.jp/kourei/english/annualreport/2021/pdf/2021.pdf (accessed on 12 November 2021).
- Comprehensive Survey of Living Conditions—Health Status of Household Members 2019. Available online: https://www.mhlw.go.jp/toukei/saikin/hw/k-tyosa/k-tyosa19/dl/04.pdf (accessed on 12 November 2021).
- Yoon, C.-J. Between the Ideal and Reality of City Resizing Policy: Focused on 25 Cases of Compact City Plans in Japan. Sustainability 2020, 12, 989. [Google Scholar] [CrossRef] [Green Version]
- Nishira, S.; Kobayashi, T. Adopting Some Measures to Make More Compact Urban Area through Urban Facility Relocation Policy. J. Archit. Plan. (Trans. AIJ) 2020, 85, 1459–1467. [Google Scholar] [CrossRef]
- World Population Ageing 2020 Highlights–Living Arrangements of Older Persons. Available online: https://www.un.org/development/desa/pd/sites/www.un.org.development.desa.pd/files/undesa_pd-2020_world_population_ageing_highlights.pdf (accessed on 11 April 2022).
- Levine, J. A century of evolution of the accessibility concept. Transp. Res. Part D Transp. Environ. 2020, 83, 102309. [Google Scholar] [CrossRef]
- Penchansky, R.; Thomas, J.W. The concept of access: Definition and relationship to consumer satisfaction. Med. Care 1981, 19, 127–140. Available online: http://0-www-jstor-org.brum.beds.ac.uk/stable/3764310 (accessed on 20 October 2021). [CrossRef] [PubMed]
- Morris, J.M.; Dumble, P.L.; Wigan, M.R. Accessibility indicators for transport planning. Transp. Res. Part A Gen. 1979, 13, 91–109. [Google Scholar] [CrossRef]
- Vulevic, A. Accessibility concepts and indicators in transportation strategic planning issues: Theoretical framework and literature review. Logist. Sustain. Transp. 2016, 7, 58–67. [Google Scholar] [CrossRef] [Green Version]
- Xu, Y.; Olmos, L.E.; Abbar, S.; González, M.C. Deconstructing laws of accessibility and facility distribution in cities. Sci. Adv. 2020, 6, eabb4112. [Google Scholar] [CrossRef] [PubMed]
- Guagliardo, M.F. Spatial accessibility of primary care: Concepts, methods and challenges. Int. J. Health Geogr. 2004, 3, 3. [Google Scholar] [CrossRef] [Green Version]
- Páez, A.; Scott, D.M.; Morency, C. Measuring accessibility: Positive and normative implementations of various accessibility indicators. J. Transp. Geogr. 2012, 25, 141–153. [Google Scholar] [CrossRef]
- Apparicio, P.; Abdelmajid, M.; Riva, M.; Shearmur, R. Comparing alternative approaches to measuring the geographical accessibility of urban health services: Distance types and aggregation-error issues. Int. J. Health Geogr. 2008, 7, 7. [Google Scholar] [CrossRef] [PubMed] [Green Version]
- Hewko, J.; Smoyer-Tomic, K.E.; Hodgson, M.J. Measuring neighbourhood spatial accessibility to urban amenities: Does aggregation error matter? Environ. Plan. A 2002, 34, 1185–1206. [Google Scholar] [CrossRef]
- Chen, X.; Jia, P.F. A comparative analysis of accessibility measures by the two-step floating catchment area (2SFCA) method. Int. J. Geogr. Inf. Sci. 2019, 33, 1739–1758. [Google Scholar] [CrossRef]
- Luo, W.; Wang, F. Measures of spatial accessibility to health care in a GIS environment: Synthesis and a case study in the Chicago region. Environ. Plan. B Plan. Des. 2003, 30, 865–884. [Google Scholar] [CrossRef] [PubMed] [Green Version]
- Luo, W. Using a GIS-based floating catchment method to assess areas with shortage of physicians. Health Place 2004, 10, 1–11. [Google Scholar] [CrossRef]
- McGrail, M.R. Spatial accessibility of primary health care utilising the two step floating catchment area method: An assessment of recent improvements. Int. J. Health Geogr. 2012, 11, 50. [Google Scholar] [CrossRef] [PubMed] [Green Version]
- Mao, L.; Nekorchuk, D. Measuring spatial accessibility to healthcare for populations with multiple transportation modes. Health Place 2013, 24, 115–122. [Google Scholar] [CrossRef] [PubMed]
- Telega, A.; Telega, I.; Bieda, A. Measuring Walkability with GIS—Methods Overview and New Approach Proposal. Sustainability 2021, 13, 1883. [Google Scholar] [CrossRef]
- Zhu, X.; Lee, C. Walkability and Safety Around Elementary Schools: Economic and Ethnic Disparities. Am. J. Prev. Med. 2008, 34, 282–290. [Google Scholar] [CrossRef]
- Luo, W.; Whippo, T. Variable catchment sizes for the two-step floating catchment area (2SFCA) method. Health Place 2012, 18, 789–795. [Google Scholar] [CrossRef]
- Shen, Y.; Du, Q.; Li, L. Spatial accessibility analysis of education resources by modified floating catchment area methods. Sci. Surv. Mapp. 2016, 41, 122–126. [Google Scholar] [CrossRef]
- Liu, S.; Qin, Y.; Xu, Y. Inequality and Influencing Factors of Spatial Accessibility of Medical Facilities in Rural Areas of China: A Case Study of Henan Province. Int. J. Environ. Res. Public Health 2019, 16, 1833. [Google Scholar] [CrossRef] [Green Version]
- Wolny, A.; Ogryzek, M.; Źróbek, R. Towards Sustainable Development and Preventing Exclusions—Determining Road Accessibility at the Sub-Regional and Local Level in Rural Areas of Poland. Sustainability 2019, 11, 4880. [Google Scholar] [CrossRef] [Green Version]
- Research on Housing and Living Environment for the Elderly: Summary of Survey Results 2018. Available online: https://www8.cao.go.jp/kourei/ishiki/h30/zentai/pdf/s2.pdf (accessed on 1 January 2022).
- Moran, P.A.P. Notes on continuous stochastic phenomena. Biometrika 1950, 37, 17–23. [Google Scholar] [CrossRef] [PubMed]
- Anselin, L. Local indicators of spatial association-LISA. Geogr. Anal. 1995, 27, 93–115. [Google Scholar] [CrossRef]
- Shi, J.; Miao, W.; Si, H.; Liu, T. Urban Vitality Evaluation and Spatial Correlation Research: A Case Study from Shanghai, China. Land 2021, 10, 1195. [Google Scholar] [CrossRef]
- Tanaka, T.; Rhu, S.; Nishigaki, M.; Hasimoto, M. Methodological approaches on medical care planning from the viewpoint of a geographical allocation model: A case study on South Tama district. Soc. Sci. Med. Part D Med. Geogr. 1981, 15, 83–91. [Google Scholar] [CrossRef]
- Present State and Future of Medical Supply System in the Region-Data by Prefecture and Secondary Medical Zone. Available online: https://www.jmari.med.or.jp/download/wp323_data/intro.pdf (accessed on 10 January 2022).
- Allam, Z.; Nieuwenhuijsen, M.; Chabaud, D.; Moreno, C. The 15-minute city offers a new framework for sustainability, liveability, and health. Lancet Planet. Health 2022, 6, e181–e183. [Google Scholar] [CrossRef]
- Calafiore, A.; Dunning, R.; Nurse, A.; Singleton, A. The 20-minute city: An equity analysis of Liverpool City Region. Transp. Res. Part D Transp. Environ. 2022, 102, 103111. [Google Scholar] [CrossRef]
- Malý, J. Questioning territorial cohesion: (Un)equal access to services of general interest. Pap. Reg. Sci. 2018, 97, 323–343. [Google Scholar] [CrossRef]
- Sá Marques, T.; Saraiva, M.; Ribeiro, D.; Amante, A.; Silva, D.; Melo, P. Accessibility to services of general interest in polycentric urban system planning: The case of Portugal. Eur. Plan. Stud. 2020, 28, 1068–1094. [Google Scholar] [CrossRef]
- Yang, T.; Jin, Y.; Yan, L.; Pei, P. Aspirations and realities of polycentric development: Insights from multi-source data into the emerging urban form of Shanghai. Environ. Plan. B Urban Anal. City Sci. 2019, 46, 1264–1280. [Google Scholar] [CrossRef]
- Spreafico, C.; Russo, D. Exploiting the Scientific Literature for Performing Life Cycle Assessment about Transportation. Sustainability 2020, 12, 7548. [Google Scholar] [CrossRef]
- de Bortoli, A.; Christoforou, Z. Consequential LCA for territorial and multimodal transportation policies: Method and application to the free-floating e-scooter disruption in Paris. J. Clean. Prod. 2020, 273, 122898. [Google Scholar] [CrossRef]
Figure 1.
Location of the study area, Fukuoka city, and the Designated Cities.

Figure 2.
Distribution of the population in Fukuoka City at the chome level and the location of the clinics.
Figure 2.
Distribution of the population in Fukuoka City at the chome level and the location of the clinics.

Figure 3.
Spatial accessibility of primary medical facilities in Fukuoka city using the fixed catchment.
Figure 3.
Spatial accessibility of primary medical facilities in Fukuoka city using the fixed catchment.

Figure 4.
The sizes of HCAs and PCAs. (a) HCAs for clinic locations; (b) PCAs for the population locations.
Figure 4.
The sizes of HCAs and PCAs. (a) HCAs for clinic locations; (b) PCAs for the population locations.

Figure 5.
Spatial accessibility of primary medical facilities in Fukuoka city using the variable catchments.
Figure 5.
Spatial accessibility of primary medical facilities in Fukuoka city using the variable catchments.

Figure 6.
Global spatial autocorrelation report of the accessibility.

Figure 7.
Local spatial autocorrelations of the accessibility. (a) Local Moran’s I cluster map; (b) Local Moran’s I significance map.
Figure 7.
Local spatial autocorrelations of the accessibility. (a) Local Moran’s I cluster map; (b) Local Moran’s I significance map.

Figure 8.
The proportion of population locations whether served by certain kinds of clinics in each district.
Figure 8.
The proportion of population locations whether served by certain kinds of clinics in each district.

Figure 9.
Hot spots and cold spots for the accessibility to each type of clinic.

Figure 10.
Accessibility distribution of the Type1, Type2 and Type3 high-demand areas.


Table 1.
Descriptive statistic of the primary health accessibility by district.
| District | Mean | Median | Max | Min | Std. Dev |
|---|---|---|---|---|---|
| Hakata-Ku | 1.748 | 0.780 | 18.517 | 0.000 | 2.852 |
| Jōnan-Ku | 0.908 | 0.903 | 2.308 | 0.000 | 0.547 |
| Higashi-Ku | 0.761 | 0.498 | 6.796 | 0.000 | 0.953 |
| Minami-Ku | 0.959 | 0.839 | 3.901 | 0.000 | 0.742 |
| Nishi-Ku | 0.760 | 0.431 | 4.380 | 0.000 | 0.937 |
| Sawara-Ku | 0.890 | 0.886 | 2.392 | 0.000 | 0.672 |
| Chūō-Ku | 3.132 | 1.349 | 35.107 | 0.000 | 5.737 |
| Fukuoka city | 1.263 | 0.797 | 35.107 | 0.000 | 2.474 |
Table 2.
Descriptive Statistic of the primary health accessibility with variable catchments by district.
Table 2.
Descriptive Statistic of the primary health accessibility with variable catchments by district.
| District | Mean | Median | Max | Min | Std. Dev |
|---|---|---|---|---|---|
| Hakata-Ku | 1.617 | 0.832 | 13.319 | 0.040 | 2.166 |
| Jōnan-Ku | 0.955 | 0.928 | 2.308 | 0.154 | 0.444 |
| Higashi-Ku | 0.768 | 0.581 | 4.647 | 0.000 | 0.673 |
| Minami-Ku | 0.999 | 0.889 | 3.822 | 0.097 | 0.624 |
| Nishi-Ku | 0.814 | 0.596 | 3.052 | 0.003 | 0.630 |
| Sawara-Ku | 0.872 | 0.864 | 2.371 | 0.000 | 0.579 |
| Chūō-Ku | 2.853 | 1.302 | 28.502 | 0.083 | 4.636 |
| Fukuoka city | 1.224 | 0.827 | 28.502 | 0.000 | 1.975 |
Table 3.
Descriptive Statistic of quantity and types of clinics in population catchment areas.
| Quantity of Clincis | Clinic Types | |||||||
|---|---|---|---|---|---|---|---|---|
| District | Mean | Max | Min | Std. Dev | Mean | Max | Min | Std. Dev |
| Hakata-Ku | 14.256 | 64 | 4 | 9.247 | 5.108 | 8 | 1 | 1.564 |
| Jōnan-Ku | 10.859 | 21 | 4 | 3.699 | 4.891 | 7 | 1 | 1.296 |
| Higashi-Ku | 7.355 | 26 | 0 | 4.184 | 3.544 | 8 | 0 | 1.672 |
| Minami-Ku | 11.247 | 38 | 3 | 5.927 | 4.87 | 8 | 2 | 1.745 |
| Nishi-Ku | 9.5108 | 27 | 1 | 5.176 | 5.237 | 8 | 1 | 1.943 |
| Sawara-Ku | 9.509 | 29 | 0 | 6.634 | 4.279 | 8 | 0 | 2.196 |
| Chūō-Ku | 25.066 | 136 | 3 | 21.302 | 6.213 | 8 | 1 | 1.501 |
| Fukuoka city | 12.038 | 136 | 0 | 10.561 | 4.758 | 8 | 0 | 1.911 |
Table 4.
Quantity and complexity classification about the medical service of PCA.
| Complexity of the Departments | |||||
|---|---|---|---|---|---|
| Quantity of Clinics | Level | 1 | 2 | 3 | 4 |
| 1 | 129 | 112 | 29 | -- | |
| 2 | 22 | 147 | 153 | 8 | |
| 3 | -- | 45 | 137 | 62 | |
| 4 | -- | 6 | 83 | 152 | |
Publisher’s Note: MDPI stays neutral with regard to jurisdictional claims in published maps and institutional affiliations. |
© 2022 by the authors. Licensee MDPI, Basel, Switzerland. This article is an open access article distributed under the terms and conditions of the Creative Commons Attribution (CC BY) license (https://creativecommons.org/licenses/by/4.0/).
Share and Cite
MDPI and ACS Style
Du, M.; Zhao, S. An Equity Evaluation on Accessibility of Primary Healthcare Facilities by Using V2SFCA Method: Taking Fukuoka City, Japan, as a Case Study. Land 2022, 11, 640. https://0-doi-org.brum.beds.ac.uk/10.3390/land11050640
AMA Style
Du M, Zhao S. An Equity Evaluation on Accessibility of Primary Healthcare Facilities by Using V2SFCA Method: Taking Fukuoka City, Japan, as a Case Study. Land. 2022; 11(5):640. https://0-doi-org.brum.beds.ac.uk/10.3390/land11050640
Chicago/Turabian StyleDu, Mengge, and Shichen Zhao. 2022. "An Equity Evaluation on Accessibility of Primary Healthcare Facilities by Using V2SFCA Method: Taking Fukuoka City, Japan, as a Case Study" Land 11, no. 5: 640. https://0-doi-org.brum.beds.ac.uk/10.3390/land11050640
Note that from the first issue of 2016, this journal uses article numbers instead of page numbers. See further details here.