Article

Large-Scale Automatic Vessel Monitoring Based on Dual-Polarization Sentinel-1 and AIS Data

1
Luxembourg Institute of Science and Technology (LIST), Environmental Research and Innovation Department (ERIN), venue des Hauts-Fourneaux, 4362 Esch-sur-Alzette, Luxembourg
2
LuxSpace Sàrl, 9 Rue Pierre Werner, 6832 Betzdorf, Luxembourg
*
Author to whom correspondence should be addressed.
Current address: 41, rue du Brill, Belvaux, Luxembourg.
Submission received: 28 February 2019 / Revised: 30 April 2019 / Accepted: 1 May 2019 / Published: 7 May 2019
(This article belongs to the Special Issue Remote Sensing of Target Detection in Marine Environment)

Abstract

:
This research addresses the use of dual-polarimetric descriptors for automatic large-scale ship detection and characterization from synthetic aperture radar (SAR) data. Ship detection is usually performed independently on each polarization channel and the detection results are merged subsequently. In this study, we propose to make use of the complex coherence between the two polarization channels of Sentinel-1 and to perform vessel detection in this domain. Therefore, an automatic algorithm, based on the dual-polarization coherence, and applicable to entire large scale SAR scenes in a timely manner, is developed. Automatic identification system (AIS) data are used for an extensive and also large scale cross-comparison with the SAR-based detections. The comparative assessment allows us to evaluate the added-value of the dual-polarization complex coherence, with respect to SAR intensity images in ship detection, as well as the SAR detection performances depending on a vessel’s size. The proposed methodology is justified statistically and tested on Sentinel-1 data acquired over two different and contrasting, in terms of traffic conditions, areas: the English Channel the and Pacific coastline of Mexico. The results indicate a very high SAR detection rate, i.e., >80%, for vessels larger than 60 m and a decrease of detection rate up to 40 % for smaller size vessels. In addition, the analysis highlights many SAR detections without corresponding AIS positions, indicating the complementarity of SAR with respect to cooperative sources for detecting dark vessels.

1. Introduction

Nowadays, over 80% of the world’s trade is carried out by vessels navigating daily across the globe [1]. Therefore, the security and safety of maritime transportation is essential to ensure the international shipping of goods. At the same time, the maritime traffic is threatened by piracy attacks and other illegal activities such as drug trafficking, unreported and unregulated fishing or illegal immigration. In this context, maritime surveillance (MS), defined as the ability to monitor multiple sea activities, ranging from safe and secure transportation to illegal fishery, piracy or embargo breaches, permits us to create a comprehensive awareness of the maritime domain. MS is usually made possible by integrating information extracted from various data sources including space-based sensors, land-based surveillance stations or in-situ observations. This information allows us to localize and track ships at a large scale in a timely manner. The MS data sources are generally divided in cooperative and non-cooperative systems. Examples of cooperative systems that rely on vessels to report their localization are the automatic identification system (AIS), the satellite AIS (Sat-AIS) or the vessel monitoring system (VMS). Non-cooperative systems that allow to localize vessels regardless of their agreement, include active and passive sensors onboard spaceborne or airborne platforms. Synthetic aperture radar (SAR) sensors occupy a privileged position in the non-cooperative systems due to their quasi all-weather and day/night observation capability. Ship detection applications based on SAR data have multiplied in the last decade, their importance being supported by the commercial sector, as mentioned in [2].
SAR imagery are widely used to monitor the maritime domain and various SAR-based applications such as ship detection or oil spill delineation are available as operational services integrated into near-real-time processing chains [3,4,5,6]. Along with operational applications, a vast scientific literature has evaluated the potential of SAR imagery for detecting vessels [7,8]. Generally, in SAR imagery, ships appear as bright points associated to high backscattering values while the surrounding smooth water surfaces (i.e., sea clutter) appear as dark areas characterized by low backscattering values. A variety of methods ranging from adaptive thresholding algorithms to wavelet- or machine learning-based approaches have been proposed in the literature in order to detect these bright targets. Whereas the majority of vessel detection methods exploit the SAR amplitude or intensity data, the SAR phase is commonly used for the retrieval of Doppler parameters corresponding to moving targets. Classical thresholding methods such as the constant false alarm rate (CFAR) detector, are derived with respect to the statistical distribution of the sea clutter. Depending on the SAR imaging mode and the equivalent number of looks, the SAR amplitude and intensity are characterized by different statistical distributions as summarized in [9]. For instance, the SAR amplitude is characterized by a Rayleigh distribution [10] while the intensity is assumed to be distributed according to a Gamma [11] or K [12] distribution. For SAR multi-looked images processed with a sufficiently high number of looks, the intensity follows a Gaussian distribution [13]. Therefore, one of the most common versions of the CFAR is based on the Gaussian distribution [14]. Other studies employ the Gamma [15,16] or the K [5,17] distribution for CFAR methods adapted to non-homogeneous areas. Other CFAR approaches exploit alpha-stable models [18], super-pixel topologies [19] or generalized Gamma distributions [20]. In addition, non-parametric models of the sea clutter, that allow us to fit real SAR data more precisely, are also used to compute the threshold for adaptive algorithms [21,22]. Other ship detection methods rely on the use of the discrete wavelets transforms [23] or standard deviation-based filters [24]. Alternatively, machine learning based approaches are also able to efficiently detect ships from SAR imagery. Such techniques include deep neural networks [25], graph signal processing [26], artificial neural networks (ANN) and support vector machine (SVM) [27] methods.
In addition to the above mentioned research studies, highly relevant research questions emerged from the recent advances in SAR imaging capabilities, and new satellite-based MS services are triggered by the higher time sampling rates provided by new satellite constellations. A prime example is the Sentinel-1 SAR mission [28] which has as main assets: an open access data policy, three to six days systematic revisit time depending on the geographical region and multiple acquisition modes. Additional and highly complementary assets for MS derive from other SAR sensors such as the COSMOSkyMed (CSK) [29] or the TerraSAR-X and TanDEM-X [30] satellite constellations, providing images with spatial resolutions down to one meter and a revisit time of 12 hours. These characteristics allow us to advance MS by unlocking the full potential of satellite earth observation (EO) for large scale, systematic and rapid vessel detection.
One key characteristic of Sentinel-1 images deserving attention for vessel detection is the availability of dual polarization data. The dual polarized antenna allows transmitting one single, but selectable, polarization (H or V) and receiving simultaneously both H and V polarizations. The Sentinel-1 images over areas of maritime interest are primarily acquired in the VV-VH polarimetric configuration. Vessels imaged by such sensors, present distinctive polarization signatures, i.e., different backscattering values depending on the polarization channel. The complex Sentinel-1 images can lead to different polarimetric parameters that are of interest for SAR-based ship detection. For instance, in [31] the polarimetric Notch filter [32] is adapted for the dual-polarization case which is well suited for processing the data generated by Sentinel-1. Other studies [33,34], apply a thresholding operation on the coherence between co- and cross-polarization channels in order to detect the vessels. In addition, the polarimetric diversity has demonstrated its effectiveness in ship detection through several algorithms based on full (quad) polarimetric SAR data [35,36,37]. Such algorithms allow us to detect vessels in complex clutter scenarios, while reducing the number of false alarms with respect to single polarization based algorithms.
The high revisit time of Sentinel-1 provides access to large collections of SAR data. Large datasets are necessary to perform a comprehensive analysis of SAR-based detection capabilities and performances. Such an analysis is performed in [22,38] by using SAR images acquired by different sensors including Sentinel-1, but also Radarsat-2 and CSK, together with AIS data flows as ground truth. A large number of Sentinel-1 images (more than 10,000) is employed in [39] for performing a SAR-AIS cross-comparison study over the Mediterranean sea. Another study that makes use of the large Sentinel-1 dataset in order to create a benchmarking SAR-AIS dataset is presented in [40].
In this paper, we address two main research objectives: (i) to develop a new detection algorithm based on the dual polarimetric coherence and (ii) to evaluate the detection performances as a function of the vessels size, at a large scale. Therefore, the developed method exploits the particular characteristics of Sentinel-1, namely the dual polarization capability and the systematic acquisition of images. First, we propose to use the polarimetric complex coherence between the co- and cross- channel, instead of the intensity, to perform vessel detection. Although the capability to detect vessels in the dual polarization coherence domain has been demonstrated in previous studies [34,41], this feature has not been used so far in automatic detection chains, processing large datasets systematically and in a timely manner. Generally, automatic processing algorithms require us to perform the detection over an entire SAR frame, that usually covers large geographical areas. For instance, Sentinel-1 images acquired in the Interferometric Wide Swath (IW) mode, representing the most relevant mode for the MS domain, cover a 250 km swath area. Moreover, the spatial resolution of single look complex (SLC) images is 5 m × 20 m (range × azimuth), resulting in images of large size. Even if such large size Sentinel-1 images are associated with complex computational resources, in this study we aim to demonstrate that processing the dual-polarization complex data for ship detection is efficiend and worth. In this framework, we propose a dual-polarization coherence-based detection algorithm that can be applied to large scale SAR scenes. Our first assumption is that the ratio between the vessel signatures and the sea clutter presents high values in the coherence domain, thereby enabling a detection of vessels by applying a thresholding operation. We propose to employ the non-normalized coherence which is affected by the attenuation due to the scene-antenna distance. Therefore, for an entire SAR scene, the values of the coherence for both vessels and sea clutter vary with the range of the incidence angle, decreasing across each SAR swath from near to far range. In order to cope with this effect, we then define an adaptive threshold value for each SAR image sub-swath (i.e., three for the IW mode of Sentinel-1) in order to detect the vessels. This allows adapting the selection of the threshold as the dual-polarization coherence varies with the incidence angle and, therefore, perform a more reliable detection. The proposed algorithm can be implemented for near real time (NRT) scenarios by making use of ESA’s Thematic Exploitation Platforms (TEPs) [42] or the European Commission’s Data and Informaton Access Service (DIAS) [43]. As a second research objective, we perform an quantitative and qualitative analysis of the dual-polarization-based ship detection and cross-compare it with SAR intensity-based results and AIS data flows. This comparison allows us to investigate the performances of dual-polarization-based algorithm with respect to the intensity-based detections and to the vessel’s size extracted from AIS data, for a large number of targets. The analysis of the experimental results is drawn from two case studies containing datasets acquired over two different geographical areas. The first one focuses on the English Channel, as an example of a dense maritime traffic area, while the second one focuses on the Mexican marine areas, containing both dense and sparse maritime traffic with reduced AIS monitoring.
The paper is organized in four parts: Section 2 presents the theoretical aspects. Section 3 describes the employed datasets and presents the experimental results. Section 4 contains an extended discussion of the experimental analysis. Finally, Section 5 gives the conclusions.

2. Materials and Methods

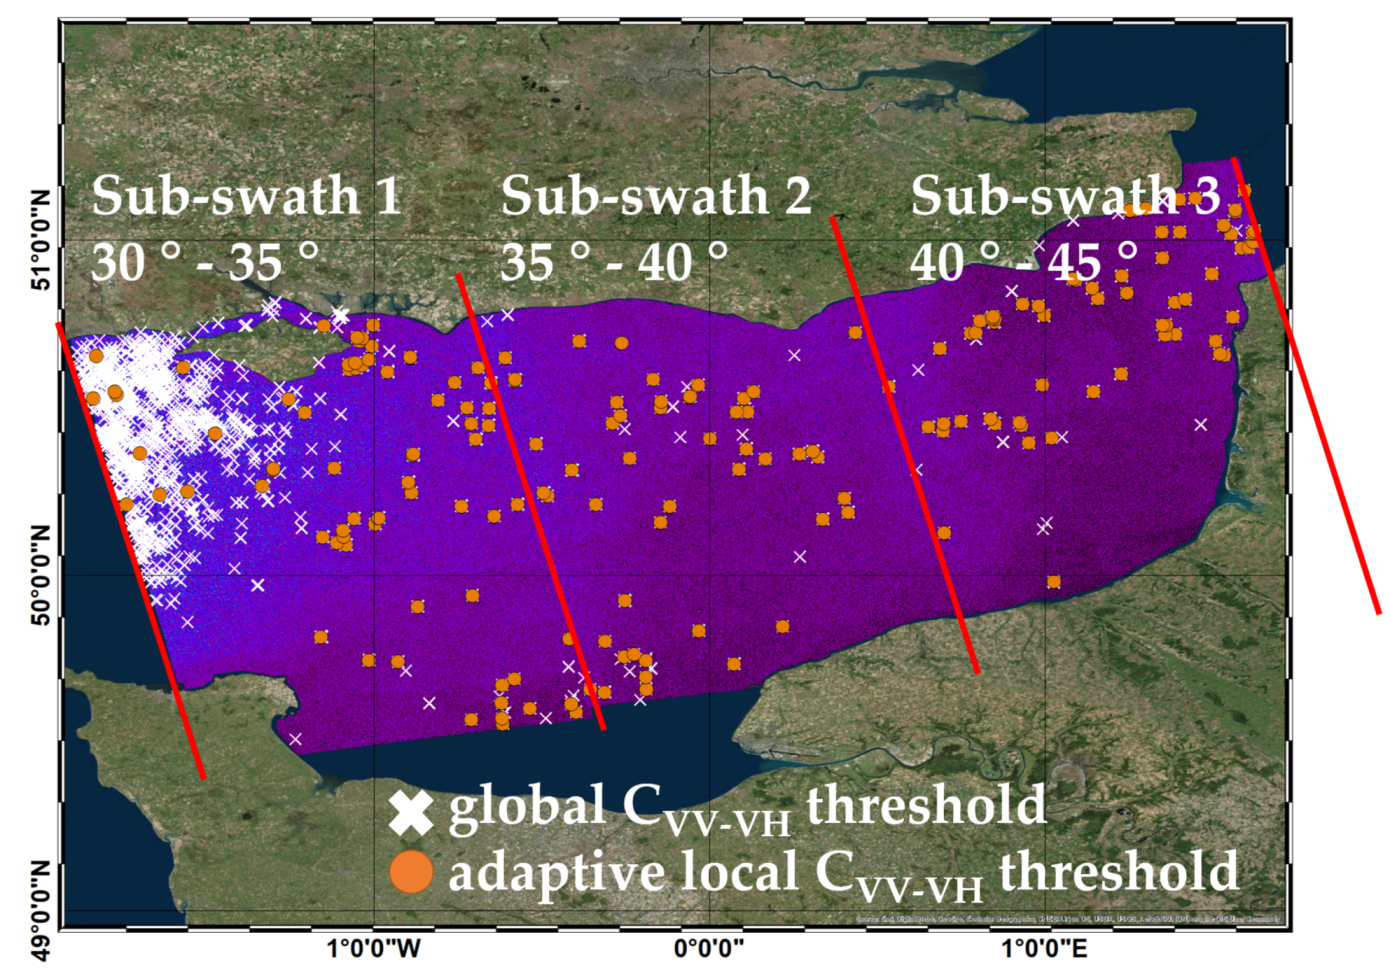
2.1. Sentinel-1 Dual-Polarization Characteristics

The Sentinel-1 mission, developed under the Copernicus Programme, is a constellation of two satellites (A and B units) each carrying an imaging C-band SAR sensor that acquires systematically dual-polarization data. Dual polarization SAR sensors transmit one single but selectable polarization (horizontal H or vertical V) and receive simultaneously both the transmitted polarization and its orthogonal counterpart [44,45]. For the Sentinel-1 sensor, two linear polarization cases were considered: vertical transmission with vertical and horizontal reception (VV-VH) and horizontal transmission with horizontal and vertical reception (HH-HV). The default polarimetric combination for Sentinel-1 images acquired over areas of maritime interest is (VV-VH). This combination was considered in the algorithms and experimental analysis presented in this study. As demonstrated in the scientific literature [37,46], for SAR incidence angles in the range of 30 to 45 which are characteristic for Sentinel-1 IW, vessels generally exhibited higher backscattering values in the co-polarization channel (VV), while in the cross-polarization channel (VH) the backscattering values were lower. However, in the VH channel, the sea clutter, being comparable to the instrument noise floor, was typically characterized by very low energy values in comparison with the VV channel [47,48]. Therefore, the signal to clutter ratio of the VH channel presents higher values than the one of the VV channel, making the former channel theoretically better suited for vessel detection.
Another valuable characteristic of SAR data for ship detection and characterization is the phase information that can be extracted from SLC images. For the vessel signatures, as well as for the sea clutter, the phase values provided supplementary backscattering information with respect to the one contained in the amplitude. The phase information was able to retain the features that characterize the backscatter originating from the vessel’s motions and its interaction with the surrounding sea. The scattering of vessels was a complex mechanism that included double-bounce scattering originating from metallic structures and multiple reflections between the sea and the targets [49,50,51]. Moreover, such mechanisms present different behaviours depending on the SAR polarization. For instance, the co-polarization channel was influenced mostly by the double bounce effect while the cross-polarization channel is more sensitive to the multiple-bounce. Therefore, the complex co- and cross-polarization SAR vessel signatures provide complementary information, thereby enabling for a more complete characterization of a target.

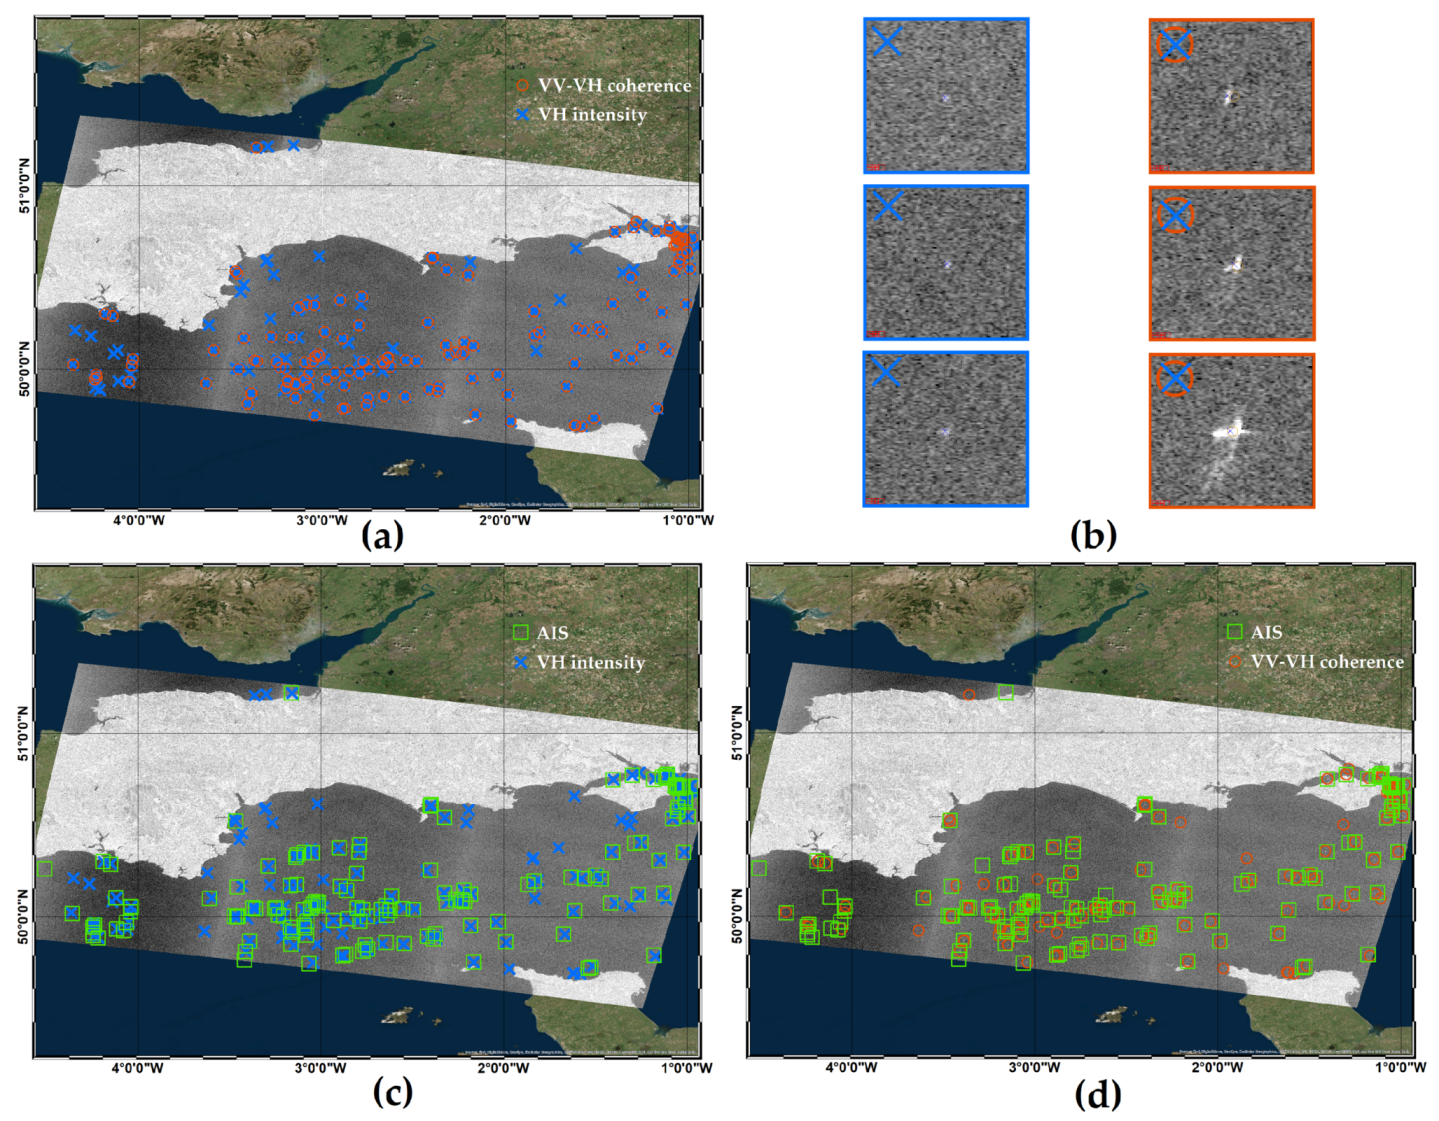
2.2. Dual-Polarization Ship Detection Algorithm

In order to benefit from the dual-polarization characteristics we propose to merge the complex co- and cross-polarization channels for an improved vessel detection from SAR imagery. The availability of complex dual-polarization data allows us to extract different polarimetric features (e.g., coherence, eigenvalue decompositions, etc.) based on the elements of covariance matrix. For the dual-polarization basis (VV-VH), the 2 × 2 Hermitian covariance matrix is defined as follows:
C 2 = < | S V V | 2 > < S V V S V H > < S V H S V V > < | S V H | 2 > ,
where < · > represents the ensemble average function and the complex conjugate. S V V and S V H denote the dual-polarization complex SAR images. The ensemble average is usually estimated over a sliding window (average kernel) of a size equal to k × k pixels. The complex off-diagonal element, denoted in this study as the non-normalized coherence, is defined as the channel correlation among the co- and cross-polarization images given in Equation (2) [52]. This study makes use of the coherence magnitude as indicated in Equation (2).
C V V V H u n n o r m = < S V V S V H > = < S V H S V V > .
As demonstrated in [41], C V V V H u n n o r m allows to measure the reflection symmetry of the SAR scene. Under the hypothesis that the sea clutter is a natural distributed target, i.e., reflection symmetric target, the expected values of C V V V H u n n o r m for this class are very low. On the contrary, for man-made structures such as vessels, the assumption of reflection symmetry is no longer valid and this results in values of C V V V H u n n o r m significantly higher to those of the sea clutter. Under these circumstances, the C V V V H u n n o r m presents a high target-to-clutter ratio with respect to the individual intensity channels, and is consequently suited for the detection of vessels as denoted in [34,41] for the reflection symmetry approach. As demonstrated in the scientific literature, the dual-polarization coherence presents high values of the ratio between the targets and the sea clutter making a thresholding operation in this domain suitable for detecting the vessels. Based on these considerations, in this study, we propose to extend the dual-polarization coherence thresholding technique in order to reduce its dependency on the incidence angle and to make it suitable for large swath width SAR images. To this end, we propose to apply an adaptive threshold to C V V V H u n n o r m by considering the variability of the incidence angle. In practice, SAR SLC images are constituted of 2D arrays of a size superior to 10,000 pixels in both dimensions, i.e., azimuth and range. For such large scenes, the values of C V V V H u n n o r m change gradually in the range direction as a consequence of the incidence angle characteristics, as observed in Figure 1. The SAR backscattering exhibits variations depending on the near to far range of incidence angle and normalization operations considering the incidence angle values are necessary for different applications, including also oceanographic ones [53,54]. In this study, we detected the vessels by thresholding the values of C V V V H u n n o r m . In order to consider the variations of C V V V H u n n o r m we proposed to apply an adaptive thresholding approach that defines the threshold values at a local level depending on the range values of the incidence angle. The ScanSAR mode, which is widely used for maritime surveillance due to its capabilities of covering large areas (from 100 km up to 500 km), is characterized by narrow incidence angle ranges for each image sub-swath. The Sentinel-1 terrain observation with progressive scans SAR (TOPSAR) acquisition mode captures three image sub-swath for IW images and five image sub-swath for extra wide swath (EW) images with variations of up to 5 of the incidence angle per swath. In this study, we assumed that the variations of C V V V H u n n o r m over the sea clutter remained constant for each image sub-swath. Therefore, a threshold value T was defined for each image sub-swath as a function of the C V V V H u n n o r m first and second order statistics (i.e., mean and variance) over the sea clutter areas. Therefore, the dual polarization-based detector is defined as follows:
if C V V V H u n n o r m ( i s w a t h , j s w a t h ) T ( μ s w a t h s e a c l u t t e r , σ s w a t h s e a c l u t t e r ) , then detect target ,
where i s w a t h and j s w a t h represent the pixel indexes for each image sub-swath, μ s w a t h s e a c l u t t e r and σ s w a t h s e a c l u t t e r are the sea clutter mean and variance. As indicated previously, the objective of this work is to define an operational vessel detection algorithm, based on C V V V H u n n o r m , enabling the processing of large swath width SAR images in a timely manner. As detailed in Section 1, many research efforts have focused on adapting to the statistics of the SAR images intensity sea clutter to optimize vessel detection, considering for instance: Rayleigh or gamma pdfs, K-distribution pdf or generalized gamma pdf. In case of homogeneous areas, SAR image statistics are governed by the Gaussian pdf, and the variance of the data is fully explained by the multiplicative speckle noise model [55]. Nevertheless, in the presence of data texture or heterogeneous areas, as it may happen in sea surfaces [56], the multiplicative speckle noise model was unable to account for the increase in the data variability, especially in terms of longer pdf tails, so more complex statistical models need to be considered [57]. In addition to this consideration of more complex statistical models, in our case, we need to adapt to the statistics of C V V V H u n n o r m , and not to the intensity statistics. The statistics of the complex covariance matrix are difficult to obtain, even under the Gaussian scattering assumption [58,59]. Consequently, to consider complex statistics in terms of the covariance matrix, and specifically in terms of C V V V H u n n o r m , would add a large computational burden which would be not acceptable when addressing an operational processing of large SAR images in a timely manner. Despite this complexity, we considered it necessary to adapt to this variability. Hence we proposed to define the threshold values of each sub-swath as follows:
T ( μ s w a t h s e a c l u t t e r , σ s w a t h s e a c l u t t e r ) = μ s w a t h s e a c l u t t e r + f × σ s w a t h s e a c l u t t e r , 6 < f < 12 .
In the case of Gaussian statistics, i.e., Rayleigh pdf for SAR images amplitude and Gamma pdf for the intensity, f is usually set to three to account for 99.7 % of the sea clutter. However, we propose to increase this factor to a value comprised between 6 and 12 to account for the excess of variability not explained by the Gaussian scattering assumption. Larger values of f could be foreseen in cases with extreme sea state. The simplicity of the thresholding process makes it possible to process large SAR images in a timely manner. Figure 1 shows the difference in ship detection performance with or without adapting the threshold value to the local image swath. We can notice that if we applied a global threshold there are many false detections, especially in the near range part of the SAR image, as the values of the coherence for both vessels and sea clutter, vary with the range of the incidence angle. However, if we considered the proposed adaptive threshold, we can observe that the false detections were removed.
Following the detection step, all the pixels that satisfy the thresholding condition are afterwards clustered into target-objects by considering the spatial resolution of the SAR images and the maximum and minimum possible sizes of a vessel. As described in [7], the clustering algorithms employed in vessel detection chains include thresholding approaches followed by a cluster growing procedure, morphological-based operations or target extractions that fit a Gaussian profile. In this study, we propose to apply a segmentation technique based on the k-nearest neighbours that allows clustering the detected pixels into objects. The minimum number of pixels per object was set to five and objects smaller than this size are considered as sea clutter. The maximum number of pixels per object was equal to the size in pixels of the world’s longest ship in service (i.e., 450 m). Since the signature of a vessel depends on its structure and its orientation with respect to the SAR sensor, it can be represented as a fractured object which cannot be completely clustered by the segmentation. Therefore, a dilation filter is applied subsequently to the segmentation in order to regroup clusters corresponding to the same object. The entire procedure of the proposed dual-polarization detector is summarized in the pseudo-code described in Algorithm 1.
Algorithm 1: C V V V H u n n o r m -based detector.
Remotesensing 11 01078 i001

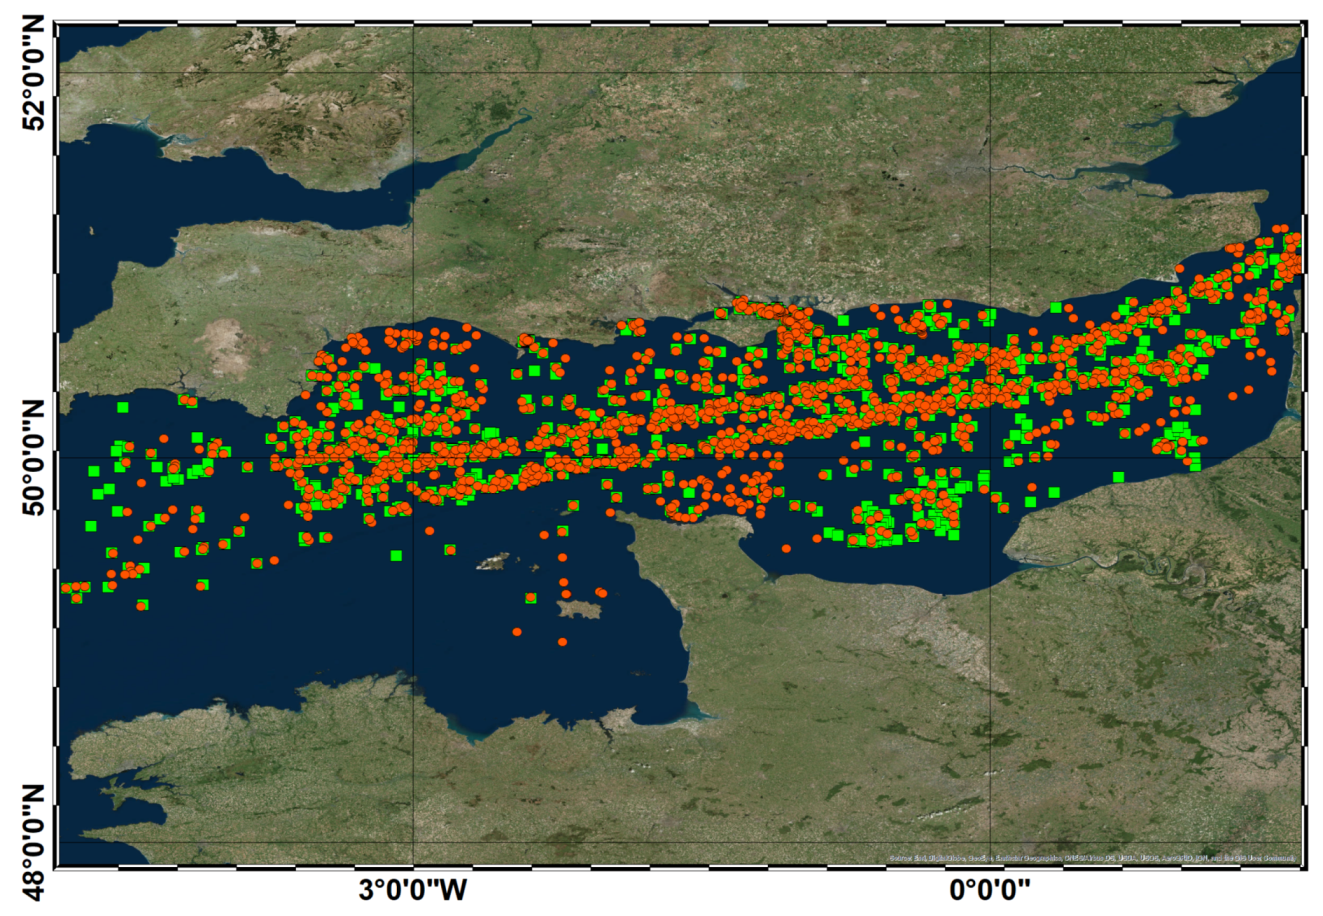
2.3. SAR and AIS Data Comparison

In order to assess the effectiveness of ship SAR-based detections, the identified targets are compared with vessel positions extracted from AIS data flows. The AIS data was collected from databases containing messages acquired by both terrestrial stations and SAT-AIS systems. Even if, according to the the International Convention for Safety of Life at Sea (SOLAS), it is required that all ships exceeding 300 tons engaged on international voyages, cargo ships of 500 tons and above not engaged on international voyages and all passenger ships were required to carry AIS transponders [60], not all existing vessels were monitored by AIS systems. In addition, AIS systems can present communication losses due to the physical limitations of their components, such as very high frequency (VHF) propagation losses or multipath effects of the signal reception. Due to these limitations, in this study we considered the AIS information as a cross-comparison datatest for the evaluation of SAR-based vessel detection results, and not as a complete ground-truth dataset.
In general, AIS transponders broadcast the position of the vessel at different time intervals ranging from two seconds for fast manoeuvring targets, to three minutes for anchored vessels [61]. However, for different scenarios including deliberate partial switch of the AIS transponder or surveillance of areas out of the reception range of terrestrial antennas, the time span between the reception of two AIS positions can be higher than three minutes. Therefore, for low frequency AIS data flows, it is not necessarly possible to extract the AIS positions at the specific SAR image acquisition time. In order to overcome this limitation and to compare SAR and AIS datasets it is necessary to first interpolate the AIS positions [22]. In case the SAR acquisition time lies between two AIS positions close in time (few seconds) a linear interpolation was sufficient while for larger gaps between the AIS positions a more complex interpolation procedure is desirable [62].
In this study, for each area of interest corresponding to the SAR image coverage, we extract the AIS ship positions for a time range of ±X minutes with respect to the SAR acquisition time, denoted hereafter t S A R . The values of X may vary for instance, from 15 min to one or even two hours depending on the traffic density or the number of terrestrial antennas in the area of interest. Under normal conditions, we receive more than one AIS position per ship during this 2 × X minutes time interval. However, as mentioned before, not all the ships are able to report AIS messages in a very short 2 × X minutes time interval (e.g., X ≤ 1 min). To overcome this difference, all AIS positions were interpolated in order to predict the position at t S A R . In this context, the following procedure is proposed. First, trajectories were extracted for ships that reported more than one position before and after t S A R , under the assumption of constant speed and heading. The closest position to t S A R from the AIS trajectory is retained for each unique vessel identified by its Maritime Mobile Service Identity (MMSI) series. The heading and speed computed between the consecutive positions for each trajectory are compared with the AIS heading and speed and heading provided by the metadata reports. If the compared numbers are similar enough, the interpolation process continues for all points and the interpolated positions corresponding to t S A R are retained for each vessel. In addition, we take into account the following two cases. For the first one, we consider that the reported positions have all timestamps before t S A R and assume that speed and heading are constant. Therefore, the ship position is predicted for a time interval equalling the difference in seconds between t S A R and the latest AIS position timestamp. For the second case, we considered that the timestamps of the AIS reported positions are after t S A R . The ship’s speed is considered constant and the heading to be applied is in the opposite direction of the one from the AIS report. The position is then re-projected for a time interval equal to the difference in seconds between both t S A R and the latest AIS position timestamp. The interpolation procedure is summarized pseudocode described in Algorithm 2.
The projected AIS positions are compared with SAR detections using an iterative methodology based on minimizing the Euclidean distance between all AIS and SAR target combinations. Several values have been considered for the maximum tolerable distance between SAR and AIS ranging from 500 m to 2 km. Closer distances increase the confidence of having a SAR-AIS matching target. For instance, in areas of dense maritime traffic, if the distance was too large, closely located vessels might be wrongly matched. For this cases, if the distance exceeds 2 km, the SAR-AIS matches are not considered reliable and therefore discarded. The non-matched AIS positions were considered as under-detections in the following analysis while the non-matched SAR targets belong to one of the following two classes: vessels that did not emit AIS messages but are present in the SAR images (dark vessels) and SAR false alarms, i.e., vessel-like SAR objects such as small rocks or noise related ambiguities.
Algorithm 2: Interpolation of automatic identification system (AIS) data flows.
Remotesensing 11 01078 i002

3. Results

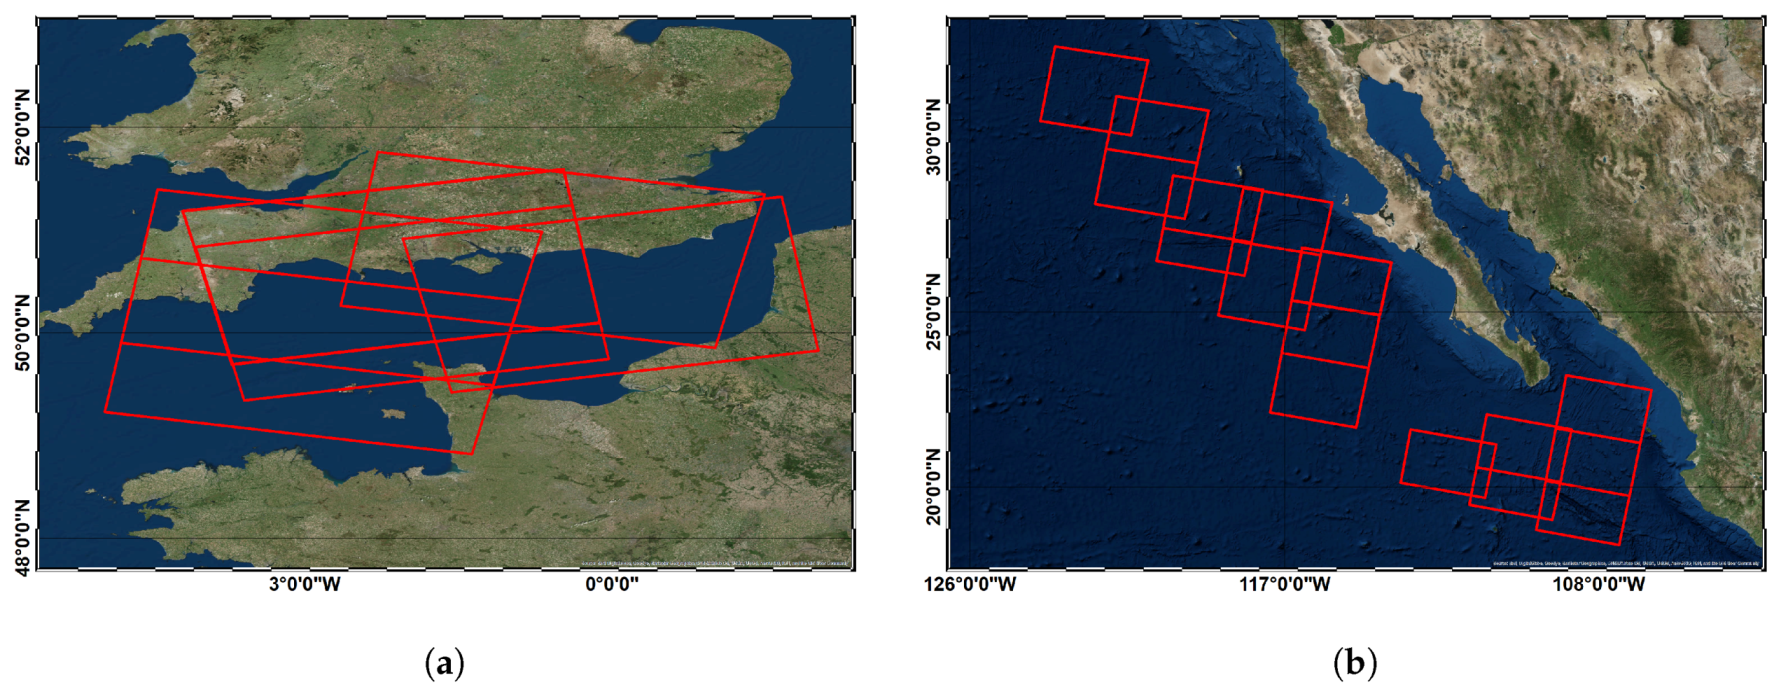
3.1. Sentinel-1 and AIS Datasets, Benchmarking Methods

For the experimental results, we analyze two case studies making use of two different AIS-SAR datasets acquired over the English Channel and the Pacific Mexican marine areas. The SAR dataset is composed of Sentinel-1 images in the interferometric wide swath (IW) mode, which is the main Sentinel-1 mode to acquire data in areas of MS interest. Table 1 summarizes the characteristics of the Sentinel-1 images for both case studies. Single Look Complex (SLC) products with a spatial resolution rg × az of approximately 5 × 20 m have been considered in order to assess the ship signatures at the sensor’s full resolution. The corresponding polarization channels are VV and VH. First, the dual-polarization algorithm described in Section 2.2 was applied to the Sentinel-1 datasets in order to carry out the SAR-based ship detection. In order to estimate the values of C V V V H u n n o r m we have employed a sliding window with a size of k × k pixels, testing different values for k ranging from 3 to 15 pixels. Based on a visual analysis of several targets of different sizes we found that the optimal value allowing to preserve small size targets while reducing the noise at the given pixel size of Sentinel-1 IW SLC images, was 5 pixels and was further utilized in this study.
In addition to the C V V V H u n n o r m -based detector, we also make use of the constant false alarm rate (CFAR) detector as a state-of-the-art method for performing the ship detection from VV and VH Sentinel-1 intensity images, I V V and I V H . The CFAR applied to intensity images is widely used in operational chains and was used as benchmarking method for our proposed dual-polarization based algorithm that aims in a similar way to process SAR images systematically and rapidly. The detector employed to this end, was a cell-averaging CFAR based on the Gaussian distribution. As a brief reminder, the CFAR algorithm compares pixels from a target cell within a sliding window, i.e., pixels under test p t e s t , to a threshold depending on the statistics of the surrounding area, i.e., background cell p b a c k g r o u n d . The threshold values are determined by considering the statistics in the background cell and the corresponding probability density function (PDF) for a desired probability of false alarm (PFA) defined as follows:
P F A = τ f ( x ) d x ,
where x ranges within the possible values of p t e s t . Once the values of τ are estimated by considering the Gaussian distribution and a given PFA, the detector is defined as a two-parameter CFAR:
p t e s t > μ b a c k g r o u n d + σ b a c k g r o u n d τ ,
where, μ b a c k g r o u n d and σ b a c k g r o u n d represent the statistical parameters of the background area, mean and respectively standard deviation. In order to respect the Gaussian distribution assumption, the VV and VH intensity image are multi-looked considering 4 × 1 looks (rg × az). For the Sentinel-1 IW images this resulted in a spatial resolution of 20 m in both range and azimuth directions. For the experimental results presented in this study we have set the PFA value to 10 5 for both VV and VH intensity channels. The two benchmarking methods are denoted in the following as CFAR I V V and I V H .
The AIS positions were extracted from AIS dataflows gathered from terrestrial AIS base station networks, as well as from satellite AIS (SAT-AIS) systems. The access to the AIS data has been provided by LuxSpace, which is the Luxembourgish industrial partner in the project that supports this study. We have compiled two AIS datasets in order to analyze the two different test cases. The first one focused on the English Channel area characterized by a very dense maritime traffic. Figure 2a depicts the frames of the Sentinel-1 images used for this case study. The corresponding AIS data are extracted within a time interval of 30 min (X = 15 min). Due to the dense maritime traffic and a large number of AIS terrestrial stations located in this area, the number of AIS positions per ship in a time range of 30 min was sufficiently high to find out if there was an AIS position for each SAR detected target. The second test case aimed at analyzing the maritime traffic in open sea areas located in the vicinity of the Pacific Mexican coastline. The location of the Sentinel-1 images used for this case study is given in Figure 2b. Due to a relatively sparse maritime traffic and a lack of AIS terrestrial stations, the corresponding AIS data were extracted within a time interval of two hours (X = 60 min). For both datasets, more than one Sentinel-1 image acquired at a different time can can correspond to a single SAR frame illustrated in Figure 2.
The experimental results were carried out using a computer with a processor i7-6800K CPU of 3.40 GHz and a memory of 64 GB. In order to process a Sentinel-1 IW image, acquired over the English Channel and containing about 200 targets, the detection algorithm took about 7 minutes for the CFAR detector that handled a GRD image of 24,720 × 12,599 (range × azimuth) pixels and about 10 minutes for the proposed detector computing the un-normalized coherence considering a SLC image of 69,009 × 13,122 (range × azimuth) pixels.

3.2. English Channel Test Case

In order to characterize the benefits of using a C V V V H u n n o r m -based technique for ship detection, a statistical analysis with a large number of targets is required. To this end, the detector described in Section 2.2 has been applied to a set of 10 S1 IW images corresponding to the English Channel test case. As mentioned in the previous section, a conventional CFAR detector has been applied to the I V V and I V H intensity channels of the corresponding intensity data, as a benchmarking method. Figure 3a presents the qualitative detection results obtained by applying the C V V V H u n n o r m -based and the CFAR I V H detectors to a selected Sentinel-1 image. In order to simplify the understanding of the presented analysis, the detection results issued from CFAR I V V are not shown in this example. The targets detected by both SAR methods represent vessels of sizes that range from small, composed of few pixels, to large, composed of many pixels with a clear signature. These targets were also characterized by backscattering values that are significantly higher than those of the sea clutter, as is illustrated in the examples shown in the right column of Figure 3b. We may also notice that the number of vessels detected by the C V V V H u n n o r m -based detector is lower than for CFAR I V H . A visual analysis of the results indicates that the additional vessels detected by CFAR I V H correspond to very small size objects (2 pixels) with low backscattering values, as it is illustrated for the signatures shown in the left column of Figure 3b. These targets can correspond to one of the following: (i) clutter-related false alarms and (ii) small-size vessels with very low backscattering values in the VV channel and implicitly of C V V V H u n n o r m . As mentioned in the previous sections, a partial validation of these targets and of all SAR detection results can be performed by using AIS data. To this end, SAR detection results were cross-compared with AIS data flows in order to evaluate the SAR detection performances and also to assess the level of correlation and complementarity between non-cooperative and cooperative MS data sources. To this end, we have employed AIS vessel positions that were interpolated as described in Section 2.3.
An iterative approach minimizing the distance between the SAR and AIS positions was employed in order to enable a meaningful comparison. The maximum tolerable distance between the SAR and AIS positions was two kilometres. Figure 4 gives the distribution of the AIS-SAR matching distance corresponding to the targets considered as matched for the English Channel case study. We can notice that half of the total number of targets were matched with a matching distance inferior to 500 m. We can notice that for distances ranging from 500 m to 2 km the number of AIS-SAR matched targets was decreasing. There were a considerable number of targets that were matched with a distance of about 1 km. This distance can be justified by the AIS interpolation inaccuracies due to missing information about the vessel speed. In addition, moving vessels were affected by a SAR Doppler shift that can also introduce inaccuracies in the AIS-SAR matching procedure, since the SAR targets were displaced from their original positions. For instance, vessels moving with about 15 knots can be displaced by about 700 m, resulting therefore in matching distances close to 1 km. Since the vessel’s speed cannot be extracted from SAR images at a large scale and the AIS vessel speed information is not always available in our dataset, for this study the correction of the SAR shift is not carried out. The number of AIS-SAR targets matched with a distance close to 2 km is very low, i.e., less than 5% of the total number of targets. These targets were associated with vessels for which the AIS messages cannot be accurately interpolated at the SAR acquisition time, e.g., a sparse number of AIS messages are available only before or after the SAR acquisition time.
Figure 3c,d present the qualitative cross-comparison results of the C V V V H u n n o r m -based detections and AIS positions and of the CFAR I V H detected vessels and AIS positions, respectively. We can notice that overall there is a high agreement between the AIS and SAR positions for both SAR detection methodologies. For the selected SAR frame, at total number of 140 AIS interpolated positions are available. After applying the AIS-SAR matching procedure, it comes out that 112 AIS positions have been matched with the C V V V H u n n o r m -based detections while for the CFAR I V H 123 AIS positions were matched. The latter correspond to small size vessels for which the C V V V H u n n o r m has low values, presumably due to the fact that the VV vessel signature was mixed with the sea clutter. These first results indicate that the detection performances were similar for the two SAR methods except for small size vessel, for which the CFAR I V H performed better. However, if we compare the number of SAR over-detections for both methodologies we observe that the number of detected targets for C V V V H u n n o r m (16) was lower than for the CFAR I V H (37). A visual analysis of these targets shows that the C V V V H u n n o r m over-detections are also detected by CFAR I V H and the majority of their signatures are similar to vessels of different sizes that were validated by the AIS. The over-detections corresponding only to CFAR I V H were small size objects of 1–2 pixels, with very low backscattering values, similar to those of the sea clutter. We argue that these correspond to false alarms rather than to dark vessels. The visual analysis confirms that at least half of the additional CFAR I V H detections corresponded to false alarms due to the clutter noise and land ambiguities generated by land structures located near the coastline. A similar analysis is carried out for two more images of the English Channel dataset and two additional images from the Mexico dataset. The results presented similarities with the ones obtained from the analysis of the image presented in Figure 3, thereby allowing to conclude with some certainty that the C V V V H u n n o r m helps in reducing the number of SAR over-detections. Thus, even if, on the one hand, the coherence seemed to have some difficulty in detecting small vessels, with a size close to the spatial resolution of the SAR sensors, on the other hand, it seems to be more robust with respect to false alarms. From this analysis, we could argue that for images with a higher spatial resolution, the coherence-based detectors could perform the best. Moreover, although the CFAR I V H detected small vessels better than C V V V H u n n o r m , its reliability was low given the comparatively high amount of false alarms. This analysis indicates that the proposed algorithm permitted us to reduce the false alarm rate which is a parameter of high importance for automatic detection chains employed in operational applications. For instance, having a high reliability for the detected ships while reducing the number of false positives allows to have a high confidence in the automatic detection performances and might reduce the human supervision of the results. Such detection chains were of interest for a systematic and automatic monitoring of the maritime traffic that does not require human intervention. Our approach provided a low number of false alarms and was robust and reliable for vessels of a size larger than the spatial resolution of the SAR image. However, if the monitoring applications were interested in vessels, with a size close to the spatial resolution of the SAR image, there was a risk not to detect them by the dual-polarization detector, triggering a number false negatives. The detection of such vessels, when possible, implies also a high number of false alarms and requires a visual inspection of the results with a certain cost for the operational applications.
Figure 5 presents jointly the SAR C V V V H u n n o r m -based detections and the AIS positions for the entire English Channel dataset. The vessel positions are extracted at different time instants corresponding to the acquisition time of the 10 Sentinel-1 SAR images. Despite the different acquisition times of the SAR images, the overlapping Sentinel-1 frames contained a sufficiently high number of targets to allow for a characterization of the maritime traffic in the English Channel area. We can observe that the dense traffic, characteristic to this area, was confirmed by both the SAR detections, as well as by the AIS positions. We can also notice that there was a strong agreement between the AIS and SAR positions for the majority of the zones. For instance, the main maritime routes characterizing the inward and outward-bound English Channel traffic, showed a strong AIS-SAR correlation. In order to analyze in more detail the AIS-SAR matching we have computed the SAR probability of detection by considering the AIS data as ground truth. Table 2 gives the number of targets resulting from the AIS-SAR matching. We can notice that more than 70% of the AIS positions have been matched with the SAR targets. The non-matched AIS targets were mostly due to the small size of the vessels (smaller than 20 m) that are hardly or not at all visible in the SAR images due to the limitations caused by the spatial resolution. When applying C V V V H u n n o r m -based technique, the SAR and AIS matched targets represented about 60% of the total number of SAR detections. The nearly 40% SAR targets with no AIS positions correspond either to dark vessels or to false alarms generated by the sea clutter. A detailed discussion about the SAR unmatched targets resulting from C V V V H u n n o r m as well as from the I V V and I V H images, will be provided in the next section.
In the following we assess the statistics issued from the AIS-SAR matched targets. Figure 6a shows the distribution of the vessel length which was extracted from the AIS data flows. This information was of high importance in order to determine which vessel types can be detected from Sentinel-1 imagery. Figure 6b gives the probability of detection as a function of the AIS vessel length. We may notice that for vessels of a size larger than 60–70 m, the detection rate presented high values, that exceeded 80%, for both the C V V V H u n n o r m -based detections as well as for the CFAR I V V and I V H results. We can notice that for vessels of sizes ranging from 100 to 200 m, the three probability of detection curves were not completely superposed. The small differences were due to the input parametrization and thresholding definition that are different for each one of the three SAR detectors. The fact that the probability of detection did not equal 100% for large size vessels is due to AIS-SAR matching inaccuracies that cannot be avoided in areas with dense traffic, such as the English Channel. Even though such scenarios rarely occur when considering this case study’s maximum matching AIS-SAR distance of two kilometres, the probability of detection can be significantly affected by matching inaccuracies when only a limited number of vessels is available for a given size range. We can notice that for smaller size vessels, the probability of detection was decreasing. Generally, small size vessels were more difficult to be detected as they represent only a few pixels due to the SAR spatial resolution limitations but also to the position of the target with respect to the line of sight of the SAR sensor. For small size vessels, CFAR I V H gives the best performances, while the coherence-based performance measures are lower and similar to those given by CFAR I V V , although as discussed before, the CFAR detector was more sensitive to false alarms. This first result indicates the limitations of using the joint information of VV and VH with respect to the VH channel for the detection of small size vessels. A more detailed discussion aiming to further investigate the C V V V H u n n o r m -based detection capabilities by addressing some specific examples will be presented in Section 4.

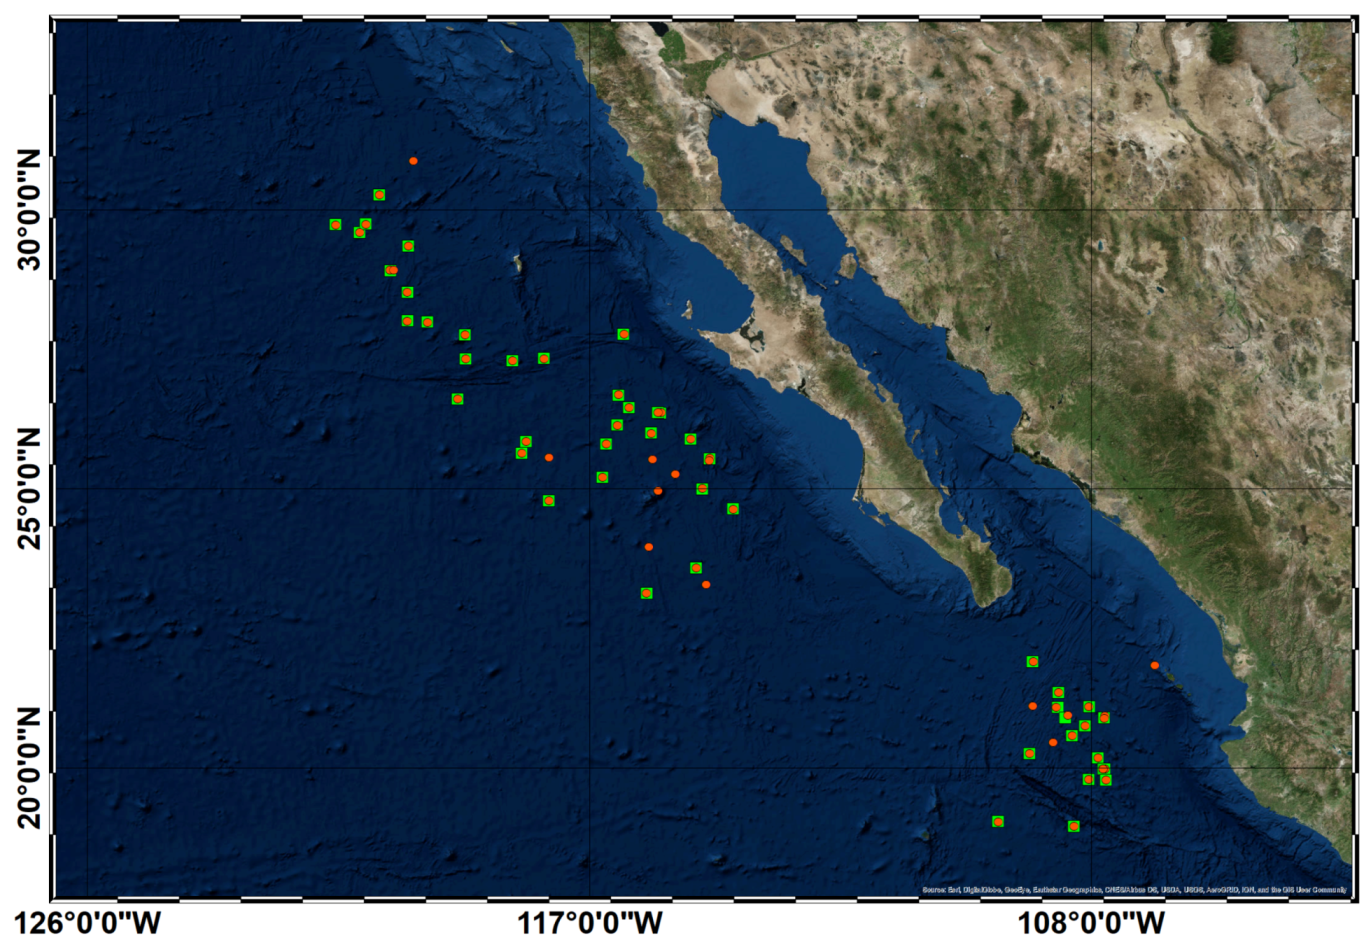
3.3. Mexico Test Case

Figure 7 presents the qualitative cross comparison of the AIS positions and SAR-based detections for the Mexico test case. We notice that with respect the English Channel case study, the traffic in the Mexican open sea areas was characterized by a lower number of vessels. The total number of interpolated AIS messages for this case study was equal to 60, including mostly large sized vessels and a few small-sized ones. The overall size of the small vessels belonging to this dataset was 30 m and the corresponding types are tug and sailing vessels. Therefore, hypothetically speaking, all the AIS vessels corresponding to this dataset could be also detected in the SAR images, since their sizes were larger than the Sentinel-1 IW SLC spatial resolution. The hypothesis is proven by the experimental results: all the AIS vessels presenting a match in the SAR-based detections are depicted in Figure 7 (SAR detection rate = 100%). As illustrated in Figure 7, the Mexico dataset overall presents a high agreement between the AIS and SAR positions that corresponds mainly to large sized vessels navigating towards the Panama Channel. Table 2 presents the number of AIS and SAR targets issued from their cross-comparison. We can notice that the percentage of SAR detections with no corresponding AIS positions was lower than for the English Channel case study. In addition, we have made a visual inspection confirming that the 12 vessels detected by the coherence (over-detections) were in fact no false alarms but correspond to dark vessels or vessels that were not required to carry an AIS transponder. In the following section, different cases illustrating the vessel signatures of SAR unmatched targets are presented in order to have a better understanding of the global rate of the SAR detections.

4. Discussion

A first analysis of the experimental results of this study has been introduced in the previous section. The SAR detection rates have been evaluated by assuming the AIS positions as ground truth. Even if, as mentioned in Section 2.3, the AIS datasets can present gaps and therefore do not cover the entire maritime traffic, a sufficient number of AIS positions is available to enable the characterization of the SAR detection probability of the AIS-SAR matched vessels. In order to complement this analysis and under the assumption that there are uncooperative vessels in our areas of interest, in the following, we investigate the SAR detections with no corresponding AIS positions, i.e., SAR over-detections, through a comparison of the coherence- and intensity- SAR-based detection results. Moreover, the SAR vessel signatures with no corresponding AIS are compared to those of the targets with an AIS match in order to be able not to consider them as false alarms. Table 2 gives the number of the targets resulting from the AIS-SAR matching procedure that are assigned to three different classes: AIS-SAR matches, AIS with no SAR detections and SAR with no AIS corresponding positions. We notice that for the English Channel case study, about 40% of the total number of the C V V V H u n n o r m -based detections do not have corresponding AIS positions, while for the Mexico case study the percentage of unmatched SAR detections is approximately 20%. The Mexico test case is located in open sea areas where the vessel density is low and composed of large size targets that can be usually monitored reliably by AIS systems. However, the limitations of AIS systems such as low coverage of open sea areas by the terrestrial stations or message collision/saturation for SAT-AIS along with the presence of dark vessels without active AIS transponders, can explain the non-matched SAR targets for both the Mexico and English Channel cases.
Figure 8 illustrates the SAR ship signatures of six targets corresponding to C V V V H u n n o r m , I V V and I V H images. Two targets are matched with AIS positions, the first one is a large sized cargo while the second one is a small sized sailing vessel. For all SAR images, we notice that the cargo is associated with a SAR signature comprised of several pixels with high backscattering values. In contrast, the sailing vessel is characterized by a SAR signature composed of a reduced number of pixels with lower backscattering values. The signatures corresponding to C V V V H u n n o r m present a larger amount of pixels due to the fact that an averaging sliding window is employed to estimate the dual-polarization coherence. The vessel signatures are characterized by high values of C V V V H u n n o r m , demonstrating that metallic targets are coherent between the two polarization channels, while the values of C V V V H u n n o r m for sea clutter, considered as a symmetric environment, tend to be low. This result is validated for both large- and small-sized SAR vessel signatures that present AIS matches. The other four SAR targets represented in Figure 8 (T3, T4, T5 and T6) do not have an AIS matching position. However, we can notice that their associated SAR signatures present important similarities with those of the targets matched with AIS positions. For instance, the signature of T4 is similar to the ones of a large size vessel. Moreover, T4 has been identified by all SAR-based detection methodologies. In general, the fact of not having an AIS matching position can be due to the following scenarios: (i) the vessel is located in a very dense traffic area where collisions of AIS messages may occur, e.g., English channel case study, (ii) the area where the vessel is located is not covered by AIS terrestrial stations and the reception of SAT-AIS messages is limited, and (iii) it is a dark vessel that did not broadcast its position during the time range centred on SAR acquisition time. Analogous, T3, T5 and T6 present similar SAR signatures with those of T2, which is a small sized sailing vessel. T3 is detected in the C V V V H u n n o r m domain as well as in the I V H image but not in the I V V image. The latter, i.e. co-polarization channel, is more sensitive to the sea clutter and therefore, the signatures of small sized targets are impacted by the clutter and become hardly distinguishable. However, even if the VV signature is more hard to be detected, its correlation with the VH channel remains valid as it can be observed from the coherence signature which presents a high C V V V H u n n o r m value. The sea-clutter is rarely represented with such high values of C V V V H u n n o r m , e.g., very high sea state. Therefore, in such scenarios C V V V H u n n o r m facilitates the detection of small sized targets. The same aspect is demonstrated for T5 which presents a more important C V V V H u n n o r m signature with respect to the VV and VH intensities. T6 illustrates a target that is visible only in the VH intensity channel, the VV signature being completely similar with the one of sea clutter and therefore not distinguishable in this domain. Based on the assessment of the examples given in Figure 8, which present illustratively a part of our analysis of the SAR vessel signatures, we conclude that for medium and large sized vessels (i.e., >100 m) the C V V V H u n n o r m method and the I V V and I V H give similar detection performances. For small size targets, I V H allows to detect more small size vessels with the drawback of having a high rate of alarms. However, as indicated in Section 3.2, the I V H domain is also influenced by larger number of SAR over-detections with respect to C V V V H u n n o r m .
Table 3 gives the total number of detections for each SAR methodology and the result of their intersection. We can notice that the intersection provides the lowest number of SAR detected targets. As indicated in previous example (Figure 8), the targets detected by all three SAR methodologies present a very high reliability of corresponding to vessels, even when AIS data is not available. The total number of SAR targets detected by the three methodologies, i.e., SAR intersection set, is superior to the number of AIS matched targets, thereby indicating the utility of SAR imagery for detecting dark vessels. In addition to the SAR over-detections associated to dark vessels and confirmed by the three SAR detectors, in the following we quantify the number of over-detections that are not detected jointly by the three SAR detectors. Table 4 gives percentages of AIS-SAR matched targets, AIS under-detections and SAR over-detections with respect to total of all AIS and SAR matched and unmatched targets, for each SAR methodology. The first two columns concerning the matching of the AIS data, confirm our previous conclusion, i.e., that the CFAR (VH) detector outperforms the other two methods, due to its capability to better detect small size vessels. The third column of the table, gives the percentage of SAR over-detections. We notice that the percentage of C V V V H u n n o r m -based over-detections is lower with respect to the results obtained with the CFAR for both I V V and I V H . In addition, the total number of AIS-SAR matched and unmatched targets is higher for both I V V and I V H than for C V V V H u n n o r m . This results in a significant number of additional over-detections for I V V and I V H that are not detected by C V V V H u n n o r m , the latter presenting a reduced number of false alarms, as discussed in Section 3.2, where the visual analysis shows that the coherence is more immune to false alarms than CFAR.

5. Conclusions

In this study we exploit the Sentinel-1 dual-polarization characteristic for carrying out an operational, large-scale, automatic, reliable and accurate detection of vessels. The need to develop an operational detection technique for timely processing of large-scale datasets imposes important restrictions on the computational cost, thus giving the preference to lighten processing approaches. The newly developed detection algorithm relies on an adaptive threshold of the correlation between the co- and cross-polarization channels. This threshold is locally tuned by considering the SAR swath acquisition geometry, i.e., the range of incidence angles, in order to make the method applicable to an entire large size SAR image.
The proposed methodology has been applied to different Sentinel-1 datasets and the results have been compared with corresponding AIS positions interpolated from AIS data flows. In addition, SAR detection results derived from the state-of-the-art CFAR algorithm applied to the separate dual polarization intensity channels, have been used in a comparative study. As demonstrated for two case studies focusing on the English Channel and the Pacific Mexican coastline, the high agreement of the results provided by the coherence-based method and the intensities-based detections indicates that SAR data are in general a reliable source of information for detecting vessels. The intersection of SAR detections set is higher than the number of AIS matched targets, thereby indicating the clear complementarity of SAR with respect to cooperative sources for maritime surveillance applications. Moreover, the number of coherence-based detections is lower than the one obtained with CFAR, thereby indicating that the rate of false alarms is reduced with the proposed methodology, as it has been investigated in this study by a visual inspection analysis. A performance assessment of the detection performances depending on the vessel size has also been presented, indicating that the detection rate is high for vessels of a size larger than 60 m, while for smaller sized vessels, in the case of the dual polarization coherence-based proposed method, it decreases from 80% to 40%.
As a perspective for future work, we suggest to add a hierarchical dimension to the proposed dual-polarization based detector, by applying the following sequence of processing steps: (i) to parametrize the algorithm for large-sized vessels first, to detect and remove them from the initial SAR image, (ii) to apply the same procedure for smaller-sized vessels until the minimum size of detectable vessels given the SAR spatial resolution is reached. This will allow to improve the detection of small sized vessels while limiting the rate of false alarms.
As noticed in the examples shown in this study, the signatures of the vessels appear differently in the dual polarization channels. This property is of interest for characterizing a vessel once it has been detected. For instance, in a future study we aim at deriving the vessel’s kinematic characteristics from SAR SLC imagery by integrating the dual polarization information as well.

Author Contributions

Conceptualization, R.P.; formal analysis, R.P., M.C., R.H., P.M., C.L.-M., M.N., P.R. and G.E.; investigation, R.P., M.C., R.H., P.M., C.L.-M., P.R. and G.E.; methodology, R.P., M.C.; validation, R.P. and M.N.; writing—original draft, R.P.; writing—review and editing, R.P., M.C., R.H., P.M. and C.L.-M.

Funding

This research was funded by the Luxembourg National Research Fund (FNR) through the AFR-PPP SKUA Project under the Grant 2017-1, project reference 11610378.

Conflicts of Interest

The authors declare no conflict of interest.

References

  1. International Maritime Organization. Introduction to International Maritime Organization. 2019. Available online: http://www.imo.org/ (accessed on 28 February 2019).
  2. Denis, G.; Claverie, A.; Pasco, X.; Darnis, J.P.; de Maupeou, B.; Lafaye, M.; Morel, E. Towards disruptions in Earth observation? New Earth Observation systems and markets evolution: Possible scenarios and impacts. Acta Astronaut. 2017, 137, 415–433. [Google Scholar] [CrossRef]
  3. Hajduch, G.; Kerbaol, V.; de Joux, R. Ship Detection: from Processing to Instrument Characterization. In Proceedings of the SeaSAR 2008 Workshop, Frascati, Italy, 21–25 January 2008. [Google Scholar]
  4. Potin, P.; Rosich, B.; Miranda, N.; Grimont, P.; Shurmer, I.; Connell, A.; Krassenburg, M.; Gratadour, J.B. Sentinel-1 Constellation Mission Operations Status. In Proceedings of the IGARSS 2018—2018 IEEE International Geoscience and Remote Sensing Symposium, Valencia, Spain, 22–27 July 2018; pp. 1547–1550. [Google Scholar]
  5. Greidanus, H.; Alvarez, M.; Santamaria, C.; Thoorens, F.X.; Kourti, N.; Argentieri, P. The SUMO Ship Detector Algorithm for Satellite Radar Images. Remote Sens. 2017, 9, 246. [Google Scholar] [CrossRef]
  6. Buckreuss, S.; Schättler, B.; Fritz, T.; Mittermayer, J.; Kahle, R.; Maurer, E.; Böer, J.; Bachmann, M.; Mrowka, F.; Schwarz, E.; et al. Ten Years of TerraSAR-X Operations. Remote Sens. 2018, 10, 873. [Google Scholar] [CrossRef]
  7. Crisp, D.J. The State-of-the-Art in Ship Detection in Synthetic Aperture Radar Imagery; Technical Report; Intelligence, Surveillance and Reconnaissance Division Information Sciences Laboratory: Edinburgh, South Australia, Australia, 2004. [Google Scholar]
  8. El-Darymli, K.; Gill, E.W.; McGuire, P.; Power, D.; Moloney, C. Target detection in synthetic aperture radar imagery: A state-of-the-art survey. J. Appl. Remote Sens. SPIE 2013, 7, 071598. [Google Scholar] [CrossRef]
  9. Gao, G. Statistical Modeling of SAR Images: A Survey. Sensors 2010, 10, 775–795. [Google Scholar] [CrossRef] [PubMed] [Green Version]
  10. Kuruoglu, E.E.; Zerubia, J. Modeling SAR images with a generalization of the Rayleigh distribution. IEEE Trans. Image Process. 2004, 13, 527–533. [Google Scholar] [CrossRef]
  11. Li, H.; Hong, W.; Wu, Y.; Fan, P.Z. On the Empirical-Statistical Modeling of SAR Images With Generalized Gamma Distribution. IEEE J. Sel. Top. Signal Process. 2011, 5, 386–397. [Google Scholar]
  12. Sijbers, J.; den Dekker, A.J.; Scheunders, P.; Dyck, D.V. Maximum-likelihood estimation of Rician distribution parameters. IEEE Trans. Med. Imaging 1998, 17, 357–361. [Google Scholar] [CrossRef] [Green Version]
  13. Xie, H.; Pierce, L.; Ulaby, F. Statistical properties of logarithmically transformed speckle. IEEE Trans. Geosci. Remote Sens. 2002, 40, 721–727. [Google Scholar] [CrossRef]
  14. Eldhuset, K. An automatic ship and ship wake detection system for spaceborne SAR images in coastal regions. IEEE Trans. Geosci. Remote Sens. 1996, 34, 1010–1019. [Google Scholar] [CrossRef]
  15. Alberola-Lopez, C.; Casar-Corredera, J.; de Miguel-Vela, G. Object CFAR detection in gamma-distributed textured-background images. IEE Proc. Vis. Image Signal Process. 1999, 146, 130–136. [Google Scholar] [CrossRef]
  16. Magraner, E.; Bertaux, N.; Rex0301frex0301gier, P. Detection in Gamma-Distributed Nonhomogeneous Backgrounds. IEEE Trans. Aerosp. Electron. Syst. 2010, 46, 1127–1139. [Google Scholar] [CrossRef]
  17. Armstrong, B.; Griffiths, H. CFAR detection of fluctuating targets in spatially correlated K-distributed clutter. IEE Proc. Vis. Image Signal Process. 1991, 138, 139–152. [Google Scholar] [CrossRef]
  18. Xing, X.; Ji, K.; Zou, H.; Sun, J.; Zhou, S. High resolution SAR imagery ship detection based on EXS-C-CFAR in Alpha-stable clutters. In Proceedings of the 2011 IEEE International Geoscience and Remote Sensing Symposium, Vancouver, BC, Canada, 24–29 July 2011; pp. 316–319. [Google Scholar]
  19. Pappas, O.A.; Achim, A.; Bull, D.R. Superpixel-Level CFAR Detectors for Ship Detection in SAR Imagery. IEEE Geosci. Remote Sens. Lett. 2018, 15, 1397–1401. [Google Scholar] [CrossRef]
  20. Tao, D.; Anfinsen, S.N.; Brekke, C. Robust CFAR Detector Based on Truncated Statistics in Multiple-Target Situations. IEEE Trans. Geosci. Remote Sens. 2016, 54, 117–134. [Google Scholar] [CrossRef]
  21. Gao, G. A Parzen-Window-Kernel-Based CFAR Algorithm for Ship Detection in SAR Images. IEEE Geosci. Remote Sens. Lett. 2011, 8, 557–561. [Google Scholar] [CrossRef]
  22. Pelich, R.; Longepe, N.; Mercier, G.; Hajduch, G.; Garello, R. AIS-Based Evaluation of Target Detectors and SAR Sensors Characteristics for Maritime Surveillance. IEEE J. Sel. Top. Appl. Earth Obs. Remote Sens. 2014, 8, 3892–3901. [Google Scholar] [CrossRef]
  23. Tello, M.; López-Martínez, C.; Mallorqui, J.J. A Novel Algorithm for Ship Detection in SAR Imagery Based on the Wavelet Transform. IEEE Geosci. Remote Sens. Lett. 2005, 2, 201–205. [Google Scholar] [CrossRef] [Green Version]
  24. Arii, M. Improvement of ship-sea clutter ratio of SAR imagery using standard deviation filter. In Proceedings of the 2011 IEEE International Geoscience and Remote Sensing Symposium, Vancouver, BC, Canada, 24–29 July 2011; pp. 632–635. [Google Scholar]
  25. Kang, M.; Ji, K.; Leng, X.; Lin, Z. Contextual Region-Based Convolutional Neural Network with Multilayer Fusion for SAR Ship Detection. Remote Sens. 2017, 9, 860. [Google Scholar] [CrossRef]
  26. Salembier, P.; Liesegang, S.; López-Martínez, C. Ship Detection in SAR Images Based on Maxtree Representation and Graph Signal Processing. IEEE Trans. Geosci. Remote Sens. 2018, 57, 2709–2724. [Google Scholar] [CrossRef]
  27. Hwang, J.I.; Jung, H.S. Automatic Ship Detection Using the Artificial Neural Network and Support Vector Machine from X-Band Sar Satellite Images. Remote Sens. 2018, 10, 1799. [Google Scholar] [CrossRef]
  28. Snoeij, P.; Attema, E.; Davidson, M.W.J.; Duesmann, B.; Floury, N.; Levrini, G.; Rommen, B.; Rosich, B. Sentinel-1 radar mission: Status and performance. IEEE Aerosp. Electron. Syst. Mag. 2010, 25, 32–39. [Google Scholar] [CrossRef]
  29. Virelli, M.; Coletta, A.; Battagliere, M.L. ASI COSMO-SkyMed: Mission Overview and Data Exploitation. IEEE Geosci. Remote Sens. Mag. 2014, 2, 64–66. [Google Scholar] [CrossRef]
  30. Faller, N.; Weber, M. TerraSAR-X and TanDEM-X: Revolution in spaceborne radar. In Proceedings of the 2007 IEEE International Geoscience and Remote Sensing Symposium, Barcelona, Spain, 23–28 July 2007; pp. 4924–4928. [Google Scholar]
  31. Zhang, T.; Marino, A.; Xiong, H.; Yu, W. A Ship Detector Applying Principal Component Analysis to the Polarimetric Notch Filter. Remote Sens. 2018, 10, 948. [Google Scholar] [CrossRef]
  32. Marino, A.; Cloude, S.; Woodhouse, I.H. A Polarimetric Target Detector Using the Huynen Fork. IEEE Trans. Geosci. Remote Sens. 2010, 48, 2357–2366. [Google Scholar] [CrossRef] [Green Version]
  33. Velotto, D.; Nunziata, F.; Migliaccio, M.; Lehner, S. Dual-Polarimetric TerraSAR-X SAR Data for Target at Sea Observation. IEEE Geosci. Remote Sens. Lett. 2013, 10, 1114–1118. [Google Scholar] [CrossRef]
  34. Velotto, D.; Bentes, C.; Tings, B.; Lehner, S. First Comparison of Sentinel-1 and TerraSAR-X Data in the Framework of Maritime Targets Detection: South Italy Case. IEEE J. Ocean. Eng. 2016, 41, 993–1006. [Google Scholar] [CrossRef]
  35. Touzi, R.; Charbonneau, F.; Hawkins, R.K.; Vachon, P.W. Ship detection and characterization using polarimetric SAR. Can. J. Remote Sens. 2004, 30, 552–559. [Google Scholar] [CrossRef]
  36. Hu, C.; Ferro-Famil, L.; Kuang, G. Ship Discrimination Using Polarimetric SAR Data and Coherent Time-Frequency Analysis. Remote Sens. 2013, 5, 6899–6920. [Google Scholar] [CrossRef] [Green Version]
  37. Touzi, R.; Hurley, J.; Vachon, P.W. Optimization of the Degree of Polarization for Enhanced Ship Detection Using Polarimetric RADARSAT-2. IEEE Trans. Geosci. Remote Sens. 2015, 53, 5403–5424. [Google Scholar] [CrossRef]
  38. Pelich, R.; Mercier, N.L.G.; Hajduch, G.; Garello, R. Performance evaluation of Sentinel-1 data in SAR ship detection. In Proceedings of the IEEE International Geoscience and Remote Sensing Symposium (IGARSS), Milan, Italy, 26–31 July 2015. [Google Scholar]
  39. Santamaria, C.; Alvarez, M.; Greidanus, H.; Syrris, V.; Soille, P.; Argentieri, P. Mass Processing of Sentinel-1 Images for Maritime Surveillance. Remote Sens. 2017, 9, 678. [Google Scholar] [CrossRef]
  40. Huang, L.; Liu, B.; Li, B.; Guo, W.; Yu, W.; Zhang, Z.; Yu, W. OpenSARShip: A Dataset Dedicated to Sentinel-1 Ship Interpretation. IEEE J. Sel. Top. Appl. Earth Obs. Remote Sens. 2018, 11, 195–208. [Google Scholar] [CrossRef]
  41. Nunziata, F.; Migliaccio, M.; Brown, C.E. Reflection Symmetry for Polarimetric Observation of Man-Made Metallic Targets at Sea. IEEE J. Ocean. Eng. 2012, 37, 384–394. [Google Scholar] [CrossRef]
  42. European Space Agency. Thematic Exploitation Platform. 2019. Available online: https://tep.eo.esa.int/ (accessed on 28 February 2019).
  43. European Commission. Functional Requirements for the Copernicus Distribution Services and the Data and Information Access Services (DIAS). 2016. Available online: http://ec.europa.eu/DocsRoom/documents/20521/attachments/1/translations/en/renditions/pdf (accessed on 28 February 2019).
  44. Lee, J.S.; Pottier, E. Polarimetric Radar Imaging: From Basics to Applications; CRC Press: Boca Raton, FL, USA, 2009. [Google Scholar]
  45. Raney, R.K.; Spudis, P.D.; Bussey, D.B.J.; Crusan, J.; Jensen, J.R.; Marinelli, W.; McKerracher, P.; Neish, C.; Palsetia, M.R.; Schulze, R.; et al. The Lunar Mini-RF Radars: Hybrid Polarimetric Architecture and Initial Results. Proc. IEEE 2011, 99, 808–823. [Google Scholar] [CrossRef]
  46. Arii, M. Ship detection from full polarimetric SAR data at different incidence angles. In Proceedings of the 2011 3rd International Asia-Pacific Conference on Synthetic Aperture Radar (APSAR), Seoul, Korea, 26–30 September 2011; pp. 1–4. [Google Scholar]
  47. Touzi, R.; Vachon, P.W.; Wolfe, J. Requirement on Antenna Cross-Polarization Isolation for the Operational Use of C-Band SAR Constellations in Maritime Surveillance. IEEE Geosci. Remote Sens. Lett. 2010, 7, 861–865. [Google Scholar] [CrossRef]
  48. Liu, C.D.; Vachon, P.W.; English, R.A.; Sandirasegaram, N.M. Ship Detection Using RADARSAT-2 Fine Quad Mode and Simulated Compact Polarimetry Data; Technical Memorandum; Defence R&D Canada: Ottawa, ON, Canada, 2010. [Google Scholar]
  49. Margarit, G.; Mallorquí, J.; Fortuny-Guasch, J.; López-Martínez, C. Phenomenological Vessel Scattering Study Based on Simulated Inverse SAR Imagery. IEEE Trans. Geosci. Remote Sens. 2009, 47, 1212–1223. [Google Scholar] [CrossRef]
  50. Margarit, G.; Mallorquí, J.; Fortuny-Guasch, J.; López-Martínez, C. Exploitation of Ship Scattering in Polarimetric SAR for an Improved Classification Under High Clutter Conditions. IEEE Trans. Geosci. Remote Sens. 2009, 47, 1224–1235. [Google Scholar] [CrossRef]
  51. Yin, J.; Yang, J.; Zhou, Z.S.; Song, J. The Extended Bragg Scattering Model-Based Method for Ship and Oil-Spill Observation Using Compact Polarimetric SAR. IEEE J. Sel. Top. Appl. Earth Obs. Remote Sens. 2015, 8, 3760–3772. [Google Scholar] [CrossRef]
  52. Touzi, R.; Lopes, A.; Bruniquel, J.; Vachon, P. Coherence estimation for SAR imagery. IEEE Trans. Geosci. Remote Sens. 1999, 37, 135–149. [Google Scholar] [CrossRef]
  53. Topouzelis, K.N.; Singha, S. Incidence angle Normalization of Wide Swath SAR Data for Oceanographic Applications. Open Geosci. 2016, 8, 450–464. [Google Scholar] [CrossRef]
  54. Huang, L.; Liu, B.; Li, X.; Zhang, Z.; Yu, W. Technical Evaluation of Sentinel-1 IW Mode Cross-Pol Radar Backscattering from the Ocean Surface in Moderate Wind Condition. Remote Sens. 2017, 9, 854. [Google Scholar] [CrossRef]
  55. Lee, J.S.; Grunes, M.; de Grandi, G. Polarimetric SAR speckle filtering and its implication for classification. IEEE Trans. Geosci. Remote Sens. 1999, 37, 2363–2373. [Google Scholar]
  56. Makhoul, E.; López-Martínez, C.; Broquetas, A. Exploiting Polarimetric TerraSAR-X Data for Sea Clutter Characterization. IEEE Trans. Geosci. Remote Sens. 2016, 54, 358–372. [Google Scholar] [CrossRef]
  57. Frery, A.; Muller, H.J.; Yanasse, C.; Sant’Anna, S. A model for extremely heterogeneous clutter. IEEE Trans. Geosci. Remote Sens. 1997, 35, 648–659. [Google Scholar] [CrossRef] [Green Version]
  58. Lee, J.S.; Hoppel, K.; Mango, S.; Miller, A. Intensity and phase statistics of multilook polarimetric and interferometric SAR imagery. IEEE Trans. Geosci. Remote Sens. 1994, 32, 1017–1028. [Google Scholar]
  59. Tough, R.J.A.; Blacknell, D.; Quegan, S. A Statistical Description of Polarimetric and Interferometric Synthetic Aperture Radar Data. Proc. R. Soc. A 1995, 449, 567–589. [Google Scholar] [CrossRef]
  60. Smestad, B.B.; Asbjørnslett, B.E.; Rødseth, Ø.J. Expanding the Possibilities of AIS Data with Heuristics. TransNav Int. J. Mar. Navig. Saf. Sea Transp. 2017, 11, 279–286. [Google Scholar] [CrossRef]
  61. Tetreault, B.J. Use of the Automatic Identification System (AIS) for maritime domain awareness (MDA). In Proceedings of the OCEANS 2005 MTS/IEEE, Washington, DC, USA, 17–23 September 2005; Volume 2, pp. 1590–1594. [Google Scholar]
  62. Mazzarella, F.; Arguedas, V.F.; Vespe, M. Knowledge-based vessel position prediction using historical AIS data. In Proceedings of the 2015 Sensor Data Fusion: Trends, Solutions, Applications (SDF), Bonn, Germany, 6–8 October 2015; pp. 1–6. [Google Scholar]
Figure 1. Example of vessel detection results obtained from the dual-polarization-based algorithm by applying both a global and local adaptive threshold to the C V V V H u n n o r m extracted from a Sentinel-1 IW image.
Remotesensing 11 01078 g001
Figure 2. Location of the Sentinel-1 frames for the two test case sites: (a) English Channel and (b) Mexico.
Remotesensing 11 01078 g002
Figure 3. Illustration of the AIS-SAR cross-comparison for a Sentinel-1 IW image acquired over the English Channel area (24/10/2017): (a) Vessels detected by the C V V V H u n n o r m -based detector and the CFAR applied to I V H , (b) signatures of vessels detected by only constant false alarm rate (CFAR) I V H (left column) and by both C V V V H u n n o r m -based detector and CFAR I V H (right column), (c) vessels detected by the C V V V H u n n o r m -based detector and AIS interpolated positions, (d) vessels detected by CFAR applied to I V H and AIS interpolated positions.
Remotesensing 11 01078 g003
Figure 4. Distribution of the AIS-SAR matching distances for the English Channel case study.
Remotesensing 11 01078 g004
Figure 5. English Channel test case, vessel density: automatic identification system (AIS) positions (green squares) and synthetic aperture radar (SAR) C V V V H u n n o r m -based detections (orange circles). The positions correspond to the cumulation of SAR detections for all the Sentinel-1 images of this dataset and their associated interpolated AIS positions.
Remotesensing 11 01078 g005
Figure 6. Statistical analysis of the detection performances derived for 1400 vessels extracted from 10 SAR images and the corresponding AIS data flow: (a) AIS vessel length distribution; (b) probability of detection as a function of polarization and vessel length.
Remotesensing 11 01078 g006
Figure 7. Mexico test case: AIS positions (green squares) and SAR C V V V H u n n o r m -based detections (orange circles). The positions correspond to the cumulation of SAR detections for all the Sentinel-1 images of this dataset and their associated interpolated AIS positions.
Remotesensing 11 01078 g007
Figure 8. Different Sentinel-1 SAR vessel signatures represented in the C V V V H u n n o r m , I V V and I V H images.
Remotesensing 11 01078 g008
Table 1. Characteristics of the Sentinel-1 synthetic aperture radar (SAR) datasets.
Case StudyNo. of ImagesSLC Resolution [m]PolarizationSensing Dates
English Channel105 × 20 (rg × az)VV-VHOctober–November 2017
Mexican marine areas20October 2018
Table 2. Automatic identification system (AIS) and SAR cross-comparison, SAR detections derived by using the proposed dual-polarization algorithm.
Case Study AIS ∩ SARAIS with no SARSAR with no AISAIS ∪ SAR
English Channelnb. of vessels9983937132104
Mexico5101263
Table 3. SAR detections: coherence based detections and constant false alarm rate (CFAR) vertical transmission with vertical (VV) and horizontal reception (VH) Intensity detections.
Case Study Detection Method
C VV VH un norm I VH CFAR I VV CFAR C VV VH un norm & I VH CFAR & I VV CFAR
English Channelnb. of vessels1711196018151420
Mexico63809256
Table 4. SAR detections, i.e., C V V V H u n n o r m , CFAR I V H and CFAR I V V , and AIS positions global cross-comparison for the English Channel case study.
Case Study AIS ∩ SARAIS with No SARSAR with No AISAIS ∪ SAR (Vessel nb)
C V V V H u n n o r m % wrt
AIS ∪ SAR
48%18%34%2104
CFAR I V H 51%12%37%2215
CFAR I V V 46%17%37%2208

