Article

Identifying Linear Traces of the Han Dynasty Great Wall in Dunhuang Using Gaofen-1 Satellite Remote Sensing Imagery and the Hough Transform

1
Key Laboratory of Digital Earth Science, Aerospace Information Research Institute, Chinese Academy of Sciences (CAS), Beijing 100094, China
2
International Centre on Space Technologies for Natural and Cultural Heritage (HIST) under the Auspices of UNESCO, Beijing 100094, China
3
National-Local Joint Engineering Laboratory on Digital Preservation and Innovative Technologies for the Culture of Traditional Villages and Towns, Hengyang Normal University, Hengyang 421001, China
4
University of the Chinese Academy of Sciences (UCAS), Beijing 100049, China
5
IRIT, CNRS, Université de Toulouse, 31062 Toulouse, France
*
Author to whom correspondence should be addressed.
These authors contributed equally to this work.
Remote Sens. 2019, 11(22), 2711; https://0-doi-org.brum.beds.ac.uk/10.3390/rs11222711
Submission received: 28 October 2019 / Revised: 15 November 2019 / Accepted: 17 November 2019 / Published: 19 November 2019

Abstract

:
The Han Dynasty Great Wall (GH), one of the largest and most significant ancient defense projects in the whole of northern China, has been studied increasingly not only because it provides important information about the diplomatic and military strategies of the Han Empire (206 B.C.–220 A.D.), but also because it is considered to be a cultural and national symbol of modern China as well as a valuable archaeological monument. Thus, it is crucial to obtain the spatial pattern and preservation situation of the GH for next-step archaeological analysis and conservation management. Nowadays, remote sensing specialists and archaeologists have given priority to manual visualization and a (semi-) automatic extraction approach is lacking. Based on the very high-resolution (VHR) satellite remote sensing imagery, this paper aims to identify automatically the archaeological features of the GH located in ancient Dunhuang, northwest China. Gaofen-1 (GF-1) data were first processed and enhanced after image correction and mathematical morphology, and the M-statistic was then used to analyze the spectral characteristics of GF-1 multispectral (MS) data. In addition, based on GF-1 panchromatic (PAN) data, an auto-identification method that integrates an improved Otsu segmentation algorithm with a Linear Hough Transform (LHT) is proposed. Finally, by making a comparison with visual extraction results, the proposed method was assessed qualitatively and semi-quantitatively to have an accuracy of 80% for the homogenous background in Dunhuang. These automatic identification results could be used to map and evaluate the preservation state of the GH in Dunhuang. Also, the proposed automatic approach was applied to identify similar linear traces of other generations of the Great Wall of China (Western Xia Dynasty (581 A.D.–618 A.D.) and Ming Dynasty (1368 A.D.–1644 A.D.)) in various geographic regions. Moreover, the results indicate that the computer-based automatic identification has great potential in archaeological research, and the proposed method can be generalized and applied to monitor and evaluate the state of preservation of the Great Wall of China in the future.

Graphical Abstract

1. Introduction

1.1. Historical and Archaeological Background

A large proportion of the Great Wall of China (GWC) that we see today was built during the Ming Dynasty (1368 A.D.–1644 A.D.) [
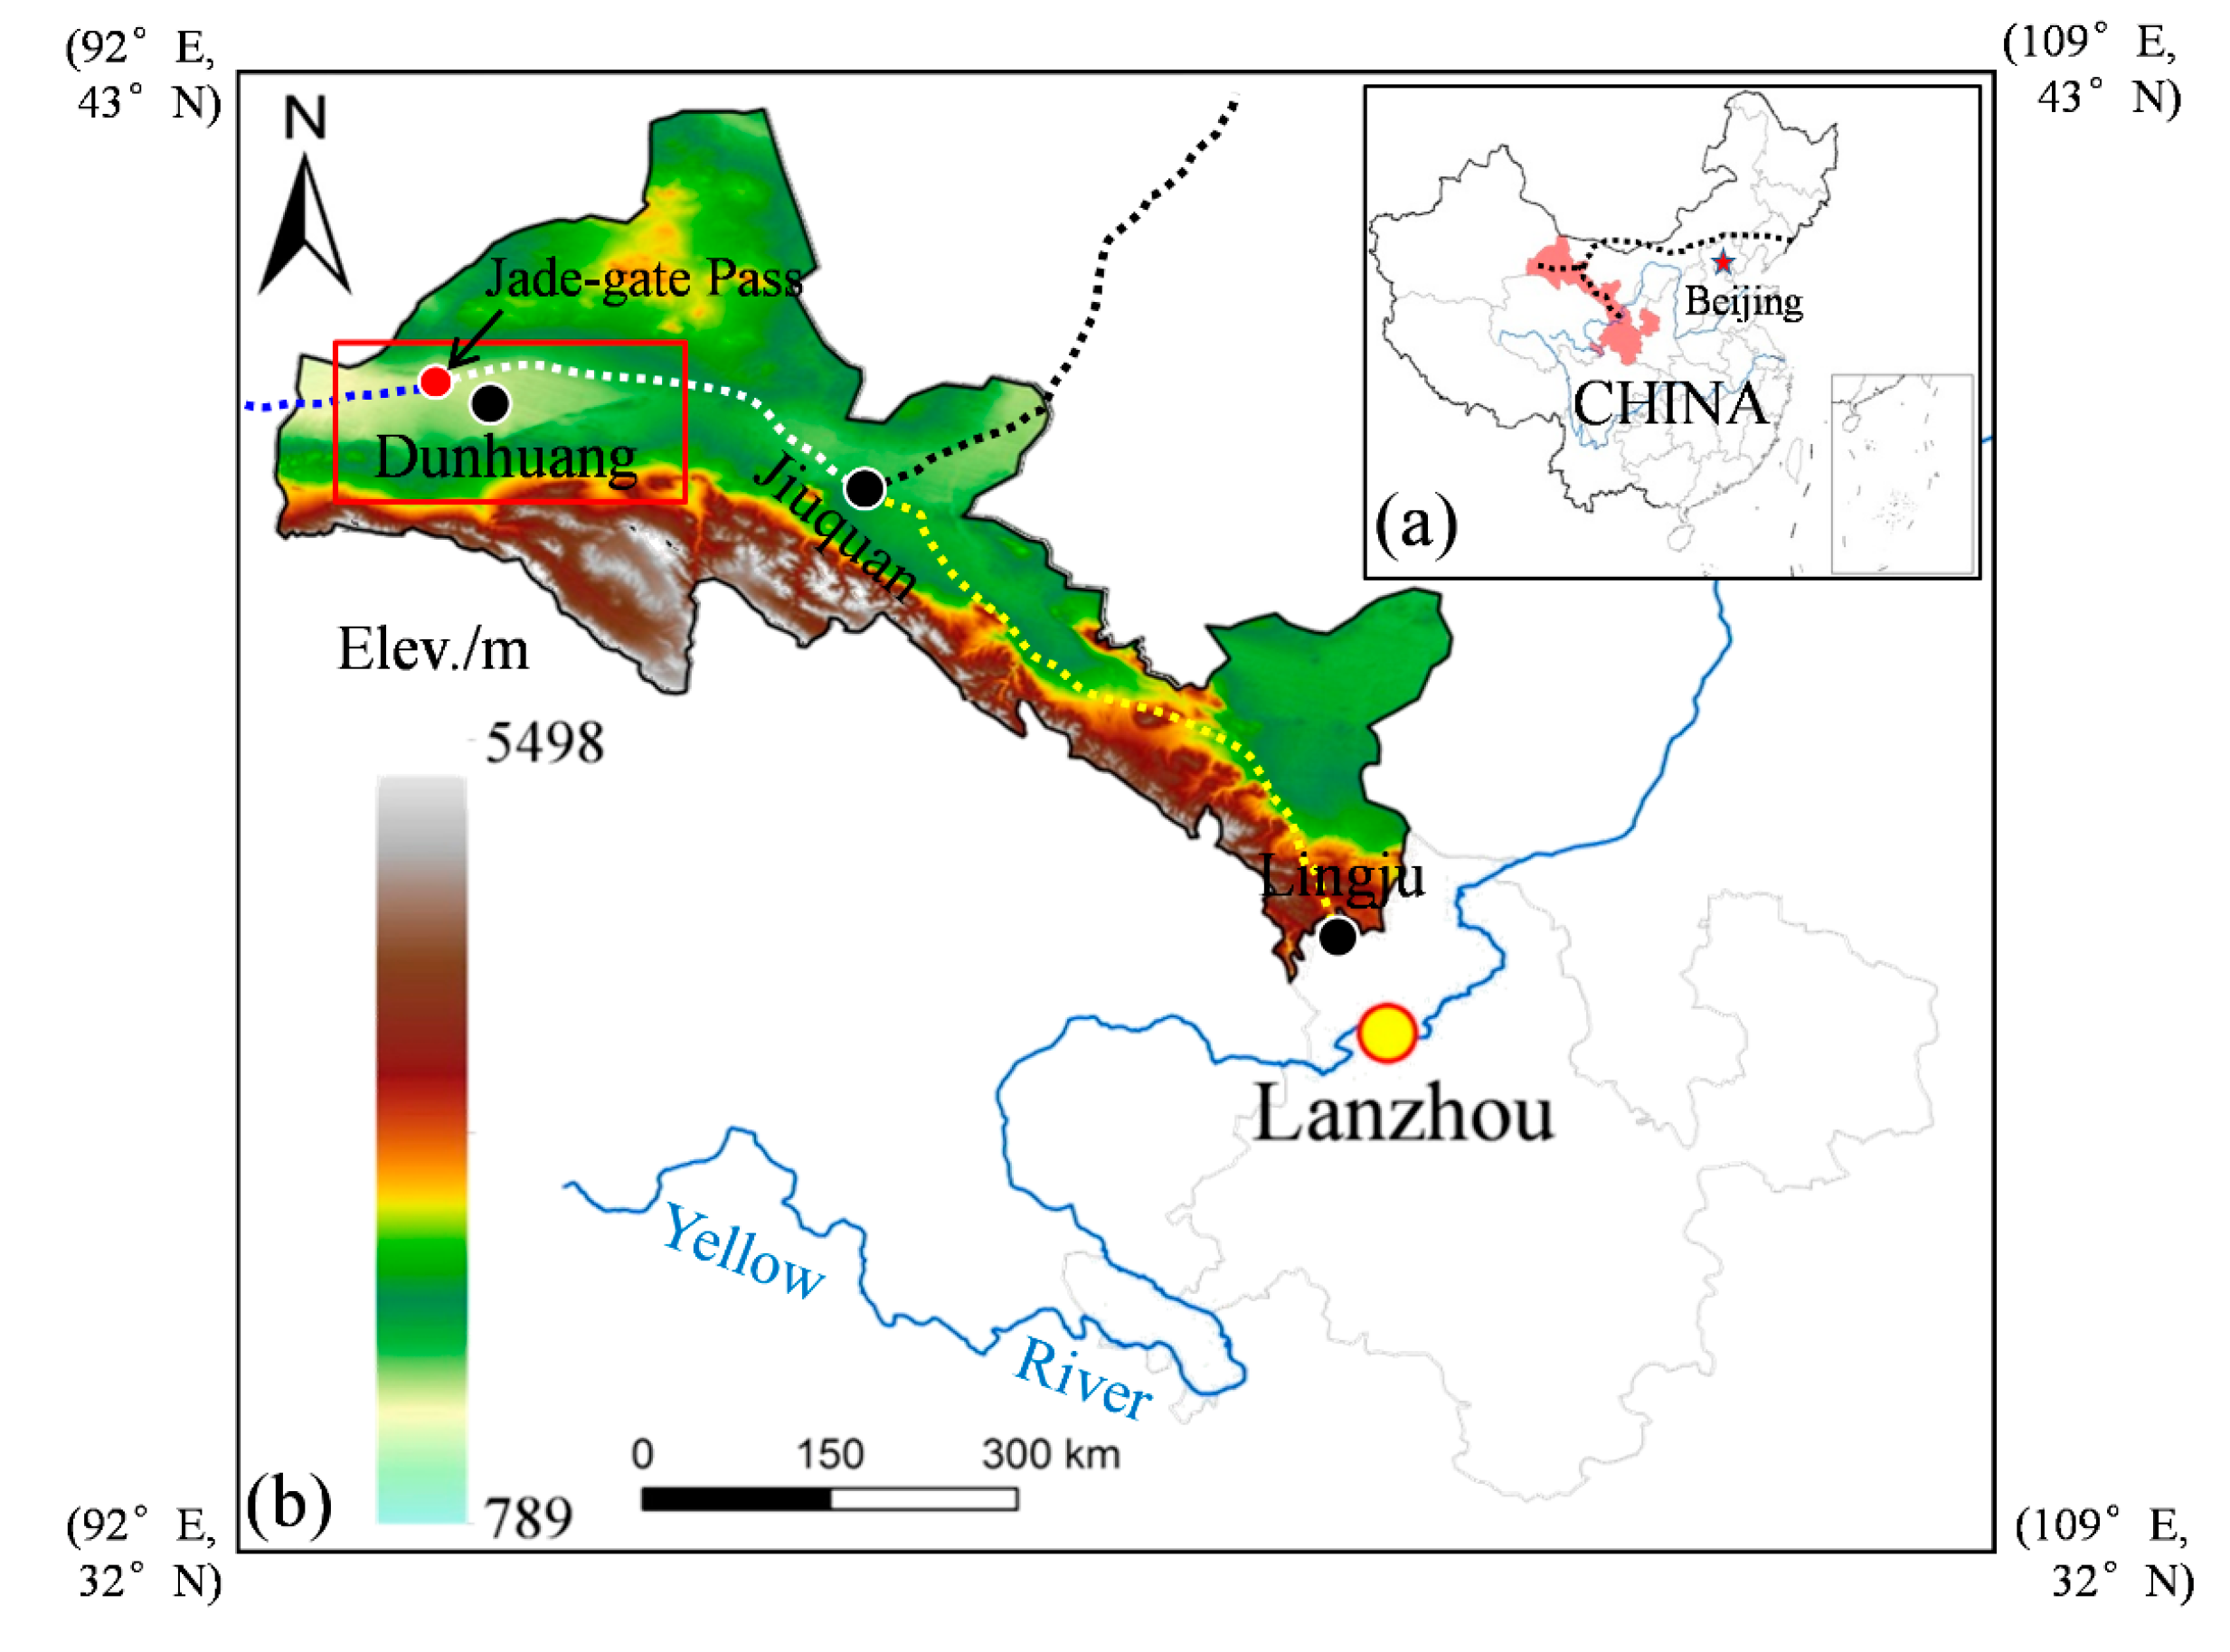
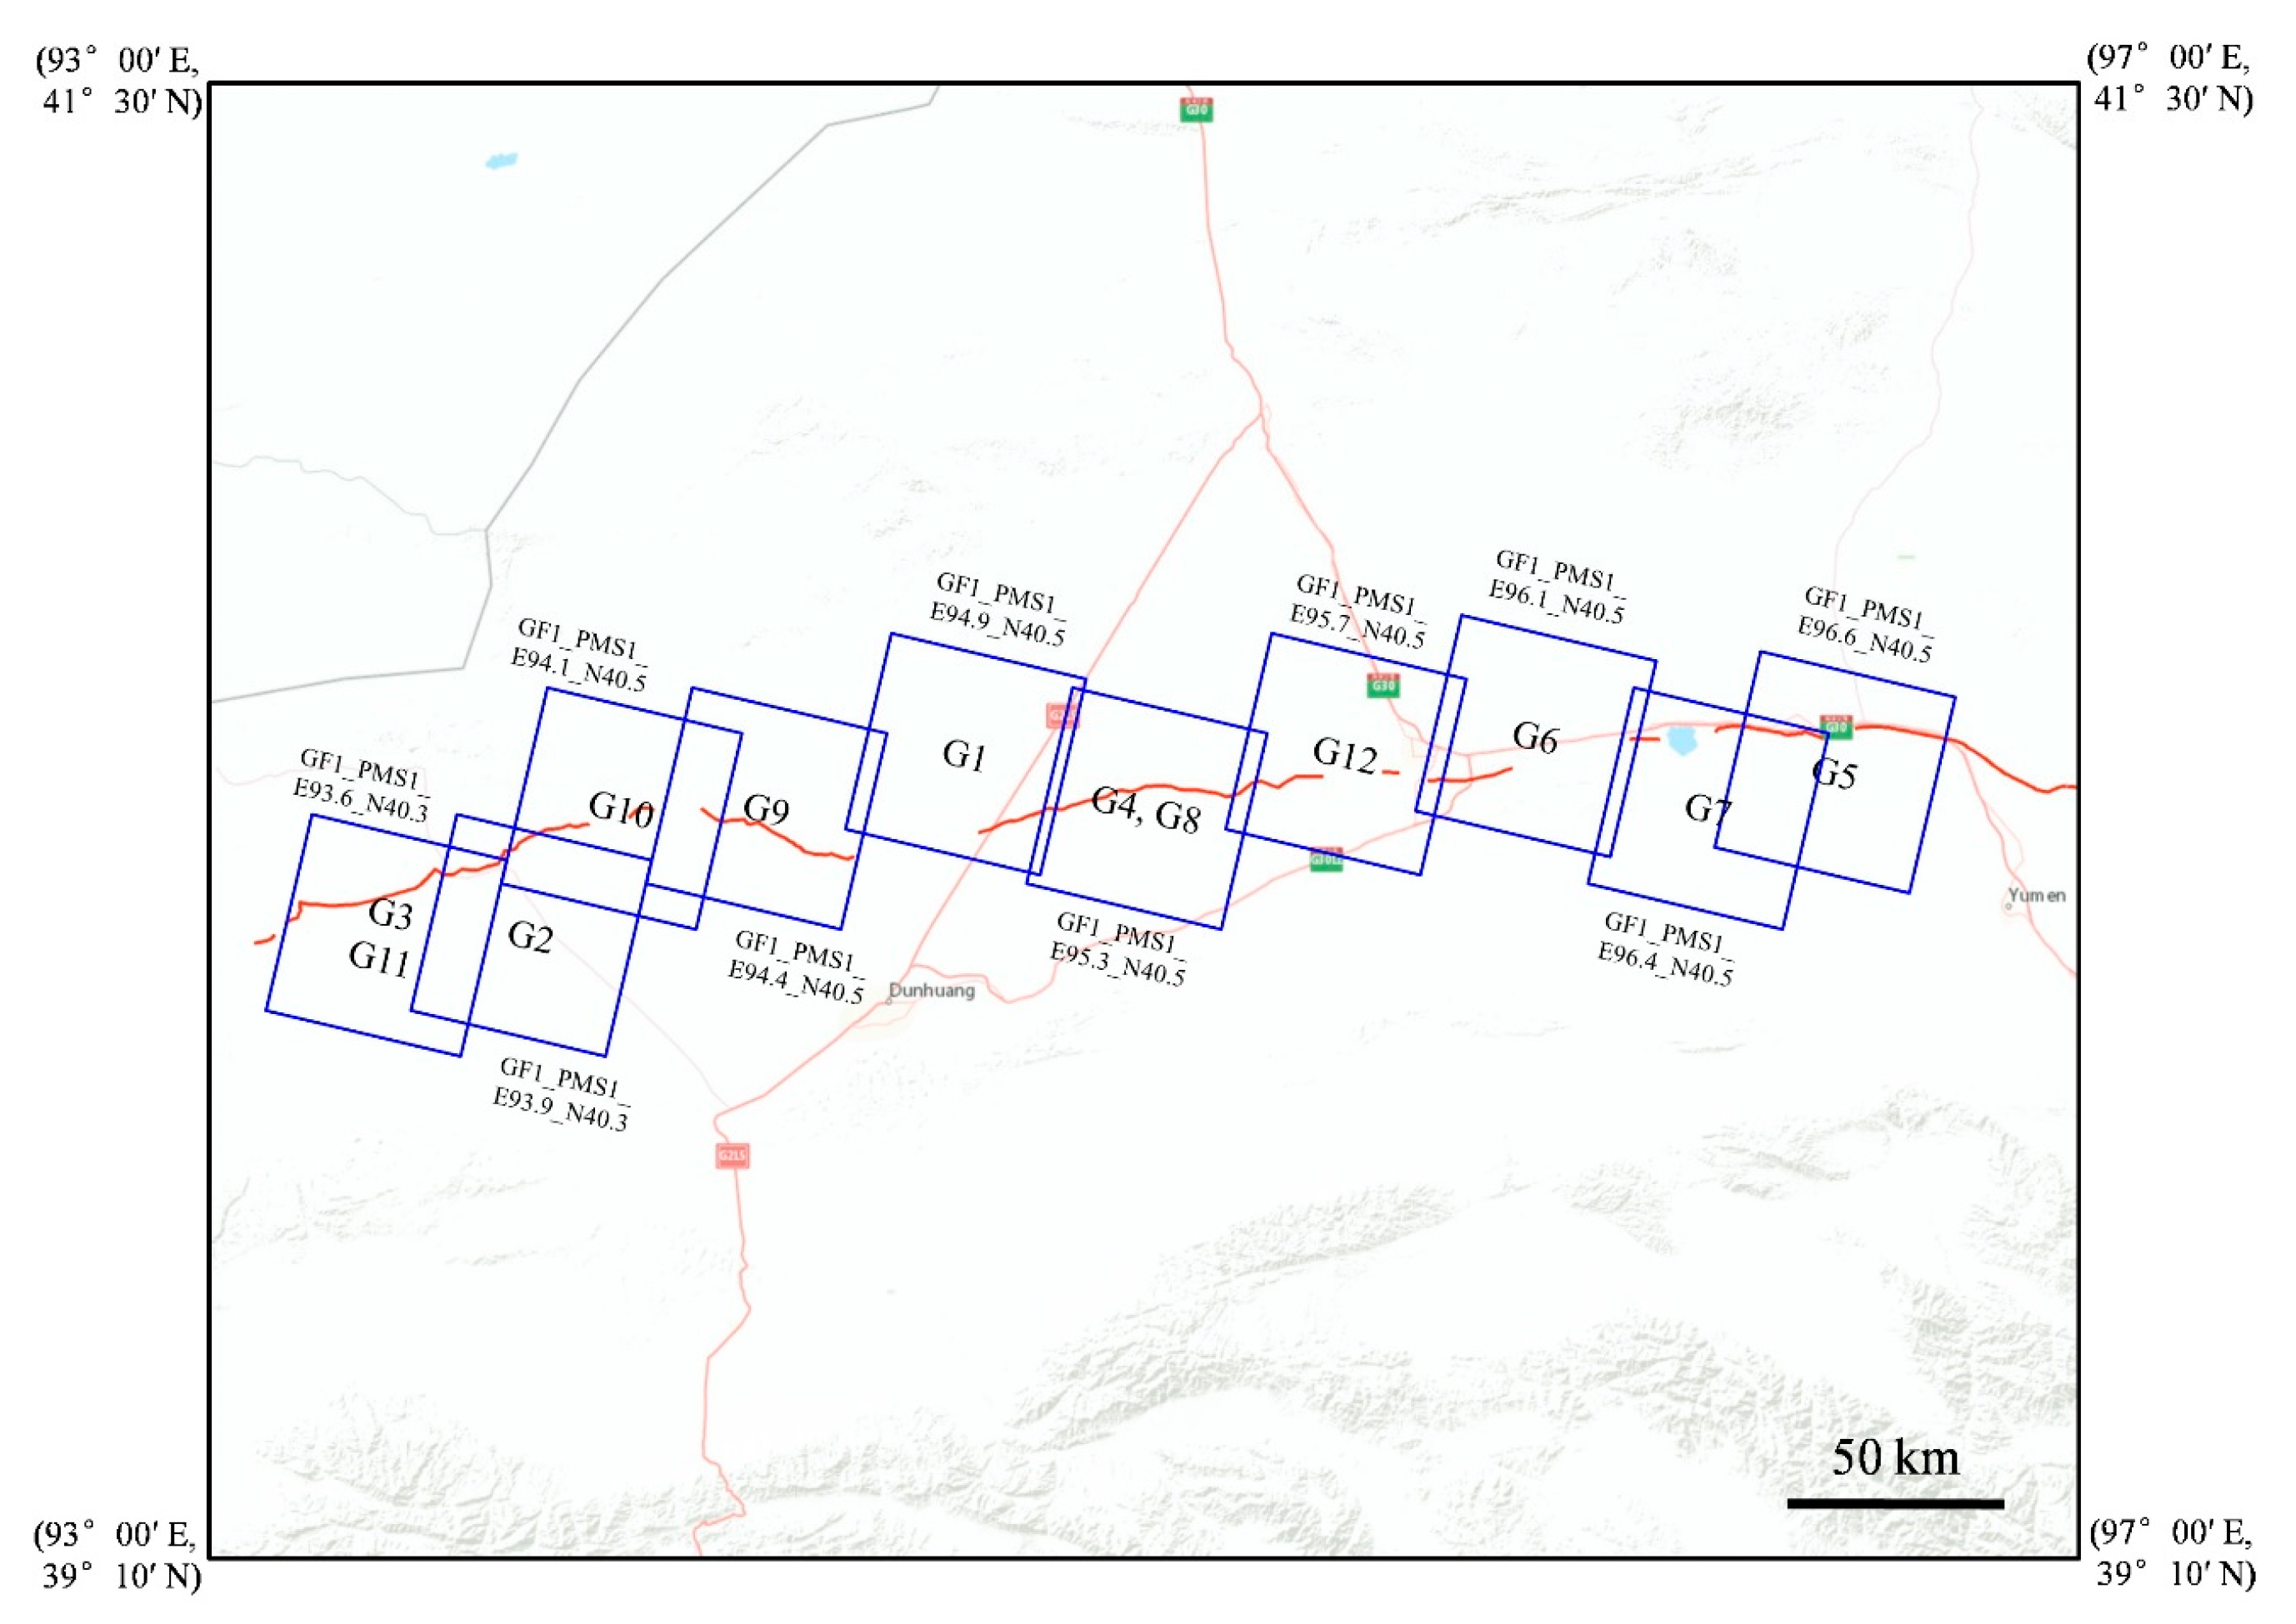
1]. However, west of the Yellow River in the Hexi Corridor, today’s Gansu Province (Figure 1a) lies a section dating back to the Han Dynasty (206 B.C.–220 A.D.), more than 1300 years earlier than the Ming [2,3]. The Han Dynasty Great Wall (GH), the largest national defense project of the Han Empire, once spanned over 5000 km across the plains, grasslands, deserts, mountains, and rivers of northern China [4,5]. As one of the generations of the GWC, the GH was for centuries used to protect and safeguard the Han Empire against the invasions and attacks of the various nomadic powers of the Eurasian Steppes and Mongolia, who were looking to expand [6,7,8]. Around 121 B.C., the Han Empire sent troops to fight against the Huns and re-conquered the lost territory of the Hexi Corridor [9,10]. Subsequently, in order to protect these recovered lands, the GH defense system was erected along the corridor over three periods of time (Figure 1b).
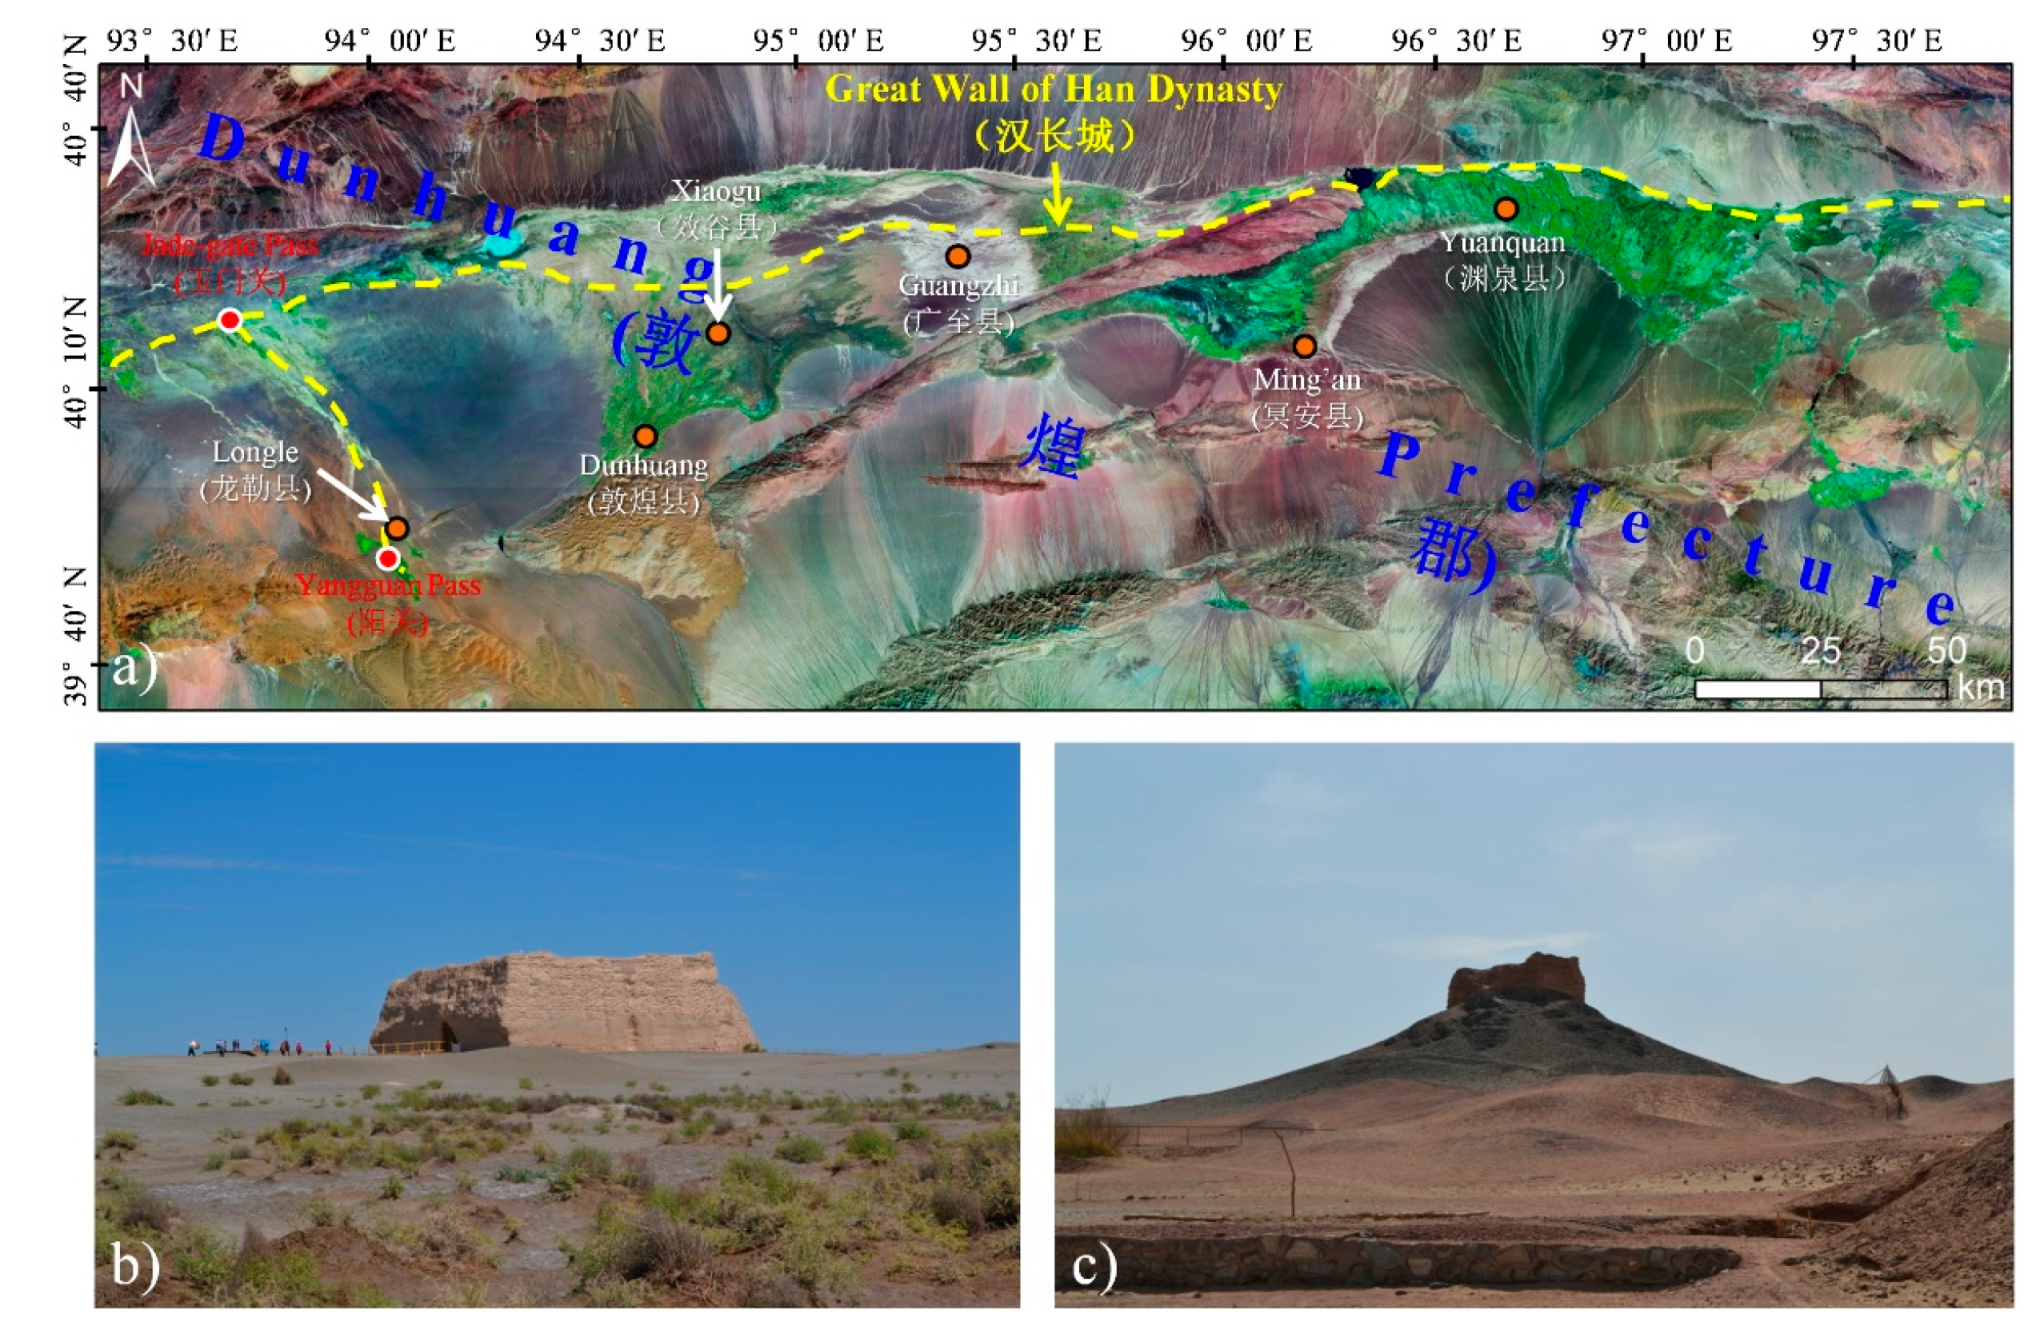
These three periods of time were as follows. (1) In 121 B.C., Han troops regained the Hexi Corridor; thereafter, the GH was built between Lingju and Jiuquan (Lingju Section, yellow dotted line in Figure 1b) [11,12]; (2) from 111 B.C. to 110 B.C., the GH was extended from Jiuquan to the Jade-Gate Pass in Dunhuang (Dunhuang Section, white dotted line in Figure 1b) [9,13,14]; and (3) from 104 B.C. to 100 B.C., the GH was again extended from the Jade-Gate Pass to Lop-Nor Lake to the west (Lop-Nor Section, blue dotted line in Figure 1b) [9,14]. So, after twenty years of construction, the GH defense system in the Hexi Corridor was finally completed, starting from Lingju in the east and ending near Lop-Nor Lake in the west [9,14]. To consolidate the safety of the frontier region and to unblock the trade routes, the Han Empire built walls, forts and barriers along the Hexi Corridor to guarantee the safety and efficiency of trade activities and cultural communication along the ancient Silk Road [15,16]. Additionally, the defense capability of the GH was strengthened by the construction of beacon towers, passes, garrison stations, troop barracks, and also signaling capabilities that used flags and smoke in the daytime and fires at night [17,18,19,20].
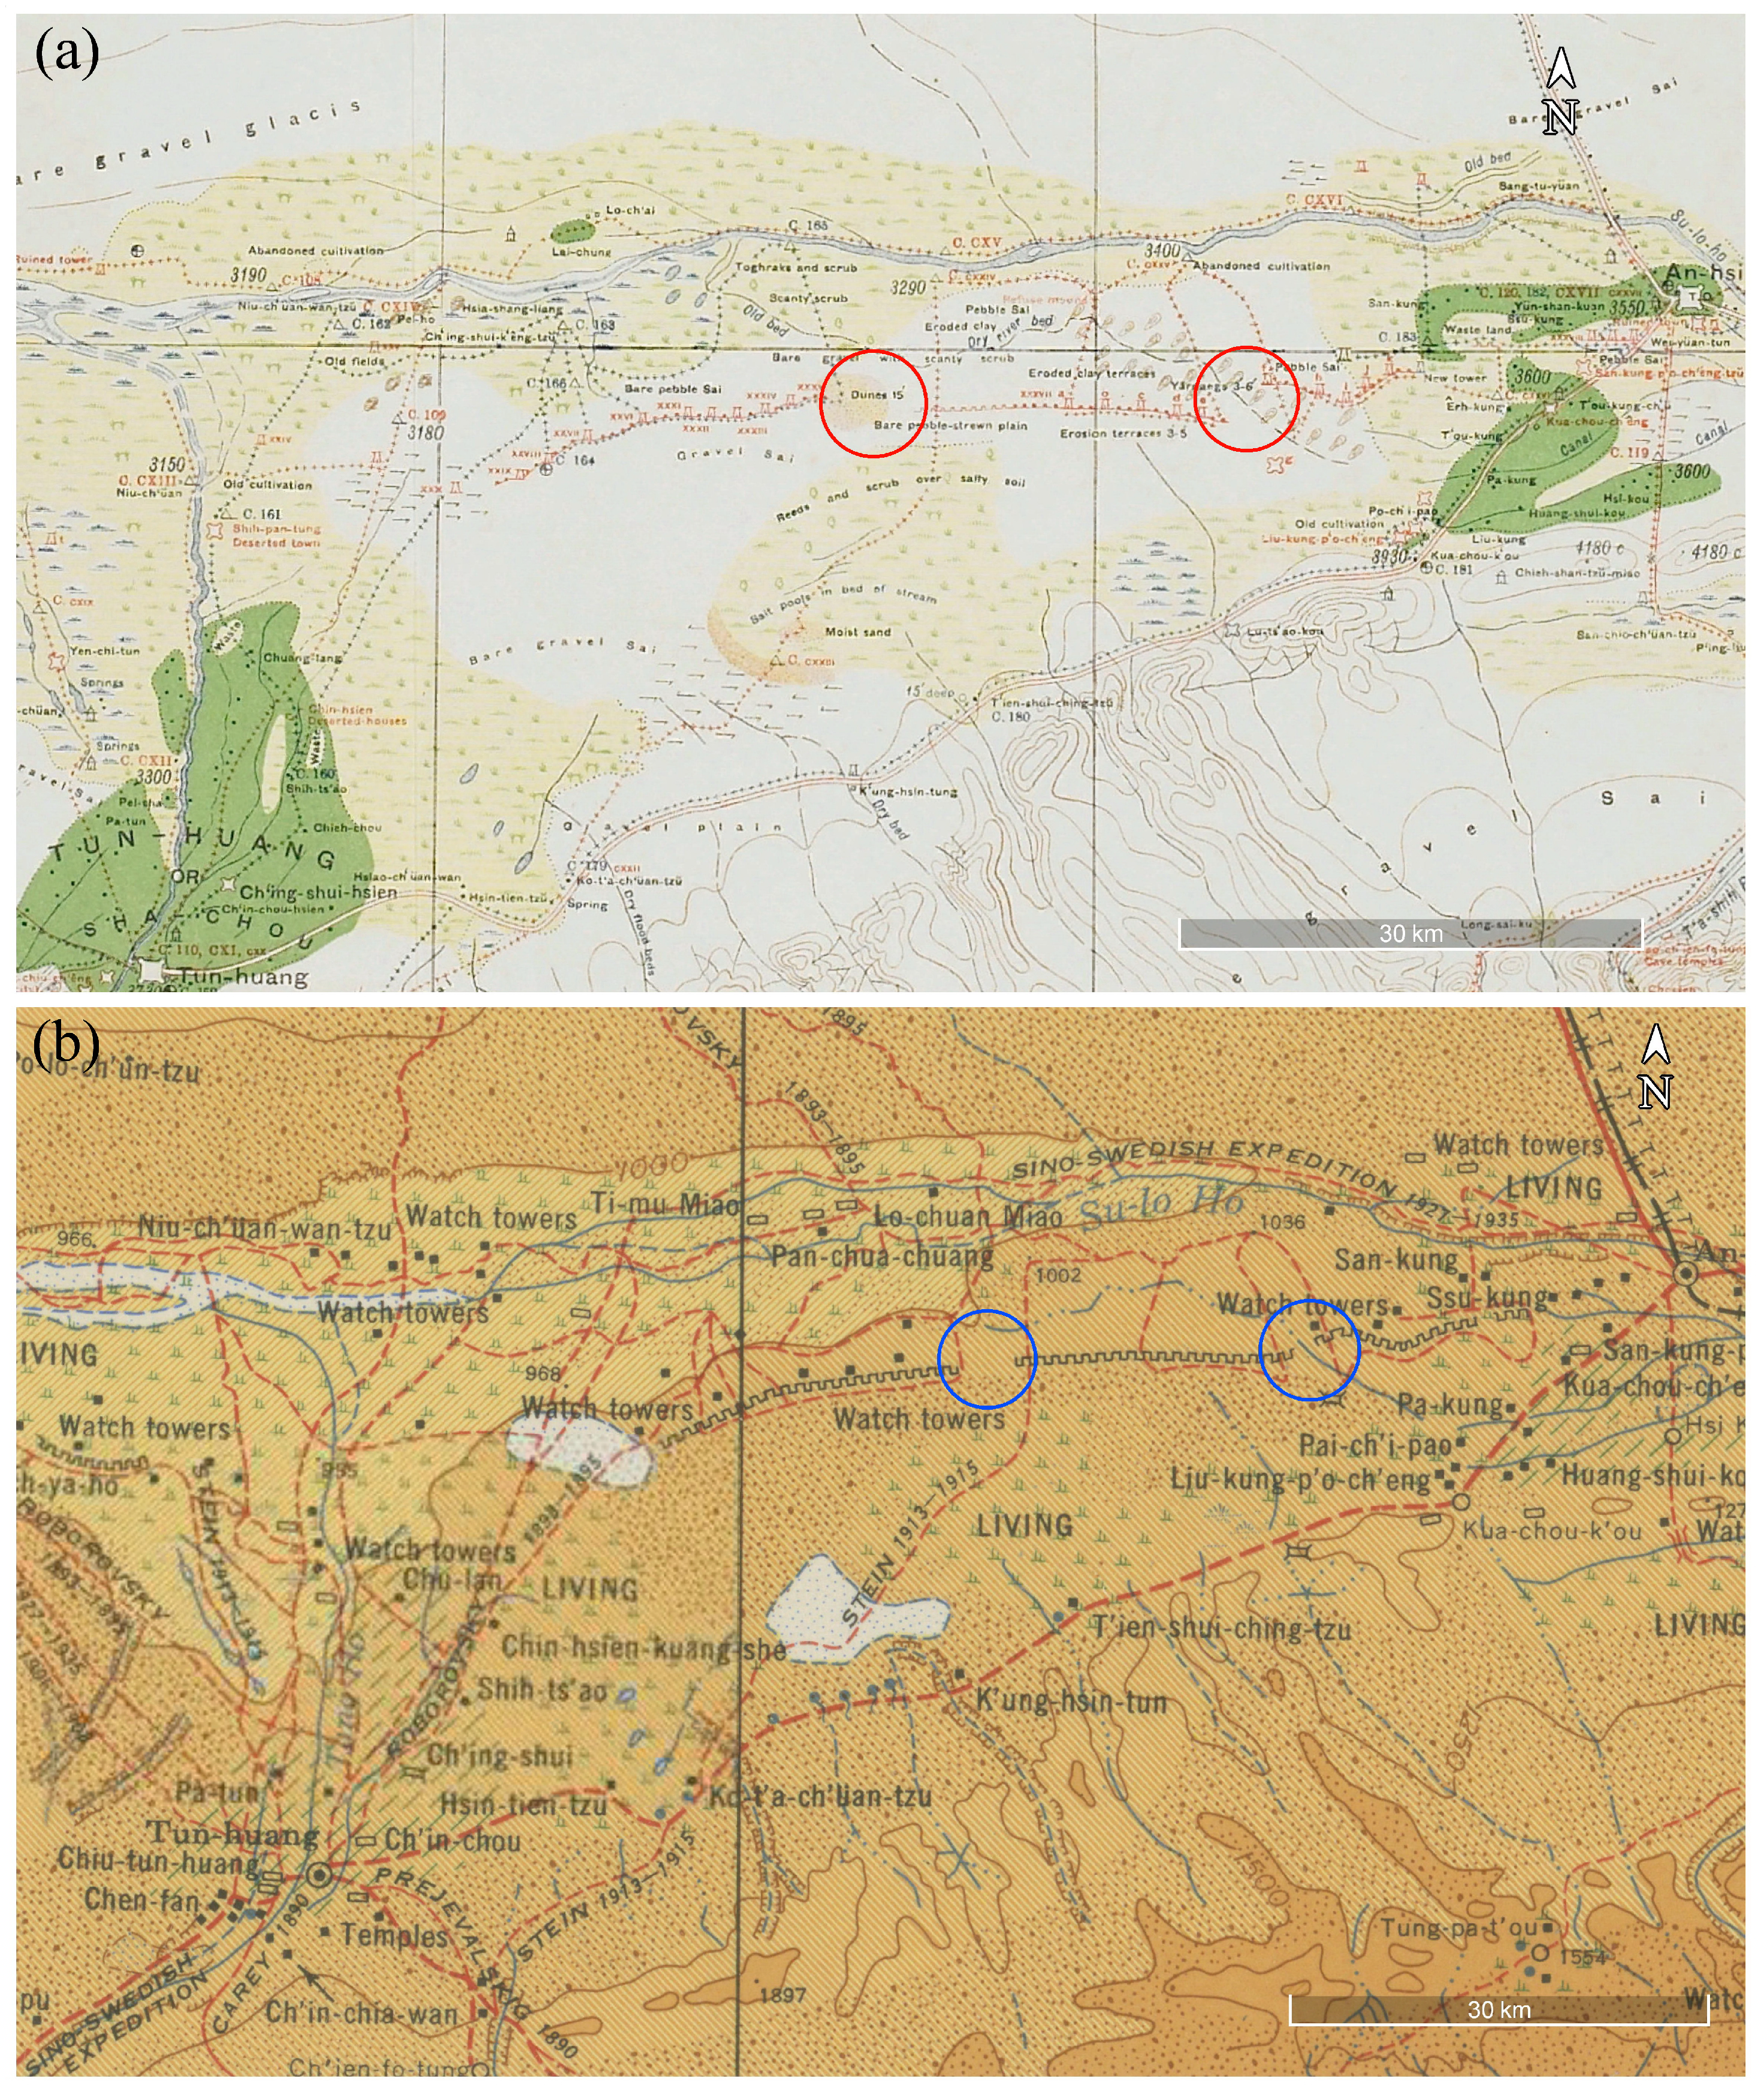
Despite thousands of years of natural erosion and anthropogenic disturbances, there are still traces of the buried remains of these structures, located in different geographical environments. Over the past hundred years, the Dunhuang Section of the GH has been the focus of domestic and foreign studies in the fields of politics, archaeology, history, geography, agriculture, climate, the military and many other disciplines. Many explorers, geographers and archaeologists, such as Stein [21], Hedin [22], Xiang [23], Xia [24], Yan [25] and Wu [26], have made valuable contributions (Figure 2) related to, for example, construction times, management structures and military functions. Comprehensive studies of the GH have been carried out by combining field investigations, archaeological excavations and literature analysis with textual research on the Han bamboo slips that have been unearthed [14,27,28]. The achievements of these researchers provide an important and solid research background for the present study as well as useful archaeological and geographical materials.
The Dunhuang Section of the GH is an important physical carrier of and historical witness to the development of western China in ancient times. It has outstanding political, military, cultural, economic, historical, archaeological, geographical, ecological and environmental value and needs to be well studied and well protected. In terms of ecology, the areas along the GH in Dunhuang are mostly fragile and sensitive and are vulnerable to frequent environmental damage, which causes varying degrees of natural and anthropogenic damage to the GH. Therefore, it is particularly important to quickly and accurately understand the existing situation at the GH sites and to objectively evaluate and analyze them. This has great practical significance for the protection and sustainable development of the GH.
At present, the monitoring and protection of the large, linear GH site is mostly based on periodic ground patrols, especially in northwestern China, where the economy is less well developed and access to technology is limited. This has some obvious shortcomings: necessary action can be delayed, and this type of monitoring is time-consuming and costly. The conservation status of the GH is not good and faces severe challenges. At the same time, most of the GH remains are buried by sand or are located in remote areas. It is, thus, not easy to find these remains on the ground and making full use of VHR satellite RS images is necessary. This study is aiming to design an automatic approach for identifying the linear traces of GH, and provide a computer-based pattern recognition prototype which would be constantly advanced and used to monitor and evaluate the preserve situations of GH in the future.

1.2. Archaeological Remote Sensing

Remote sensing (RS) provides a rapid and low-cost way of exploring, mapping and monitoring archaeological features of interest (AOIs) across the world [29]. Research that involves the identification of AOIs increasingly employs aerial photographs and spy satellite images [30,31,32,33] as well as multispectral and hyperspectral imagery [34,35,36,37,38], SAR data [39,40,41,42], and LiDAR products [43,44,45]. RS has unique advantages for detecting the large archaeological sites such as the Silk Road, Grand Canal, Nasca Lines and Great Wall [4]. In the 1980s, sections of the Ming Dynasty Great Wall in Beijing and Ningxia were first surveyed using aerial remote sensing [46,47]. Guo [48] discovered two generations of the Great Wall buried in dry sand in northwestern China by using Shuttle imaging radar data. Chen et al. [49] completed the first comprehensive survey of the whole Ming Great Wall with the help of RS and GIS. Additionally, much RS-based research on the military defense systems of the Great Wall have been carried out [50,51,52], especially at the regional level.
Nowadays, RS specialists and archaeologists are giving priority to manual visualization, which is limited to three spectral bands at a time [29]. This means that it is still necessary to intervene manually, which requires a lot of time, manpower and material resources [53,54,55]. With the rapid development of image and signal processing and computer vision, several (semi-) automatic approaches have also been designed for and applied to archaeological research [56,57,58,59,60]. For instance, Lasaponara et al. [55] designed a classification-based semi-automatic approach for identifying four buried farm objects at the Hierapolis site; the identification results were then qualitatively evaluated by combining visual interpretation with the GPR survey data. Traviglia and Torsello [57] presented an integrated approach for automatically identifying archaeological landscape patterns based on multi-scale analysis of dominant oriented response filters, which qualitatively demonstrated that the proposed approach provided accurate localization of the target linear objects and alignments signaled by a wide range of physical entities with very different characteristics. Figorito and Tarantino [58] identified artificial monuments indicative of crop-marks by combining VHR aerial photographs with an image segmentation approach; in this case, the performance of the proposed algorithm was qualitatively evaluated by classifying traces according to their visibility and integrity. Using a Circular Hough Transform (CHT) algorithm that had an average extraction accuracy better than 80%, Luo et al. [59] automatically extracted the shafts of the ancient irrigation system of Qanat from VHR Google Earth imagery of a homogeneous desert environment. Only line tops of the Qanat shafts surrounded by spoil, representing line of tunnel gathering groundwater, can be observed from space, and their circular archaeological traces can also be seen in VHR Google Earth imagery [59].
For RS specialists and archaeologists, obtaining spatial information about AOIs from various sources of data is the original and primary goal of archaeological remote sensing research [59]. In general, AOIs can be detected in RS imagery as grid data or vector data using visual or automatic interpretation following image enhancement and data fusion [61]. However, there are some long-standing problems pointed out by Luo et al. [47], such as low level of automation and extremely limited range of spatial scales and spectral contrasts in AOIs’ identification. This study aimed to identify the linear traces of GH Linear traces from GF-1 MS and PAN data using an automatic approach that combined image segmentation with a Linear Hough Transform (LHT). Section 2 presents the research materials, including a description of the study area at Dunhuang and the GF-1 satellite RS imagery. Section 3 introduces the automatic approach applied to identify the linear traces of GH. Section 4 and Section 5 present the results and discussion, and the conclusions, respectively.

2. Study Area and Data

2.1. Ancient Dunhuang

In this study, research was performed for a well-documented historic region called Dunhuang Prefecture located close to the modern city of Dunhuang, in the northwestern Hexi Corridor. (Figure 1b and Figure 2). Ancient Dunhuang, one of the most import military towns in China during the whole of the imperial period, was nourished by the ancient Shule River; however, now the area is characterised by the Gobi, sand dunes and wind-eroded yardang landforms [19]. Additionally, ancient Dunhuang, located at the western end of the Hexi Corridor, was a strategic spot leading to the Western Regions (Figure 3), and therefore played an extremely important role in trade and cultural exchange along the Silk Road. The Dunhuang Section of the GH was an important part of the overall GH defense system in the Hexi Corridor, as well as being symbolic of the defense system in northwest China during the Han Dynasty.
The strategic position of ancient Dunhuang and the convenient communication that it enjoyed favored continuous anthropogenic activity [19,61] from pre-historic times to the imperial period, especially during the Han–Tang period, as has been confirmed by various excavated archaeological materials, monuments, historical remains and ancient documents [9,10,14,15,16]. The Dunhuang Section of the GH, distributed about 80 km north of the modern oasis city of Dunhuang, is now one of the most significant pieces of large-scale linear cultural heritage, and the best-preserved section of the GH in China [4]. This section was designed and built over several years, and varies in terms of its spatial, structural and morphological patterns. Generally, beacon towers and military forts were built first along the line of the GH; defensive walls or ditches were then added when necessary. In some difficult locations (e.g., rivers, lakes, hills and valleys), only beacon towers and military forts were built. Today, along the line of the GH in northern Dunhuang, the only preserved remnants are water-eroded paleochannels, wind-weathered yardang landforms, and small sand dunes [19]. Thus, it is nearly impossible to discover and identify ancient remains using conventional field surveys in these less-accessible regions.

2.2. Linear Traces of GH in Dunhuang

The Dunhuang Section of the GH is a huge and complex military defense system. There are many types of military facilities related to it, including defensive walls, beacons, forts, ditches, fences, trenches, passes, warehouses and post-stations [14,18]. Due to the severe natural conditions, and also later damage caused by people, it is hard to find most these original features, and most of them have disappeared or been buried by sand [19]. Based on well-documented historical literatures [9,10,14] and comprehensive archaeological maps [21,22], the defensive walls of the GH stretched for about 400 km [12,18] in Dunhuang: they were built to serve as the strongest and most extensive part of the integrated GH defense system, and indicate the skeletal structure of the GH system. The walls were made of local materials with the sandy soil, reeds, Tamarix and Euphrates Poplar being built up layer by layer (Figure 4), [14,20] making the defensive wall solid and sound.
According to historical records [9,10] and recent archaeological researches [14,16,19,21,22], a parallel trench or ditch was usually dug outside the wall after the original soil and sand had been carried away. The defensive walls represent a unique construction technology that demonstrates the innovative utilization and creative transformation of local conditions as well as the use of indigenous knowledge in the development of a military presence in frontier regions where construction materials were in short supply. In this study, the most characteristic features of the GH, the defensive walls, were selected as the research objects. Figure 4 shows a typical segment of GH in Dunhuang. The wind erosion and anthropogenic vandalism in a long term of years have told severely on the preservation of the GH in Dunhuang. Nearly all of the defensive walls disappeared and their linear traces are hard to see on the ground (Figure 5d–g). Fortunately, high-resolution satellite RS, in particular, provides a new perspective for prospecting the GH, allowing its traces to be observed from above (Figure 5a–c).
In Dunhuang, the defensive walls of the GH usually appear similar to archaeological soil-marks and can be seen as approximately linear features in VHR RS data. The linear traces of the GH are visible owing to variations in color, texture or shape (Figure 5b,c). As these were major features and symbols of the GH in ancient Dunhuang, observing the linear traces in VHR satellite RS data required a proper method for identifying them in different environmental settings. In this study, it was crucial to identify the linear traces so that spatial patterns and defense policies employed along the Hexi Corridor could be better understood. Those traces had a mean width of around 10–12 m. This allowed an extraction approach for identifying them from VHR satellite remote sensing imagery to be designed.

2.3. Remote Sensing Data

A total of 10 GF-1 images (see Table 1, Figure 6), acquired between 30 July and 25 September 2014 were procured for use in this study. The GF-1 satellite RS data used in this study was obtained from the Centre for REsources Satellite Data and Application (CRESDA), China. The GF-1 satellite is fitted with two panchromatic and multispectral (PMS) cameras (Table 2) which can provide PAN and MS data with nadir resolutions of 2 m and 8 m, respectively, across an imaging swath of 60 km. It is worth noting that all the GF-1 images used in this study are cloud-free and are imaged at approximately the same local time (10:30 a.m.)
Remote sensing archaeologists interested in detecting, mapping and documenting AOIs are increasingly employing very high-resolution commercial satellite optical imagery. The SPOT, IKONOS, QuickBird, GeoEye and WorldView data have been widely used in previous studies [19,33,34,54,55], and will continue to play a constructive role in the identification of archaeological features in the future [29], lacking applications of the latest GF-1 optical data. Compare with above-mentioned commercial satellite data, the unique advantage of GF-1 data is that it is free to access by the registered users. Gaofen-1 Constellation is currently composed of four satellites (Gaofen-1 A, B, C, D), which jointly construct the operational constellation of land resources survey and monitoring. It shortens the global imaging period to 11 days and the revisit period to 1 day. In case of emergency, the target area can be revisited for several hours.
Based on an analysis of the GF-1 PAN image, which has a spatial resolution of 2 m, it was easily found that the linear traces between two adjacent beacon towers were almost linear and had clear edges, and that the remnants of the GH on the ground produced obvious archaeological soil marks. In view of these common features of linear traces, a method of automatically identifying linear traces of the GH that included image segmentation using the Otsu threshold segmentation algorithm and the extraction of linear traces based on the Hough Transform was developed.
At the landscape scale, the landform types in Dunhuang are diverse and complex (consisting of steppe, Gobi, desert, yardang, etc.), resulting in different background environmental conditions where the linear traces are located. Meanwhile, in order to fully understand the image characteristics for the GH, 12 typical linear traces distributed across Dunhuang were selected for GF-1 PAN image analysis (Table 3, Figure 6). They were divided into two categories: linear traces with wall remnants and those with non-wall remnants. The background environment at the locations of these 12 GH fell into 6 classes: homogeneous desert-Gobi background (G1), heterogeneous desert-Gobi background (G8), homogeneous Gobi background (G5, G9), heterogeneous Gobi background (G2), homogeneous gully background (G3), heterogeneous gully background (G6, G11), homogeneous yardang background (G4, G10) and heterogeneous yardang background (G7, G12).

3. Methodology

3.1. Data Pre-Processing

The GF-1 PAN and MS data were first radiometrically corrected before atmospheric correction was performed. Subsequently, the MS data were atmospherically corrected with the aim of reducing the errors or noises attributed to atmospheric conditions as these affect the ability to use spectral channels to analyze features of interest analysis. In addition, the processed data were orthorectificated based on the rational polynomial coefficient (RPC). Lastly, Each GF-1 image was geometrically corrected using dozens of ground control points acquired using a hand-held portable DGPS system [62] with a horizontal accuracy better than 1 m (equal to 0.5 pixels). This yielded an average root mean square error of less than 0.4 pixels. All of the data pre-processing was carried out in ENVI5.4 [63]. Additionally, the 10 corrected PAN images used in this paper were also enhanced using the joint morphological transformation approach that was proposed in our previous study [61].

3.2. M-Statistic

In this study, we adopted the M-statistic [64], and the spectral separability index (SSI), to assess the separability of linear traces and their surrounding backgrounds (e.g., sand dunes, yardang, and paleochannels). The M-statistic can be defined as follows [65]:
M ( λ ) = μ 1 ( λ ) μ 2 ( λ ) σ 1 ( λ ) + σ 2 ( λ )
where μ 1 ( λ ) and μ 2 ( λ ) are the means of two different classes (such as linear traces and their surroundings), and σ 1 ( λ ) and σ 2 ( λ ) represent the corresponding standard deviations.
A greater M value means a higher separability between the two classes since the intra-class variance is minimized and the inter-class variance is maximized [61]. Based on our previous study [61], M < 1.0 and M > 1.0 represent poor and good class separation, respectively. In this study, the M-statistic was used to compare the spectral separability of linear traces for multispectral imagery with panchromatic data and the products derived from them (fused imagery, multispectral channels, panchromatic data, the normalized difference vegetation index (NDVI), principal component analysis (PCA), etc.).

3.3. Otsu Segmentation

At present, there are many image segmentation algorithms available, these can be divided into the following categories: edge operator-based (Sobel, Laplacian, Prewitt, Canny, etc.), threshold-based (2-Mode, Iteration, Otsu, Global Threshold, etc.), region-based (Region Growing, Splitting and Merging, Watershed, etc.), graph theory-based (GraphCut, GrabCut, Random Walk, etc.), and energy function-based (such as the Chan-Vese model). In pattern recognition and signal and digital image processing, the Otsu segmentation method, designed and proposed by Nobuyuki Otsu [66] in 1979, is applied to automatically perform clustering-based image thresholding, or, the reduction of a gray-level image to a binary image [67]. Otsu segmentation has been widely used because of its simplicity, stability and effectiveness. It assumes that the targeted image contains two groups of pixels (the background and objects of interest) that follow the bi-modal histogram. It then calculates the optimum threshold separating the two groups so that their within-class variance is minimal or, equivalently, so that their between-class variance is maximal [68].
Otsu’s segmentation algorithm exhaustively searches for the threshold that minimizes the within-class variance, defined as a weighted sum of the variances of the two groups:
σ ω 2 ( t ) = ω 0 ( t ) σ 0 2 ( t ) + ω 1 ( t ) σ 1 2 ( t )
where weights ω 0 and ω 1 are the probabilities of the two groups separated by a threshold t , and σ 0 2 and σ 1 2 are the variances of these two groups.
The class probability ω 0 , 1 ( t ) is computed from the L bins of the histogram, L is 256 for the grayscale level image:
ω 0 ( t ) = i = 0 t 1 p ( i ) ,   ω 1 ( t ) = i = t L 1 p ( i ) ,   p ( i )   = P i M × N
where M × N indicates the size of the targeted original input image, and P i is the total number of pixels in each group separated by a threshold t .
Otsu shows that minimizing the within-class variance is the same as maximizing the between-class variance σ b 2 [68]:
σ b 2 = σ 2 σ ω 2 ( t ) = ω 0 ( μ 0 μ T ) 2 + ω 1 ( μ 1 μ T ) 2 = ω 0 ( t ) ω 1 ( t ) [ μ 0 ( t ) μ 1 ( t ) ] 2
where the class means μ 0 , 1 , T ( t ) are given by:
μ 0 ( t ) =   i = 0 t 1 i p ( i ) ω 0 ( t ) ,   μ 1 ( t ) =   i = t L 1 i p ( i ) ω 1 ( t ) ,   μ T ( t ) = i = 0 L 1   i p ( i )
It is easy to find the following mathematical relations:
ω 0 μ 0 + ω 1 μ 1 = μ T ,   ω 0 + ω 1 = 1
Because variance is an indicator that measures the uniformity of the gray-level distribution of the image of interest, the greater the variance, the greater the difference between the two parts of the image. From the point of view of pattern recognition, the best threshold in an Otsu algorithm is the one that produces the best separation between foreground and background classes, which is represented by category variance. For this reason, the within-class variance, between-class variance and total variance are introduced. When the variance of the two groups is maximal, the threshold has been obtained.

3.4. Linear Hough Transform

The Linear Hough Transform (LHT), a linear feature detection algorithm, is popularly applied in pattern recognition and computer vision [49,69,70,71]. It aims to detect potential linear features within a certain class of shapes by making it possible to perform groupings of edge points into object candidates by performing an explicit voting procedure over a set of parameterized image objects [70]. Generally, in the parameter space (X, Y), a line y = ax + b can be represented as a point (a, b). However, vertical lines pose a problem as they give rise to unbounded values of the slope parameter a. Thus, for computational reasons, Duda and Hart [69] proposed the use of the Hesse normal form (Figure 7):
ρ = x cos θ   + y sin θ
where ρ is the distance from the coordinate origin O to the closest point C on the straight line y = ax + b, and θ is the angle between the X axis and the line connecting the origin O with that closest point C. It is therefore possible to associate with each line of the image a pair (ρ, θ). The (ρ, θ) parameter space is also referred to as the Hough space for the set of straight lines in two dimensions. Given a single point in the (ρ, θ) plane, then the set of all straight lines going through that point corresponds to a sinusoidal curve in the (ρ, θ) plane, which is unique to that point. A set of two or more points that form a straight line will produce sinusoids which cross at the (ρ, θ) for that line. Thus, the problem of detecting collinear points can be converted to the problem of finding concurrent curves.
The LHT uses a 2-D matrix, called an accumulator, to detect the existence of a line described by ρ = x cos θ + y sin θ. The dimension of the accumulator equals the number of unknown parameters, i.e., two, based on the quantized values of ρ and θ in the pair (ρ, θ). For each pixel at (x, y) and in its neighborhood, the LHT algorithm determines whether there is enough evidence of a straight line at that pixel. If so, it will calculate the parameters (ρ, θ) for that line, and then look for the accumulator’s bin that the parameters fall into, and increment the value of that bin. By finding the bins with the highest values, typically by looking for the local maximum in the accumulator space, the most likely lines can be detected, and their geometric definitions read off.

3.5. Ground Verification Surveys

In 2013, 2015 and 2018, the senior authors of this paper took part in 10 expeditions to the Dunhuang region and searched suspected sections of the GH from the prospective areas for ground verification. The exploring team was going straight to the suspected sections, which were seen so obvious on the GF-1 satellite imagery, but we took full advantage of the ancient road and the dried rivers’ channel during the marches.

4. Results and Discussion

4.1. M-Statistic of Linear Traces of GH

Table 4 gives the M-statistics obtained for the linear traces in Dunhuang. Unfortunately, all the M values calculated from the spectral channels and their derived products were less than 1.0. This is because linear traces do not have distinctive spectral signatures, being partially or completely covered by layers of water-eroded or wind-weathered soils, gravels or sands (Figure 5).
We also checked all four pansharpened GF-1 MS images individually over the study area. Despite differences in how each pansharpened image accentuates surface characteristics, little difference can be seen. However, the GH’s linear traces are clearly visible in GF-1 PAN image due to the obvious texture characteristics. Image texture gives us information about the spatial arrangement of color or intensities in an image or selected region of an image. Texture information has been an important factor in visual image interpretation. To the GF-1 PAN imagery, it takes into consideration the distribution and variation of neighborhood pixel values.
In this study, because the contrast between the linear traces and their surrounds was very large, processing our previously proposed joint mathematical morphological method [61] was applied to enhance the PAN data before image segmentation was performed.

4.2. Image Segmentation

Figure 8 shows the results of applying the 2-Mode (b) and Iteration methods (c); extra patches are presented because these methods do not take the effect of noise into account. The Otsu approach (d), in particular, had a positive effect on the noise, and was highly sensitive to linear traces of the GH.
A geometric filter was designed and then used to leave the objects that were not of interest out of the patch segmentation based on the Otsu approach. The filtering procedure was based on the area and aspect ratio of each object segmented in the sub-image. Because the GH appeared as linear features in the GF-1 PAN image, we focused only on the approximately rectangular patches that had a small length to width ratio (aspect ratio). Based on the results of field surveys, it was known that the length of the linear trace is often in the range 1000 m to 1200 m—equivalent 500 to 600 pixels in the sub-images—and that the width of the linear trace often ranges from 10 m to 12 m—i.e., equal to 5 to 6 pixels. Thus, the area and aspect ratio thresholds used to remove the objects that were not of interest were set to 500 pixels and 0.01, respectively (Figure 8d). All of the filtered objects were extracted in the LHT processing that followed.

4.3. Automatic Identification of Linear Traces

The final result of LHT processing is a 2-D array which can be understood as a voting accumulator. One dimension of this array is θ and the other is ρ. Each element in the array has a value equal to the sum of the points or pixels that are positioned on the line represented by the parameters (ρ, θ). Therefore, the element with the highest number of votes represents the highest likelihood of the presence of a line in the input data (Figure 9a). Figure 9b shows the automatic linear traces identification results obtained using the image used in the experiment. The GF-1 PAN sub-image of the test site is displayed with the extracted lines in color. It can be seen that the linear traces were extracted well.

4.4. Performance Evaluation

In general, the evaluation of the performance of an archaeological feature extraction algorithm needs an objective and quantitative standard. However, unfortunately, due to the complexity of surroundings, multiple solutions and differences between archaeological sites themselves, it is difficult to achieve accurate evaluation of segmentation and extraction results at the pixel scale. In addition, the comparison of identification results based on statistical analysis is sensitive to the interpretation of ground truth. Thus, drawing on the ideas for accuracy evaluation proposed by Tarantino and Figorito [72], and based on the image characteristics of linear traces, the performance of our proposed approach was qualitatively assessed by grouping linear traces on the basis of their integrity (high, medium, or low), visibility (high, medium, or low) and background complexity (high, medium, or low) (Table 5).
Table 6 shows the integrity, visibility and background complexity together with the level of feature identification for the 12 linear traces described in Table 3. At the same time, based on the automatically identified results, the detected lines were converted into shapefiles, and the length of the automatically extracted linear traces is calculated in ArcGIS 10.1. These were then compared with the manually extracted length to assist in the quantitative evaluation of the accuracy and reliability of the proposed approach. The two ratios: Length True (LT) to Length Manual (LM) and Length False (LF) to LM of were used to assess the accuracy and applicability of the proposed method.
Figure 10 shows that the proposed approach obtained good results when the low background complexity was low (G1, G4, G5 and G12). The low values of the identification level for linear traces G3, G7 and G11 were influenced by the low integrity, high background complexity and textural similarity with the sand dunes. The linear traces extracted manually but not detected automatically are basically archaeological features in GF-1 PAN sub-images with low visibility and multiple breakpoints. As a result, it was possible that linear traces may have been extracted from multiple line segments; that is, the edge features of the linear traces were not effectively recognized. Because of the assumption that linear traces of the GH approximated to straight lines, there was a slight deviation between the locations identified in the results and the actual locations of the linear traces obtained from field surveys. In order to demonstrate the general applicability of the proposed method, experiments were carried out on VHR Google Earth images from other two generations of Great Wall of China. In Figure 11, we report the results obtained by using the proposed approach to Ming Dynasty (1368 A.D.–1644 A.D.) and Western Xia Dynasty (1038 A.D.–1227A.D.). The trace identification is perfect and very encouraging, since wall intersections and deviations, different segments have been detected as a whole.

5. Conclusions

In this paper, an integrated approach to automatically identifying the linear traces of the GH using Chinese GF-1 satellite RS data in Dunhuang, northwest China was proposed. The linear traces at various stages of preservation were first categorized into 12 classes based on image feature analysis and field investigation. An automatic approach, consisting of Otsu segmentation and LHT was then used to identify the linear traces in VHR GF-1 PAN data. The results indicated that the proposed approach could help in automatic identification of linear traces of the GH in different environmental contexts.
For linear traces of the GH with simple or low background complexity, the proposed method based on Otsu segmentation algorithm and LHT can realize automatically identified and extracted the linear traces well. In areas of high background complexity, however, there are often objects similar to or even identical to the linear texture features of the GH in GF-1 PAN images. Therefore, some noise objects appeared in the segmentation results, which increased the background complexity to a certain extent. At the same time, when linear traces are detected and extracted using the LHT, due to the effects of the integrity and visibility of linear traces themselves, there will be a certain amount of false identification. To improve the accuracy of the results this needs to be deleted manually in combination with actual application in the later stages of comprehensive archaeological mapping.
Due to paleochannels, yardang landforms, and obscuring with sediments and sand dunes, the visibility of the linear traces varies. In this study, most of the linear traces are clear (High and Medium) from a satellite-view in light of the geometric and texture characteristics. The integrity of the linear traces is mainly affected by the seasonal flooding and anthropogenic activities (such as construction of power lines and roads). The use of remote sensing methods for the automated detection of archaeological features and landscape patterns is still in its infancy. The quantitative evaluation described here has shown that the automatic identification of linear traces of the GH can be successfully performed in this study.
All of these problems need to be dealt with in future work. Additionally, the identification of non-linear traces of the GH will pose a greater challenge to the proposed approach. The automatic identification based on the Otsu segmentation method and LHT can recognize some linear noise or linear background objects as linear traces. Because of the limited resolution of GF-1 PAN imagery, linear traces in the imagery cannot truly and objectively reflect the actual characteristics of the GH.

Author Contributions

In this paper, L.L. drafted the manuscript and was responsible for the research design, experiment and analysis. X.W. provided the space archaeology theory and the historic-geographical information of Silk Road. P.S., N.B. and L.Z. supported the data preparation and the interpretation of the results. J.S. and C.L. provided fieldwork data and technical supports. Y.Y. gave environmental archaeological analysis. All of the authors contributed to editing and reviewing the manuscript.

Funding

This work was funded by the National Natural Science Foundation of China (Grant No. 41801345), the Strategic Priority Research Program of the CAS (Grant No. XDA19030504, XDA19030502) and the Open-Fund Project of National-Local Joint Engineering Laboratory on Digital Preservation and Innovative Technologies for the Culture of Traditional Villages and Towns.

Acknowledgments

The authors thank four anonymous reviewers for their helpful comments, which improved this manuscript. Many thanks are due to China Centre for Resource Satellite Data and Applications for providing the GF-1 VHR remote sensing data that were used in this study.

Conflicts of Interest

The authors declare no conflict of interest.

References

  1. Wang, G. The Evolution of the Great Wall of China; The Commercial Press: Shanghai, China, 1928. (In Chinese) [Google Scholar]
  2. Jing, A. The History of the Great Wall of China; Shanghai People’s Publishing House: Shanghai, China, 2006. (In Chinese) [Google Scholar]
  3. Waldron, A. The Great Wall of China: From History to Myth; Cambridge University Press: Cambridge, UK, 1992. [Google Scholar]
  4. Luo, L. Space Archaeology for Tunshu Sites along the South Route of the Ancient Silk Road. Ph.D. Thesis, University of Chinese Academy of Sciences, Beijing, China, 2016. (In Chinese). [Google Scholar]
  5. Zhang, W. The Construction System of the Great Wall of China; Zhonghua Book Company: Beijing, China, 1976. (In Chinese) [Google Scholar]
  6. Waltner, A. Review of Arthur Waldron, The Great Wall of China: From History to Myth. J. Orient. Stud. 1992, 19, 255–256. [Google Scholar]
  7. Su, H.; Qu, L.; He, K.; Zhang, Z.; Wang, J.; Chen, Z.; Gu, H. The Great Wall of China: A physical barrier to gene flow? Heredity 2003, 90, 212. [Google Scholar] [CrossRef] [PubMed]
  8. Lattimore, O. Origins of the Great Wall of China: A Frontier Concept in Theory and Practice. Geogr. Rev. 1937, 27, 529–549. [Google Scholar] [CrossRef]
  9. Sima, Q. Shiji; Zhonghua Book Company: Beijing, China, 1962. First published 91 BC. (In Chinese) [Google Scholar]
  10. Ban, G. HanShu; Zhonghua Book Company: Beijing, China, 1962. First published 92 BC. (In Chinese) [Google Scholar]
  11. Xu, P. The Archaeology of the Great Wall of the Qin and Han Dynasties. J. East Asian Archaeol. 2001, 3, 259–281. [Google Scholar]
  12. Duan, Q.; Xu, W. The Discovery and Research of the Great Wall of China; Science Press: Beijing, China, 2014. (In Chinese) [Google Scholar]
  13. Stein, A. Serindia; Clarendon Press: Oxford, UK, 1921. [Google Scholar]
  14. Li, Z. Sites of the Great Wall and beacon towers in Dunhuang prefecture (Synopsis). Dunhuang Res. 1995, 2, 120–126. (In Chinese) [Google Scholar]
  15. Li, B. An oasis disappeared between Guazhou and Shazhou. Dunhuang Res. 1994, 3, 71–78. (In Chinese) [Google Scholar]
  16. Li, B. Yihe and Central military towns of Dunhuang prefecture in the Han Dynasty. J. Northwest Norm. Univ. (Social Sci.) 1995, 32, 93–96. (In Chinese) [Google Scholar]
  17. Li, B. Courier stations from Guazhou to Shazhou in the Tang Dynasty. In Historical Geography; Chen, Q., Zou, Y., Eds.; Shanghai People Press: Shanghai, China, 1996; pp. 93–101. (In Chinese) [Google Scholar]
  18. Li, Z. Collation and Annotation of Dunhuang Manuscripts; Gansu People Press: Lanzhou, China, 2008. (In Chinese) [Google Scholar]
  19. Luo, L.; Wang, X.; Liu, C.; Guo, H.; Du, X. Integrated RS, GIS and GPS Approaches to Archaeological Prospecting in the Hexi Corridor, NW China: A Case Study of the Royal Road to Ancient Dunhuang. J. Archaeol. Sci. 2014, 50, 178–190. [Google Scholar] [CrossRef]
  20. Huang, Y.; Xu, W. Research on the Great Wall of Han Dynasty: A review. J. Chin. Hist. Stud. 2012, 5, 40–47. (In Chinese) [Google Scholar]
  21. Stein, A. Innermost Asia: Detailed Report of Explorations in Central Asia, Kansu and Eastern Iran, Carried Out and Described under the Orders of H. M. Indian Government; Clarendon Press: Oxford, UK, 1928. [Google Scholar]
  22. Hedin, S. Scientific Results of a Journey in Central Asia 1899–1902; Lithographic Institute of the General Staff of the Swedish Army: Stockholm, Sweden, 1907. [Google Scholar]
  23. Xiang, D. Zhong Xi Jiao Tong Shi; Zhonghua Book Company: Beijing, China, 1930. [Google Scholar]
  24. Xia, N. Archaeological investigations in Dunhuang. Archaeol. Lett. 1955, 1, 1–3. (In Chinese) [Google Scholar]
  25. Yan, W. Archaeological investigations in Hexi corridor. Cult. Herit. Ref. Mater. 1953, 12, 53–71. (In Chinese) [Google Scholar]
  26. Wu, R. Hexi Han Sai Diao Cha Yu Yan Jiu; Cultural Relics Press: Beijing, China, 2005. (In Chinese) [Google Scholar]
  27. Wang, G. Guang Tang Ji Lin; Zhonghua Book Company: Beijing, China, 1961. [Google Scholar]
  28. Zhang, D. Station Troops to Open-up Wasteland of Western Region in the Han Dynasty Based on the Han Slips from Xuanquan. Dunhuang Res. 2001, 3, 113–121. (In Chinese) [Google Scholar]
  29. Luo, L.; Wang, X.; Guo, H.; Lasaponara, R.; Zong, X.; Masini, N.; Wang, G.; Shi, P.; Khatteli, H.; Chen, F.; et al. Airborne and spaceborne remote sensing for archaeological and cultural heritage applications: A review of the century (1907–2017). Remote Sens. Environ. 2019, 232, 111280. [Google Scholar] [CrossRef]
  30. Verhoeven, G.; Sevara, C. Trying to break new ground in aerial archaeology. Remote Sens. 2016, 8, 918. [Google Scholar] [CrossRef]
  31. Lasaponara, R.; Yang, R.; Chen, F.; Li, X.; Masini, N. Corona satellite pictures for archaeological studies: A review and application to the lost Forbidden City of the Han–Wei Dynasties. Surv. Geophys. 2018, 39, 1303–1322. [Google Scholar] [CrossRef]
  32. Doneus, M. Precision mapping and interpretation of oblique aerial photographs. Archaeol. Prospect. 2001, 8, 13–27. [Google Scholar] [CrossRef]
  33. Lin, A.; Novo, A.; Har-Noy, S.; Ricklin, N.; Stamatiou, K. Combining GeoEye-1 satellite remote sensing, UAV aerial imaging, and geophysical surveys in anomaly detection applied to archaeology. IEEE J. Sel. Top. Appl. Earth Observ. Remote Sens. 2011, 4, 870–876. [Google Scholar] [CrossRef]
  34. Agapiou, A.; Lysandrou, V.; Lasaponara, R.; Masini, N.; Hadjimitsis, D.G. Study of the Variations of Archaeological Marks at Neolithic Site of Lucera, Italy Using High-Resolution Multispectral Datasets. Remote Sens. 2016, 8, 723. [Google Scholar] [CrossRef]
  35. Luo, L.; Wang, X.; Liu, J.; Zheng, W.; Zhen, J.; Zhu, L.; Liu, C.; Wan, H. Low-Cost Archaeological Investigation and Rapid Mapping of Ancient Stone Tidal Weirs in the Penghu Archipelago Using Google Earth. Sustainability 2019, 11, 4536. [Google Scholar] [CrossRef]
  36. Cerra, D.; Agapiou, A.; Cavalli, R.M.; Sarris, A. An Objective Assessment of Hyperspectral Indicators for the Detection of Buried Archaeological Relics. Remote Sens. 2018, 10, 500. [Google Scholar] [CrossRef]
  37. Abate, N.; Lasaponara, R. Preventive Archaeology Based on Open Remote Sensing Data and Tools: The Cases of Sant’Arsenio (SA) and Foggia (FG), Italy. Sustainability 2019, 11, 4145. [Google Scholar] [CrossRef]
  38. Kalayci, T.; Lasaponara, R.; Wainwright, J.; Masini, N. Multispectral Contrast of Archaeological Features: A Quantitative Evaluation. Remote Sens. 2019, 11, 913. [Google Scholar] [CrossRef]
  39. Tapete, D.; Cigna, F.; Donoghue, D. ‘Looting marks’ in space-borne SAR imagery: Measuring rates of archaeological looting in Apamea (Syria) with TerraSAR-X Staring Spotlight. Remote Sens. Environ. 2016, 178, 42–58. [Google Scholar] [CrossRef]
  40. Tapete, D.; Cigna, F. COSMO-SkyMed SAR for Detection and Monitoring of Archaeological and Cultural Heritage Sites. Remote Sens. 2019, 11, 1326. [Google Scholar] [CrossRef]
  41. Zhu, X.; Chen, F.; Guo, H. Reconstruction of the Water Cultivation Paleoenvironment Dating Back to the Han and Tang Dynasties Surrounding the Yangguan Frontier Pass Using X- and L-Band SAR Data. Remote Sens. 2018, 10, 1536. [Google Scholar] [CrossRef]
  42. Stewart, C.; Oren, E.; Cohen-Sasson, E. Satellite remote sensing analysis of the Qasrawet archaeological site in North Sinai. Remote Sens. 2018, 10, 1090. [Google Scholar] [CrossRef]
  43. Masini, N.; Gizzi, F.; Biscione, M.; Fundone, V.; Sedile, M.; Sileo, M.; Pecci, A.; Lacovara, B.; Lasaponara, R. Medieval archaeology under the canopy with LiDAR. The (re)discovery of a medieval fortified settlement in Southern Italy. Remote Sens. 2018, 10, 1598. [Google Scholar] [CrossRef]
  44. Canuto, M.; Estrada-Belli, F.; Garrison, T.; Houston, S.; Acuna, M.; Kovac, M.; Marken, D.; Nondedeo, P.; Auld-Thomas, L.; Castanet, C.; et al. Ancient lowland Maya complexity as revealed by airborne laser scanning of northern Guatemala. Science 2018, 361, eaau0137. [Google Scholar] [CrossRef]
  45. Doneus, M.; Doneus, N.; Briese, C.; Pregesbauer, M.; Mandlburger, G.; Verhoeven, G. Airborne laser bathymetry—Detecting and recording submerged archaeological sites from the air. J. Archaeol. Sci. 2013, 40, 2136–2151. [Google Scholar] [CrossRef]
  46. Zeng, C.; Gu, W.; Liu, J. Remote sensing investigation of Great Wall in Beijing. Remote Sens. Inform. 1987, 1, 7–9. (In Chinese) [Google Scholar]
  47. Luo, L.; Wang, X.; Guo, H.; Lasaponara, R.; Shi, P.; Bachagha, N.; Li, L.; Yao, Y.; Masini, N.; Chen, F. Google Earth as a Powerful Tool for Archaeological and Cultural Heritage Applications: A Review. Remote Sens. 2018, 10, 1558. [Google Scholar] [CrossRef]
  48. Guo, H. Spaceborne multifrequency, polarametric and interferometric radar for detection of the targets on earth surface and subsurface. J. Remote Sens. 1997, 1, 32–39. (In Chinese) [Google Scholar]
  49. Chen, J.; Jin, S.; Liao, A.; Zhao, Y.; Zhang, H.; Rong, D.; Yang, Z. Stereo mapping of Ming Great Wall with remote sensing. Chin. Sci. Bull. 2010, 55, 2290–2294. [Google Scholar] [CrossRef]
  50. Li, Y. The Research of Military Fortresses of Nine Defense Areas along the Great Wall in Ming Dynasty. Ph.D. Thesis, Tianjin University, Tainjin, China, 2007. (In Chinese). [Google Scholar]
  51. Liu, J. Research on Gansu-Town’s Defense System and its Spatial Analysis of the Great Wall in Ming Dynasty. Ph.D. Thesis, Tianjin University, Tainjin, China, 2013. (In Chinese). [Google Scholar]
  52. Ruan, H.; Wang, N.; Niu, Z.; Jia, P. Spatial pattern of ancient city sites and its driving forces in Mu Us Sandy Land during Han Dynasty. Acta Geogr. Sin. 2016, 71, 873–882. (In Chinese) [Google Scholar]
  53. Davis, D. Object-based image analysis: A review of developments and future directions of automated feature detection in landscape archaeology. Archaeol. Prospect. 2018, 1–9. [Google Scholar] [CrossRef]
  54. De Laet, V.; Paulissen, E.; Waelkens, M. Methods for the extraction of archaeological features from very high-resolution Ikonos-2 remote sensing imagery, Hisar (southwest Turkey). J. Archaeol. Sci. 2007, 34, 830–841. [Google Scholar] [CrossRef]
  55. Lasaponara, R.; Leucci, G.; Masini, N.; Persico, R.; Scardozzi, G. Towards an Operative Use of Remote Sensing for Exploring the Past Using Satellite Data: The Case Study of Hierapolis (Turkey). Remote Sens. Environ. 2016, 174, 148–164. [Google Scholar] [CrossRef]
  56. D’Orazio, T.; Da Pelo, P.; Marani, R.; Guaragnella, C. Automated Extraction of Archaeological Traces by a Modified Variance Analysis. Remote Sens. 2015, 7, 3565–3587. [Google Scholar] [CrossRef]
  57. Traviglia, A.; Torsello, A. Landscape Pattern Detection in Archaeological Remote Sensing. Geosciences 2017, 7, 128. [Google Scholar] [CrossRef]
  58. Figorito, B.; Tarantino, E. Semi-automatic detection of linear archaeological traces from orthorectified aerial images. Int. J. Appl. Earth Obs. Geoinf. 2014, 26, 458–463. [Google Scholar] [CrossRef]
  59. Luo, L.; Wang, X.; Guo, H.; Liu, C.; Liu, J.; Li, L.; Du, X.; Qian, G. Automated extraction of the archaeological tops of Qanat Shafts from VHR imagery in Google Earth. Remote Sens. 2014, 6, 11956–11976. [Google Scholar] [CrossRef]
  60. Trier, Ø.; Cowley, D.; Waldeland, A. Using deep neural networks on airborne laser scanning data: Results from a case study of semi-automatic mapping of archaeological topography on Arran, Scotland. Archaeol. Prospect. 2018, 1–11. [Google Scholar] [CrossRef]
  61. Luo, L.; Wang, X.; Lasaponara, R.; Xiang, B.; Zhen, J.; Zhu, L.; Yang, R.; Liu, D.; Liu, C. Auto-Extraction of Linear Archaeological Traces of Tuntian Irrigation Canals in Miran Site (China) from Gaofen-1 Satellite Imagery. Remote Sens. 2018, 10, 718. [Google Scholar] [CrossRef] [Green Version]
  62. Trimble. GeoExplorer 6000 Series GeoXR User Guide; Trimble: Sunnyvale, CA, USA, 2015. [Google Scholar]
  63. Exelis VIS. ENVI 5.4; Exelis VIS: Boulder, CO, USA, 2016. [Google Scholar]
  64. Lasaponara, R.; Masini, N. Satellite Remote Sensing: A New Tool for Archaeology; Springer: Berlin, Germany, 2012. [Google Scholar]
  65. Kaufman, Y.; Remer, L. Detection of Forests Using Mid-IR Reflectance: An Application for Aerosol Studies. IEEE Trans. Geosci. Remote Sens. 1994, 32, 672–683. [Google Scholar] [CrossRef]
  66. Ostu, N. A threshold selection method from gray-histogram. IEEE Trans. Syst. Man Cybern.-Syst. 1979, 9, 62–66. [Google Scholar]
  67. Zhang, J.; Hu, J. Image segmentation based on 2D Otsu method with histogram analysis. In Proceeding of the International Conference on Computer Science and Software Engineering, Wuhan, China, 12–14 December 2008; pp. 105–108. [Google Scholar]
  68. Vala, H.; Baxi, A. A review on Otsu image segmentation algorithm. Int. J. Adv. Res. Comput. Eng. Technol. (IJARCET) 2013, 2, 387. [Google Scholar]
  69. Duda, R.; Hart, P. Use of the Hough transformation to detect lines and curves in pictures. Commun. ACM 1972, 15, 11–15. [Google Scholar] [CrossRef]
  70. Hough, P. Method and Means for Recognizing Complex Patterns. U.S. Patent No. 3,069,654, 18 December 1962. [Google Scholar]
  71. Shapiro, L.; Stockman, G. Computer Vision; Prentice-Hall, Inc.: Upper Saddle River, NJ, USA, 2001; p. 304. [Google Scholar]
  72. Tarantino, E.; Figorito, B. Steerable Filtering in Interactive Tracing of Archaeological Linear Features Using Digital True Color Aerial Images. Int. J. Digit. Earth 2014, 7, 870–880. [Google Scholar] [CrossRef]
Figure 1. General locations of the Great Wall of Han Dynasty (GH) (a) and the topography of Hexi Corridor (b) in China; the dotted lines represent different sections of the GH in Hexi Corridor.
Remotesensing 11 02711 g001
Figure 2. The locations of the Dunhuang Section of the GH and ancient Dunhuang in Stein’s [21] (a) and Hedin’s [22] (b) archaeological maps, which can be downloaded from http://dsr.nii.ac.jp/. The red and blue circles indicated that the absence of the GH.
Remotesensing 11 02711 g002
Figure 3. (a) Map of ancient Dunhuang Prefecture and the Dunhuang Section of GH; the yellow dotted lines represent the general location of GH; the names in white text indicate the approximate locations of the major oasis counties during the Early Han Dynasty. The basemap for (a) was the Enhanced Thematic Mapper Plus (ETM+) imagery, which can be downloaded from http://www.usgs.gov. (b) Photograph of a military fort at the Jade-gate Pass; (c) photograph of a beacon tower at Yangguan Pass.
Remotesensing 11 02711 g003
Figure 4. Field photograph showing the natural profile of a typical segment of the GH with remained walls on the ground in Dunhuang.
Remotesensing 11 02711 g004
Figure 5. Gaofen-1 (GF-1) multispectral (MS) image (RGB432) (a) and panchromatic (PAN) image (b) of the linear traces of GH in Dunhuang. (c) 2 m GF-1 PMS pansharpened data (RGB432); the white arrows in (b) indicate the linear traces and the red circles in (c) represent the remaining beacon towers (dg).
Remotesensing 11 02711 g005
Figure 6. Spatial coverage of GF-1 PMS data in this study is shown by blue rectangles. The black numbers in the rectangles indicate the general location of 12 selected typical linear traces.
Remotesensing 11 02711 g006
Figure 7. Schematic diagram of the Hough Transform used for line detection.
Remotesensing 11 02711 g007
Figure 8. Threshold-based segmentation results for the GF-1 PAN sub-image: (a) original image, (b) original image after 2-Mode, (c) original image after Iteration and (d) original image after applying Otsu’s method with geometric filtering. The white arrows in (a) indicate linear traces of GH.
Remotesensing 11 02711 g008
Figure 9. (a) The voting results in (ρ, θ)-parameter space obtained using the image shown in Figure 8d: the two peak points (white squares) indicate that two potential lines were present in the original image. (b) The LHT-based line detection results: the magenta lines represent the identified linear traces; the yellow and red points represent the start and end points of the extracted lines, respectively.
Remotesensing 11 02711 g009
Figure 10. Results of automatic identification of 12 typical linear traces. Magenta lines represent the identified fragments of linear traces, and yellow and red points represent the start and end points of the extracted lines, respectively.
Remotesensing 11 02711 g010
Figure 11. Application of the proposed method to Google Earth very high-resolution (VHR) images in order to identify linear traces of the Ming generation of the Great Wall in Heaton Corridor (a), (105°47′42″ E, 38°12′55″ N)) and the Western Xia generation in Inner Mongolia (b), (106°01′34″ E, 41°43′03″ N)).
Remotesensing 11 02711 g011
Table 1. GF-1 panchromatic and multispectral (PMS) data used in Dunhuang.
ID (See Figure 2 for Location)SensorAcquisition Date
GF1_PMS1_E93.6_N40.3PMS2014-07-30
GF1_PMS1_E93.9_N40.3PMS2014-08-03
GF1_PMS2_E94.1_N40.5PMS2014-07-30
GF1_PMS2_E94.4_N40.5PMS2014-08-03
GF1_PMS1_E94.9_N40.5PMS2014-09-17
GF1_PMS2_E95.3_N40.5PMS2014-04-06
GF1_PMS2_E95.7_N40.5PMS2014-09-17
GF1_PMS1_E96.1_N40.5PMS2014-08-15
GF1_PMS2_E96.4_N40.5PMS2014-09-25
GF1_PMS1_E96.6_N40.5PMS2014-04-18
Table 2. Characteristics of GF-1 PMS data.
SensorsWavelength/μmSpatial Resolution/m
GF-1 PMSPAN0.45–0.902
MSB1-Blue: 0.45–0.528
B2-Green: 0.52–0.59
B3-Red: 0.63–0.69
B4-NIR: 0.77–0.89
Table 3. Image characteristics of 12 typical linear traces in GF-1 PAN data.
TypesGF-1 PAN Sub-Images of Linear TracesWalls?Field Photos
G1 Remotesensing 11 02711 i001No Remotesensing 11 02711 i002
G2 Remotesensing 11 02711 i003Yes Remotesensing 11 02711 i004
G3 Remotesensing 11 02711 i005No Remotesensing 11 02711 i006
G4 Remotesensing 11 02711 i007No Remotesensing 11 02711 i008
G5 Remotesensing 11 02711 i009No Remotesensing 11 02711 i010
G6 Remotesensing 11 02711 i011Yes Remotesensing 11 02711 i012
G7 Remotesensing 11 02711 i013No Remotesensing 11 02711 i014
G8 Remotesensing 11 02711 i015Yes Remotesensing 11 02711 i016
G9 Remotesensing 11 02711 i017No Remotesensing 11 02711 i018
G10 Remotesensing 11 02711 i019Yes Remotesensing 11 02711 i020
G11 Remotesensing 11 02711 i021No Remotesensing 11 02711 i022
G12 Remotesensing 11 02711 i023No Remotesensing 11 02711 i024
Table 4. M-statistic for linear traces of GH in Dunhuang.
Bandsμ1μ2σ1 + σ2M
B1-Blue1.546.240.25
B2-Green2.539.130.28
B3-Red3.769.020.42
B4-NIR3.9210.880.36
PAN2.865.550.52
NDVI1.0111.340.09
PCA13.458.570.40
PCA22.9318.110.16
PCA33.3814.960.23
PCA43.6718.330.20
Table 5. Score categories used for the assessment of integrity, visibility and background complexity of processed the linear traces in Dunhuang.
IntegrityVisibilityBackground Complexity
HighNo gapsHigh contrast with backgroundHomogeneous background
MediumLess than 2 gaps and gap lengths always less than 3 mIntermediate conditionsHeterogeneous Background
LowMore than 2 gaps and gap lengths greater than 3 mPoorly defined contourHeterogeneous Background
Table 6. Specific characteristics of the 12 typical linear traces of the GH and the results obtained using the proposed identification method.
Linear Trace of GHIntegrityVisibilityBackground ComplexityIdentification LevelLT/mLF/mMl/mLT/LM × 100%LF/LM × 100%
G1HighHighLowHigh8050100080.5%0
G2MediumMediumHighMedium6200100062.0%0
G3LowLowMediumLow350720100035.0%72.0
G4HighHighLowHigh10800120090.0%0
G5HighHighLowHigh8100100081.0%0
G6MediumMediumHighMedium685315100068.5%31.5
G7LowLowHighLow7902050100079.0%205.0
G8MediumMediumHighMedium535505100053.5%50.5
G9MediumMediumHighMedium800395100076.5%39.5
G10MediumHighMediumHigh8300100083.0%0
G11LowLowHighLow300605100030.0%60.5
G12HighHighLowHigh8550100085.5%0

