Sensors, Features, and Machine Learning for Oil Spill Detection and Monitoring: A Review

 ,
,  ,
,  , and
, and
Abstract
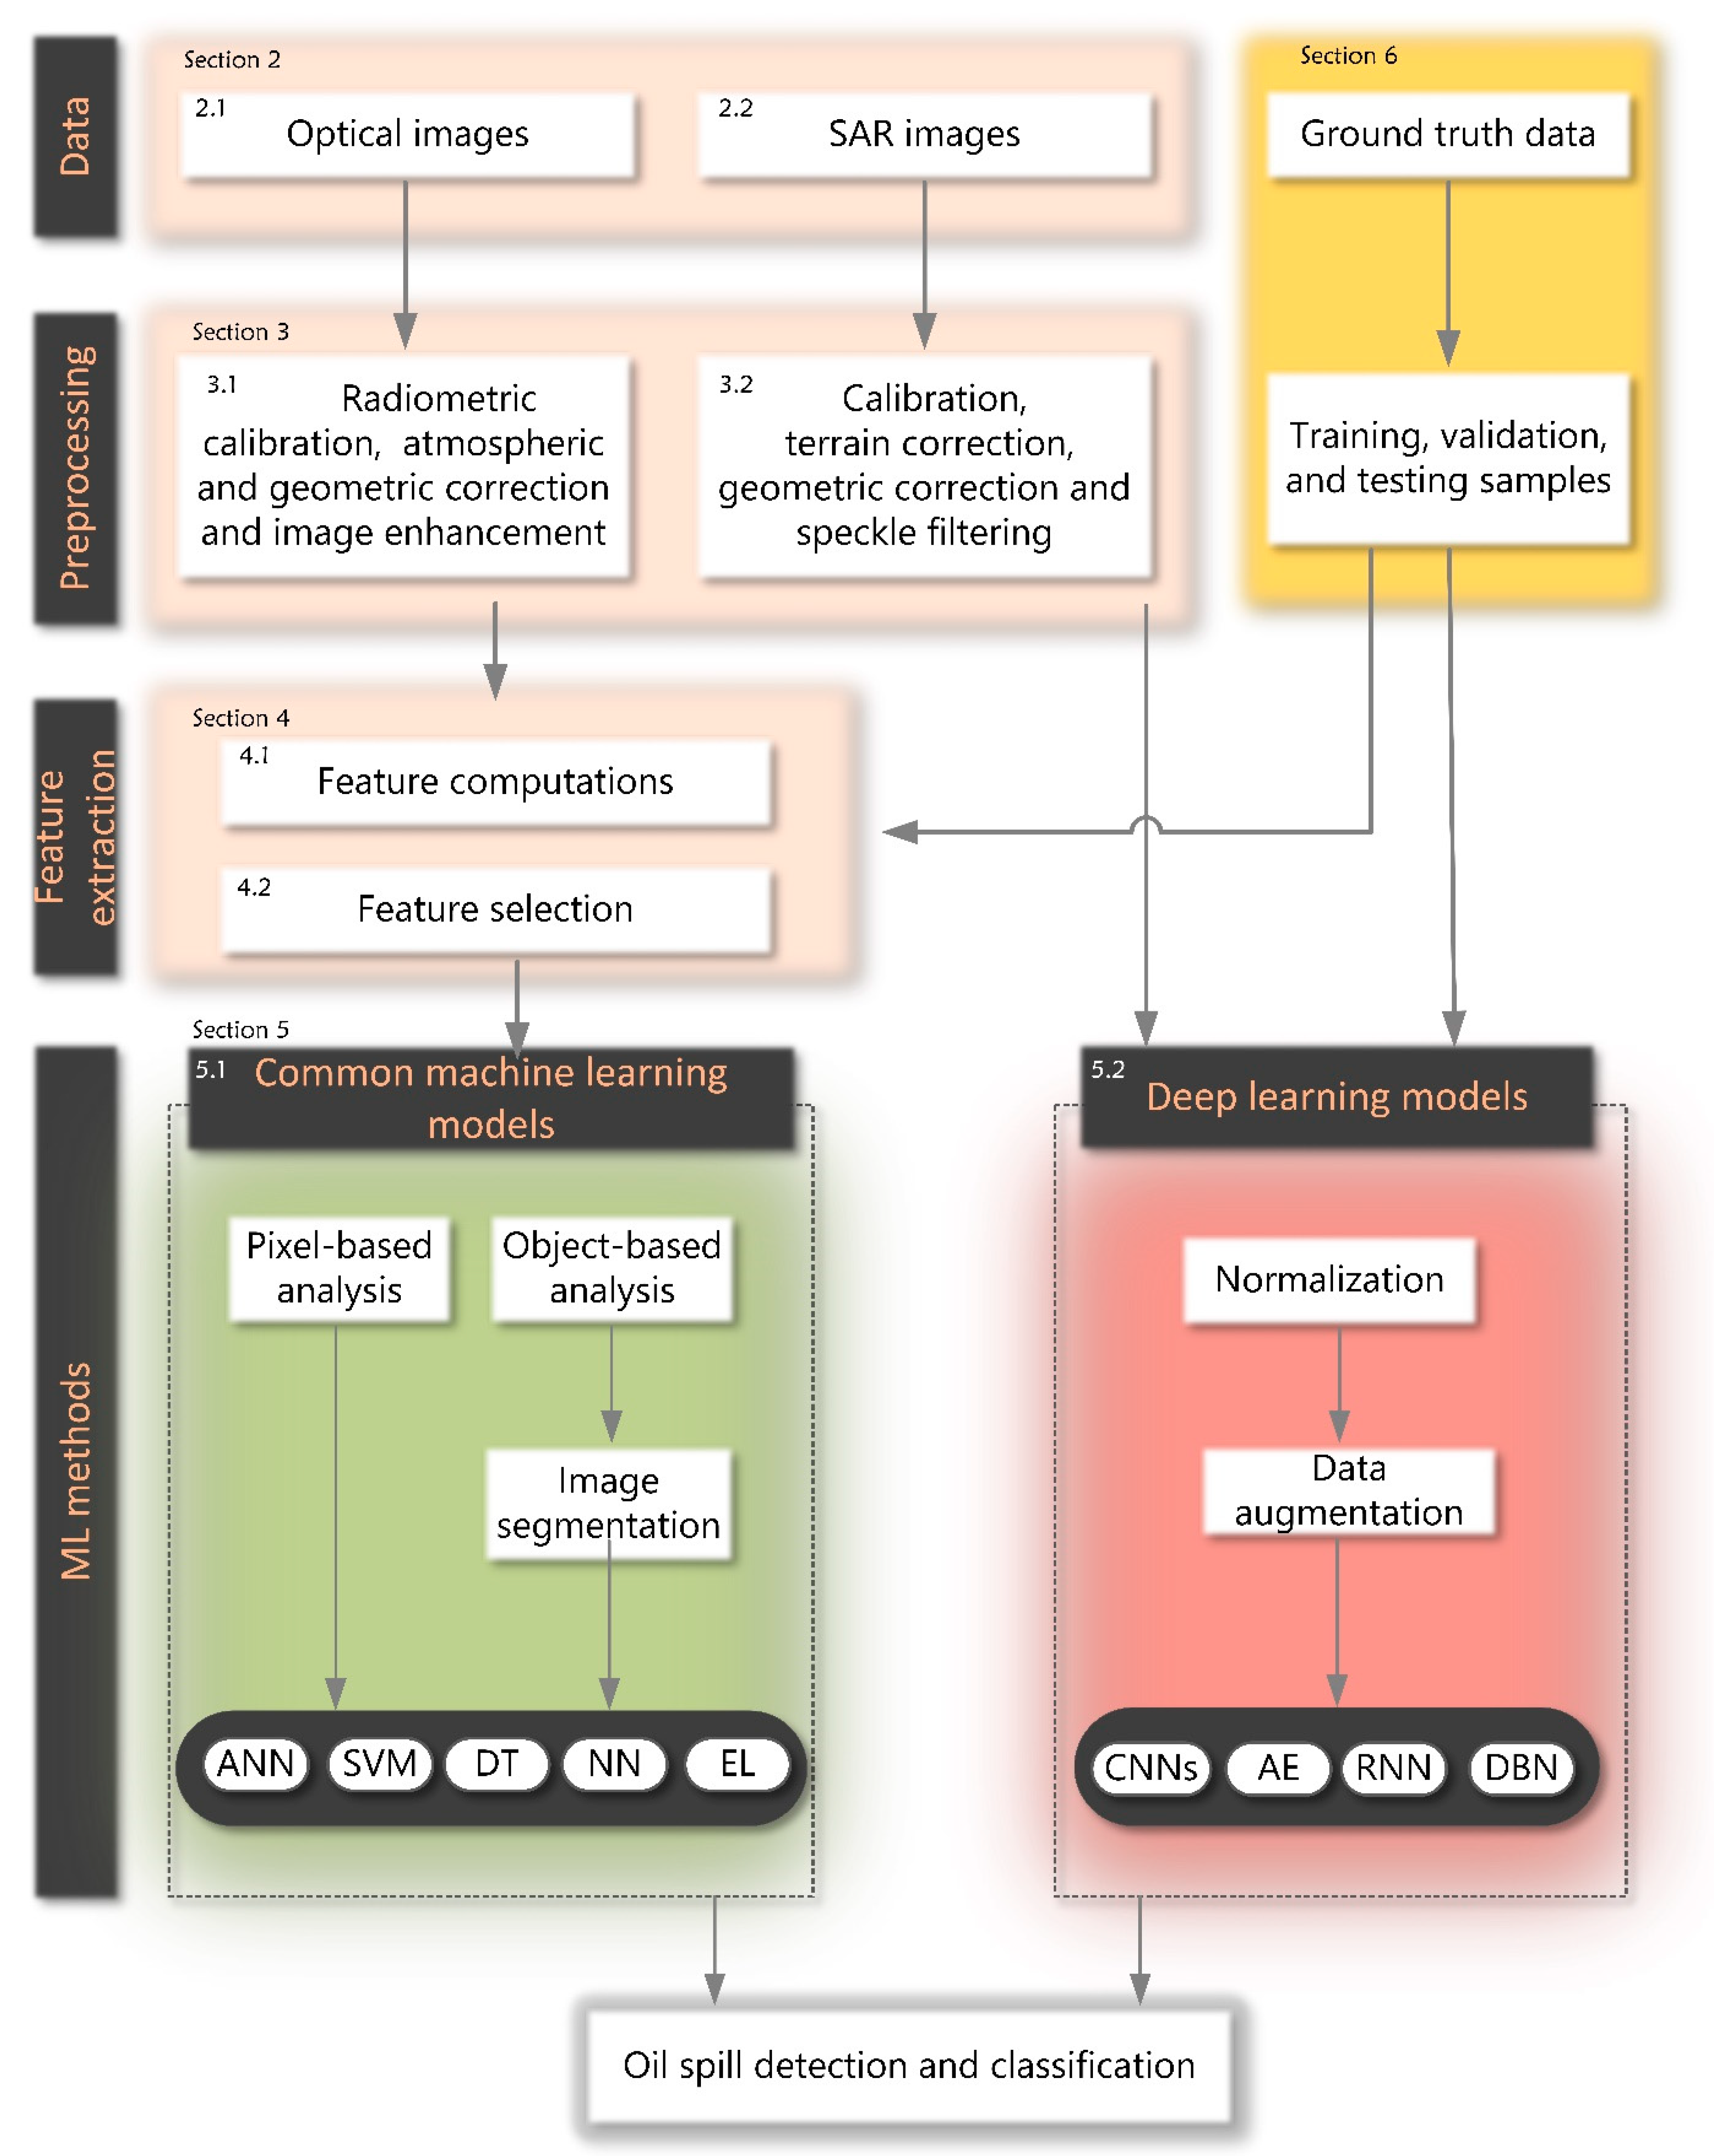
:1. Introduction
2. Remotely Sensed Data
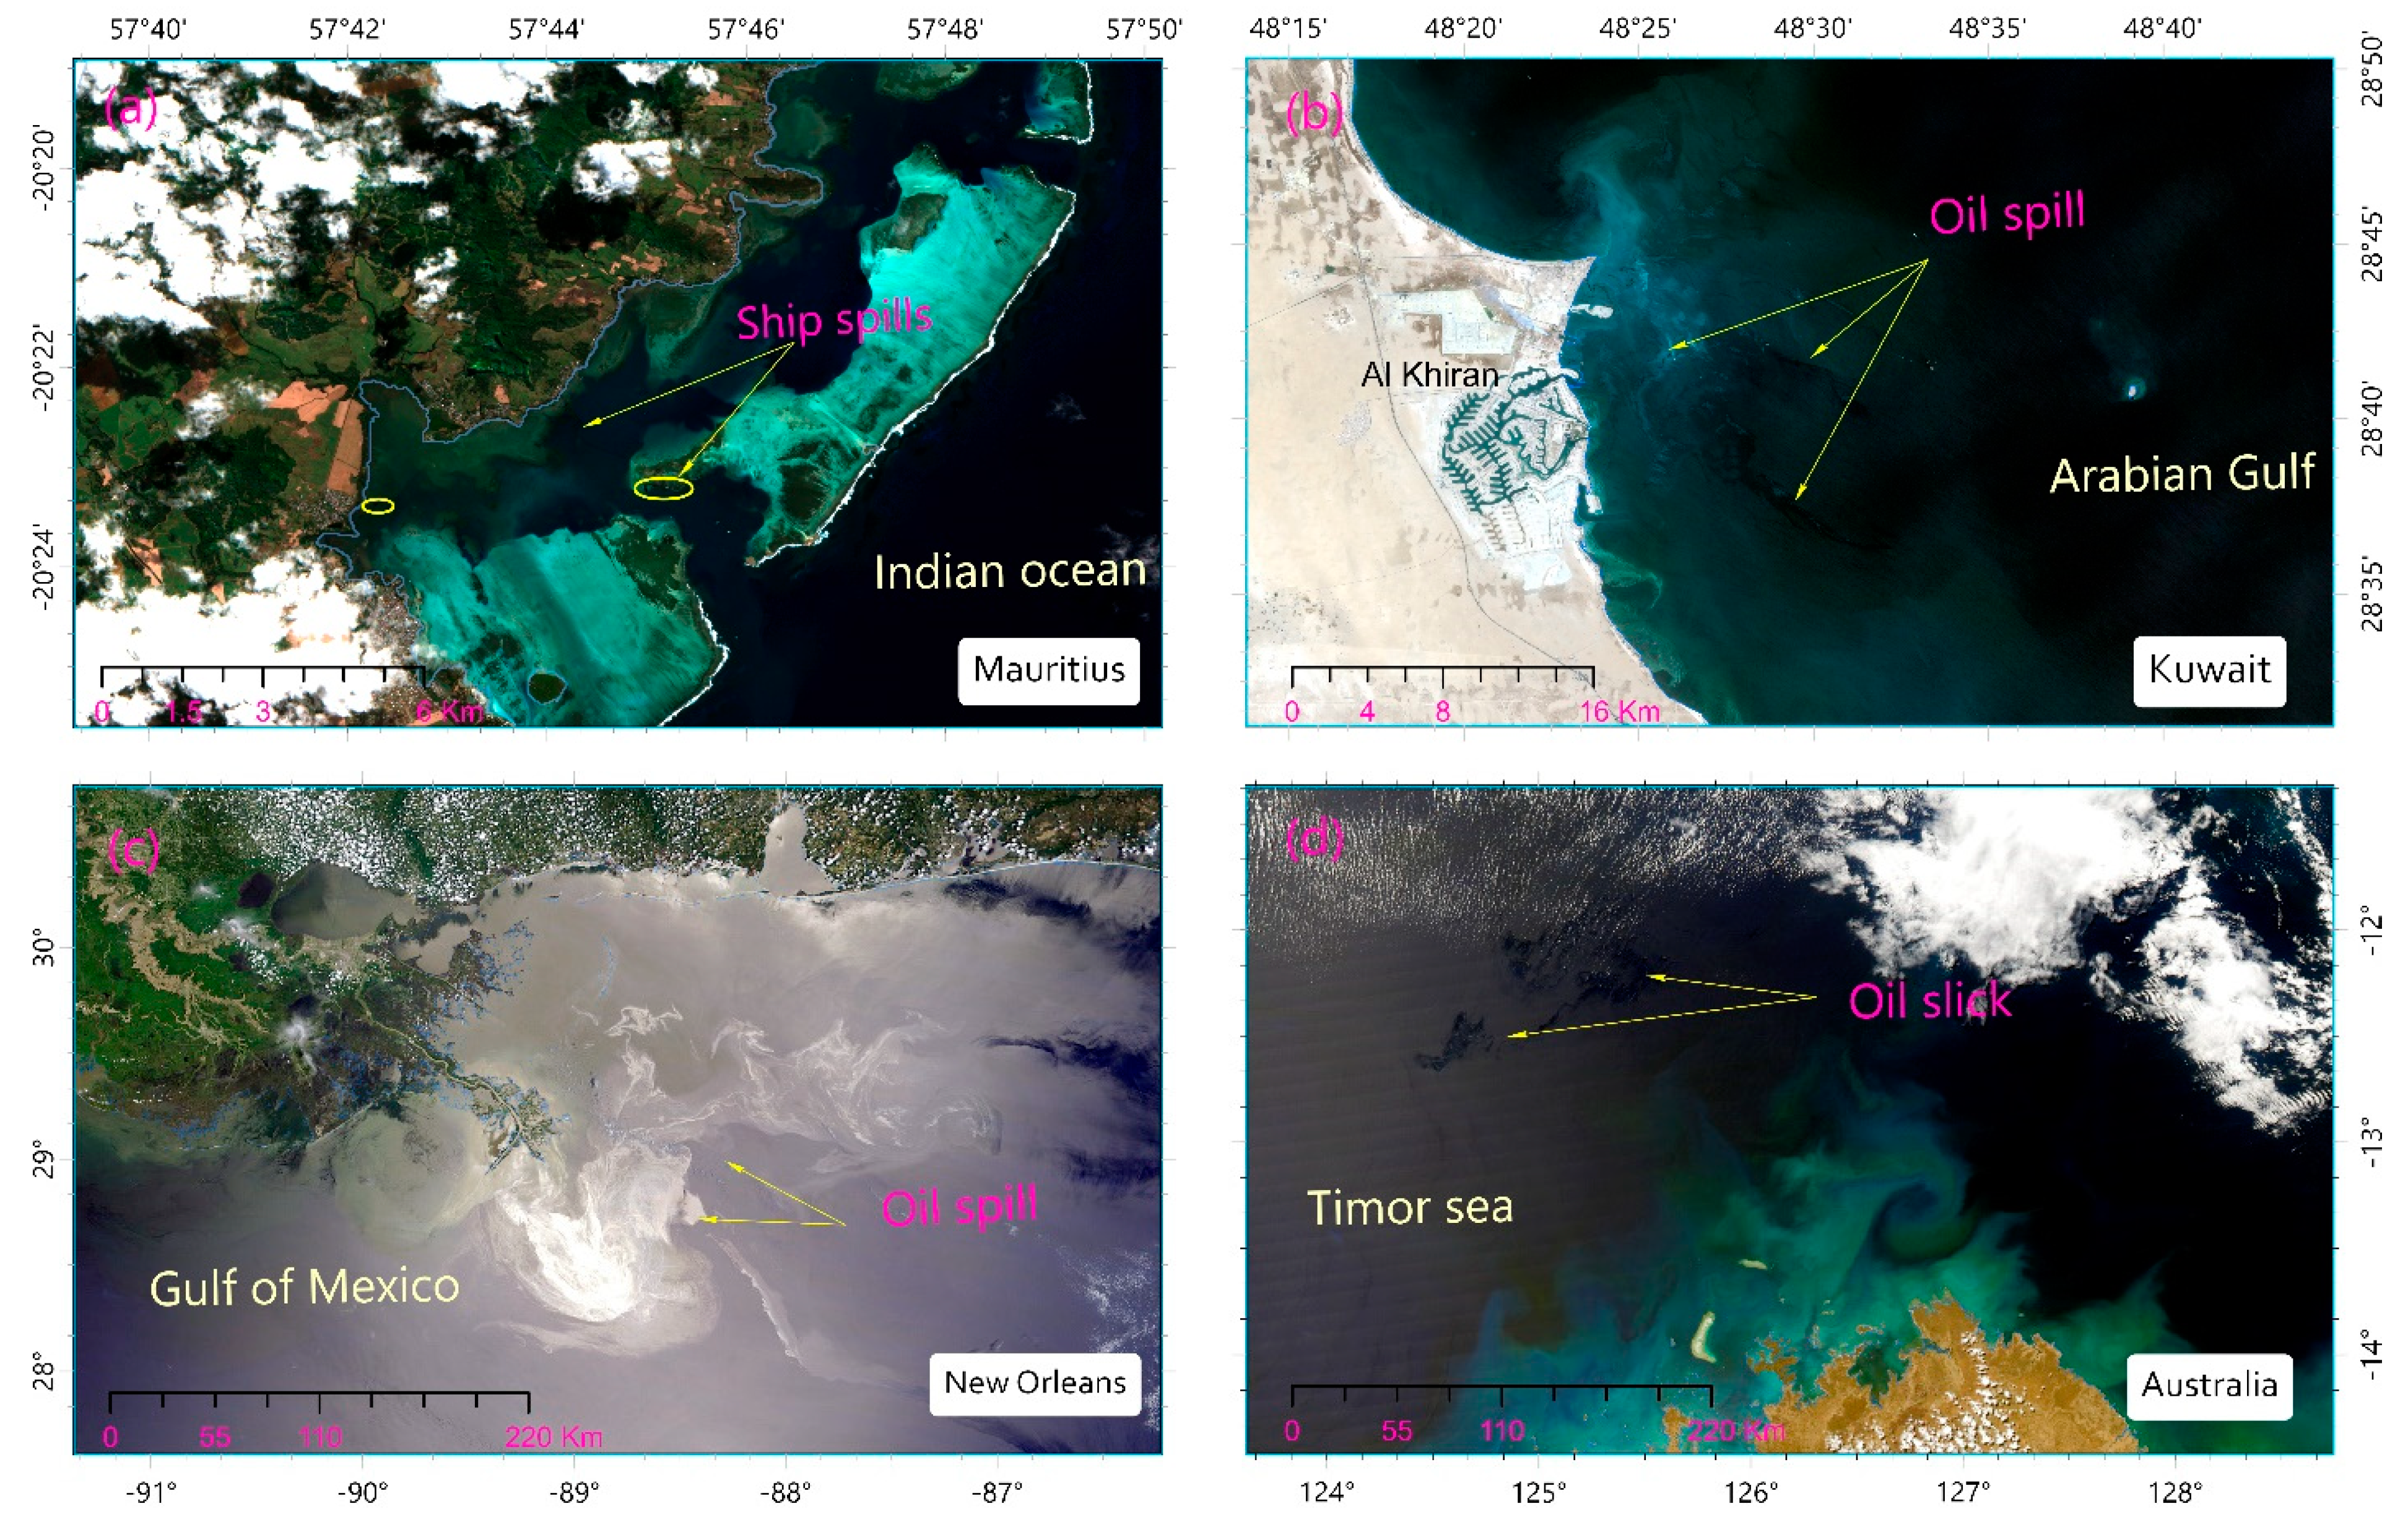
2.1. Optical Data

| Satellite | Spectral Region (Bands) | Range (µm) | Spatial ResolUtion (m) | Revisit Time (Days) | Operation | References |
|---|---|---|---|---|---|---|
| MODIS (Terra, Aqua) | VIS, NIR, MIR, SWIR,55 LWIR (36 spectral bands) | B1–19 (0.405–2.155) B 20-36 (3.66–14.28) | 250,500, 1000 m | 1–2 | 1999/2002–operating | [38,46,47,48,59,60,61,62] |
| Landsat-8 | VIS, NIR, SWIR, TIR (12 spectral bands) | B1–9 (0.43–1.38) B10–11 (10.6–12.51) | 15, 30, 100 m | 16 | 2013–operating | [51,63,64,65,66,67] |
| Landsat-7 | VIS, NIR, MIR, TIR (8 spectral bands) | B1–5 (0.45–1.75) B6 (10.40–12.50) B7 (2.08–2.35) | 15, 30, 60 m | 16 | 1999–operating | [68,69,70] |
| Landsat-5 | VIS, NIR, MIR, TIR (8 spectral bands) | B1–5 (0.45–1.75) B6 (10.40–12.50) B7 (2.08–2.35) | 30, 120 m | 16 | 1984–2013 | [44,66,69] |
| Sentinel-2 | VIS, NIR, SWIR (12 spectral bands) | 0.443–2.190 | 10, 20, 60 m | 5 | 2015–operating | [36,71,72] |
| KOMPSAT-2 | VIS, NIR (5 bands) | 0.45–0.9 | 1(pan), 4 m (MS) | 14 | 2006–operating | [52] |
| Gaofen-1 | VIS, NIR (5 bands) | 0.45–0.89 | 2 (pan), 8 m (MS) | 4 | 2013–operating | [51,53] |
| ASTER | VIS, NIR, SWIR, TIR (14 bands) | B1–3B (0.52–0.86) B4–B9 (1.6–2.43) B10–B14 (8.12–11.65) | 15, 30, 90 m | 4–16 | 1999–operating | [73,74,75] |
| Quickbird | VIS, NIR (5 bands) | 0.45–0.9 | 0.61(pan), 2.4(MS) | 1–3.5 | 2001–operating | [69,76] |
| Dubaisat-2 | Visible, NIR (5 bands) | 0.45–0.89 | 1(pan), 4 (MS) | <8 | 2013–operating | [63] |
| Huan Jing-1 | VIS, NIR (4 bands) | 0.43–0.90 | 30 m | 4 | 2008–operating | [32,51,77] |
| RapidEye | VIS, NIR (4 bands) | 0.44–0.85 | 5 m | 1–5.5 | 2008–operating | [69] |
| WorldView-2 | VIS, NIR (8 bands) | 0.45–0.80 | 0.52(pan), 2.4(MS) | 1.1 | 2009–operating | [44] |
| IKONOS | VIS, NIR (4 bands) | 0.45–0.86 | 0.82(pan), 3.28(MS) | 1–14 | 1999–2015 | [69] |
| AVHRR (NOAA) | VIS, MIR, TIR(6 bands) | 0.58–12.5 | 1.1 km | 0.5 | 1978–operating | [74,78,79] |
| SeaWiFS | VIS, NIR (8 bands) | 0.58–12.5 | 1.1–4.5 km | 1 | 1997–2010 | [80] |
| MERIS | VIS, NIR (15 bands) | 0.4–0.95 | 300 | 3 | 2002–2012 | [42,60] |
| SPOT-5 | VIS, NIR, SWIR (4 bands) | B1–B3 (0.5–0.89) B4 (1.58–1.75) | 2.5 or 5 m(Pan), 10(MS), 20(SWIR) | 2–3 | 2002–2015 | [44] |
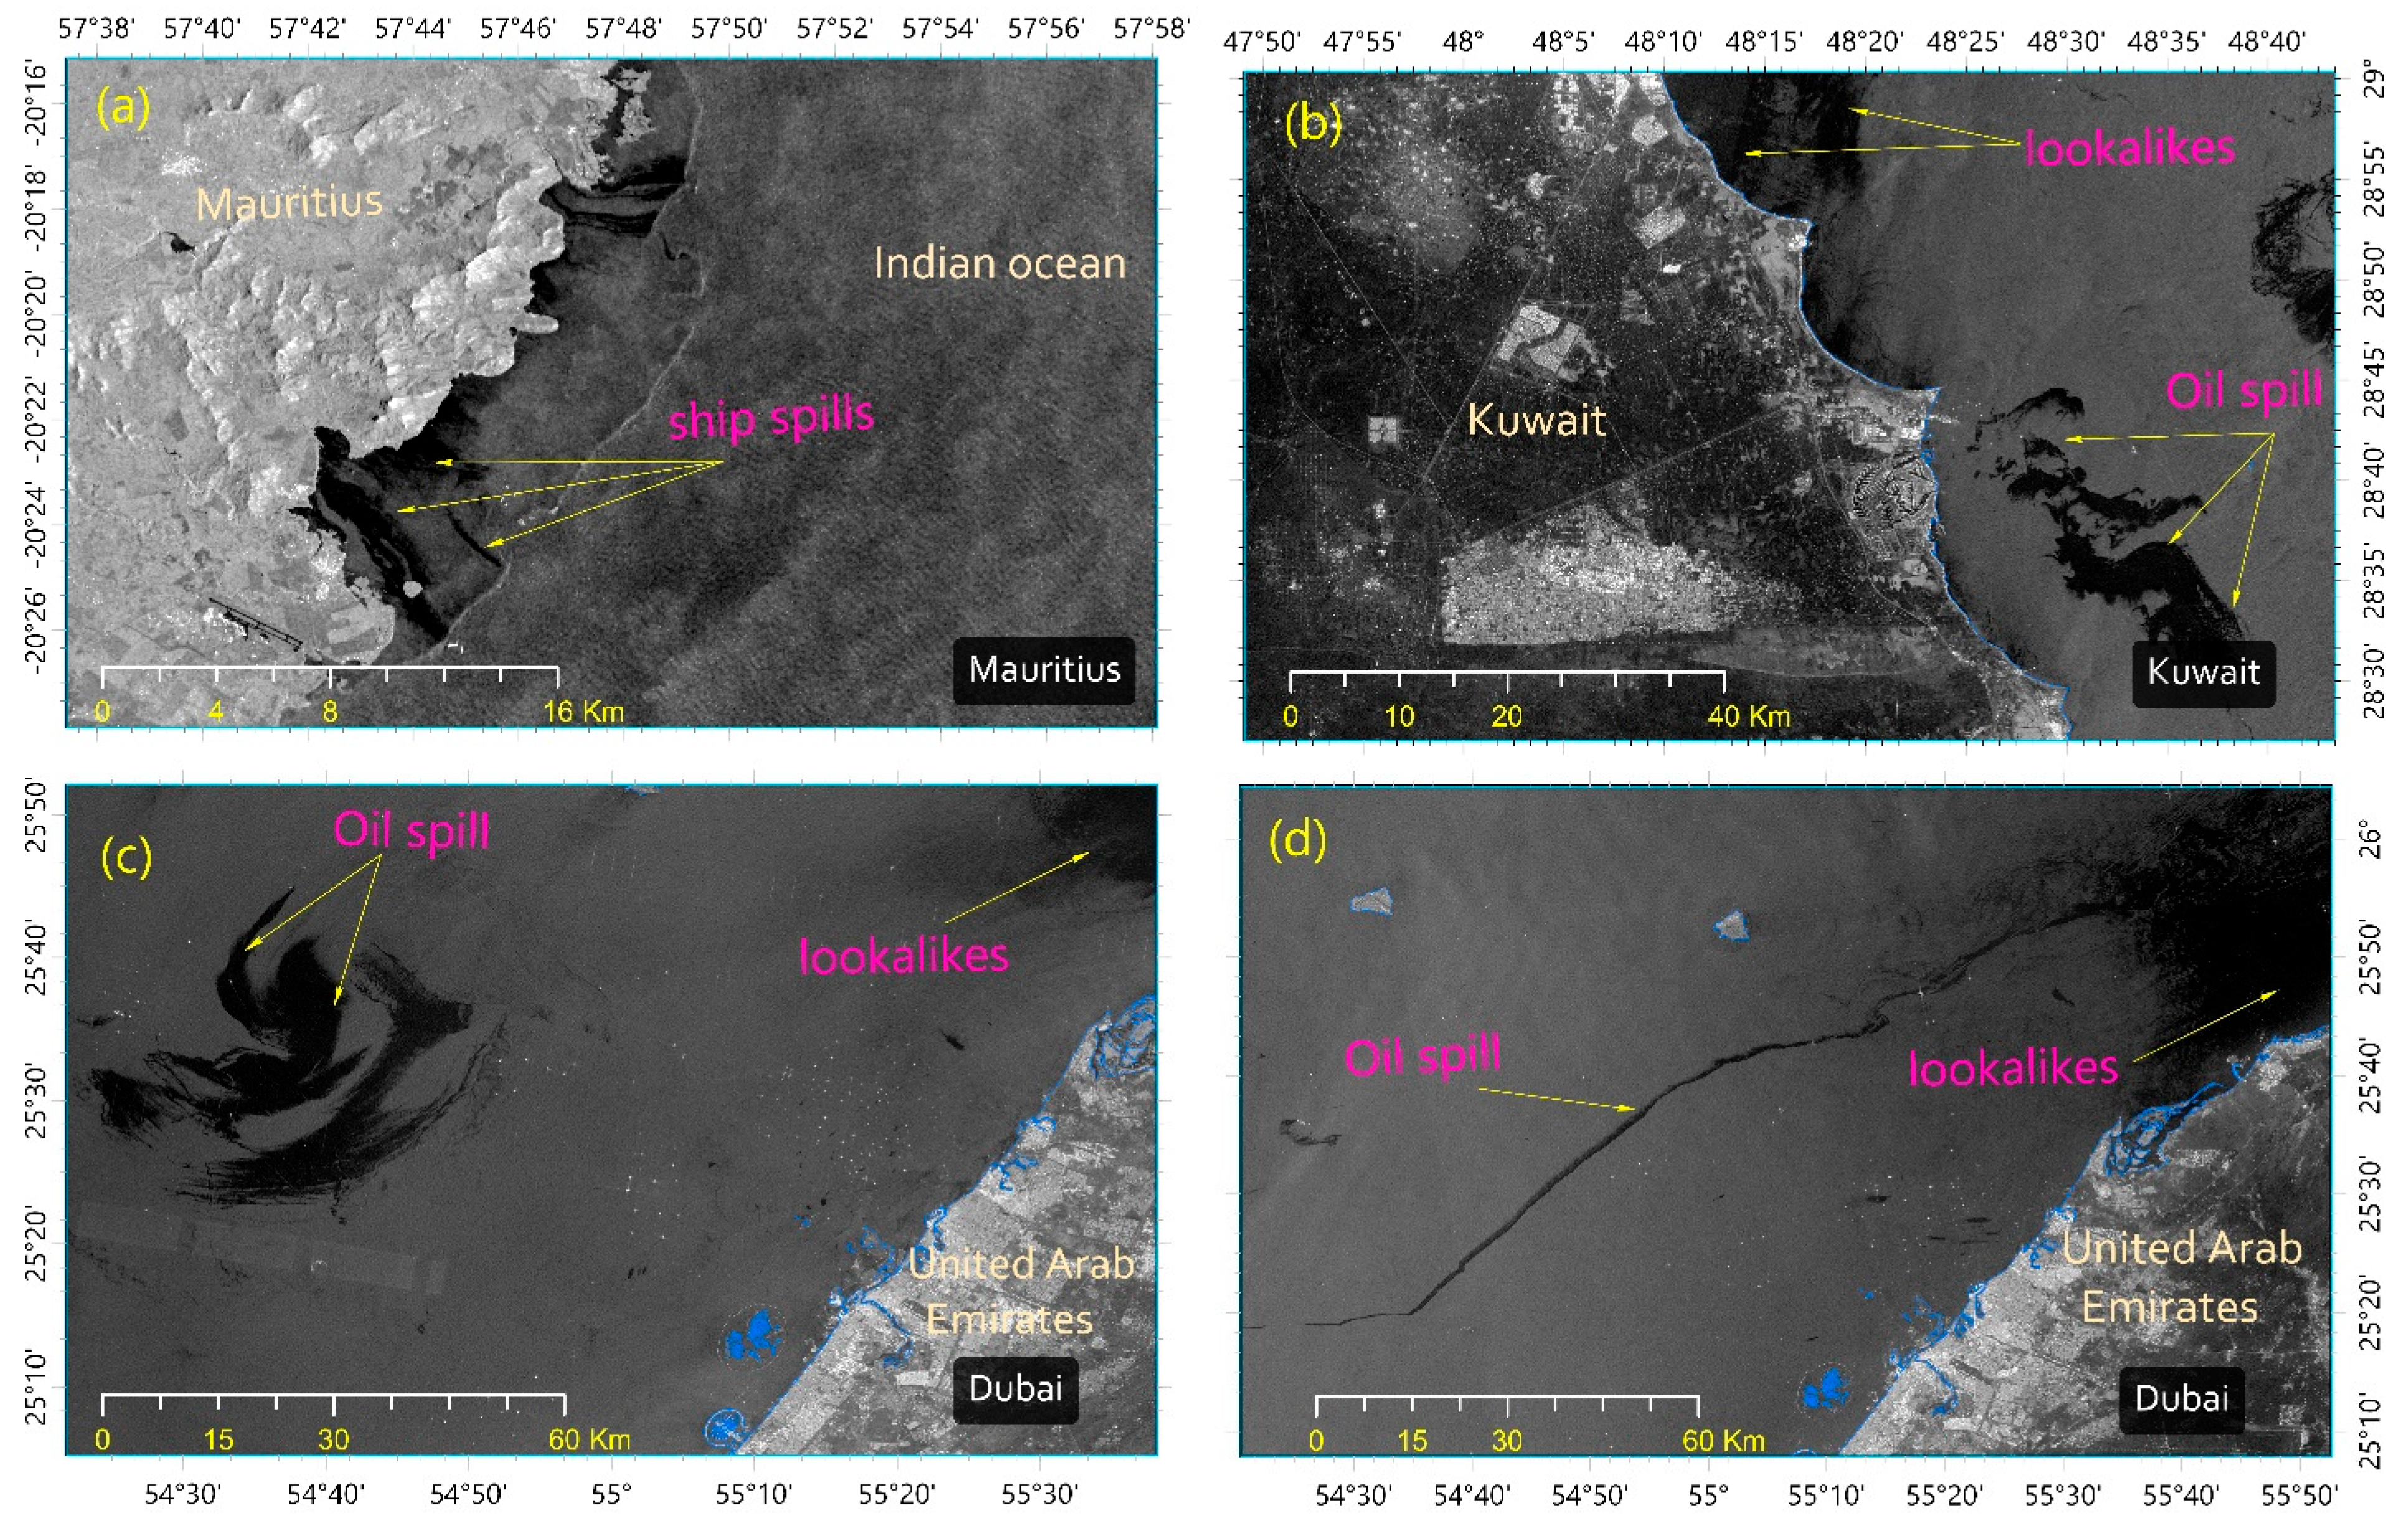
2.2. SAR Data
| Satellite Name | Operation | Operator | Band | Polarization | References |
|---|---|---|---|---|---|
| ERS-1, ERS-2 | 1991–2000, 1995–2011 | European Space Agency (ESA) | C | Single-VV | [64,104,105,106,107,108,109,110,111,112,113] |
| RADARSAT-1 | 1995–2013 | Canadian Space Agency (CSA) | C | Single-HH | [64,112,114,115,116,117] |
| RADARSAT-2 | 2007 | Canadian Space Agency (CSA) | C | Quad | [26,64,106,110,114,116,118,119,120,121,122,123,124,125,126,127,128,129,130] |
| ENVISAT ASAR | 2002–2012 | European Space Agency (ESA) | C | Dual | [64,77,105,106,108,109,110,112,117,124,129,131,132,133,134,135,136,137,138,139,140,141,142,143,144] |
| ALOS PALSAR, ALOS-2 | 2006–2011, 2013 | Japan Aerospace Exploration Agency (JAXA) | L | Quad | [117,118,126,141,143] |
| TerraSARX | 2007 | German Aerospace Centre | X | Quad | [112,145,146,147,148,149,150] |
| Cosmo Skymed-1/2 | 2007/2010 | Italian Space Agency | X | Dual | [151,152,153] |
| RISAT-1 | 2012 | India | C | Quad | [154,155,156] |
| Huan Jing-1C (HJ-1C) | 2012 | China | S | Single-VV | [157,158] |
| Kompsat-5 | 2013 | Korea | X | Dual | [159,160] |
| Sentinel-1 | 2014 | European Space Agency (ESA) | C | Dual | [64,65,161,162,163,164,165] |
3. Data Preprocessing
3.1. Optical Images
3.2. SAR Images
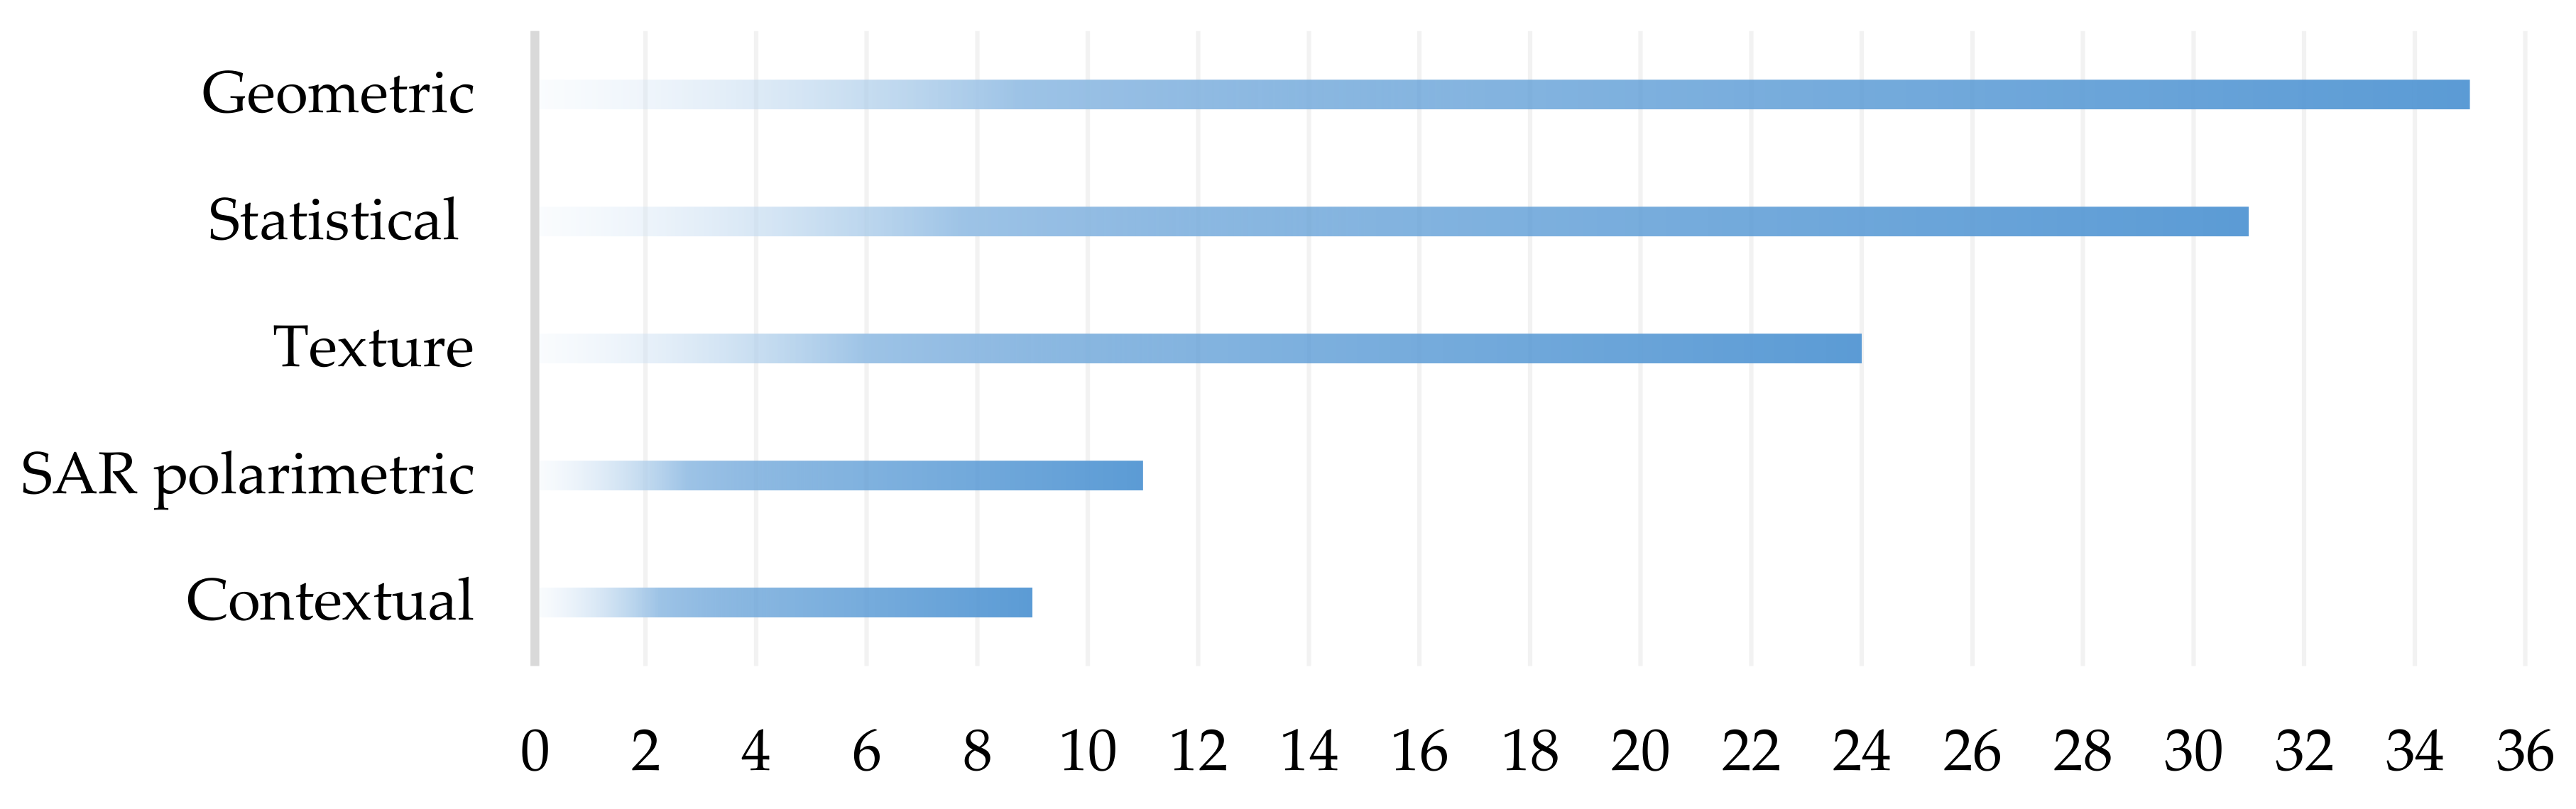
4. Feature Extraction
4.1. Feature Categories
4.2. Feature Selection Techniques
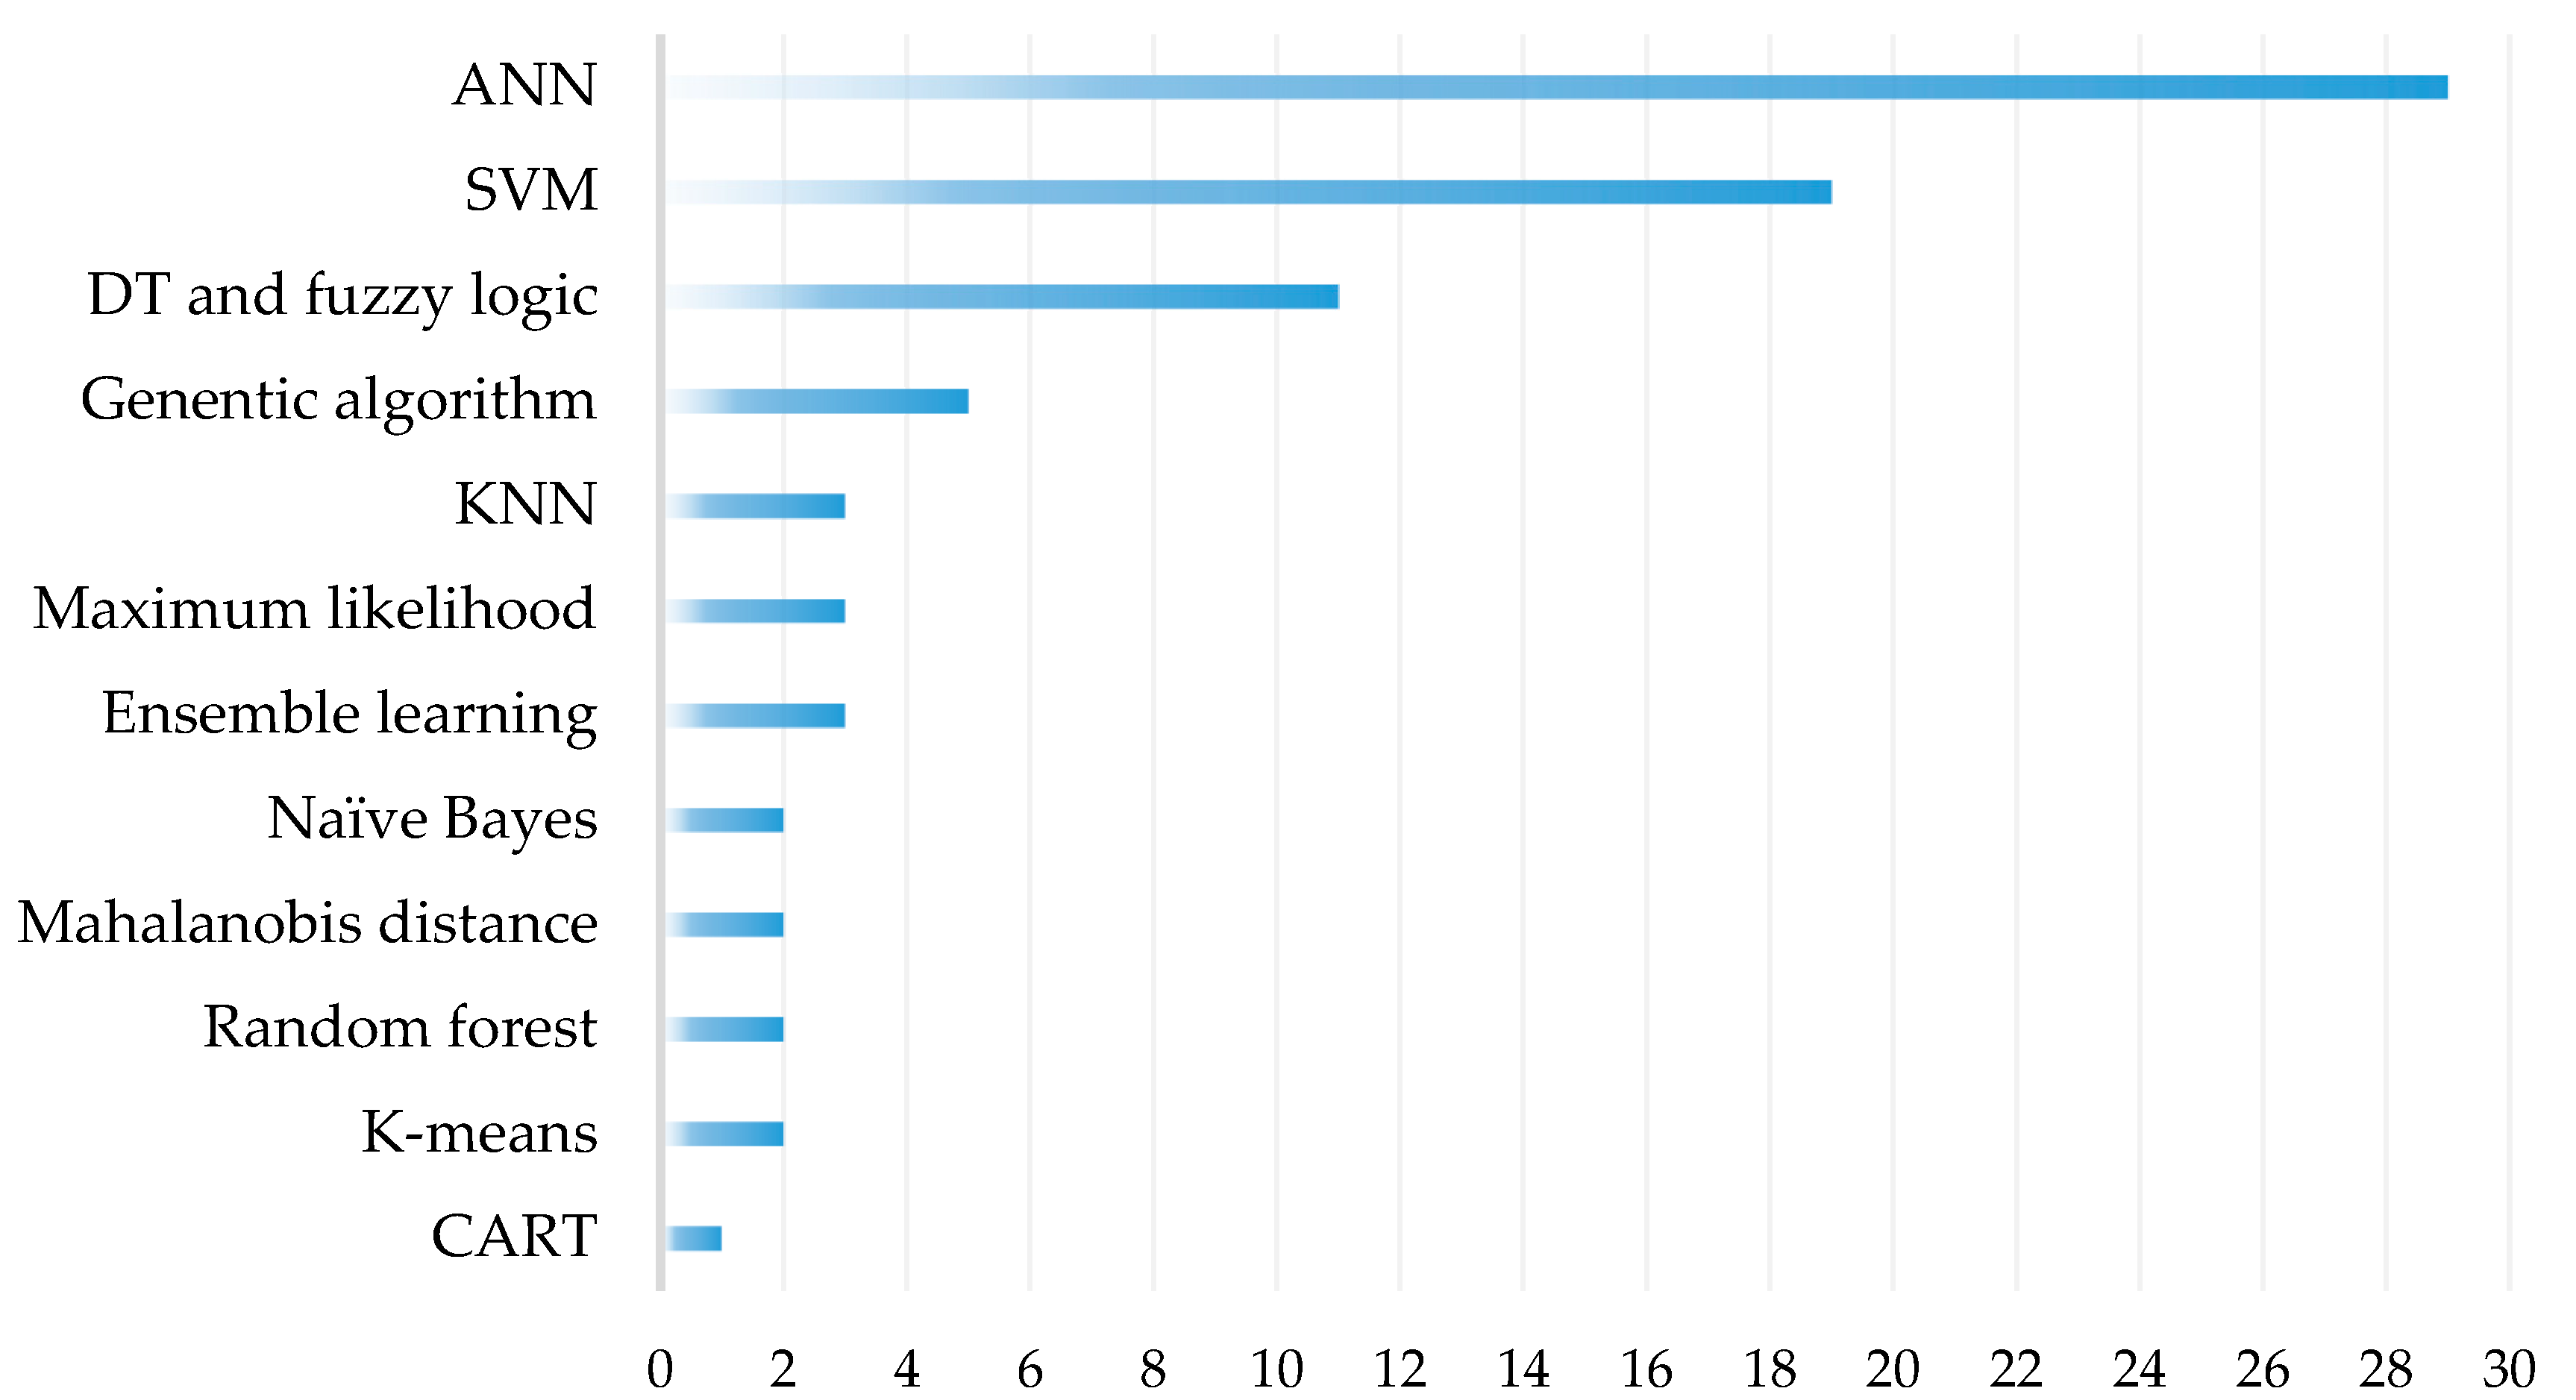
5. Machine Learning
5.1. Traditional Machine Learning Techniques
5.1.1. Artificial Neural Network
5.1.2. Support Vector Machine
5.1.3. Decision Tree
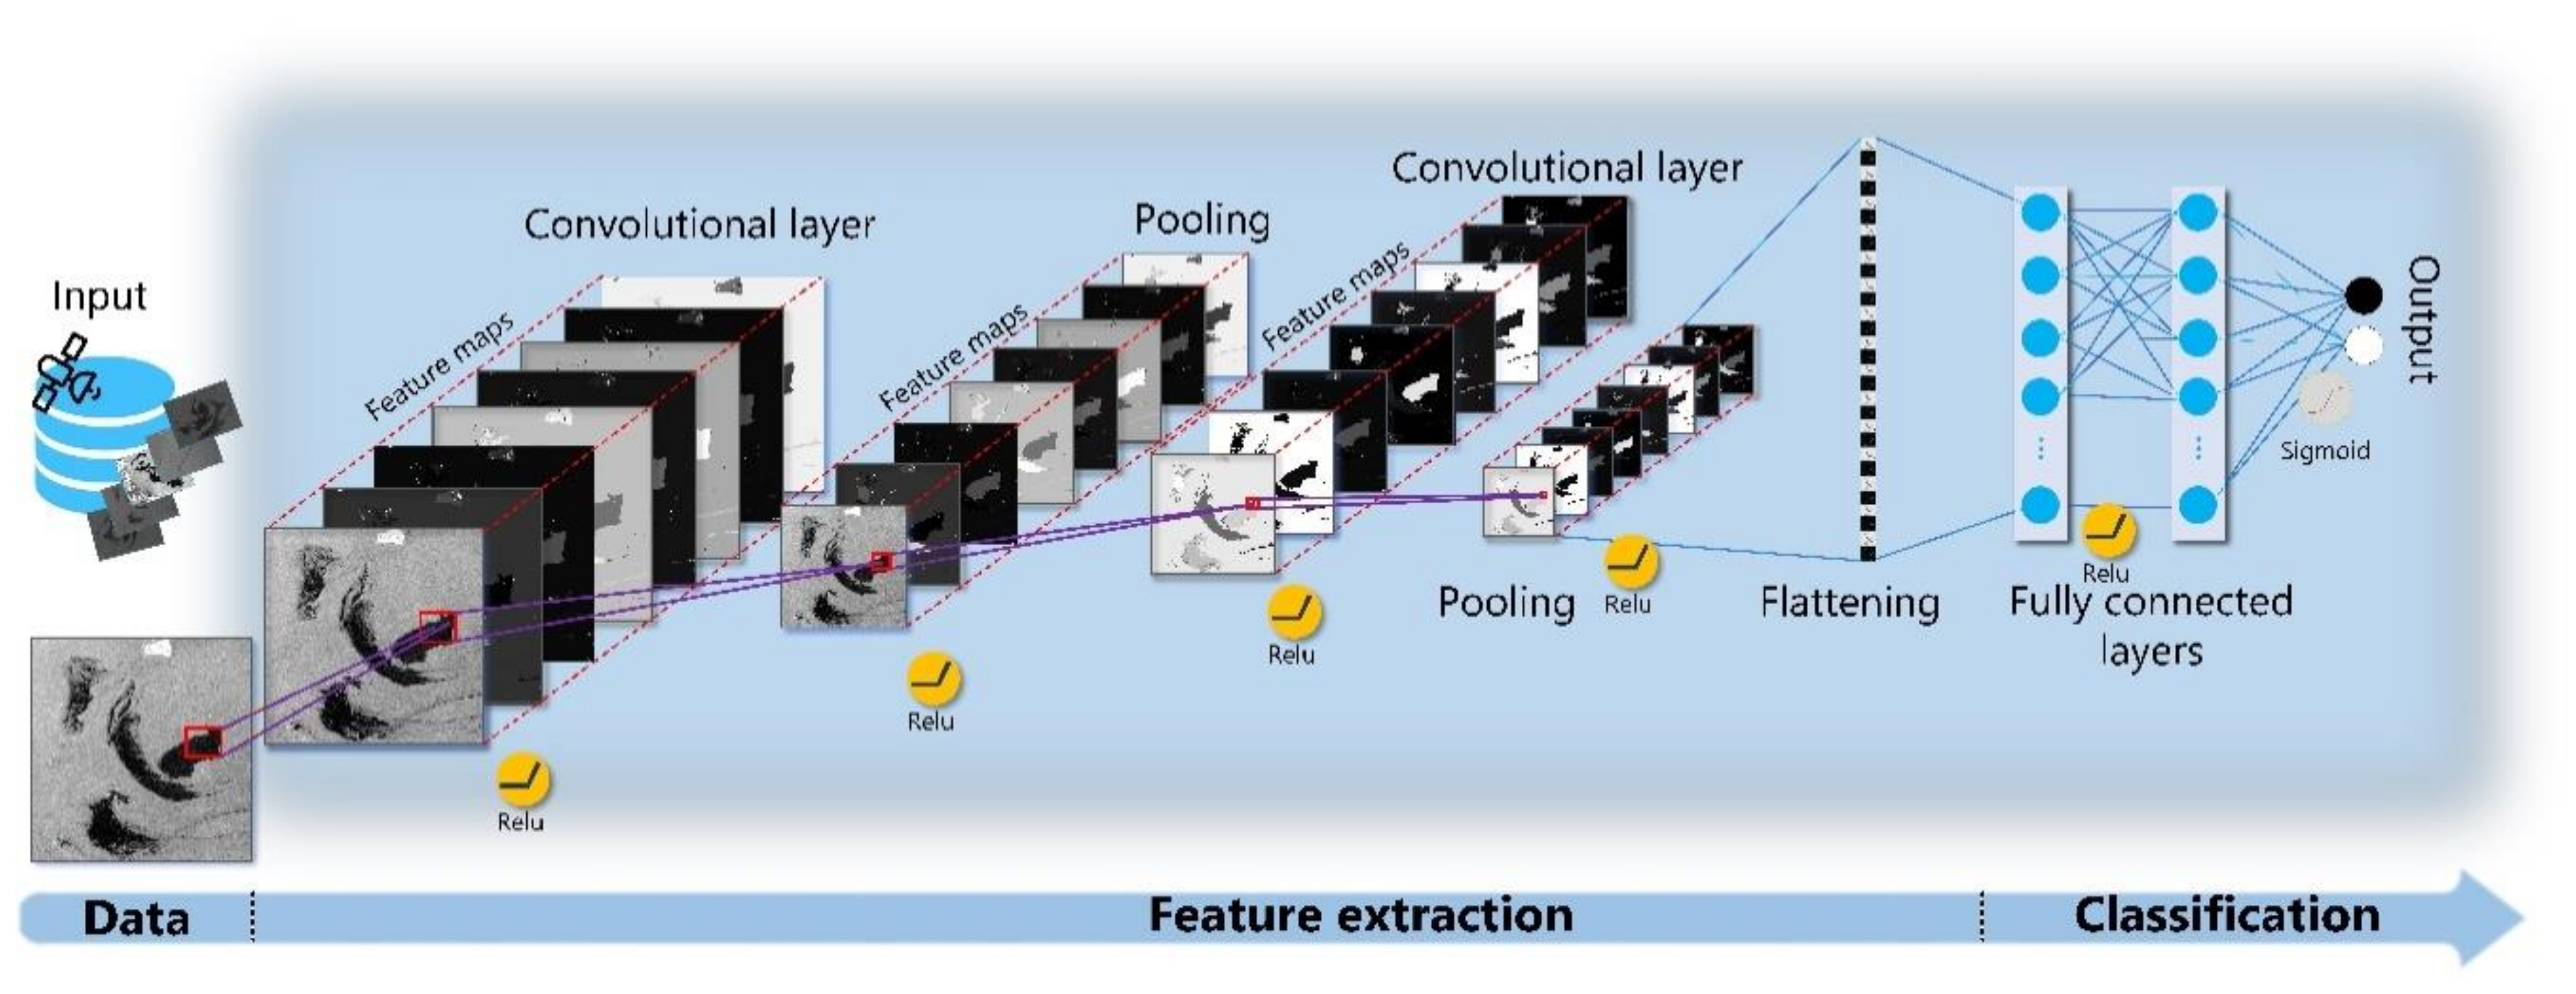
5.2. Deep Learning Techniques
5.2.1. Convolutional Neural Network
| DL Models | DL Task | Data | Architecture | Input Data Size | Labelled Data | Reference |
|---|---|---|---|---|---|---|
| CNN | Patch-based classification | ERS-2 | DenseNet | 224 × 224 | A total of 86 oil film samples and 62 oil film samples. | [258] |
| ERS-2 | VGG-19 | 224 × 224 | A total of 87 and 63 oil slick and look-alike oil slick samples, respectively. | [269] | ||
| ENVISAT, ERS-1,2, COSMO Sky-Med | VGG-16 | 64 × 64 | A total of 4843 and 18,925 oil slick and look-alike samples, respectively. | [270] | ||
| RADARSAT-2 | Two convolutional and pooling layers | 28 × 28 | A total of 2100 crude oil, 2100 plant oil, and 2100 oil emulsion samples | [197] | ||
| AVIRIS | 1D CNN | - | A total of 469,567 and 42,676 samples were selected for training and testing, respectively. | [22] | ||
| RADARSAT-2 | Five-layer CNN architecture + SVM | 15 × 15 | A total of 26,000 and 6500 samples were used for training and testing, respectively. | [271] | ||
| Object detection | SLAR | Two-stage CNN | 50 or 28 pixels per side (with an overlap of 25 and 14 pixels) | A total of 23 SLAR images (512,566 samples) | [272] | |
| Unmanned aerial vehicle (RGB) | Faster R-CNN | - | A total of 1096 and 958 images were used for training and testing, respectively. | [273] | ||
| Semantic Segmentation | Sentinel-1 | DeepLabv3+ | 321 × 321 pixels | A total of 1002 and 110 images were used for training and testing, respectively. | [260] | |
| Radarsat-2 | SegNet | 256 × 256 pixels | A total of 3600 and 600 samples were used for training and testing, respectively. | [262] | ||
| ENVISAT and Sentinel-1 | Fully CNNs | 128 × 128 pixels; 2048 × 2048 pixels | A total of 630 images were used for the training process. | [265] | ||
| QuickBird, Worldview, and Google Earth | Deeplab + fully connected conditional random field | - | Approximately 60%, 20%, and 20% of the 8400 images were used for training, testing, and validation, respectively. | [259] | ||
| Radarsat-2 and SIR-C/X-SAR | Encoder–decoder CNN and simple linear iterative clustering superpixel | 48 × 48 pixels | A total of 356 and 122 samples were used for training and testing, respectively. | [261] | ||
| Sentinel-1 | DeepLab | 1250 × 650 pixels | The training and testing sets consist of 771 and 110 images, respectively | [274] | ||
| Landsat-8 and Landsat-7 | FCN-GoogLeNet and FCN-ResNet models | - | Yantai and Bohai bay datasets | [275] | ||
| Sentinel-1 | DeepLab | 1252 × 609 pixels | The training and testing sets consist of 571 and 106 images, respectively. | [264] | ||
| Sentinel-1 | fully convolutional network based on U-net | 160 × 160 pixels | Three sets of data were used, and each set was divided into training, testing, and validation patches. | [276] | ||
| Sentinel-1 | Mask R-CNN | 1024 × 1024 | A total of 2882 images were labelled for training and validation. | [277] | ||
| AEs | Classification | AVIRIS | Stacked AE | - | A total of 1500 and 315 pixels were used for training and validation, respectively | [83] |
| RADARSAT-2 | Stacked AE and DBN | 20 × 20 | A total of 24,000 data samples | [103] | ||
| Segmentation | SLAR | Selectional AE, and very deep Residual Encoder-Decoder Networks | 256 × 256 384 × 384 | A dataset with 28 flight sequences | [278] | |
| SLAR | Long Short-Term Memory Selectional AE | - | A dataset composed of 51 flight sequences | [263] | ||
| DBN | Classification | Radarsat-2 | DBN with Restricted Boltzmann Machine | 32 × 32 | A total of 600 and 300 samples were used for training and testing, respectively. | [195] |
| RNN | Classification | SLAR | MLPs, Vanilla RNN, LSTM networks, Bidirectional LSTM networks | - | A total of 12 SLAR records | [279] |
| GANs | Segmentation | ERS-1, 2, ENVISAT ASAR | Adversarial f-divergence | 256 × 256 | - | [280] |
Patch-Based Image Classification
Object Detection
Semantic and Instance Segmentation
5.2.2. Autoencoder
5.2.3. Other Deep Learning Models
6. Discussion and Conclusions
- The process of preparing considerable amounts of labeled data to train a DL model is a laborious and time-consuming task. Given the similarities between oil spills and lookalikes (i.e., dark spots created by natural phenomena, such as regions with low wind speed, wave shadows, and biogenic slicks/films) in SAR images, the process of defining training samples is challenging and susceptible to human errors.
- The limitation or absence of accessible open-source annotated datasets compromise oil spill/slick images collected from various multisensory sources at different locations with diverse environmental variations and oil characteristics.
- The fine-tuning of DL model hyperparameters (i.e., number of filters, batch size, learning rate, momentum, weight decay, and others) requires an extensive trial-and-error experimentation to determine optimum configurations of parameters. A wide variety of hyperparameters should be considered and investigated for practical use.
- A thorough investigation on the performance and generalizability of DL models to detect the presence of oil spills from unseen datasets collected from different environments in the literature is lacking.
- A detailed classification of oil spills/slicks—including oil type, thickness, or other chemical properties—via DL models is lacking in the literature.
Author Contributions
Funding
Conflicts of Interest
References
- Li, P.; Cai, Q.; Lin, W.; Chen, B.; Zhang, B. Offshore oil spill response practices and emerging challenges. Mar. Pollut. Bull. 2016, 110, 6–27. [Google Scholar] [CrossRef] [PubMed]
- De Oliveira, O.M.C.; Antônio, A.F.; Cerqueira, J.R.; Soares, S.A.R.; Garcia, K.S.; Filho, A.P.; Rosa, M.d.L.d.S.; Suzart, C.M.; Pinheiro, L.d.L. Environmental disaster in the northeast coast of Brazil: Forensic geochemistry in the identification of the source of the oily material. Mar. Pollut. Bull. 2020, 160, 111597. [Google Scholar] [CrossRef] [PubMed]
- Chang, S.E.; Stone, J.; Demes, K.; Piscitelli, M. Consequences of oil spills: A review and framework for informing planning. Ecol. Soc. 2014, 19, 26. [Google Scholar] [CrossRef] [Green Version]
- Chen, J.; Zhang, W.; Wan, Z.; Li, S.; Huang, T.; Fei, Y. Oil spills from global tankers: Status review and future governance. J. Clean. Prod. 2019, 227, 20–32. [Google Scholar] [CrossRef]
- ITOPF. The International Tanker Owners Pollution Federation Limited Oil Tanker Spill Statistics. 2020. Available online: http://www.itopf.com/knowledge-resources/data-statistics/statistics/ (accessed on 30 September 2020).
- Gokce Cicek Ceyhun, A. The impact of shipping accidents on marine environment: A study of turkish seas. Eur. Sci. J. 2014, 10, 1857–7881. [Google Scholar]
- Ober, H.K. Effects of Oil Spills on Marine and Coastal Wildlife. Inst. Food Agric. Sci. 2010, 1–4. [Google Scholar]
- Mishra, A.K.; Kumar, G.S. Weathering of oil spill: Modeling and analysis. Aquat. Procedia 2015, 4, 435–442. [Google Scholar] [CrossRef]
- Leifer, I.; Lehr, W.J.; Simecek-Beatty, D.; Bradley, E.; Clark, R.; Dennison, P.; Hu, Y.; Matheson, S.; Jones, C.E.; Holt, B.; et al. State of the art satellite and airborne marine oil spill remote sensing: Application to the BP deepwater horizon oil spill. Remote Sens. Environ. 2012, 124, 185–209. [Google Scholar] [CrossRef] [Green Version]
- Sadek, M.E.; Seheimy, A.E.; El-Tokhy, T.T.; Allah, M.A. Management process of oil spill in water plants. J. Pollut. Eff. Control 2017, 5. [Google Scholar] [CrossRef]
- Ivshina, I.B.; Kuyukina, M.S.; Krivoruchko, A.V.; Elkin, A.A.; Makarov, S.O.; Cunningham, C.J.; Peshkur, T.A.; Atlas, R.M.; Philp, J.C. Oil spill problems and sustainable response strategies through new technologies. Environ. Sci. Process. Impacts 2015, 17, 1201–1219. [Google Scholar] [CrossRef] [Green Version]
- Michel, J.; Fingas, M. Oil spills: Causes, consequences, prevention, and countermeasures. In Fossil Fuels: Current Status and Future Directions; World Scientific: Singapore, 2016; pp. 159–201. ISBN 9789814699983. [Google Scholar]
- Fingas, M.; Brown, C.E. Oil Spill Remote Sensing: A Review. In Oil Spill Science and Technology; Elsevier: Amsterdam, The Netherlands, 2011; pp. 111–169. ISBN 9781856179430. [Google Scholar]
- Brekke, C.; Solberg, A.H.S. Oil spill detection by satellite remote sensing. Remote Sens. Environ. 2005, 95, 1–13. [Google Scholar] [CrossRef]
- Fingas, M.; Brown, C. Review of oil spill remote sensing. Mar. Pollut. Bull. 2014, 83, 9–23. [Google Scholar] [CrossRef] [PubMed] [Green Version]
- Fingas, M.; Brown, C. A Review of oil spill remote sensing. Sensors 2017, 18, 91. [Google Scholar] [CrossRef] [PubMed] [Green Version]
- Alpers, W.; Holt, B.; Zeng, K. Remote sensing of environment oil spill detection by imaging radars: Challenges and pitfalls. Remote Sens. Environ. 2017, 201, 133–147. [Google Scholar] [CrossRef]
- Fingas, M.; Brown, C.E. Oil Spill Remote Sensing: A Forensics Approach. In Standard Handbook Oil Spill Environmental Forensics; Elsevier: Amsterdam, The Netherlands, 2016; pp. 961–981. ISBN 9780128096598. [Google Scholar]
- Ozigis, M.S.; Kaduk, J.D.; Jarvis, C.H. Mapping terrestrial oil spill impact using machine learning random forest and Landsat 8 OLI imagery: A case site within the Niger Delta region of Nigeria. Environ. Sci. Pollut. Res. 2019, 26, 3621–3635. [Google Scholar] [CrossRef] [PubMed] [Green Version]
- Pelta, R.; Carmon, N.; Ben-Dor, E. A machine learning approach to detect crude oil contamination in a real scenario using hyperspectral remote sensing. Int. J. Appl. Earth Obs. Geoinf. 2019, 82, 101901. [Google Scholar] [CrossRef]
- Xu, J.; Wang, H.; Cui, C.; Zhao, B.; Li, B. Oil Spill Monitoring of shipborne radar image features using SVM and local adaptive threshold. Algorithms 2020, 13, 69. [Google Scholar] [CrossRef] [Green Version]
- Liu, B.; Li, Y.; Li, G.; Liu, A. A spectral feature based convolutional neural network for classification of sea surface oil spill. ISPRS Int. J. Geo-Inf. 2019, 8, 160. [Google Scholar] [CrossRef] [Green Version]
- Zhu, X.; Li, Y.; Zhang, Q.; Liu, B. Oil film classification using deep learning-based hyperspectral remote sensing technology. ISPRS Int. J. Geo-Inf. 2019, 8, 181. [Google Scholar] [CrossRef] [Green Version]
- Park, S.H.; Jung, H.S.; Lee, M.J.; Lee, W.J.; Choi, M.J. Oil spill detection from planetscope satellite image: Application to oil spill accident near ras Al Zour area, Kuwait in august 2017. J. Coast. Res. 2019, 90, 251–260. [Google Scholar] [CrossRef]
- Jiang, Z.; Ma, Y.; Yang, J. Inversion of the thickness of crude oil film based on an OG-CNN Model. J. Mar. Sci. Eng. 2020, 8, 653. [Google Scholar] [CrossRef]
- Tong, S.; Liu, X.; Chen, Q.; Zhang, Z.; Xie, G. Multi-feature based ocean oil spill detection for polarimetric SAR data using random forest and the self-similarity parameter. Remote Sens. 2019, 11, 451. [Google Scholar] [CrossRef] [Green Version]
- Hassani, B.; Sahebi, M.R.; Asiyabi, R.M. Oil spill four-Class classification using UAVSAR polarimetric data. Ocean Sci. J. 2020, 55, 1–11. [Google Scholar] [CrossRef]
- Schultz, C. Monitoring and modeling the deepwater horizon oil spill: A record-breaking enterprise. EOS Trans. Am. Geophys. Union 2013, 94, 185–186. [Google Scholar] [CrossRef]
- Fingas, M.F.; Brown, C.E. Review of oil spill remote sensing. Spill Sci. Technol. Bull. 1997, 4, 199–208. [Google Scholar] [CrossRef] [Green Version]
- Zhao, J.; Temimi, M.; Ghedira, H.; Hu, C. Exploring the potential of optical remote sensing for oil spill detection in shallow coastal waters-a case study in the Arabian Gulf. Opt. Express 2014, 22, 13755. [Google Scholar] [CrossRef]
- Garcia-Pineda, O.; Staples, G.; Jones, C.E.; Hu, C.; Holt, B.; Kourafalou, V.; Graettinger, G.; DiPinto, L.; Ramirez, E.; Streett, D.; et al. Classification of oil spill by thicknesses using multiple remote sensors. Remote Sens. Environ. 2020, 236, 111421. [Google Scholar] [CrossRef]
- Liu, S.; Chi, M.; Zou, Y.; Samat, A.; Benediktsson, J.A.; Plaza, A. Oil spill detection via, ultitemporal optical remote sensing images: A change detection perspective. IEEE Geosci. Remote Sens. Lett. 2017, 14, 324–328. [Google Scholar] [CrossRef]
- Zhang, T.; Guo, J.; Chi, Y.; Wang, Y. Dynamic Threshold Oil Spill Detection Algorithm for Landsat ETM+. In Proceedings of the 2019 IEEE International Geoscience and Remote Sensing Symposium (IGARSS), Yokohama, Japan, 28 July–2 August 2019; pp. 1486–1489. [Google Scholar]
- Yin, D.; Huang, X.; Qian, W.; Huang, X.; Li, Y.; Feng, Q. Airborne validation of a new-style ultraviolet push-broom camera for ocean oil spill pollution surveillance. In Proceedings of the Remote Sensing of the Ocean, Sea Ice, and Large Water Regions, Toulouse, France, 22–23 September 2010; Bostater, C.R., Jr., Mertikas, S.P., Neyt, X., Velez-Reyes, M., Eds.; SPIE: Bellingham, WA, USA, 2010; Volume 7825, p. 78250I. [Google Scholar]
- Satriano, V.; Ciancia, E.; Lacava, T.; Pergola, N.; Tramutoli, V. Improving the RST-OIL algorithm for oil spill detection under severe sun glint conditions. Remote Sens. 2019, 11, 2762. [Google Scholar] [CrossRef] [Green Version]
- Kolokoussis, P.; Karathanassi, V. Oil spill detection and mapping using sentinel 2 imagery. J. Mar. Sci. Eng. 2018, 6, 4. [Google Scholar] [CrossRef] [Green Version]
- Lei, F.; Wang, W.; Zhang, W.; Li, K.; Xu, Z. Oil spills tracking through texture analysis from modis imagery. In Proceedings of the IGARSS 2019—2019 IEEE International Geoscience and Remote Sensing Symposium, Yokohama, Japan, 28 July–2 August 2019; pp. 9768–9771. [Google Scholar]
- Lacava, T.; Ciancia, E.; Coviello, I.; Di Polito, C.; Grimaldi, C.S.L.; Pergola, N.; Satriano, V.; Temimi, M.; Zhao, J.; Tramutoli, V. A MODIS-based robust satellite technique (RST) for timely detection of oil spilled areas. Remote Sens. 2017, 9, 128. [Google Scholar] [CrossRef] [Green Version]
- Bhangale, U.; Durbha, S.S.; King, R.L.; Younan, N.H.; Vatsavai, R. High performance GPU computing based approaches for oil spill detection from multi-temporal remote sensing data. Remote Sens. Environ. 2017, 202, 28–44. [Google Scholar] [CrossRef]
- Chatziantoniou, A.; Bakopoulos, V.; Papandroulakis, N.; Topouzelis, K. Detection of biogenic oil film near aquaculture sites seen by Sentinel-2 multispectral images. In Proceedings of the Remote Sensing of the Ocean, Sea Ice, Coastal Waters, and Large Water Regions 2020; Bostater, C.R., Neyt, X., Viallefont-Robinet, F., Eds.; SPIE: Bellingham, WA, USA, 2020; Volume 11529, p. 4. [Google Scholar]
- Clark, R.N.; Swayze, G.A.; Leifer, I.; Livo, K.E.; Lundeen, S.; Eastwood, M.; Green, R.O.; Kokaly, R.F.; Hoefen, T.; Sarture, C.; et al. A Method for Qualitative Mapping of Thick Oil Spills Using Imaging Spectroscopy; U.S. Geological Survey: Reston, VA, USA, 2010.
- De Carolis, G.; Adamo, M.; Pasquariello, G. Thickness estimation of marine oil slicks with near-infrared MERIS and MODIS imagery: The Lebanon oil spill case study. In Proceedings of the International Geoscience and Remote Sensing Symposium, Munich, Germany, 22–27 July 2012; pp. 3002–3005. [Google Scholar]
- Sicot, G.; Lennon, M.; Miegebielle, V.; Dubucq, D. Estimation of the thickness and emulsion rate of oil spilled at sea using hyperspectral remote sensing imagery in the SWIR domain. Int. Arch. Photogramm. Remote Sens. Spat. Inf. Sci.-ISPRS Arch. 2015, 40, 445–450. [Google Scholar] [CrossRef] [Green Version]
- Svejkovsky, J.; Hess, M.; Muskat, J.; Nedwed, T.J.; McCall, J.; Garcia, O. Characterization of surface oil thickness distribution patterns observed during the deepwater horizon (MC-252) oil spill with aerial and satellite remote sensing. Mar. Pollut. Bull. 2016, 110, 162–176. [Google Scholar] [CrossRef] [PubMed]
- Sun, S.; Hu, C. The challenges of interpreting oil-water spatial and spectral contrasts for the sstimation of oil thickness: Examples from satellite and airborne measurements of the deepwater horizon oil spill. IEEE Trans. Geosci. Remote Sens. 2019, 57, 2643–2658. [Google Scholar] [CrossRef]
- Cococcioni, M.; Corucci, L.; Masini, A.; Nardelli, F. SVME: An ensemble of support vector machines for detecting oil spills from full resolution MODIS images. Ocean Dyn. 2012, 62, 449–467. [Google Scholar] [CrossRef]
- Corucci, L.; Nardelli, F.; Cococcioni, M. Oil spill classification from multi-spectral satellite images: Exploring different machine learning techniques. Remote Sens. Ocean. Sea Ice Large Water Reg. 2010, 7825, 782509. [Google Scholar]
- Maianti, P.; Rusmini, M.; Tortini, R.; Dalla Via, G.; Frassy, F.; Marchesi, A.; Rota Nodari, F.; Gianinetto, M. Monitoring large oil slick dynamics with moderate resolution multispectral satellite data. Nat. Hazards 2014, 73, 473–492. [Google Scholar] [CrossRef]
- De Carolis, G.; Adamo, M.; Pasquariello, G. On the estimation of thickness of marine oil slicks from sun-glittered, near-infrared MERIS and MODIS imagery: The lebanon oil spill case study. IEEE Trans. Geosci. Remote Sens. 2014, 52, 559–573. [Google Scholar] [CrossRef]
- Lee, M.S.; Park, K.A.; Lee, H.R.; Park, J.J.; Kang, C.K.; Lee, M. Detection and dispersion of oil spills from satellite optical images in a coastal bay. Int. Geosci. Remote Sens. Symp. 2016, 2016, 2491–2494. [Google Scholar]
- Li, Y.; Cui, C.; Liu, Z.; Liu, B.; Xu, J.; Zhu, X.; Hou, Y. Detection and monitoring of oil spills using moderate/high-resolution remote sensing images. Arch. Environ. Contam. Toxicol. 2017, 73, 154–169. [Google Scholar] [CrossRef] [PubMed]
- Park, S.H.; Jung, H.S.; Lee, M.J. Oil spill mapping from Kompsat-2 high-resolution image using directional median filtering and artificial neural network. Remote Sens. 2020, 12, 253. [Google Scholar] [CrossRef] [Green Version]
- Yang, J.; Wan, J.; Ma, Y.; Hu, Y. Research on object-oriented decision fusion for oil spill detection on sea surface. In Proceedings of the International Geoscience and Remote Sensing Symposium, Yokohama, Japan, 28 July–2 August 2019; pp. 9772–9775. [Google Scholar]
- Jha, M.N.; Levy, J.; Gao, Y. Advances in remote sensing for oil spill disaster management: State-of-the-art sensors technology for oil spill surveillance. Sensors 2008, 8, 236–255. [Google Scholar] [CrossRef] [PubMed] [Green Version]
- Klemas, V. Tracking oil slicks and predicting their trajectories using remote sensors and models: Case studies of the sea princess and deepwater horizon oil spills. J. Coast. Res. 2010, 265, 789–797. [Google Scholar] [CrossRef] [Green Version]
- Fingas, M. The challenges of remotely measuring oil slick thickness. Remote Sens. 2018, 10, 319. [Google Scholar] [CrossRef] [Green Version]
- Pisano, A.; Bignami, F.; Santoleri, R. Oil spill detection in glint-contaminated near-infrared MODIS imagery. Remote Sens. 2015, 7, 1112–1134. [Google Scholar] [CrossRef] [Green Version]
- Adamo, M.; de Carolis, G.; de Pasquale, V.; Pasquariello, G. Detection and tracking of oil slicks on sun-glittered visible and near infrared satellite imagery. Int. J. Remote Sens. 2009, 30, 6403–6427. [Google Scholar] [CrossRef]
- Bulgarelli, B.; Djavidnia, S. On MODIS retrieval of oil spill spectral properties in the marine environment. IEEE Geosci. Remote Sens. Lett. 2012, 9, 398–402. [Google Scholar] [CrossRef]
- Chen, S.; Hu, C. In search of oil seeps in the Cariaco basin using MODIS and MERIS medium-resolution data. Remote Sens. Lett. 2014, 5, 442–450. [Google Scholar] [CrossRef]
- Zhao, J.; Ghedira, H.; Temimi, M. Detection of oil pollution in the arabian gulf using optical remote sensing imagery. In Proceedings of the 2014 IEEE Geoscience and Remote Sensing Symposium, Québec City, QC, Canada, 13–18 July 2014; pp. 1453–1456. [Google Scholar]
- Srivastava, H.; Singh, T.P. Assessment and development of algorithms to detection of oil spills using MODIS data. J. Indian Soc. Remote Sens. 2010, 38, 161–167. [Google Scholar] [CrossRef]
- Lee, M.-S.; Park, K.-A.; Lee, H.-R.; Park, J.-J.; Kang, C.-K.; Lee, M. Detection and dispersion of thick and film-like oil spills in a coastal bay using satellite optical images. IEEE J. Sel. Top. Appl. Earth Obs. Remote Sens. 2016, 9, 5139–5150. [Google Scholar] [CrossRef]
- Bayramov, E.; Kada, M.; Buchroithner, M. Monitoring oil spill hotspots, contamination probability modelling and assessment of coastal impacts in the Caspian Sea using SENTINEL-1, LANDSAT-8, RADARSAT, ENVISAT and ERS satellite sensors. J. Oper. Oceanogr. 2018, 11, 27–43. [Google Scholar] [CrossRef]
- Arslan, N. Assessment of oil spills using Sentinel 1 C-band SAR and Landsat 8 multispectral sensors. Environ. Monit. Assess. 2018, 190, 637. [Google Scholar] [CrossRef] [PubMed]
- Bayramov, E.; Knee, K.; Kada, M.; Buchroithner, M. Using multiple satellite observations to quantitatively assess and model oil pollution and predict risks and consequences to shoreline from oil platforms in the Caspian Sea. Hum. Ecol. Risk Assess. 2018, 24, 1501–1514. [Google Scholar] [CrossRef]
- Zhao, D.; Cheng, X.; Zhang, H.; Zhang, H. An oil slick detection index based on Landsat 8 remote Sensing images. In Proceedings of the 2018 International Workshop on Big Geospatial Data and Data Science (BGDDS), Wuhan, China, 22–23 September 2018. [Google Scholar]
- Taravat, A.; Del Frate, F. Development of band ratioing algorithms and neural networks to detection of oil spills using Landsat ETM+ data. EURASIP J. Adv. Signal Process. 2012, 2012, 107. [Google Scholar] [CrossRef]
- Polychronis, K.; Vassilia, K. Detection of oil spills and underwater natural oil outflow using multispectral satellite imagery. Int. J. Remote Sens. Appl. 2013, 3, 145–154. [Google Scholar]
- Lavrova, O.Y.; Mityagina, M.I. Satellite monitoring of oil slicks on the Black Sea surface. Izv.-Atmos. Ocean Phys. 2013, 49, 897–912. [Google Scholar] [CrossRef]
- Althawadi, J.J.A.; Hashim, M. An approach of vicarious calibration of sentinel-2 satellite multispectral image based on spectral library for mapping oil spills. Int. Arch. Photogramm. Remote Sens. Spat. Inf. Sci. ISPRS Arch. 2019, 42, 117–121. [Google Scholar] [CrossRef] [Green Version]
- Nezhad, M.M.; Groppi, D.; Laneve, G.; Marzialetti, P.; Piras, G. Oil Spill Detection Analyzing “sentinel 2” satellite images: A Persian gulf case study. In Proceedings of the World Congress on Civil, Structural, and Environmental Engineering, Budapest, Hungary, 8–10 April 2018; p. 8. [Google Scholar]
- Cai, G.; Wu, J.; Xue, Y.; Wan, W.; Huang, X. Oil spill detection from thermal anomaly using ASTER data in Yinggehai of Hainan, China. In Proceedings of the International Geoscience and Remote Sensing Symposium, Barcelona, Spain, 23–27 July 2007; pp. 898–900. [Google Scholar]
- Guo, G.; Liu, B.; Liu, C. Thermal infrared spectral characteristics of bunker fuel oil to determine oil-film thickness and API. J. Mar. Sci. Eng. 2020, 8, 135. [Google Scholar] [CrossRef] [Green Version]
- Cai, G.; Huang, X.; Du, M.; Liu, Y. Detection of natural oil seeps signature from SST and ATI in South Yellow Sea combining ASTER and MODIS data. Int. J. Remote Sens. 2010, 31, 4869–4885. [Google Scholar] [CrossRef]
- Hese, S.; Schmullius, C. Object-oriented oil spill contamination mapping in west Siberia with quickbird data. In Object-Based Image Analysis; Springer: Berlin/Heidelberg, Germany, 2008; pp. 275–290. [Google Scholar]
- Xu, Q.; Li, X.; Wei, Y.; Tang, Z.; Cheng, Y.; Pichel, W.G. Satellite observations and modeling of oil spill trajectories in the Bohai sea. Mar. Pollut. Bull. 2013, 71, 107–116. [Google Scholar] [CrossRef] [PubMed]
- Grimaldi, C.S.L.; Casciello, D.; Coviello, I.; Lacava, T.; Pergola, N.; Tramutoli, V. An improved RST approach for timely alert and near real time monitoring of oil spill disasters by using AVHRR data. Nat. Hazards Earth Syst. Sci. 2011, 11, 1281–1291. [Google Scholar] [CrossRef] [Green Version]
- Casciello, D.; Lacava, T.; Pergola, N.; Tramutoli, V. Robust satellite techniques for oil spill detection and monitoring using AVHRR thermal infrared bands. Int. J. Remote Sens. 2011, 32, 4107–4129. [Google Scholar] [CrossRef]
- Mihoub, Z.; Hassini, A. Remote sensing of marine oil spills using sea-viewing wide field-of-view sensor images. Boll. Di Geofis. Teor. Ed Appl. 2019, 60, 123–136. [Google Scholar]
- Lu, Y.; Tian, Q.; Wang, X.; Zheng, G.; Li, X. Determining oil slick thickness using hyperspectral remote sensing in the Bohai sea of China. Int. J. Digit. Earth 2013, 6, 76–93. [Google Scholar] [CrossRef]
- Shi, J.; Jiao, J.; Lu, Y.; Zhang, M.; Mao, Z.; Liu, Y. Determining spectral groups to distinguish oil emulsions from Sargassum over the Gulf of Mexico using an airborne imaging spectrometer. ISPRS J. Photogramm. Remote Sens. 2018, 146, 251–259. [Google Scholar] [CrossRef]
- Liu, B.; Zhang, Q.; Li, Y.; Chang, W.; Zhou, M. Spatial–spectral jointed stacked auto-encoder-based deep learning for oil slick extraction from hyperspectral images. J. Indian Soc. Remote Sens. 2019, 47, 1989–1997. [Google Scholar] [CrossRef]
- Alam, M.S.; Sidike, P. Trends in oil spill detection via hyperspectral imaging. In Proceedings of the 2012 7th International Conference on Electrical and Computer Engineering, Dhaka, Bangladesh, 20–22 December 2012; pp. 858–862. [Google Scholar]
- Kokaly, R.F.; Couvillion, B.R.; Holloway, J.A.M.; Roberts, D.A.; Ustin, S.L.; Peterson, S.H.; Khanna, S.; Piazza, S.C. Spectroscopic remote sensing of the distribution and persistence of oil from the deepwater horizon spill in Barataria Bay marshes. Remote Sens. Environ. 2013, 129, 210–230. [Google Scholar] [CrossRef] [Green Version]
- Wang, W.; Sheng, H.; Liu, S.; Chen, Y.; Wan, J.; Mao, J. An edge-preserving active contour model with bilateral filter based on hyperspectral image spectral information for oil spill segmentation. In Proceedings of the 2019 10th Workshop on Hyperspectral Imaging and Signal Processing: Evolution in Remote Sensing (WHISPERS), Amsterdam, The Netherlands, 24–26 September 2019. [Google Scholar]
- Li, Y.; Lu, H.; Zhang, Z.; Liu, P. A novel nonlinear hyperspectral unmixing approach for images of oil spills at sea. Int. J. Remote Sens. 2020, 41, 4682–4699. [Google Scholar] [CrossRef]
- Arellano, P.; Tansey, K.; Balzter, H.; Boyd, D.S. Detecting the effects of hydrocarbon pollution in the Amazon forest using hyperspectral satellite images. Environ. Pollut. 2015, 205, 225–239. [Google Scholar] [CrossRef]
- Yang, J.; Wan, J.; Ma, Y.; Zhang, J.; Hu, Y. Characterization analysis and identification of common marine oil spill types using hyperspectral remote sensing. Int. J. Remote Sens. 2020, 41, 7163–7185. [Google Scholar] [CrossRef]
- Stringer, W.J.; Dean, K.G.; Guritz, R.M.; Garbeil, H.M.; Groves, J.E.; Ahlnaes, K. Detection of petroleum spilled from the MV exxon valdez. Int. J. Remote Sens. 1992, 13, 799–824. [Google Scholar] [CrossRef]
- Hu, C.; Li, X.; Pichel, W.G.; Muller-Karger, F.E. Detection of natural oil slicks in the NW Gulf of Mexico using MODIS imagery. Geophys. Res. Lett. 2009, 36. [Google Scholar] [CrossRef]
- Cross, A.M. Monitoring marine oil pollution using avhrr data: Observations off the coast of kuwait and saudi arabia during january 1991. Int. J. Remote Sens. 1992, 13, 781–788. [Google Scholar] [CrossRef]
- Chen, X.; Liu, L.; Huang, W. The detection and prediction for oil spill on the sea based on the infrared images. Infrared Phys. Technol. 2016, 77, 391–404. [Google Scholar] [CrossRef]
- Xing, Q.; Li, L.; Lou, M.; Bing, L.; Zhao, R.; Li, Z. Observation of oil spills through Landsat thermal infrared imagery: A case of deepwater horizon. Aquat. Procedia 2015, 3, 151–156. [Google Scholar] [CrossRef]
- Ud din, S.; Al Dousari, A.; Literathy, P. Evidence of hydrocarbon contamination from the Burgan oil field, Kuwait-Interpretations from thermal remote sensing data. J. Environ. Manag. 2008, 86, 605–615. [Google Scholar] [CrossRef]
- Tseng, W.Y.; Chiu, L.S. AVHRR observations of Persian Gulf oil spills. In Proceedings of the International Geoscience and Remote Sensing Symposium, Pasadena, CA, USA, 8–12 August 1994; Volume 2, pp. 779–782. [Google Scholar]
- Li, Y.; Lan, G.X.; Li, J.J.; Ma, L. Potential analysis of maritime oil spill monitoring based on MODIS thermal infrared data. In Proceedings of the International Geoscience and Remote Sensing Symposium, Cape Town, South Africa, 12–17 July 2009; Volume 3. [Google Scholar]
- Grimaldi, C.S.L.; Coviello, I.; Lacava, T.; Pergola, N.; Tramutoli, V. A New RST-based approach for continuous oil spill detection in TIR range: The case of the deepwater horizon platform in the gulf of Mexico. In Monitoring and Modeling the Deepwater Horizon Oil Spill: A Record-Breaking Enterprise; American Geophysical Union (AGU): Washington, DC, USA, 2011; Volume 195, pp. 19–31. [Google Scholar]
- Niclos, R.; Dona, C.; Valor, E.; Bisquert, M. Thermal-infrared spectral and angular characterization of crude oil and seawater emissivities for oil slick identification. IEEE Trans. Geosci. Remote Sens. 2014, 52, 5387–5395. [Google Scholar] [CrossRef] [Green Version]
- Lu, Y.; Zhan, W.; Hu, C. Detecting and quantifying oil slick thickness by thermal remote sensing: A ground-based experiment. Remote Sens. Environ. 2016, 181, 207–217. [Google Scholar] [CrossRef]
- Oulefki, A.; Trongtirakul, T.; Agaian, S.S.; Chiracharit, W. Detection and visualization of oil spill using thermal images. In Proceedings of the Mobile Multimedia/Image Processing, Security, and Applications, 22 May 2020; Agaian, S.S., DelMarco, S.P., Asari, V.K., Eds.; SPIE: Bellingham, WA, USA; p. 18.
- Li, X.; Li, C.; Yang, Z.; Pichel, W. SAR imaging of ocean surface oil seep trajectories induced by near inertial oscillation. Remote Sens. Environ. 2013, 130, 182–187. [Google Scholar] [CrossRef]
- Chen, G.; Li, Y.; Sun, G.; Zhang, Y. Application of deep networks to oil spill detection using polarimetric synthetic aperture radar images. Appl. Sci. 2017, 7, 968. [Google Scholar] [CrossRef]
- Guo, Y.; Zhang, H.Z. Oil spill detection using synthetic aperture radar images and feature selection in shape space. Int. J. Appl. Earth Obs. Geoinf. 2014, 30, 146–157. [Google Scholar] [CrossRef]
- Mitra, D.S.; Majumdar, T.J.; Ramakrishnan, R.; Dave, H.; Mazumder, S. Detection and monitoring of offshore oil seeps using ERS/ENVISAT SAR/ASAR data and seep-seismic studies in Krishna-Godavari offshore basin, India. Geocarto Int. 2013, 28, 404–419. [Google Scholar] [CrossRef]
- Singha, S.; Bellerby, T.J.; Trieschmann, O. Detection and classification of oil spill and look-alike spots from SAR imagery using an Artificial Neural Network. In Proceedings of the 2012 IEEE International Geoscience and Remote Sensing Symposium, Munich, Germany, 22–27 July 2012. [Google Scholar]
- Girard-Ardhuin, F.; Mercier, G.; Collard, F.; Garello, R. Operational oil-slick characterization by SAR imagery and synergistic data. IEEE J. Ocean. Eng. 2005, 30, 487–495. [Google Scholar] [CrossRef] [Green Version]
- Taravat, A.; Del Frate, F. Weibull multiplicative model and machine learning models for full-automatic dark-spot detection from Sar images. ISPRS Int. Arch. Photogramm. Remote Sens. Spat. Inf. Sci. 2013, 40, 421–424. [Google Scholar] [CrossRef] [Green Version]
- Liu, P.; Zhao, C.; Li, X.; He, M.; Pichel, W. Identification of ocean oil spills in SAR imagery based on fuzzy logic algorithm. Int. J. Remote Sens. 2010, 31, 4819–4833. [Google Scholar] [CrossRef]
- Chehresa, S.; Amirkhani, A.; Rezairad, G.A.; Mosavi, M.R. Optimum features selection for oil spill detection in SAR image. J. Indian Soc. Remote Sens. 2016, 44, 775–787. [Google Scholar] [CrossRef]
- Gambardella, A.; Giacinto, G.; Migliaccio, M.; Montali, A. One-class classification for oil spill detection. Pattern Anal. Appl. 2010, 13, 349–366. [Google Scholar] [CrossRef]
- Raeisi, A.; Akbarizadeh, G.; Mahmoudi, A. combined method of an efficient cuckoo search algorithm and nonnegative matrix factorization of different zernike moment features for discrimination between oil spills and lookalikes in SAR Images. IEEE J. Sel. Top. Appl. Earth Obs. Remote Sens. 2018, 11, 4193–4205. [Google Scholar] [CrossRef]
- Yang, Y.; Li, Y.; Zhu, X. A novel oil spill detection method from synthetic aperture radar imageries via a bidimensional empirical mode decomposition. Acta Oceanol. Sin. 2017, 36, 86–94. [Google Scholar] [CrossRef]
- Cao, Y.; Xu, L.; Clausi, D. Exploring the potential of active learning for automatic identification of marine oil spills using 10-year (2004-2013) RADARSAT data. Remote Sens. 2017, 9, 41. [Google Scholar] [CrossRef] [Green Version]
- Xu, L.; Li, J.; Brenning, A. A comparative study of different classification techniques for marine oil spill identification using RADARSAT-1 imagery. Remote Sens. Environ. 2014, 141, 14–23. [Google Scholar] [CrossRef]
- Dabboor, M.; Singha, S.; Montpetit, B.; Deschamps, B.; Flett, D. Pre-Launch assessment of RADARSAT constellation mission medium resolution modes for sea oil slicks and lookalike discrimination. Can. J. Remote Sens. 2019, 45, 530–549. [Google Scholar] [CrossRef] [Green Version]
- Kim, T.S.; Park, K.A.; Li, X.; Lee, M.; Hong, S.; Lyu, S.J.; Nam, S. Detection of the hebei spirit oil spill on SAR imagery and its temporal evolution in a coastal region of the Yellow sea. Adv. Space Res. 2015, 56, 1079–1093. [Google Scholar] [CrossRef]
- Ozkan, C.; Osmanoglu, B.; Sunar, F.; Staples, G.; Kalkan, K.; Balık Sanlı, F. Testing the generalization efficiency of oil slick classification algorithm using multiple Sar data for deepwater horizon oil spill. ISPRS Int. Arch. Photogramm. Remote Sens. Spat. Inf. Sci. 2012, XXXIX-B7, 67–72. [Google Scholar] [CrossRef] [Green Version]
- Skrunes, S.; Brekke, C.; Eltoft, T. Characterization of marine surface slicks by radarsat-2 multipolarization features. IEEE Trans. Geosci. Remote Sens. 2014, 52, 5302–5319. [Google Scholar] [CrossRef] [Green Version]
- Marghany, M. Automatic Mexico gulf oil spill detection from Radarsat-2 SAR satellite data using genetic algorithm. Acta Geophys. 2016, 64, 1916–1941. [Google Scholar] [CrossRef] [Green Version]
- Zou, Y.; Shi, L.; Zhang, S.; Liang, C.; Zeng, T. Oil spill detection by a support vector machine based on polarization decomposition characteristics. Acta Oceanol. Sin. 2016, 35, 86–90. [Google Scholar] [CrossRef]
- Li, H.Y.; Perrie, W.; Zhou, Y.Z.; He, Y.J. Oil spill detection on the ocean surface using hybrid polarimetric SAR imagery. Sci. China Earth Sci. 2016, 59, 249–257. [Google Scholar] [CrossRef]
- Marghany, M. Automatic Detection of oil spill disasters along gulf of Mexico using RADARSAT-2 SAR data. J. Indian Soc. Remote Sens. 2017, 45, 503–511. [Google Scholar] [CrossRef]
- Marghany, M. Oil Spill pollution automatic detection from MultiSAR satellite data using genetic algorithm. In Advanced Geoscience Remote Sensing; InTech: London, UK, 2014. [Google Scholar]
- Carvalho, G.D.A.; Minnett, P.J.; Paes, E.T.; de Miranda, F.P.; Landau, L. Refined analysis of RADARSAT-2 measurements to discriminate two petrogenic oil-slick categories: Seeps versus spills. J. Mar. Sci. Eng. 2018, 6, 153. [Google Scholar] [CrossRef] [Green Version]
- Wang, X.; Shao, Y.; Zhang, F.; Tian, W. Comparison of C- and L-band simulated compact polarized SAR in oil spill detection. Front. Earth Sci. 2019, 13, 351–360. [Google Scholar] [CrossRef]
- Marghany, M. Utilization of a genetic algorithm for the automatic detection of oil spill from RADARSAT-2 SAR satellite data. Mar. Pollut. Bull. 2014, 89, 20–29. [Google Scholar] [CrossRef] [PubMed]
- Song, D.; Ding, Y.; Li, X.; Zhang, B.; Xu, M. Ocean oil spill classification with RADARSAT-2 SAR based on an optimized wavelet neural network. Remote Sens. 2017, 9, 799. [Google Scholar] [CrossRef] [Green Version]
- Singha, S.; Vespe, M.; Trieschmann, O. Automatic synthetic aperture radar based oil spill detection and performance estimation via a semi-automatic operational service benchmark. Mar. Pollut. Bull. 2013, 73, 199–209. [Google Scholar] [CrossRef]
- Marghany, M. Automatic detection of oil spills in the gulf of Mexico from RADARSAT-2 SAR satellite data. Environ. Earth Sci. 2015, 74, 5935–5947. [Google Scholar] [CrossRef]
- Wang, S.; Fu, X.; Zhao, Y.; Wang, H. Modification of CFAR Algorithm for Oil Spill Detection from SAR Data. Intell. Autom. Soft Comput. 2015, 21, 163–174. [Google Scholar] [CrossRef]
- Mera, D.; Cotos, J.M.; Varela-Pet, J.G.; Rodríguez, P.; Caro, A. Automatic decision support system based on SAR data for oil spill detection. Comput. Geosci. 2014, 72, 184–191. [Google Scholar] [CrossRef] [Green Version]
- Moctezuma, M.; Parmiggiani, F. Adaptive stochastic minimization for measuring marine oil spill extent in synthetic aperture radar images. J. Appl. Remote Sens. 2014, 8, 083553. [Google Scholar] [CrossRef] [Green Version]
- Konik, M.; Bradtke, K. Object-oriented approach to oil spill detection using ENVISAT ASAR images. ISPRS J. Photogramm. Remote Sens. 2016, 118, 37–52. [Google Scholar] [CrossRef]
- Akar, S.; Süzen, M.L.; Kaymakci, N. Detection and object-based classification of offshore oil slicks using ENVISAT-ASAR images. Environ. Monit. Assess. 2011, 183, 409–423. [Google Scholar] [CrossRef] [PubMed]
- Mihoub, Z.; Hassini, A. Monitoring and identification of marine oil spills using advanced synthetic aperture radar images. Opt. Appl. 2014, 44, 433–449. [Google Scholar]
- Senthil Murugan, J.; Parthasarathy, V. AETC: Segmentation and classification of the oil spills from SAR imagery. Environ. Forensics 2017, 18, 258–271. [Google Scholar] [CrossRef]
- Su, T.F.; Li, H.Y.; Liu, T.X. Sea oil spill detection method using SAR imagery combined with object-Based image analysis and fuzzy logic. Adv. Mater. Res. 2014, 1065–1069, 3192–3200. [Google Scholar] [CrossRef]
- Mera, D.; Fernández-Delgado, M.; Cotos, J.M.; Viqueira, J.R.R.; Barro, S. Comparison of a massive and diverse collection of ensembles and other classifiers for oil spill detection in SAR satellite images. Neural Comput. Appl. 2017, 28, 1101–1117. [Google Scholar] [CrossRef]
- Yu, F.; Sun, W.; Li, J.; Zhao, Y.; Zhang, Y.; Chen, G. An improved Otsu method for oil spill detection from SAR images. Oceanologia 2017, 59, 311–317. [Google Scholar] [CrossRef]
- Hang, L.M.; Van Truong, V. A combination method of differential evolution algorithm and neural network for automatic identification oil spill at Vietnam East Sea. J. Geol. Resour. Eng. 2015, 4, 184–193. [Google Scholar]
- Holstein, A.; Kappas, M.; Propastin, P.; Renchin, T. Oil spill detection in the Kazakhstan sector of the Caspian sea with the help of ENVISAT ASAR data. Environ. Earth Sci. 2018, 77, 198. [Google Scholar] [CrossRef] [Green Version]
- Cheng, Y.; Li, X.; Xu, Q.; Garcia-Pineda, O.; Andersen, O.B.; Pichel, W.G. SAR observation and model tracking of an oil spill event in coastal waters. Mar. Pollut. Bull. 2011, 62, 350–363. [Google Scholar] [CrossRef]
- Zhang, Y.; Lin, H.; Liu, Q.; Hu, J.; Li, X.; Yeung, K. Oil-Spill Monitoring in the coastal waters of Hong Kong and vicinity. Mar. Geod. 2012, 35, 93–106. [Google Scholar] [CrossRef]
- Singha, S.; Ressel, R.; Velotto, D.; Lehner, S. A Combination of Traditional and Polarimetric Features for oil spill detection using TerraSAR-X. IEEE J. Sel. Top. Appl. Earth Obs. Remote Sens. 2016, 9, 4979–4990. [Google Scholar] [CrossRef] [Green Version]
- Kim, D.; Jung, H.S. Mapping oil spills from dual-polarized sar images using an artificial neural network: Application to oil spill in the kerch strait in november 2007. Sensors 2018, 18, 2237. [Google Scholar] [CrossRef] [Green Version]
- Benito-Ortiz, M.C.; Mata-Moya, D.; Jarabo-Amores, M.P.; Maganto-Pascual, M.; Gomez-del-Hoyo, P.J. Multi-resolution technique-based oil spill look-alikes detection in X-band SAR data. In Advances in Intelligent Systems and Computing; Springer Verlag: Berlin/Heidelberg, Germany, 2019; Volume 797, pp. 737–745. [Google Scholar]
- Nunziata, F.; de Macedo, C.R.; Buono, A.; Velotto, D.; Migliaccio, M. On the analysis of a time series of X–band TerraSAR–X SAR imagery over oil seepages. Int. J. Remote Sens. 2019, 40, 3623–3646. [Google Scholar] [CrossRef]
- Singha, S.; Velotto, D.; Lehner, S. Near real time monitoring of platform sourced pollution using TerraSAR-X over the North Sea. Mar. Pollut. Bull. 2014, 86, 379–390. [Google Scholar] [CrossRef] [PubMed]
- Velotto, D.; Member, S.; Migliaccio, M.; Member, S.; Nunziata, F.; Member, S.; Lehner, S. Dual-polarized TerraSAR-X data for oil-spill observation. IEEE Trans. Geosci. Remote Sens. 2011, 49, 4751–4762. [Google Scholar] [CrossRef]
- Lupidi, A.; Staglianò, D.; Martorella, M.; Berizzi, F. Fast detection of oil spills and ships using SAR images. Remote Sens. 2017, 9, 230. [Google Scholar] [CrossRef] [Green Version]
- Nunziata, F.; Buono, A.; Migliaccio, M. COSMO-SkyMed synthetic aperture radar data to observe the deepwater horizon oil spill. Sustainability 2018, 10, 3599. [Google Scholar] [CrossRef] [Green Version]
- Marghany, M. Multi-objective evolutionary algorithm for oil spill detection from COSMO-SkeyMed satellite. In Proceedings of the Lecture Notes in Computer Science (Including Subseries Lecture Notes in Artificial Intelligence and Lecture Notes in Bioinformatics); Springer: Berlin/Heidelberg, Germany, 2014; Volume 8584, pp. 355–371. [Google Scholar]
- Chaudhary, V.; Kumar, S. Marine oil slicks detection using spaceborne and airborne SAR data. Adv. Space Res. 2020, 66, 854–872. [Google Scholar] [CrossRef]
- Joseph, M.; Jayasri, P.V.; Dutta, S.; Kumari, E.V.S.S.; Prasad, A.V.V. Oil spill detection from RISAT-1 imagery using texture analysis. In Proceedings of the 2016 Asia-Pacific Microwave Conference (APMC), New Delhi, India, 5–9 December 2016. [Google Scholar]
- Kumar, L.J.V.; Kishore, J.K.; Rao, P.K. Unsupervised classification based on decomposition of RISAT-1 images for oil spill detection. In Proceedings of the 2013 International Conference on Advances in Computing, Communications and Informatics (ICACCI), Mysore, India, 22–25 August 2013. [Google Scholar]
- Lin, Y.; Yu, J.; Zhang, Y.; Wang, P.; Ye, Z. Dynamic analysis of oil spill in Yangtze estuary with HJ-1 imagery. In Proceedings of the Communications in Computer and Information Science; Springer: Berlin/Heidelberg, Germany, 2016; Volume 569, pp. 345–356. [Google Scholar]
- Tian, W.; Bian, X.; Shao, Y.; Zhang, Z. On the detection of oil spill with China’s HJ-1C SAR image. Aquat. Procedia 2015, 3, 144–150. [Google Scholar] [CrossRef]
- Harahsheh, H.A. Oil spill detection and monitoring of Abu Dhabi coastal zone using KOMPSAT-5 SAR imagery. Int. Arch. Photogramm. Remote Sens. Spat. Inf. Sci. 2016, 41, 1115–1121. [Google Scholar] [CrossRef]
- Kim, D. Monitoring of coastal wind and oil spill using KOMPSAT-5. In Proceedings of the 2011 3rd International Asia-Pacific Conference on Synthetic Aperture Radar, Seoul, Korea, 26–30 September 2011; pp. 1–4. [Google Scholar]
- Prastyani, R.; Basith, A. Detecting Oil spill on Sentinel-1 imagery based on texture analysis and instantaneous wind speed estimation. In Proceedings of the 5th International Conference on Science and Technology, Yogyakarta, Indonesia, 30–31 July 2019; pp. 1–5. [Google Scholar]
- Chaturvedi, S.K.; Banerjee, S.; Lele, S. An assessment of oil spill detection using Sentinel 1 SAR-C images. J. Ocean Eng. Sci. 2020, 5, 116–135. [Google Scholar] [CrossRef]
- Topouzelis, K.; Singha, S. Oil Spill Detection Using Space-Borne Sentinel-1 SAR Imagery; Elsevier: Amsterdam, The Netherlands, 2017; ISBN 9781856179430. [Google Scholar]
- Prastyani, R.; Basith, A. Utilisation of Sentinel-1 SAR imagery for oil spill mapping: A case study of Balikpapan Bay oil spill. JGISE J. Geospat. Inf. Sci. Eng. 2018, 1, 22–26. [Google Scholar] [CrossRef]
- El-Magd, I.A.; Zakzouk, M.; Abdulaziz, A.M.; Ali, E.M. The potentiality of operational mapping of oil pollution in the mediterranean sea near the entrance of the suez canal using sentinel-1 SAR data. Remote Sens. 2020, 12, 1352. [Google Scholar] [CrossRef] [Green Version]
- Paolini, L.; Grings, F.; Sobrino, J.; Jiménez Muñoz, J.C.; Karszenbaum, H. Radiometric correction effects in Landsat multi-date/multi-sensor change detection studies. Int. J. Remote Sens. 2006, 27, 685–704. [Google Scholar] [CrossRef]
- Chrysoulakis, N.; Abrams, M.; Feidas, H.; Arai, K. Comparison of atmospheric correction methods using ASTER data for the area of Crete, Greece. Int. J. Remote Sens. 2010, 31, 6347–6385. [Google Scholar] [CrossRef]
- Lu, Y.; Li, X.; Tian, Q.; Zheng, G.; Sun, S.; Liu, Y.; Yang, Q. Progress in marine oil spill optical remote sensing: Detected targets, spectral response characteristics, and theories. Mar. Geod. 2013, 36, 334–346. [Google Scholar] [CrossRef]
- Frulla, L.A.; Milovich, J.A.; Karszenbaum, H.; Gagliardini, D.A. Radiometric corrections and calibration of SAR images. In Proceedings of the International Geoscience and Remote Sensing Symposium, Seattle, WA, USA, 6–10 July 1998; Volume 2, pp. 1147–1149. [Google Scholar]
- Maître, H. Processing of Synthetic Aperture Radar Images; Willey: Hoboken, NJ, USA, 2008; ISBN 978-1-84821-024-0. [Google Scholar]
- Yuan, L.; Ge, J.; Jiang, K.; Wang, Y. Research on efficient calibration techniques for airborne SAR systems. Asia-Pacific Conf. Synth. Aperture Radar Proc. 2009, 266–269. [Google Scholar] [CrossRef]
- Moreira, A.; Prats-Iraola, P.; Younis, M.; Krieger, G.; Hajnsek, I.; Papathanassiou, K.P. A tutorial on synthetic aperture radar. IEEE Geosci. Remote Sens. Mag. 2013, 1, 6–43. [Google Scholar] [CrossRef] [Green Version]
- Loew, A.; Mauser, W. Generation of geometrically and radiometrically terrain corrected SAR image products. Remote Sens. Environ. 2007, 106, 337–349. [Google Scholar] [CrossRef]
- Lillesand, T.; Kiefer, R.W.; Chipman, J. Remote Sensing and Image Interpretation; John Wiley and Sons: Hoboken, NJ, USA, 2015. [Google Scholar]
- Argenti, F.; Lapini, A.; Alparone, L.; Bianchi, T. A tutorial on speckle reduction in synthetic aperture radar images. IEEE Geosci. Remote Sens. Mag. 2013, 1, 6–35. [Google Scholar] [CrossRef] [Green Version]
- Gao, F.; Xue, X.; Sun, J.; Wang, J.; Zhang, Y. A SAR image despeckling method based on two-dimensional S transform shrinkage. IEEE Trans. Geosci. Remote Sens. 2016, 54, 3025–3034. [Google Scholar] [CrossRef]
- Topouzelis, K.; Psyllos, A. Oil spill feature selection and classification using decision tree forest on SAR image data. ISPRS J. Photogramm. Remote Sens. 2012, 68, 135–143. [Google Scholar] [CrossRef]
- Brekke, C.; Solberg, A.H.S. Feature extraction for oil spill detection based on SAR images. Lect. Notes Comput. Sci. 2005, 3540, 75–84. [Google Scholar]
- Lang, H.; Zhang, X.; Xi, Y.; Zhang, X.; Li, W. Dark-spot segmentation for oil spill detection based on multifeature fusion classification in single-pol synthetic aperture radar imagery. J. Appl. Remote Sens. 2017, 11, 015006. [Google Scholar] [CrossRef]
- Mera, D.; Bolon-Canedo, V.; Cotos, J.M.; Alonso-Betanzos, A. On the use of feature selection to improve the detection of sea oil spills in SAR images. Comput. Geosci. 2017, 100, 166–178. [Google Scholar] [CrossRef]
- Ramalho, G.L.B.; De Medeiros, F.N.S. Improving reliability of oil spill detection systems using boosting for high-level feature selection. Lect. Notes Comput. Sci. 2007, 4633, 1172–1181. [Google Scholar]
- Karathanassi, V.; Topouzelis, K.; Pavlakis, P.; Rokos, D. An object-oriented methodology to detect oil spills. Int. J. Remote Sens. 2006, 27, 5235–5251. [Google Scholar] [CrossRef]
- Topouzelis, K.; Stathakis, D.; Karathanassi, V. Investigation of genetic algorithms contribution to feature selection for oil spill detection. Int. J. Remote Sens. 2009, 30, 611–625. [Google Scholar] [CrossRef]
- Shi, L.; Zhang, X.; Seielstad, G.; Zhao, C.; He, M.X. Oil spill detection by MODIS images using fuzzy cluster and texture feature extraction. In Proceedings of the OCEANS 2007—Europe, Aberdeen, UK, 18–21 June 2007. [Google Scholar]
- Ma, L. Support Tucker machines based marine oil spill detection using SAR images. Indian J. Geo-Mar. Sci. 2016, 45, 1445–1449. [Google Scholar]
- Ozkan, C.; Ozturk, C.; Sunar, F.; Karaboga, D. The artificial bee colony algorithm in training artificial neural network for oil spill detection. Neural Netw. World 2011, 21, 473–492. [Google Scholar] [CrossRef]
- Wang, Y.; Lin, M. Numerical Simulation on Oil Spilling of Submarine Pipeline and Its Evolution on Sea Surface. Comput. Modeling Eng. Sci. 2020, 124, 885–914. [Google Scholar] [CrossRef]
- Marzialetti, P.; Laneve, G. Oil spill monitoring on water surfaces by radar L, C and X band SAR imagery: A comparison of relevant characteristics. Int. Geosci. Remote Sens. Symp. 2016, 2016, 7715–7717. [Google Scholar]
- Hu, M.K. Visual Pattern Recognition by Moment Invariants. IRE Trans. Inf. Theory 1962, 8, 179–187. [Google Scholar]
- Yue, G.; Xiaofeng, W. Oil spill detection by SAR images based on shape feature space. Int. Conf. Netw. Inf. Technol. IPCSIT 2011, 17, 187–194. [Google Scholar]
- Capizzi, G.; Lo Sciuto, G.; Wozniak, M.; Damasevicius, R. A clustering based system for automated oil spill detection by satellite remote sensing. In Artificial Intelligence and Soft Computing; Rutkowski, L., Korytkowski, M., Scherer, R., Tadeusiewicz, R., Zadeh, L., Zurada, J., Eds.; Springer: Berlin/Heidelberg, Germany, 2016; pp. 613–623. [Google Scholar]
- Dabbiru, L.; Samiappan, S.; Nobrega, R.A.A.; Aanstoos, J.A.; Younan, N.H.; Moorhead, R.J. Fusion of synthetic aperture radar and hyperspectral imagery to detect impacts of oil spill in Gulf of Mexico. Int. Geosci. Remote Sens. Symp. 2015, 2015, 1901–1904. [Google Scholar]
- Zhao, P.; Yang, X.; Chen, Y.; Tong, L.; He, L. Feature extraction and classification of ocean oil spill based on SAR image. In Proceedings of the International Geoscience and Remote Sensing Symposium, Beijing, China, 10–15 July 2016; pp. 1488–1491. [Google Scholar]
- Liu, P.; Li, Y.; Liu, B.; Chen, P.; Xu, J. Semi-automatic oil spill detection on X-band marine radar images using texture analysis, machine learning, and adaptive thresholding. Remote Sens. 2019, 11, 756. [Google Scholar] [CrossRef] [Green Version]
- Chen, G.; Guo, H.; An, J. Research on SAR oil spill image classification based on DBN in small sample space. In Proceedings of the 2017 4th International Conference on Systems and Informatics (ICSAI), Hangzhou, China, 11–13 November 2017; Volume 2018, pp. 479–483. [Google Scholar]
- Lyu, X. Oil spill detection based on features and extreme learning machine method in SAR images. In Proceedings of the 2018 3rd International Conference On Mechanical, Control and Computer Engineering, Hohhot, China, 14–16 September 2018; pp. 559–563. [Google Scholar]
- Guo, H.; Wu, D.; An, J. Discrimination of oil slicks and lookalikes in polarimetric SAR images using CNN. Sensors 2017, 17, 1837. [Google Scholar] [CrossRef] [Green Version]
- Zhang, Y.; Li, Y.; Liang, X.S.; Tsou, J. Comparison of oil spill classifications using fully and compact polarimetric SAR images. Appl. Sci. 2017, 7, 193. [Google Scholar] [CrossRef] [Green Version]
- Li, X.; Nunziata, F.; Garcia, O. Oil spill detection from single- and multipolarization SAR imagery. Compr. Remote Sens. 2017, 1–9, 231–248. [Google Scholar]
- Li, Y.; Zhang, Y.; Yuan, Z.; Guo, H.; Pan, H.; Guo, J. Marine oil spill detection based on the comprehensive use of polarimetric SAR data. Sustainablity 2018, 10, 4408. [Google Scholar] [CrossRef] [Green Version]
- Song, S.; Zhao, C.; An, W.; Li, X.; Wang, C. Analysis of impacting factors on polarimetric SAR oil spill detection. Acta Oceanol. Sin. 2018, 37, 77–87. [Google Scholar] [CrossRef]
- Salberg, A.B.; Rudjord, Ø.; Solberg, A.H.S. Oil spill detection in hybrid-polarimetric SAR images. IEEE Trans. Geosci. Remote Sens. 2014, 52, 6521–6533. [Google Scholar] [CrossRef]
- Li, Y.; Lin, H.; Zhang, Y.; Chen, J. Comparisons of circular transmit and linear receive compact polarimetric SAR features for oil slicks discrimination. J. Sens. 2015, 2015. [Google Scholar] [CrossRef] [Green Version]
- Minchew, B.; Jones, C.E.; Holt, B. Polarimetric analysis of backscatter from the deepwater horizon oil spill using l-band synthetic aperture radar. IEEE Trans. Geosci. Remote Sens. 2012, 50, 3812–3830. [Google Scholar] [CrossRef]
- Nunziata, F.; Migliaccio, M.; Gambardella, A. Pedestal height for sea oil slick observation. IET Radar Sonar Navig. 2011, 5, 103–110. [Google Scholar] [CrossRef]
- Migliaccio, M.; Nunziata, F.; Gambardella, A. On the co-polarized phase difference for oil spill observation. Int. J. Remote Sens. 2009, 30, 1587–1602. [Google Scholar] [CrossRef]
- Singha, S.; Bellerby, T.J.; Trieschmann, O. Satellite oil spill detection using artificial neural networks. IEEE J. Sel. Top. Appl. Earth Obs. Remote Sens. 2013, 6, 2355–2363. [Google Scholar] [CrossRef]
- Gibril, M.B.A.; Kalantar, B.; Al-Ruzouq, R.; Ueda, N.; Saeidi, V.; Shanableh, A.; Mansor, S.; Shafri, H.Z.M. Mapping heterogeneous urban landscapes from the fusion of digital surface model and unmanned aerial vehicle-based images using adaptive multiscale image segmentation and classification. Remote Sens. 2020, 12, 1081. [Google Scholar] [CrossRef] [Green Version]
- Hamedianfar, A.; Barakat, A.; Gibril, M. Gibril Large-scale urban mapping using integrated geographic object-based image analysis and artificial bee colony optimization from worldview-3 data. Int. J. Remote Sens. 2019, 40, 6796–6821. [Google Scholar] [CrossRef]
- Laliberte, A.S.; Browning, D.M.; Rango, A. A comparison of three feature selection methods for object-based classification of sub-decimeter resolution UltraCam-L imagery. Int. J. Appl. Earth Obs. Geoinf. 2012, 15, 70–78. [Google Scholar] [CrossRef]
- Hamedianfar, A.; Gibril, M.B.A.; Hosseinpoor, M.; Pellikka, P.K.E. Synergistic use of particle swarm optimization, artificial neural network, and extreme gradient boosting algorithms for urban LULC mapping from WorldView-3 images. Geocarto Int. 2020. [Google Scholar] [CrossRef]
- Dash, M.; Liu, H. Feature selection for classification. Intell. Data Anal. 1997, 1, 131–156. [Google Scholar] [CrossRef]
- Georganos, S.; Grippa, T.; Vanhuysse, S.; Lennert, M.; Shimoni, M.; Kalogirou, S.; Wolff, E. Less is more: Optimizing classification performance through feature selection in a very-high-resolution remote sensing object-based urban application. GIScience Remote Sens. 2018, 55, 221–242. [Google Scholar] [CrossRef]
- Guyon, I.; Elisseeff, A. An introduction to variable and feature selection. J. Mach. Learn. Res. 2003, 3, 1157–1182. [Google Scholar]
- Ma, L.; Fu, T.; Blaschke, T.; Li, M.; Tiede, D.; Zhou, Z.; Ma, X.; Chen, D. Evaluation of feature selection methods for object-based land cover mapping of unmanned aerial vehicle imagery using random forest and support vector machine classifiers. ISPRS Int. J. Geo-Inf. 2017, 6, 51. [Google Scholar] [CrossRef]
- Colkesen, I.; Kavzoglu, T. Selection of optimal object features in object-based image analysis using filter-based algorithms. J. Indian Soc. Remote Sens. 2018, 46, 1233–1242. [Google Scholar] [CrossRef]
- Shanableh, A.; Al-Ruzouq, R.; Gibril, M.B.A.; Flesia, C.; AL-Mansoori, S. Spatiotemporal mapping and monitoring of whiting in the semi-enclosed gulf using moderate resolution imaging spectroradiometer (MODIS) time series images and a generic ensemble tree-based model. Remote Sens. 2019, 11, 1193. [Google Scholar] [CrossRef] [Green Version]
- Zhou, Y.; Chen, Y.; Feng, L.; Zhang, X.; Shen, Z.; Zhou, X. Supervised and adaptive feature weighting for object-based classification on satellite images. IEEE J. Sel. Top. Appl. Earth Obs. Remote Sens. 2018, 11, 3224–3234. [Google Scholar] [CrossRef]
- Wolff, S.; O’Donncha, F.; Chen, B. Statistical and machine learning ensemble modelling to forecast sea surface temperature. J. Mar. Syst. 2020, 208, 103347. [Google Scholar] [CrossRef]
- Guirado, E.; Tabik, S.; Rivas, M.L.; Alcaraz-Segura, D.; Herrera, F. Whale counting in satellite and aerial images with deep learning. Sci. Rep. 2019, 9, 1–12. [Google Scholar] [CrossRef] [Green Version]
- Li, X.; Liu, B.; Zheng, G.; Ren, Y.; Zhang, S.; Liu, Y.; Gao, L.; Liu, Y.; Zhang, B.; Wang, F. Deep learning-based information mining from ocean remote sensing imagery. Natl. Sci. Rev. 2020, 1–22. [Google Scholar] [CrossRef]
- Prakash, N.; Manconi, A.; Loew, S. Mapping landslides on EO data: Performance of deep learning models vs. Traditional machine learning models. Remote Sens. 2020, 12, 346. [Google Scholar] [CrossRef] [Green Version]
- Shahabi, H.; Shirzadi, A.; Ghaderi, K.; Omidvar, E.; Al-Ansari, N.; Clague, J.J.; Geertsema, M.; Khosravi, K.; Amini, A.; Bahrami, S.; et al. Flood detection and susceptibility mapping using Sentinel-1 remote sensing data and a machine learning approach: Hybrid intelligence of bagging ensemble based on K-Nearest Neighbor classifier. Remote Sens. 2020, 12, 266. [Google Scholar] [CrossRef] [Green Version]
- Sharma, R.; Rani, S.; Memon, I. A smart approach for fire prediction under uncertain conditions using machine learning. Multimed. Tools Appl. 2020, 79, 1–14. [Google Scholar] [CrossRef]
- Kalantar, B.; Ueda, N.; Saeidi, V.; Ahmadi, K.; Halin, A.A.; Shabani, F. Landslide Susceptibility Mapping: Machine and ensemble learning based on remote sensing big data. Remote Sens. 2020, 12, 1737. [Google Scholar] [CrossRef]
- Xavier, L.C.P.; Carvalho, T.M.N.; Filho, J.D.P.; de Souza Filho, F.d.A.; da Silva, S.M.O. Use of machine learning in evaluation of drought perception in irrigated agriculture: The case of an irrigated perimeter in Brazil. Water 2020, 12, 1546. [Google Scholar] [CrossRef]
- Mazzia, V.; Comba, L.; Khaliq, A.; Chiaberge, M.; Gay, P. UAV and machine learning based refinement of a satellite-driven vegetation index for precision agriculture. Sensors 2020, 20, 2530. [Google Scholar] [CrossRef]
- Al-najjar, H.A.H.; Kalantar, B.; Pradhan, B.; Saeidi, V. Land Cover Classification from fused DSM and UAV Images Using Convolutional Neural Networks. Remote Sens. 2019, 11, 1461. [Google Scholar] [CrossRef] [Green Version]
- Gibril, M.B.A.; Idrees, M.O.; Yao, K.; Shafri, H.Z.M. Integrative image segmentation optimization and machine learning approach for high quality land-use and land-cover mapping using multisource remote sensing data. J. Appl. Remote Sens. 2018, 12. [Google Scholar] [CrossRef]
- Shen, H.; Jiang, Y.; Li, T.; Cheng, Q.; Zeng, C.; Zhang, L. Deep learning-based air temperature mapping by fusing remote sensing, station, simulation and socioeconomic data. Remote Sens. Environ. 2020, 240, 111692. [Google Scholar] [CrossRef] [Green Version]
- Yang, G.; Lee, H.; Lee, G. A hybrid deep learning model to forecast particulate matter concentration levels in Seoul, South Korea. Atmosphere 2020, 11, 348. [Google Scholar] [CrossRef] [Green Version]
- Franch, G.; Nerini, D.; Pendesini, M.; Coviello, L.; Jurman, G.; Furlanello, C. Precipitation nowcasting with orographic enhanced stacked generalization: Improving deep learning predictions on extreme events. Atmosphere 2020, 11, 267. [Google Scholar] [CrossRef] [Green Version]
- Mitchell, T.M. Machine Learning; McGraw-Hill: New York, NY, USA, 1997. [Google Scholar]
- Misra, A.; Balaji, R. Simple approaches to oil spill detection using sentinel application platform (SNAP)-Ocean application tools and texture analysis: A Comparative Study. J. Indian Soc. Remote Sens. 2017, 45, 1065–1075. [Google Scholar] [CrossRef]
- Gil, P.; Alacid, B. Oil spill detection in terma-side-looking airborne radar images using image features and region segmentation. Sensors 2018, 18, 151. [Google Scholar] [CrossRef] [PubMed] [Green Version]
- Ajadi, O.A.; Meyer, F.J.; Tello, M.; Ruello, G. Oil spill detection in synthetic aperture radar images using lipschitz-regularity and multiscale techniques. IEEE J. Sel. Top. Appl. Earth Obs. Remote Sens. 2018, 11, 2389–2405. [Google Scholar] [CrossRef]
- Garcia-Pineda, O.; MacDonald, I.R.; Li, X.; Jackson, C.R.; Pichel, W.G. Oil spill mapping and measurement in the gulf of mexico with Textural Classifier Neural Network Algorithm (TCNNA). IEEE J. Sel. Top. Appl. Earth Obs. Remote Sens. 2013, 6, 2517–2525. [Google Scholar] [CrossRef]
- Del Frate, F.; Latini, D.; Scappiti, V. On neural networks algorithms for oil spill detection when applied to C- and X-band SAR. Int. Geosci. Remote Sens. Symp. 2017, 2017, 5249–5251. [Google Scholar]
- Gogate, P.U.; Desai, P.; Gawde, M.; Harne, S. Classification and Detection of Oil Spills Using Artificial Neural Network. Int. J. Adv. Res. Comput. Commun. Eng. 2016, 5, 62–64. [Google Scholar]
- Avezzano, R.G.; Velotto, D.; Soccorsi, M.; Del Frate, F.; Lehner, S. Neural networks for oil spill detection using TerraSAR-X data. In Proceedings of the SAR Image Analysis, Modeling, and Techniques XI; SPIE: Bellingham, WA, USA, 2011; Volume 8179, p. 817911. [Google Scholar]
- Wan, J.; Cheng, Y. Remote sensing monitoring of gulf of Mexico oil spill using ENVISAT ASAR images. Int. Conf. Geoinf. 2013, 1–5. [Google Scholar] [CrossRef]
- Joseph, M.; Jayasri, P.V.; Dutta, S.; Kumari, E.V.S.S.; Prasad, A.V.V. Oil spill detection from RISAT-1 imagery using texture analysis. In Proceedings of the Asia-Pacific Microwave Conference, Kyoto, Japan, 6–9 November 2019; Institute of Electrical and Electronics Engineers: Piscataway, NJ, USA, 2017. [Google Scholar]
- Zisimopoulos, M.; Kyriou, A.; Nikolakopoulos, K.G. Synergy of Copernicus optical and radar data for oil spill detection. In Proceedings of the Earth Resources and Environmental Remote Sensing/GIS Applications X; Schulz, K., Nikolakopoulos, K.G., Michel, U., Eds.; SPIE: Bellingham, WA, USA, 2019; Volume 11156, p. 37. [Google Scholar]
- Fausett, L. Fundamentals of neural networks: Architectures, algorithms and applications. J. Chromatogr. B Analyt. Technol. Biomed. Life Sci. 2005, 814, 315–323. [Google Scholar]
- Fausett, L. Fundamentals of Neural Networks; Prentice-Hall: Upper Saddle River, NJ, USA, 1994; ISBN 978-0-13-334186-7. [Google Scholar]
- Fausett, L. Fundamentals of Neural Networks: Architectures, Algorithms and Applications Fundamentals of Neural Networks: Architectures, Algorithms and Applications; Pearson Education: Cranbury, NJ, USA, 2005; Volume 814. [Google Scholar]
- Cortes, C.; Vapnik, V. Support-vector networks. Mach. Learn. 1995, 20, 273–297. [Google Scholar] [CrossRef]
- Vapnik, V.N. The Nature of Statistical Learning Theory; Springer: New York, NY, USA, 1995. [Google Scholar]
- Kavzoglu, T.; Colkesen, I. A kernel functions analysis for support vector machines for land cover classification. Int. J. Appl. Earth Obs. Geoinf. 2009, 11, 352–359. [Google Scholar] [CrossRef]
- Chi, M.; Feng, R.; Bruzzone, L. Classification of hyperspectral remote-sensing data with primal SVM for small-sized training dataset problem. Adv. Space Res. 2008, 41, 1793–1799. [Google Scholar] [CrossRef]
- Burbidge, R.; Trotter, M.; Buxton, B.; Holden, S. Drug design by machine learning: Support vector machines for pharmaceutical data analysis. Comput. Chem. 2001, 26, 5–14. [Google Scholar] [CrossRef]
- Breiman, L.; Friedman, J.H.; Olshen, R.A.; Stone, C.J. Classification and Regression Trees; Wadsworth: Monterey, CA, USA, 1984. [Google Scholar]
- Ghose, M.K.; Pradhan, R.; Ghose, S.S. Decision tree classification of remotely sensed satellite data using spectral separability matrix. Int. J. Adv. Comput. Sci. Appl. 2010, 1, 93–101. [Google Scholar]
- James, A.P. Deep Learning Classifiers with Memristive Networks; Springer: Berlin/Heidelberg, Germany, 2020; Volume 14, ISBN 978-3-030-14522-4. [Google Scholar]
- Zhang, L.; Zhang, L.; Du, B. Deep learning for remote sensing data: A technical tutorial on the state of the art. IEEE Geosci. Remote Sens. Mag. 2016, 4, 22–40. [Google Scholar] [CrossRef]
- Deng, L.; Way, O.M.; Yu, D.; Way, O.M. Deep learning: Methods and applications. Signal Process. 2014, 7, 197–387. [Google Scholar]
- Jiao, Z.; Jia, G.; Cai, Y. A new approach to oil spill detection that combines deep learning with unmanned aerial vehicles. Comput. Ind. Eng. 2019, 135, 1300–1311. [Google Scholar] [CrossRef]
- Yaohua, X.; Xudong, M. A SAR oil spill image recognition method based on densenet convolutional neural network. In Proceedings of the 2019 International Conference on Intelligent Robots and Systems, Macau, China, 3–8 November 2019; pp. 78–81. [Google Scholar]
- Chen, Y.; Li, Y.; Wang, J. An end-to-end oil-spill monitoring method for multisensory satellite images based on deep semantic segmentation. Sensors 2020, 20, 725. [Google Scholar] [CrossRef] [Green Version]
- Krestenitis, M.; Orfanidis, G.; Ioannidis, K.; Avgerinakis, K.; Vrochidis, S.; Kompatsiaris, I. Oil spill identification from satellite images using deep neural networks. Remote Sens. 2019, 11, 1762. [Google Scholar] [CrossRef] [Green Version]
- Zhang, J.; Feng, H.; Luo, Q.; Li, Y.; Wei, J.; Li, J. Oil spill detection in quad-polarimetric SAR Images using an advanced convolutional neural network based on SuperPixel model. Remote Sens. 2020, 12, 944. [Google Scholar] [CrossRef] [Green Version]
- Guo, H.; Wei, G.; An, J. Dark spot detection in SAR images of oil spill using segnet. Appl. Sci. 2018, 8, 2670. [Google Scholar] [CrossRef] [Green Version]
- Bazine, R.; Wu, H.; Boukhechba, K. Semantic segmentation of SLAR imagery with convolutional LSTM selectional autoencoders. Remote Sens. 2019, 11, 1–22. [Google Scholar]
- Orfanidis, G.; Ioannidis, K.; Avgerinakis, K.; Vrochidis, S.; Kompatsiaris, I. A deep neural network for oil spill semantic segmentation in Sar images. In Proceedings of the International Conference on Image Processing, Athens, Greece, 7–10 October 2018; pp. 3773–3777. [Google Scholar]
- Cantorna, D.; Dafonte, C.; Iglesias, A.; Arcay, B. Oil spill segmentation in SAR images using convolutional neural networks. A comparative analysis with clustering and logistic regression algorithms. Appl. Soft Comput. J. 2019, 84, 105716. [Google Scholar] [CrossRef]
- Lecun, Y.; Bengio, Y.; Hinton, G. Deep learning. Nature 2015, 521, 436–444. [Google Scholar] [CrossRef]
- Lecun, Y.; Bottou, L.; Bengio, Y.; Ha, P. LeNet. Proc. IEEE 1998, 1–46. [Google Scholar]
- Goodfellow, I.; Bengio, Y.; Courville, A.; Bengio, Y. Deep Learning; MIT Press: Cambridge, UK, 2016; Volume 1. [Google Scholar]
- Xiong, Y.; Zhou, H. Oil spills identification in SAR image based on convolutional neural network. In Proceedings of the 14th International Conference on Computer Science and Education, Toronto, ON, Canada, 19–21 August 2019; pp. 667–670. [Google Scholar]
- Zeng, K.; Wang, Y. A deep convolutional neural network for oil spill detection from spaceborne SAR images. Remote Sens. 2020, 12, 1015. [Google Scholar] [CrossRef] [Green Version]
- Song, D.; Zhen, Z.; Wang, B.; Li, X.; Gao, L.; Wang, N.; Xie, T.; Zhang, T. A novel marine oil spillage identification scheme based on convolution neural network feature extraction from fully polarimetric SAR imagery. IEEE Access 2020, 8, 59801–59820. [Google Scholar] [CrossRef]
- Nieto-Hidalgo, M.; Gallego, A.J.; Gil, P.; Pertusa, A. Two-stage convolutional neural network for ship and spill detection using SLAR images. IEEE Trans. Geosci. Remote Sens. 2018, 56, 5217–5230. [Google Scholar] [CrossRef] [Green Version]
- Huang, H.; Wang, C.; Liu, S.; Sun, Z.; Zhang, D.; Liu, C.; Jiang, Y.; Zhan, S.; Zhang, H.; Xu, R. Single spectral imagery and faster R-CNN to identify hazardous and noxious substances spills. Environ. Pollut. 2020, 258, 113688. [Google Scholar] [CrossRef]
- Krestenitis, M.; Orfanidis, G.; Ioannidis, K.; Avgerinakis, K.; Vrochidis, S.; Kompatsiaris, I. Early identification of oil spills in satellite images using deep CNNs. In Proceedings of the International Conference on Multimedia Modeling, Thessaloniki, Greece, 8–11 January 2019; pp. 424–435. [Google Scholar]
- Li, Y.; Yang, X.; Ye, Y.; Cui, L.; Jia, B.; Jiang, Z.; Wang, S. Detection of oil spill through fully convolutional network. In Communications in Computer and Information Science; Springer: Berlin/Heidelberg, Germany, 2018; Volume 848, pp. 353–362. [Google Scholar]
- Bianchi, F.M.; Espeseth, M.M.; Borch, N. Large-scale detection and categorization of oil spills from SAR images with deep learning. Remote Sens. 2020, 12, 2260. [Google Scholar] [CrossRef]
- Temitope, S.; Balogun, A.; Wan, K.B. A novel deep learning instance segmentation model for automated marine oil spill detection. ISPRS J. Photogramm. Remote Sens. 2020, 167, 190–200. [Google Scholar] [CrossRef]
- Gallego, A.-J.; Gil, P.; Pertusa, A.; Fisher, R. Segmentation of oil spills on side-looking airborne radar imagery with autoencoders. Sensors 2018, 18, 797. [Google Scholar] [CrossRef] [Green Version]
- Oprea, S.O.; Gil, P.; Mira, D.; Alacid, B. Candidate oil spill detection in SLAR data a recurrent neural network-based approach. In Proceedings of the 6th International Conference on Pattern Recognition Applications and Methods, Porto, Portugal, 24–26 February 2017; pp. 372–377. [Google Scholar]
- Yu, X.; Zhang, H.; Luo, C.; Qi, H.; Ren, P. Oil spill segmentation via adversarial f-divergence learning. IEEE Trans. Geosci. Remote Sens. 2018, 56, 4973–4988. [Google Scholar] [CrossRef]
- Song, J.; Gao, S.; Zhu, Y.; Ma, C. A survey of remote sensing image classification based on CNNs. Big Earth Data 2019, 3, 232–254. [Google Scholar] [CrossRef]
- Wang, L.; Xu, X.; Dong, H.; Gui, R.; Pu, F. Multi-pixel simultaneous classification of PolSAR image using convolutional neural networks. Sensors 2018, 18, 769. [Google Scholar] [CrossRef] [PubMed] [Green Version]
- Zeiler, M.D.; Fergus, R. Stochastic pooling for regularization of deep convolutional neural networks. In Proceedings of the 1st International Conference on Learning Representation, Scottsdale, AZ, USA, 2–4 May 2013. [Google Scholar]
- Simonyan, K.; Zisserman, A. Very deep convolutional networks for large-scale image recognition. arXiv 2014, arXiv:1409.1556. [Google Scholar]
- He, K.; Zhang, X.; Ren, S.; Sun, J. Spatial pyramid pooling in deep convolutional networks for visual recognition. IEEE Trans. Pattern Anal. Mach. Intell. 2015, 37, 1904–1916. [Google Scholar] [CrossRef] [PubMed] [Green Version]
- Chen, L.C.; Papandreou, G.; Kokkinos, I.; Murphy, K.; Yuille, A.L. DeepLab: Semantic image segmentation with deep convolutional nets, atrous convolution, and fully connected CRFs. IEEE Trans. Pattern Anal. Mach. Intell. 2018, 40, 834–848. [Google Scholar] [CrossRef]
- Girshick, R.; Donahue, J.; Darrell, T.; Malik, J. Rich feature hierarchies for accurate object detection and semantic segmentation. In Proceedings of the IEEE Conference on Computer Vision and Pattern Recognition (CVPR), Columbus, OH, USA, 24–27 June 2014; pp. 580–587. [Google Scholar]
- Zhang, Z.; Guo, W.; Zhu, S.; Yu, W. Toward arbitrary-oriented ship detection with rotated region proposal and discrimination networks. IEEE Geosci. Remote Sens. Lett. 2018, 15, 1745–1749. [Google Scholar] [CrossRef]
- Ren, S.; He, K.; Girshick, R.; Sun, J. Faster R-CNN: Towards real-time object detection with region proposal networks. IEEE Trans. Pattern Anal. Mach. Intell. 2017, 39, 1137–1149. [Google Scholar] [CrossRef] [PubMed] [Green Version]
- He, K.; Gkioxari, G.; Dollár, P.; Girshick, R. Mask R-CNN. IEEE Trans. Pattern Anal. Mach. Intell. 2020, 42, 386–397. [Google Scholar] [CrossRef] [PubMed]
- Redmon, J.; Divvala, S.; Girshick, R.; Farhadi, A. You only look once: Unified, real-time object detection. In Proceedings of the 2016 IEEE Conference on Computer Vision and Pattern Recognition, Las Vegas, NV, USA, 27–30 June 2016; pp. 779–788. [Google Scholar]
- Liu, W.; Anguelov, D.; Erhan, D.; Szegedy, C.; Reed, S.; Fu, C.Y.; Berg, A.C. SSD: Single shot multibox detector. Lect. Notes Comput. Sci. 2016, 9905, 21–37. [Google Scholar]
- Nie, X.; Duan, M.; Ding, H.; Hu, B.; Wong, E.K. Attention mask R-CNN for ship detection and segmentation from remote sensing images. IEEE Access 2020, 8, 9325–9334. [Google Scholar] [CrossRef]
- Yao, Y.; Jiang, Z.; Zhang, H.; Zhao, D.; Cai, B. Ship detection in optical remote sensing images based on deep convolutional neural networks. J. Appl. Remote Sens. 2017, 11, 1. [Google Scholar] [CrossRef]
- Zhai, M.; Liu, H.; Sun, F.; Zhang, Y. Ship detection based on faster R-CNN network in optical remote sensing images. In Proceedings of the Lecture Notes in Electrical Engineering; Springer: Berlin/Heidelberg, Germany, 2020; Volume 586, pp. 22–31. [Google Scholar]
- Dong, Z.; Lin, B. Learning a robust CNN-based rotation insensitive model for ship detection in VHR remote sensing images. Int. J. Remote Sens. 2020, 41, 3614–3626. [Google Scholar] [CrossRef]
- Ruiz-Santaquiteria, J.; Bueno, G.; Deniz, O.; Vallez, N.; Cristobal, G. Semantic versus instance segmentation in microscopic algae detection. Eng. Appl. Artif. Intell. 2020, 87, 103271. [Google Scholar] [CrossRef]
- Wang, L. Advances in natural computation, fuzzy systems and nnowledge discovery. In Advances in Intelligent Systems and Computing; Liu, Y., Wang, L., Zhao, L., Yu, Z., Eds.; Springer: Cham, Switzerland, 2020; Volume 1074, ISBN 978-3-030-32455-1. [Google Scholar]
- Long, J.; Shelhamer, E.; Darrell, T. Fully convolutional networks for semantic segmentation. In Proceedings of the 2015 IEEE Conference on Computer Vision and Pattern Recognition, Boston, MA, USA, 7–12 June 2015; pp. 3431–3440. [Google Scholar]
- Jegou, S.; Drozdzal, M.; Vazquez, D.; Romero, A.; Bengio, Y. The one hundred layers tiramisu: Fully convolutional DenseNets for semantic segmentation. In Proceedings of the IEEE Computer Society Conference on Computer Vision and Pattern Recognition Workshops, Honolulu, HI, USA, 21–26 July 2017; pp. 1175–1183. [Google Scholar]
- Ronneberger, O.; Fischer, P.; Brox, T. U-net: Convolutional networks for biomedical image segmentation. In Proceedings of the Lecture Notes in Computer Science; Springer: Berlin/Heidelberg, Germany, 2015; Volume 9351, pp. 234–241. [Google Scholar]
- Zhao, H.; Shi, J.; Qi, X.; Wang, X.; Jia, J. PSPNet. In Proceedings of the 30th IEEE Conference on Computer Vision and Pattern Recognition, Honolulu, HI, USA, 22–25 July 2017; pp. 6230–6239. [Google Scholar]
- Badrinarayanan, V.; Kendall, A.; Cipolla, R. SegNet: A deep convolutional encoder-Decoder architecture for image segmentation. IEEE Trans. Pattern Anal. Mach. Intell. 2017, 39, 2481–2495. [Google Scholar] [CrossRef]
- Lin, G.; Milan, A.; Shen, C.; Reid, I. RefineNet: Multi-path refinement networks for high-resolution semantic segmentation. In Proceedings of the 30th IEEE Conference on Computer Vision and Pattern Recognition, Honolulu, HI, USA, 22–25 July 2017; Volume 2017, pp. 5168–5177. [Google Scholar]
- Li, H.; Xiong, P.; An, J.; Wang, L. Pyramid attention network for semantic segmentation. In Proceedings of the 2018 British Machine Vision Conference, Newcastle, UK, 3–6 September 2018. [Google Scholar]
- Chen, L.-C.; Papandreou, G.; Kokkinos, I.; Murphy, K.; Yuille, A.L. Semantic Image Segmentation with Deep Convolutional Nets and Fully Connected CRFs. arXiv 2014, arXiv:1412.7062, 1–12. [Google Scholar]
- Yu, C.; Wang, J.; Peng, C.; Gao, C.; Yu, G.; Sang, N. Learning a Discriminative Feature Network for Semantic Segmentation. In Proceedings of the IEEE Computer Society Conference on Computer Vision and Pattern Recognition, Salt Lake City, UT, USA, 18–22 June 2018; pp. 1857–1866. [Google Scholar]
- Topouzelis, K.N. Oil spill detection by SAR images: Dark formation detection, feature extraction and classification algorithms. Sensors 2008, 8, 6642–6659. [Google Scholar] [CrossRef] [Green Version]
- Hinton, G.E.; Zemel, R.S. Autoencoders, minimum description length and helmholtz free energy. Adv. Neural Inf. Process. Syst. 1994, 6, 3–10. [Google Scholar]
- Dong, G.; Liao, G.; Liu, H.; Kuang, G. A review of the autoencoder and its variants: A comparative perspective from target recognition in synthetic-aperture radar images. IEEE Geosci. Remote Sens. Mag. 2018, 6, 44–68. [Google Scholar] [CrossRef]
- Parikh, H.; Patel, S.; Patel, V. Classification of SAR and PolSAR Images Using Deep Learning: A Review; Taylor and Francis: Abingdon, UK, 2020; Volume 11, ISBN 0000000242806. [Google Scholar]
- Maxwell, A.E.; Warner, T.A.; Fang, F. Implementation of machine-learning classification in remote sensing: An applied review. Int. J. Remote Sens. 2018, 39, 2784–2817. [Google Scholar] [CrossRef] [Green Version]
- Kubat, M.; Holte, R.C.; Matwin, S. Machine learning for the detection of oil spills in satellite radar images. Mach. Learn. 1998, 30, 195–215. [Google Scholar] [CrossRef] [Green Version]
- SpaceNet. Available online: https://spacenetchallenge.github.io/ (accessed on 24 August 2020).
- EMSA Earth Observation Services CleanSeaNet service.EMSA European Maritime Safety Agency. Available online: http://emsa.europa.eu/csn-menu/csn-service.html (accessed on 2 September 2020).


| Feature Category | Feature | Description | References |
|---|---|---|---|
| Geometric/ Shape | Area (A) | Area of an image object (in number of pixels) | [47,106,110,111,113,114,115,129,136,138,141,142,145,163,177,180,185,186,187,188] |
| Perimeter (P) | perimeter of an image object (in number of pixels) | ||
| Complexity measure (C) | measure of the intricacy of an object geometrical shape or | ||
| Spreading (S) | S measures the ratio between an object’s width and length | ||
| Shape factor | Measure of an image object border smoothness | [109,110,111,118,129,134,177,180,186,188] | |
| Hu moment invariant [189] | Invariant moments used to characterize object patterns | [110,113,114,132,139,180,190] | |
| Circularity | Measure of an image object compactness | [104,139,180,190,191] | |
| Perimeter to area ratio | Ratio of the perimeter to the area () | [106,110,118,177,180,188] | |
| Statistical | Object standard deviation | Standard deviation of backscatter values an image object computed from SAR imagery | [106,109,110,111,113,114,115,134,136,138,163,177,180,185,188] |
| Object mean value | Mean backscatter values of an image object | ||
| Background mean value | Mean backscatter values of a small region around the object | ||
| Background standard deviation | Standard deviation of backscatter values of a small region around the object | ||
| Max contrast | Difference between background mean value and the lowest backscatter value inside the object | ||
| Object power to mean ratio | Ratio between the standard deviation and the mean of an image object | [114,138,177,180,185,188] | |
| Mean contrast ratio | Difference between background mean value and the mean backscatter value of the object | ||
| Gradient standard deviation | Standard deviation of the border gradient | ||
| Mean border gradient | Mean value of the border gradient | ||
| Max gradient | Maximum value of the border gradient | ||
| Texture | Contrast GLCM | GLCM contrast value computed from backscatter values of image objects | [111,113,114,129,135,136,138,155,188,192,193,194] |
| Homogeneity GLCM | GLCM homogeneity value computed for an image object | ||
| Entropy GLCM | GLCM entropy value computed for an image object | ||
| Correlation GLCM | GLCM correlation value computed for an image object | [110,113,129,155,192,195,196,197] | |
| Dissimilarity GLCM | GLCM dissimilarity value computed for an image object | ||
| Variance GLCM | GLCM variance value computed for an image object | ||
| Energy GLCM | GLCM energy value computed for an image object | ||
| Mean GLCM | GLCM mean value computed for an image object | ||
| SAR polarimetric features | Entropy | Polarimetric parameter used to measure the degree of randomness of the scattering mechanism | [103,128,198,199,200] |
| Alpha angle | Polarimetric parameter used to characterize the scattering mechanism of the reflection | ||
| Degree of polarization | Physical quantity that is used to characterize the polarized light’s polarization degree | ||
| Conformity coefficient | Evaluates if surface scattering is the dominant among all the scattering mechanisms [198], and it can discriminate surface, double-bounce, and volume scattering [201] | ||
| Correlation coefficient | Measure that reflects the averaged phase difference among scattering coefficients in co-polarized phases (i.e., HH, VV) [202] | [103,119,198,200,203] | |
| Anisotropy | Measures of the relative values of the second and third eigenvalues [204] | ||
| Pedestal height | Measure of the amount of the unpolarized backscattered energy [205] | ||
| Standard deviation of CPD (Co-Polarized phase Difference) | Standard deviation of CPD was introduced by [206] to differentiate oil and biogenic slicks | ||
| Contextual | Number of neighboring targets in the same image | Number of adjacent targets to oil slicks in the same scene | [115,185] |
| Distance to ship/rig | Distance from oil slick objects to ship, rig, and oil platforms in the surroundings | [110,142] | |
| Mean wind speed | Values of mean wind speed of image object | [132,139] |
| Classification | Sensor Type | Satellites | References |
|---|---|---|---|
| ANN | Optical | Landsat, DubaiSat-2, KOMPSAT-2, Landsat ETM+, GF-1 | [52,53,63,68] |
| SAR | ERS-1, ERS-2 and ENVSAT ASAR, RADARSAT-1, 2, ALOS PALSAR, TerraSAR-X, COSMO-SkyMed | [104,106,108,115,128,135,141,146,163,185,186,187,190,191,198,199,207,237,238,239,240] | |
| SVM | Optical | MODIS (Band 1 and 2), AVIRIS, HJ-1 and Landsat ETM+, GF-1 | [32,46,53,192] |
| SAR | TerraSAR-X, ENVISAT ASAR, UAVSAR, RADARSAT-1, 2, RISAT-1, Shipborne radar | [21,27,114,115,121,145,154,180,185,192,198,241,242] | |
| DT/fuzzy logic/rule-based | Optical | MODIS (Band 1 and 2), IKONOS, Quickbird, RapidEye, WorldView2, Landsat TM | [36,47,69] |
| SAR | ERS-2, ENVSAT ASAR, TerraSAR-X, RADARSAT | [36,109,129,134,135,136,138,147,177] | |
| KNN | Optical | LANDSAT-8, MODIS (Terra and Aqua) | [48,64] |
| SAR | ENVISAT, ERS-1/2, TerraSAR-X, RADARSAT-1, SENTINEL-1,ERS-1,2 | [64,112] | |
| Genetic algorithm | SAR | RADARSAT-2 | [123,124,127,130] |
| Extreme learning | SAR | ENVISAT ASAR | [196] |
| Ensemble learning | Optical | MODIS (Band 1 and 2) | [46] |
| SAR | RADARSAT-1 | [115] | |
| Maximum likelihood | SAR | RADARSAT-2 | [198,234] |
| Naïve Bayes | SAR | ERS-1, ERS-2, ENVISAT and RADARSAT-2 | [110] |
| Mahalanobis distance | SAR | ERS-1, 2 | [113] |
| Random forest | SAR | Radarsat-2 and UAVSAR | [26] |
| Cart | SAR | ENVSAT ASAR | [132] |
| K-means | SAR | RADARSAT-2 | [26,119] |
| Others | Optical | MODIS (Band 1 and 2), Landsat 8, GF-1, and HJ-1 | [38,51] |
| SAR | ERS-1, 2, RADARSAT-1, ENVISAT ASAR, Sentinel-1, PALSAR and TerraSAR-X | [111,115,137,140,142,162,185,191,236,243] |
© 2020 by the authors. Licensee MDPI, Basel, Switzerland. This article is an open access article distributed under the terms and conditions of the Creative Commons Attribution (CC BY) license (http://creativecommons.org/licenses/by/4.0/).
Share and Cite
Al-Ruzouq, R.; Gibril, M.B.A.; Shanableh, A.; Kais, A.; Hamed, O.; Al-Mansoori, S.; Khalil, M.A. Sensors, Features, and Machine Learning for Oil Spill Detection and Monitoring: A Review. Remote Sens. 2020, 12, 3338. https://0-doi-org.brum.beds.ac.uk/10.3390/rs12203338
Al-Ruzouq R, Gibril MBA, Shanableh A, Kais A, Hamed O, Al-Mansoori S, Khalil MA. Sensors, Features, and Machine Learning for Oil Spill Detection and Monitoring: A Review. Remote Sensing. 2020; 12(20):3338. https://0-doi-org.brum.beds.ac.uk/10.3390/rs12203338
Chicago/Turabian StyleAl-Ruzouq, Rami, Mohamed Barakat A. Gibril, Abdallah Shanableh, Abubakir Kais, Osman Hamed, Saeed Al-Mansoori, and Mohamad Ali Khalil. 2020. "Sensors, Features, and Machine Learning for Oil Spill Detection and Monitoring: A Review" Remote Sensing 12, no. 20: 3338. https://0-doi-org.brum.beds.ac.uk/10.3390/rs12203338