Advantages of Using UAV Digital Photogrammetry in the Study of Slow-Moving Coastal Landslides


Abstract
:1. Introduction
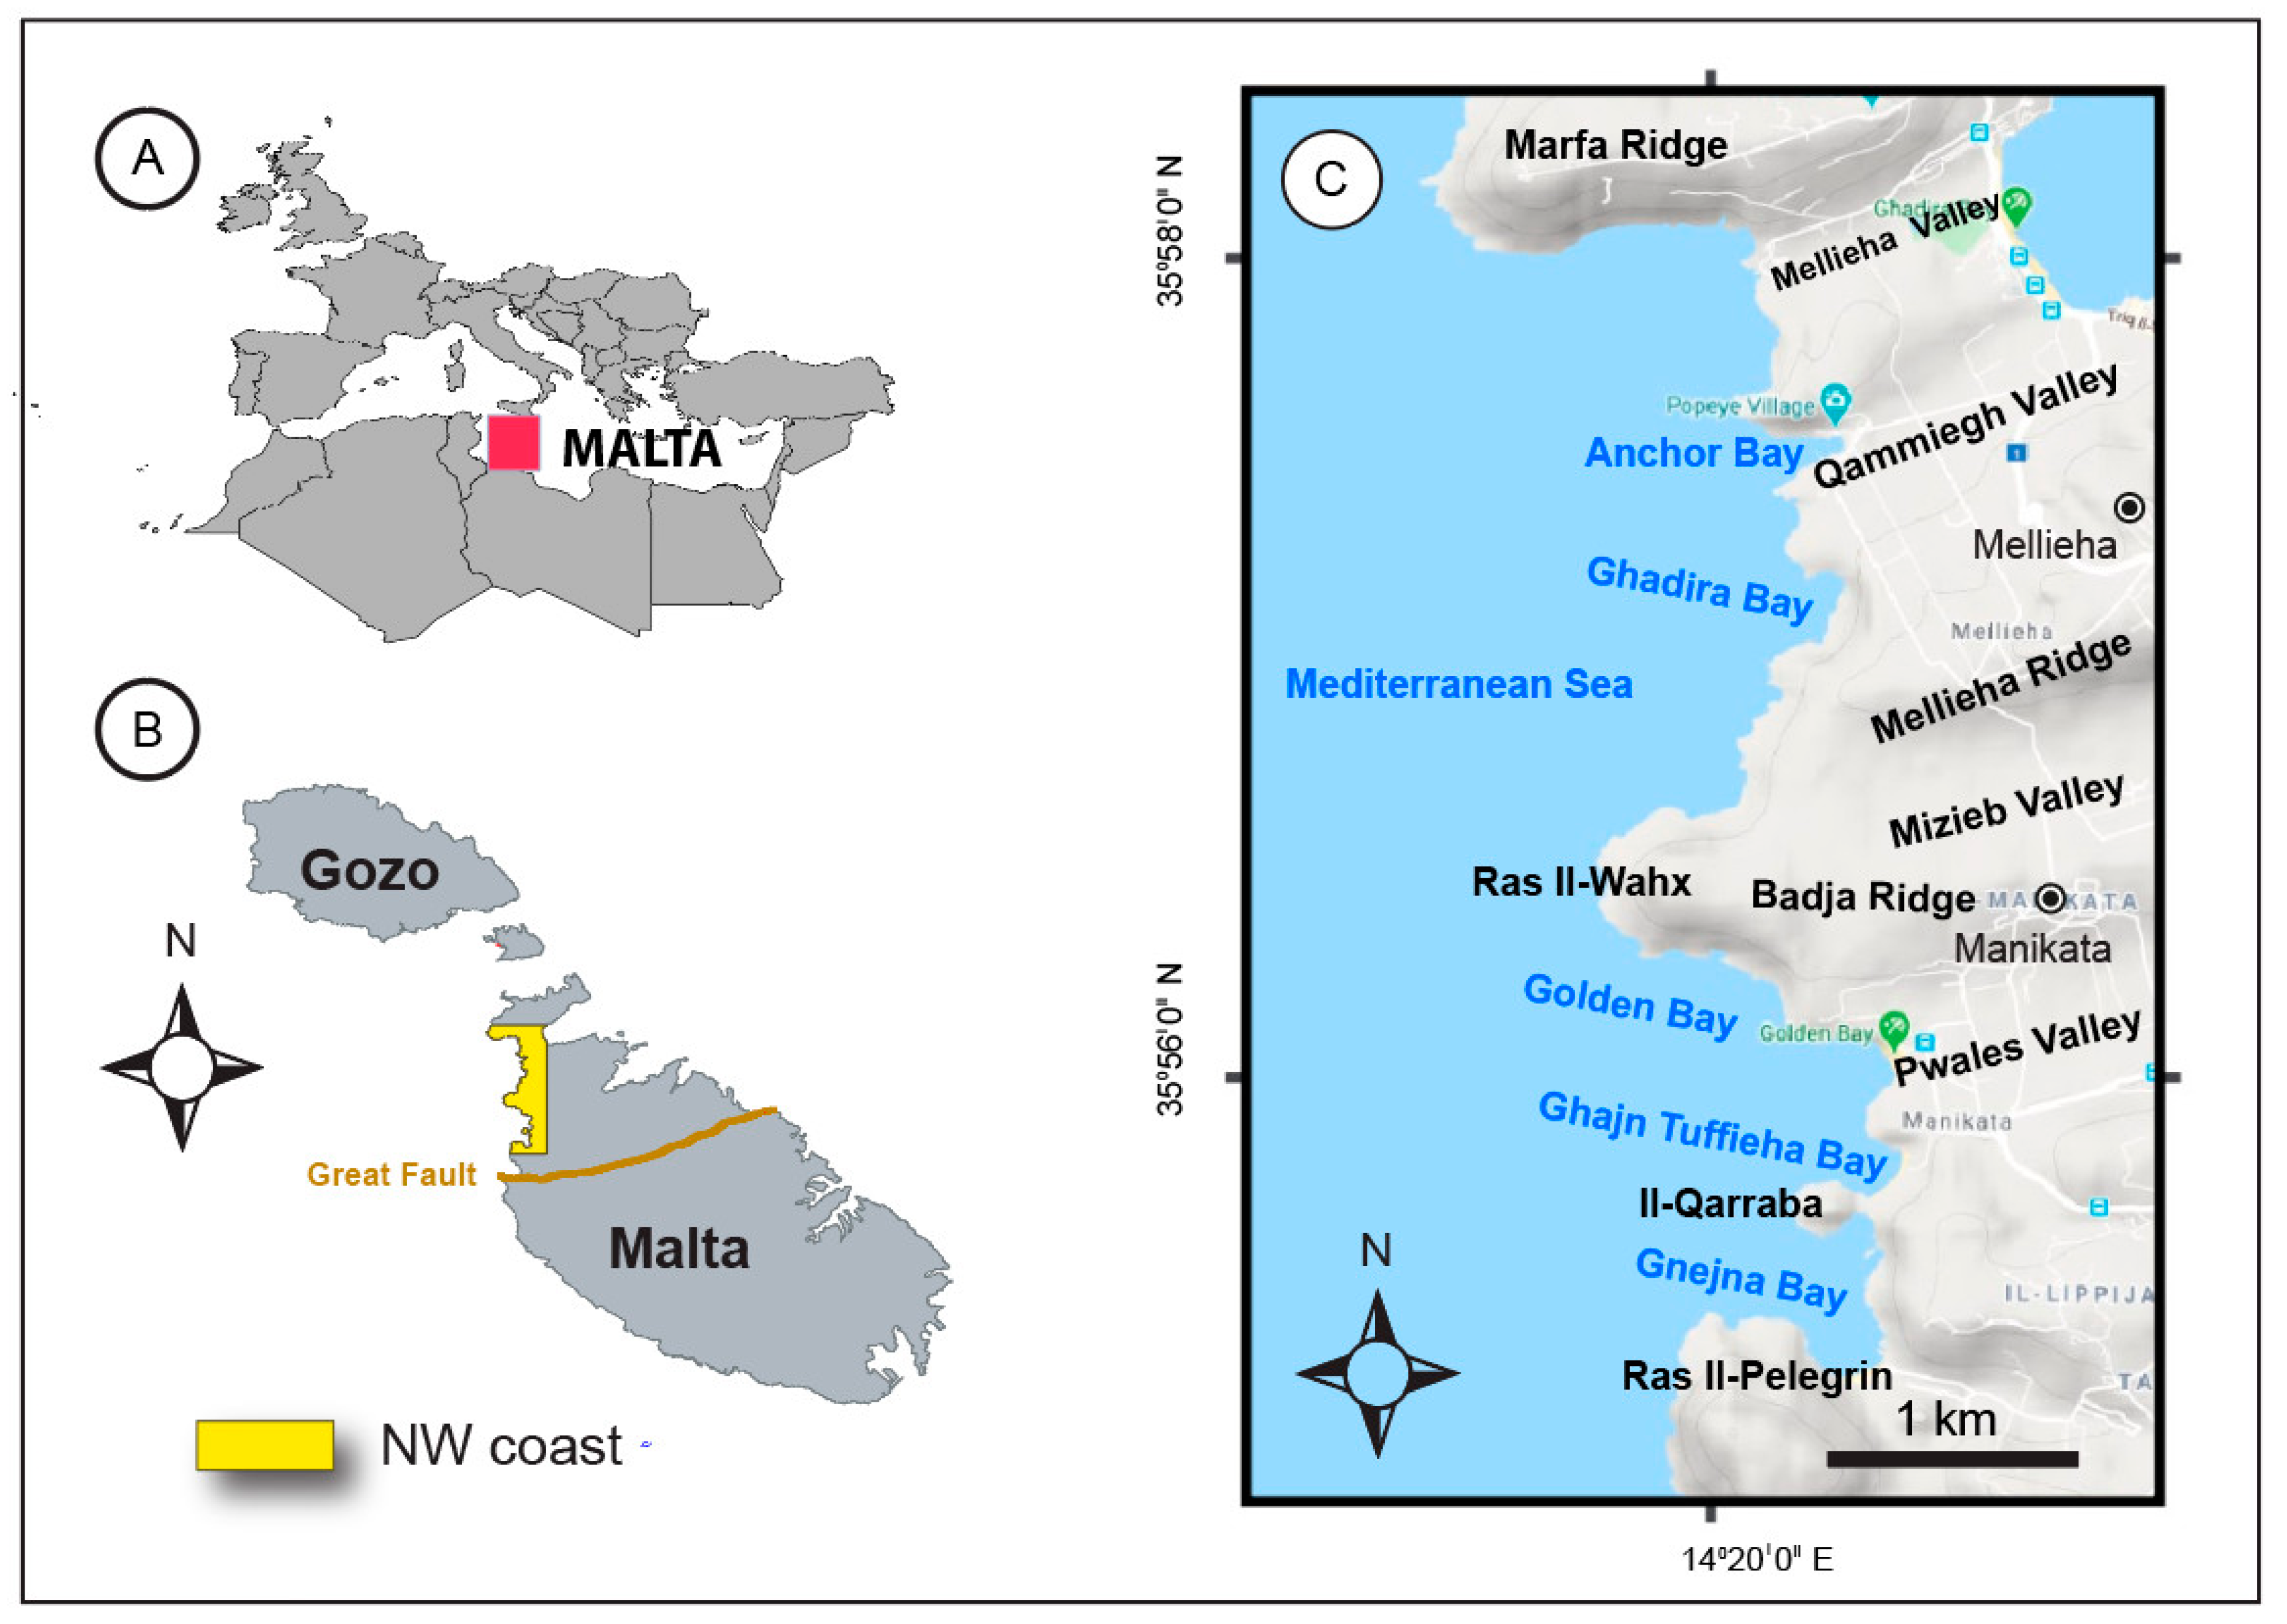
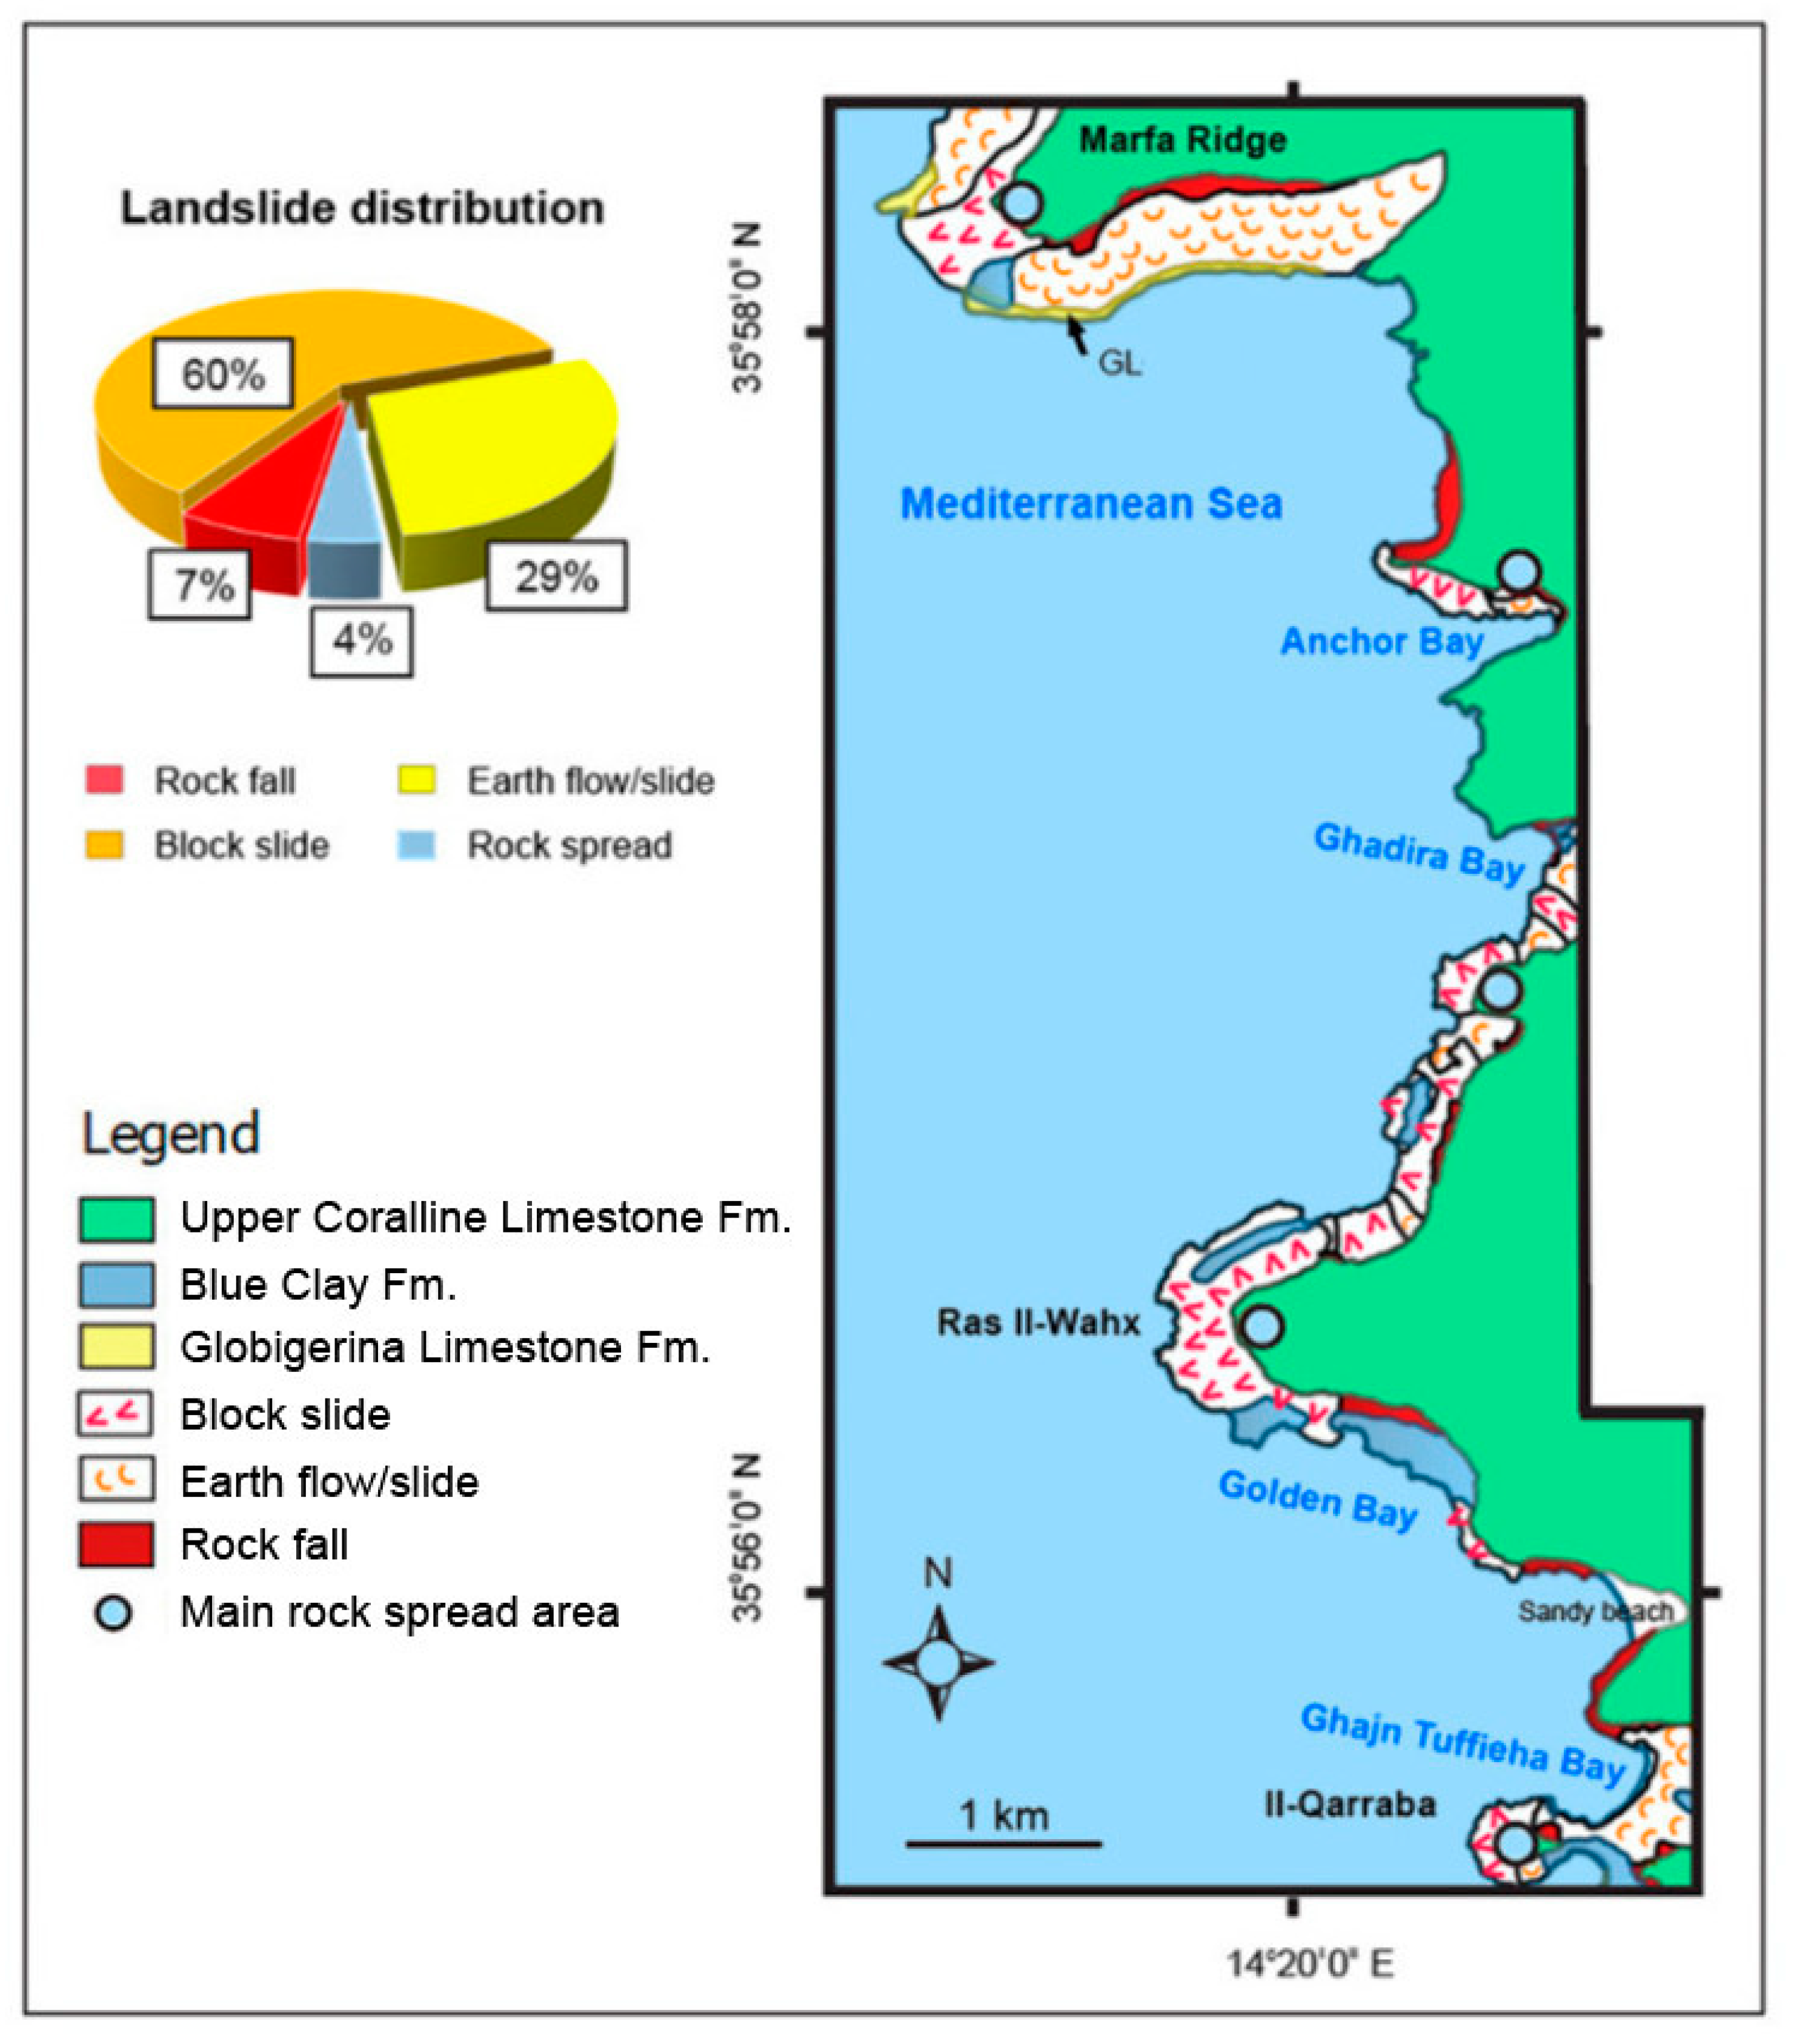
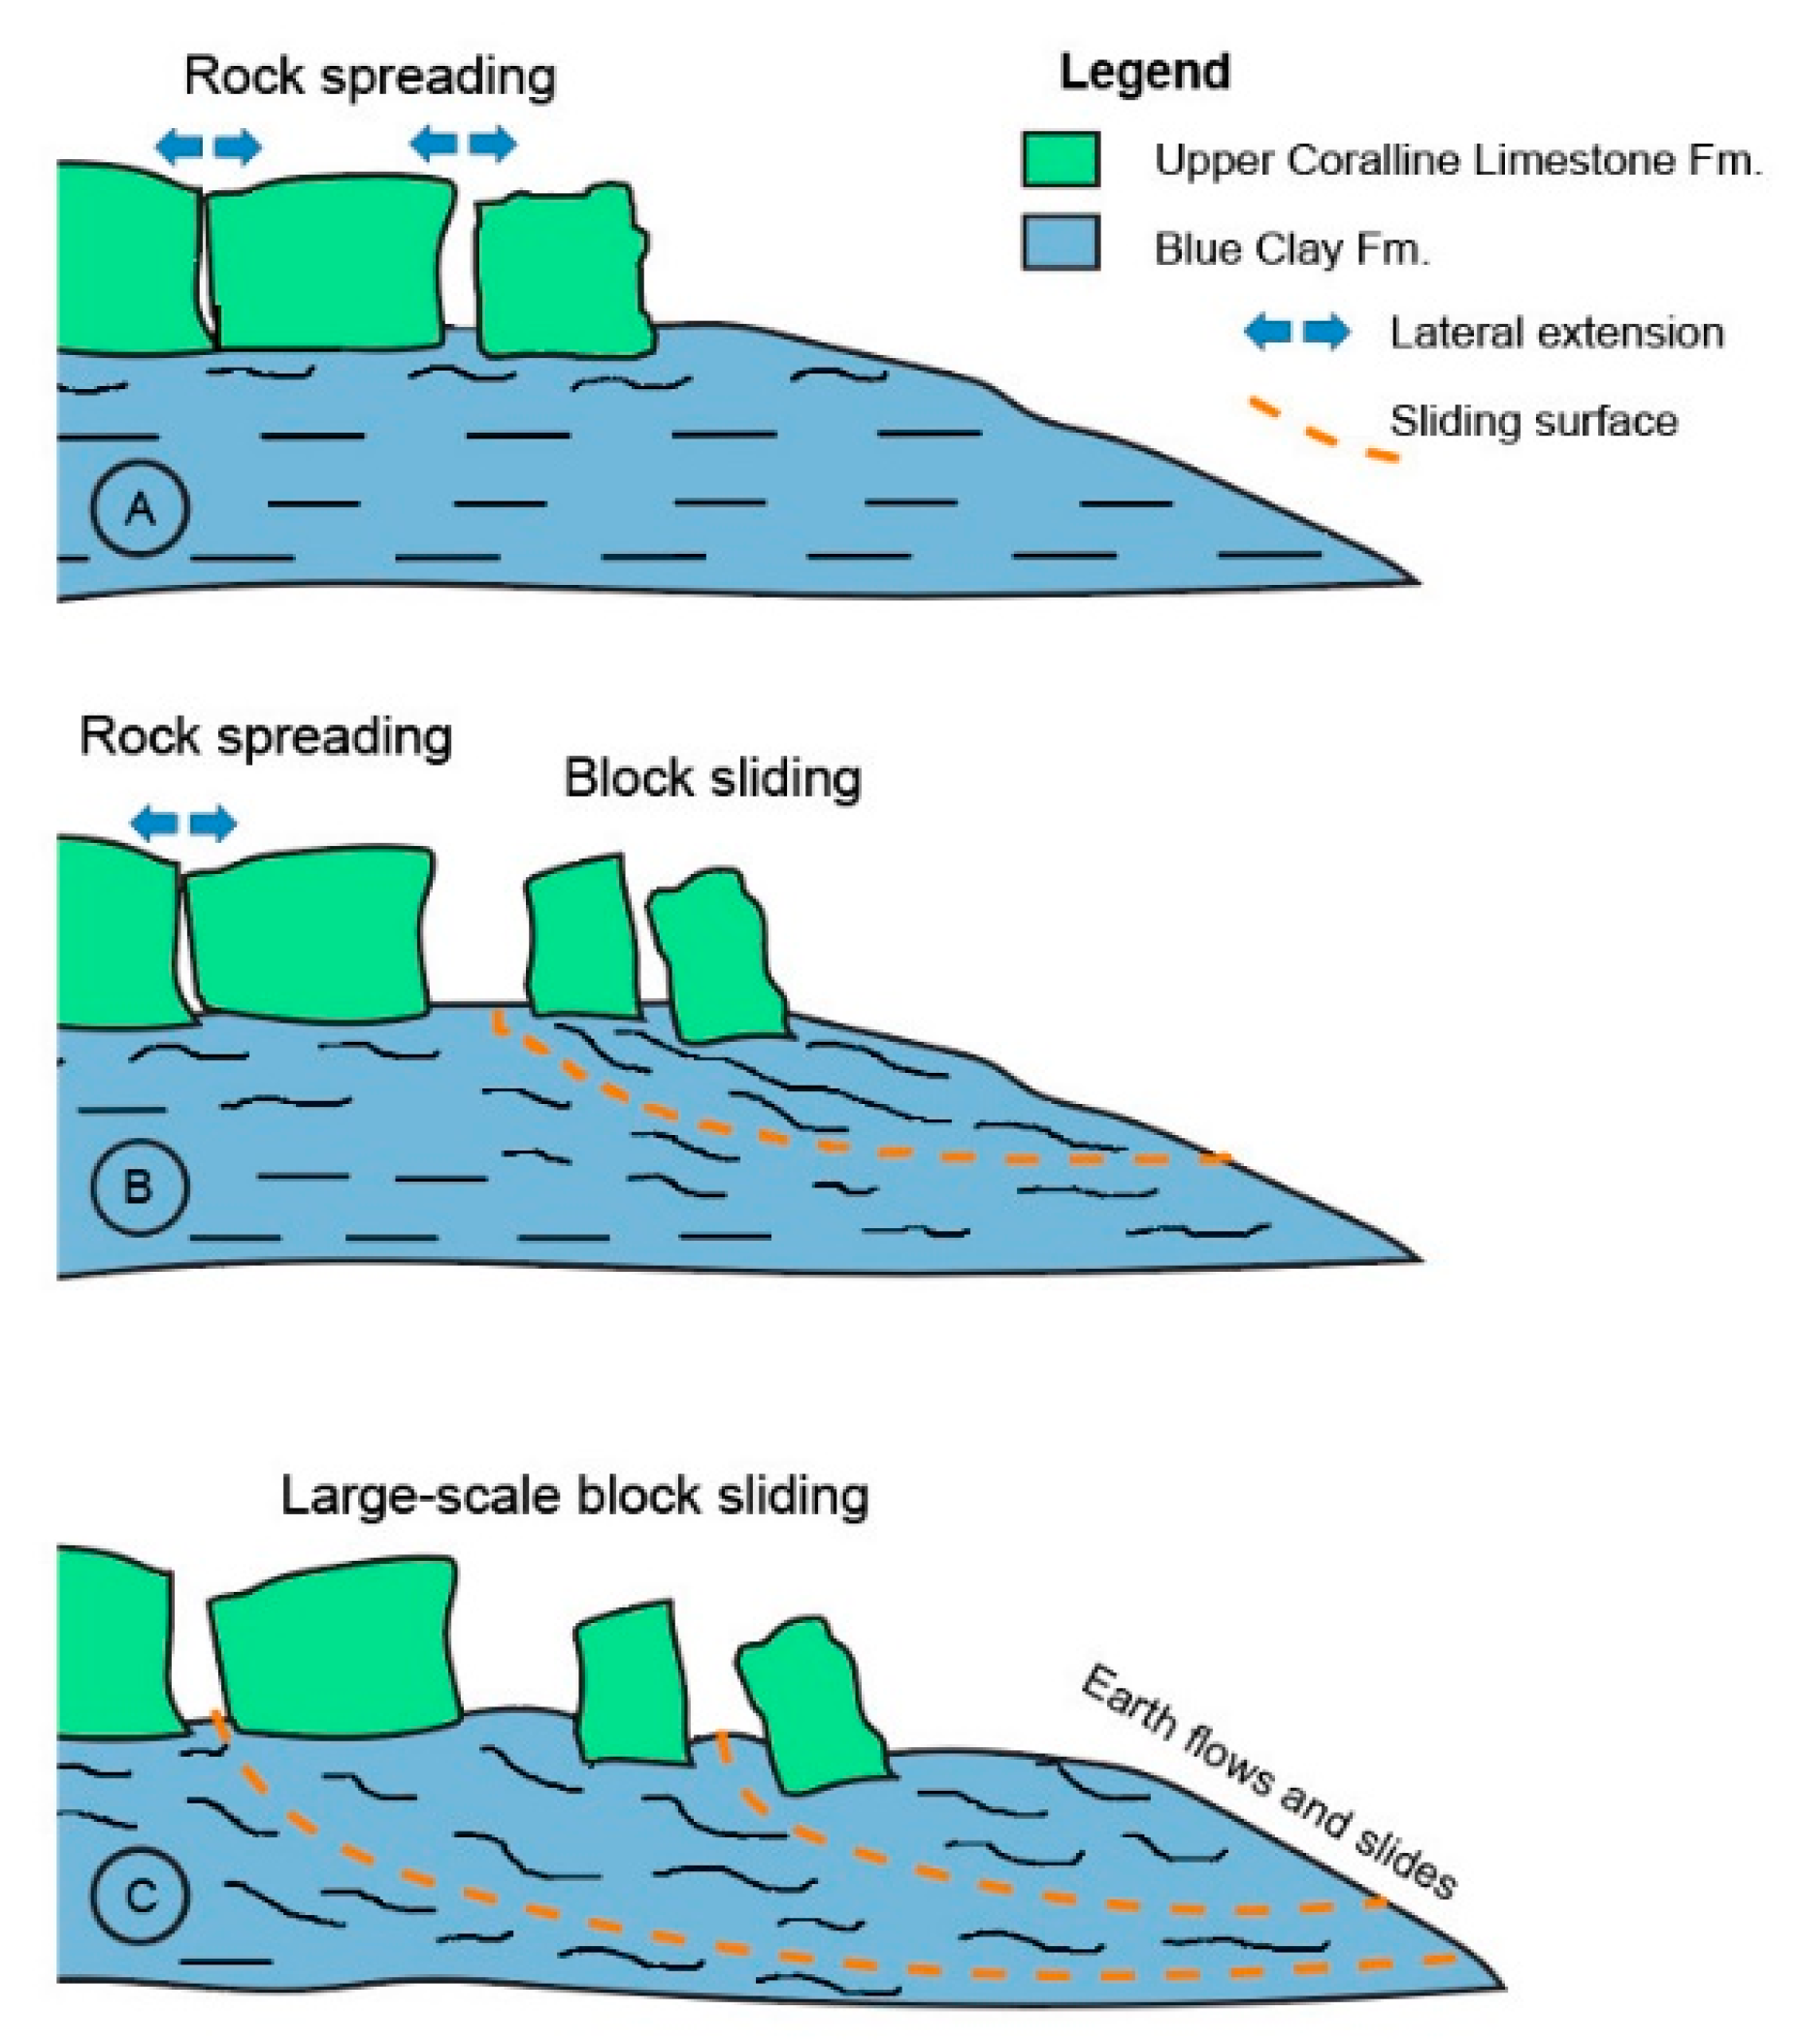
2. Slow-Moving Landslides at the NW Malta Coast
3. Study Sites
- (1)
- areas characterized by remarkable examples of rock spreads and block slides;
- (2)
- the presence of gravity-induced joints and/or well-developed network of discontinuities;
- (3)
- the occurrence of wide population of blocks in the coastal megaclast deposits;
- (4)
- the availability of published landslide-related datasets;
- (5)
- guaranteed safety conditions during UAV take-off and landing phases;
- (6)
- adequate visibility for the pilot during drone flights.
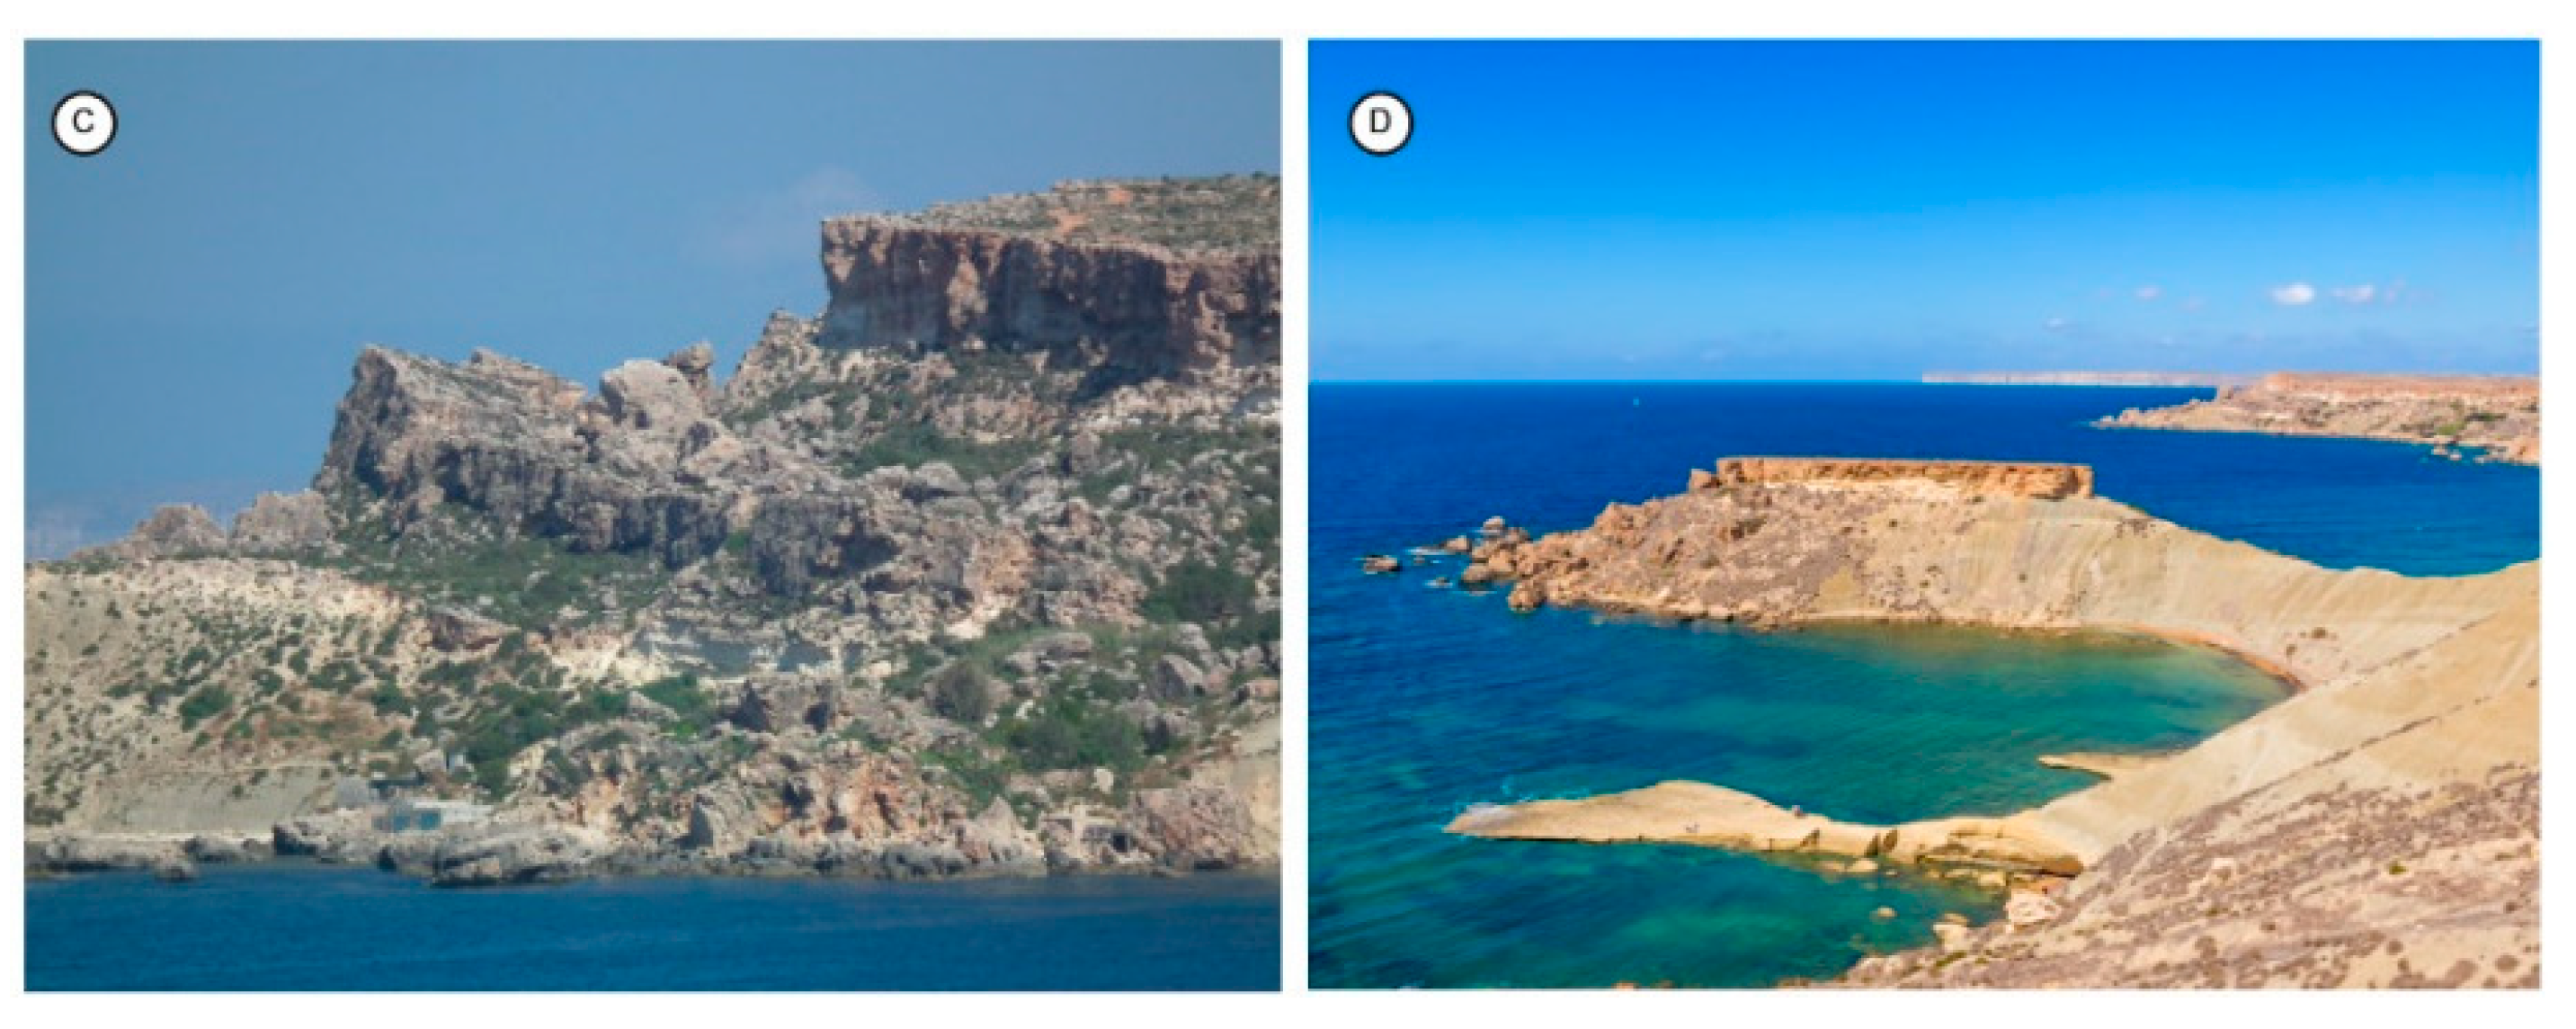
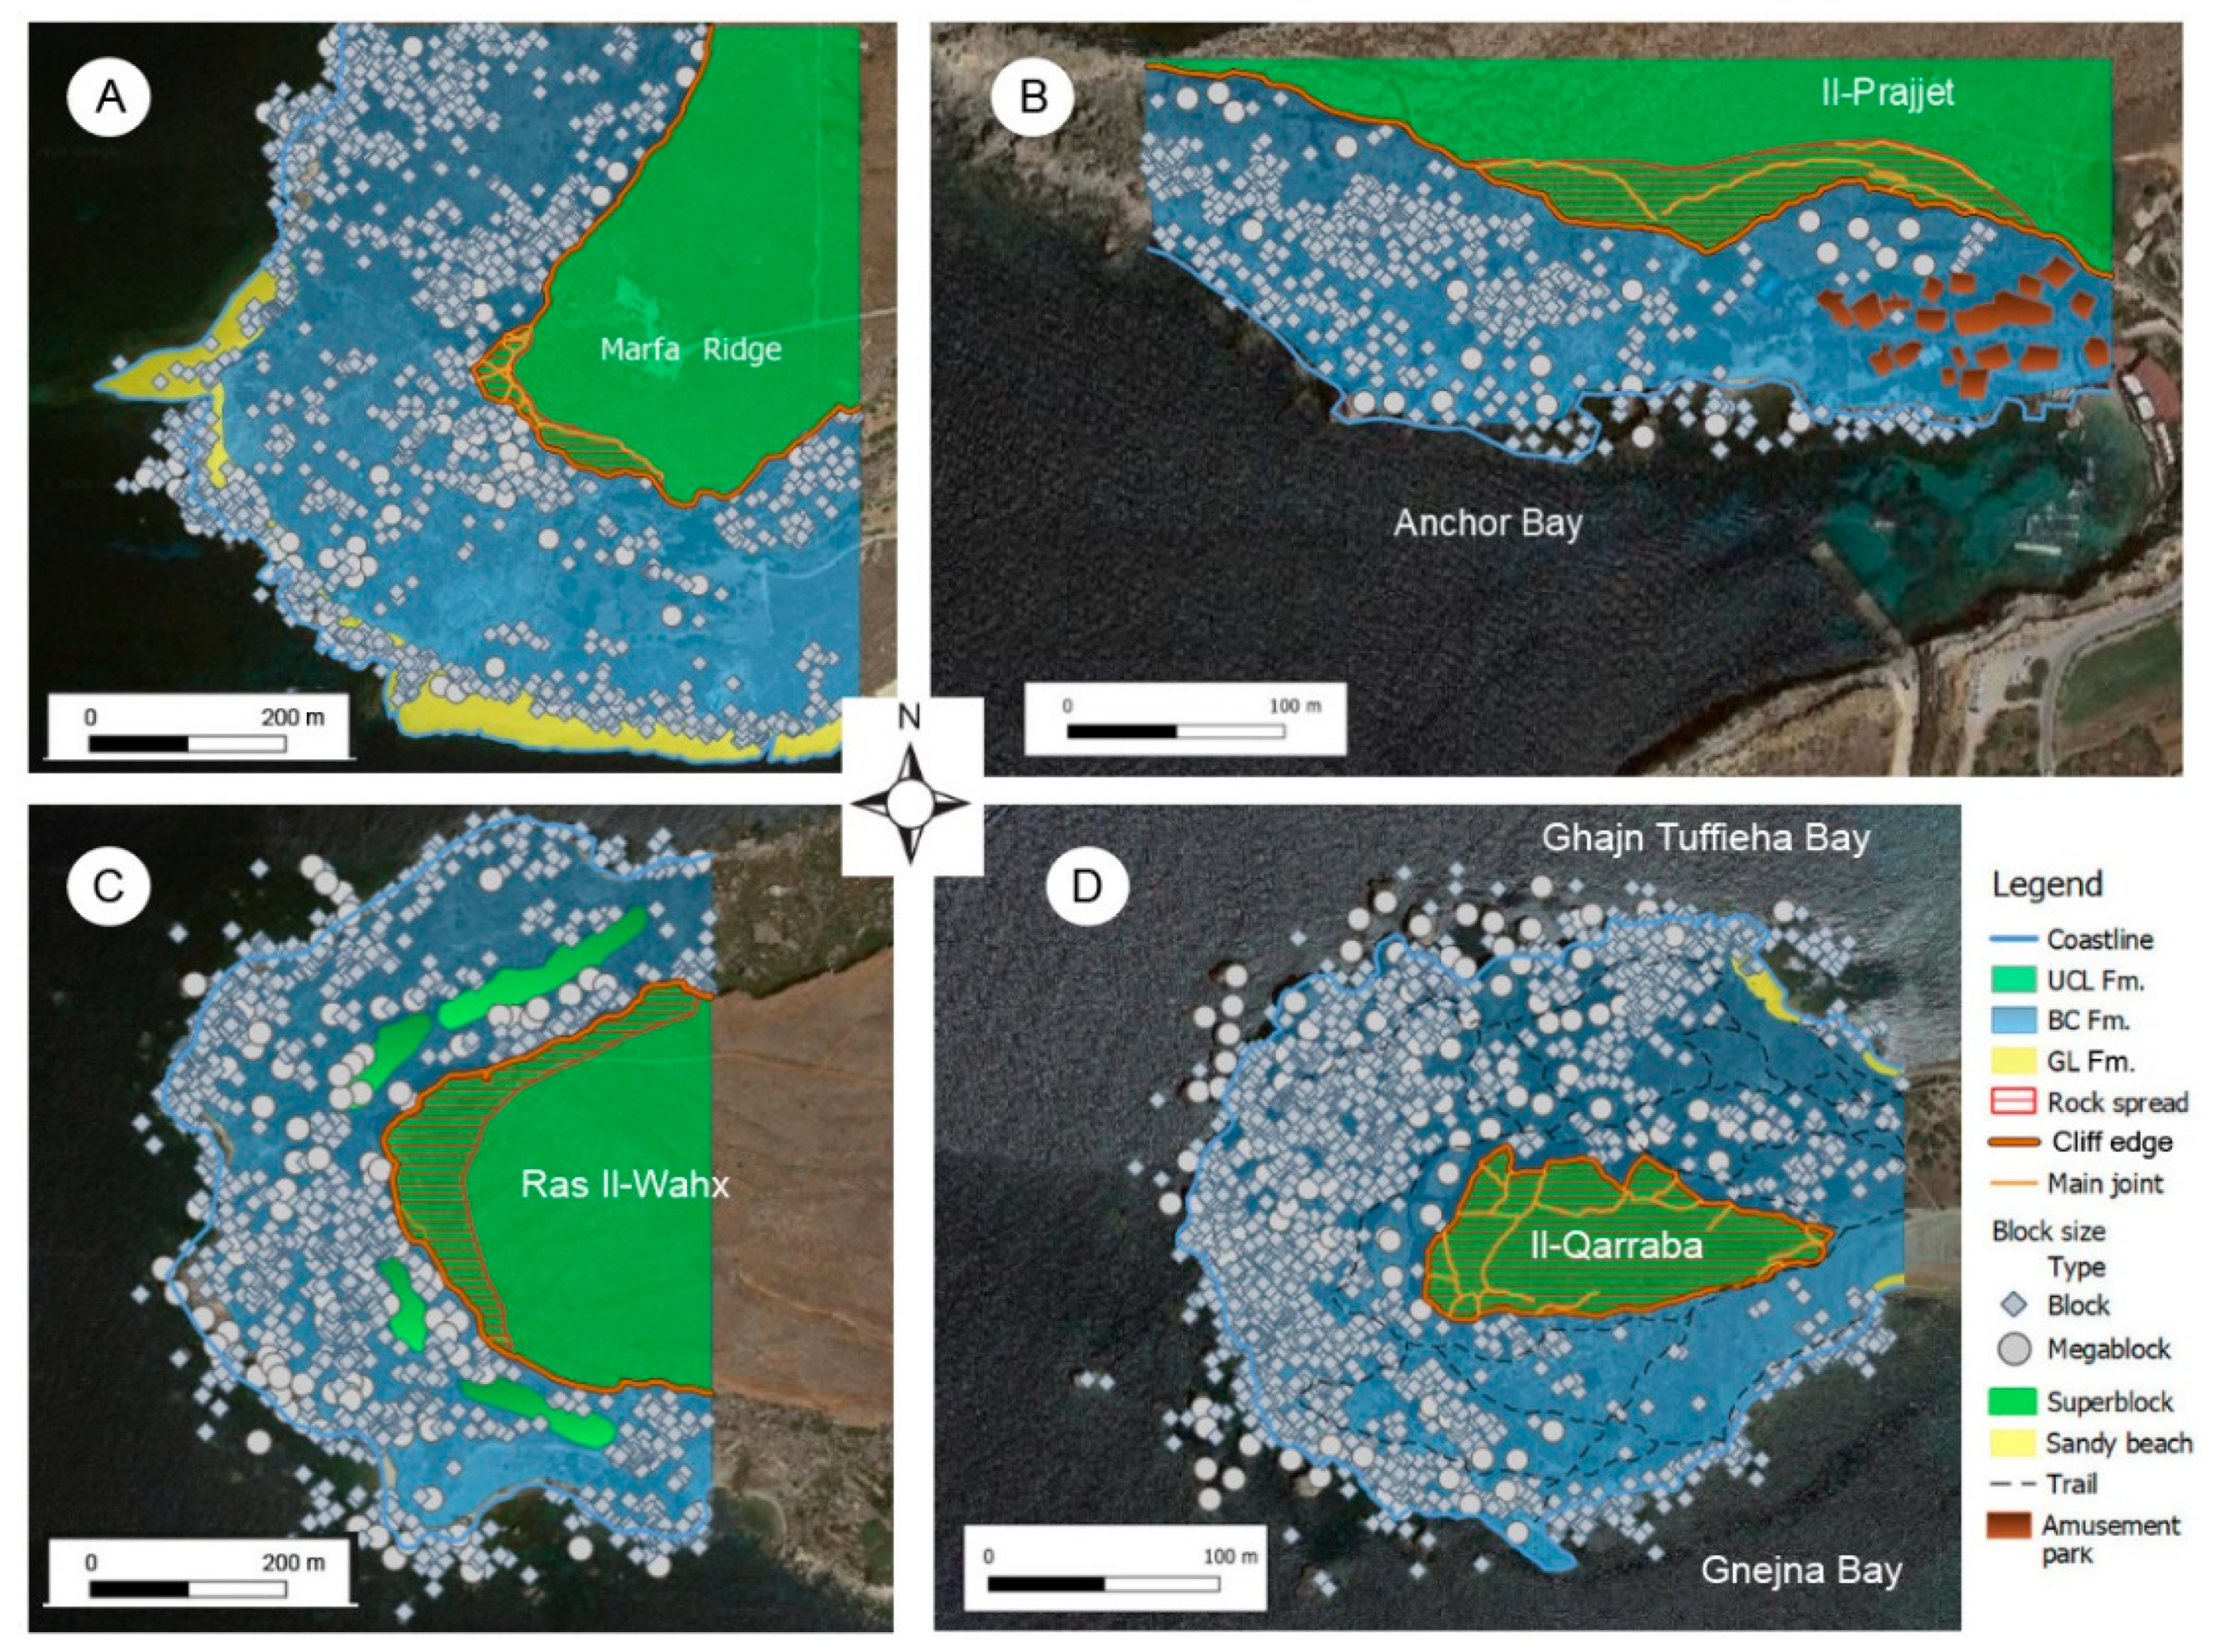
3.1. Marfa Ridge
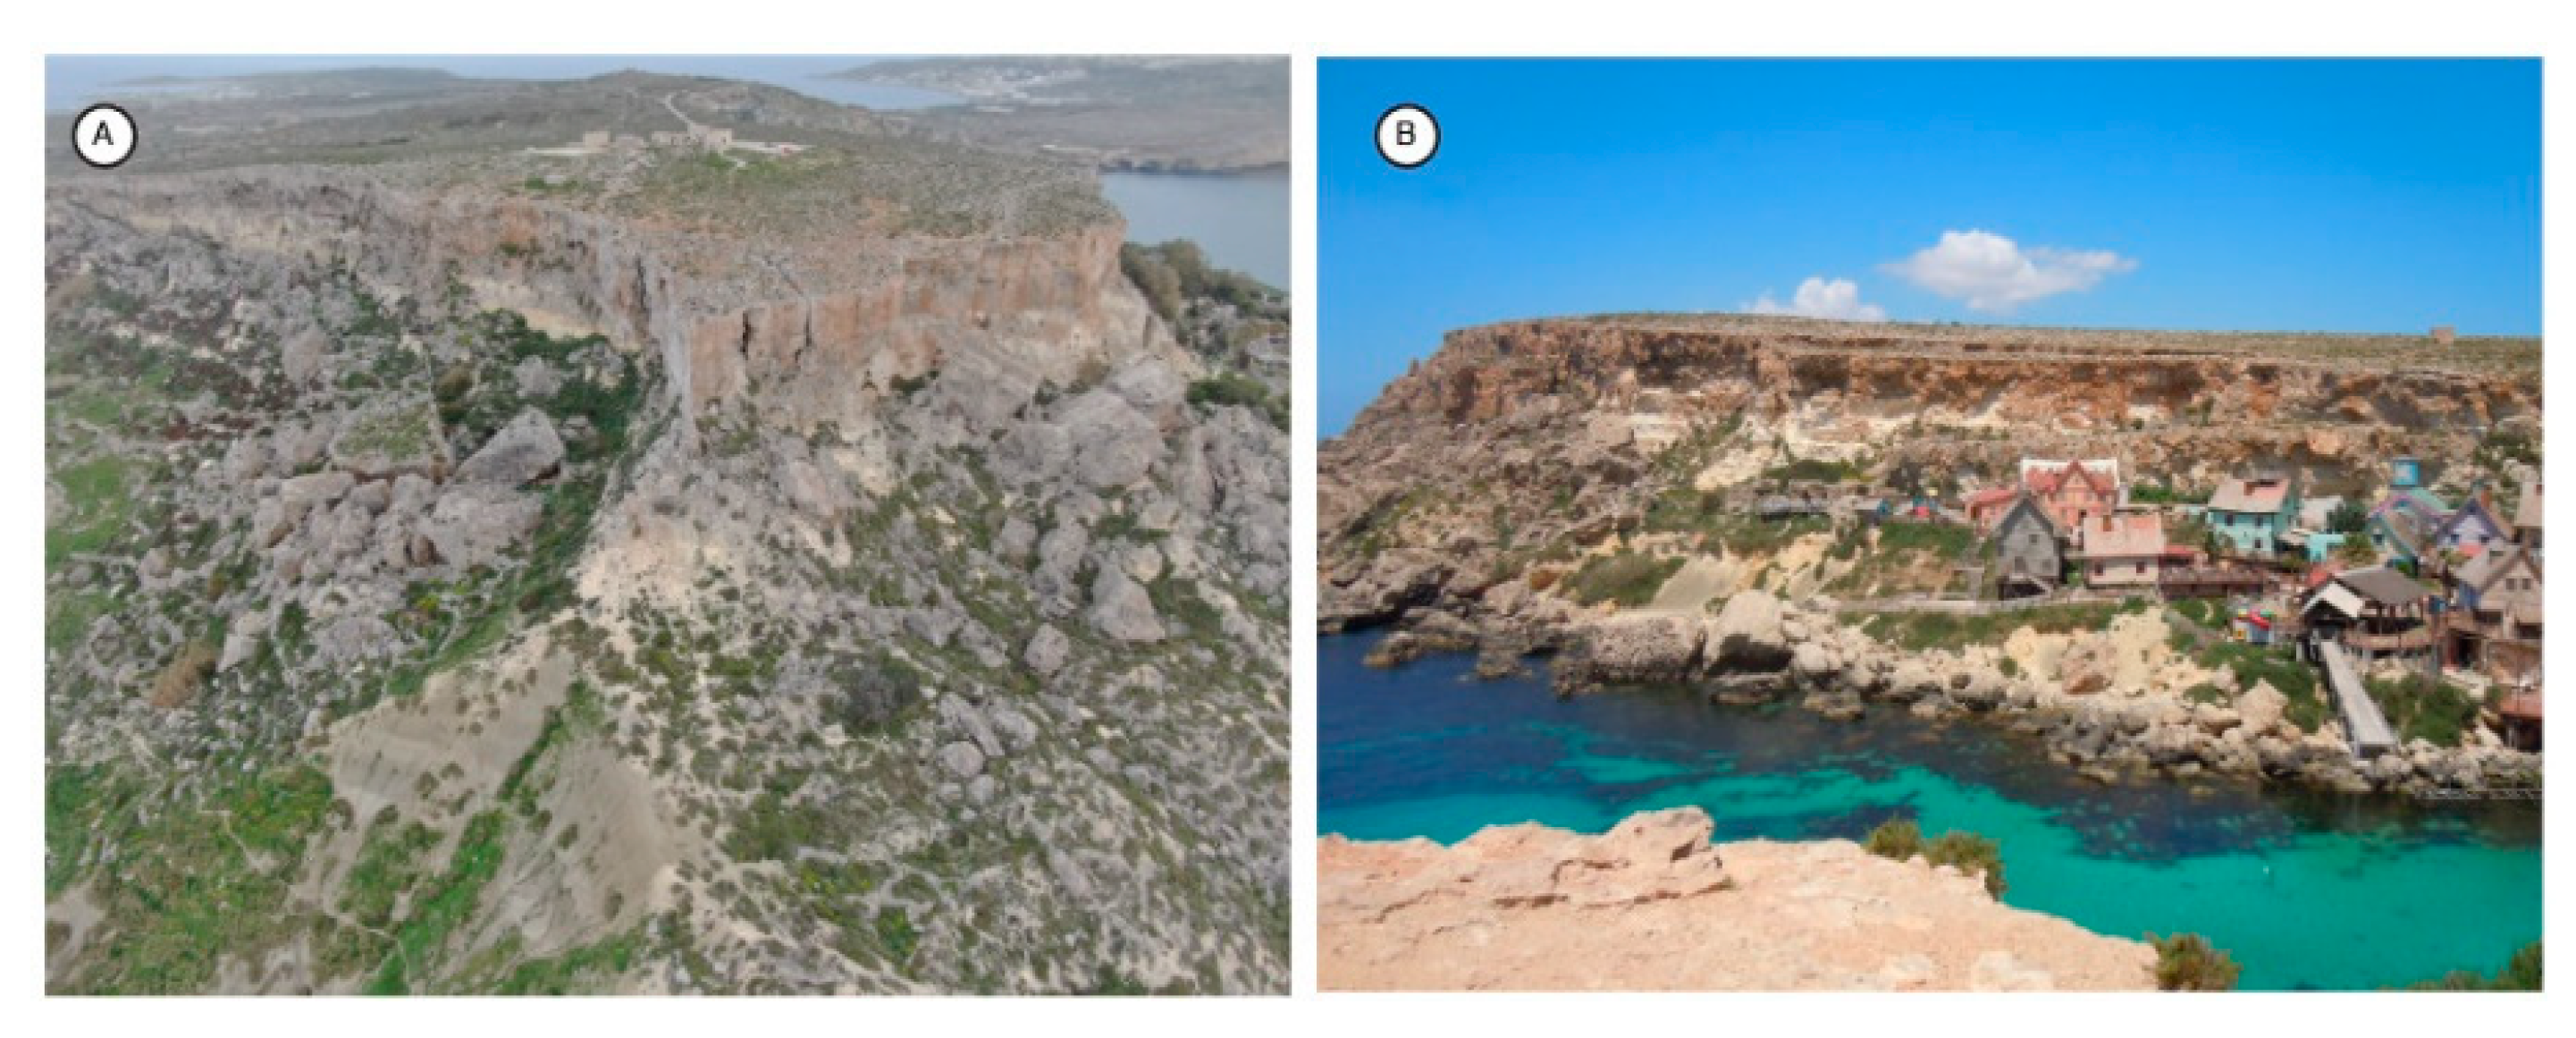
3.2. Anchor Bay
3.3. Ras Il-Wahx
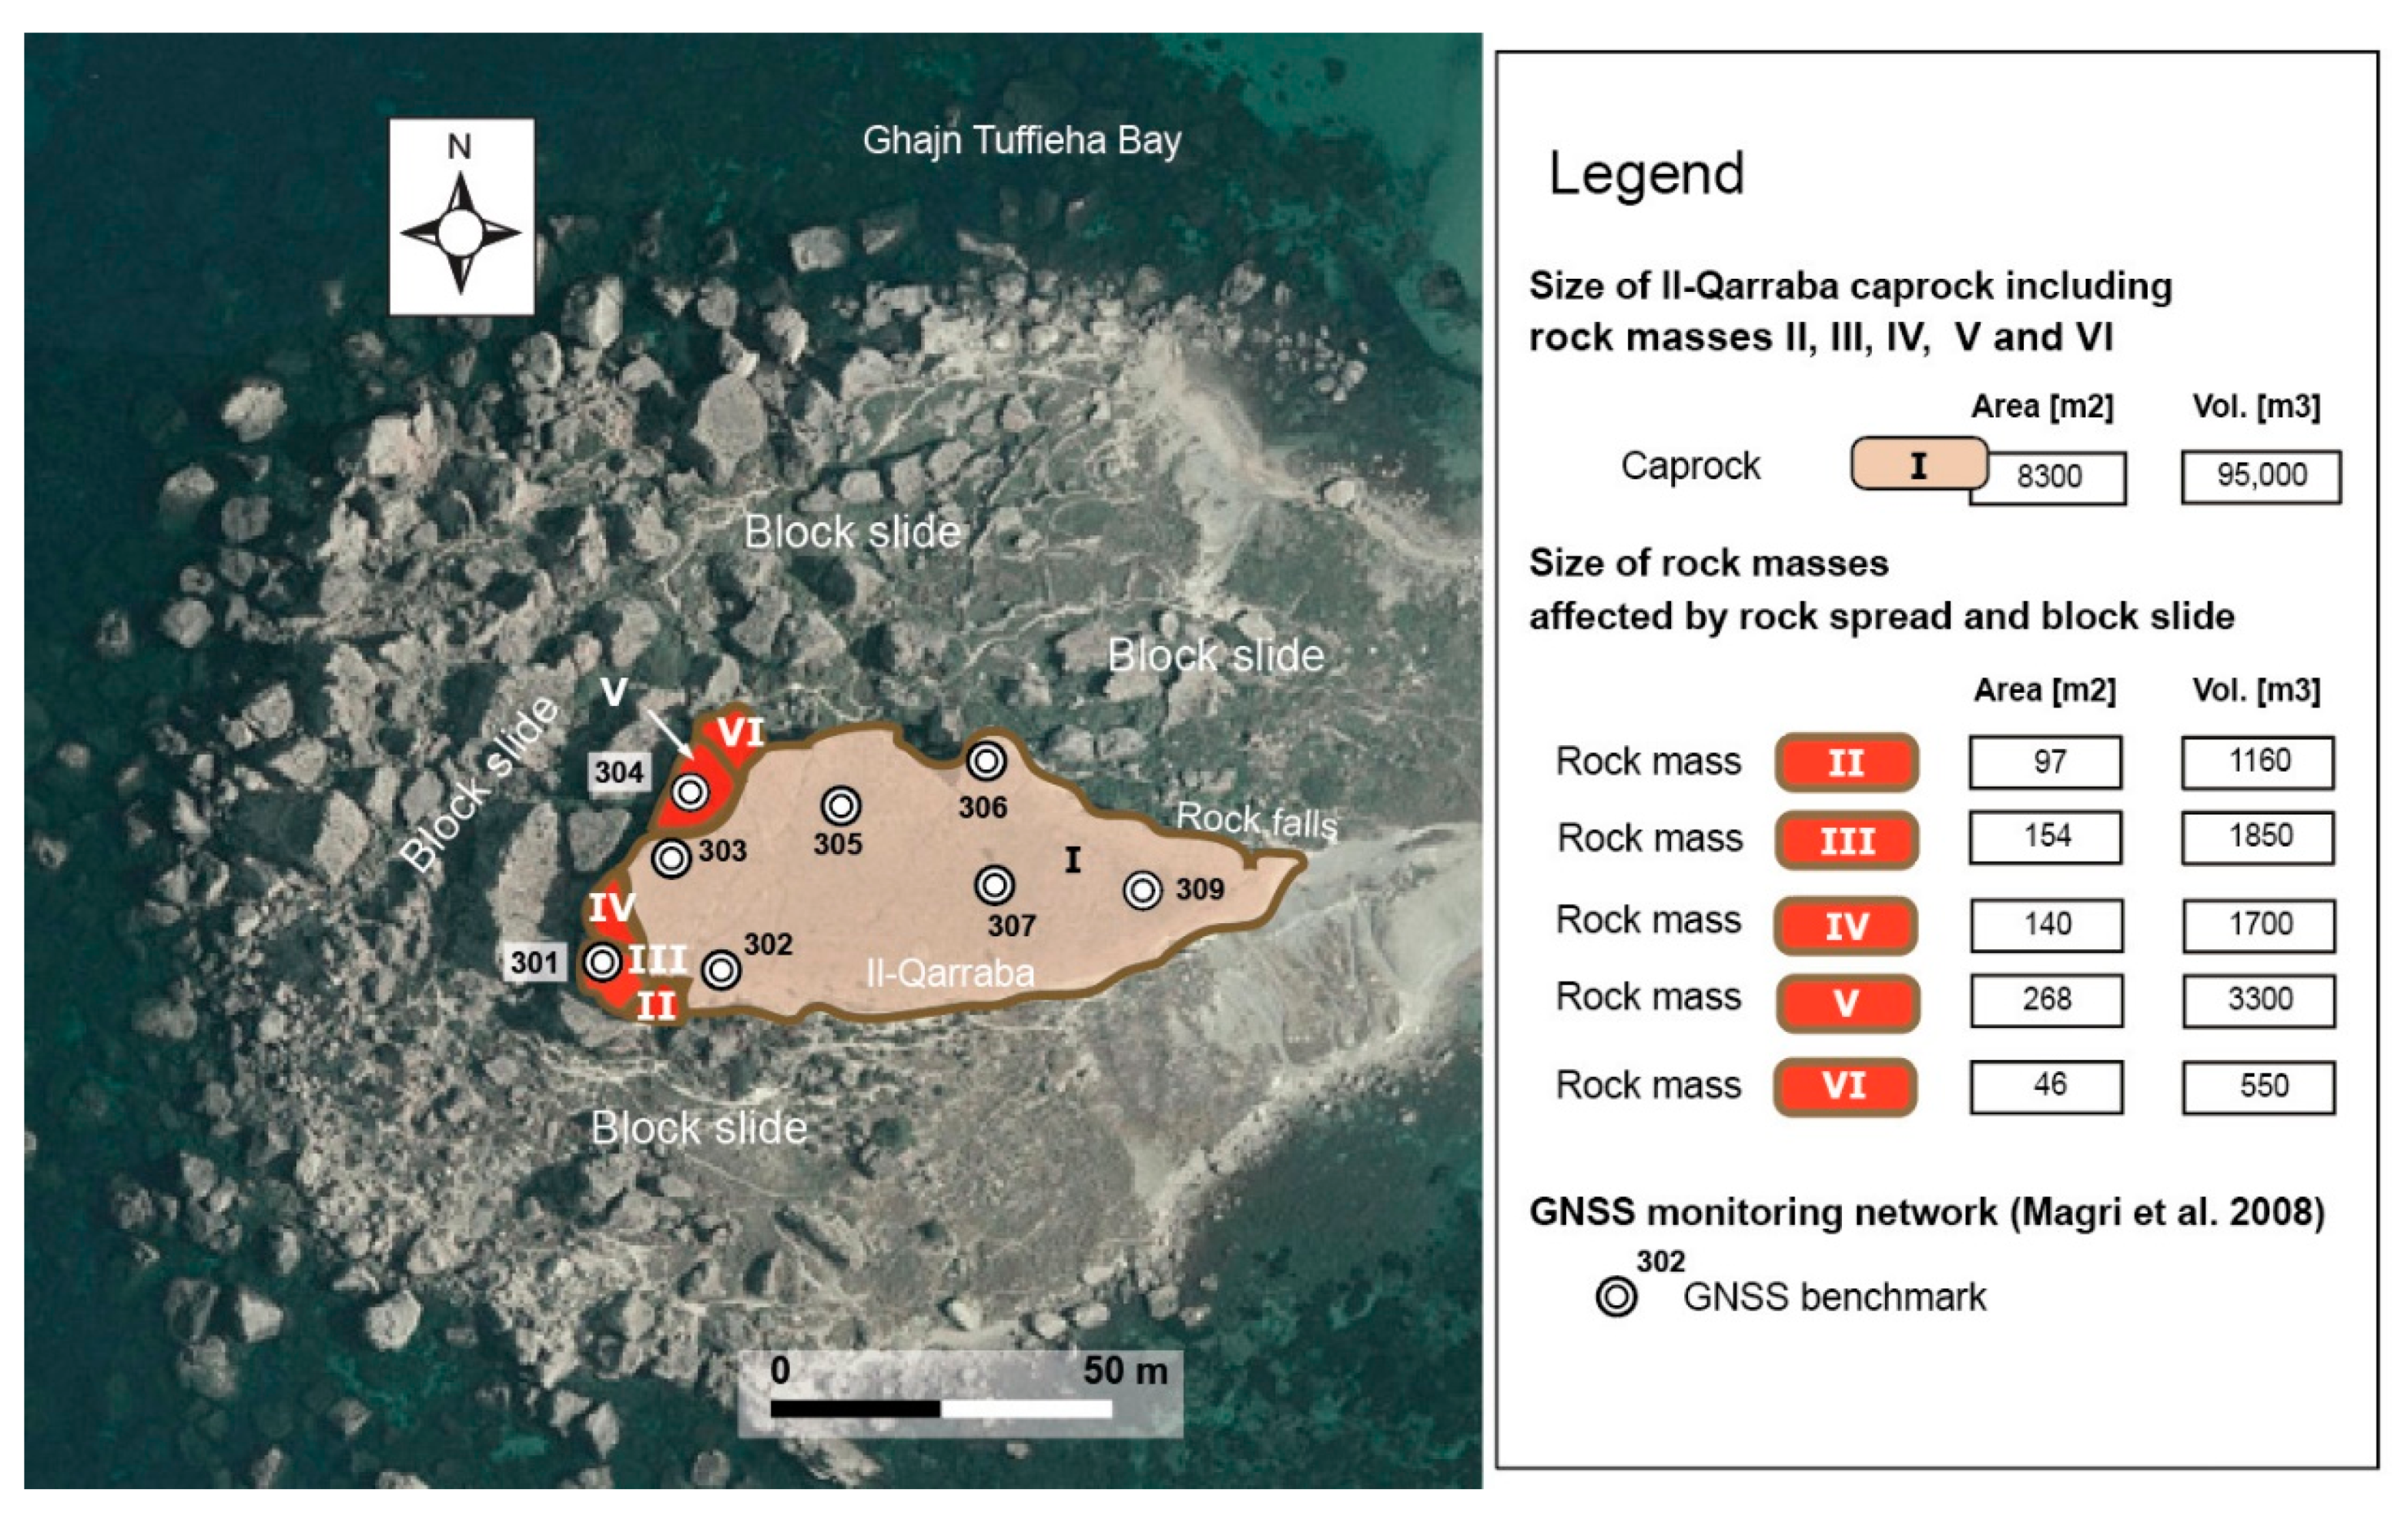
3.4. Il-Qarraba Peninsula
4. Materials and Methods
4.1. UAV Flight Planning and Image Aquisition
4.2. 3D Model Production
4.2.1. Generation of Point Clouds
4.2.2. Generation of 3D Models
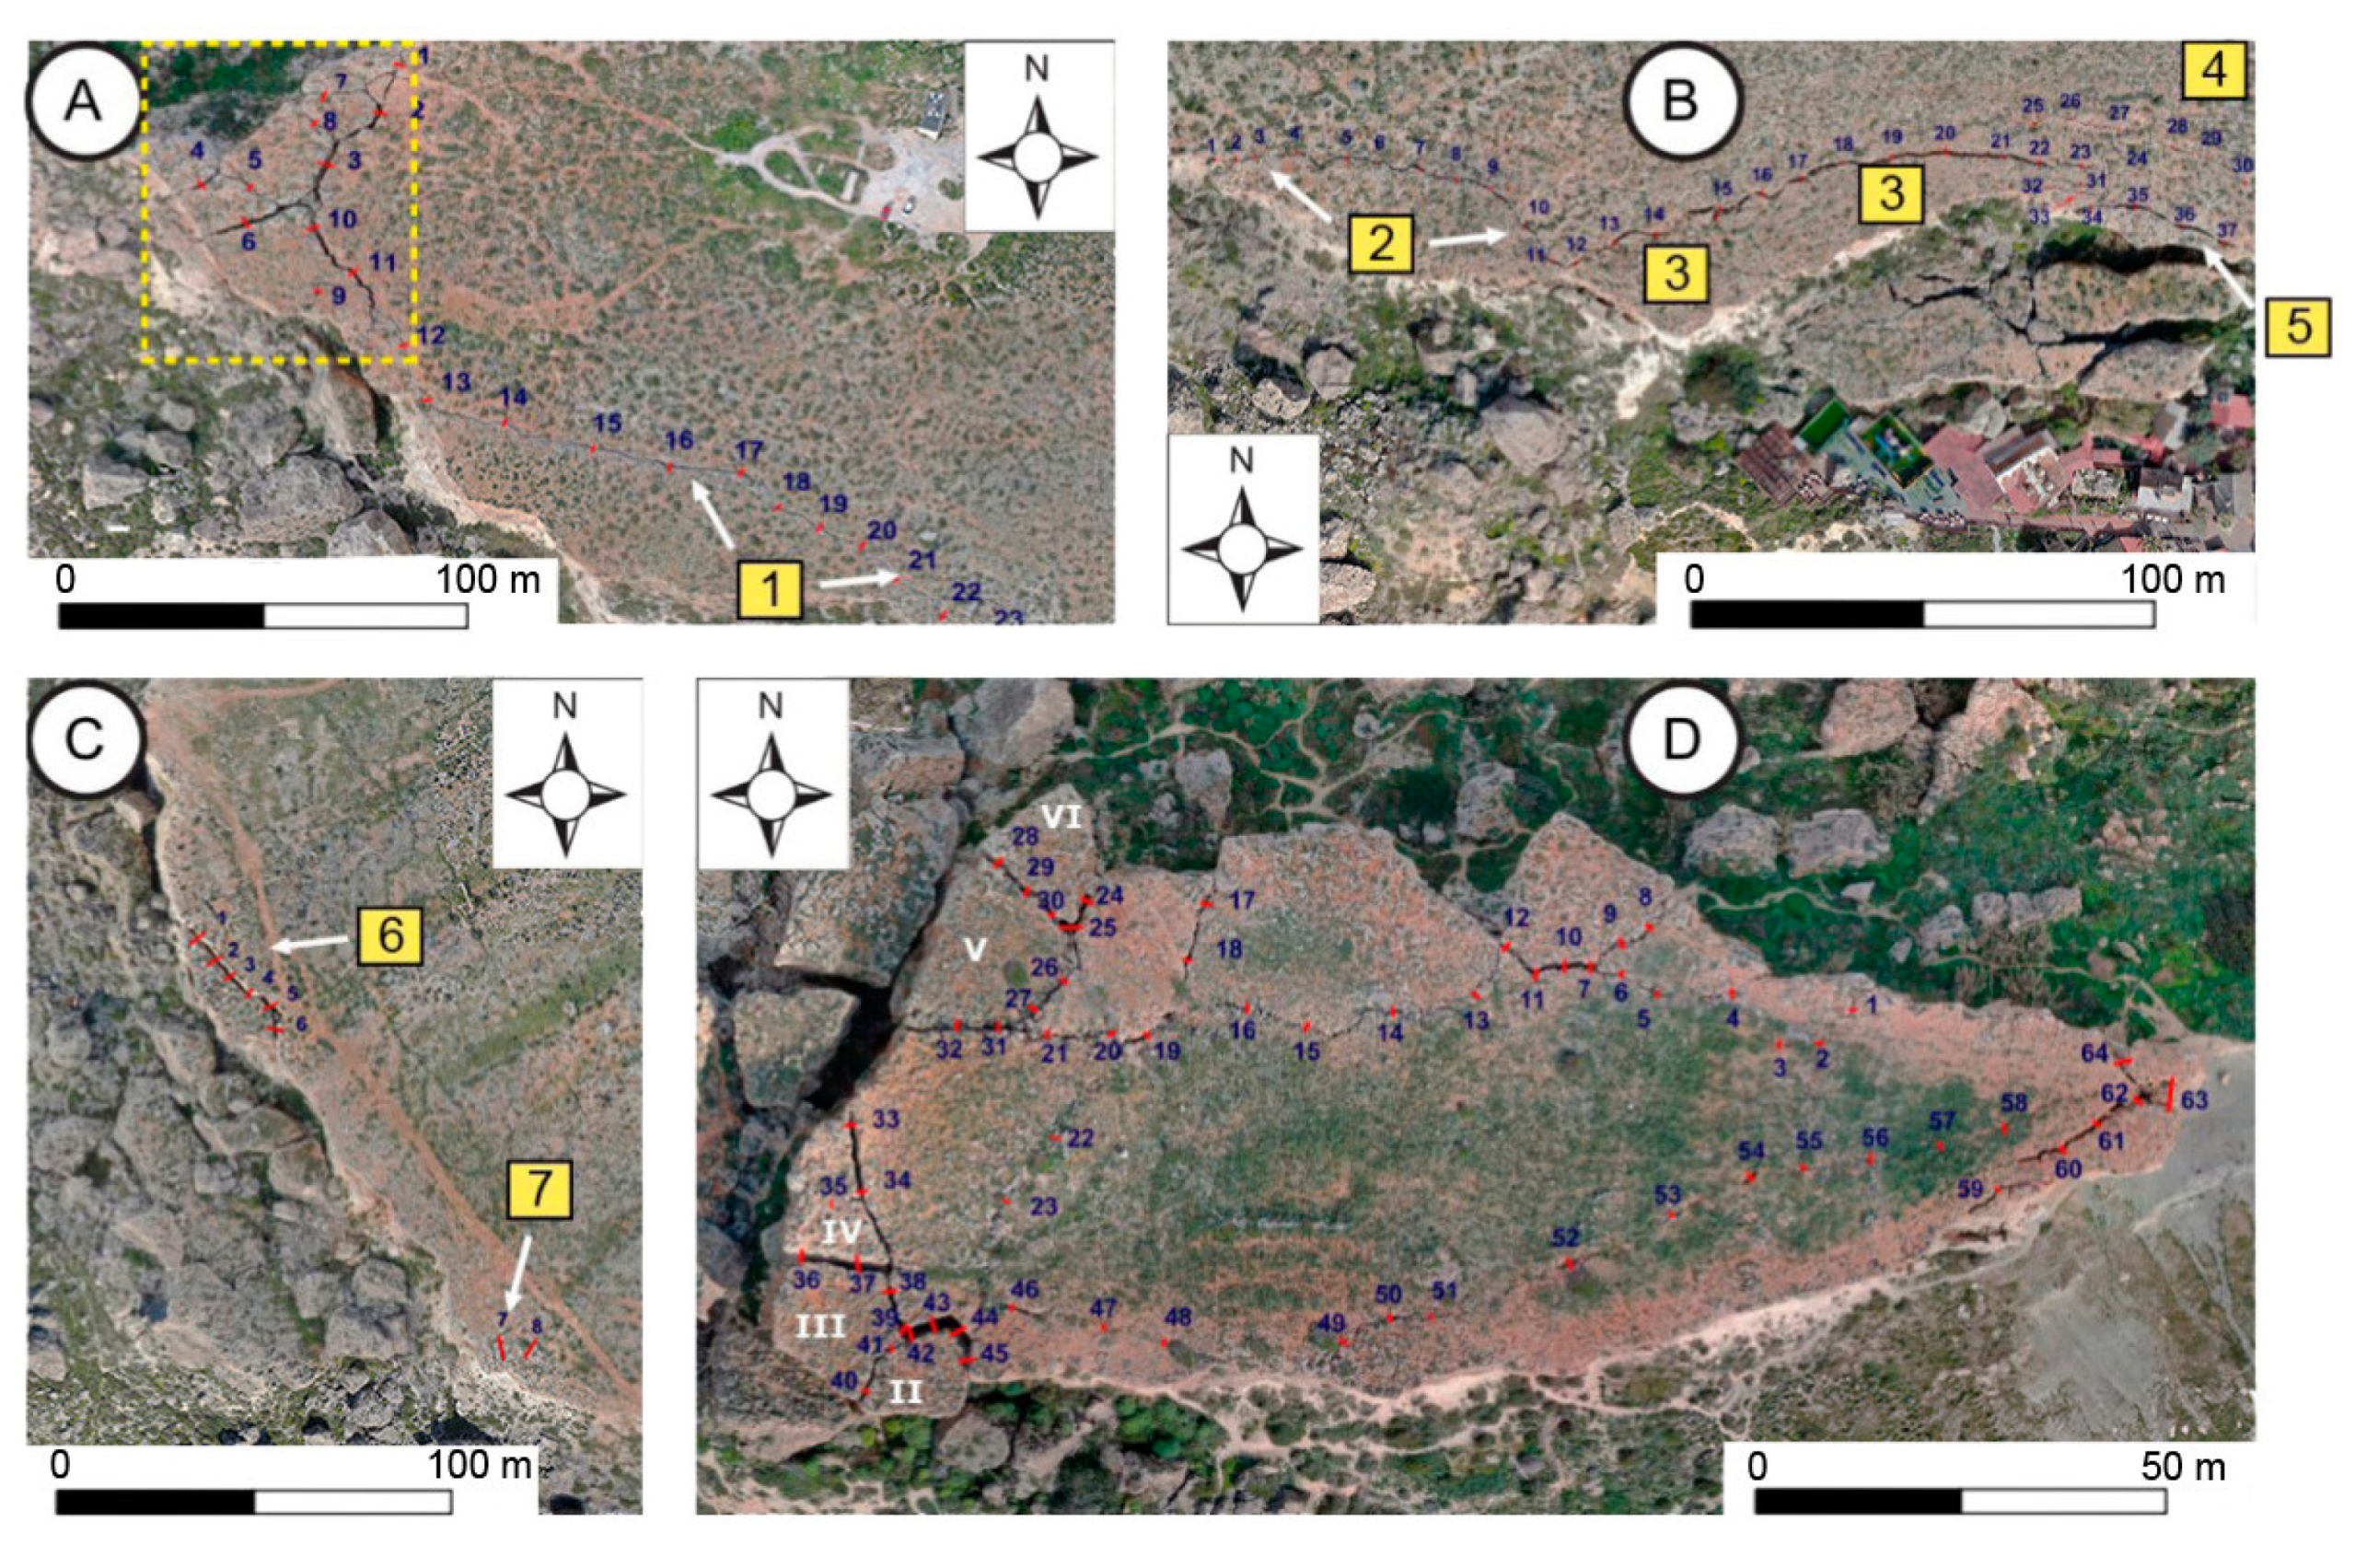
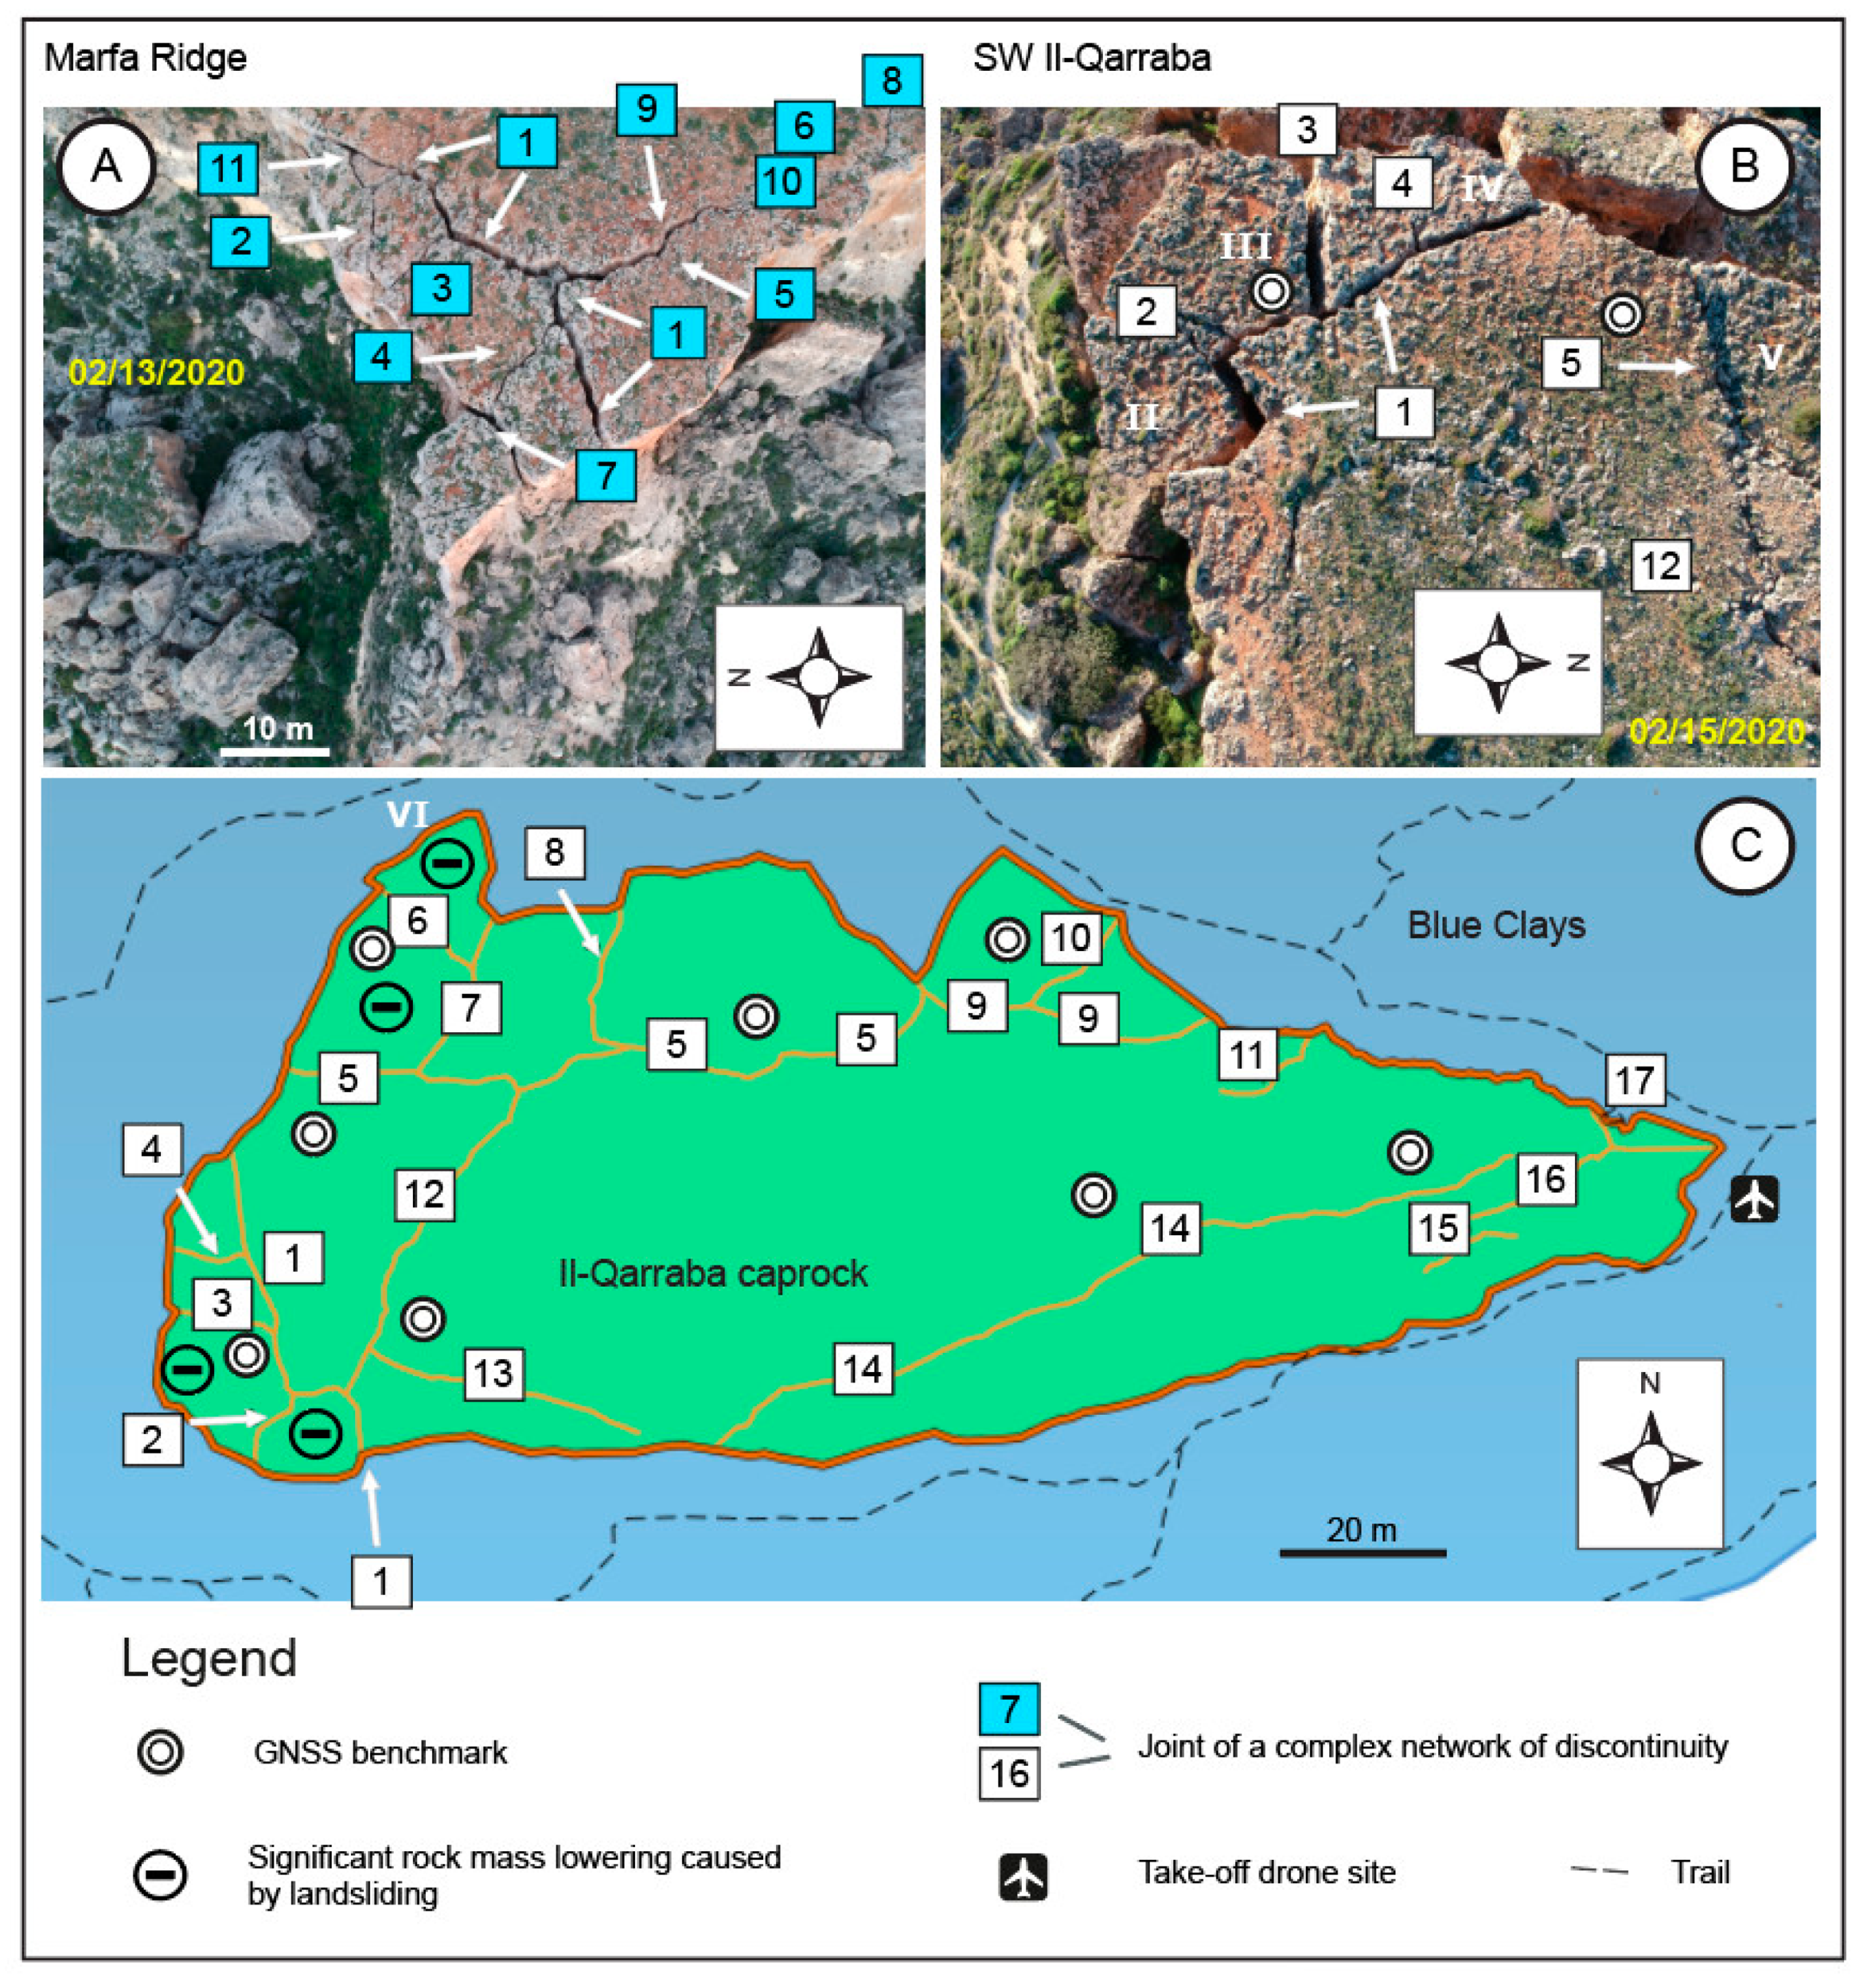
4.3. Gravity-Induced Joints and Coastal Megaclast Deposit Investigation
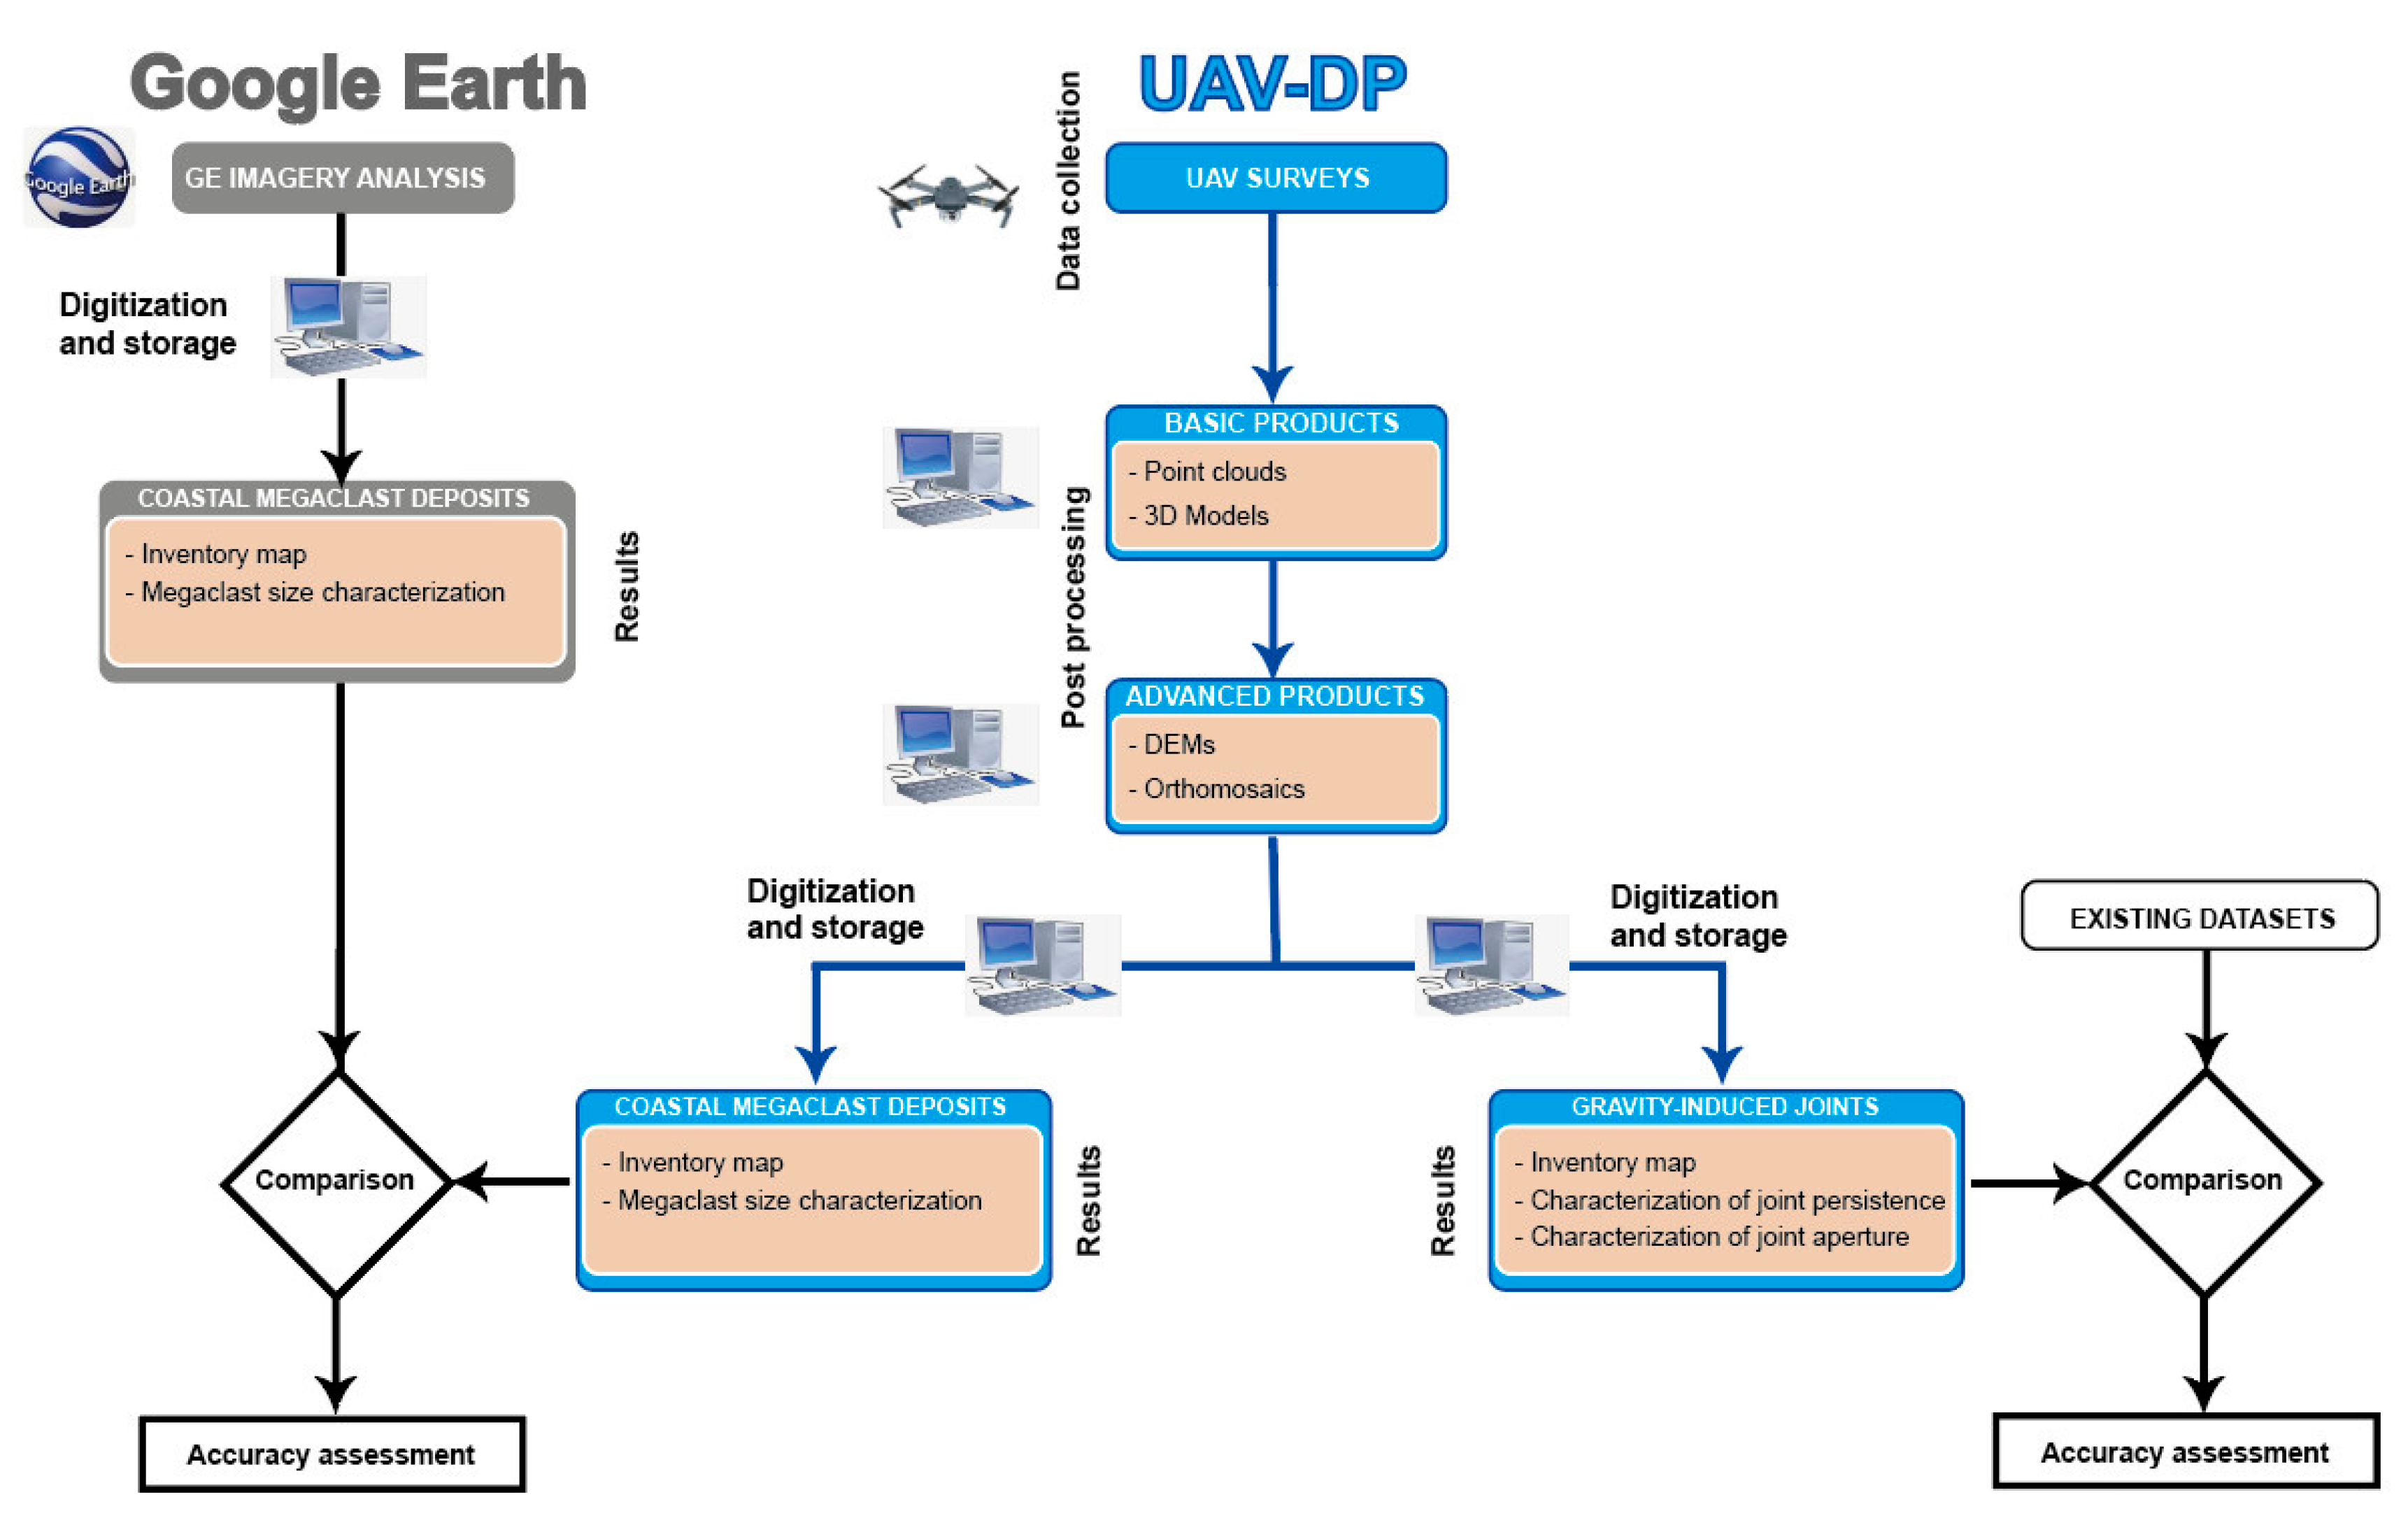
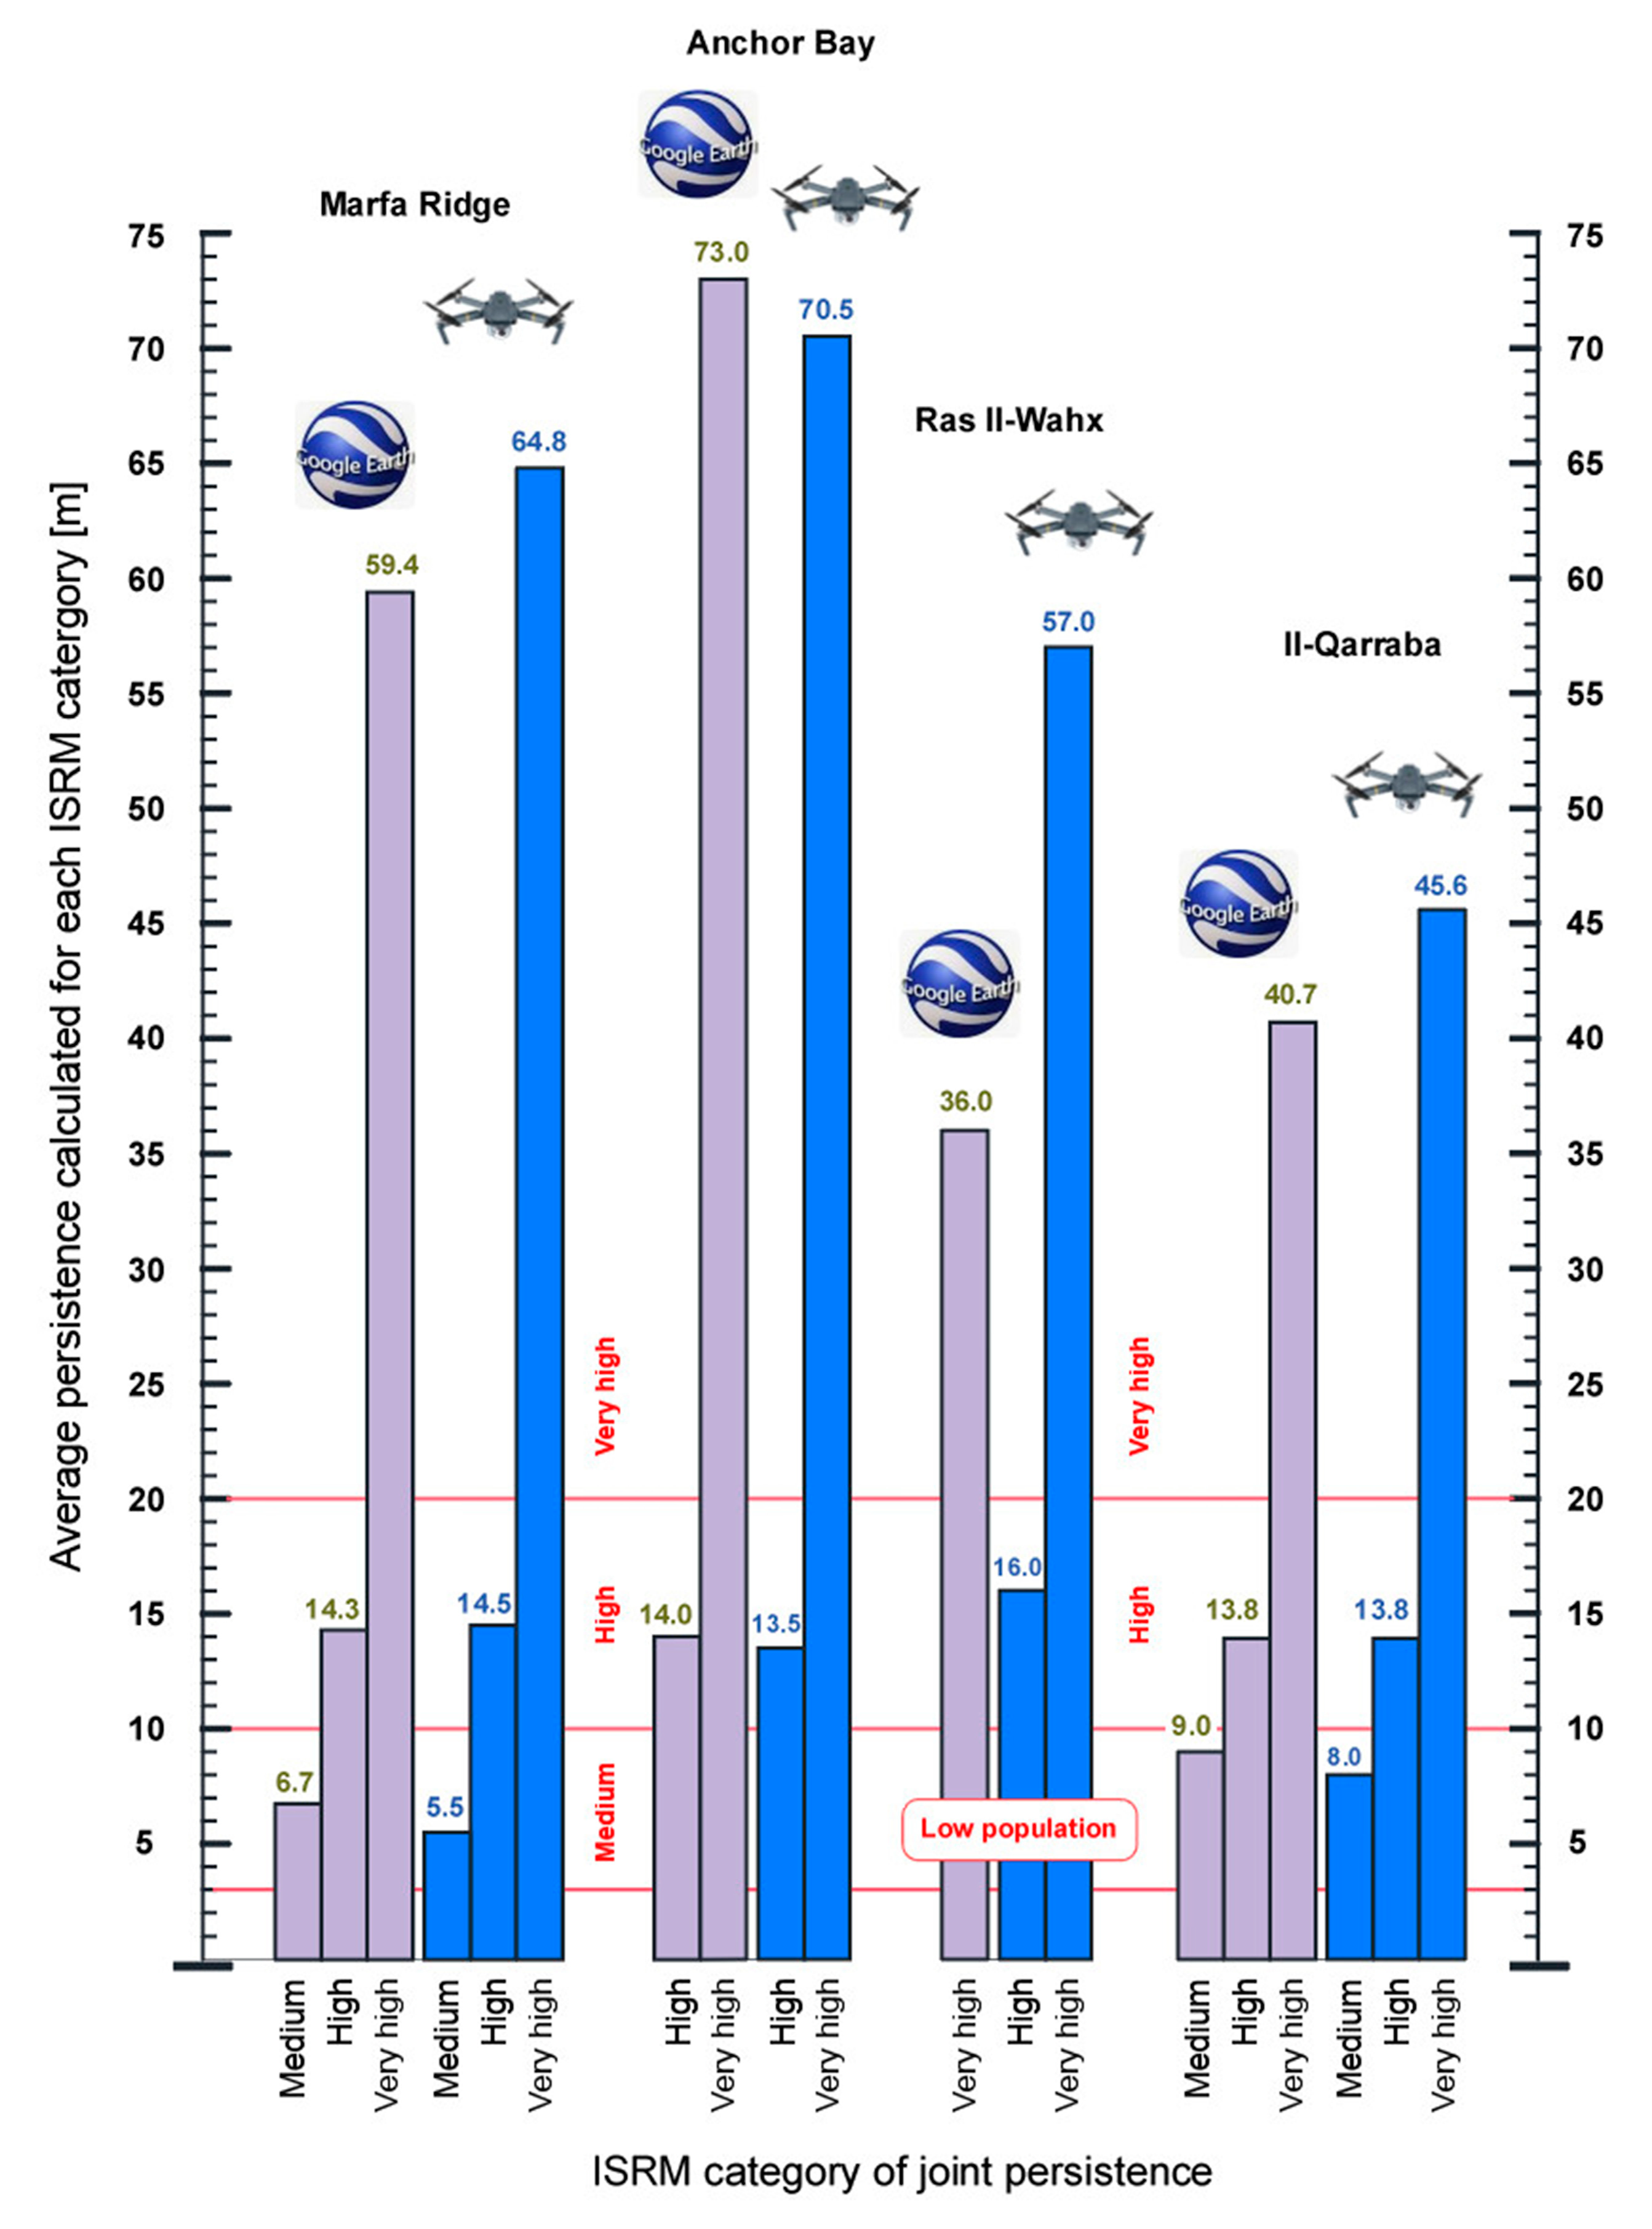
5. Results of GE Analysis
6. Results of UAV-DP Analysis
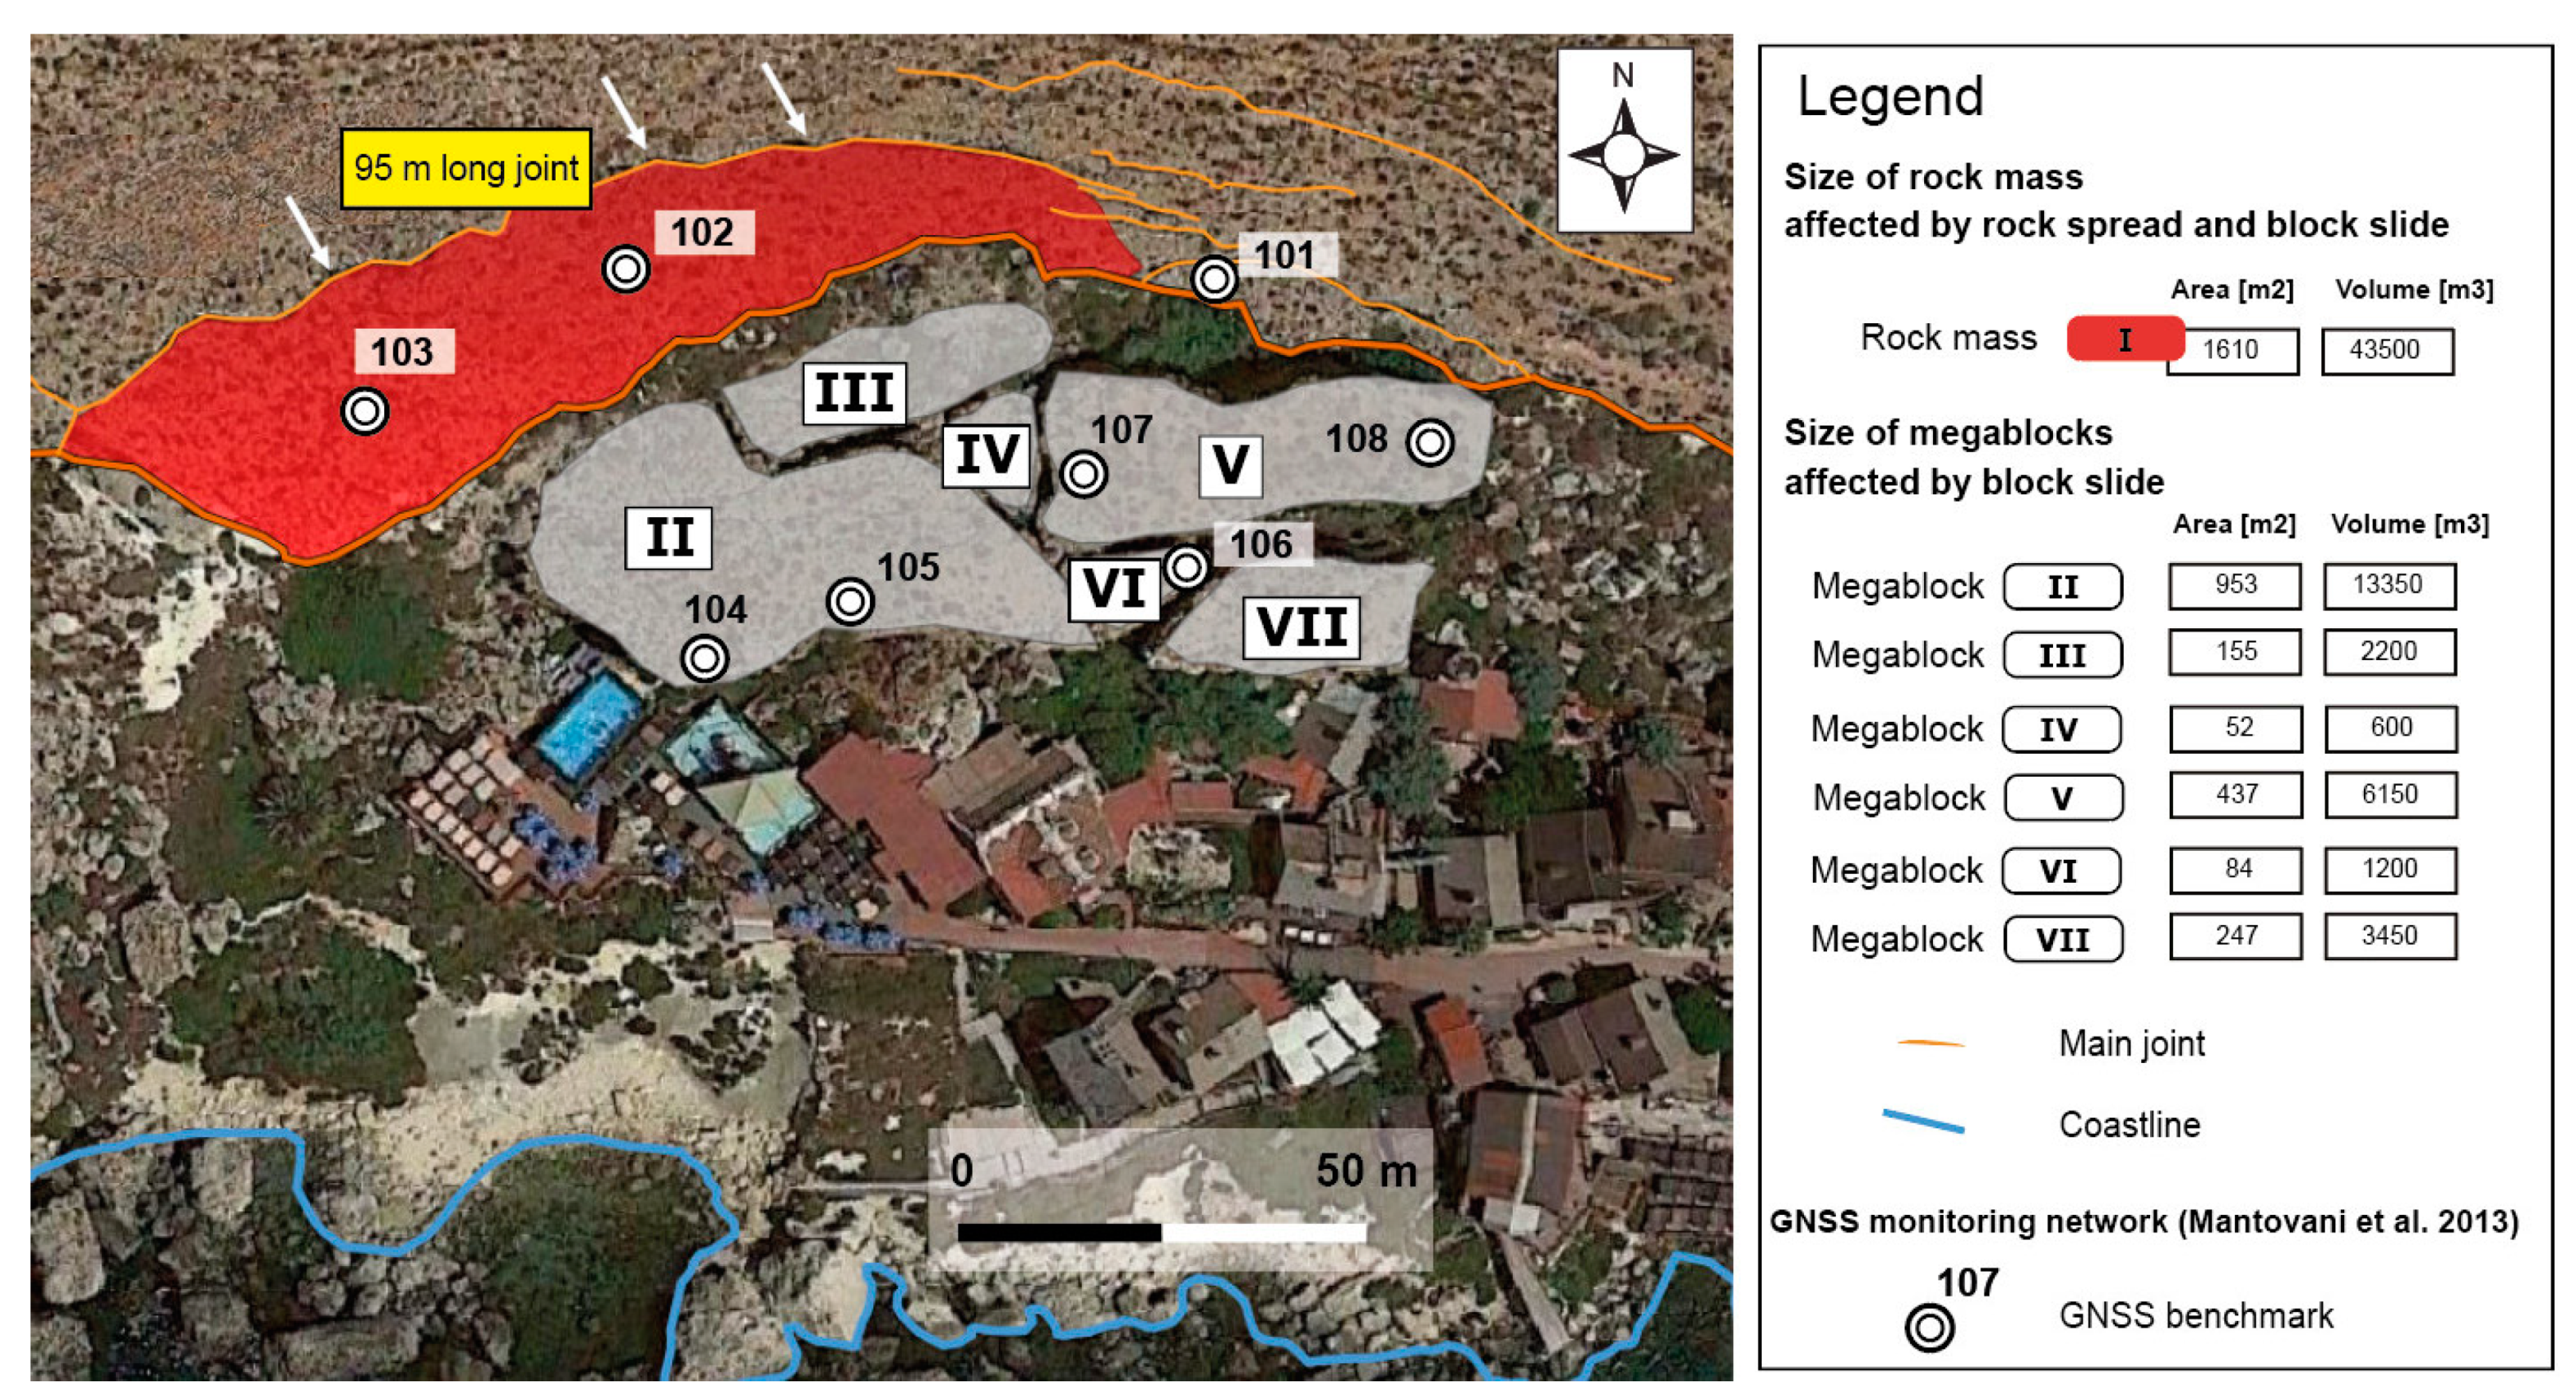
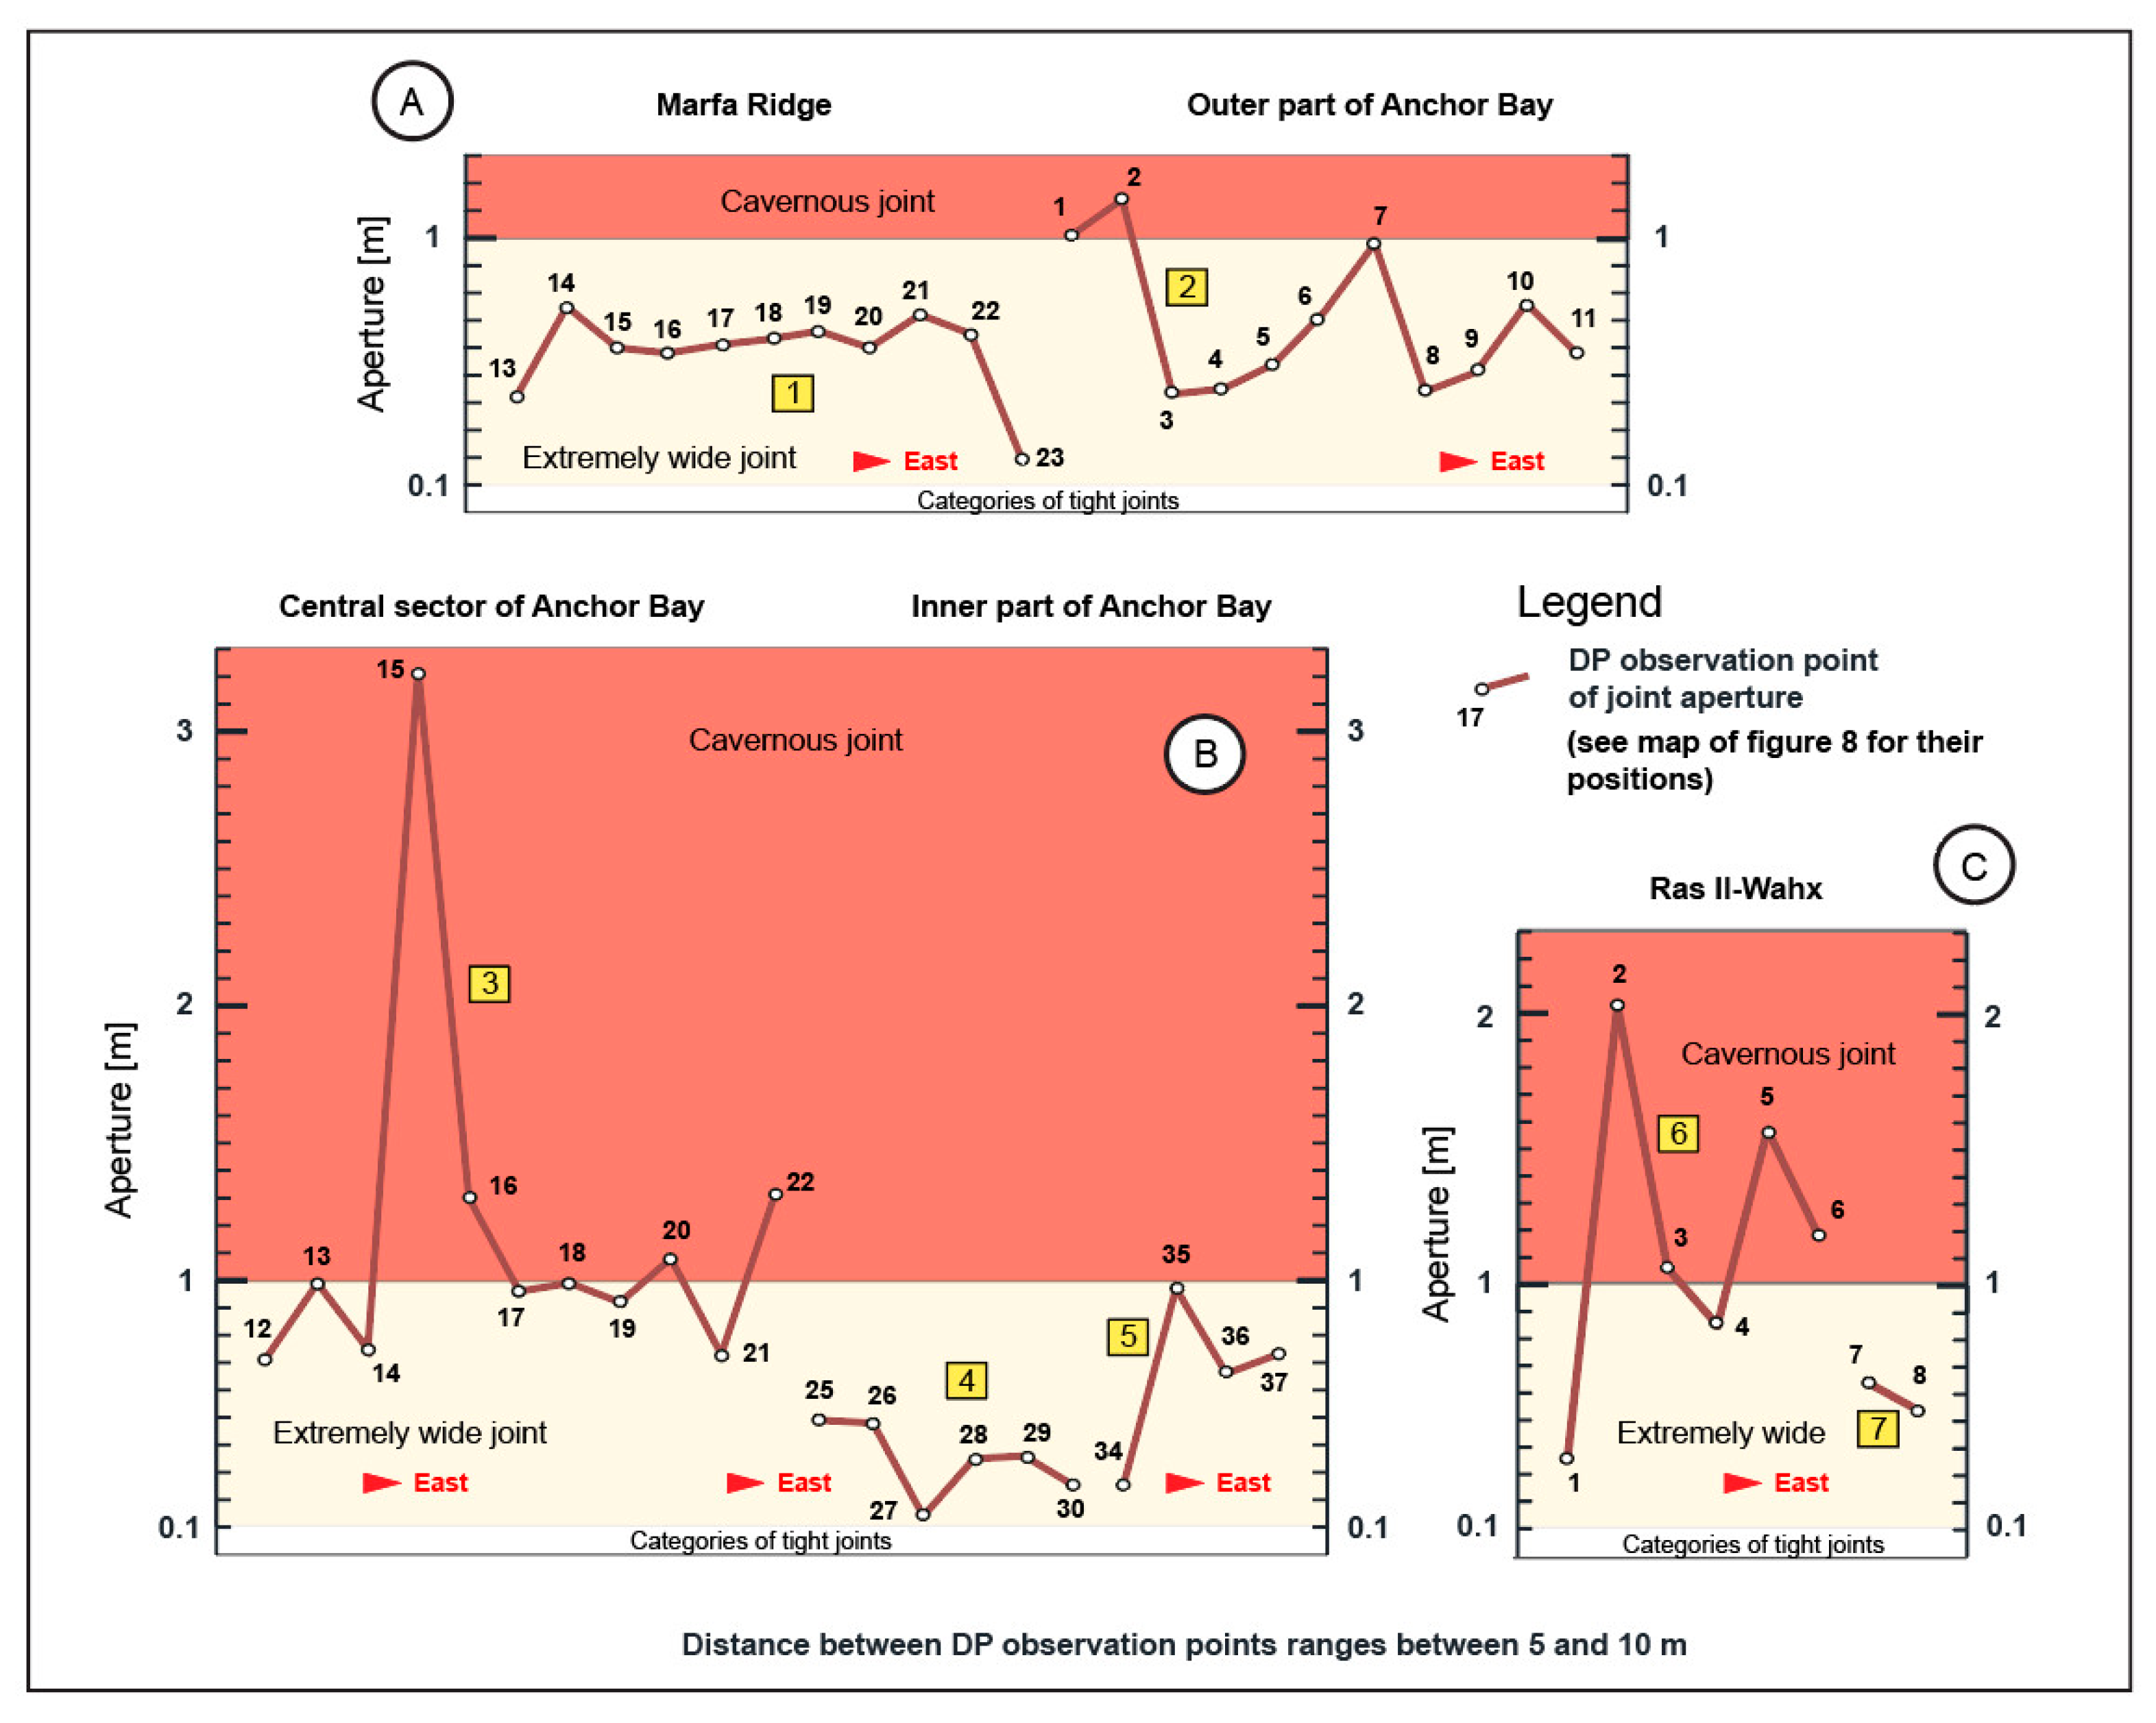
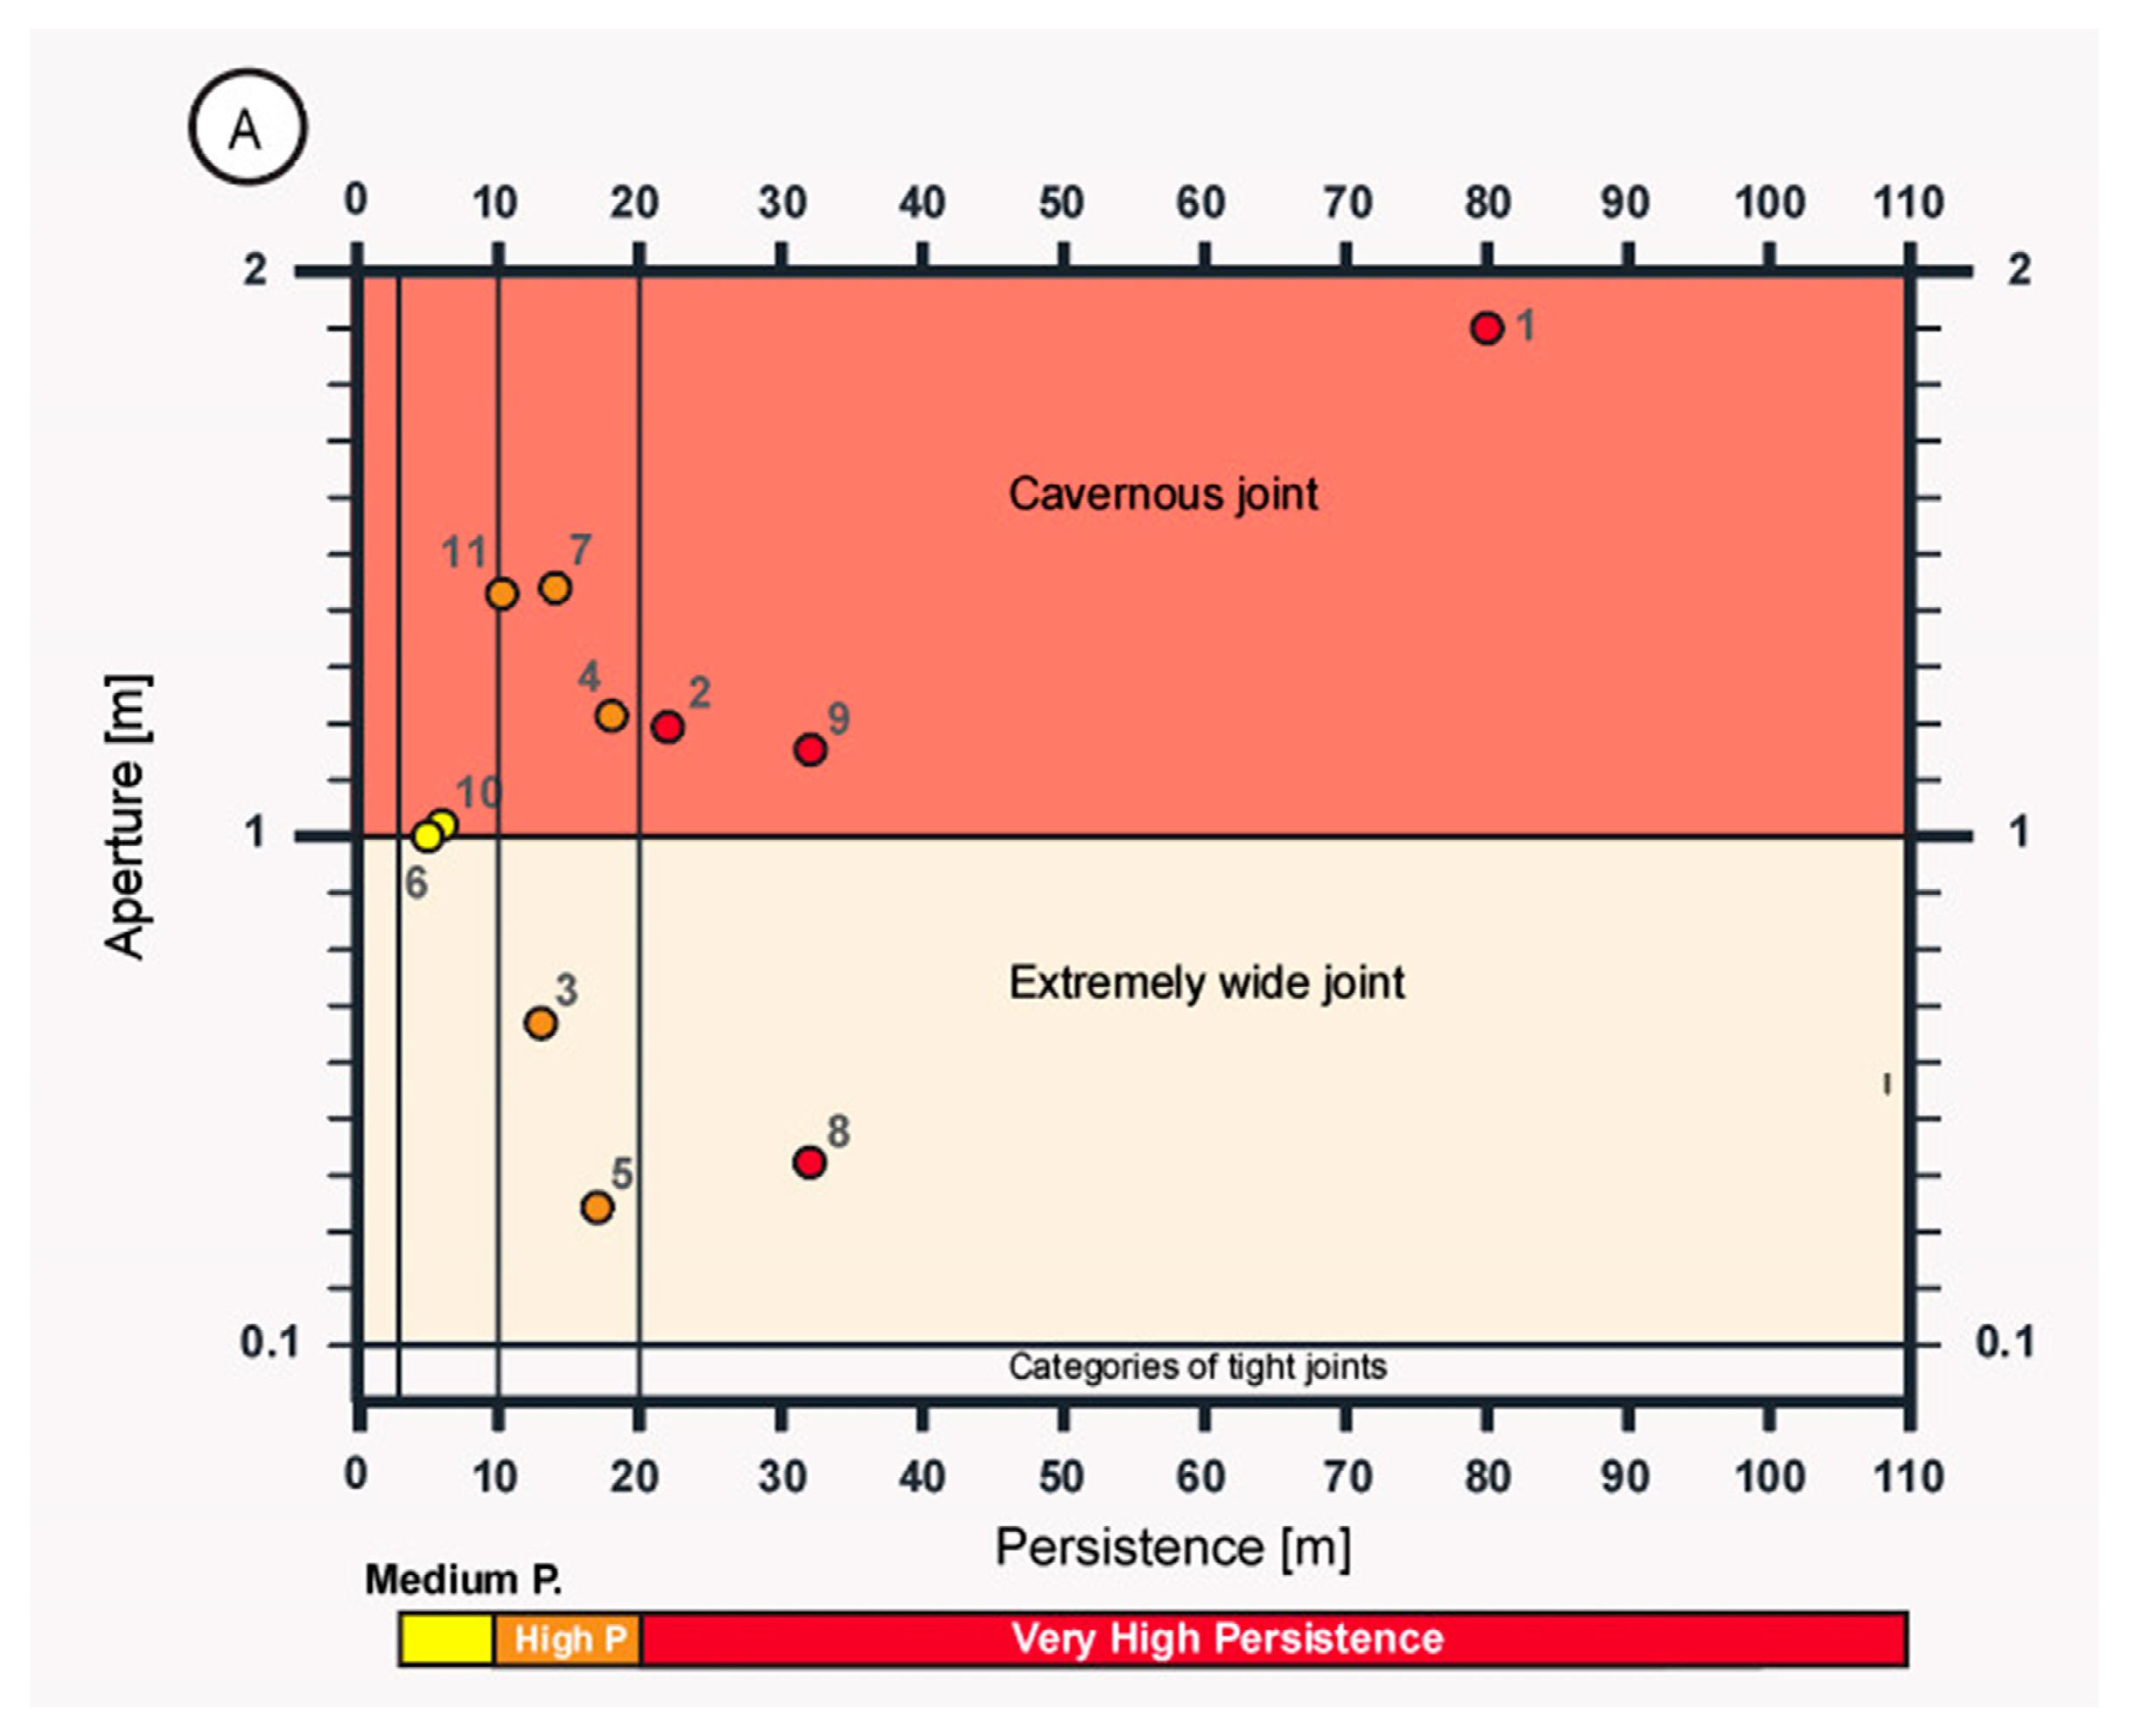
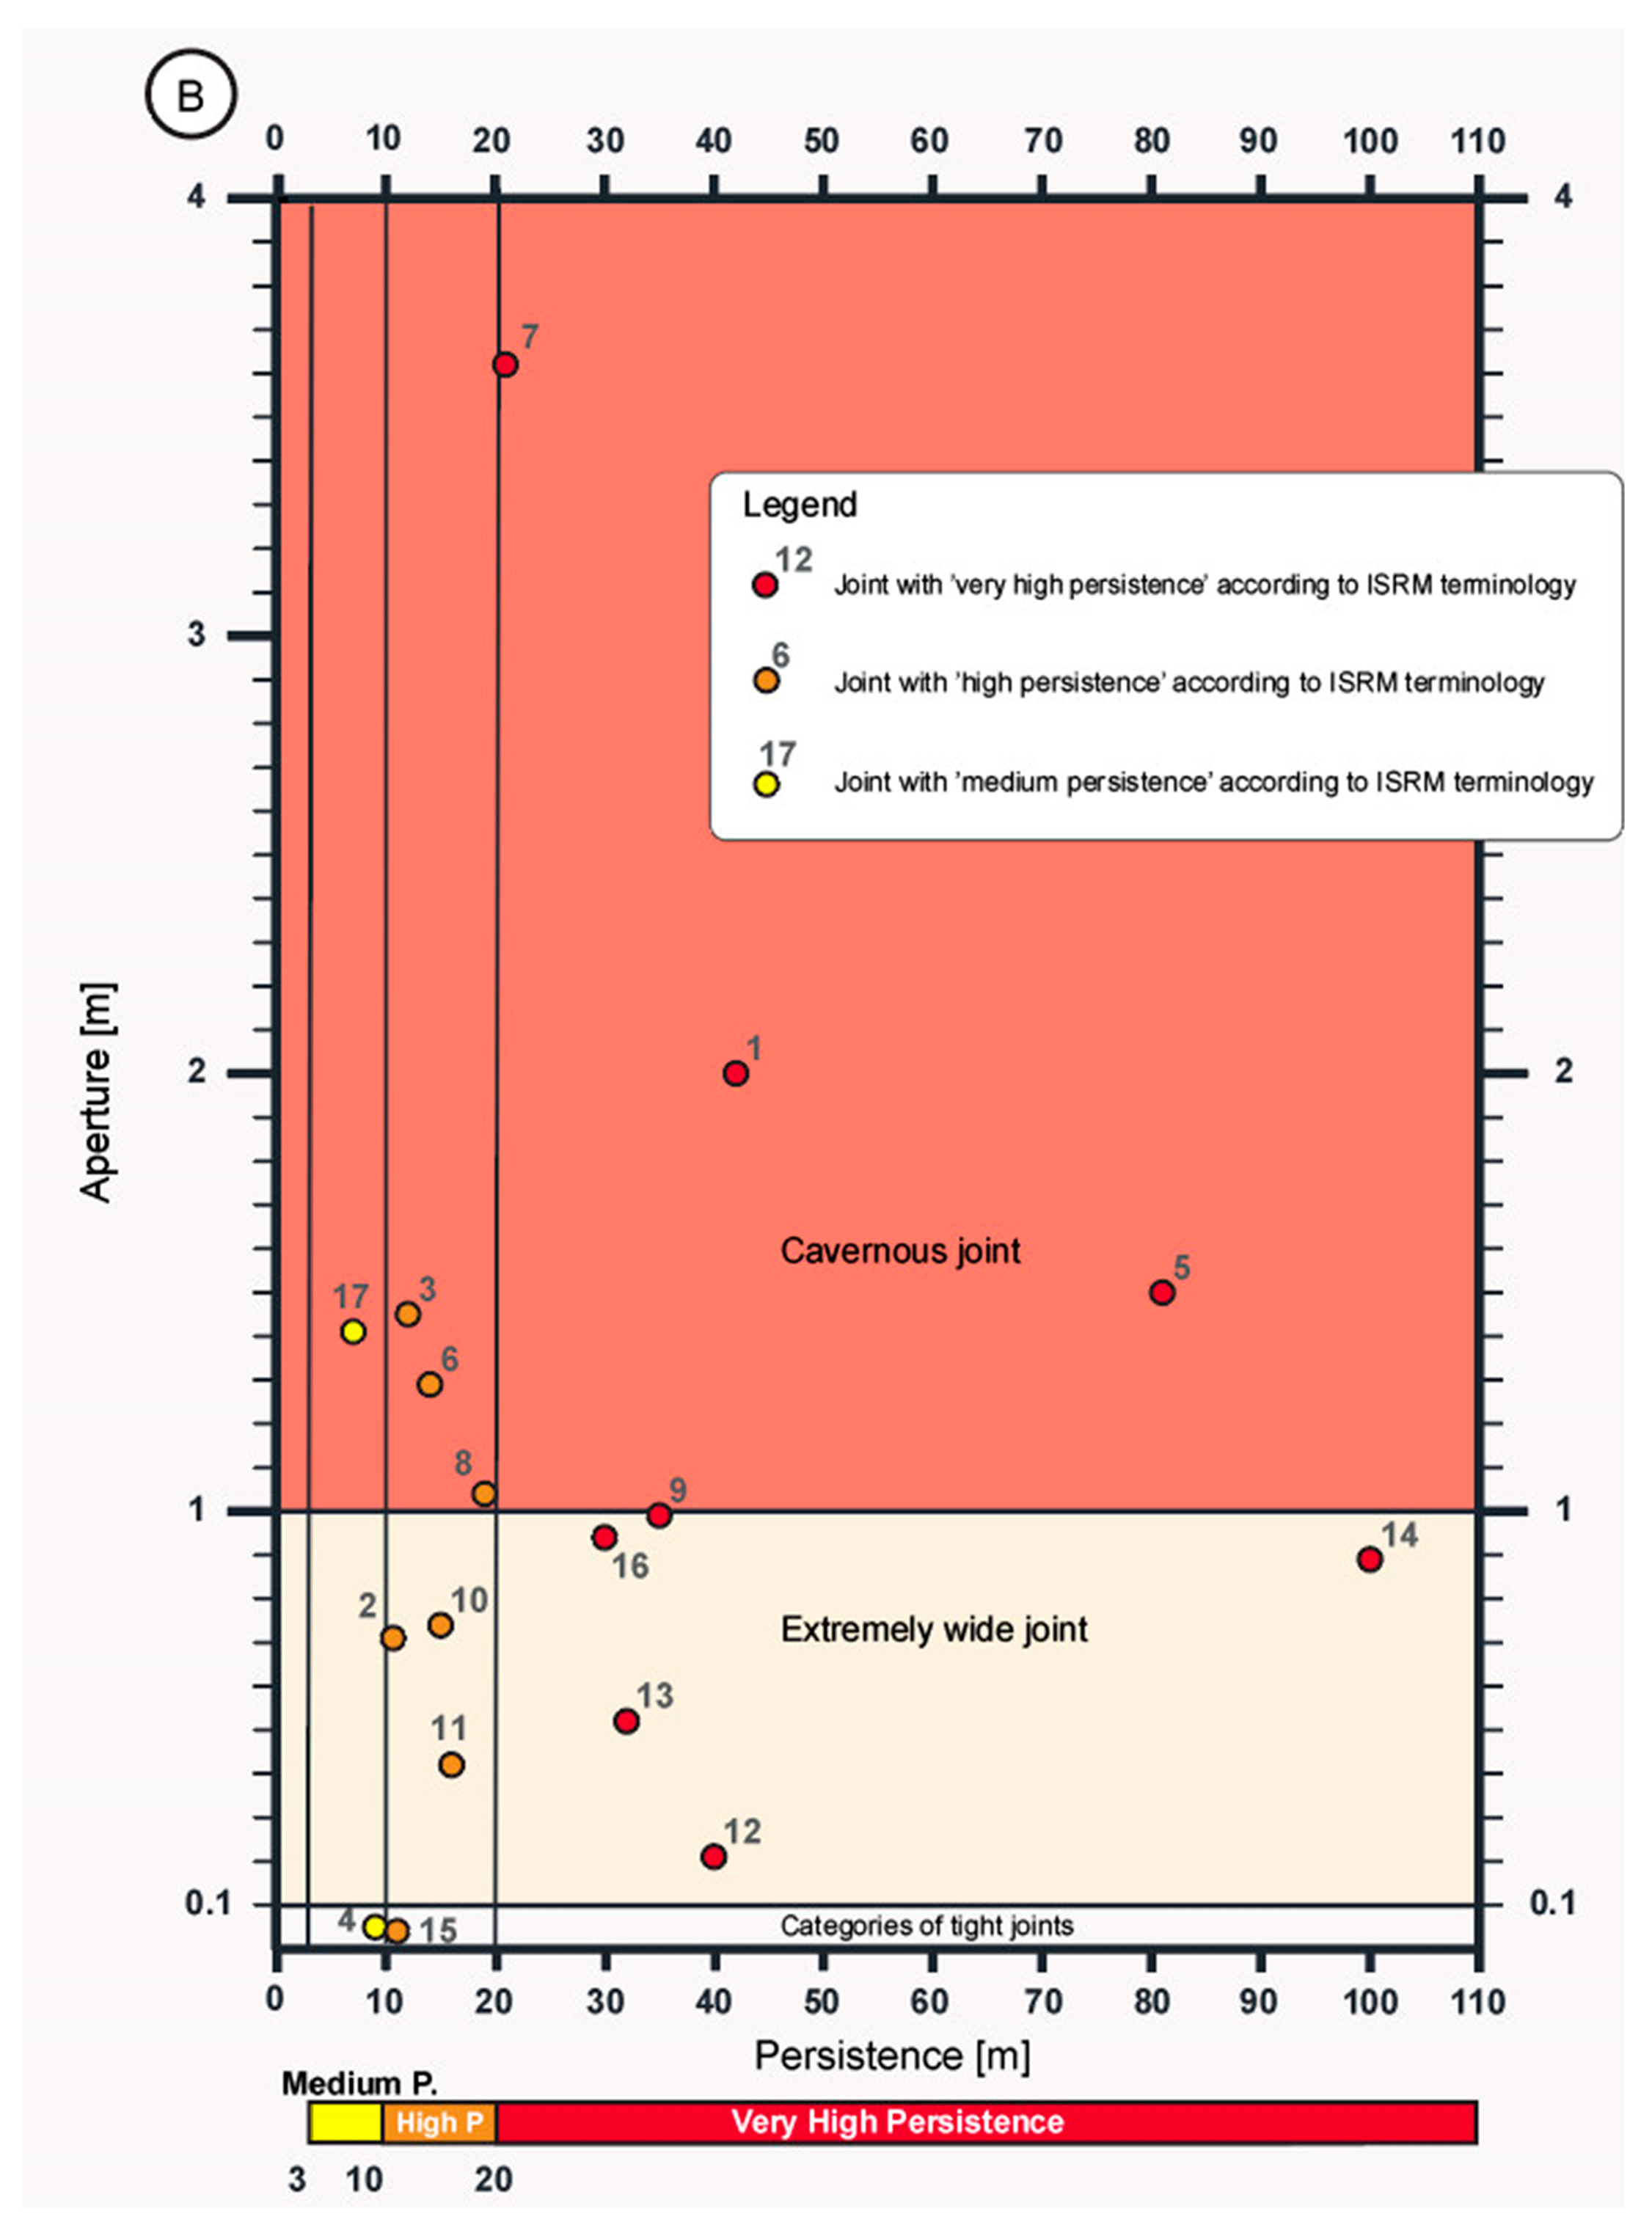
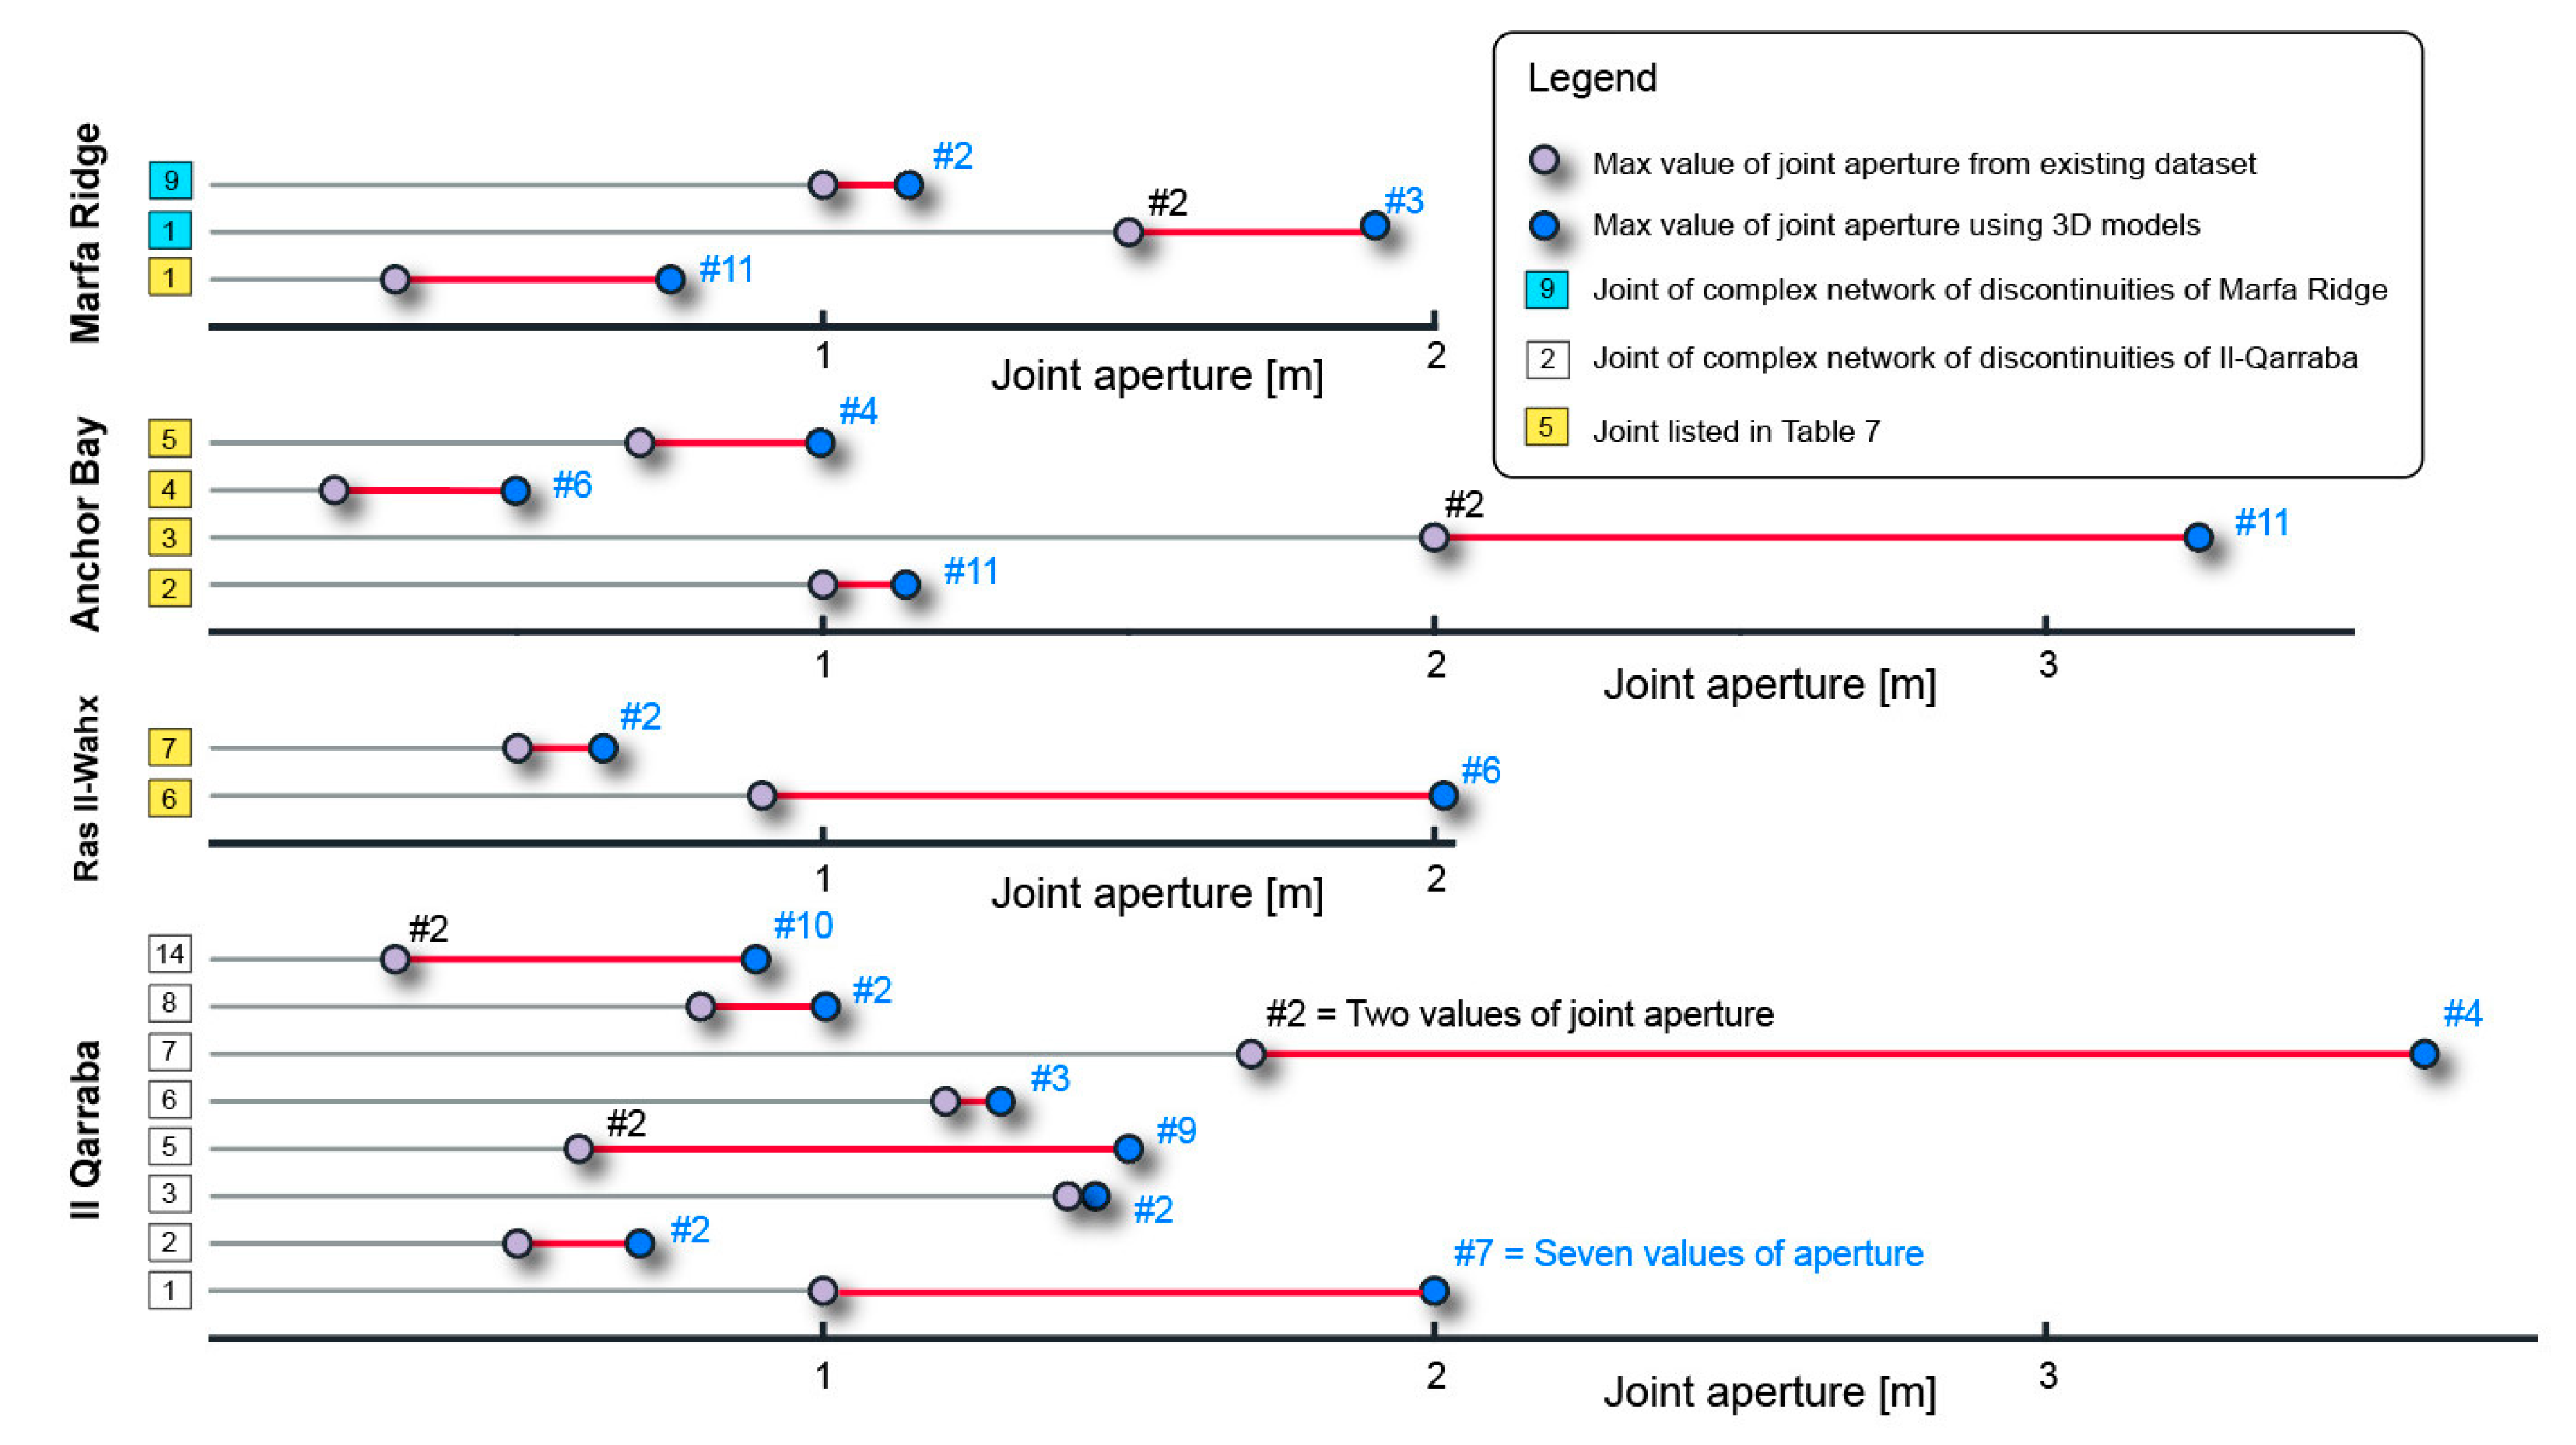
6.1. Joint Inventory and Property Characterization
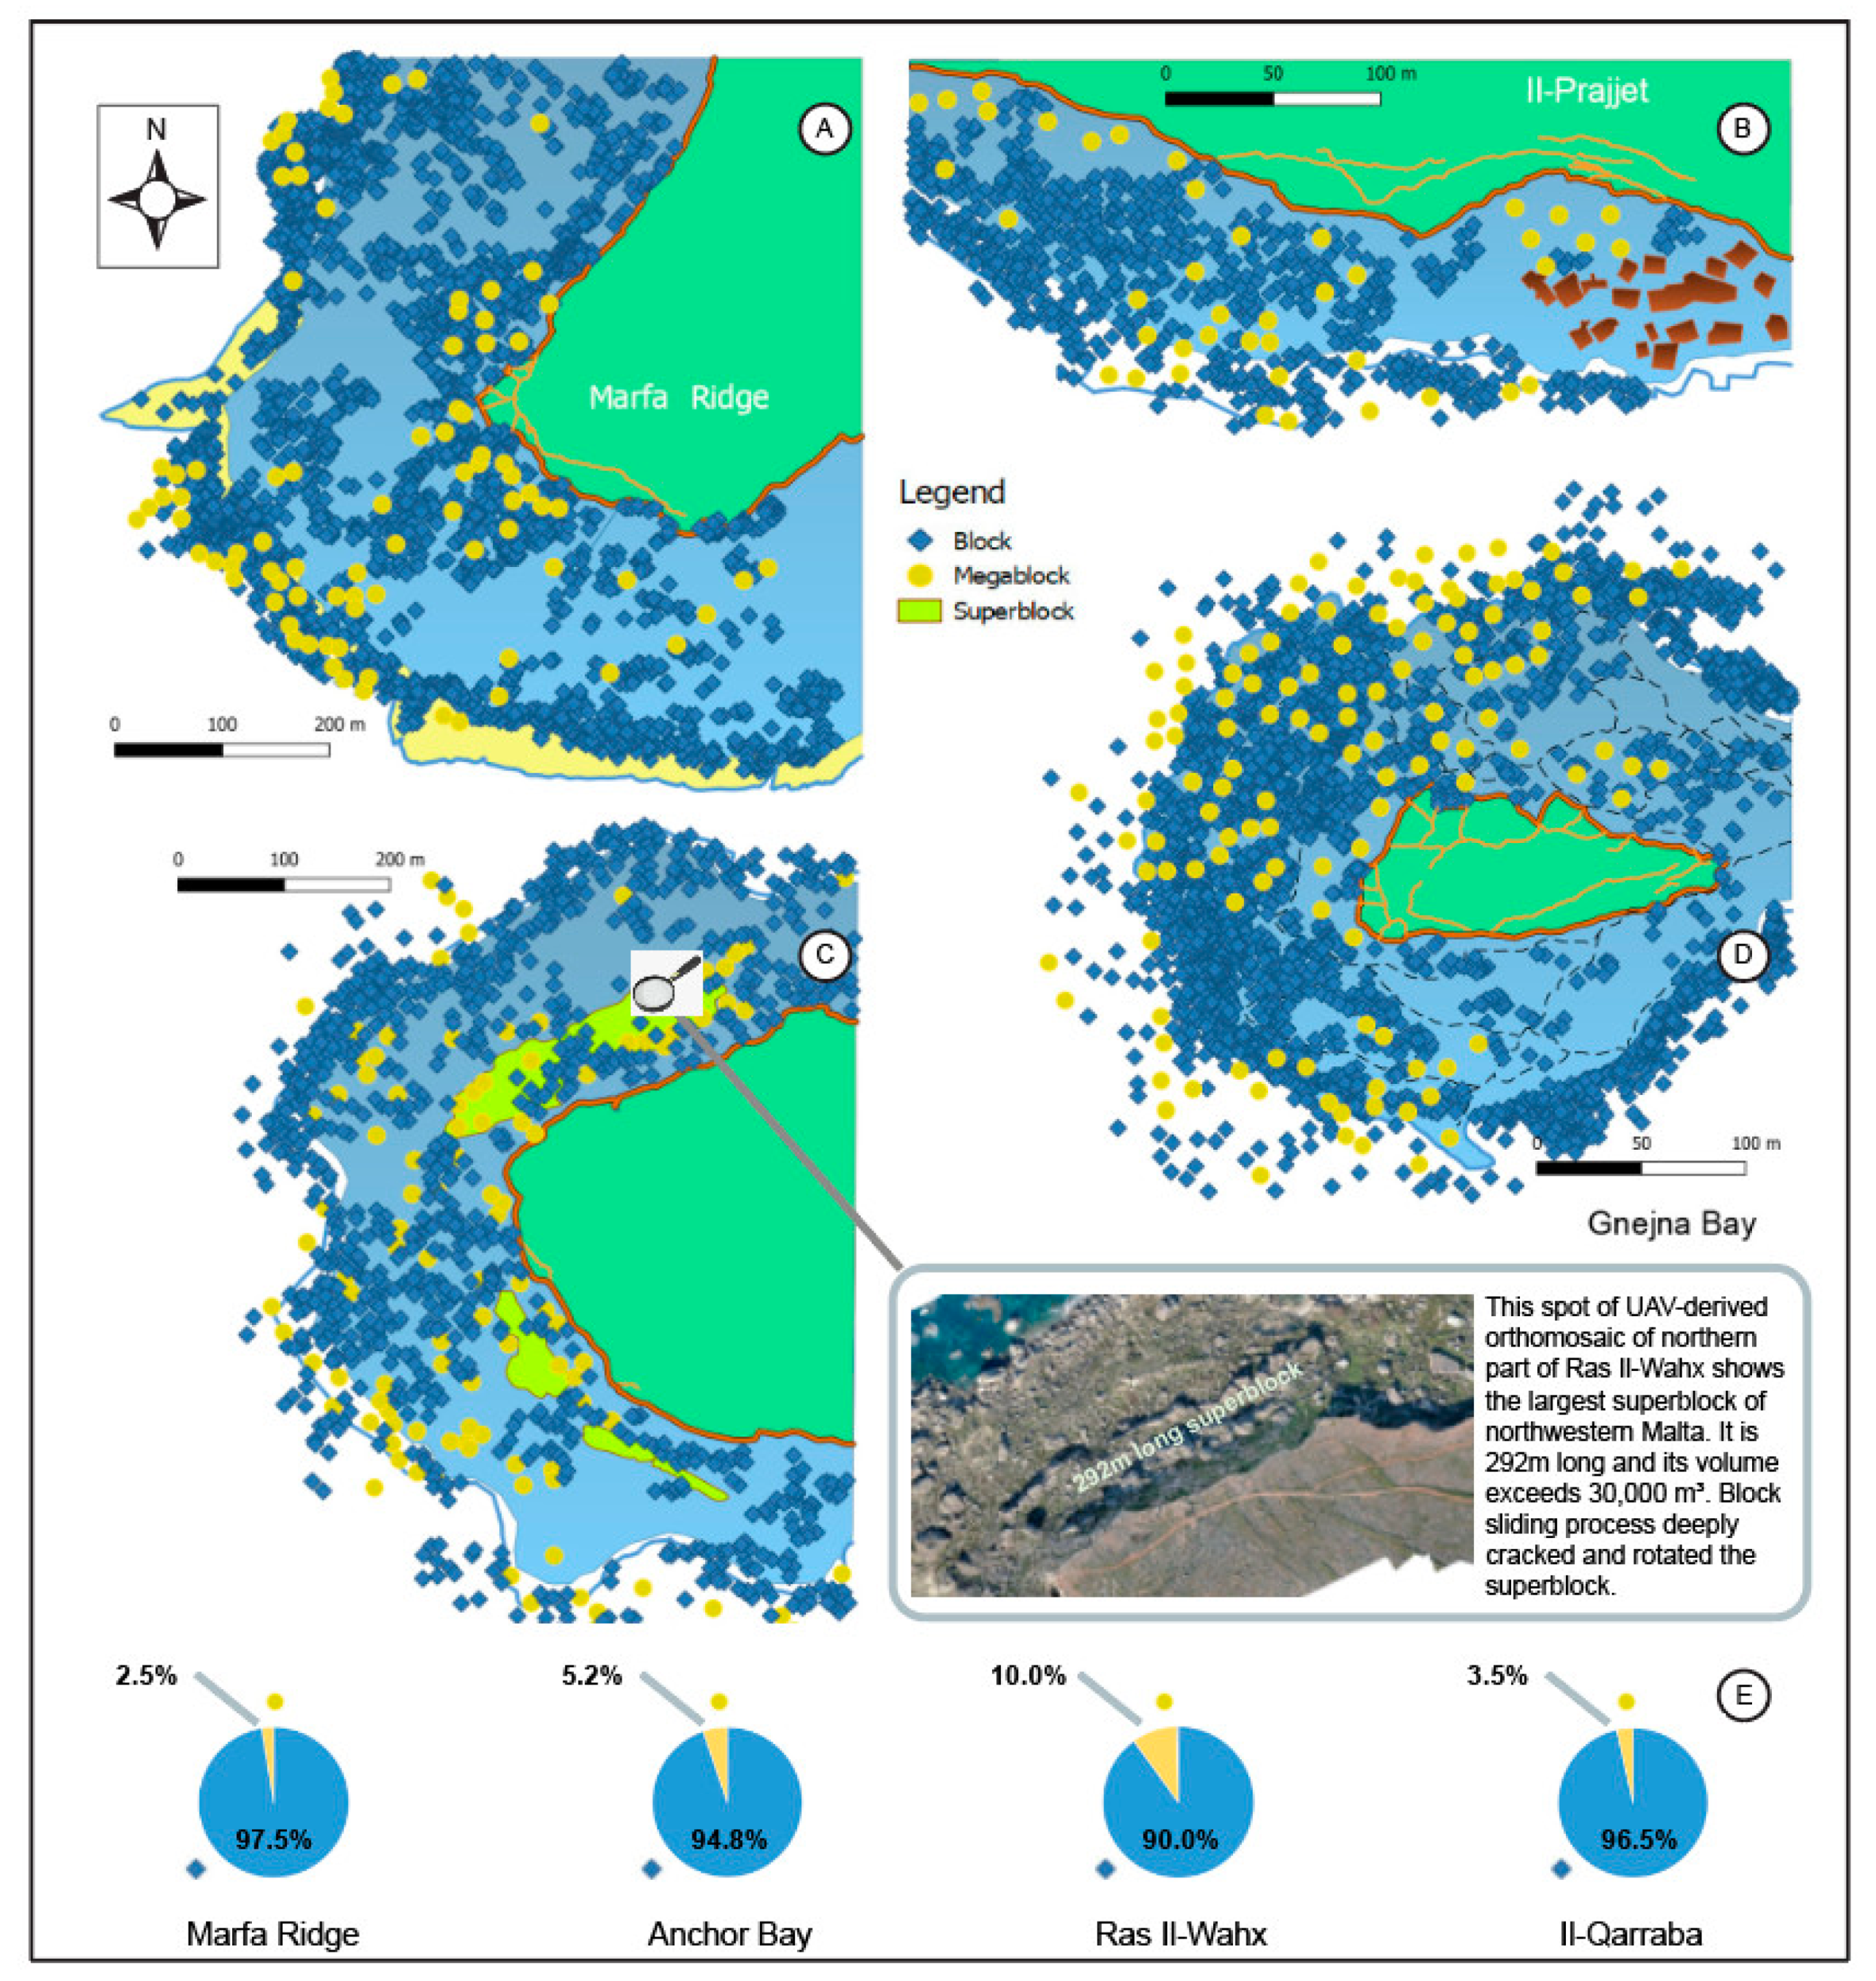
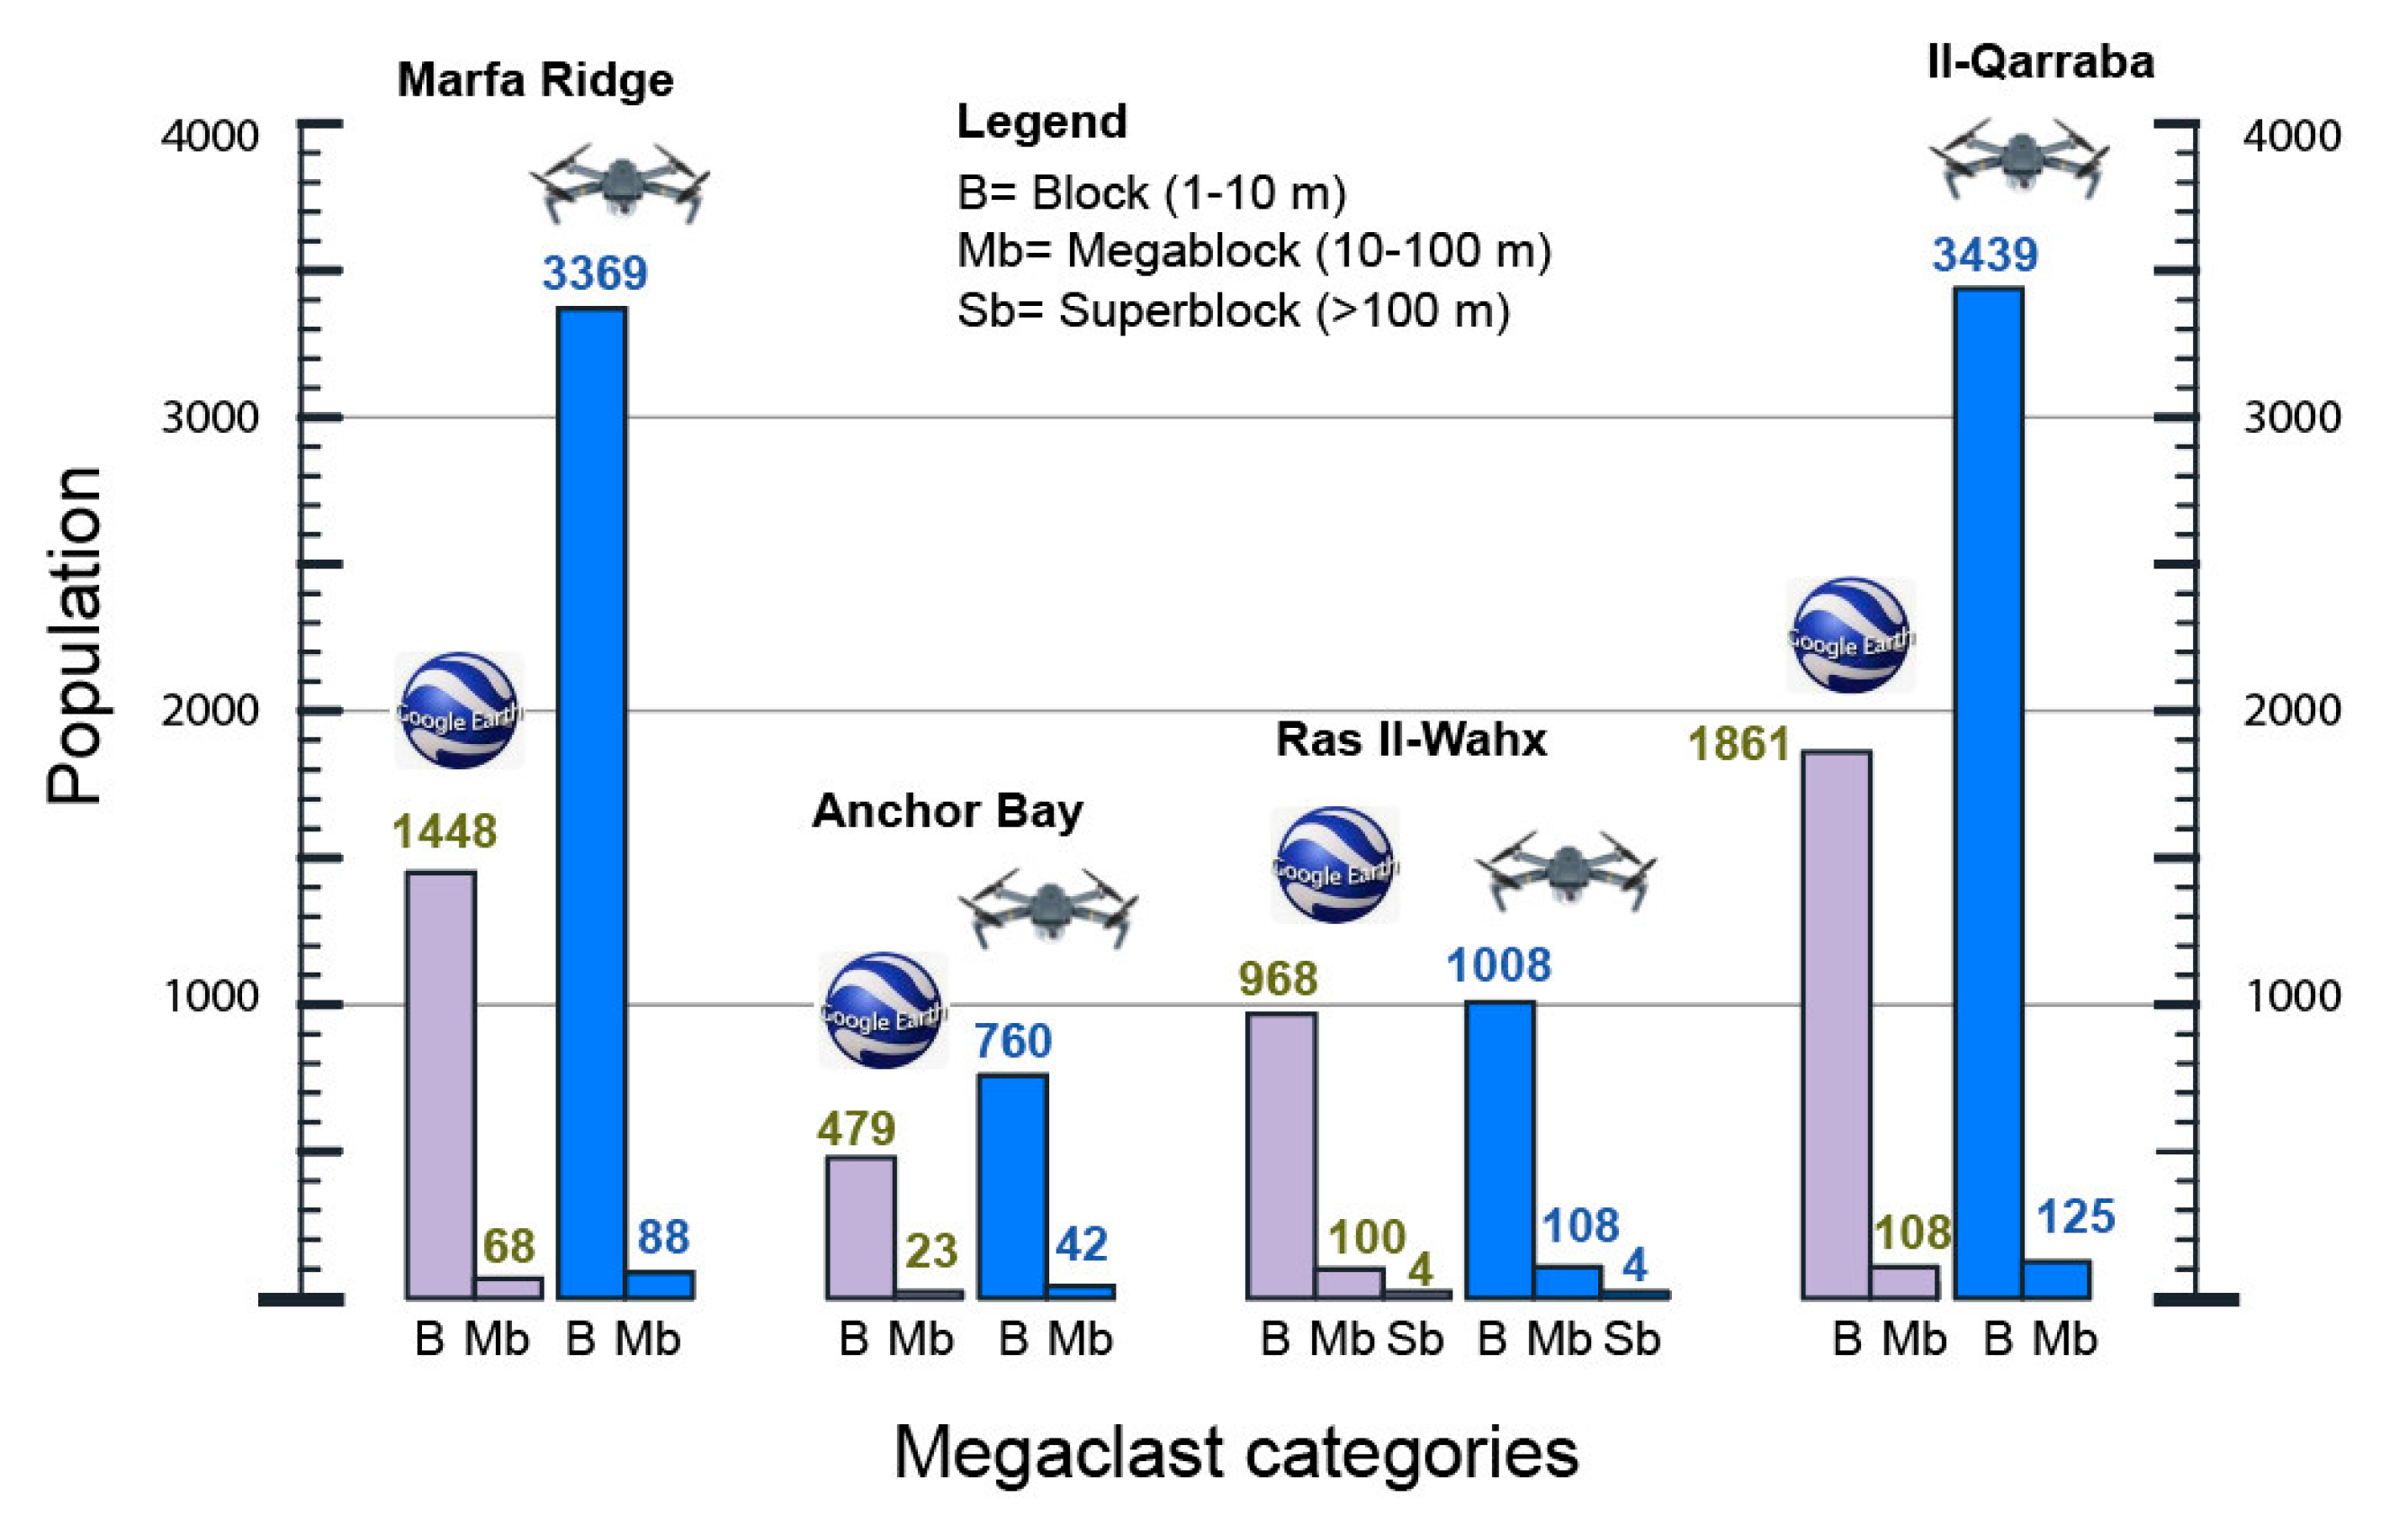
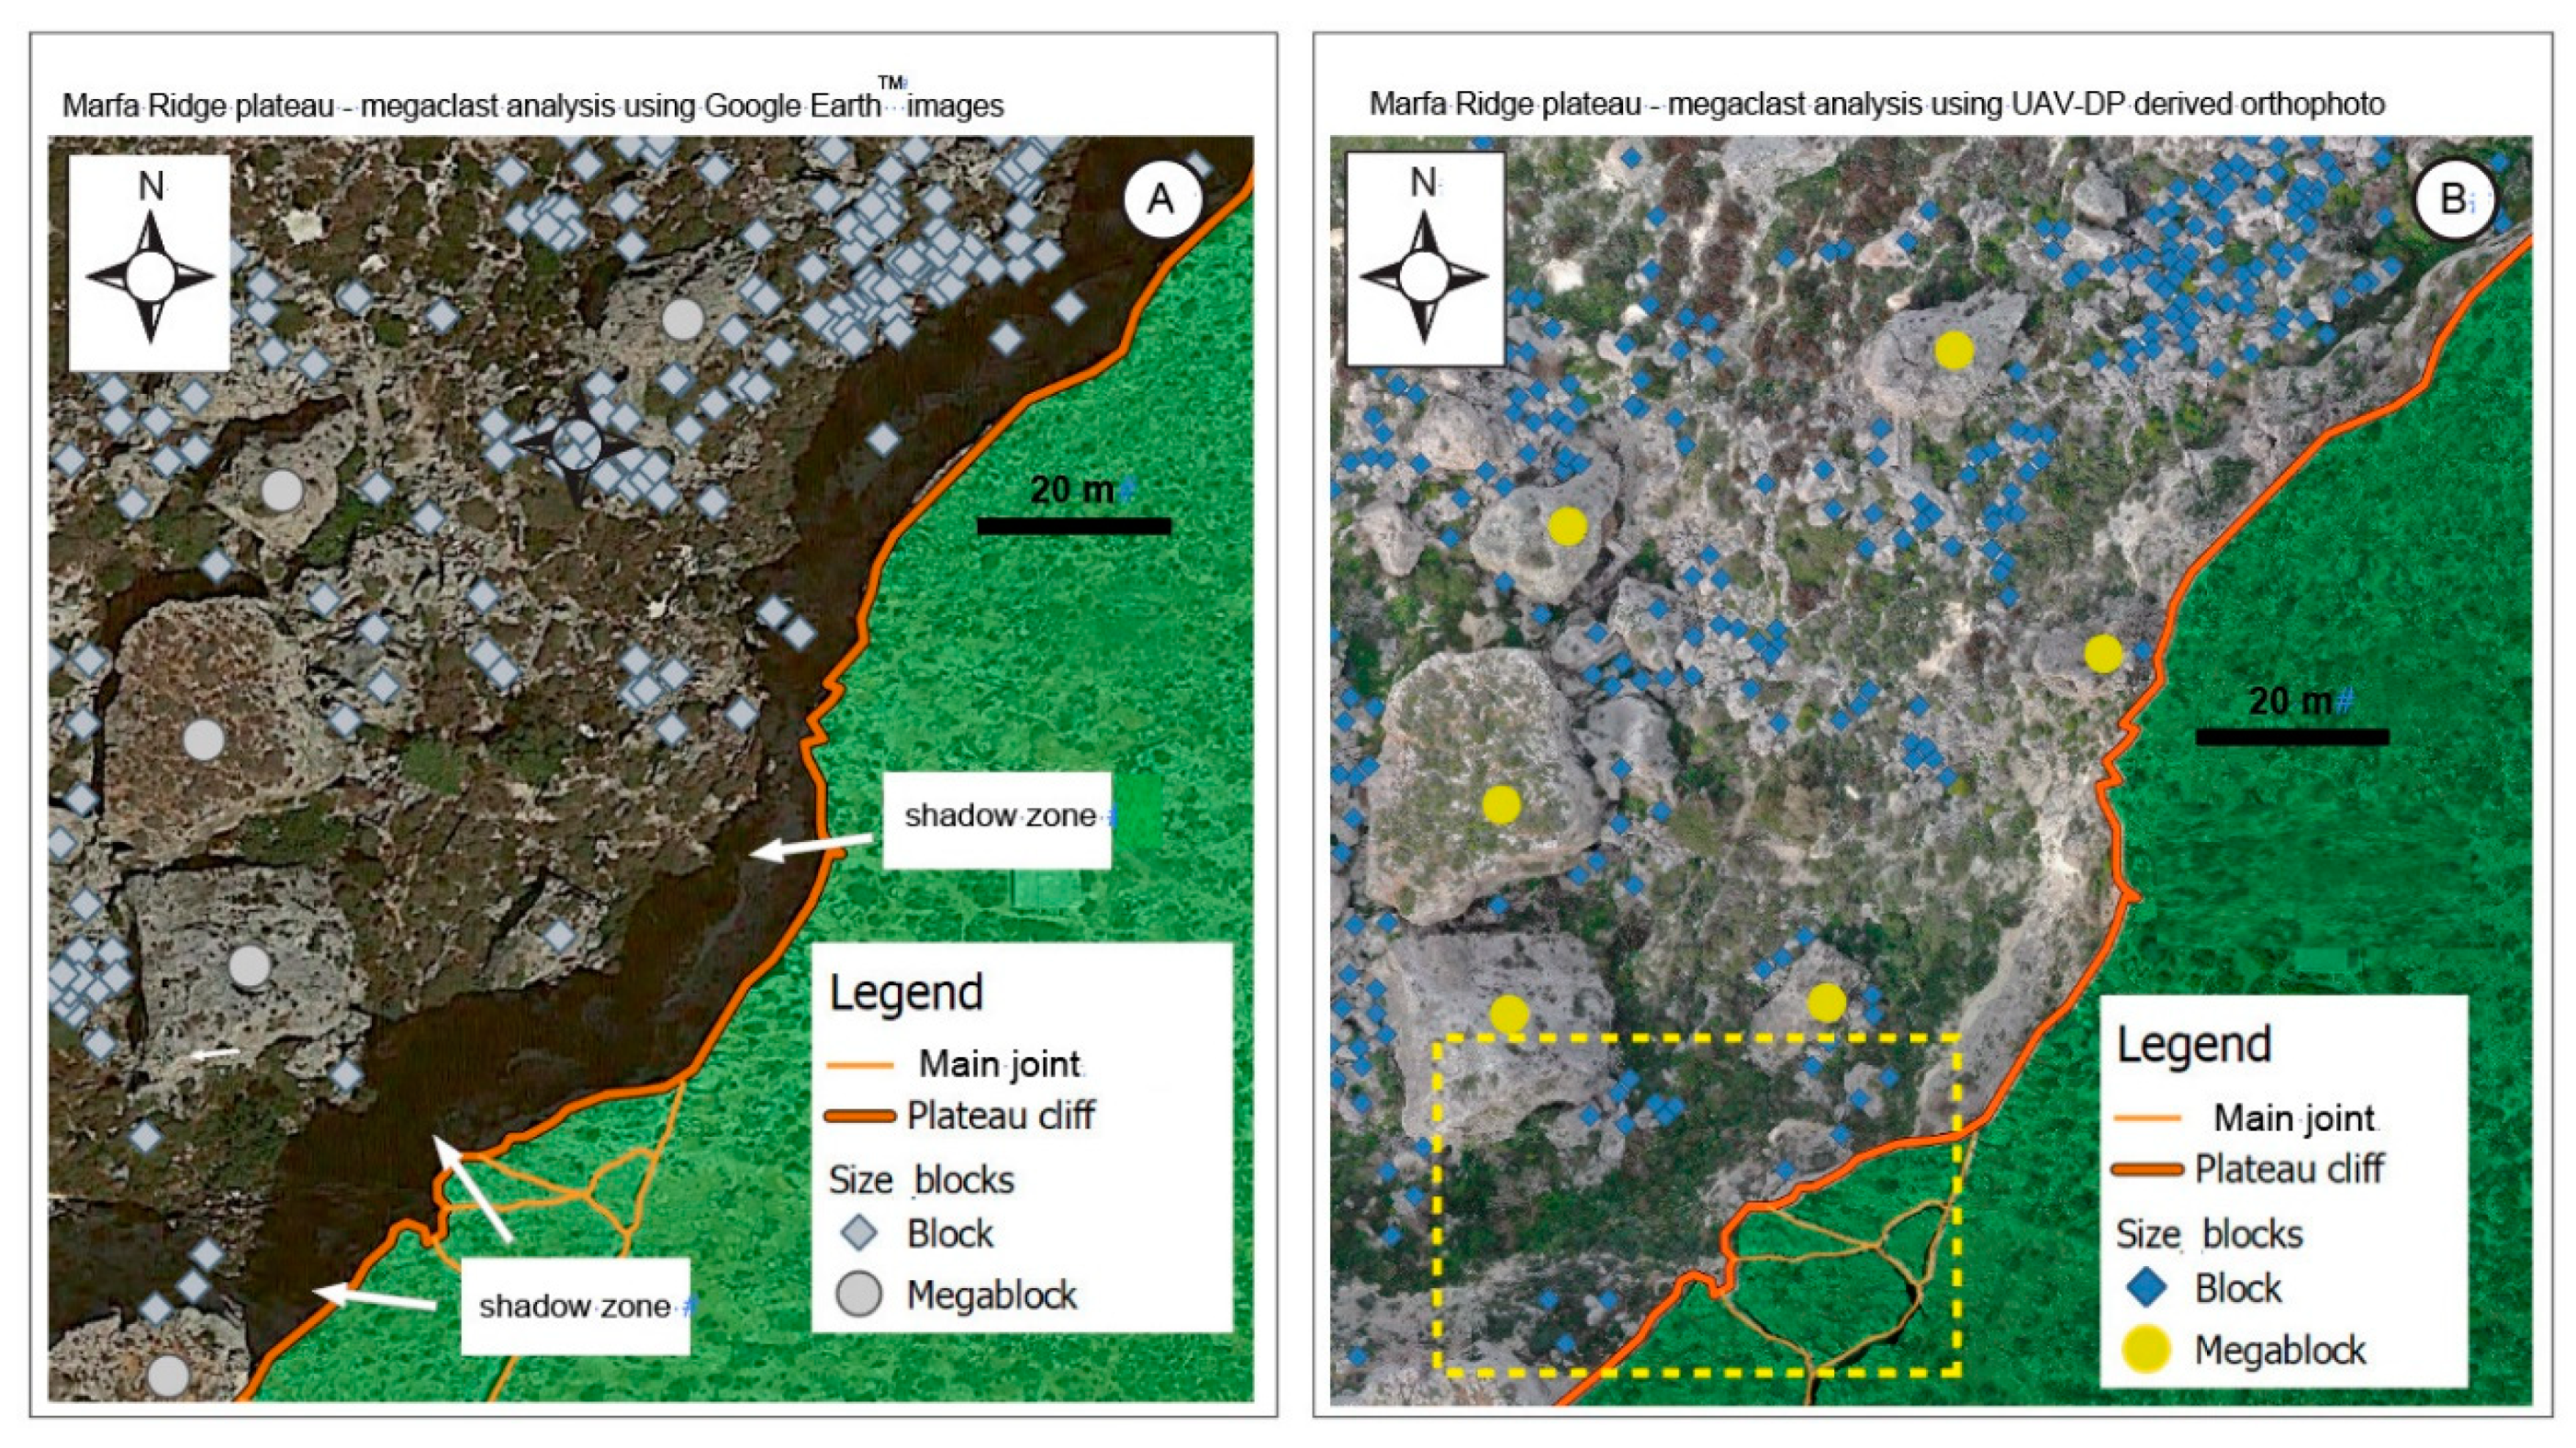
6.2. Coastal Megaclast Deposit Inventory and Categorization
7. Discussion
8. Conclusions
Author Contributions
Funding
Acknowledgments
Conflicts of Interest
Abbreviations
| GE | Google Earth |
| UAV | Uncrewed Aerial Vehicle |
| DP | Digital Photogrammetry |
| DGSD | Deep-seated Gravitational Slope Deformation |
| RPAS | Remotely Piloted Aircraft System |
| HR | High Resolution |
| VHR | Very High Resolution |
| DEMs | Digital Elevation Models |
| LiDAR | Light Detection And Ranging |
| ALS | Airborne Laser Scanning |
| TLS | Terrestrial Laser Scanning |
| LIM | Landslide Inventory Map |
| UCL | Upper Coralline Limestone Formation |
| BC | Blue Clays |
| GL | Globigerina Limestone Formation |
| LCL | Lower Coralline Limestone Formation |
| GNSS | Global Navigation Satellite System |
| A-DinSAR | Advanced SAR interferometric analysis |
| FS | Fast Static |
| UAS | Uncrewed Aircraft System |
| VL/MC | Very Light MultiCopter |
| MALE | Medium-Altitude Long-Endurance |
| HALE | High-Altitude Long-Endurance |
| VTOL | Vertical TakeOff and Landing |
References
- Bromhead, E.N. Large landslides in London Clay at Herne Bay, Kent. Q. J. Eng. Geol. Hydr. 1978, 11, 291–304. [Google Scholar] [CrossRef]
- Bromhead, E.N. Factors affecting the transition between the various types of mass movement in coastal cliffs consisting largely of overconsolidated clay with special reference to Southern England. Q. J. Eng. Geol. Hydr. 1979, 12, 291–300. [Google Scholar] [CrossRef]
- Dixon, N.; Bromhead, E.N. Landsliding in London Clay coastal cliffs. Q. J. Eng. Geol. Hydr. 2002, 35, 327–343. [Google Scholar] [CrossRef]
- Della Seta, M.; Martino, S.; Scarascia Mugnozza, G. Quaternary sea-level change and slope instability in coastal areas: Insights from the Vasto Landslide (Adriatic coast, central Italy). Geomorphology 2013, 201, 462–478. [Google Scholar] [CrossRef] [Green Version]
- Fenton, C.; Martin, P.; Cheng, F.; Murphy, B. Geomorphological Analysis of Large Scale Slope Instability, Trotternish, Isle of Skye. In Engineering Geology for Society and Territory; Lollino, G., Giordan, D., Crosta, G.B., Corominas, J., Azzam, R., Wasowski, J., Sciarra, N., Eds.; Springer: Cham, Switzerland, 2015; Volume 2, pp. 1037–1040. [Google Scholar]
- Lissak, C.; Maquaire, O.; Malet, J.-P.; Lavigne, F.; Virmoux, C.; Gomez, C.; Davidson, R. Ground-penetrating radar observations for estimating the vertical displacement of rotational landslides. Nat. Hazards Earth Syst. Sci. 2015, 15, 1399–1406. [Google Scholar] [CrossRef] [Green Version]
- Kavoura, K.; Konstantopoulou, M.; Depountis, N.; Sabatakakis, N. Slow-moving landslides: Kinematic analysis and movement evolution modeling. Environ. Earth Sci. 2020, 79, 130. [Google Scholar] [CrossRef]
- Prampolini, M.; Savini, A.; Foglini, F.; Soldati, M. Seven Good Reasons for Integrating Terrestrial and Marine Spatial Datasets in Changing Environments. Water 2020, 12, 2221. [Google Scholar] [CrossRef]
- Martino, S.; Mazzanti, P. Integrating geomechanical surveys and remote sensing for sea cliff slope stability analysis: The Mt. Pucci case study (Italy). Nat. Hazards Earth Syst. Sci. 2014, 14, 831–848. [Google Scholar] [CrossRef] [Green Version]
- Caso, I.; D’Angelo, R.; Palma, B.; Parise, M.; Ruocco, A. Landslide Susceptibility Maps in the Rock Slopes of Ventotene Island (Latium, Italy). In Engineering Geology for Society and Territory; Lollino, G., Giordan, D., Crosta, G.B., Corominas, J., Azzam, R., Wasowski, J., Sciarra, N., Eds.; Springer: Cham, Switzerland, 2015; Volume 2, pp. 941–945. [Google Scholar]
- Furlani, S.; Pappalardo, M.; Gómez-Pujol, L.; Chelli, A. The rock coast of the Mediterranean and Black seas. In Rock Coast Geomorphology: A Global Synthesis; Kennedy, D.M., Stephenson, W.J., Naylor, L.A., Eds.; Geological Society: London, UK, 2014; pp. 89–123. [Google Scholar]
- Furlani, S.; Piacentini, D.; Troiani, F.; Biolchi, S.; Roccheggiani, M.; Tamburini, A.; Tirincanti, E.; Vaccher, V.; Antonioli, F.; Devoto, S.; et al. Tidal notches (Tn) along the western Adriatic coast as markers of coastal stability during late Holocene. Geogr. Fis. Din. Quat. 2018, 41, 33–46. [Google Scholar]
- Calista, M.; Mascioli, F.; Menna, V.; Miccadei, E.; Piacentini, T. Recent Geomorphological Evolution and 3D Numerical Modelling of Soft Clastic Rock Cliffs in the Mid-Western Adriatic Sea (Abruzzo, Italy). Geosciences 2019, 9, 309. [Google Scholar] [CrossRef] [Green Version]
- Soldati, M.; Devoto, S.; Prampolini, M.; Pasuto, A. The Spectacular Landslide-Controlled Landscape of the Northwestern Coast of Malta. In Landscapes and Landforms of the Maltese Islands; Gauci, R., Schembri, J.A., Eds.; Springer: Cham, Switzerland, 2019; pp. 167–178. [Google Scholar]
- Mateos, R.M.; Ezquerro, P.; Azañón, J.M.; Gelabert, B.; Herrera, G.; Fernández-Merodo, J.A.; Spizzichino, D.; Sarro, R.; Garcia-Moreno, I.; Bejar-Pizarro, M. Coastal lateral spreading in the world heritage site of the Tramuntana Range (Majorca, Spain). The use of PSInSAR monitoring to identify vulnerability. Landslides 2018, 15, 797–809. [Google Scholar] [CrossRef]
- Carobene, L.; Cevasco, A. A large scale lateral spreading, its genesis and Quaternary evolution in the coastal sector between Cogoleto and Varazze (Liguria-Italy). Geomorphology 2011, 129, 398–411. [Google Scholar] [CrossRef]
- Ietto, F.; Perri, F.; Fortunato, G. Lateral spreading phenomena and weathering processes from the Tropea area (Calabria, southern Italy). Environ. Earth Sci. 2015, 73, 4595–4608. [Google Scholar] [CrossRef]
- Agnesi, A.; Rotigliano, E.; Tammaro, U.; Cappadonia, C.; Conoscenti, C.; Obrizzo, F.; Di Maggio, C.; Luzio, D.; Pingue, F. GPS Monitoring of the Scopello (Sicily, Italy) DGSD Phenomenon: Relationships Between Surficial and Deep-Seated Morphodynamics. In Engineering Geology for Society and Territory; Lollino, G., Giordan, D., Crosta, G.B., Corominas, J., Azzam, R., Wasowski, J., Sciarra, N., Eds.; Springer: Cham, Switzerland, 2015; Volume 2, pp. 1321–1325. [Google Scholar]
- Prampolini, M.; Gauci, C.; Micallef, A.S.; Selmi, L.; Vandelli, V.; Soldati, M. Geomorphology of the north-eastern coast of Gozo (Malta, Mediterranean Sea). J. Maps 2018, 14, 402–410. [Google Scholar] [CrossRef]
- Furlani, S.; Gauci, R.; Devoto, S.; Schembri, J.A. Fifla: A Case Study of the Effect of Target Practice on Coastal Landforms. In Landscapes and Landforms of the Maltese Islands; Gauci, R., Schembri, J.A., Eds.; Springer: Cham, Switzerland, 2019; pp. 261–271. [Google Scholar]
- Pasuto, A.; Soldati, M. Rock Spreading. In Landslide Recognition: Identification, Movement and Courses; Dikau, R., Brunsden, D., Schrott, L., Ibsen, M.-L., Eds.; Wiley: Chichester, UK, 1996; pp. 122–136. [Google Scholar]
- Bozzano, F.; Bretschneider, A.; Esposito, C.; Martino, S.; Prestininzi, A.; Scarascia Mugnozza, G. Lateral spreading processes in mountain ranges: Insights from an analogue modelling experiment. Tectonophysics 2013, 605, 88–95. [Google Scholar] [CrossRef]
- Soldati, M. Deep-seated gravitational slope deformation. In Encyclopedia of Geomorphology, 1st ed.; Goudie, A.S., Ed.; Routledge: London, UK, 2004; pp. 226–228. [Google Scholar]
- Pánek, T.; Klimeš, J. Temporal behavior of deep-seated gravitational slope deformations: A review. Earth Sci. Rev. 2016, 156, 14–38. [Google Scholar] [CrossRef]
- Morelli, S.; Pazzi, V.; Frodella, W.; Fanti, R. Kinematic Reconstruction of a Deep-Seated Gravitational Slope Deformation by Geomorphic Analyses. Geosciences 2018, 8, 26. [Google Scholar] [CrossRef] [Green Version]
- Ibsen, M.-L.; Brunsden, D.; Bromhead, E.; Collison, A. Block Slide. In Landslide Recognition: Identification, Movement and Courses; Dikau, R., Brunsden, D., Schrott, L., Ibsen, M.-L., Eds.; Wiley: Chichester, UK, 1996; pp. 64–77. [Google Scholar]
- Berov, B.; Ivanov, P.; Dobrev, N.; Nankin, R.; Krastonov, M. State of the Art for Landslides Along the North Bulgarian Black Sea Coast. In Landslide Science and Practice; Margottini, C., Canuti, P., Sassa, K., Eds.; Springer: Berlin/Heidelberg, Germany, 2013; Volume 5, pp. 97–102. [Google Scholar]
- Piras, M.; Taddia, G.; Forno, M.G.; Gattiglio, M.; Aicardi, I.; Dabove, P.; Lo Russo, S.; Lingua, A. Detailed geological mapping in mountain areas using an unmanned aerial vehicle: Application to the Rodoretto Valley, NW Italian Alps. Geomat. Nat. Haz. Risk 2017, 8, 137–149. [Google Scholar] [CrossRef]
- Giordan, D.; Hayakawa, Y.; Nex, F.; Remondino, F.; Tarolli, P. Review article: The use of remotely piloted aircraft systems (RPASs) for natural hazards monitoring and management. Nat. Hazards Earth Syst. Sci. 2018, 18, 1079–1096. [Google Scholar] [CrossRef] [Green Version]
- Giordan, D.; Adams, M.S.; Aicardi, I.; Alicandro, M.; Allasia, P.; Baldo, M.; De Berardinis, P.; Dominici, D.; Godone, D.; Hobbs, P.; et al. The use of unmanned aerial vehicles (UAVs) for engineering geology applications. Bull. Eng. Geol. Environ. 2020, 79, 3437–3481. [Google Scholar] [CrossRef] [Green Version]
- Francioni, M.; Salvini, R.; Stead, D.; Coggan, J. Improvements in the integration of remote sensing and rock slope modelling. Nat. Hazards 2018, 90, 975–1004. [Google Scholar] [CrossRef] [Green Version]
- Jaboyedoff, M.; Oppikofer, T.; Abellan, A.; Derron, M.H.; Loye, A.; Metzger, R.; Pedrazzini, A. Use of LIDAR in landslide investigations: A review. Nat. Hazards 2012, 61, 5–28. [Google Scholar] [CrossRef] [Green Version]
- Lan, H.; Martin, C.D.; Zhou, C.; Lim, C.H. Rockfall hazard analysis using LiDAR and spatial modeling. Geomorphology 2010, 118, 213–223. [Google Scholar] [CrossRef]
- Yao, H.; Qin, R.; Chen, X. Unmanned Aerial Vehicle for Remote Sensing Applications-A Review. Remote Sens. 2019, 11, 1443. [Google Scholar] [CrossRef] [Green Version]
- Lucieer, A.; De Jong, S.M.; Turner, D. Mapping landslide displacements using Structure from Motion (SfM) and image correlation of multi-temporal UAV photography. Prog. Phys. Geogr. Earth Environ. 2014, 38, 97–116. [Google Scholar] [CrossRef]
- Turner, D.; Lucieer, A.; De Jong, S.M. Time Series Analysis of Landslide Dynamics Using an Unmanned Aerial Vehicle (UAV). Remote Sens. 2015, 7, 1736–1757. [Google Scholar] [CrossRef] [Green Version]
- Menegoni, N.; Giordan, D.; Perotti, C.; Tannant, D.D. Detection and geometric characterization of rock mass discontinuities using a 3D high-resolution digital outcrop model generated from RPAS imagery-Ormea rock slope, Italy. Eng. Geol. 2019, 252, 145–163. [Google Scholar] [CrossRef]
- Barlow, J.; Gilham, J.; Ibarra Cofra, I. Kinematic analysis of sea cliff stability using UAV photogrammetry. Int. J. Remote Sens. 2017, 38, 2464–2479. [Google Scholar] [CrossRef]
- Devoto, S. Cartografia, Monitoraggio e Modellizzazione di Frane Lungo la Costa Nord-Occidentale Dell’isola di Malta. Ph.D. Thesis, University of Modena and Reggio Emilia, Modena, Italy, 3 April 2013. [Google Scholar]
- Devoto, S.; Biolchi, S.; Bruschi, V.M.; Furlani, S.; Mantovani, M.; Piacentini, D.; Pasuto, A.; Soldati, M. Geomorphological map of the NW Coast of the Island of Malta (Mediterranean Sea). J. Maps 2012, 8, 33–40. [Google Scholar] [CrossRef]
- Soldati, M.; Maquaire, O.; Zezere, J.L.; Piacentini, D.; Lissak, C. Coastline at Risk: Methods for Multi-Hazard Assessment. J. Coast. Res. 2011, 61, 335–339. [Google Scholar] [CrossRef]
- Biolchi, S.; Furlani, S.; Devoto, S.; Gauci, R.; Castaldini, D.; Soldati, M. Geomorphological identification, classification and spatial distribution of coastal landforms of Malta (Mediterranean Sea). J. Maps 2016, 12, 87–99. [Google Scholar] [CrossRef] [Green Version]
- Main, G.; Schembri, J.; Gauci, R.; Crawford, K.; Chester, D.; Duncan, A. The hazard exposure of the Maltese Islands. Nat. Hazards 2018, 92, 829–855. [Google Scholar] [CrossRef]
- Alexander, D. A review of the physical geography of Malta and its significance for tectonic geomorphology. Quat. Sci. Rev. 1988, 7, 41–53. [Google Scholar] [CrossRef]
- Pedley, M.; Clarke, M.H. Limestone Isles in a Crystal Sea: The Geology of the Maltese Islands; Publishers Enterprises Group: San Gwann, Malta, 2002. [Google Scholar]
- Gauci, R.; Scerri, S. A Synthesis of Different Geomorphological Landscapes on the Maltese Islands. In Landscapes and Landforms of the Maltese Islands; Gauci, R., Schembri, J.A., Eds.; Springer: Cham, Switzerland, 2019; pp. 49–65. [Google Scholar]
- Baldassini, N.; Di Stefano, A. Stratigraphic features of the Maltese Archipelago: A synthesis. Nat. Hazards 2017, 86, 203–231. [Google Scholar] [CrossRef]
- Scerri, S. Sedimentary Evolution and Resultant Geological Landscapes. In Landscapes and Landforms of the Maltese Islands; Gauci, R., Schembri, J.A., Eds.; Springer: Cham, Switzerland, 2019; pp. 31–47. [Google Scholar]
- Devoto, S.; Biolchi, S.; Bruschi, V.M.; Díez, A.G.; Mantovani, M.; Pasuto, A.; Piacentini, D.; Schembri, J.A.; Soldati, M. Landslides Along the North-West Coast of the Island of Malta. In Landslide Science and Practice; Margottini, C., Canuti, P., Sassa, K., Eds.; Springer: Berlin/Heidelberg, Germany, 2013; Volume 1, pp. 57–63. [Google Scholar]
- Cruden, D.M.; Varnes, D.J. Landslide Types and Processes. Spec. Rep. Natl. Acad. Sci. Transp. Res. Board 1996, 247, 36–75. [Google Scholar]
- Prampolini, M.; Foglini, F.; Biolchi, S.; Devoto, S.; Angelini, S.; Soldati, M. Geomorphological mapping of terrestrial and marine areas, northern Malta and Comino (central Mediterranean Sea). J. Maps 2017, 13, 457–469. [Google Scholar] [CrossRef]
- Soldati, M.; Barrows, T.T.; Prampolini, M.; Fifield, K.L. Cosmogenic exposure dating constraints for coastal landslide evolution on the Island of Malta (Mediterranean Sea). J. Coast. Conserv. 2018, 22, 831–844. [Google Scholar] [CrossRef] [Green Version]
- Prampolini, M.; Foglini, F.; Micallef, A.; Soldati, M.; Taviani, M. Malta’s Submerged Landscapes and Landforms. In Landscapes and Landforms of the Maltese Islands; Gauci, R., Schembri, J.A., Eds.; Springer: Cham, Switzerland, 2019; pp. 117–128. [Google Scholar]
- Furlani, S.; Antonioli, F.; Biolchi, S.; Gambin, T.; Gauci, R.; Lo Presti, V.; Anzidei, M.; Devoto, S.; Palombo, M.; Sulli, A. Holocene sea level change in Malta. Quat. Int. 2013, 288, 146–157. [Google Scholar] [CrossRef]
- Bruno, D.E.; Ruban, D.A. Something more than boulders: A geological comment on the nomenclature of megaclasts on extraterrestrial bodies. Planet. Space Sci. 2017, 135, 37–42. [Google Scholar] [CrossRef]
- Pasuto, A.; Soldati, M. Lateral Spreading. In Treatise on Geomorphology; Shroder, J.F., Ed.; Academic Press: San Diego, CA, USA, 2013; Volume 7, pp. 239–248. [Google Scholar]
- Dykes, A.P. Mass movements and conservation management in Malta. J. Environ. Manag. 2002, 66, 77–89. [Google Scholar] [CrossRef]
- Magri, O.; Mantovani, M.; Pasuto, A.; Soldati, M. Geomorphological investigation and monitoring of lateral spreading along the north-west coast of Malta. Geogr. Fisica Din. Quat. 2008, 31, 171–180. [Google Scholar]
- Devoto, S.; Forte, E.; Mantovani, M.; Mocnik, A.; Pasuto, A.; Piacentini, D.; Soldati, M. Integrated Monitoring of Lateral Spreading Phenomena Along the North-West Coast of the Island of Malta. In Landslide Science and Practice; Margottini, C., Canuti, P., Sassa, K., Eds.; Springer: Berlin/Heidelberg, Germany, 2013; Volume 2, pp. 235–241. [Google Scholar]
- Mantovani, M.; Devoto, S.; Forte, E.; Mocnik, A.; Pasuto, A.; Piacentini, D.; Soldati, M. A multidisciplinary approach for rock spreading and block sliding investigation in the north-western coast of Malta. Landslides 2013, 10, 611–622. [Google Scholar] [CrossRef]
- Mantovani, M.; Devoto, S.; Piacentini, D.; Prampolini, M.; Soldati, M.; Pasuto, A. Advanced SAR Interferometric Analysis to Support Geomorphological Interpretation of Slow-Moving Coastal Landslides (Malta, Mediterranean Sea). Remote Sens. 2016, 8, 443. [Google Scholar] [CrossRef] [Green Version]
- Piacentini, D.; Devoto, S.; Mantovani, M.; Pasuto, A.; Prampolini, M.; Soldati, M. Landslide susceptibility modeling assisted by Persistent Scatterers Interferometry (PSI): An example from the northwestern coast of Malta. Nat. Hazards 2015, 78, 681–697. [Google Scholar] [CrossRef] [Green Version]
- Selmi, L.; Coratza, P.; Gauci, R.; Soldati, M. Geoheritage as a Tool for Environmental Management: A Case Study in Northern Malta (Central Mediterranean Sea). Resources 2019, 8, 168. [Google Scholar] [CrossRef] [Green Version]
- Coratza, P.; Bruschi, V.M.; Piacentini, D.; Saliba, D.; Soldati, M. Recognition and Assessment of Geomorphosites in Malta at the Il-Majjistral Nature and History Park. Geoheritage 2011, 3, 175–185. [Google Scholar] [CrossRef] [Green Version]
- Cappadonia, C.; Coratza, P.; Agnesi, V.; Soldati, M. Malta and Sicily Joined by Geoheritage Enhancement and Geotourism within the Framework of Land Management and Development. Geosciences 2018, 8, 253. [Google Scholar] [CrossRef] [Green Version]
- Role’, A. Landforms and Processes at Il-Majjistral Park and Its Environs. In Landscapes and Landforms of the Maltese Islands; Gauci, R., Schembri, J.A., Eds.; Springer: Cham, Switzerland, 2019; pp. 305–316. [Google Scholar]
- Eltner, A.; Kaiser, A.; Castillo, C.; Rock, G.; Neugirg, F.; Abellán, A. Image-based surface reconstruction in geomorphometry—merits, limits and developments. Earth Surf. Dynam. 2016, 4, 359–389. [Google Scholar] [CrossRef] [Green Version]
- Brooke-Holland, L. Unmanned Aerial Vehicles (Drones): An Introduction; House of Commons Library: London, UK, 2012. [Google Scholar]
- Watts, A.C.; Ambrosia, V.G.; Hinkley, E.A. Unmanned Aircraft Systems in Remote Sensing and Scientific Research: Classification and Considerations of Use. Remote Sens. 2012, 4, 1671–1692. [Google Scholar] [CrossRef] [Green Version]
- Hassanalian, M.; Abdelkefi, A. Classifications, applications, and design challenges of drones: A review. Prog. Aerosp. Sci. 2017, 91, 99–131. [Google Scholar] [CrossRef]
- James, M.R.; Robson, S. Straightforward reconstruction of 3D surfaces and topography with a camera: Accuracy and geoscience application. J. Geophys. Res. Earth Surf. 2012, 117, F03017. [Google Scholar] [CrossRef] [Green Version]
- Nocerino, E.; Menna, F.; Remondino, F.; Saleri, R. Accuracy and block deformation analysis in automatic UAV and terrestrial photogrammetry—Lesson learnt. ISPRS Ann. Photogramm. Remote Sens. Spatial Inf. Sci. 2013, II-5/W1, 203–208. [Google Scholar] [CrossRef] [Green Version]
- Agisoft Metashape User Manual. Available online: https://www.agisoft.com/pdf/metashape-pro_1_6_en.pdf (accessed on 27 September 2020).
- Nouwakpo, S.K.; Weltz, M.A.; McGwire, K. Assessing the performance of structure-from-motion photogrammetry and terrestrial LiDAR for reconstructing soil surface microtopography of naturally vegetated plots. Earth Surf. Process. Landf. 2016, 41, 308–322. [Google Scholar] [CrossRef]
- Vasuki, Y.; Holden, E.-J.; Kovesi, P.; Micklethwaite, S. Semi-automatic mapping of geological Structures using UAV-based photogrammetric data: An image analysis approach. Comput. Geosci. 2014, 69, 22–32. [Google Scholar] [CrossRef]
- ISRM. International society for rock mechanics commission on standardization of laboratory and field tests: Suggested methods for the quantitative description of discontinuities in rock masses. Int. J. Rock Mech. Min. Sci. Geomech. Abstr. 1978, 15, 319–368. [Google Scholar] [CrossRef]
- Casagli, N.; Frodella, W.; Morelli, S.; Tofani, V.; Ciampalini, A.; Intrieri, E.; Raspini, F.; Rossi, G.; Tanteri, L.; Lu, P. Spaceborne, UAV and ground-based remote sensing techniques for landslide mapping, monitoring and early warning. Geoenviron. Disasters 2017, 4, 9. [Google Scholar] [CrossRef]
- Schembri, P.J. The Maltese Islands: Climate, vegetation and landscape. Geojournal 1997, 41, 115–125. [Google Scholar] [CrossRef]
- Sharifzadeh, M.; Mitani, Y.; Esaki, T. Rock Joint Surfaces Measurement and Analysis of Aperture Distribution under Different Normal and Shear Loading using GIS. Rock. Mech. Rock Engng. 2008, 41, 299–323. [Google Scholar] [CrossRef]
- Ruban, D.A. Finding Coastal Megaclast Deposits: A Virtual Perspective. J. Mar. Sci. Eng. 2020, 8, 164. [Google Scholar] [CrossRef] [Green Version]
- Menegoni, N.; Giordan, D.; Perotti, C. Reliability and Uncertainties of the Analysis of an Unstable Rock Slope Performed on RPAS Digital Outcrop Models: The case of the Gallivaggio Landslide (Western Alps, Italy). Remote Sens. 2020, 12, 1635. [Google Scholar] [CrossRef]


| Weight [kg] | Size [mm] | Max Speed [km/h] | Flight Time [min] | Ground Resolution (100 m–48 mm) | Max Mapped Surface (1.9 m/pix–80% Overlap) |
|---|---|---|---|---|---|
| 0.905 | 322 × 242 × 84 | 72 | ~30 | 0.019 m/pix | 0.1 km2 |
| Type | Weight Range [kg] |
|---|---|
| Nano drones | 0–0.2 |
| Micro drones | 0.2–2 |
| Mini drones | 2–20 |
| Small drones | 20–150 |
| Tactical drones | 150–1500 |
| MALE, HALE, strike drones | >1500 |
| Site | Flight Time [min] | Picture [#] | Area Coverage [m2] | Covered Flight Distance [km] | Dense Cloud Model Point Count | 3D Model Face Count |
|---|---|---|---|---|---|---|
| Marfa Ridge | 37 | 838 | 698,769 | 12.2 | 90,370,838 | 18,367,407 |
| Anchor Bay | 13 | 332 | 246,980 | 3.6 | 64,553,718 | 12,910,687 |
| Ras Il-Wahx | 69 | 764 | 671,447 | 18.6 | 189,249,228 | 11,667,442 |
| Il-Qarraba | 36 | 886 | 267,656 | 9.7 | 142,510,544 | 9,464,093 |
| Type | Joint Length [m] |
|---|---|
| Very low persistence | <1 |
| Low persistence | 1–3 |
| Medium persistence | 3–10 |
| High persistence | 10–20 |
| Very high persistence | >20 |
| Description | Width of Aperture |
|---|---|
| Very tight | <0.1 mm |
| Tight | 0.1–0.25 mm |
| Partly open | 0.25–0.5 mm |
| Open | 0.5–2.5 mm |
| Moderately wide | 2.5–10 mm |
| Wide | Over 10 mm |
| Very wide | 1–10 cm |
| Extremely wide | 10 cm–1 m |
| Cavernous | >1 m |
| Location | Block | Megablock | Superblock |
|---|---|---|---|
| Marfa Ridge | 1448 | 68 | - |
| Anchor Bay | 479 | 23 | - |
| Ras Il-Wahx | 968 | 100 | 4 |
| Il-Qarraba | 1861 | 108 | - |
| Joint [#] | Location | Orientation | Persistence [m] | Max Aperture [m] |
|---|---|---|---|---|
| 1 | Marfa Ridge | NW-SE | 158 | 0.75 |
| 2 | Anchor Bay | NW-SE | 86 | 1.14 |
| 3 | Anchor Bay | W-E | 109 | 3.25 |
| 4 | Anchor Bay | W-E | 53 | 0.49 |
| 5 | Anchor Bay | W-E | 34 | 0.98 |
| 6 | Ras Il-Wahx | NW-SE | 57 | 2.03 |
| 7 | Ras Il-Wahx | NW-SE | 16 | 0.64 |
| Location | Block | Megablock | Superblock |
|---|---|---|---|
| Marfa Ridge | 3369 | 88 | - |
| Anchor Bay | 760 | 42 | - |
| Ras Il-Wahx | 1008 | 108 | 4 |
| Il-Qarraba | 3439 | 125 | - |
Publisher’s Note: MDPI stays neutral with regard to jurisdictional claims in published maps and institutional affiliations. |
© 2020 by the authors. Licensee MDPI, Basel, Switzerland. This article is an open access article distributed under the terms and conditions of the Creative Commons Attribution (CC BY) license (http://creativecommons.org/licenses/by/4.0/).
Share and Cite
Devoto, S.; Macovaz, V.; Mantovani, M.; Soldati, M.; Furlani, S. Advantages of Using UAV Digital Photogrammetry in the Study of Slow-Moving Coastal Landslides. Remote Sens. 2020, 12, 3566. https://0-doi-org.brum.beds.ac.uk/10.3390/rs12213566
Devoto S, Macovaz V, Mantovani M, Soldati M, Furlani S. Advantages of Using UAV Digital Photogrammetry in the Study of Slow-Moving Coastal Landslides. Remote Sensing. 2020; 12(21):3566. https://0-doi-org.brum.beds.ac.uk/10.3390/rs12213566
Chicago/Turabian StyleDevoto, Stefano, Vanja Macovaz, Matteo Mantovani, Mauro Soldati, and Stefano Furlani. 2020. "Advantages of Using UAV Digital Photogrammetry in the Study of Slow-Moving Coastal Landslides" Remote Sensing 12, no. 21: 3566. https://0-doi-org.brum.beds.ac.uk/10.3390/rs12213566