RCSANet: A Full Convolutional Network for Extracting Inland Aquaculture Ponds from High-Spatial-Resolution Images

 , ,
, ,
Abstract
:
1. Introduction
- (1)
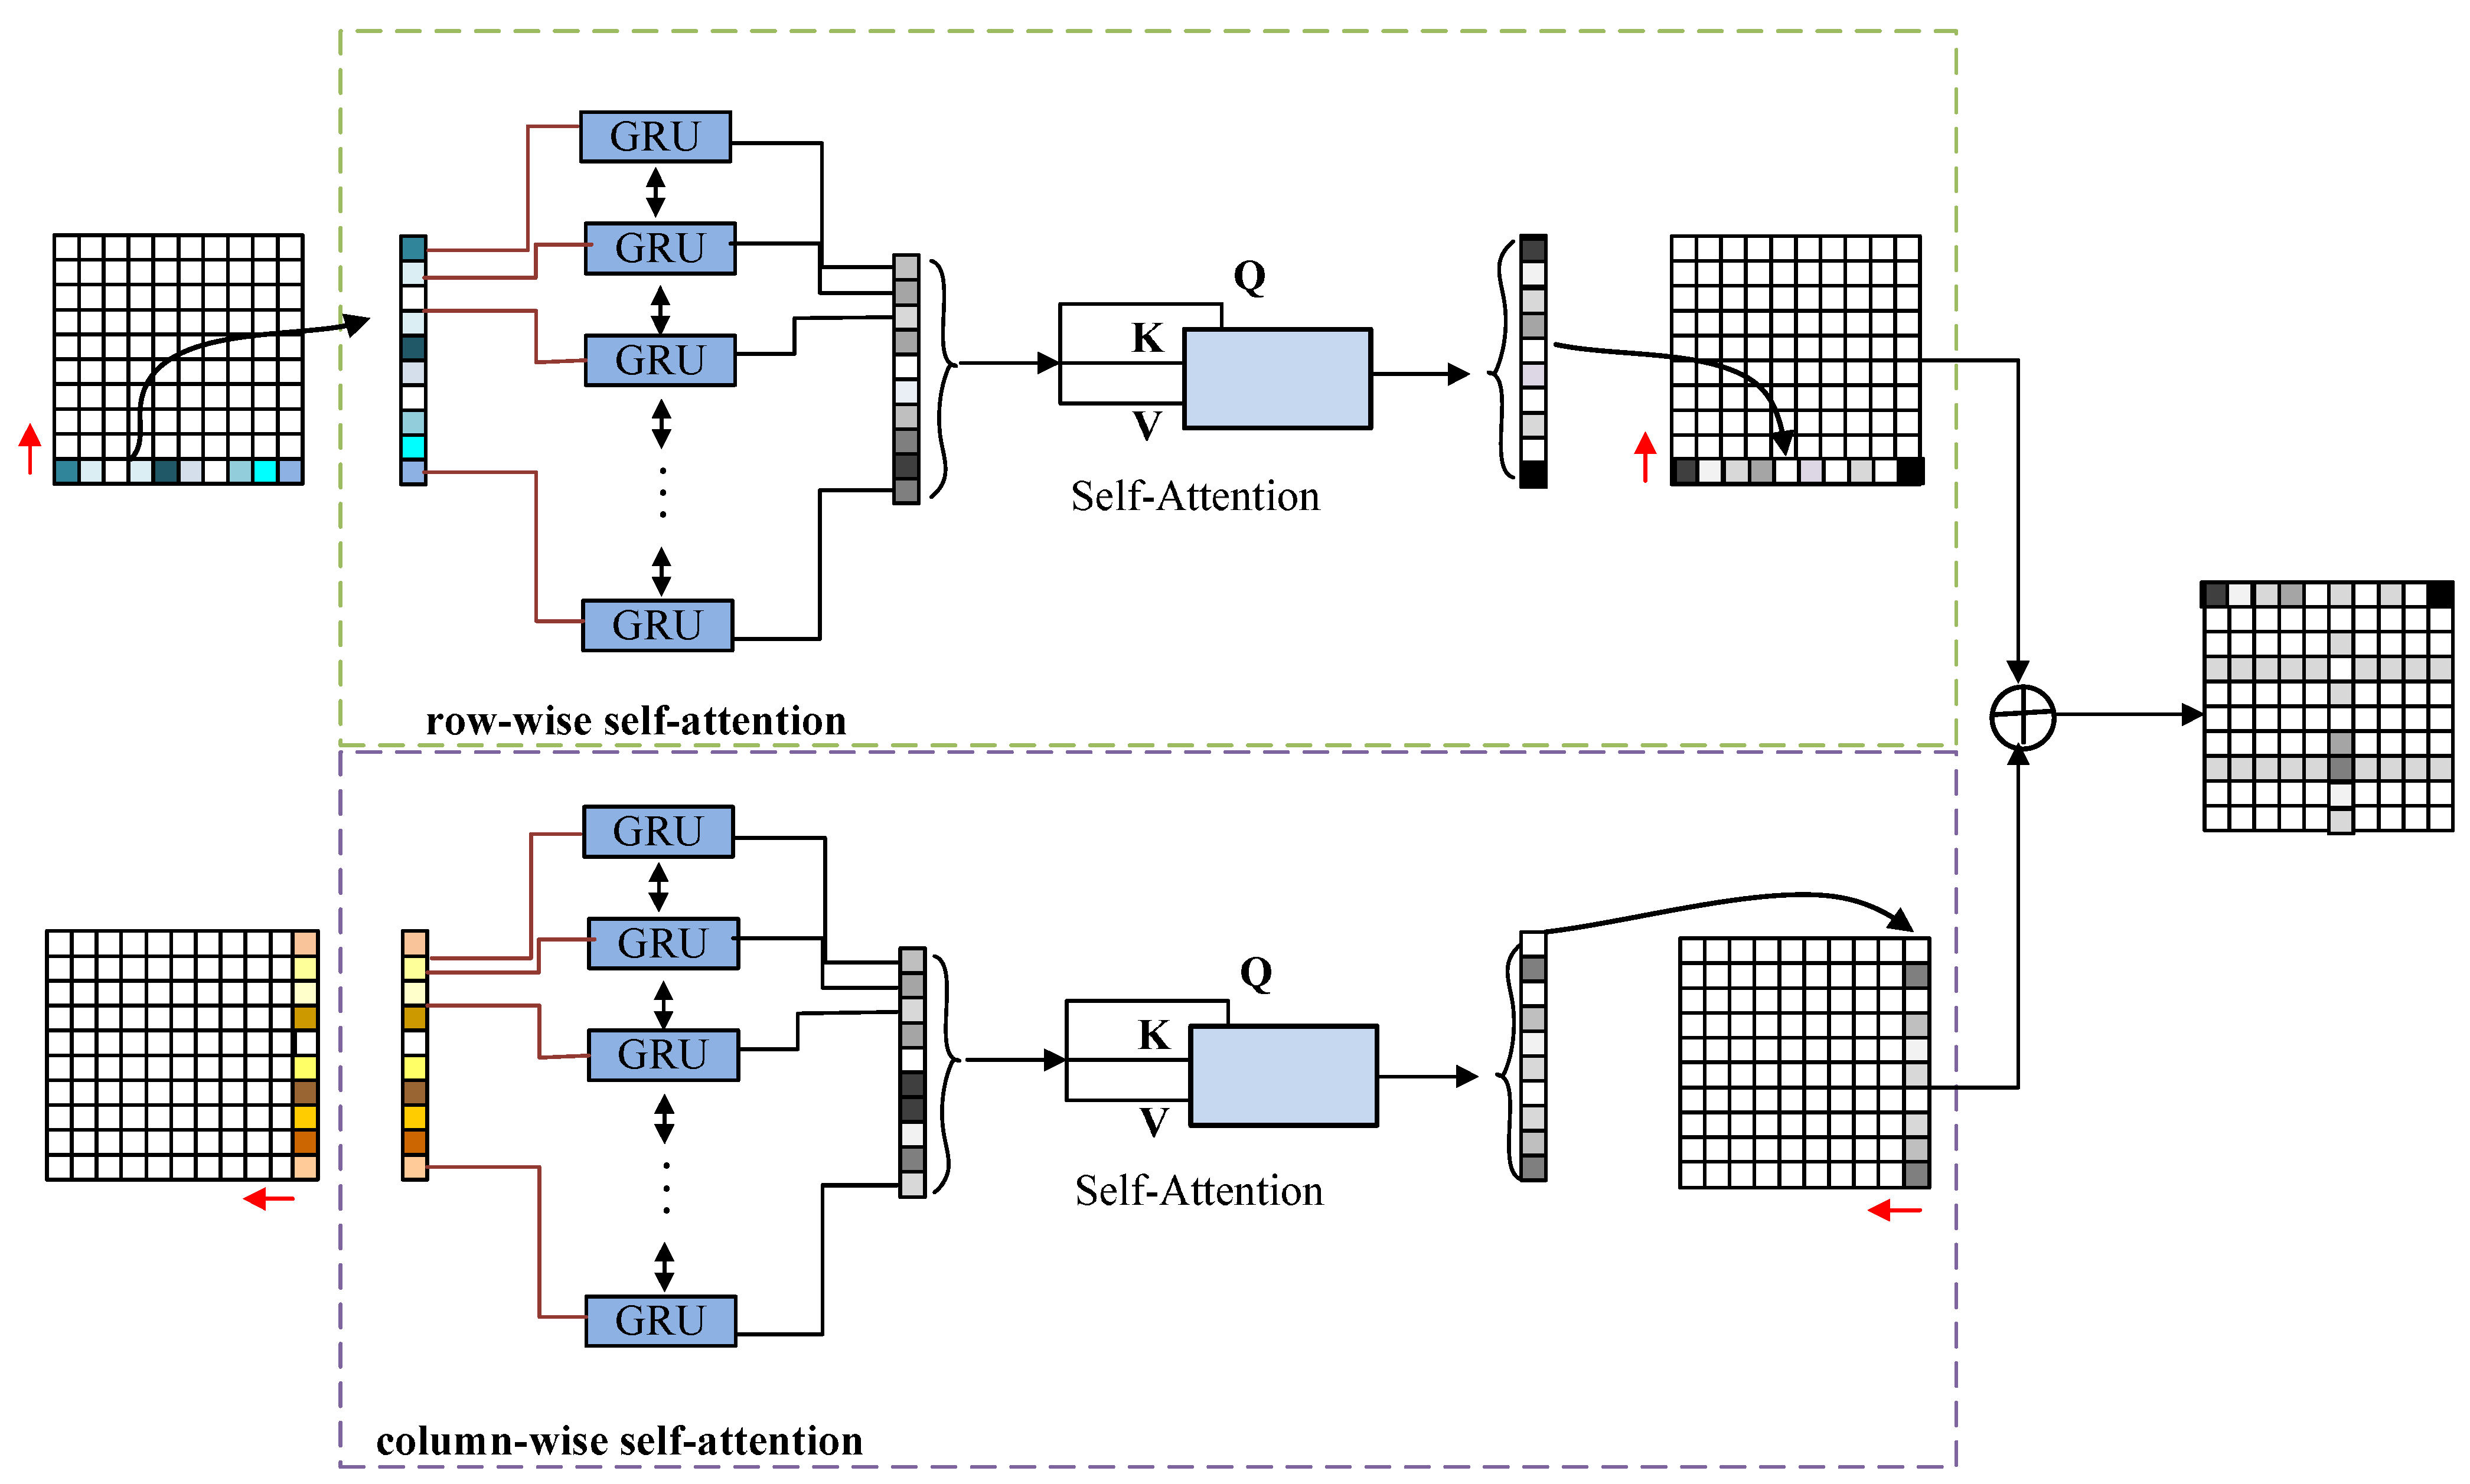
- Propose the Row-wise and Column-wise Self-Attention (RCSA) mechanism, which can work in parallel to capture visual emphasis on salient pixels in the context of rows and columns from a remote-sensing image.
- (2)
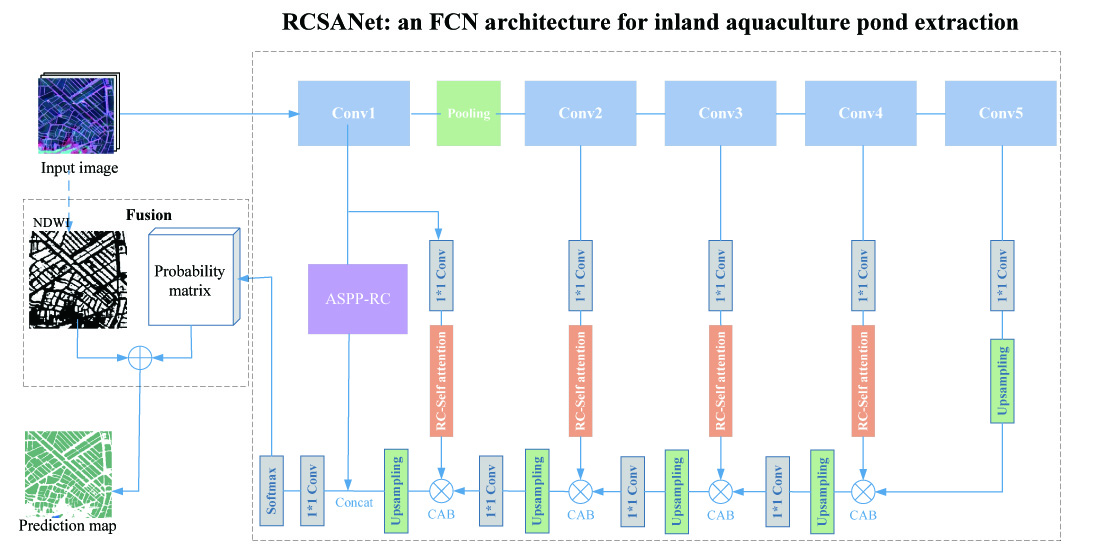
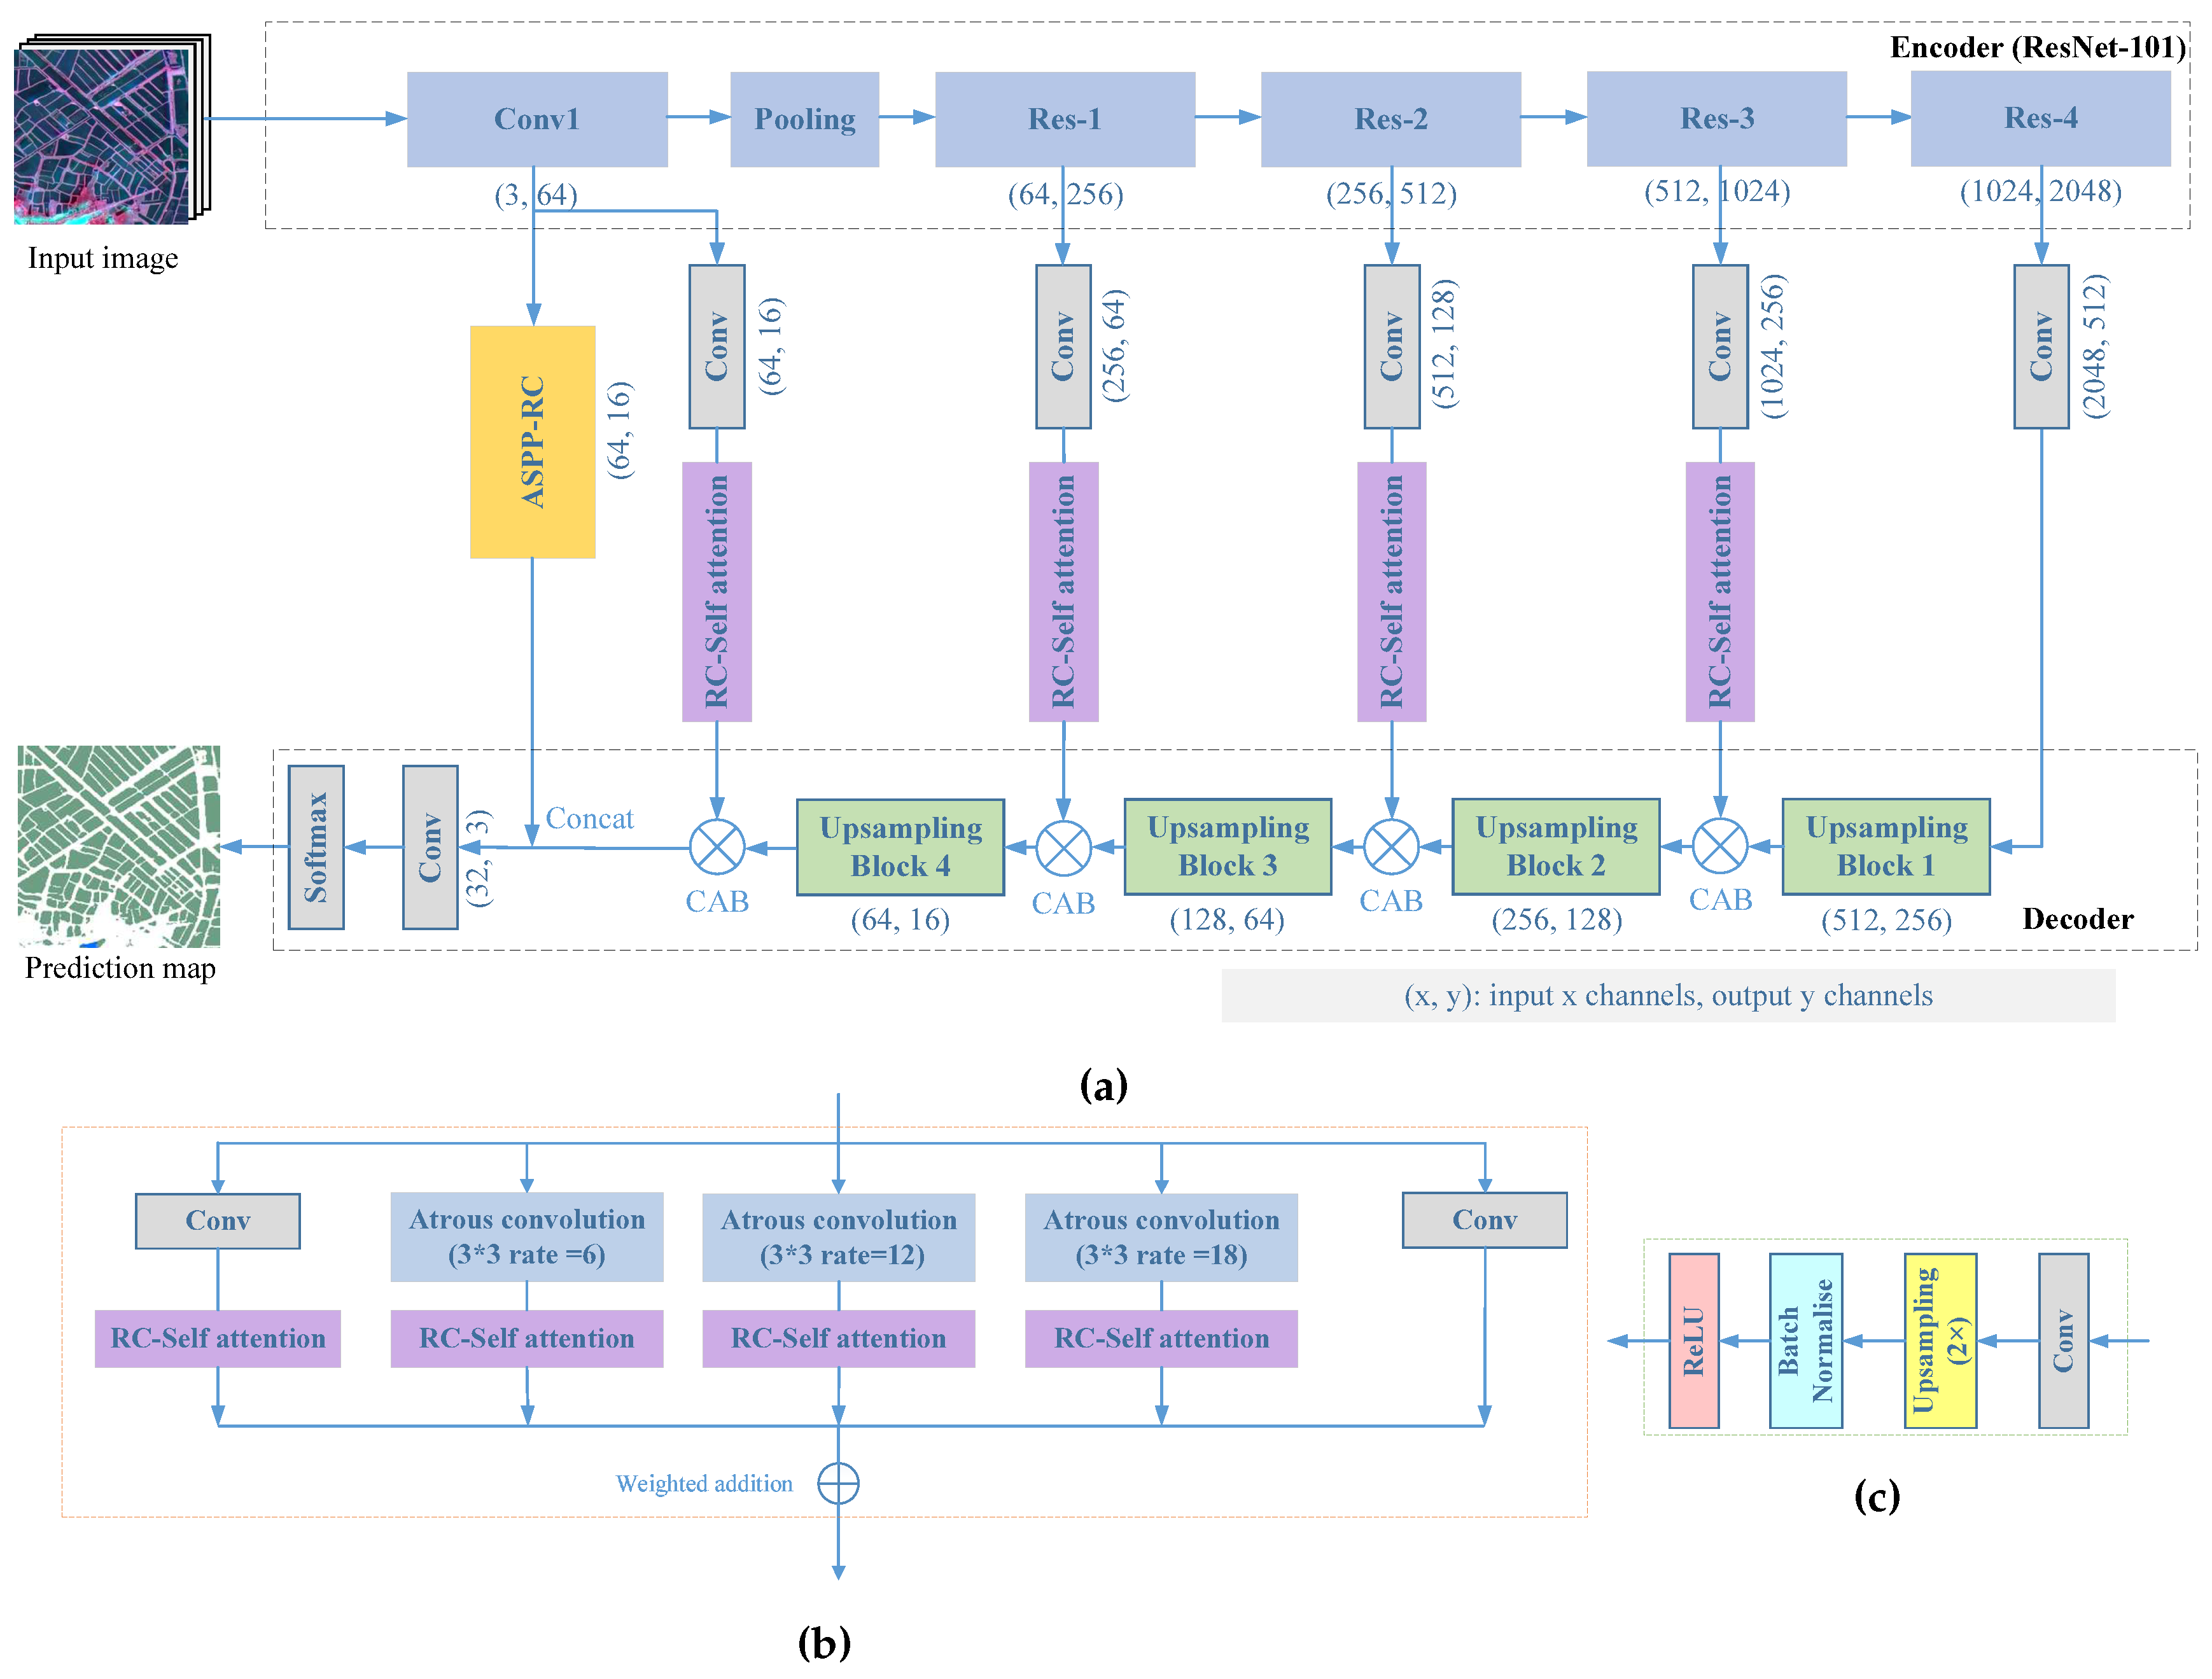
- Propose an improved fully convolutional network based on the RCSA mechanism that is combined with an ASPP structure for multi-scale attention.
- (3)
- Evaluate the validity of the proposed method on a developed dataset that contains abundant aquaculture ponds around inland lakes.
2. Materials
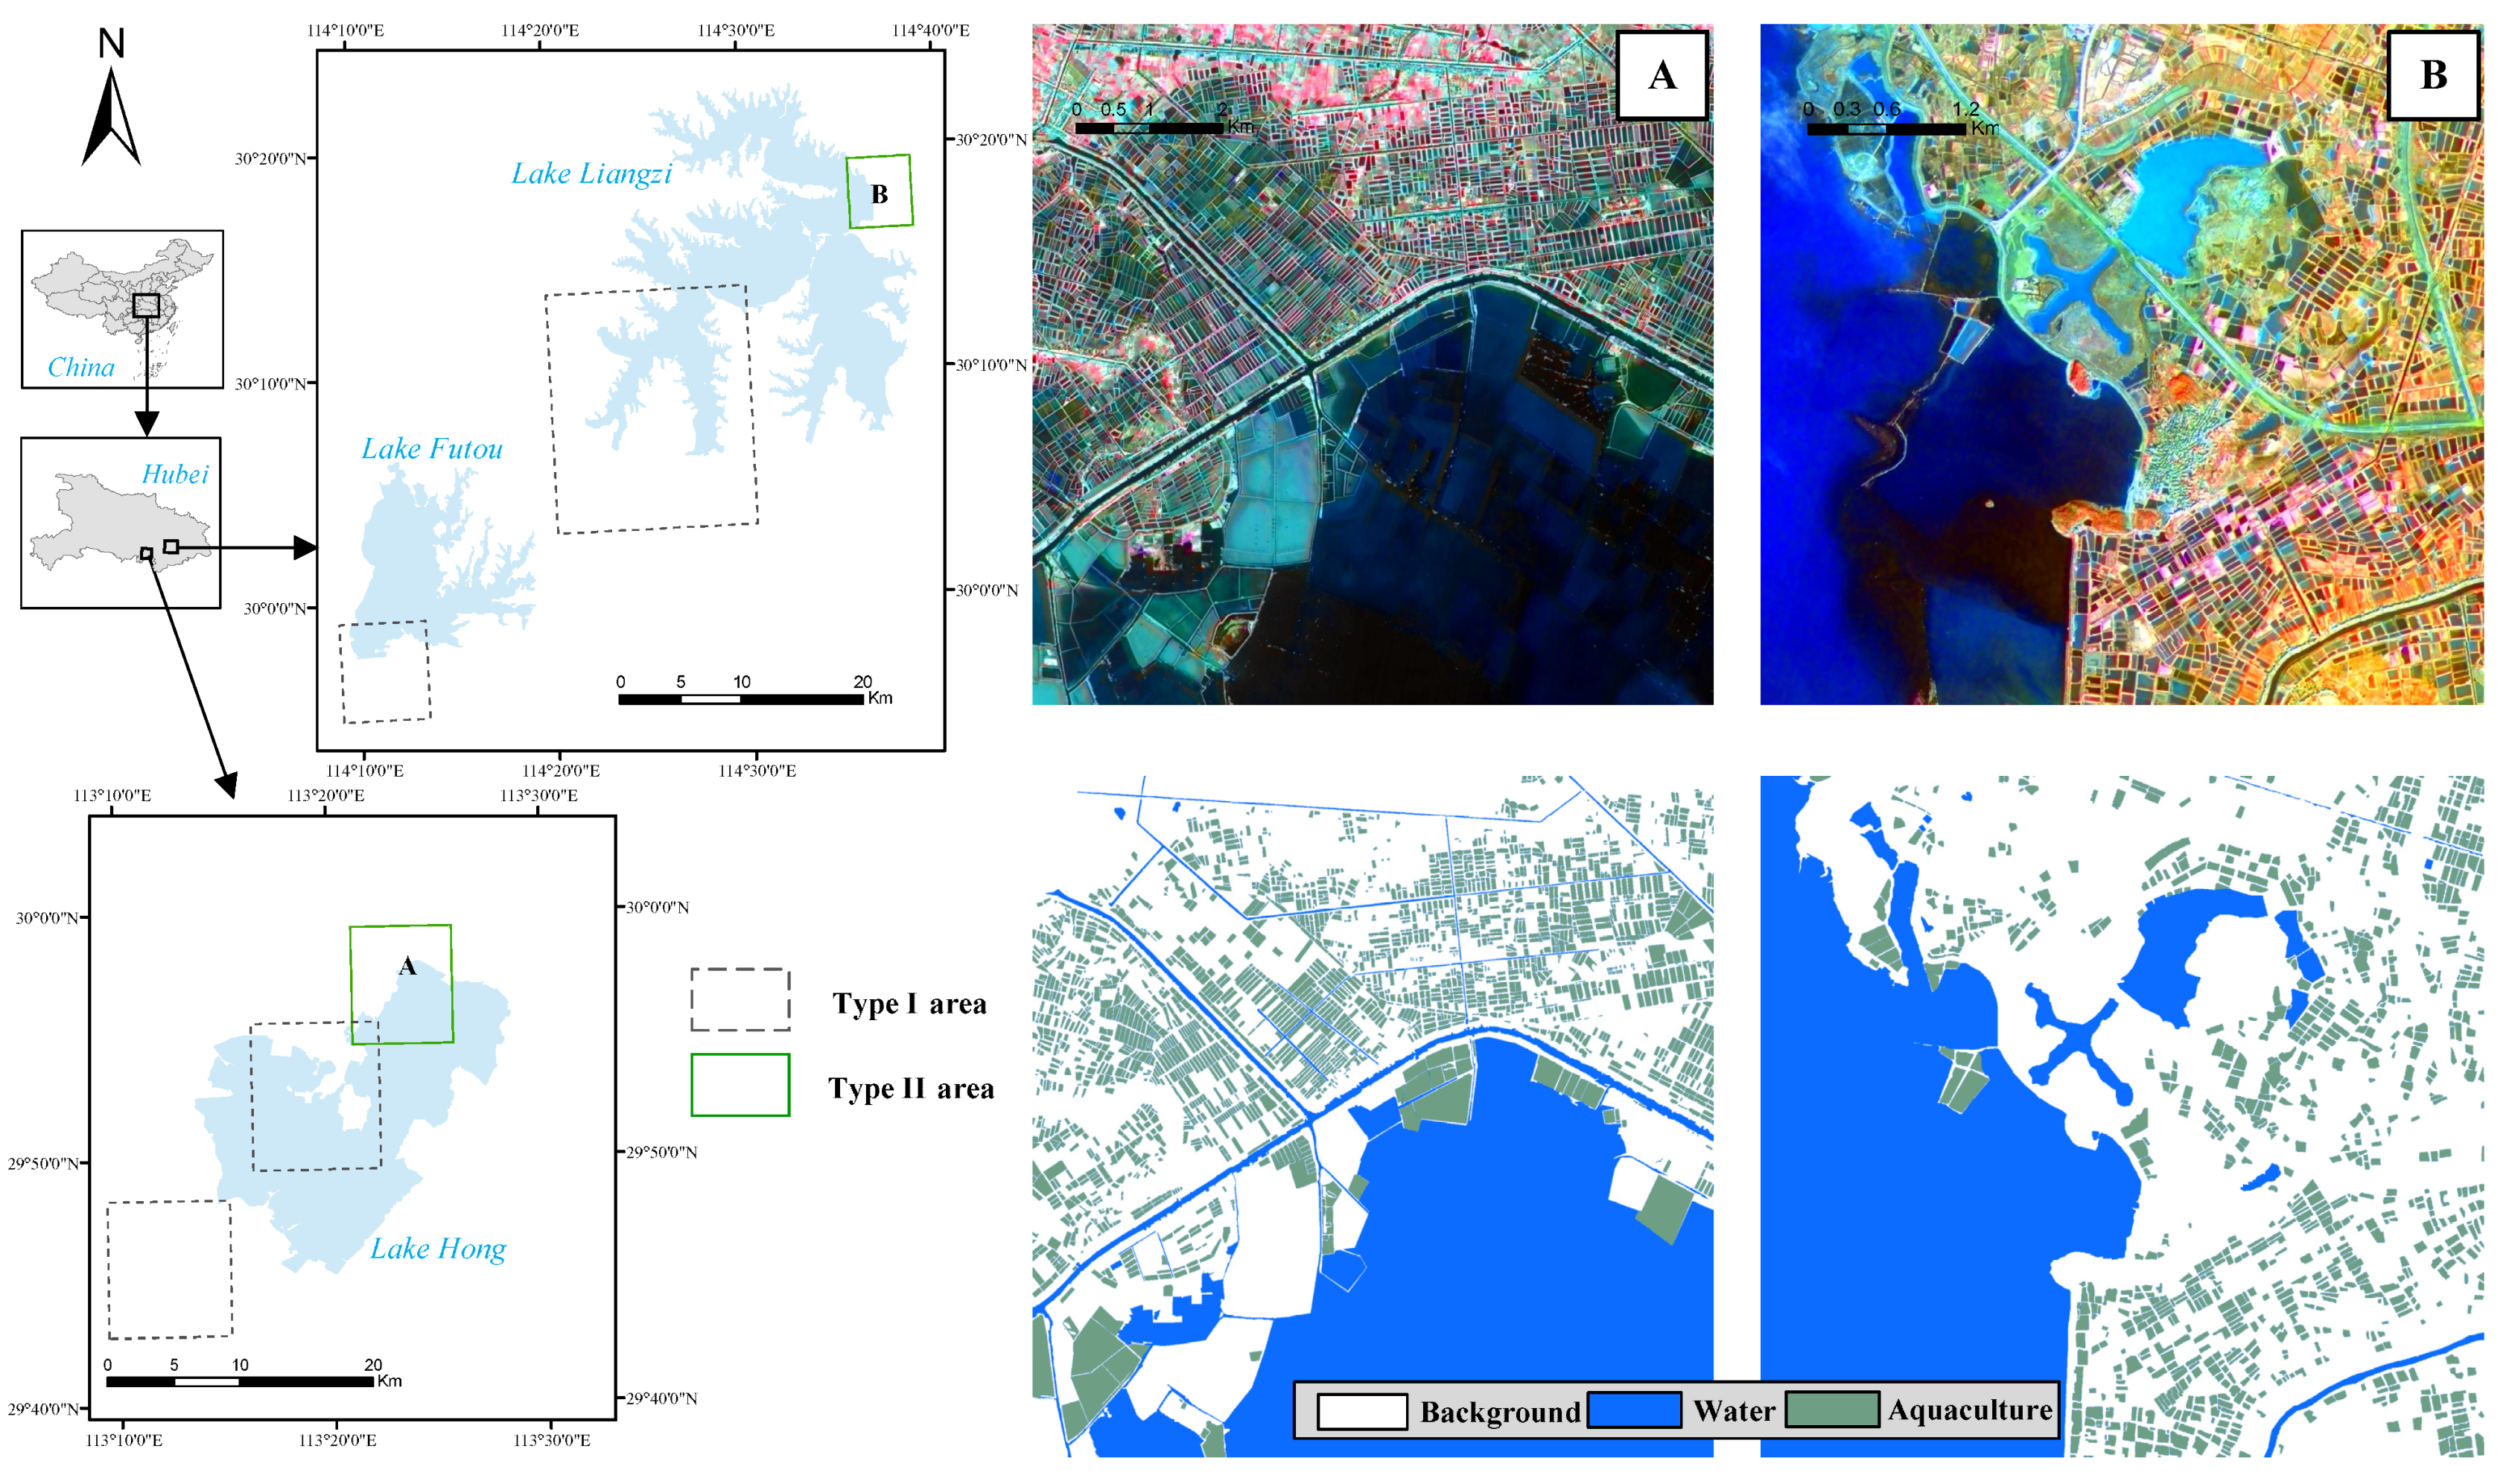
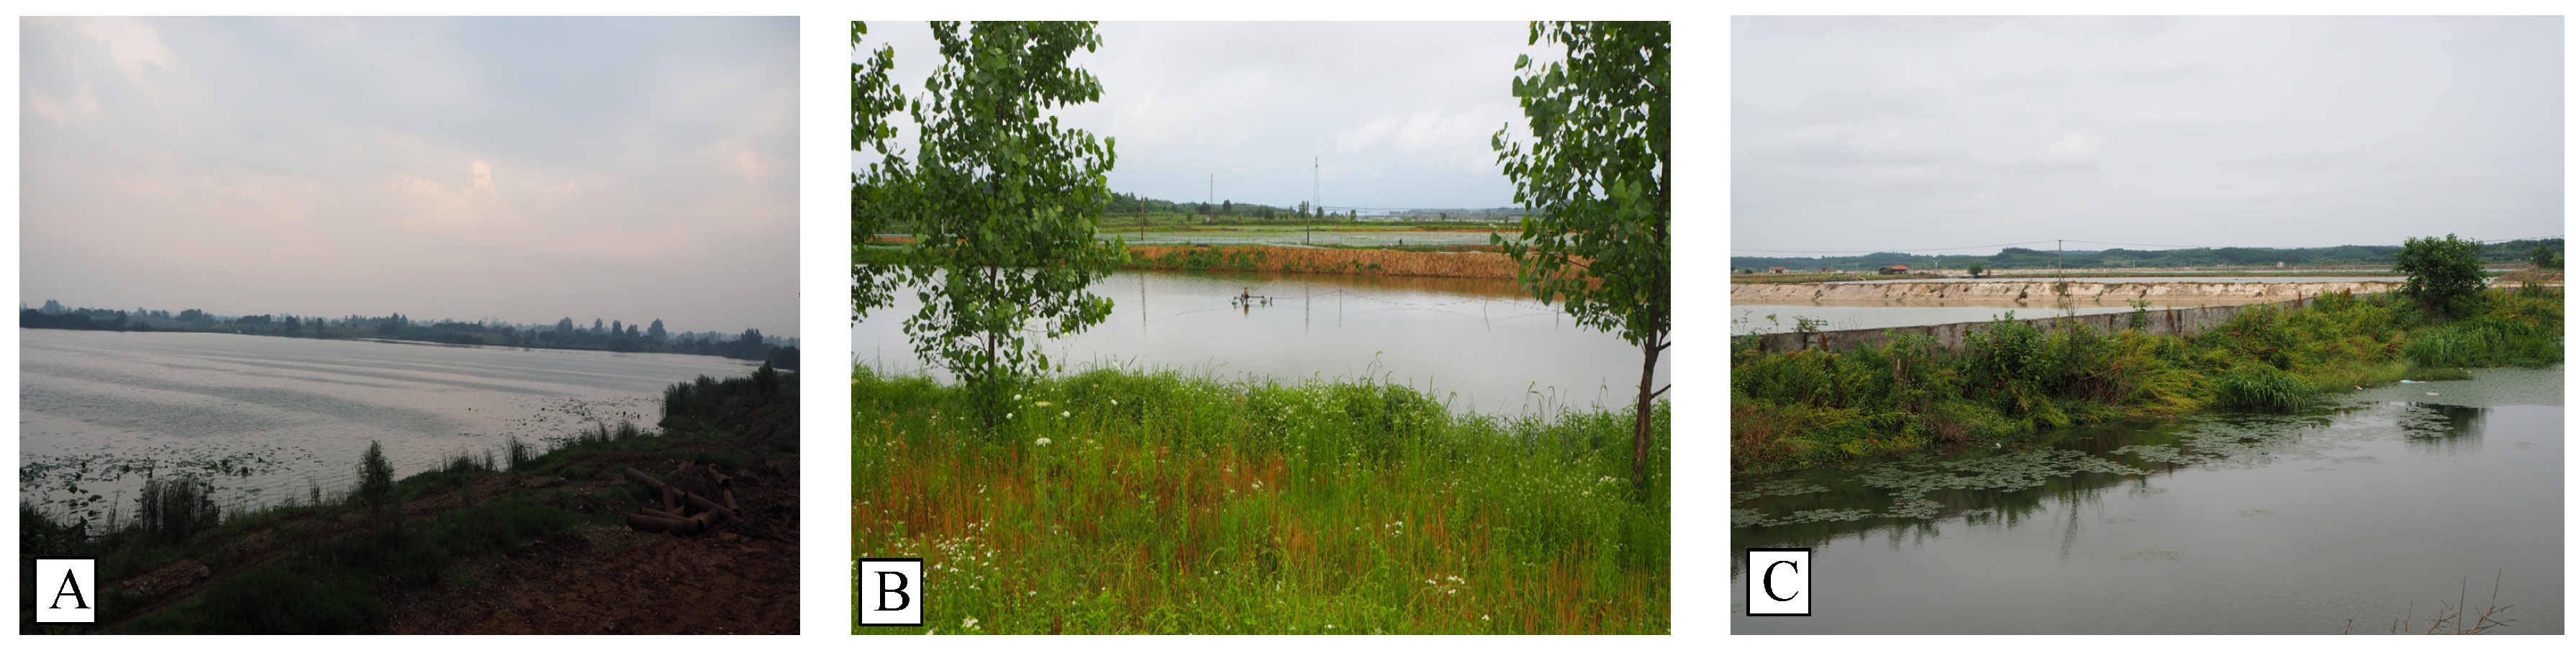
2.1. Study Area
2.2. Dataset
3. Methodology
3.1. Preprocessing
3.2. Basic Model
3.2.1. Network Architecture
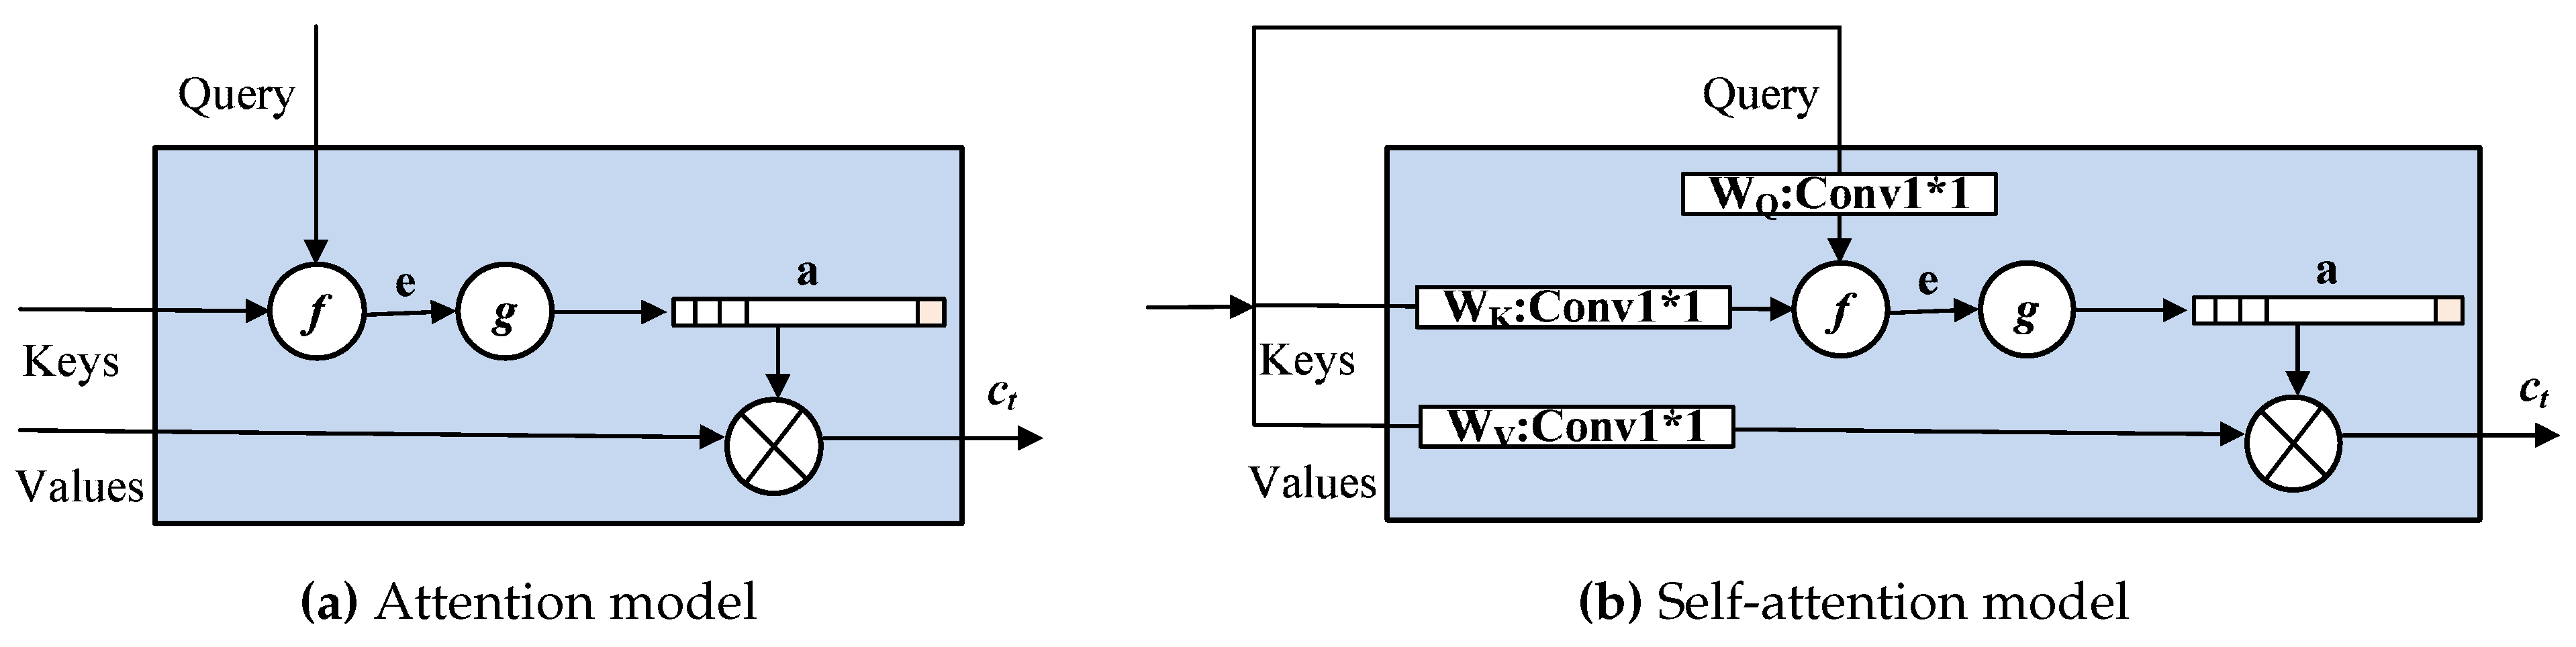
3.2.2. RCSA Mechanism
3.2.3. RCSA for Dense Prediction
3.2.4. ASPP-RC Module
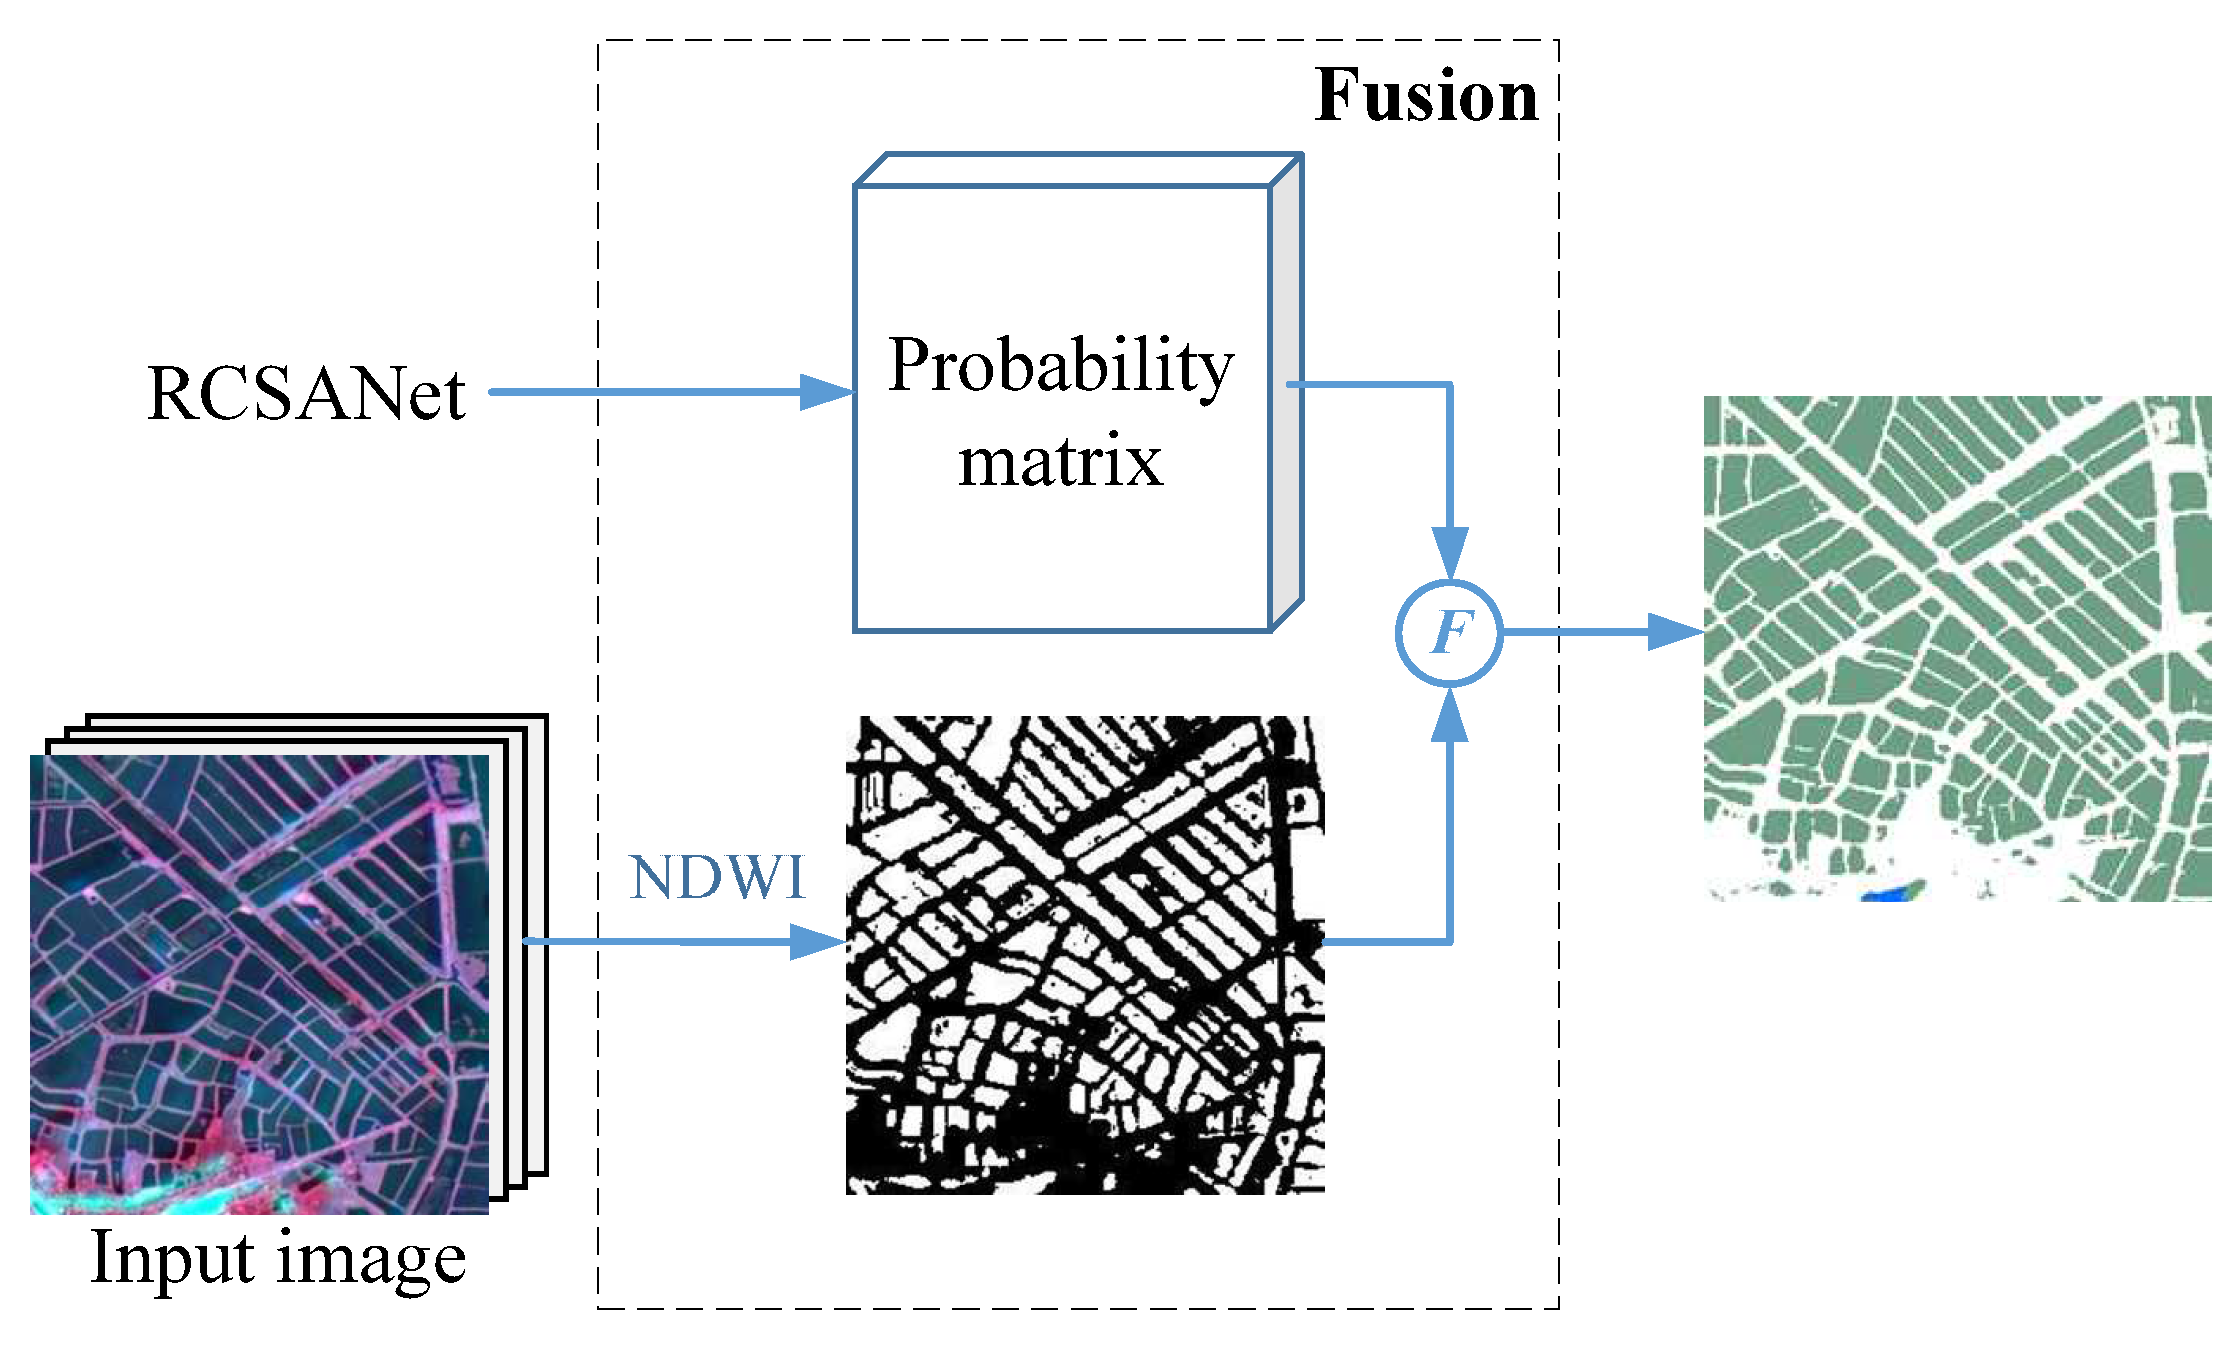
3.3. Fusion Strategy
4. Experiments
4.1. Experimental Set-Up
- (1)
- Evaluating the performance of the proposed methods. The pansharpening images of the six regions (both type I and type II in Figure 1) were segmented into image patches 256 × 256 pixels in size. These image slices were randomly divided into training and test sets, of which 80% (4488 images) made up the training set and 20% (1122 images) made up the test set. The overall accuracy, user’s accuracy, producer’s accuracy, and kappa coefficients were used as the main evoluation metrics.
- (2)
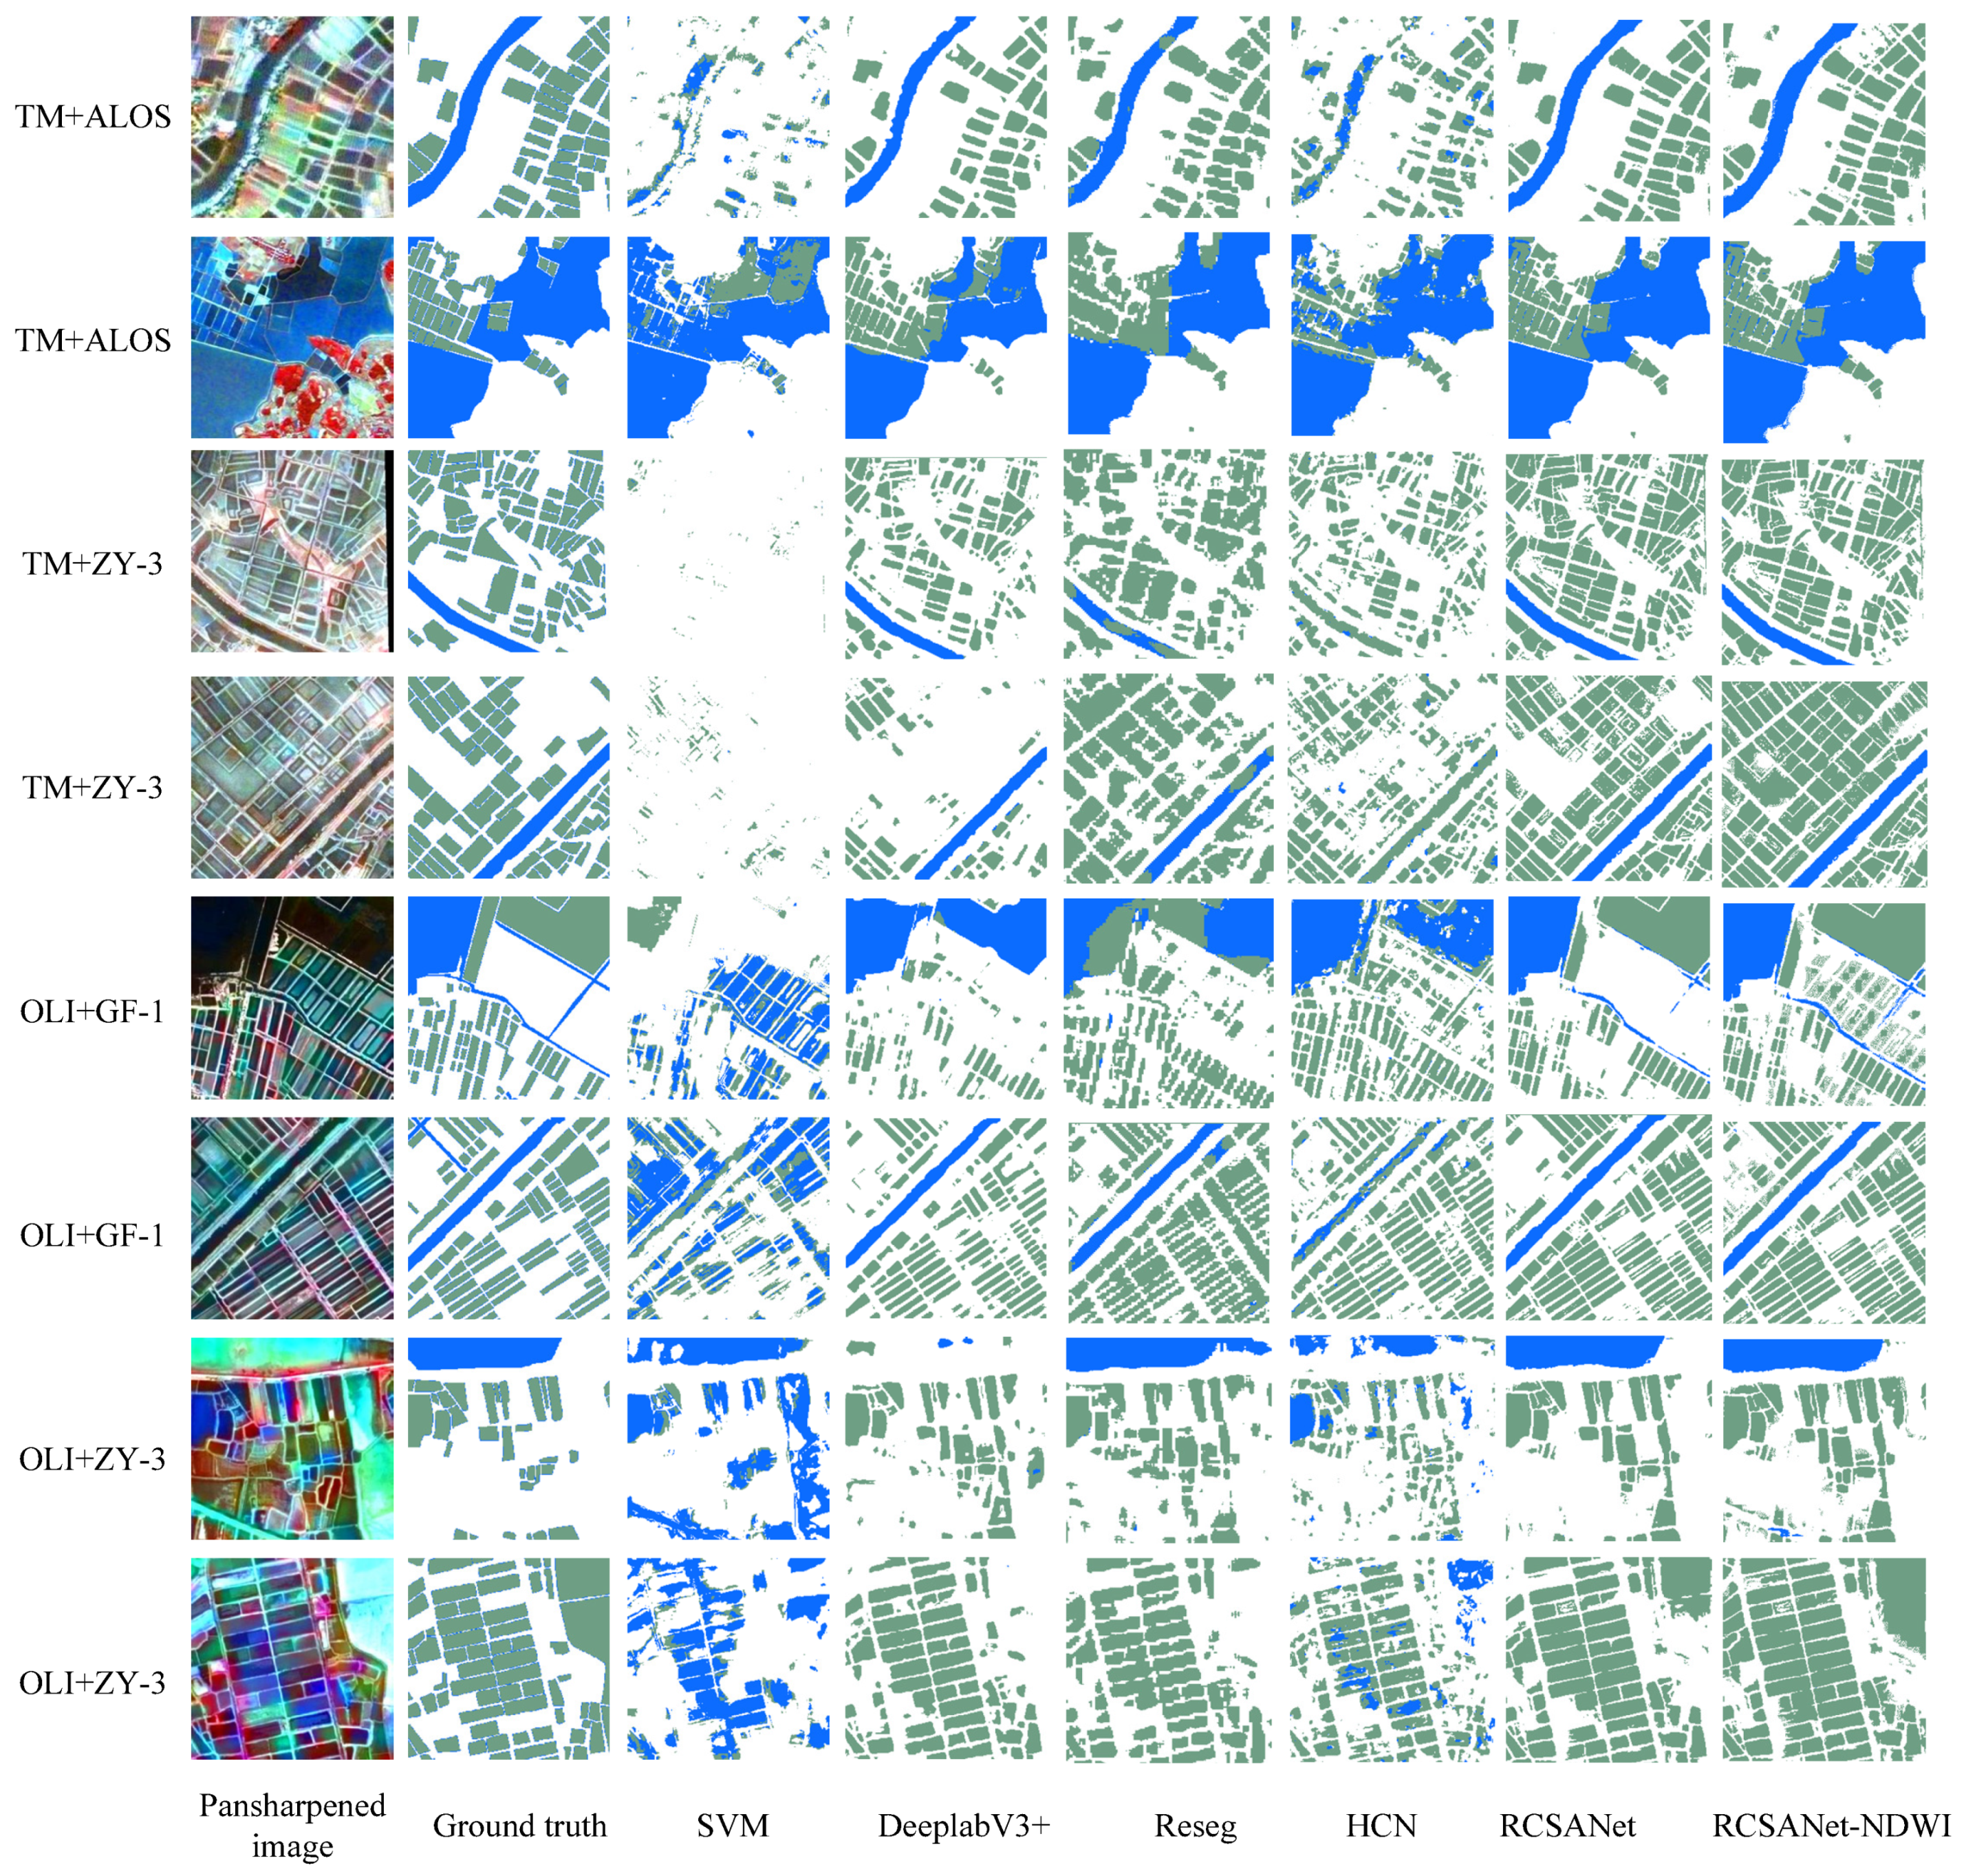
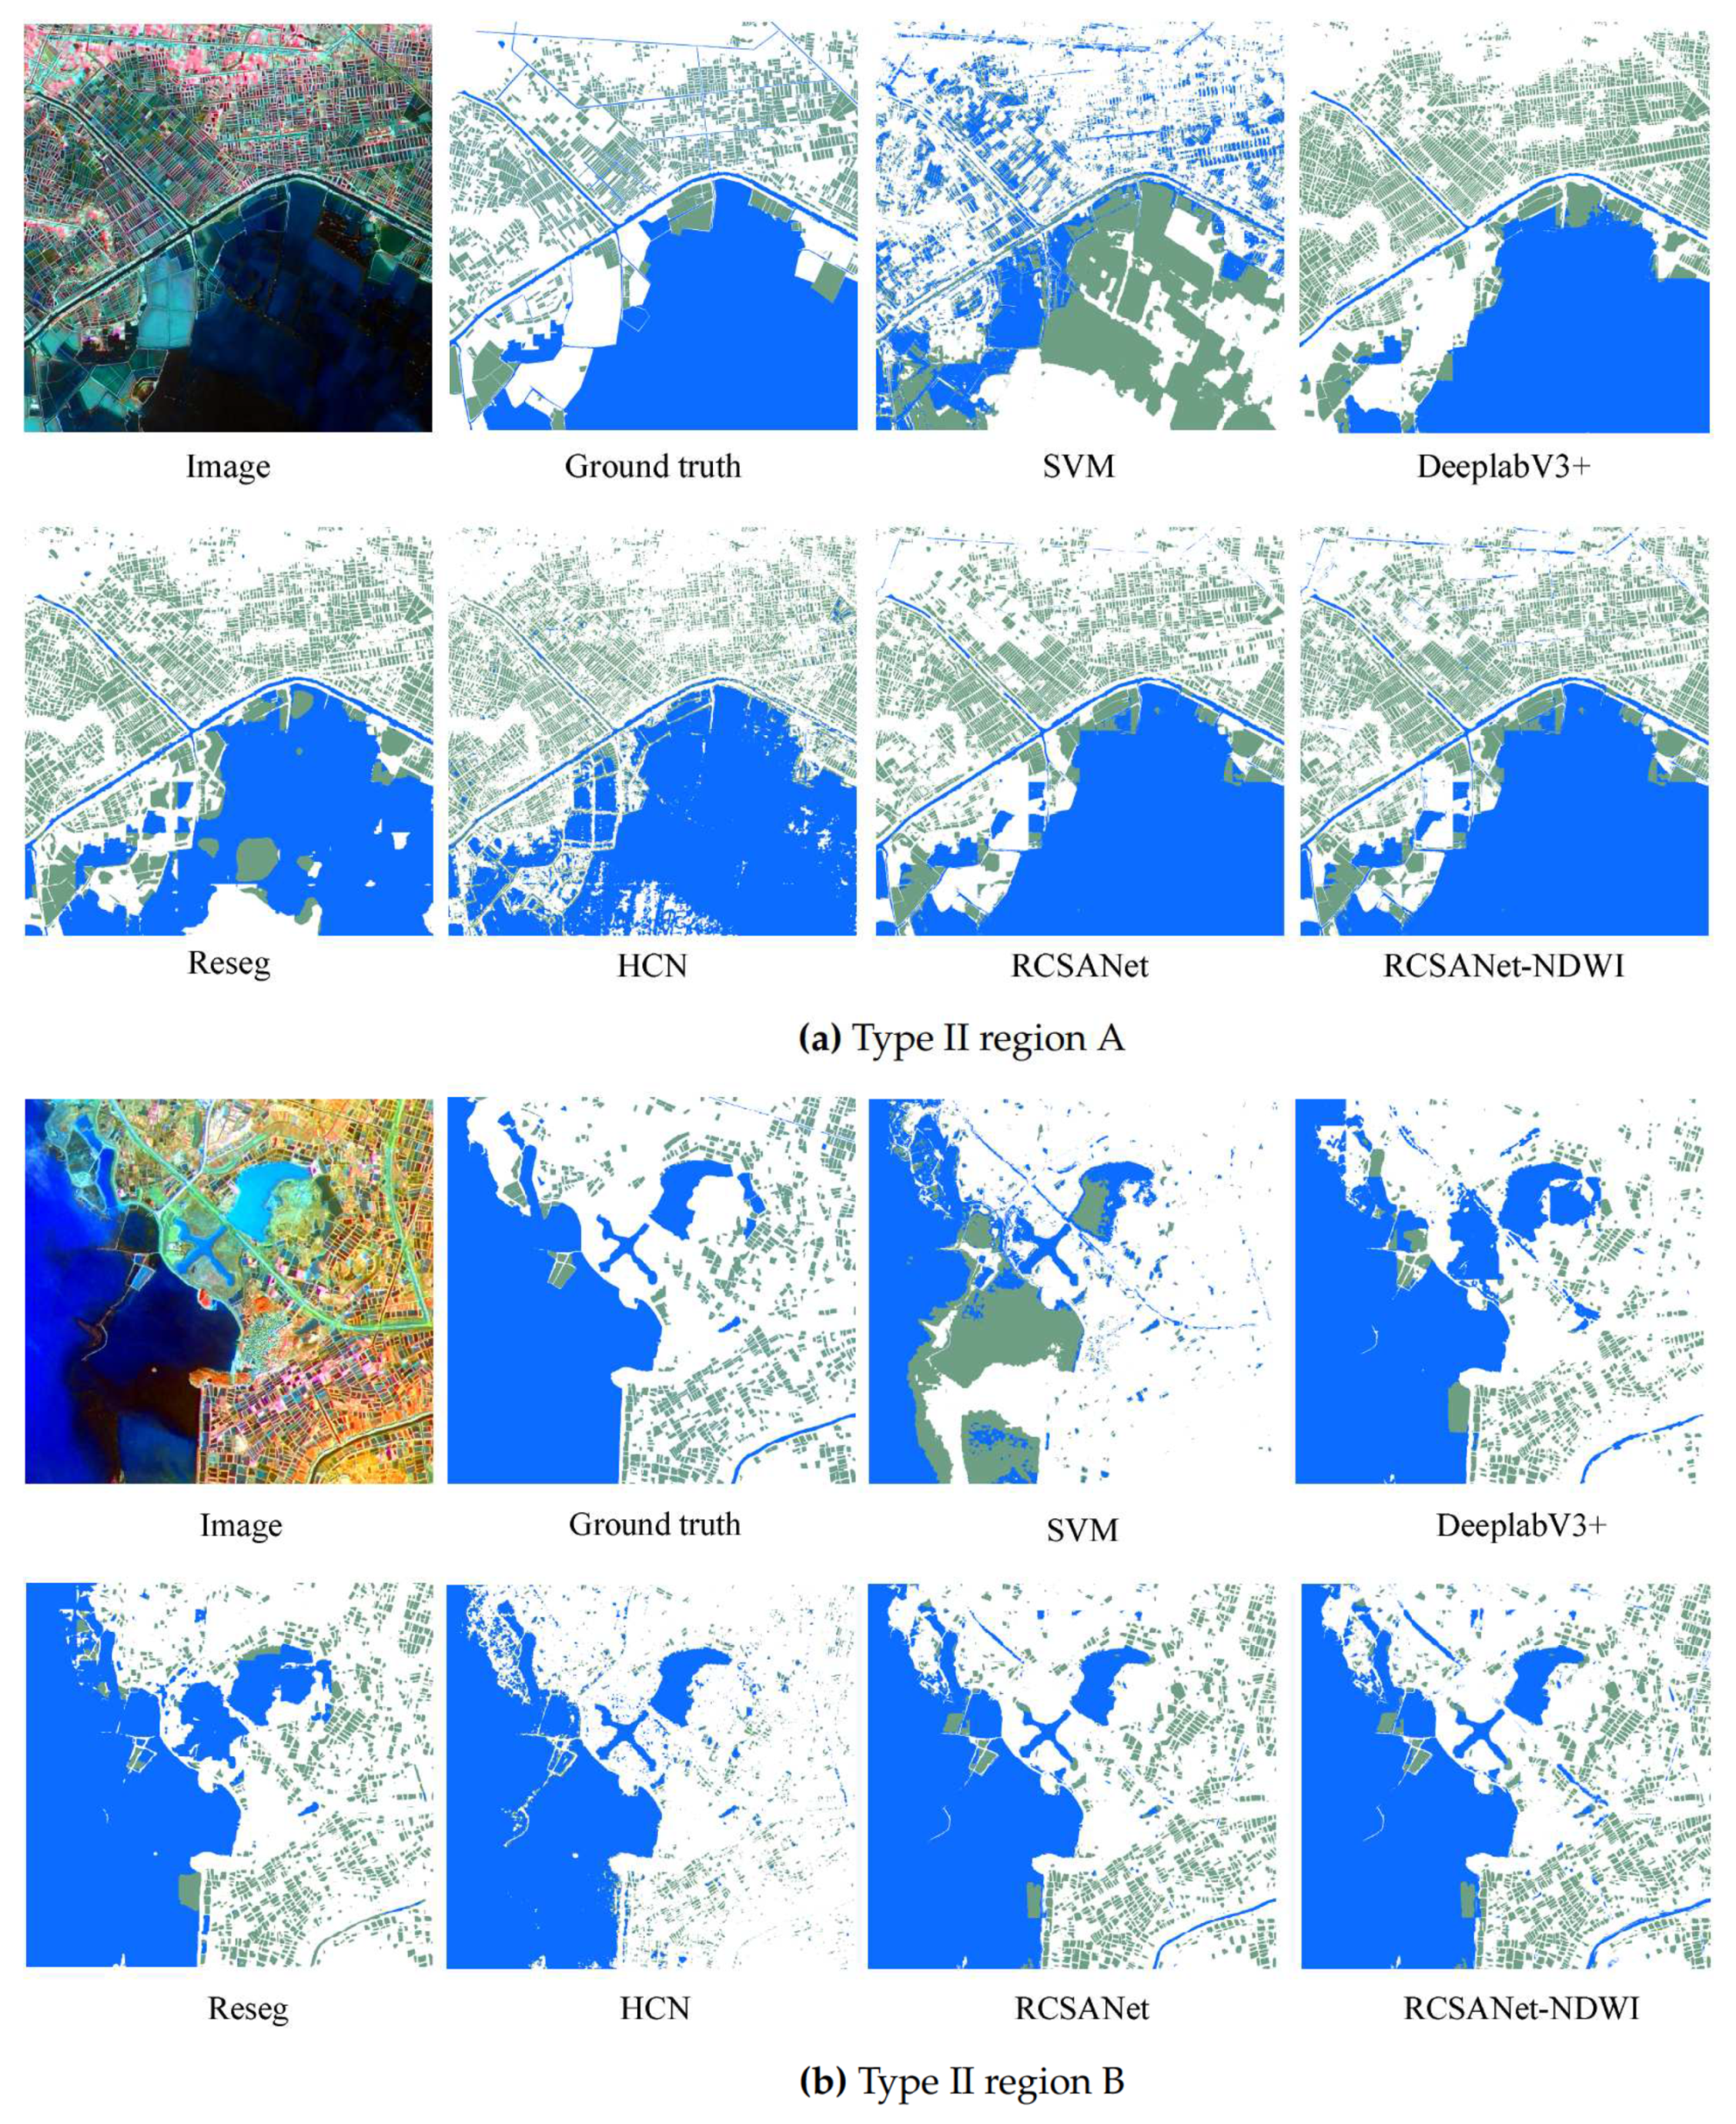
- To assess the quality of aquaculture pond extraction and evaluate the generalization and migration capabilities of RCSANet, four regions (type I) were used as training data, and the other two regions (type II) were used as test areas. The overall accuracy, user’s accuracy, producer’s accuracy, and kappa coefficients were calculated to assess aquaculture pond extraction accuracy on the 2 m spatial resolution pansharpened images.
4.2. Results
5. Discussion
6. Conclusions
Author Contributions
Funding
Institutional Review Board Statement
Informed Consent Statement
Data Availability Statement
Acknowledgments
Conflicts of Interest
References
- Cao, L.; Naylor, R.; Henriksson, P.; Leadbitter, D.; Metian, M.; Troell, M.; Zhang, W. China’s aquaculture and the world’s wild fisheries. Science 2015, 347, 133–135. [Google Scholar] [CrossRef] [PubMed]
- Cai, C.; Gu, X.; Ye, Y.; Yang, C.; Dai, X.; Chen, D.; Yang, C. Assessment of pollutant loads discharged from aquaculture ponds around Taihu Lake, China. Aquac. Res. 2013, 44, 795–806. [Google Scholar] [CrossRef]
- Luo, J.; Pu, R.; Ma, R.; Wang, X.; Lai, X.; Mao, Z.; Zhang, L.; Peng, Z.; Sun, Z. Mapping long-term spatiotemporal dynamics of pen aquaculture in a shallow lake: Less aquaculture coming along better water quality. Remote Sens. 2020, 12, 1866. [Google Scholar] [CrossRef]
- Zhang, H.; Kang, M.; Shen, L.; Wu, J.; Li, J.; Du, H.; Wang, C.; Yang, H.; Zhou, Q.; Liu, Z.; et al. Rapid change in Yangtze fisheries and its implications for global freshwater ecosystem management. Fish Fish. 2020, 21, 601–620. [Google Scholar] [CrossRef]
- Ottinger, M.; Clauss, K.; Kuenzer, C. Large-scale assessment of coastal aquaculture ponds with Sentinel-1 time series data. Remote Sens. 2017, 9, 440. [Google Scholar] [CrossRef] [Green Version]
- Ren, C.; Wang, Z.; Zhang, Y.; Zhang, B.; Chen, L.; Xi, Y.; Xiao, X.; Doughty, R.B.; Liu, M.; Jia, M.; et al. Rapid expansion of coastal aquaculture ponds in China from Landsat observations during 1984–2016. Int. J. Appl. Earth Obs. Geoinf. 2019, 82, 101902. [Google Scholar] [CrossRef]
- Stiller, D.; Ottinger, M.; Leinenkugel, P. Spatio-temporal patterns of coastal aquaculture derived from Sentinel-1 time series data and the full Landsat archive. Remote Sens. 2019, 11, 1707. [Google Scholar] [CrossRef] [Green Version]
- Zeng, Z.; Wang, D.; Tan, W.; Huang, J. Extracting aquaculture ponds from natural water surfaces around inland lakes on medium resolution multispectral images. Int. J. Appl. Earth Obs. Geoinf. 2019, 80, 13–25. [Google Scholar] [CrossRef]
- Zhang, T.; Li, Q.; Yang, X.; Zhou, C.; Su, F. Automatic mapping aquaculture in coastal zone from TM imagery with OBIA approach. In Proceedings of the 2010 18th International Conference on Geoinformatics, Geoinformatics 2010, Beijing, China, 18–20 June 2010. [Google Scholar] [CrossRef]
- Tran, H.; Tran, T.; Kervyn, M. Dynamics of land cover/land use changes in the Mekong Delta, 1973–2011: A Remote sensing analysis of the Tran Van Thoi District, Ca Mau Province, Vietnam. Remote Sens. 2015, 7, 2899–2925. [Google Scholar] [CrossRef] [Green Version]
- Prasad, K.A.; Ottinger, M.; Wei, C.; Leinenkugel, P. Assessment of coastal aquaculture for India from Sentinel-1 SAR time series. Remote Sens. 2019, 11, 357. [Google Scholar] [CrossRef] [Green Version]
- Geng, Q.; Zhou, Z.; Cao, X. Survey of recent progress in semantic image segmentation with CNNs. Sci. China Inf. Sci. 2018, 61, 051101. [Google Scholar] [CrossRef] [Green Version]
- Lecun, Y.; Bengio, Y.; Hinton, G. Deep learning. Nature 2015, 521, 436–444. [Google Scholar] [CrossRef] [PubMed]
- Simonyan, K.; Zisserman, A. Very Deep Convolutional Networks for Large-Scale Image Recognition. In Proceedings of the International Conference on Learning Representations, San Diego, CA, USA, 7–9 May 2015. [Google Scholar]
- He, K.; Zhang, X.; Ren, S.; Sun, J. Deep residual learning for image recognition. In Proceedings of the IEEE Computer Society Conference on Computer Vision and Pattern Recognition, Las Vegas, NV, USA, 27–30 June 2016; pp. 770–778. [Google Scholar] [CrossRef] [Green Version]
- Shelhamer, E.; Long, J.; Darrell, T. Fully Convolutional Networks for Semantic Segmentation. IEEE Trans. Pattern Anal. Mach. Intell. 2017, 39, 640–651. [Google Scholar] [CrossRef] [PubMed]
- Badrinarayanan, V.; Kendall, A.; Cipolla, R. SegNet: A Deep Convolutional Encoder-Decoder Architecture for Image Segmentation. IEEE Trans. Pattern Anal. Mach. Intell. 2017, 39, 2481–2495. [Google Scholar] [CrossRef] [PubMed]
- Chen, L.C.; Papandreou, G.; Kokkinos, I.; Murphy, K.; Yuille, A.L. DeepLab: Semantic Image Segmentation with Deep Convolutional Nets, Atrous Convolution, and Fully Connected CRFs. IEEE Trans. Pattern Anal. Mach. Intell. 2018, 40, 834–848. [Google Scholar] [CrossRef] [PubMed]
- Chen, L.; Papandreou, G.; Schroff, F.; Adam, H. Rethinking Atrous Convolution for Semantic Image Segmentation. arXiv 2017, arXiv:1706.05587. [Google Scholar]
- Chen, L.; Zhu, Y.; Papandreou, G.; Schroff, F.; Adam, H. Encoder-Decoder with Atrous Separable Convolution for Semantic Image Segmentation. arXiv 2018, arXiv:1802.02611. [Google Scholar]
- Lateef, F.; Ruichek, Y. Survey on semantic segmentation using deep learning techniques. Neurocomputing 2019, 338, 321–348. [Google Scholar] [CrossRef]
- Du, P.; Bai, X.; Tan, K.; Xue, Z.; Samat, A.; Xia, J.; Li, E.; Su, H.; Liu, W. Advances of Four Machine Learning Methods for Spatial Data Handling: A Review. J. Geovisualization Spat. Anal. 2020, 4, 13. [Google Scholar] [CrossRef]
- Audebert, N.; Le Saux, B.; Lefèvre, S. Beyond RGB: Very high resolution urban remote sensing with multimodal deep networks. ISPRS J. Photogramm. Remote Sens. 2018, 140, 20–32. [Google Scholar] [CrossRef] [Green Version]
- Wurm, M.; Stark, T.; Zhu, X.X.; Weigand, M.; Taubenböck, H. Semantic segmentation of slums in satellite images using transfer learning on fully convolutional neural networks. ISPRS J. Photogramm. Remote Sens. 2019, 150, 59–69. [Google Scholar] [CrossRef]
- Shi, T.; Xu, Q.; Zou, Z.; Shi, Z. Automatic Raft Labeling for Remote Sensing Images via Dual-Scale Homogeneous Convolutional Neural Network. Remote Sens. 2018, 10, 1130. [Google Scholar] [CrossRef] [Green Version]
- Cui, B.; Fei, D.; Shao, G.; Lu, Y.; Chu, J. Extracting raft aquaculture areas from remote sensing images via an improved U-net with a PSE structure. Remote Sens. 2019, 11, 2053. [Google Scholar] [CrossRef] [Green Version]
- Mnih, V.; Heess, N.; Graves, A.; Kavukcuoglu, K. Recurrent Models of Visual Attention. Adv Neural Inf Process Syst. 2014, 2, 2204–2212. [Google Scholar]
- Bahdanau, D.; Cho, K.; Bengio, Y. Neural Machine Translation by Jointly Learning to Align and Translate. arXiv 2015, arXiv:1409.0473. [Google Scholar]
- Luong, T.; Pham, H.; Manning, C.D. Effective Approaches to Attention-based Neural Machine Translation. In Proceedings of the 2015 Conference on Empirical Methods in Natural Language Processing, Lisbon, Portugal, 17–21 September 2015; pp. 1412–1421. [Google Scholar] [CrossRef] [Green Version]
- Xu, K.; Ba, J.L.; Kiros, R.; Cho, K.; Courville, A.; Salakhutdinov, R.; Zemel, R.S.; Bengio, Y. Show, attend and tell: Neural image caption generation with visual attention. In Proceedings of the 32nd International Conference on Machine Learning, ICML 2015, Lille, France, 6–11 July 2015; Volume 3, pp. 2048–2057. [Google Scholar]
- Parmar, N.; Vaswani, A.; Uszkoreit, J.; Kaiser, Ł.; Shazeer, N.; Ku, A.; Tran, D. Image Transformer. In Proceedings of the 35th International Conference on Machine Learning, Stockholmsmässan, Stockholm, Sweden, 10–15 July 2018. [Google Scholar]
- Vaswani, A.; Shazeer, N.; Parmar, N.; Uszkoreit, J.; Jones, L.; Gomez, A.N.; Kaiser, L.; Polosukhin, I. Attention Is All You Need. In Proceedings of the 31st Conference on Neural Information Processing Systems (NIPS 2017), Long Beach, CA, USA, 4–9 December 2017. [Google Scholar]
- Fu, J.; Liu, J.; Tian, H.; Li, Y.; Bao, Y.; Fang, Z.; Lu, H. Dual Attention Network for Scene Segmentation. arXiv 2019, arXiv:1809.02983. [Google Scholar]
- Xu, X.; Huang, X.; Zhang, Y.; Yu, D.; Xu, X.; Huang, X.; Zhang, Y.; Yu, D. Long-Term Changes in Water Clarity in Lake Liangzi Determined by Remote Sensing. Remote Sens. 2018, 10, 1441. [Google Scholar] [CrossRef] [Green Version]
- Hua, Y.; Mou, L.; Zhu, X.X. Recurrently exploring class-wise attention in a hybrid convolutional and bidirectional LSTM network for multi-label aerial image classification. ISPRS J. Photogramm. Remote Sens. 2019, 149, 188–199. [Google Scholar] [CrossRef]
- Gao, H.; Gu, X.; Yu, T.; Liu, L.; Sun, Y.; Xie, Y.; Liu, Q. Validation of the calibration coefficient of the GaoFen-1 PMS sensor using the landsat 8 OLI. Remote Sens. 2016, 8, 132. [Google Scholar] [CrossRef] [Green Version]
- Jiang, Y.H.; Zhang, G.; Tang, X.M.; Li, D.; Huang, W.C.; Pan, H.B. Geometric calibration and accuracy assessment of ZiYuan-3 multispectral images. IEEE Trans. Geosci. Remote Sens. 2014, 52, 4161–4172. [Google Scholar] [CrossRef]
- Maurer, T. How to pan-sharpen images using the Gram-Schmidt pan-sharpen method—A recipe. In Proceedings of the ISPRS Hannover Workshop 2013, Hannover, Germany, 21–24 May 2013; Volume XL-1/W1, pp. 239–244. [Google Scholar] [CrossRef] [Green Version]
- Sekrecka, A.; Kedzierski, M.; Wierzbicki, D. Pre-processing of panchromatic images to improve object detection in pansharpened images. Sensors 2019, 19, 5146. [Google Scholar] [CrossRef] [PubMed] [Green Version]
- Yu, C.; Wang, J.; Peng, C.; Gao, C.; Yu, G.; Sang, N. Learning a Discriminative Feature Network for Semantic Segmentation. In Proceedings of the IEEE Computer Society Conference on Computer Vision and Pattern Recognition, Salt Lake City, UT, USA, 18–22 June 2018; Volume 1, pp. 1857–1866. [Google Scholar] [CrossRef] [Green Version]
- Zhao, R.; Wang, D.; Yan, R.; Mao, K.; Shen, F.; Wang, J. Machine Health Monitoring Using Local Feature-Based Gated Recurrent Unit Networks. IEEE Trans. Ind. Electron. 2018, 65, 1539–1548. [Google Scholar] [CrossRef]
- Galassi, A.; Lippi, M.; Torroni, P. Attention in Natural Language Processing. arXiv 2020, arXiv:1902.02181. [Google Scholar] [CrossRef] [PubMed]
- Otsu, N. A Threshold Selection Method from Gray-Level Histograms. IEEE Trans. Syst. Man Cybern. 1979, 9, 62–66. [Google Scholar] [CrossRef] [Green Version]
- Visin, F.; Romero, A.; Cho, K.; Matteucci, M.; Ciccone, M.; Kastner, K.; Bengio, Y.; Courville, A. ReSeg: A Recurrent Neural Network-Based Model for Semantic Segmentation. In Proceedings of the 2016 IEEE Conference on Computer Vision and Pattern Recognition Workshops (CVPRW), Las Vegas, NV, USA, 28 June–1 July 2016; pp. 426–433. [Google Scholar] [CrossRef] [Green Version]
- Chang, C.C.; Lin, C.J. LIBSVM: A Library for Support Vector Machines. ACM Trans. Intell. Syst. Technol. TIST 2013, 2, 1–39. [Google Scholar] [CrossRef]


| Multispectral Images | Panchromatic Images | |||||
|---|---|---|---|---|---|---|
| Regions | Sensors | Spatial Resolution (m) | Date | Sensors | Spatial Resolution (m) | Date |
| Lake Hong (west, type I region) | TM (Landsa 5) | 30 | 2011.01.15 | PAN-NAD(ZY-3) | 2.1 | 2013.01.27 |
| Lake Hong (west, type I region) | OLI (Landsat 8) | 30 | 2014.01.23 | PMS2(GF-1) | 2 | 2014.01.23 |
| Lake Hong (middle, type I region) | TM (Landsat 5) | 30 | 2011.01.15 | PAN-NAD(ZY-3) | 2.1 | 2013.01.27 |
| Lake Hong (middle, type I region) | OLI (Landsat 8) | 30 | 2014.01.23 | PMS2(GF-1) | 2 | 2014.01.23 |
| Lake Futou (south, type I region) | OLI (Landsat 8) | 30 | 2015.03.31 | PAN-NAD(ZY-3) | 2.1 | 2017.01.22 |
| Lake Liangzi (west, type I region) | TM (Landsat 5) | 30 | 2010.11.12 | PRISM(ALOS) | 2.5 | 2010.11.06 |
| Lake Liangzi (west, type I region) | OLI (Landsat 8) | 30 | 2014.02.01 | PMS2(GF-1) | 2 | 2014.01.31 |
| Lake Hong (east, type II region A) | TM (Landsat 5) | 30 | 2011.01.15 | PAN-NAD(ZY-3) | 2.1 | 2013.01.27 |
| Lake Hong (east, type II region A) | OLI (Landsat 8) | 30 | 2014.01.23 | PMS2(GF-1) | 2 | 2014.01.23 |
| Lake Liangzi (east, type II region B) | TM (Landsat 5) | 30 | 2010.11.12 | PRISM(ALOS) | 2.5 | 2010.11.06 |
| Lake Liangzi (east, type II region B) | OLI (Landsat 8) | 30 | 2014.02.01 | PMS2(GF-1) | 2 | 2014.01.31 |
| Module | Kernel Size | Stride | Padding | Dilation |
|---|---|---|---|---|
| Conv | 1 × 1 | 1 | 0 | 1 |
| RCSA | 1 × 1 | 1 | 0 | 1 |
| Upsampling block | 1 × 1 | 1 | 0 | 1 |
| ASPP-RC(Conv) | 1 × 1 | 1 | 0 | 1 |
| ASPP-RC(Atrous conv) | 3 × 3 | 1 | rate | rate |
| Producer’s Accuracy | User’s Accuracy | |||||
|---|---|---|---|---|---|---|
| Methods | Overall Accuracy (%) | Kappa | Natural Water (%) | Aqua- Culture (%) | Natural Water (%) | Aqua- Culture (%) |
| SVM | 26.90 | 9.71 | 54.80 | 15.96 | 52.43 | 76.60 |
| Deeplabv3+ | 79.16 | 59.23 | 90.32 | 55.26 | 97.90 | 93.14 |
| Reseg | 84.52 | 68.23 | 90.74 | 71.18 | 97.44 | 90.31 |
| HCN | 74.53 | 49.86 | 86.83 | 48.21 | 92.71 | 85.74 |
| RCSANet | 86.95 | 72.83 | 92.83 | 74.36 | 98.13 | 93.99 |
| RCSANet-NDWI | 89.31 | 77.28 | 93.28 | 80.81 | 98.07 | 93.57 |
| Producer’s Accuracy | User’s Accuracy | |||||||
|---|---|---|---|---|---|---|---|---|
| Regions | Sensors | Methods | Overall Accuracy (%) | Kappa | Natural Water (%) | Aqua- Culture (%) | Natural Water (%) | Aqua- Culture (%) |
| Lake Hong (East, type II region A) | TM+ZY-3 | SVM | 24.44 | 5.09 | 27.55 | 23.80 | 53.83 | 86.72 |
| Deeplabv3+ | 81.30 | 60.93 | 87.87 | 64.71 | 98.25 | 83.30 | ||
| Reseg | 84.74 | 66.92 | 88.97 | 74.06 | 97.85 | 82.52 | ||
| HCN | 77.37 | 52.85 | 88.83 | 48.42 | 96.73 | 79.79 | ||
| RCSANet | 86.79 | 70.83 | 90.79 | 76.70 | 98.25 | 84.47 | ||
| RCSANet-NDWI | 88.77 | 74.78 | 91.08 | 82.94 | 98.21 | 84.42 | ||
| OLI+GF-1 | SVM | 67.60 | 25.99 | 38.82 | 78.75 | 47.09 | 82.16 | |
| Deeplabv3+ | 84.96 | 69.73 | 87.60 | 79.57 | 96.82 | 90.01 | ||
| Reseg | 76.47 | 55.10 | 78.30 | 72.75 | 92.44 | 83.38 | ||
| HCN | 73.76 | 48.23 | 82.90 | 55.07 | 88.02 | 86.79 | ||
| RCSANet | 85.36 | 69.14 | 90.57 | 74.70 | 93.59 | 90.38 | ||
| RCSANet-NDWI | 86.61 | 71.43 | 91.07 | 77.50 | 93.61 | 90.14 | ||
| Lake Liangzi (East, type II region B) | TM+ALOS | SVM | 39.26 | 14.51 | 67.37 | 5.32 | 86.62 | 19.22 |
| Deeplabv3+ | 74.60 | 53.48 | 86.73 | 50.69 | 99.25 | 82.83 | ||
| Reseg | 75.27 | 54.33 | 84.94 | 56.20 | 97.86 | 83.28 | ||
| HCN | 67.68 | 40.23 | 90.05 | 23.60 | 92.51 | 86.44 | ||
| RCSANet | 79.95 | 62.01 | 89.31 | 61.50 | 99.56 | 90.03 | ||
| RCSANet-NDWI | 83.85 | 68.42 | 89.63 | 72.45 | 99.51 | 89.03 | ||
| OLI+GF-1 | SVM | 39.43 | 3.29 | 48.19 | 7.58 | 94.43 | 5.90 | |
| Deeplabv3+ | 82.31 | 55.98 | 91.45 | 49.06 | 98.91 | 77.99 | ||
| Reseg | 87.97 | 67.84 | 93.74 | 66.96 | 97.85 | 85.59 | ||
| HCN | 77.25 | 43.83 | 91.80 | 24.31 | 97.19 | 81.96 | ||
| RCSANet | 90.90 | 75.86 | 93.00 | 83.26 | 99.21 | 83.97 | ||
| RCSANet-NDWI | 91.71 | 77.83 | 93.19 | 86.31 | 99.20 | 83.69 | ||
| Producer’s Accuracy | User’s Accuracy | ||||||||
|---|---|---|---|---|---|---|---|---|---|
| Regions | Sensors | Methods | Training Data | Overall Accuracy (%) | Kappa | Natural Water (%) | Aqua- Culture (%) | Natural Water (%) | Aqua- Culture (%) |
| Lake Liangzi (East, type II region B) | TM+ALOS | RCSANet | All pansharpened images from type I regions | 79.95 | 62.01 | 89.31 | 61.50 | 99.56 | 90.03 |
| RCSANet-NDWI | 83.85 | 68.42 | 89.63 | 72.45 | 99.51 | 89.03 | |||
| RCSANet | Pansharpened images of fusing TM images with panchromatic images from ZY-3 or ALOS satellites, from type I regions | 77.44 | 57.54 | 90.98 | 50.75 | 98.71 | 91.26 | ||
| RCSANet-NDWI | 81.84 | 64.68 | 91.23 | 63.33 | 98.65 | 91.00 | |||
| OLI+GF-1 | RCSANet | All pansharpened images from type I regions | 90.90 | 75.86 | 93.00 | 83.26 | 99.21 | 83.97 | |
| RCSANet-NDWI | 91.71 | 77.83 | 93.19 | 86.31 | 99.20 | 83.69 | |||
| RCSANet | Pansharpened images of fusing OLI images with panchromatic images from GF-1 satellites, from type I regions | 88.01 | 68.78 | 92.92 | 70.12 | 98.96 | 85.70 | ||
| RCSANet-NDWI | 89.41 | 72.09 | 93.14 | 75.85 | 98.89 | 85.93 | |||
| Methods | Overall Accuracy | Kappa Coefficient |
|---|---|---|
| RCSANet2 | 81.04 | 66.15 |
| RCSANet1 | 84.63 | 71.59 |
| RCSANet | 86.95 | 72.83 |
| Methods | Training Time (seconds) | Occupied Memory of GPU for Training (MB) | Prediction Time for Region B (seconds) | Occupied Memory of GPU for Prediction (MB) |
|---|---|---|---|---|
| RCSA | 60,280 | 7563 | 35 | 1543 |
| HCN | 66,000 | 7709 | 64 | 7843 |
| Deeplabv3+ | 16,760 | 3113 | 12 | 1417 |
| Reseg | 10,640 | 2343 | 16 | 1083 |
Publisher’s Note: MDPI stays neutral with regard to jurisdictional claims in published maps and institutional affiliations. |
© 2020 by the authors. Licensee MDPI, Basel, Switzerland. This article is an open access article distributed under the terms and conditions of the Creative Commons Attribution (CC BY) license (http://creativecommons.org/licenses/by/4.0/).
Share and Cite
Zeng, Z.; Wang, D.; Tan, W.; Yu, G.; You, J.; Lv, B.; Wu, Z. RCSANet: A Full Convolutional Network for Extracting Inland Aquaculture Ponds from High-Spatial-Resolution Images. Remote Sens. 2021, 13, 92. https://0-doi-org.brum.beds.ac.uk/10.3390/rs13010092
Zeng Z, Wang D, Tan W, Yu G, You J, Lv B, Wu Z. RCSANet: A Full Convolutional Network for Extracting Inland Aquaculture Ponds from High-Spatial-Resolution Images. Remote Sensing. 2021; 13(1):92. https://0-doi-org.brum.beds.ac.uk/10.3390/rs13010092
Chicago/Turabian StyleZeng, Zhe, Di Wang, Wenxia Tan, Gongliang Yu, Jiacheng You, Botao Lv, and Zhongheng Wu. 2021. "RCSANet: A Full Convolutional Network for Extracting Inland Aquaculture Ponds from High-Spatial-Resolution Images" Remote Sensing 13, no. 1: 92. https://0-doi-org.brum.beds.ac.uk/10.3390/rs13010092