
A Novel Framework Based on Mask R-CNN and Histogram Thresholding for Scalable Segmentation of New and Old Rural Buildings


Abstract
:1. Introduction
2. Study Area and Data
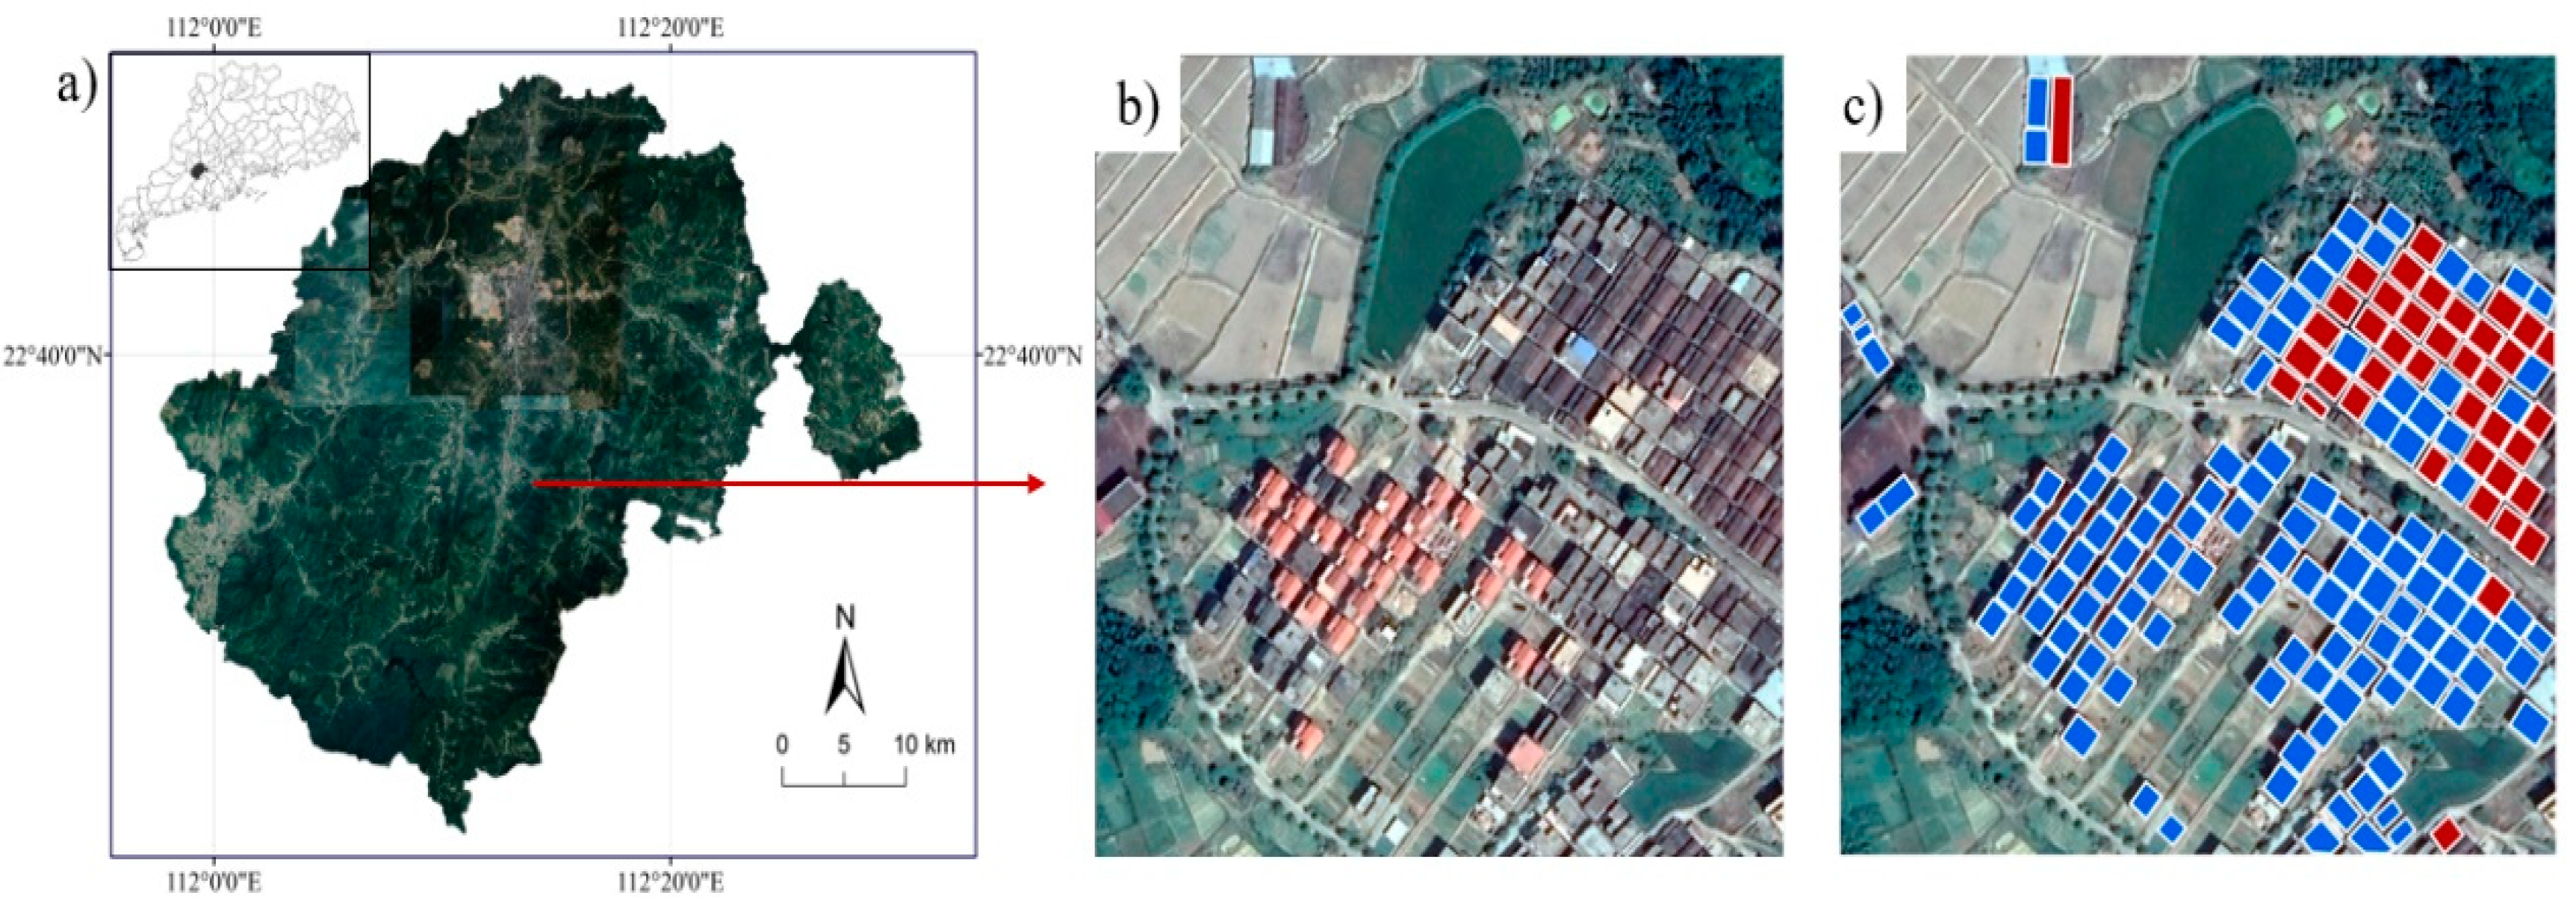
2.1. Study Area
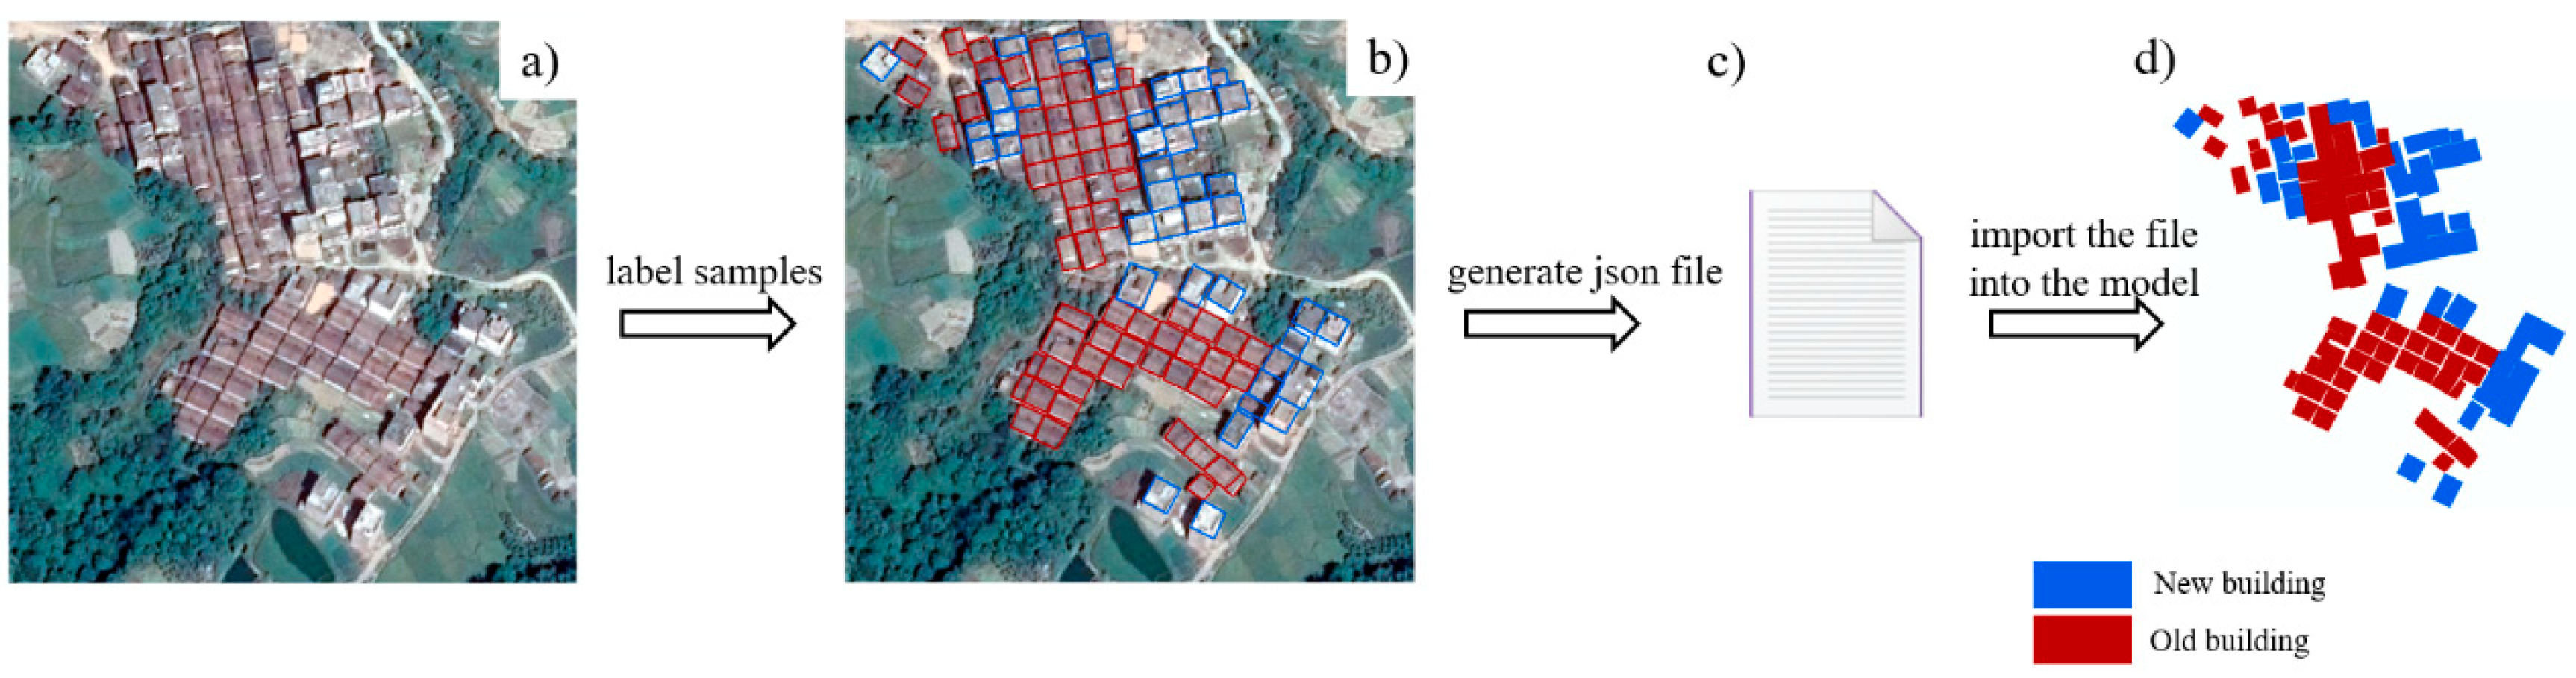
2.2. Data Collection and Annotation
3. Methods
3.1. HTMask R-CNN
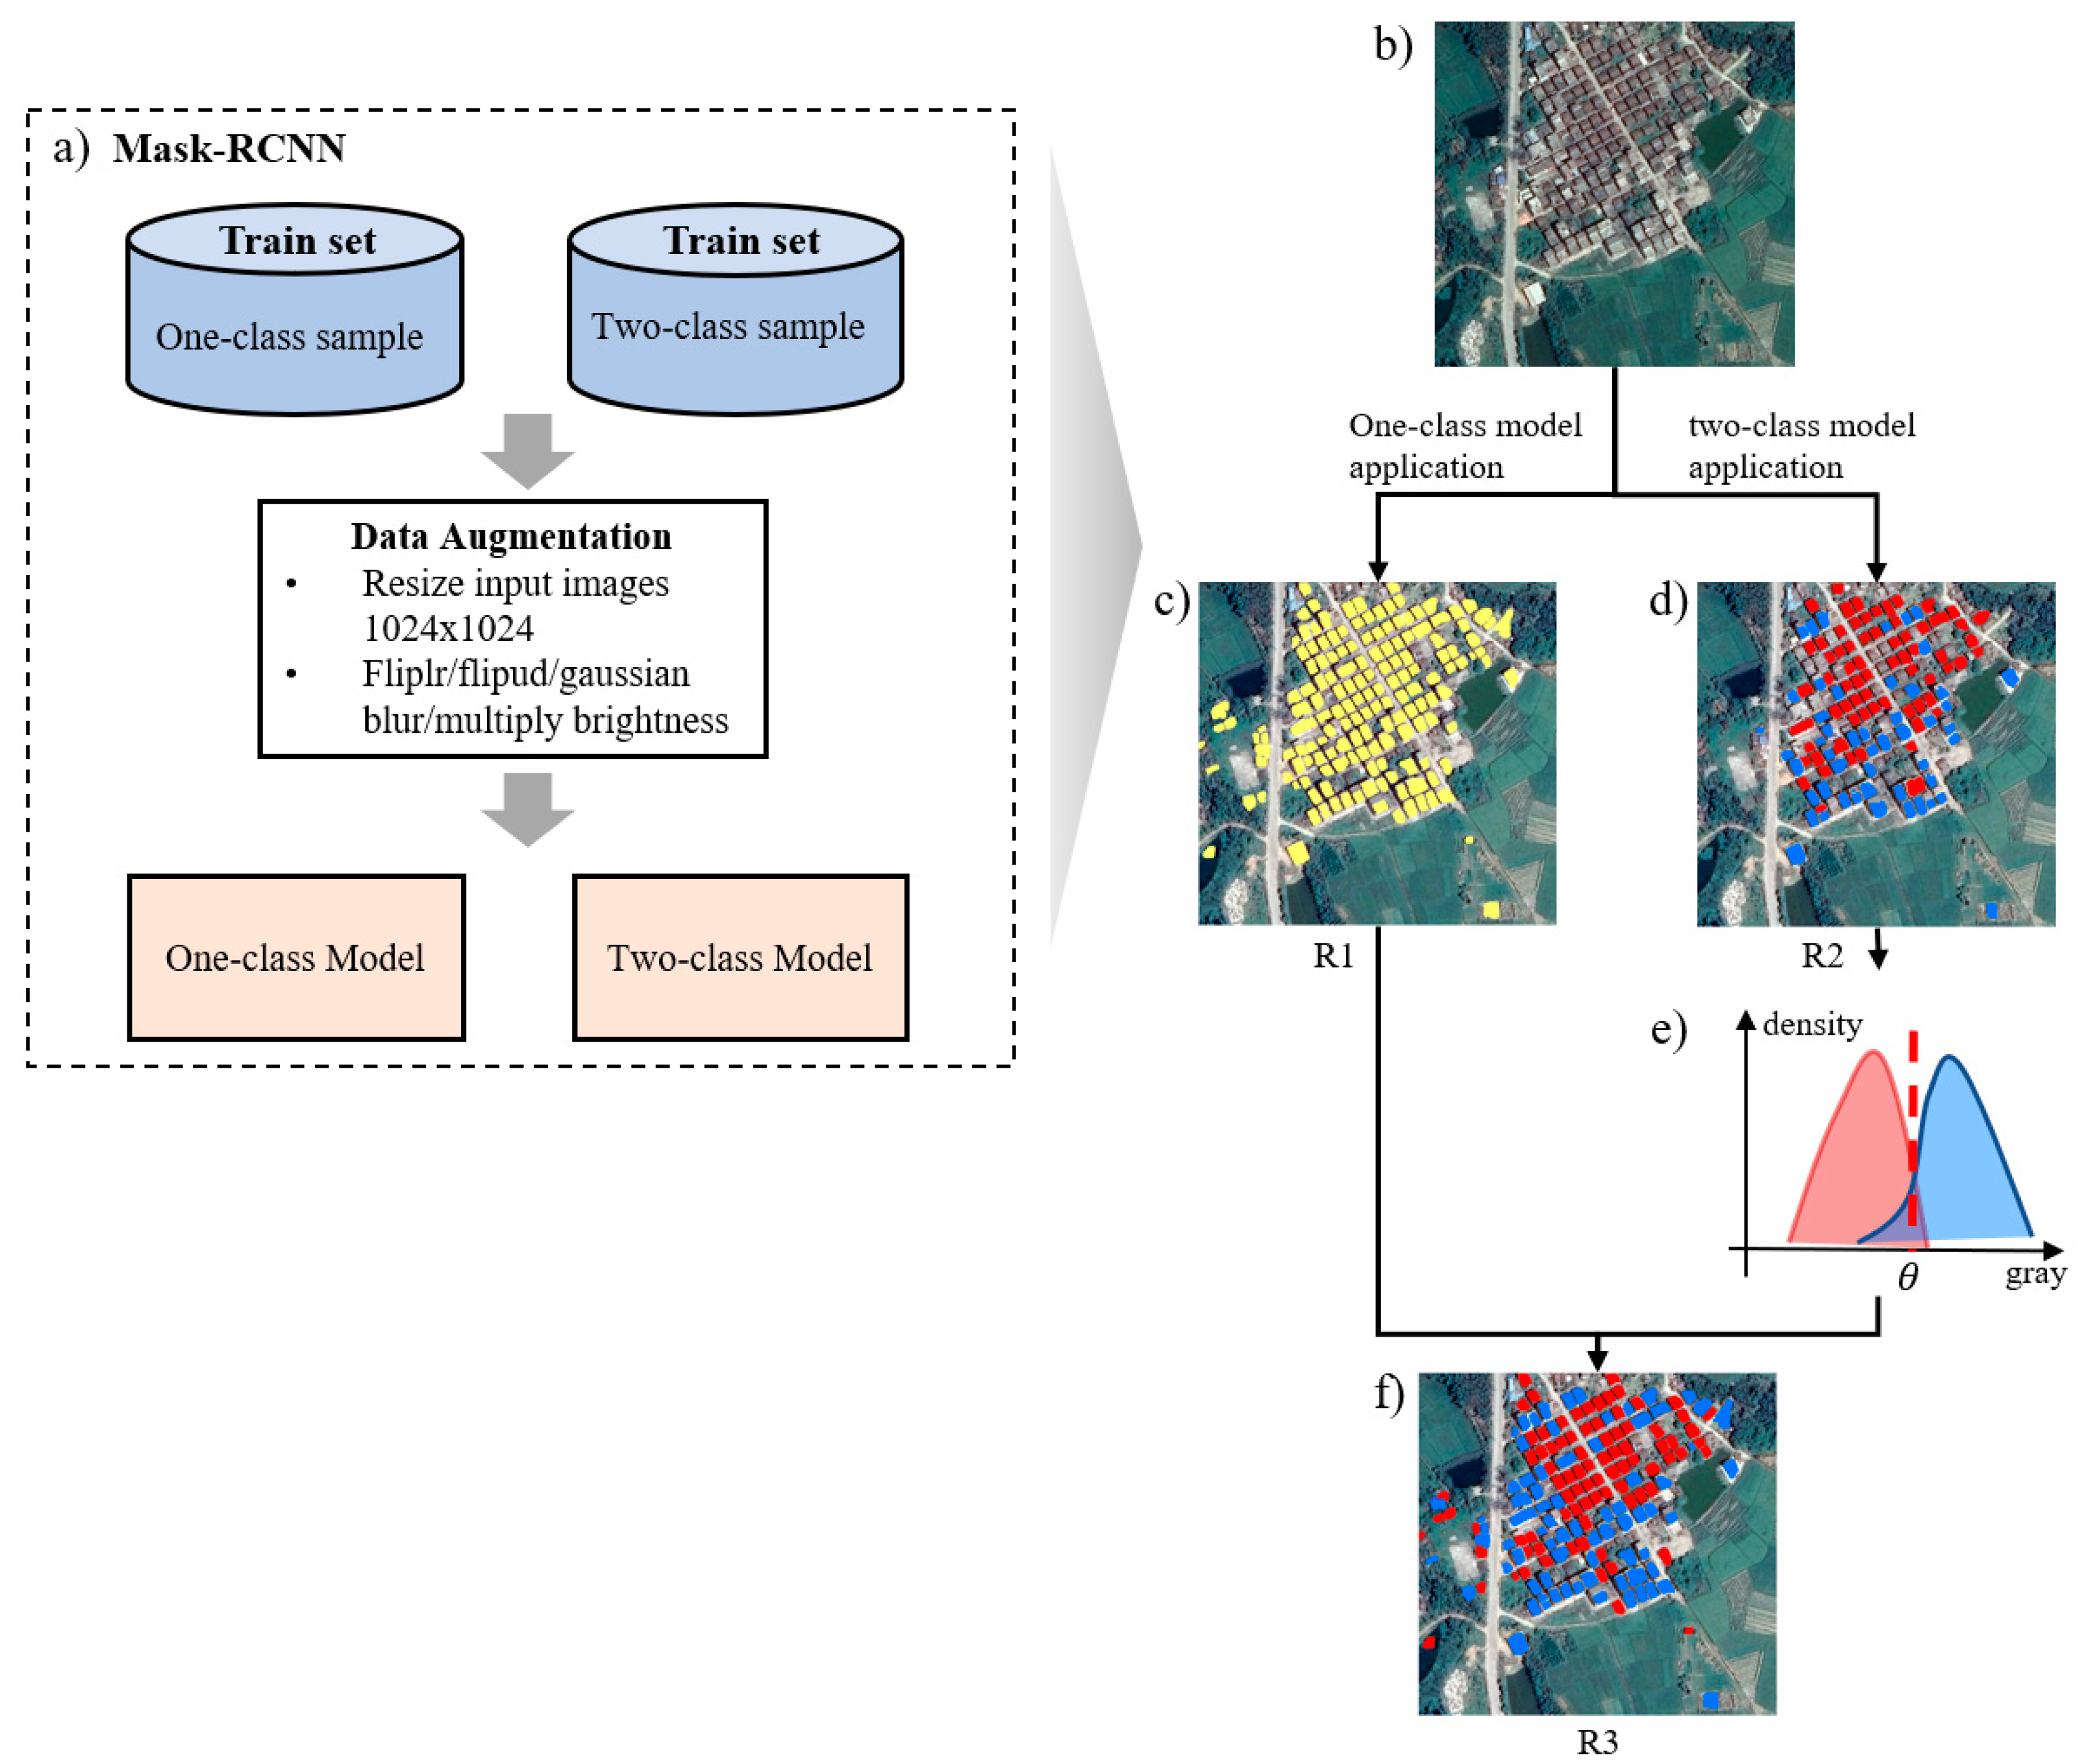
- We built two segmentation models (one-class model and two-class model) based on the one-class and two-class samples’ training sets (Figure 3a). The one-class model can extract rural buildings, while the two-class model can classify new and old rural buildings. All models used the pre-trained weights trained on the COCO dataset [40] as the base weights.
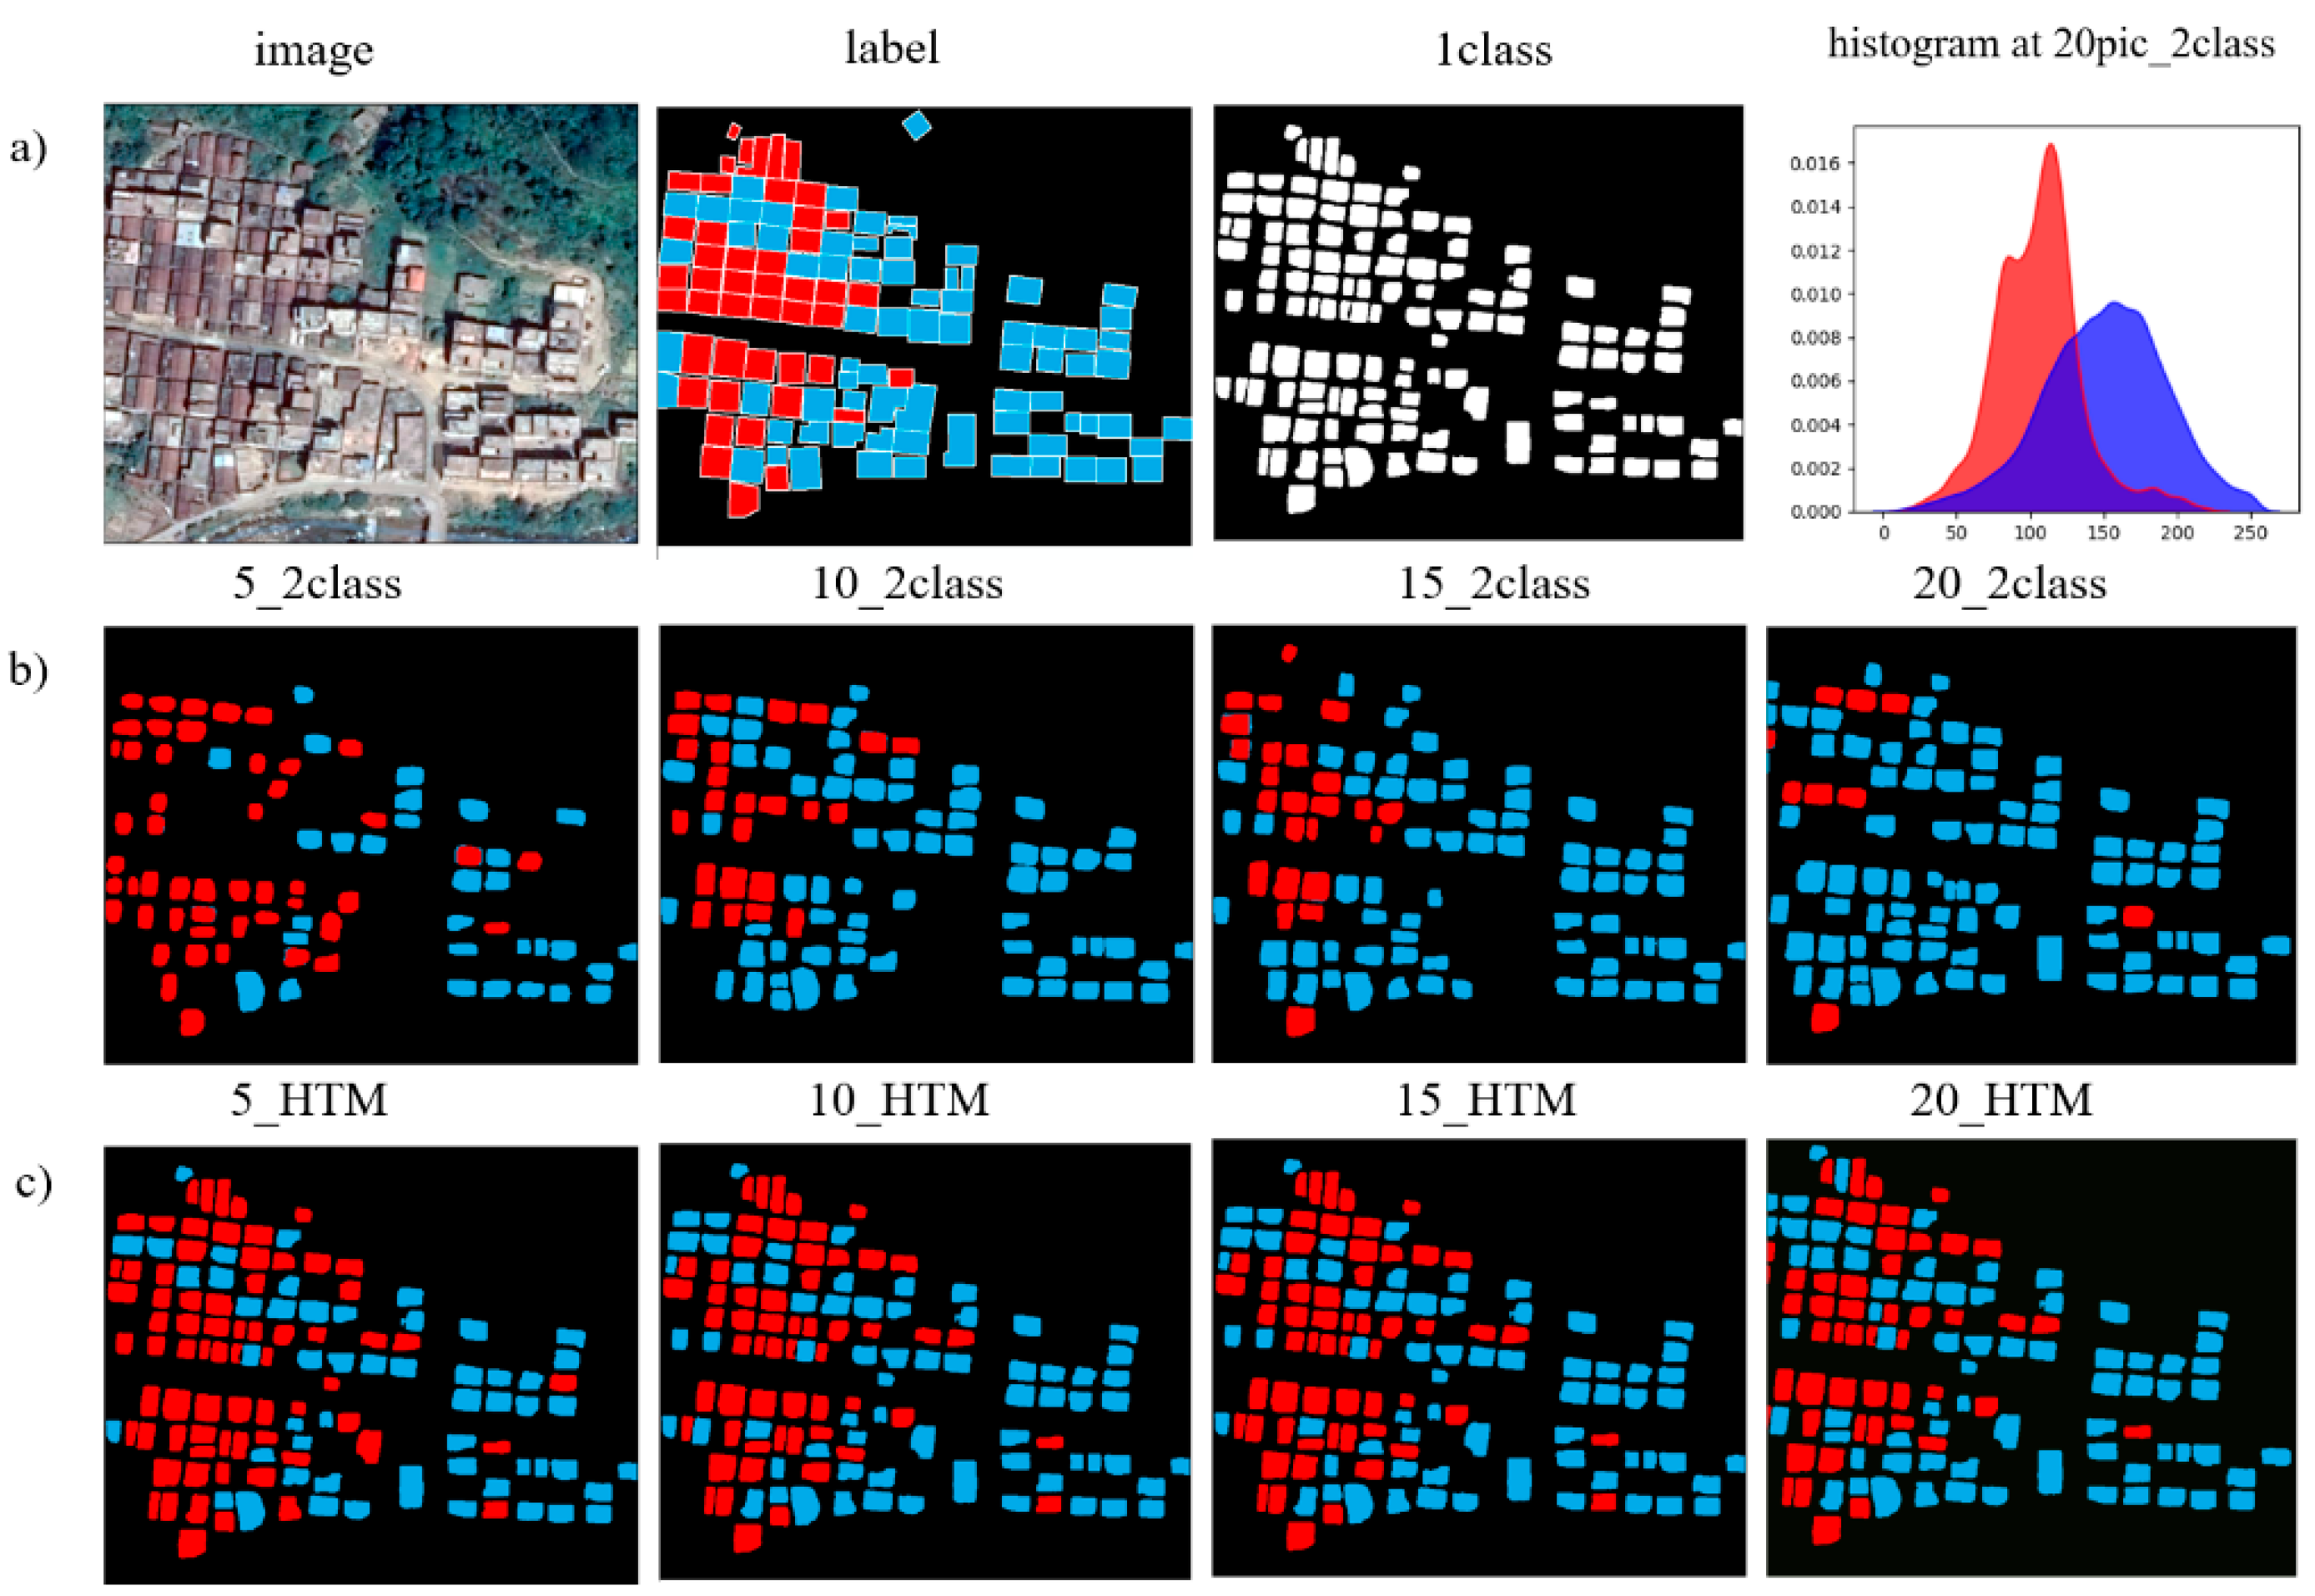
- Grayscale histograms were built using the pixels from the new and old building footprints (R2). The average grayscale levels for new and old buildings were computed as and , respectively (Figure 3e). A valley point is determined by .
- The valley point is used as the threshold to determine the type of building in R1. Finally, we get a map of the old and new buildings in R3 (Figure 3f).
3.2. Experiment
3.3. Accuracy Assessment
4. Results
5. Discussions
6. Conclusions
Supplementary Materials
Author Contributions
Funding
Institutional Review Board Statement
Informed Consent Statement
Data Availability Statement
Conflicts of Interest
References
- Zhao, X.; Sun, H.; Chen, B.; Xia, X.; Li, P. China’s rural human settlements: Qualitative evaluation, quantitative analysis and policy implications. Ecol. Indic. 2018, 105, 398–405. [Google Scholar] [CrossRef]
- Yang, R.; Xu, Q.; Long, H. Spatial distribution characteristics and optimized reconstruction analysis of China’s rural settlements during the process of rapid urbanization. Rural Stud. 2016, 47, 413–424. [Google Scholar] [CrossRef]
- Kuffer, M.; Pfeffer, K.; Sliuzas, R. Slums from space—15 years of slum mapping using remote sensing. Remote Sens. 2016, 8, 455. [Google Scholar] [CrossRef] [Green Version]
- Kuffer, M.; Persello, C.; Pfeffer, K.; Sliuzas, R.; Rao, V. Do we underestimate the global slum population? Joint Urban Remote Sensing Event (JURSE). IEEE 2019, 2019, 1–4. [Google Scholar]
- National Bureau of Statistics of China. China Statistical Yearbook 2018; China Statistics Press: Beijing, China, 2019.
- Patino, J.E.; Duque, J.C. A review of regional science applications of satellite remote sensing in urban settings. Comput. Environ. Urban Syst. 2013, 37, 1–17. [Google Scholar] [CrossRef]
- Jin, X.; Davis, C.H. Automated building extraction from high-resolution satellite imagery in urban areas using structural, contextual, and spectral information. EURASIP J. Adv. Signal Process. 2005, 2005, 745309. [Google Scholar] [CrossRef] [Green Version]
- Huang, X.; Zhang, L. Morphological building/shadow index for building extraction from high-resolution imagery over urban areas. IEEE J. Sel. Top. Appl. Earth Obs. Remote Sens. 2011, 5, 161–172. [Google Scholar] [CrossRef]
- Ghanea, M.; Moallem, P.; Momeni, M. Building extraction from high-resolution satellite images in urban areas: Recent methods and strategies against significant challenges. Int. J. Remote Sens. 2016, 37, 5234–5248. [Google Scholar] [CrossRef]
- Bachofer, F.; Braun, A.; Adamietz, F.; Murray, S.; D’Angelo, P.; Kyazze, E.; Mumuhire, A.P.; Bower, J. Building stock and building typology of kigali, rwanda. Data 2019, 4, 105. [Google Scholar] [CrossRef] [Green Version]
- Tupin, F.; Roux, M. Markov random field on region adjacency graph for the fusion of SAR and optical data in radar grammetric applications. IEEE Trans. Geosci. Remote Sens. 2005, 43, 1920–1928. [Google Scholar] [CrossRef]
- Zhang, L.; Ji, Q. Image segmentation with a unified graphical model. IEEE Trans. Pattern Anal. Mach. Intell. 2010, 32, 1406–1425. [Google Scholar] [CrossRef] [PubMed] [Green Version]
- Kurnaz, M.N.; Dokur, Z.; Ölmez, T. Segmentation of remote-sensing images by incremental neural network. Pattern Recognit. Lett. 2005, 26, 1096–1104. [Google Scholar] [CrossRef]
- Mitra, P.; Uma Shankar, B.; Pal, S.K. Segmentation of multispectral remote sensing images using active support vector machines. Pattern Recognit. Lett. 2004, 25, 1067–1074. [Google Scholar] [CrossRef]
- Audebert, N.; Le Saux, B.; Lefèvre, S. Semantic Segmentation of Earth Observation Data Using Multimodal and Multi-Scale Deep Networks; Lai, S., Lepetit, V., Nishino, K., Sato, Y., Eds.; Asian Conference on Computer Vision; Springer: Cham, Germany, 2016; pp. 180–196. [Google Scholar] [CrossRef] [Green Version]
- Guo, M.; Liu, H.; Xu, Y.; Huang, Y. Building extraction based on U-Net with an attention block and multiple losses. Remote Sens. 2020, 12, 1400. [Google Scholar] [CrossRef]
- Chen, H.; Lu, S. Building Extraction from Remote Sensing Images Using SegNet. In Proceedings of the 2019 IEEE 4th International Conference on Image, Vision and Computing (ICIVC), Xiamen, China, 5–7 July 2019; pp. 227–230. [Google Scholar]
- Murphy, K.; Yuille, A.L. Deeplab: Semantic image segmentation with deep convolutional nets, atrous convolution, and fully connected crfs. IEEE Trans. Pattern Anal. Mach. Intell. 2017, 40, 834–848. [Google Scholar]
- Arnab, A.; Zheng, S.; Jayasumana, S.; Romera-Paredes, B.; Larsson, M.; Kirillov, A.; Savchynskyy, B.; Rother, C.; Kahl, F.; Torr, P.H. Conditional random fields meet deep neural networks for semantic segmentation: Combining probabilistic graphical models with deep learning for structured prediction. IEEE Signal Process. Mag. 2018, 35, 37–52. [Google Scholar] [CrossRef]
- Pan, Z.; Xu, J.; Guo, Y.; Hu, Y.; Wang, G. Deep Learning Segmentation and Classification for Urban Village Using a Worldview Satellite Image Based on U-Net. Remote Sens. 2020, 12, 1574. [Google Scholar] [CrossRef]
- He, K.; Gkioxari, G.; Dollár, P.; Girshick, R. Mask r-cnn. In Proceedings of the IEEE International Conference on Computer Vision; 2017; pp. 2961–2969. Available online: https://openaccess.thecvf.com/content_iccv_2017/html/He_Mask_R-CNN_ICCV_2017_paper.html (accessed on 8 February 2021).
- Li, Q.; Mou, L.; Hua, Y.; Sun, Y.; Jin, P.; Shi, Y.; Zhu, X.X. Instance segmentation of buildings using keypoints. arXiv 2020, arXiv:2006.03858. [Google Scholar]
- Zhao, K.; Kang, J.; Jung, J.; Sohn, G. Building Extraction from Satellite Images Using Mask R-CNN With Building Boundary Regularization. In CVPR Workshops; IEEE: New York, NY, USA, 2018; pp. 247–251. [Google Scholar] [CrossRef]
- Mahmoud, A.; Mohamed, S.; El-Khoribi, R.; Abdelsalam, H. Object Detection Using Adaptive Mask RCNN in Optical Remote Sensing Images. Int. Intell. Eng. Syst. 2020, 13, 65–76. [Google Scholar]
- Zhang, W.; Liljedahl, A.K.; Kanevskiy, M.; Epstein, H.E.; Jones, B.M.; Jorgenson, M.T.; Kent, K. Transferability of the deep learning mask R-CNN model for automated mapping of ice-wedge polygons in high-resolution satellite and UAV images. Remote Sens. 2020, 12, 1085. [Google Scholar]
- Bhuiyan, M.A.E.; Witharana, C.; Liljedahl, A.K. Use of Very High Spatial Resolution Commercial Satellite Imagery and Deep Learning to Automatically Map Ice-Wedge Polygons across Tundra Vegetation Types. J. Imaging 2020, 6, 137. [Google Scholar] [CrossRef]
- Kaiser, P.; Wegner, D.; Lucchi, A.; Jaggi, M.; Hofmann, T.; Schindler, K. Learning Aerial Image Segmentation from Online Maps. IEEE Trans. Geosci. Remote Sens. 2017, 55, 6054–6068. [Google Scholar] [CrossRef]
- Maggiori, E.; Tarabalka, Y.; Charpiat, G.; Alliez, P. Can semantic labeling methods generalize to any city? the inria aerial image labeling benchmark. In Proceedings of the 2017 IEEE International Geoscience and Remote Sensing Symposium (IGARSS); 2017; pp. 3226–3229. [Google Scholar] [CrossRef] [Green Version]
- Ji, S.; Wei, S.; Lu, M. Fully convolutional networks for multisource building extraction from an open aerial and satellite imagery data set. IEEE Trans. Geosci. Remote Sens. 2018, 57, 574–586. [Google Scholar] [CrossRef]
- Mnih, V. Machine Learning for Aerial Image Labeling; University of Toronto (Canada): Toronto, ON, Canada, 2013. [Google Scholar]
- Wang, S.; Hou, X.; Zhao, X. Automatic building extraction from high-resolution aerial imagery via fully convolutional encoder-decoder network with non-local block. IEEE Access 2020, 8, 7313–7322. [Google Scholar] [CrossRef]
- Kang, W.; Xiang, Y.; Wang, F.; You, H. EU-net: An efficient fully convolutional network for building extraction from optical remote sensing images. Remote Sens. 2019, 11, 2813. [Google Scholar] [CrossRef] [Green Version]
- Chen, M.; Wu, J.; Liu, L.; Zhao, W.; Tian, F.; Shen, Q.; Zhao, B.; Du, R. DR-Net: An Improved Network for Building Extraction from High Resolution Remote Sensing Image. Remote Sens. 2021, 13, 294. [Google Scholar] [CrossRef]
- Sekertekin, A. A survey on global thresholding methods for mapping open water body using Sentinel-2 satellite imagery and normalized difference water index. Arch. Comput. Methods Eng. 2020, 1–13. [Google Scholar] [CrossRef]
- Li, C.; Duan, P.; Wang, M.; Li, J.; Zhang, B. The Extraction of Built-up Areas in Chinese Mainland Cities Based on the Local Optimal Threshold Method Using NPP-VIIRS Images. J. Indian Soc. Remote Sens. 2020, 1–16. [Google Scholar] [CrossRef]
- Srikanth, M.V.; Prasad, V.; Prasad, K.S. An improved firefly algorithm-based 2-d image thresholding for brain image fusion. Int. J. Cogn. Inform. Nat. Intell. (IJCINI) 2020, 14, 60–96. [Google Scholar] [CrossRef]
- Qi, Z. Rural revitalization in Xinxing County. China Econ. Wkly. 2018, 78–79. (In Chinese) [Google Scholar]
- Dutta, A.; Zisserman, A. The VIA annotation software for images, audio and video. In Proceedings of the 27th ACM International Conference on Multimedia; Association for Computing Machinery: New York, NY, USA, 2019; pp. 2276–2279. [Google Scholar]
- Wu, T.; Hu, Y.; Peng, L.; Chen, R. Improved Anchor-Free Instance Segmentation for Building Extraction from High-Resolution Remote Sensing Images. Remote Sens. 2020, 12, 2910. [Google Scholar] [CrossRef]
- Lin, T.Y.; Maire, M.; Belongie, S.; Hays, J.; Perona, P.; Ramanan, D.; Zitnick, C.L.; Dollár, P. Microsoft Coco: Common Objects in Context; European Conference on Computer Vision; Springer: Cham, Germany, 2014; pp. 740–755. [Google Scholar]
- Bottou, L. Large-scale machine learning with stochastic gradient descent. In Proceedings of COMPSTAT’2010; Physica-Verlag HD: Heidelberg, Germany, 2010; pp. 177–186. [Google Scholar]
- Luo, L.; Tang, Y.; Zou, X.; Ye, M.; Feng, W.; Li, G. Vision-based extraction of spatial information in grape clusters for harvesting robots. Biosyst. Eng. 2016, 151, 90–104. [Google Scholar] [CrossRef]
- Tang, Y.; Li, L.; Wang, C.; Chen, M.; Feng, W.; Zou, X.; Huang, K. Real-time detection of surface deformation and strain in recycled aggregate concrete-filled steel tubular columns via four-ocular vision. Robot. Comput. Integr. Manuf. 2019, 59, 36–46. [Google Scholar] [CrossRef]


| Type | Image Characteristics |
|---|---|
| old buildings |      |
| new buildings |      |
| One-Class Samples | Two-Class Samples | |||
|---|---|---|---|---|
| Buildings | New Buildings | Old Buildings | Total | |
| training | 54 pic/5359 poly | 1340 | 1081 | 20 pic/2421 poly |
| validation | 8 pic/817 poly | 439 | 378 | 8 pic/817 poly |
| test | 6 pic/892 poly | 462 | 454 | 6 pic/906 poly |
| total | 68 pic/7068 poly | 2241 | 1913 | 34 pic/4154 poly |
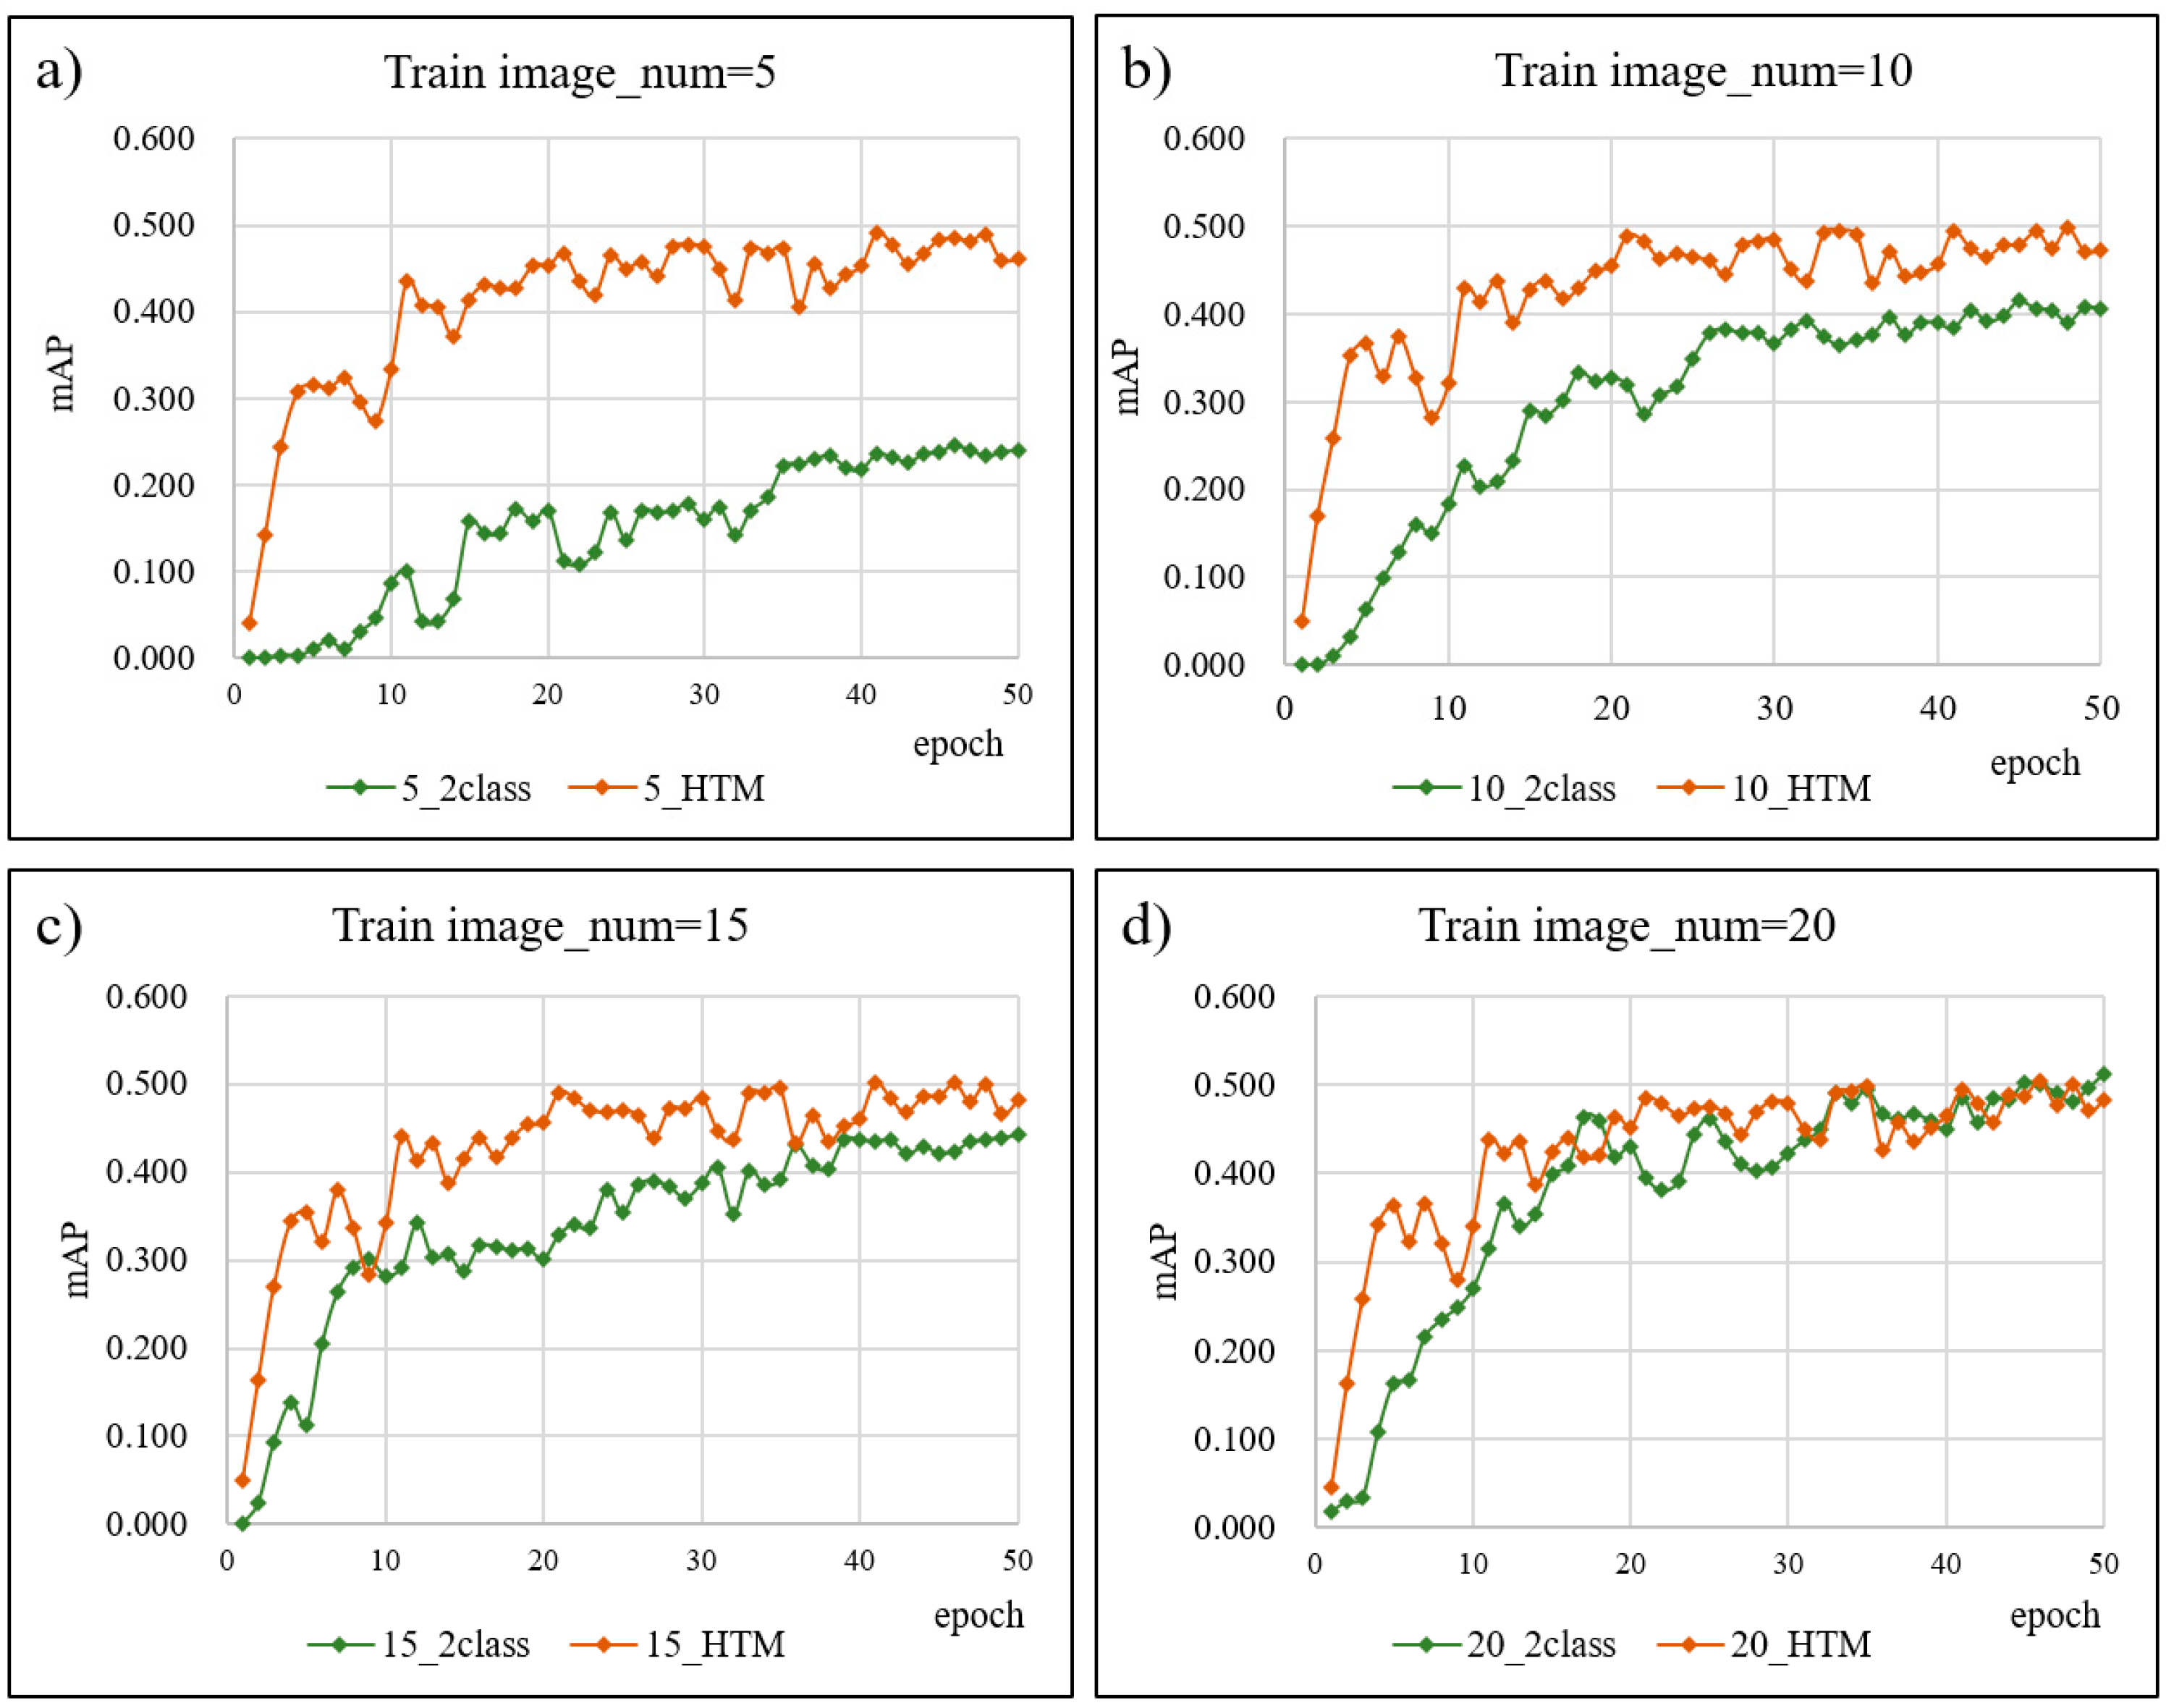
| Models\Epoch | 1 | 5 | 10 | 15 | 20 | 25 | 30 | 35 | 40 | 45 | 50 |
|---|---|---|---|---|---|---|---|---|---|---|---|
| 5_2 class | 0.00 | 0.01 | 0.09 | 0.16 | 0.17 | 0.14 | 0.16 | 0.22 | 0.22 | 0.24 | 0.24 |
| 5_HTM | 0.04 | 0.31 | 0.33 | 0.41 | 0.45 | 0.45 | 0.48 | 0.47 | 0.45 | 0.48 | 0.46 |
| 10_2 class | 0.00 | 0.06 | 0.18 | 0.29 | 0.33 | 0.35 | 0.37 | 0.37 | 0.39 | 0.41 | 0.41 |
| 10 pic_ HTM | 0.05 | 0.37 | 0.32 | 0.43 | 0.45 | 0.46 | 0.48 | 0.49 | 0.46 | 0.48 | 0.47 |
| 15_2 class | 0.00 | 0.11 | 0.28 | 0.29 | 0.30 | 0.35 | 0.39 | 0.39 | 0.44 | 0.42 | 0.44 |
| 15 pic_HTM | 0.05 | 0.35 | 0.34 | 0.41 | 0.46 | 0.47 | 0.48 | 0.49 | 0.46 | 0.49 | 0.48 |
| 20_2 class | 0.02 | 0.16 | 0.27 | 0.40 | 0.43 | 0.46 | 0.42 | 0.49 | 0.45 | 0.50 | 0.51 |
| 20_HTM | 0.05 | 0.36 | 0.34 | 0.42 | 0.45 | 0.47 | 0.48 | 0.50 | 0.46 | 0.49 | 0.48 |
Publisher’s Note: MDPI stays neutral with regard to jurisdictional claims in published maps and institutional affiliations. |
© 2021 by the authors. Licensee MDPI, Basel, Switzerland. This article is an open access article distributed under the terms and conditions of the Creative Commons Attribution (CC BY) license (http://creativecommons.org/licenses/by/4.0/).
Share and Cite
Li, Y.; Xu, W.; Chen, H.; Jiang, J.; Li, X. A Novel Framework Based on Mask R-CNN and Histogram Thresholding for Scalable Segmentation of New and Old Rural Buildings. Remote Sens. 2021, 13, 1070. https://0-doi-org.brum.beds.ac.uk/10.3390/rs13061070
Li Y, Xu W, Chen H, Jiang J, Li X. A Novel Framework Based on Mask R-CNN and Histogram Thresholding for Scalable Segmentation of New and Old Rural Buildings. Remote Sensing. 2021; 13(6):1070. https://0-doi-org.brum.beds.ac.uk/10.3390/rs13061070
Chicago/Turabian StyleLi, Ying, Weipan Xu, Haohui Chen, Junhao Jiang, and Xun Li. 2021. "A Novel Framework Based on Mask R-CNN and Histogram Thresholding for Scalable Segmentation of New and Old Rural Buildings" Remote Sensing 13, no. 6: 1070. https://0-doi-org.brum.beds.ac.uk/10.3390/rs13061070