
Individual Tree Detection and Qualitative Inventory of a Eucalyptus sp. Stand Using UAV Photogrammetry Data

 , , , , ,
Abstract
:
1. Introduction
2. Materials and Methods
2.1. Study Area
2.2. Forest Inventory Data
2.3. Silvicultural Quality of the Stand
2.4. Digital Aerial Photogrammetry
2.4.1. UAV Data Collection
2.4.2. Structure from Motion Processing
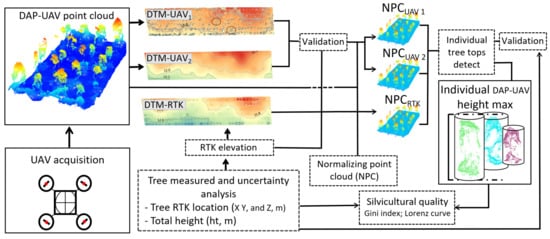
2.4.3. Digital Terrain Model
2.4.4. Tree Tops Detection
2.5. Digital Aerial Photogrammetry Assessment
2.5.1. DTM_UAV
2.5.2. Tree Tops Detection
2.5.3. Tree Height
2.6. Modeled Heights
2.7. Stand Silvicultural Quality via DAP-UAV
3. Results
3.1. DAP Assessment
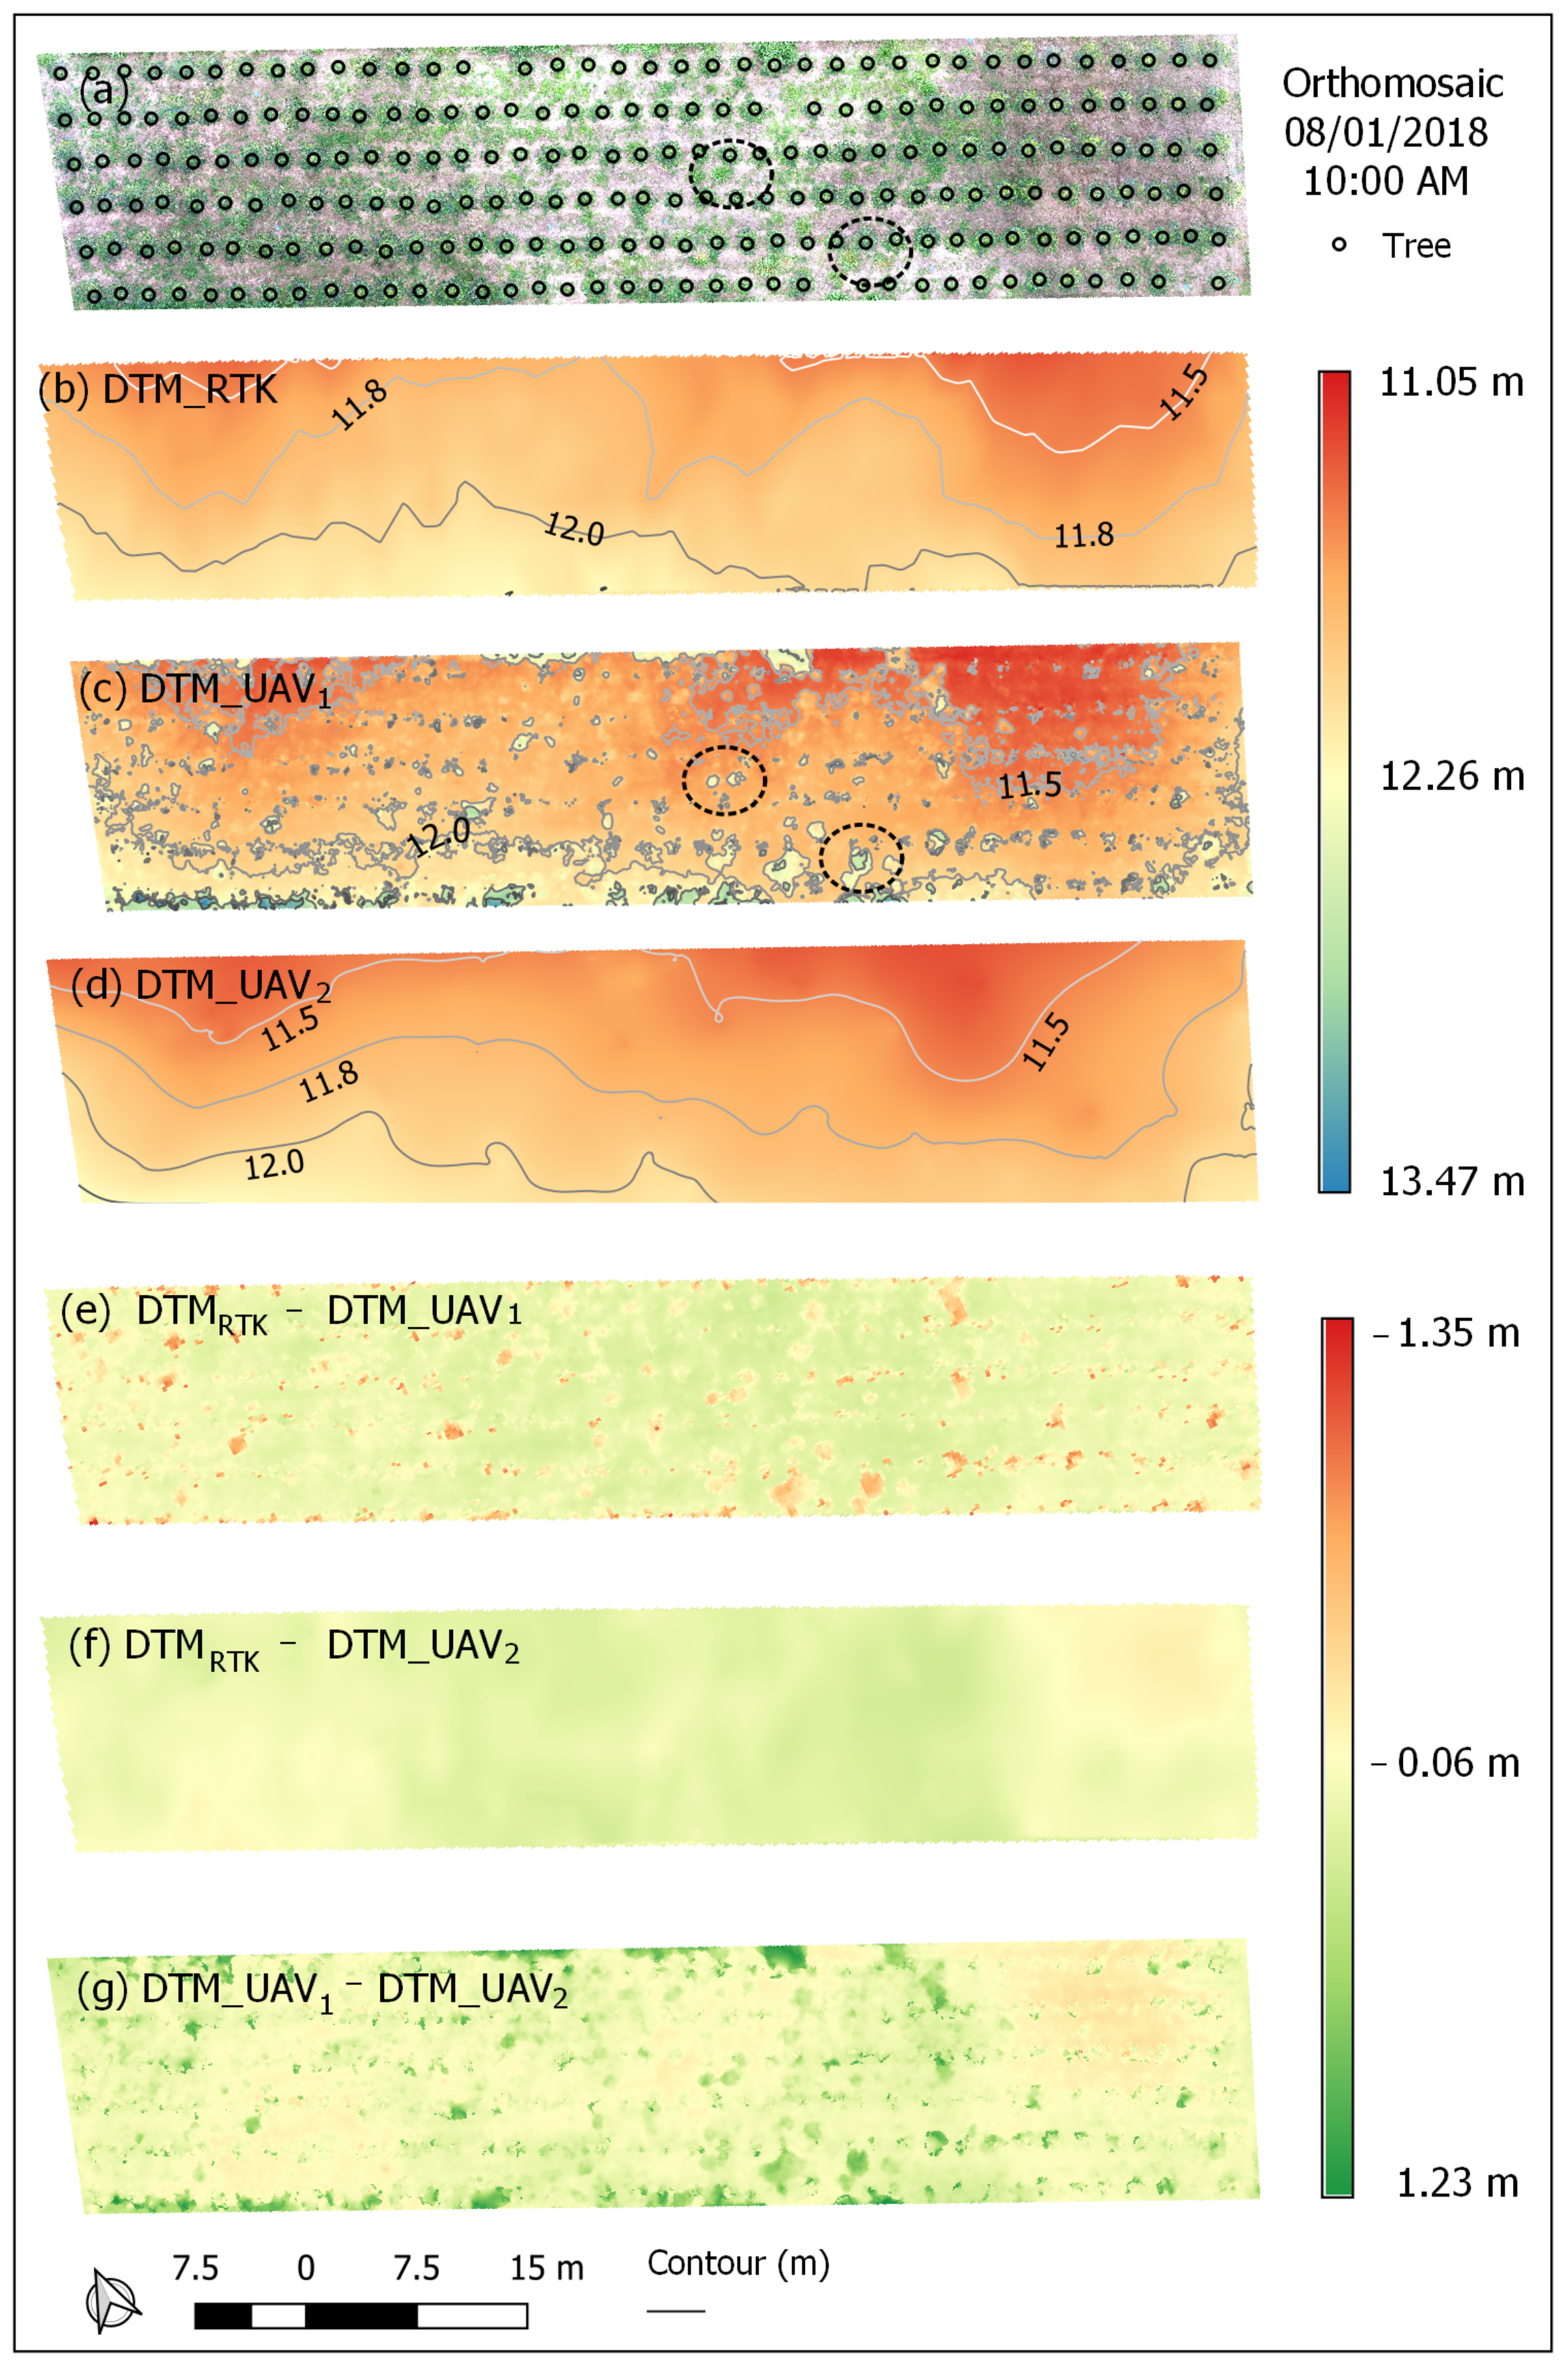
3.1.1. DTM_UAV
3.1.2. Tree Tops Detection
3.1.3. Tree Height
3.2. Modelled Tree Height
3.3. Silvicultural Quality of the Stand
4. Discussion
4.1. DTMs Assessment
4.2. Tree Tops Detection
4.3. Tree Height
4.4. Modelled Tree Height
4.5. Stand Silvicultural Quality
5. Conclusions
Author Contributions
Funding
Institutional Review Board Statement
Informed Consent Statement
Acknowledgments
Conflicts of Interest
Abbreviations
| ABA | Area-based approach |
| Correctly detected | |
| Commission Error | |
| Coefficient of Variation | |
| Canopy Relief Ratio | |
| DAP | Digital Aerial photogrammetry |
| DTM | Digital Terrain Model |
| GSD | Ground Sample Distance |
| GCPs | Ground Control Points |
| GPP | Gross Primary Product |
| GNSS | Global satellite navigation systems |
| ITD | Individual Tree Detection |
| LIDAR | Light Detection and Ranging |
| LMF | Local Maximum Filter |
| NPC | Normalized Point Cloud |
| Omission error | |
| 50 | Percentage of cumulative heights for the 50% lowest trees |
| RMSE | Root Mean Square Error |
| RMSD | Root Mean Square Deviation |
| RTK | Real-Time Kinematic |
| SfM | Structure from Motion |
| SIRGAS | Sistema de Referencia Geocéntrico para las Américas |
| TIN | Triangulated Irregular Network |
| UTM | Universal Transversa de Mercator |
| UAV | Unmanned Aerial Vehicles |
| VLOS | Visual Line of Sight |
References
- Indústria Brasileira de Árvores (IBÁ). Relatório 2019; Technical Report Relatório Anual; OSAC: São Paulo, Brazil, 2019.
- Tomé, M.; Burkhart, H.E. Distance-Dependent Competition Measures for Predicting Growth of Individual Trees. For. Sci. 1989, 35, 816–831. [Google Scholar] [CrossRef]
- Hakamada, R.E.; Stape, J.L.; Lemos, C.C.Z.d.; Almeida, A.E.A.; Silva, L.F. Uniformidade Entre árvores durante uma rotação e sua relação com a produtividade em Eucalyptus clonais. CERNE 2015, 21, 465–472. [Google Scholar] [CrossRef] [Green Version]
- Lorenz, M.O. Methods of Measuring the Concentration of Wealth. Publ. Am. Stat. Assoc. 1905, 9, 209–219. [Google Scholar] [CrossRef]
- Weiner, J.; Solbrig, O.T. The meaning and measurement of size hierarchies in plant populations. Oecologia 1984, 61, 334–336. [Google Scholar] [CrossRef]
- Valbuena, R.; Vauhkonen, J.; Packalen, P.; Pitkänen, J.; Maltamo, M. Comparison of airborne laser scanning methods for estimating forest structure indicators based on Lorenz curves. ISPRS J. Photogramm. Remote Sens. 2014, 95, 23–33. [Google Scholar] [CrossRef] [Green Version]
- Valbuena, R.; Maltamo, M.; Martín-Fernández, S.; Packalen, P.; Pascual, C.; Nabuurs, G.J. Patterns of covariance between airborne laser scanning metrics and Lorenz curve descriptors of tree size inequality. Can. J. Remote Sens. 2013, 39, S18–S31. [Google Scholar] [CrossRef]
- Burkhart, H.E.; Tomé, M. Modeling Forest Trees and Stands; Springer Science & Business Media: Dordrecht, The Netherlands, 2012; p. 458. [Google Scholar]
- Bauwens, S.; Bartholomeus, H.; Calders, K.; Lejeune, P. Forest Inventory with Terrestrial LiDAR: A Comparison of Static and Hand-Held Mobile Laser Scanning. Forests 2016, 7, 127. [Google Scholar] [CrossRef] [Green Version]
- Hyyppä, J.; Hyyppä, H.; Inkinen, M.; Engdahl, M.; Linko, S.; Zhu, Y.H. Accuracy comparison of various remote sensing data sources in the retrieval of forest stand attributes. For. Ecol. Manag. 2000, 128, 109–120. [Google Scholar] [CrossRef]
- Næsset, E. Estimating timber volume of forest stands using airborne laser scanner data. Remote Sens. Environ. 1997, 61, 246–253. [Google Scholar] [CrossRef]
- Wulder, M.A.; Coops, N.C.; Hudak, A.T.; Morsdorf, F.; Nelson, R.; Newnham, G.; Vastaranta, M. Status and prospects for LiDAR remote sensing of forested ecosystems. Can. J. Remote Sens. 2013, 39, S1–S5. [Google Scholar] [CrossRef] [Green Version]
- Beland, M.; Parker, G.; Sparrow, B.; Harding, D.; Chasmer, L.; Phinn, S.; Antonarakis, A.; Strahler, A. On promoting the use of lidar systems in forest ecosystem research. For. Ecol. Manag. 2019, 450, 117484. [Google Scholar] [CrossRef]
- González-Ferreiro, E.; Diéguez-Aranda, U.; Miranda, D. Estimation of stand variables in Pinus radiata D. Don plantations using different LiDAR pulse densities. For. Int. J. For. Res. 2012, 85, 281–292. [Google Scholar] [CrossRef]
- Packalén, P.; Mehtätalo, L.; Maltamo, M. ALS-based estimation of plot volume and site index in a eucalyptus plantation with a nonlinear mixed-effect model that accounts for the clone effect. Ann. For. Sci. 2011, 68, 1085–1092. [Google Scholar] [CrossRef] [Green Version]
- Dalla Corte, A.P.; Rex, F.E.; de Almeida, D.R.A.; Sanquetta, C.R.; Silva, C.A.; Moura, M.M.; Wilkinson, B.; Zambrano, A.M.A.; da Cunha Neto, E.M.; Veras, H.F.P.; et al. Measuring Individual Tree Diameter and Height Using GatorEye High-Density UAV-Lidar in an Integrated Crop-Livestock-Forest System. Remote Sens. 2020, 12, 863. [Google Scholar] [CrossRef] [Green Version]
- Leite, R.V.; do Amaral, C.H.; de Paula Pires, R.; Silva, C.A.; Soares, C.P.B.; Macedo, R.P.; da Silva, A.A.L.; Broadbent, E.N.; Mohan, M.; Leite, H.G. Estimating Stem Volume in Eucalyptus Plantations Using Airborne LiDAR: A Comparison of Area- and Individual Tree-Based Approaches. Remote Sens. 2020, 12, 1513. [Google Scholar] [CrossRef]
- Gobakken, T.; Bollandsås, O.M.; Næsset, E. Comparing biophysical forest characteristics estimated from photogrammetric matching of aerial images and airborne laser scanning data. Scand. J. For. Res. 2015, 30, 73–86. [Google Scholar] [CrossRef]
- Puliti, S.; Gobakken, T.; Ørka, H.O.; Næsset, E. Assessing 3D point clouds from aerial photographs for species-specific forest inventories. Scand. J. For. Res. 2017, 32, 68–79. [Google Scholar] [CrossRef]
- Iglhaut, J.; Cabo, C.; Puliti, S.; Piermattei, L.; O’Connor, J.; Rosette, J. Structure from Motion Photogrammetry in Forestry: A Review. Curr. For. Rep. 2019, 5, 155–168. [Google Scholar] [CrossRef] [Green Version]
- Almeida, A.; Gonçalves, F.; Silva, G.; Souza, R.; Treuhaft, R.; Santos, W.; Loureiro, D.; Fernandes, M. Estimating Structure and Biomass of a Secondary Atlantic Forest in Brazil Using Fourier Transforms of Vertical Profiles Derived from UAV Photogrammetry Point Clouds. Remote Sens. 2020, 12, 3560. [Google Scholar] [CrossRef]
- Baltsavias, E.P. A comparison between photogrammetry and laser scanning. ISPRS J. Photogramm. Remote Sens. 1999, 54, 83–94. [Google Scholar] [CrossRef]
- Goodbody, T.R.H.; Coops, N.C.; White, J.C. Digital Aerial Photogrammetry for Updating Area-Based Forest Inventories: A Review of Opportunities, Challenges, and Future Directions. Curr. For. Rep. 2019, 5, 55–75. [Google Scholar] [CrossRef] [Green Version]
- Guerra-Hernández, J.; Cosenza, D.N.; Rodriguez, L.C.E.; Silva, M.; Tomé, M.; Díaz-Varela, R.A.; González-Ferreiro, E. Comparison of ALS- and UAV(SfM)-derived high-density point clouds for individual tree detection in Eucalyptus plantations. Int. J. Remote Sens. 2018, 39, 5211–5235. [Google Scholar] [CrossRef]
- Guerra-Hernández, J.; Cosenza, D.N.; Cardil, A.; Silva, C.A.; Botequim, B.; Soares, P.; Silva, M.; González-Ferreiro, E.; Díaz-Varela, R.A. Predicting Growing Stock Volume of Eucalyptus Plantations Using 3-D Point Clouds Derived from UAV Imagery and ALS Data. Forests 2019, 10, 905. [Google Scholar] [CrossRef] [Green Version]
- Torresan, C.; Berton, A.; Carotenuto, F.; Gennaro, S.F.D.; Gioli, B.; Matese, A.; Miglietta, F.; Vagnoli, C.; Zaldei, A.; Wallace, L. Forestry applications of UAVs in Europe: A review. Int. J. Remote Sens. 2017, 38, 2427–2447. [Google Scholar] [CrossRef]
- Leite, R.V.; Silva, C.A.; Mohan, M.; Cardil, A.; de Almeida, D.R.A.; Carvalho, S.d.P.C.e.; Jaafar, W.S.W.M.; Guerra-Hernández, J.; Weiskittel, A.; Hudak, A.T.; et al. Individual Tree Attribute Estimation and Uniformity Assessment in Fast-Growing Eucalyptus spp. Forest Plantations Using Lidar and Linear Mixed-Effects Models. Remote Sens. 2020, 12, 3599. [Google Scholar] [CrossRef]
- Dandois, J.P.; Ellis, E.C. High spatial resolution three-dimensional mapping of vegetation spectral dynamics using computer vision. Remote Sens. Environ. 2013, 136, 259–276. [Google Scholar] [CrossRef] [Green Version]
- Wallace, L.; Lucieer, A.; Malenovský, Z.; Turner, D.; Vopěnka, P. Assessment of Forest Structure Using Two UAV Techniques: A Comparison of Airborne Laser Scanning and Structure from Motion (SfM) Point Clouds. Forests 2016, 7, 62. [Google Scholar] [CrossRef] [Green Version]
- Dandois, J.P.; Olano, M.; Ellis, E.C. Optimal Altitude, Overlap, and Weather Conditions for Computer Vision UAV Estimates of Forest Structure. Remote Sens. 2015, 7, 13895–13920. [Google Scholar] [CrossRef] [Green Version]
- Swinfield, T.; Lindsell, J.A.; Williams, J.V.; Harrison, R.D.; Agustiono; Habibi; Gemita, E.; Schönlieb, C.B.; Coomes, D.A. Accurate Measurement of Tropical Forest Canopy Heights and Aboveground Carbon Using Structure From Motion. Remote Sens. 2019, 11, 928. [Google Scholar] [CrossRef] [Green Version]
- Dandois, J.P.; Baker, M.; Olano, M.; Parker, G.G.; Ellis, E.C. What is the Point? Evaluating the Structure, Color, and Semantic Traits of Computer Vision Point Clouds of Vegetation. Remote Sens. 2017, 9, 355. [Google Scholar] [CrossRef] [Green Version]
- Zarco-Tejada, P.J.; Diaz-Varela, R.; Angileri, V.; Loudjani, P. Tree height quantification using very high resolution imagery acquired from an unmanned aerial vehicle (UAV) and automatic 3D photo-reconstruction methods. Eur. J. Agron. 2014, 55, 89–99. [Google Scholar] [CrossRef]
- Lin, W.; Meng, Y.; Qiu, Z.; Zhang, S.; Wu, J. Measurement and calculation of crown projection area and crown volume of individual trees based on 3D laser-scanned point-cloud data. Int. J. Remote Sens. 2017, 38, 1083–1100. [Google Scholar] [CrossRef]
- Alcudia-Aguilar, A.; Martínez-Zurimendi, P.; van der Wal, H.; Castillo-Uzcanga, M.M.; Suárez-Sánchez, J. Allometric Estimation of the Biomass of Musa spp. in Homegardens of Tabasco, Mexico. Trop. Subtrop. Agroecosyst. 2019, 22, 143–152. [Google Scholar]
- Axelsson, P. Processing of laser scanner data—Algorithms and applications. ISPRS J. Photogramm. Remote Sens. 1999, 54, 138–147. [Google Scholar] [CrossRef]
- Hentz, A.M.K.; Silva, C.A.; Corte, A.P.D.; Netto, S.P.; Strager, M.P.; Klauberg, C. Estimating forest uniformity in Eucalyptus spp. and Pinus taeda L. stands using field measurements and structure from motion point clouds generated from unmanned aerial vehicle (UAV) data collection. For. Syst. 2018, 27, 1. [Google Scholar] [CrossRef]
- Næsset, E. Predicting forest stand characteristics with airborne scanning laser using a practical two-stage procedure and field data. Remote Sens. Environ. 2002, 80, 88–99. [Google Scholar] [CrossRef]
- Hyyppa, J. Detecting and estimating attributes for single trees using laser scanner. Photogramm. J. Finl. 1999, 16, 27–42. [Google Scholar]
- Strîmbu, V.F.; Strîmbu, B.M. A graph-based segmentation algorithm for tree crown extraction using airborne LiDAR data. ISPRS J. Photogramm. Remote Sens. 2015, 104, 30–43. [Google Scholar] [CrossRef] [Green Version]
- Wan Mohd Jaafar, W.S.; Woodhouse, I.H.; Silva, C.A.; Omar, H.; Abdul Maulud, K.N.; Hudak, A.T.; Klauberg, C.; Cardil, A.; Mohan, M. Improving Individual Tree Crown Delineation and Attributes Estimation of Tropical Forests Using Airborne LiDAR Data. Forests 2018, 9, 759. [Google Scholar] [CrossRef] [Green Version]
- Liu, G.; Wang, J.; Dong, P.; Chen, Y.; Liu, Z. Estimating Individual Tree Height and Diameter at Breast Height (DBH) from Terrestrial Laser Scanning (TLS) Data at Plot Level. Forests 2018, 9, 398. [Google Scholar] [CrossRef] [Green Version]
- Mohan, M.; Silva, C.A.; Klauberg, C.; Jat, P.; Catts, G.; Cardil, A.; Hudak, A.T.; Dia, M. Individual Tree Detection from Unmanned Aerial Vehicle (UAV) Derived Canopy Height Model in an Open Canopy Mixed Conifer Forest. Forests 2017, 8, 340. [Google Scholar] [CrossRef] [Green Version]
- Krause, S.; Sanders, T.G.M.; Mund, J.P.; Greve, K. UAV-Based Photogrammetric Tree Height Measurement for Intensive Forest Monitoring. Remote Sens. 2019, 11, 758. [Google Scholar] [CrossRef] [Green Version]
- Larjavaara, M.; Muller-Landau, H.C. Measuring tree height: A quantitative comparison of two common field methods in a moist tropical forest. Methods Ecol. Evol. 2013, 4, 793–801. [Google Scholar] [CrossRef]
- Butt, N.; Slade, E.; Thompson, J.; Malhi, Y.; Riutta, T. Quantifying the sampling error in tree census measurements by volunteers and its effect on carbon stock estimates. Ecol. Appl. 2013, 23, 936–943. [Google Scholar] [CrossRef]
- Köppen, W. Climatologia: Con un Estudio de los Climas de la Tierra; Fundo de Cultura Econômica: México City, México, 1948; 478p. [Google Scholar]
- Xavier, A.C.; King, C.W.; Scanlon, B.R. Daily gridded meteorological variables in Brazil (1980–2013). Int. J. Climatol. 2016, 36, 2644–2659. [Google Scholar] [CrossRef] [Green Version]
- Empresa Brasileira de Pequisa Agropecuária-EMBRAPA. Sistema Brasileiro de Classificação de Solos, 3rd ed.; Empresa Brasileira de Pequisa Agropecuária-EMBRAPA: Brasilia, Brazil, 2013; 353p. [Google Scholar]
- QGIS. QGIS geographic information system. Open Source Geospat. Found. Proj. 2020, 1, 1–10. [Google Scholar]
- Gonçalves, F.; Treuhaft, R.; Law, B.; Almeida, A.; Walker, W.; Baccini, A.; Dos Santos, J.R.; Graça, P. Estimating Aboveground Biomass in Tropical Forests: Field Methods and Error Analysis for the Calibration of Remote Sensing Observations. Remote Sens. 2017, 9, 47. [Google Scholar] [CrossRef]
- Meng, J.; Li, S.; Wang, W.; Liu, Q.; Xie, S.; Ma, W. Mapping forest health using spectral and textural information extracted from spot-5 satellite images. Remote Sens. 2016, 8, 719. [Google Scholar] [CrossRef] [Green Version]
- Ozdemir, I.; Karnieli, A. Predicting forest structural parameters using the image texture derived from WorldView-2 multispectral imagery in a dryland forest, Israel. Int. J. Appl. Earth Obs. Geoinf. 2011, 13, 701–710. [Google Scholar] [CrossRef]
- Manzanera, J.A.; García-Abril, A.; Pascual, C.; Tejera, R.; Martín-Fernández, S.; Tokola, T.; Valbuena, R. Fusion of airborne LiDAR and multispectral sensors reveals synergic capabilities in forest structure characterization. GISci. Remote Sens. 2016, 53, 723–738. [Google Scholar] [CrossRef]
- Bourdier, T.; Cordonnier, T.; Kunstler, G.; Piedallu, C.; Lagarrigues, G.; Courbaud, B. Tree Size Inequality Reduces Forest Productivity: An Analysis Combining Inventory Data for Ten European Species and a Light Competition Model. PLoS ONE 2016, 11, e0151852. [Google Scholar] [CrossRef]
- Valbuena, R.; Packalén, P.; Martı´n-Fernández, S.; Maltamo, M. Diversity and equitability ordering profiles applied to study forest structure. For. Ecol. Manag. 2012, 276, 185–195. [Google Scholar] [CrossRef] [Green Version]
- Popescu, S.C.; Wynne, R.H. Seeing the Trees in the Forest. Photogramm. Eng. Remote Sens. 2004, 70, 589–604. [Google Scholar] [CrossRef] [Green Version]
- Roussel, J.R.; Auty, D.; Coops, N.C.; Tompalski, P.; Goodbody, T.R.H.; Meador, A.S.; Bourdon, J.F.; de Boissieu, F.; Achim, A. lidR: An R package for analysis of Airborne Laser Scanning (ALS) data. Remote Sens. Environ. 2020, 251, 112061. [Google Scholar] [CrossRef]
- RC Team. R: The R Project for Statistical Computing. 2019. Available online: https://www.r-project.org/ (accessed on 30 March 2020).
- Vastaranta, M.; Kankare, V.; Holopainen, M.; Yu, X.; Hyyppä, J.; Hyyppä, H. Combination of individual tree detection and area-based approach in imputation of forest variables using airborne laser data. ISPRS J. Photogramm. Remote Sens. 2012, 67, 73–79. [Google Scholar] [CrossRef]
- Vastaranta, M.; Holopainen, M.; Yu, X.; Haapanen, R.; Melkas, T.; Hyyppä, J.; Hyyppä, H. Individual tree detection and area-based approach in retrieval of forest inventory characteristics from low-pulse airbone laser scanning data. Photogramm. J. Finl. 2011, 22, 1–13. [Google Scholar]
- Gu, J.; Grybas, H.; Congalton, R.G. Individual Tree Crown Delineation from UAS Imagery Based on Region Growing and Growth Space Considerations. Remote Sens. 2020, 12, 2363. [Google Scholar] [CrossRef]
- Wu, B.; Yu, B.; Wu, Q.; Huang, Y.; Chen, Z.; Wu, J. Individual tree crown delineation using localized contour tree method and airborne LiDAR data in coniferous forests. Int. J. Appl. Earth Obs. Geoinf. 2016, 52, 82–94. [Google Scholar] [CrossRef]
- Khosravipour, A.; Skidmore, A.K.; Wang, T.; Isenburg, M.; Khoshelham, K. Effect of slope on treetop detection using a LiDAR Canopy Height Model. ISPRS J. Photogramm. Remote Sens. 2015, 104, 44–52. [Google Scholar] [CrossRef]
- Keränen, J.; Maltamo, M.; Packalen, P. Effect of flying altitude, scanning angle and scanning mode on the accuracy of ALS based forest inventory. Int. J. Appl. Earth Obs. Geoinf. 2016, 52, 349–360. [Google Scholar] [CrossRef]
- Zahawi, R.A.; Dandois, J.P.; Holl, K.D.; Nadwodny, D.; Reid, J.L.; Ellis, E.C. Using lightweight unmanned aerial vehicles to monitor tropical forest recovery. Biol. Conserv. 2015, 186, 287–295. [Google Scholar] [CrossRef] [Green Version]
- Panagiotidis, D.; Abdollahnejad, A.; Surový, P.; Chiteculo, V. Determining tree height and crown diameter from high-resolution UAV imagery. Int. J. Remote Sens. 2017, 38, 2392–2410. [Google Scholar] [CrossRef]
- Mlambo, R.; Woodhouse, I.H.; Gerard, F.; Anderson, K. Structure from Motion (SfM) Photogrammetry with Drone Data: A Low Cost Method for Monitoring Greenhouse Gas Emissions from Forests in Developing Countries. Forests 2017, 8, 68. [Google Scholar] [CrossRef] [Green Version]
- Guerra-Hernández, J.; González-Ferreiro, E.; Monleón, V.J.; Faias, S.P.; Tomé, M.; Díaz-Varela, R.A. Use of Multi-Temporal UAV-Derived Imagery for Estimating Individual Tree Growth in Pinus pinea Stands. Forests 2017, 8, 300. [Google Scholar] [CrossRef]
- Matasci, G.; Hermosilla, T.; Wulder, M.A.; White, J.C.; Coops, N.C.; Hobart, G.W.; Zald, H.S. Large-area mapping of Canadian boreal forest cover, height, biomass and other structural attributes using Landsat composites and lidar plots. Remote Sens. Environ. 2018, 209, 90–106. [Google Scholar] [CrossRef]
- Dandois, J.P.; Ellis, E.C. Remote sensing of vegetation structure using computer vision. Remote Sens. 2010, 2, 1157–1176. [Google Scholar] [CrossRef] [Green Version]
- Tinkham, W.T.; Huang, H.; Smith, A.; Shrestha, R.; Falkowski, M.J.; Hudak, A.T.; Link, T.E.; Glenn, N.F.; Marks, D.G. A comparison of two open source LiDAR surface classification algorithms. Remote Sens. 2011, 3, 638–649. [Google Scholar] [CrossRef] [Green Version]
- Gillan, J.K.; Karl, J.W.; Duniway, M.; Elaksher, A. Modeling vegetation heights from high resolution stereo aerial photography: An application for broad-scale rangeland monitoring. J. Environ. Manag. 2014, 144, 226–235. [Google Scholar] [CrossRef]
- Dietmaier, A.; McDermid, G.J.; Rahman, M.M.; Linke, J.; Ludwig, R. Comparison of LiDAR and digital aerial photogrammetry for characterizing canopy openings in the Boreal Forest of Northern Alberta. Remote Sens. 2019, 11, 1919. [Google Scholar] [CrossRef] [Green Version]
- Aguilar, F.J.; Rivas, J.R.; Nemmaoui, A.; Peñalver, A.; Aguilar, M.A. UAV-Based Digital Terrain Model Generation under Leaf-Off Conditions to Support Teak Plantations Inventories in Tropical Dry Forests. A Case of the Coastal Region of Ecuador. Sensors 2019, 19, 1934. [Google Scholar] [CrossRef] [Green Version]
- Meng, R.; Wu, J.; Schwager, K.L.; Zhao, F.; Dennison, P.E.; Cook, B.D.; Brewster, K.; Green, T.M.; Serbin, S.P. Using high spatial resolution satellite imagery to map forest burn severity across spatial scales in a Pine Barrens ecosystem. Remote Sens. Environ. 2017, 191, 95–109. [Google Scholar] [CrossRef] [Green Version]
- Fawcett, D.; Azlan, B.; Hill, T.C.; Kho, L.K.; Bennie, J.; Anderson, K. Unmanned aerial vehicle (UAV) derived structure-from-motion photogrammetry point clouds for oil palm (Elaeis guineensis) canopy segmentation and height estimation. Int. J. Remote Sens. 2019, 40, 7538–7560. [Google Scholar] [CrossRef] [Green Version]
- Hodgson, M.E.; Bresnahan, P. Accuracy of airborne lidar-derived elevation. Photogramm. Eng. Remote Sens. 2004, 70, 331–339. [Google Scholar] [CrossRef] [Green Version]
- White, J.C.; Coops, N.C.; Wulder, M.A.; Vastaranta, M.; Hilker, T.; Tompalski, P. Remote Sensing Technologies for Enhancing Forest Inventories: A Review. Can. J. Remote Sens. 2016, 42, 619–641. [Google Scholar] [CrossRef] [Green Version]
- Leberl, F.; Irschara, A.; Pock, T.; Meixner, P.; Gruber, M.; Scholz, S.; Wiechert, A. Point Clouds. Photogramm. Eng. Remote Sens. 2010, 76, 1123–1134. [Google Scholar] [CrossRef]
- Chen, S.; McDermid, G.J.; Castilla, G.; Linke, J. Measuring Vegetation Height in Linear Disturbances in the Boreal Forest with UAV Photogrammetry. Remote Sens. 2017, 9, 1257. [Google Scholar] [CrossRef] [Green Version]
- Woods, M.; Pitt, D.; Penner, M.; Lim, K.; Nesbitt, D.; Etheridge, D.; Treitz, P. Operational implementation of a LiDAR inventory in Boreal Ontario. For. Chron. 2011, 87, 512–528. [Google Scholar] [CrossRef]
- Kraus, K.; Pfeifer, N. Determination of terrain models in wooded areas with airborne laser scanner data. ISPRS J. Photogramm. Remote Sens. 1998, 53, 193–203. [Google Scholar] [CrossRef]
- Hébert, F.; Krause, C.; Plourde, P.Y.; Achim, A.; Prégent, G.; Ménétrier, J. Effect of tree spacing on tree level volume growth, morphology, and wood properties in a 25-year-old Pinus banksiana plantation in the boreal forest of Quebec. Forests 2016, 7, 276. [Google Scholar] [CrossRef] [Green Version]
- Yu, X.; Hyyppä, J.; Vastaranta, M.; Holopainen, M.; Viitala, R. Predicting individual tree attributes from airborne laser point clouds based on the random forests technique. ISPRS J. Photogramm. Remote Sens. 2011, 66, 28–37. [Google Scholar] [CrossRef]
- Jensen, J.L.R.; Mathews, A.J. Assessment of Image-Based Point Cloud Products to Generate a Bare Earth Surface and Estimate Canopy Heights in a Woodland Ecosystem. Remote Sens. 2016, 8, 50. [Google Scholar] [CrossRef] [Green Version]
- Cunliffe, A.M.; Brazier, R.E.; Anderson, K. Ultra-fine grain landscape-scale quantification of dryland vegetation structure with drone-acquired structure-from-motion photogrammetry. Remote Sens. Environ. 2016, 183, 129–143. [Google Scholar] [CrossRef] [Green Version]
- Díaz-Varela, R.A.; De la Rosa, R.; León, L.; Zarco-Tejada, P.J. High-Resolution Airborne UAV Imagery to Assess Olive Tree Crown Parameters Using 3D Photo Reconstruction: Application in Breeding Trials. Remote Sens. 2015, 7, 4213–4232. [Google Scholar] [CrossRef] [Green Version]
- Lisein, J.; Pierrot-Deseilligny, M.; Bonnet, S.; Lejeune, P. A photogrammetric workflow for the creation of a forest canopy height model from small unmanned aerial system imagery. Forests 2013, 4, 922–944. [Google Scholar] [CrossRef] [Green Version]
- Crespo-Peremarch, P.; Fournier, R.A.; Nguyen, V.T.; van Lier, O.R.; Ruiz, L.Á. A comparative assessment of the vertical distribution of forest components using full-waveform airborne, discrete airborne and discrete terrestrial laser scanning data. For. Ecol. Manag. 2020, 473, 118268. [Google Scholar] [CrossRef]
- Vega, C.; Hamrouni, A.; El Mokhtari, S.; Morel, J.; Bock, J.; Renaud, J.P.; Bouvier, M.; Durrieu, S. PTrees: A point-based approach to forest tree extraction from lidar data. Int. J. Appl. Earth Obs. Geoinf. 2014, 33, 98–108. [Google Scholar] [CrossRef]
- de Souza Frutuoso, L.M.; de Melo Almeida, D.; Filho, J.G.M.U.; Junior, V.C.B.; de Andrade, G.S.; do Canto, J.L. Métodos de Medição de Altura em Fragmento de Floresta Estacional Decidual. Nativa 2020, 8, 610–614. [Google Scholar] [CrossRef]
- de Mendonça, A.R.; da Silva, J.C.; Aozai, T.S.; da Silva, E.R.; Santos, J.S.; Binoti, D.H.B.; da Silva, G.F. Estimação da Altura Total de Árvores de Ipê Felpudo Utilizando Modelos de Regressão e Redes Neurais. Rev. Bras. Biom. 2018, 36, 128–139. [Google Scholar] [CrossRef]
- Curto, R.D.A.; Môra, R.; de Araújo, E.J.G.; da Silva, G.F. Treinamento na estimativa da altura de árvores de grande porte em floresta inequiânea. Sci. Agrar. Parana. 2018, 17, 170. [Google Scholar]
- Hakamada, R.E.; Stape, J.L.; Lemos, C.; Emanuel, A.; Almeida, A.; Silva, L.F. Uso do inventário florestal e da uniformidade entre árvores como ferramenta de monitoramento da qualidade silvicultural em plantios clonais de eucalipto. Sci. For. 2015, 43, 27–39. [Google Scholar]
- Ruza, M.S.; Corte, A.P.D.; Hentz, A.M.K.; Sanquetta, C.R.; Silva, C.A.; Schoeninger, E.R. Inventário de Sobrevivência de povoamento de Eucalyptus com uso de Redes Neurais Artificiais em Fotografias obtidas por VANTs. Adv. For. Sci. 2017, 4, 83–88. [Google Scholar] [CrossRef]


| Statistics | |||
|---|---|---|---|
| Measurements | Errors | ||
| Minimum | 0.6 | Range | 0.8–4.6 |
| Median | 3.35 | RMSD | 0.08 (3.0%) |
| Mean | 3.34 | Bias | 0.02 (0.7%) |
| Maximum | 5.4 | SD | 0.08 (2.9%) |
| Statistic | Elevation Difference (−) | |
|---|---|---|
| DTM_UAV | DTM_UAV | |
| Minimum difference (m) | −0.931 | −0.192 |
| Maximum difference (m) | 0.283 | 0.289 |
| RMSE (m) | 0.286 (2.43%) | 0.120 (1.01%) |
| Bias (m) | −0.127 (−1.07%) | 0.067 (0.56%) |
| Standard deviation (m) | 0.257 (2.18%) | 0.099 (0.84%) |
| Point Cloud | CD | OE | CE | Duplicated Trees |
|---|---|---|---|---|
| NPC_RTK | 208(97.2%) | 6(2.8%) | 0(0.0%) | 0(0.0%) |
| NPC_UAV | 204(95.3%) | 10(4.6%) | 2(0.9%) | 2(0.9%) |
| NPC_UAV | 209(97.6%) | 5(2.3%) | 0(0.0%) | 0(0.0%) |
| Statistic | − | ||
|---|---|---|---|
| NPC_RTK | NPC_UAV | NPC_UAV | |
| Mean difference (m) | 0.30 | 0.29 | 0.22 |
| Standard deviation (m) | 0.28 (8.3%) | 0.34 (9.1%) | 0.27 (8.3%) |
| Median difference (m) | 0.25 | 0.24 | 0.17 |
| Minimum difference (m) | −0.51 | −0.62 | −0.78 |
| Maximum difference (m) | 1.46 | 1.82 | 1.35 |
| BIAS (m) | 0.30 (8.9%) | 0.29 (8.2%) | 0.22 (6.7%) |
| RMSE (m) | 0.41 (12.4%) | 0.43 (12.9%) | 0.36 (10.9%) |
Publisher’s Note: MDPI stays neutral with regard to jurisdictional claims in published maps and institutional affiliations. |
© 2021 by the authors. Licensee MDPI, Basel, Switzerland. This article is an open access article distributed under the terms and conditions of the Creative Commons Attribution (CC BY) license (https://creativecommons.org/licenses/by/4.0/).
Share and Cite
Almeida, A.; Gonçalves, F.; Silva, G.; Mendonça, A.; Gonzaga, M.; Silva, J.; Souza, R.; Leite, I.; Neves, K.; Boeno, M.; et al. Individual Tree Detection and Qualitative Inventory of a Eucalyptus sp. Stand Using UAV Photogrammetry Data. Remote Sens. 2021, 13, 3655. https://0-doi-org.brum.beds.ac.uk/10.3390/rs13183655
Almeida A, Gonçalves F, Silva G, Mendonça A, Gonzaga M, Silva J, Souza R, Leite I, Neves K, Boeno M, et al. Individual Tree Detection and Qualitative Inventory of a Eucalyptus sp. Stand Using UAV Photogrammetry Data. Remote Sensing. 2021; 13(18):3655. https://0-doi-org.brum.beds.ac.uk/10.3390/rs13183655
Chicago/Turabian StyleAlmeida, André, Fabio Gonçalves, Gilson Silva, Adriano Mendonça, Maria Gonzaga, Jeferson Silva, Rodolfo Souza, Igor Leite, Karina Neves, Marcus Boeno, and et al. 2021. "Individual Tree Detection and Qualitative Inventory of a Eucalyptus sp. Stand Using UAV Photogrammetry Data" Remote Sensing 13, no. 18: 3655. https://0-doi-org.brum.beds.ac.uk/10.3390/rs13183655