
Exploring the Road toward Environmental Sustainability: Natural Resources, Renewable Energy Consumption, Economic Growth, and Greenhouse Gas Emissions


Abstract
:1. Introduction
2. Literature Review
3. Variable Description and Methodology Specification
3.1. Variable Description and Model Construction
3.2. Econometric Model Estimation Approach
4. Findings and Discussions
4.1. Estimation of Basic Statistics
4.2. Unit Root Test and Auto-Regressive Distributed Lag Bounds Test
4.3. Auto-Regressive Distributed Lag Model for Short- and Long-Run Analysis
4.4. Robustness Test
5. Conclusions
Author Contributions
Funding
Institutional Review Board Statement
Informed Consent Statement
Data Availability Statement
Conflicts of Interest
References
- Sarkodie, S.A. The Invisible Hand and EKC Hypothesis: What Are the Drivers of Environmental Degradation and Pollution in Africa? Environ. Sci. Pollut. Res. 2018, 25, 21993–22022. [Google Scholar] [CrossRef] [PubMed]
- Chen, Y.; Zhao, J.; Lai, Z.; Wang, Z.; Xia, H. Exploring the Effects of Economic Growth, and Renewable and Non-Renewable Energy Consumption on China’s CO2 Emissions: Evidence from a Regional Panel Analysis. Renew. Energy 2019, 140, 341–353. [Google Scholar] [CrossRef]
- Dong, K.; Sun, R.; Jiang, H.; Zeng, X. CO2 Emissions, Economic Growth, and the Environmental Kuznets Curve in China: What Roles Can Nuclear Energy and Renewable Energy Play? J. Clean. Prod. 2018, 196, 51–63. [Google Scholar] [CrossRef]
- Zhang, S.; Liu, X. The Roles of International Tourism and Renewable Energy in Environment: New Evidence from Asian Countries. Renew. Energy 2019, 139, 385–394. [Google Scholar] [CrossRef]
- Koondhar, M.A.; Tan, Z.; Alam, G.M.; Khan, Z.A.; Wang, L.; Kong, R. Bioenergy Consumption, Carbon Emissions, and Agricultural Bioeconomic Growth: A Systematic Approach to Carbon Neutrality in China. J. Environ. Manag. 2021, 296, 113242. [Google Scholar] [CrossRef]
- Jiang, Q.; Khattak, S.I.; Rahman, Z.U. Measuring the Simultaneous Effects of Electricity Consumption and Pro duction on Carbon Dioxide Emissions (CO2e) in China: New Evidence from an EKC-Based Assessment. Energy 2021, 229, 120616. [Google Scholar] [CrossRef]
- Zhang, L.; Godil, D.I.; Bibi, M.; Khan, M.K.; Sarwat, S.; Anser, M.K. Caring for the Environment: How Human Capital, Natural Resources, and Economic Growth Interact with Environmental Degradation in Pakistan? A Dynamic ARDL Approach. Sci. Total Environ. 2021, 774, 145553. [Google Scholar] [CrossRef]
- Zia, S.; ur Rahman, M.; Noor, M.H.; Khan, M.K.; Bibi, M.; Godil, D.I.; Quddoos, M.U.; Anser, M.K. Striving towards Environmental Sustainability: How Natural Resources, Human Capital, Financial Development, and Economic Growth Interact with Ecological Footprint in China. Environ. Sci. Pollut. Res. 2021, 1–15. [Google Scholar] [CrossRef]
- Ahmad, F.; Draz, M.U.; Chang, W.-Y.; Yang, S.-C.; Su, L. More than the Resource Curse: Exploring the Nexus of Natural Resource Abundance and Environmental Quality in Northwestern China. Resour. Policy 2021, 70, 101902. [Google Scholar] [CrossRef]
- Quan, Z.; Dongmei, B.; Xiaoxue, P. Research Status and Future Trends of Natural Resources and Sustainable Development in China: Visual Analysis Based on CiteSpace. J. Resour. Ecol. 2021, 12, 419–429. [Google Scholar] [CrossRef]
- uz Zaman, Q.; Wang, Z.; Zaman, S.; Rasool, S.F. Investigating the Nexus between Education Expenditure, Female Employers, Renewable Energy Consumption and CO2 Emission: Evidence from China. J. Clean. Prod. 2021, 127824. [Google Scholar] [CrossRef]
- Lei, W.; Liu, L.; Hafeez, M.; Sohail, S. Do Economic Policy Uncertainty and Financial Development Influence the Renewable Energy Consumption Levels in China? Environ. Sci. Pollut. Res. 2021, 1–10. [Google Scholar] [CrossRef] [PubMed]
- Khan, R. Beta Decoupling Relationship between CO2 Emissions by GDP, Energy Consumption, Electricity Pro duction, Value-Added Industries, and Population in China. PLoS ONE 2021, 16, e0249444. [Google Scholar]
- Kirikkaleli, D.; Adebayo, T.S. Do Public-Private Partnerships in Energy and Renewable Energy Consumption Matter for Consumption-Based Carbon Dioxide Emissions in India? Environ. Sci. Pollut. Res. 2021, 1–14. [Google Scholar] [CrossRef] [PubMed]
- Magazzino, C.; Mele, M.; Schneider, N. A Machine Learning Approach on the Relationship among Solar and Wind Energy Production, Coal Consumption, GDP, and CO2 Emissions. Renew. Energy 2021, 167, 99–115. [Google Scholar] [CrossRef]
- Ponce, P.; Khan, S.A.R. A Causal Link between Renewable Energy, Energy Efficiency, Property Rights, and CO2 Emissions in Developed Countries: A Road Map for Environmental Sustainability. Environ. Sci. Pollut. Res. 2021, 1–14. [Google Scholar] [CrossRef]
- Yuping, L.; Ramzan, M.; Xincheng, L.; Murshed, M.; Awosusi, A.A.; BAH, S.I.; Adebayo, T.S. Determinants of Carbon Emissions in Argentina: The Roles of Renewable Energy Consumption and Globalization. Energy Rep. 2021, 7, 4747–4760. [Google Scholar] [CrossRef]
- Azam, A.; Rafiq, M.; Shafique, M.; Yuan, J. An Empirical Analysis of the Non-Linear Effects of Natural Gas, Nu clear Energy, Renewable Energy and ICT-Trade in Leading CO2 Emitter Countries: Policy towards CO2 Mitigation and Economic Sustainability. J. Environ. Manag. 2021, 286, 112232. [Google Scholar] [CrossRef]
- Godil, D.I.; Yu, Z.; Sharif, A.; Usman, R.; Khan, S.A.R. Investigate the Role of Technology Innovation and Renewable Energy in Reducing Transport Sector CO2 Emission in China: A Path toward Sustainable Development. Sustain. Dev. 2021. [Google Scholar] [CrossRef]
- Hussain, I.; Rehman, A. Exploring the Dynamic Interaction of CO2 Emission on Population Growth, Foreign Investment, and Renewable Energy by Employing ARDL Bounds Testing Approach. Environ. Sci. Pollut. Res. 2021, 28, 39387–39397. [Google Scholar] [CrossRef]
- Zhang, Z.; Ma, X.; Lian, X.; Guo, Y.; Song, Y.; Chang, B.; Luo, L. Research on the Relationship between China’s Greenhouse Gas Emissions and Industrial Structure and Economic Growth from the Perspective of Energy Consumption. Environ. Sci. Pollut. Res. 2020, 27, 41839–41855. [Google Scholar] [CrossRef] [PubMed]
- Li, J.; Li, S. Energy Investment, Economic Growth and Carbon Emissions in China—Empirical Analysis Based on Spatial Durbin Model. Energy Policy 2020, 140, 111425. [Google Scholar] [CrossRef]
- Zhang, X.-P.; Cheng, X.-M. Energy Consumption, Carbon Emissions, and Economic Growth in China. Ecol. Econ. 2009, 68, 2706–2712. [Google Scholar] [CrossRef]
- Wu, Y.; Tam, V.W.; Shuai, C.; Shen, L.; Zhang, Y.; Liao, S. Decoupling China’s Economic Growth from Carbon Emissions: Empirical Studies from 30 Chinese Provinces (2001–2015). Sci. Total Environ. 2019, 656, 576–588. [Google Scholar] [CrossRef] [PubMed]
- Song, Z. Economic Growth and Carbon Emissions: Estimation of a Panel Threshold Model for the Transition Process in China. J. Clean. Prod. 2021, 278, 123773. [Google Scholar] [CrossRef]
- Bekun, F.V.; Alola, A.A.; Sarkodie, S.A. Toward a Sustainable Environment: Nexus between CO2 Emissions, Re source Rent, Renewable and Nonrenewable Energy in 16-EU Countries. Sci. Total Environ. 2019, 657, 1023–1029. [Google Scholar] [CrossRef]
- Muhammad, B.; Khan, M.K.; Khan, M.I.; Khan, S. Impact of Foreign Direct Investment, Natural Resources, Renewable Energy Consumption, and Economic Growth on Environmental Degradation: Evidence from BRICS, Developing, Developed and Global Countries. Environ. Sci. Pollut. Res. 2021, 28, 21789–21798. [Google Scholar] [CrossRef]
- Agboola, M.O.; Bekun, F.V.; Joshua, U. Pathway to Environmental Sustainability: Nexus between Economic Growth, Energy Consumption, CO2 Emission, Oil Rent and Total Natural Resources Rent in Saudi Arabia. Resour. Policy 2021, 74, 102380. [Google Scholar] [CrossRef]
- Usman, M.; Jahanger, A.; Makhdum, M.S.A.; Balsalobre-Lorente, D.; Bashir, A. How Do Financial Development, Energy Consumption, Natural Resources, and Globalization Affect Arctic Countries’ Economic Growth and Environmental Quality? An Advanced Panel Data Simulation. Energy 2021, 122515. [Google Scholar] [CrossRef]
- Topcu, E.; Altinoz, B.; Aslan, A. Global Evidence from the Link between Economic Growth, Natural Resources, Energy Consumption, and Gross Capital Formation. Resour. Policy 2020, 66, 101622. [Google Scholar] [CrossRef]
- Ulucak, R.; Ozcan, B. Relationship between Energy Consumption and Environmental Sustainability in OECD Countries: The Role of Natural Resources Rents. Resour. Policy 2020, 69, 101803. [Google Scholar] [CrossRef]
- Khan, I.; Hou, F.; Le, H.P. The Impact of Natural Resources, Energy Consumption, and Population Growth on Environmental Quality: Fresh Evidence from the United States of America. Sci. Total Environ. 2021, 754, 142222. [Google Scholar] [CrossRef] [PubMed]
- Adedoyin, F.F.; Gumede, M.I.; Bekun, F.V.; Etokakpan, M.U.; Balsalobre-Lorente, D. Modelling Coal Rent, Economic Growth and CO2 Emissions: Does Regulatory Quality Matter in BRICS Economies? Sci. Total Environ. 2020, 710, 136284. [Google Scholar] [CrossRef]
- Zaman, K.; Abdullah, I.; Ali, M. Decomposing the Linkages between Energy Consumption, Air Pollution, Climate Change, and Natural Resource Depletion in P Akistan. Environ. Prog. Sustain. Energy 2017, 36, 638–648. [Google Scholar] [CrossRef]
- Hassan, S.T.; Xia, E.; Khan, N.H.; Shah, S.M.A. Economic Growth, Natural Resources, and Ecological Footprints: Evidence from Pakistan. Environ. Sci. Pollut. Res. 2019, 26, 2929–2938. [Google Scholar] [CrossRef] [PubMed]
- Joshua, U.; Bekun, F.V. The Path to Achieving Environmental Sustainability in South Africa: The Role of Coal Consumption, Economic Expansion, Pollutant Emission, and Total Natural Resources Rent. Environ. Sci. Pollut. Res. 2020, 27, 9435–9443. [Google Scholar] [CrossRef]
- Gyamfi, B.A.; Adedoyin, F.F.; Bein, M.A.; Bekun, F.V.; Agozie, D.Q. The Anthropogenic Consequences of Energy Consumption in E7 Economies: Juxtaposing Roles of Renewable, Coal, Nuclear, Oil and Gas Energy: Evidence from Panel Quantile Method. J. Clean. Prod. 2021, 295, 126373. [Google Scholar] [CrossRef]
- Ahmed, Z.; Asghar, M.M.; Malik, M.N.; Nawaz, K. Moving towards a Sustainable Environment: The Dynamic Linkage between Natural Resources, Human Capital, Urbanization, Economic Growth, and Ecological Footprint in China. Resour. Policy 2020, 67, 101677. [Google Scholar] [CrossRef]
- Baloch, M.A.; Mahmood, N.; Zhang, J.W. Effect of Natural Resources, Renewable Energy and Economic Development on CO2 Emissions in BRICS Countries. Sci. Total Environ. 2019, 678, 632–638. [Google Scholar]
- Khan, M.K.; Teng, J.-Z.; Khan, M.I. Effect of Energy Consumption and Economic Growth on Carbon Dioxide Emissions in Pakistan with Dynamic ARDL Simulations Approach. Environ. Sci. Pollut. Res. 2019, 26, 23480–23490. [Google Scholar] [CrossRef]
- Mahmood, H.; Furqan, M. Oil Rents and Greenhouse Gas Emissions: Spatial Analysis of Gulf Cooperation Council Countries. Environ. Dev. Sustain. 2021, 23, 6215–6233. [Google Scholar] [CrossRef]
- Ozturk, I. Measuring the Impact of Alternative and Nuclear Energy Consumption, Carbon Dioxide Emissions and Oil Rents on Specific Growth Factors in the Panel of Latin American Countries. Prog. Nucl. Energy 2017, 100, 71–81. [Google Scholar] [CrossRef]
- Sadik-Zada, E.R.; Loewenstein, W. Drivers of CO2-Emissions in Fossil Fuel Abundant Settings:(Pooled) Mean Group and Nonparametric Panel Analyses. Energies 2020, 13, 3956. [Google Scholar] [CrossRef]
- Ike, G.N.; Usman, O.; Sarkodie, S.A. Testing the Role of Oil Production in the Environmental Kuznets Curve of Oil Producing Countries: New Insights from Method of Moments Quantile Regression. Sci. Total Environ. 2020, 711, 135208. [Google Scholar] [CrossRef] [PubMed]
- Mahmood, H.; Alkhateeb, T.T.Y.; Furqan, M. Oil Sector and CO 2 Emissions in Saudi Arabia: Asymmetry Analysis. Palgrave Commun. 2020, 6, 1–10. [Google Scholar] [CrossRef]
- Shen, Y.; Su, Z.-W.; Malik, M.Y.; Umar, M.; Khan, Z.; Khan, M. Does Green Investment, Financial Development and Natural Resources Rent Limit Carbon Emissions? A Provincial Panel Analysis of China. Sci. Total Environ. 2021, 755, 142538. [Google Scholar] [CrossRef]
- Agboola, M.O.; Bekun, F.V.; Balsalobre-Lorente, D. Implications of Social Isolation in Combating COVID-19 Outbreak in Kingdom of Saudi Arabia: Its Consequences on the Carbon Emissions Reduction. Sustainability 2021, 13, 9476. [Google Scholar] [CrossRef]
- Anser, M.K.; Yousaf, Z.; Zaman, K.; Nassani, A.A.; Alotaibi, S.M.; Jambari, H.; Khan, A.; Kabbani, A. Determination of Resource Curse Hypothesis in Mediation of Financial Development and Clean Energy Sources: Go-for-Green Resource Policies. Resour. Policy 2020, 66, 101640. [Google Scholar] [CrossRef]
- Sohoo, I.; Ritzkowski, M.; Kuchta, K.; Cinar, S.Ö. Environmental Sustainability Enhancement of Waste Disposal Sites in Developing Countries through Controlling Greenhouse Gas Emissions. Sustainability 2021, 13, 151. [Google Scholar] [CrossRef]
- Alola, A.A.; Akadiri, S.S.; Usman, O. Domestic Material Consumption and Greenhouse Gas Emissions in the EU-28 Countries: Implications for Environmental Sustainability Targets. Sustain. Dev. 2021, 29, 388–397. [Google Scholar] [CrossRef]
- Sarkodie, S.A.; Strezov, V.; Weldekidan, H.; Asamoah, E.F.; Owusu, P.A.; Doyi, I.N.Y. Environmental Sustainability Assessment Using Dynamic Autoregressive-Distributed Lag Simulations—Nexus between Greenhouse Gas Emissions, Biomass Energy, Food and Economic Growth. Sci. Total Environ. 2019, 668, 318–332. [Google Scholar] [CrossRef] [PubMed]
- Kaygusuz, K. Energy and Environmental Issues Relating to Greenhouse Gas Emissions for Sustainable Development in Turkey. Renew. Sustain. Energy Rev. 2009, 13, 253–270. [Google Scholar] [CrossRef]
- Vasylieva, T.; Lyulyov, O.; Bilan, Y.; Streimikiene, D. Sustainable Economic Development and Greenhouse Gas Emissions: The Dynamic Impact of Renewable Energy Consumption, GDP, and Corruption. Energies 2019, 12, 3289. [Google Scholar] [CrossRef] [Green Version]
- Lyeonov, S.; Pimonenko, T.; Bilan, Y.; Štreimikienė, D.; Mentel, G. Assessment of Green Investments’ Impact on Sustainable Development: Linking Gross Domestic Product per Capita, Greenhouse Gas Emissions and Renewable Energy. Energies 2019, 12, 3891. [Google Scholar] [CrossRef] [Green Version]
- Squalli, J. Renewable Energy, Coal as a Baseload Power Source, and Greenhouse Gas Emissions: Evidence from US State-Level Data. Energy 2017, 127, 479–488. [Google Scholar] [CrossRef]
- Lapinskienė, G.; Peleckis, K.; Slavinskaitė, N. Energy Consumption, Economic Growth and Greenhouse Gas Emissions in the European Union Countries. J. Bus. Econ. Manag. 2017, 18, 1082–1097. [Google Scholar] [CrossRef] [Green Version]
- Lu, W.-C. Greenhouse Gas Emissions, Energy Consumption and Economic Growth: A Panel Cointegration Analysis for 16 Asian Countries. Int. J. Environ. Res. Public. Health 2017, 14, 1436. [Google Scholar] [CrossRef] [Green Version]
- Kim, S. The Effects of Foreign Direct Investment, Economic Growth, Industrial Structure, Renewable and Nuclear Energy, and Urbanization on Korean Greenhouse Gas Emissions. Sustainability 2020, 12, 1625. [Google Scholar] [CrossRef] [Green Version]
- Morrow, W.R.; Gallagher, K.S.; Collantes, G.; Lee, H. Analysis of Policies to Reduce Oil Consumption and Greenhouse-Gas Emissions from the US Transportation Sector. Energy Policy 2010, 38, 1305–1320. [Google Scholar] [CrossRef]
- Van Ruijven, B.; Van Vuuren, D.P. Oil and Natural Gas Prices and Greenhouse Gas Emission Mitigation. Energy Policy 2009, 37, 4797–4808. [Google Scholar] [CrossRef]
- Germer, J.; Sauerborn, J. Estimation of the Impact of Oil Palm Plantation Establishment on Greenhouse Gas Balance. Environ. Dev. Sustain. 2008, 10, 697–716. [Google Scholar] [CrossRef]
- Tufail, M.; Song, L.; Adebayo, T.S.; Kirikkaleli, D.; Khan, S. Do Fiscal Decentralization and Natural Resources Rent Curb Carbon Emissions? Evidence from Developed Countries. Environ. Sci. Pollut. Res. 2021, 28, 49179–49190. [Google Scholar] [CrossRef] [PubMed]
- Huang, S.-Z.; Sadiq, M.; Chien, F. The Impact of Natural Resource Rent, Financial Development, and Urbanization on Carbon Emission. Environ. Sci. Pollut. Res. 2021, 1–13. [Google Scholar] [CrossRef] [PubMed]
- Sterpu, M.; Soava, G.; Mehedintu, A. Impact of Economic Growth and Energy Consumption on Greenhouse Gas Emissions: Testing Environmental Curves Hypotheses on EU Countries. Sustainability 2018, 10, 3327. [Google Scholar] [CrossRef] [Green Version]
- Pesaran, M.H.; Shin, Y.; Smith, R.J. Bounds Testing Approaches to the Analysis of Level Relationships. J. Appl. Econom. 2001, 16, 289–326. [Google Scholar] [CrossRef]
- Pesaran, M.H.; Shin, Y. An Autoregressive Distributed Lag Modelling Approach to Cointegration Analysis; University of Cambridge: Cambridge, UK, 1995. [Google Scholar]
- Narayan, P.; Smyth, R. Trade Liberalization and Economic Growth in Fiji. An Empirical Assessment Using the ARDL Approach. J. Asia Pac. Econ. 2005. [Google Scholar] [CrossRef]
- Persan, M.H.; Pesaran, B. Microfit 4.0: Interactive Econometric Analysis; Oxford University Press: Oxford, UK, 1997. [Google Scholar]
- Lee, J.; Strazicich, M.C. Break Point Estimation and Spurious Rejections with Endogenous Unit Root Tests. Oxf. Bull. Econ. Stat. 2001, 63, 535–558. [Google Scholar] [CrossRef]
- Harvey, D.I.; Leybourne, S.J.; Newbold, P. Innovational Outlier Unit Root Tests with an Endogenously Determined Break in Level. Oxf. Bull. Econ. Stat. 2001, 63, 559–575. [Google Scholar] [CrossRef]
- Carrion-i-Silvestre, J.L.; Sanso-i-Rossello, A.; Ortuño, M.A. Unit Root and Stationarity Tests’ Wedding. Econ. Lett. 2001, 70, 1–8. [Google Scholar] [CrossRef]
- Xiao, Z. Testing the Null Hypothesis of Stationarity against an Autoregressive Unit Root Alternative. J. Time Ser. Anal. 2001, 22, 87–105. [Google Scholar] [CrossRef]
- Shafiullah, M.; Khalid, U.; Shahbaz, M. Does Meat Consumption Exacerbate Greenhouse Gas Emissions? Evidence from US Data. Environ. Sci. Pollut. Res. 2021, 28, 11415–11429. [Google Scholar] [CrossRef] [PubMed]
- Hundie, S.K. Income Inequality, Economic Growth and Carbon Dioxide Emissions Nexus: Empirical Evidence from Ethiopia. Environ. Sci. Pollut. Res. 2021, 28, 43579–43598. [Google Scholar] [CrossRef] [PubMed]
- Sun, C.; Zhang, F.; Xu, M. Investigation of Pollution Haven Hypothesis for China: An ARDL Approach with Breakpoint Unit Root Tests. J. Clean. Prod. 2017, 161, 153–164. [Google Scholar] [CrossRef]
- Pata, U.K.; Caglar, A.E. Investigating the EKC Hypothesis with Renewable Energy Consumption, Human Capital, Globalization and Trade Openness for China: Evidence from Augmented ARDL Approach with a Structural Break. Energy 2021, 216, 119220. [Google Scholar] [CrossRef]
- Zhijun, F.; Nailing, Y. Putting a Circular Economy into Practice in China. Sustain. Sci. 2007, 2, 95–101. [Google Scholar] [CrossRef]
- Geng, Y.; Doberstein, B. Developing the Circular Economy in China: Challenges and Opportunities for Achieving’ leapfrog Development’. Int. J. Sustain. Dev. World Ecol. 2008, 15, 231–239. [Google Scholar] [CrossRef] [Green Version]
- Chen, Y.; Wang, Z.; Zhong, Z. CO2 Emissions, Economic Growth, Renewable and Non-Renewable Energy Production and Foreign Trade in China. Renew. Energy 2019, 131, 208–216. [Google Scholar] [CrossRef]
- Dong, K.; Dong, X.; Jiang, Q. How Renewable Energy Consumption Lower Global CO2 Emissions? Evidence from Countries with Different Income Levels. World Econ. 2020, 43, 1665–1698. [Google Scholar] [CrossRef]
- Wang, S.; Li, Q.; Fang, C.; Zhou, C. The Relationship between Economic Growth, Energy Consumption, and CO2 Emissions: Empirical Evidence from China. Sci. Total Environ. 2016, 542, 360–371. [Google Scholar] [CrossRef]
- Govindaraju, V.C.; Tang, C.F. The Dynamic Links between CO2 Emissions, Economic Growth and Coal Consumption in China and India. Appl. Energy 2013, 104, 310–318. [Google Scholar] [CrossRef]
- He, K.; Huo, H.; Zhang, Q.; He, D.; An, F.; Wang, M.; Walsh, M.P. Oil Consumption and CO2 Emissions in China’s Road Transport: Current Status, Future Trends, and Policy Implications. Energy Policy 2005, 33, 1499–1507. [Google Scholar] [CrossRef]
- Saboori, B.; Rasoulinezhad, E.; Sung, J. The Nexus of Oil Consumption, CO 2 Emissions and Economic Growth in China, Japan and South Korea. Environ. Sci. Pollut. Res. 2017, 24, 7436–7455. [Google Scholar] [CrossRef] [PubMed]
- Alam, M.S.; Paramati, S.R. Do Oil Consumption and Economic Growth Intensify Environmental Degradation? Evidence from Developing Economies. Appl. Econ. 2015, 47, 5186–5203. [Google Scholar] [CrossRef]
- Chen, G.Q.; Chen, Z.M. Greenhouse Gas Emissions and Natural Resources Use by the World Economy: Ecological Input–Output Modeling. Ecol. Model. 2011, 222, 2362–2376. [Google Scholar] [CrossRef]
- Balsalobre-Lorente, D.; Shahbaz, M.; Roubaud, D.; Farhani, S. How Economic Growth, Renewable Electricity and Natural Resources Contribute to CO2 Emissions? Energy Policy 2018, 113, 356–367. [Google Scholar] [CrossRef] [Green Version]
- Zhou, S.Y.; Chen, H.; Li, S.C. Resources Use and Greenhouse Gas Emissions in Urban Economy: Ecological Input–Output Modeling for Beijing 2002. Commun. Nonlinear Sci. Numer. Simul. 2010, 15, 3201–3231. [Google Scholar] [CrossRef]
- Anwar, A.; Siddique, M.; Dogan, E.; Sharif, A. The Moderating Role of Renewable and Non-Renewable Energy in Environment-Income Nexus for ASEAN Countries: Evidence from Method of Moments Quantile Regression. Renew. Energy 2021, 164, 956–967. [Google Scholar] [CrossRef]
- Yao, S.; Zhang, S.; Zhang, X. Renewable Energy, Carbon Emission and Economic Growth: A Revised Environ mental Kuznets Curve Perspective. J. Clean. Prod. 2019, 235, 1338–1352. [Google Scholar] [CrossRef]
- Wolde-Rufael, Y.; Idowu, S. Income Distribution and CO2 Emission: A Comparative Analysis for China and India. Renew. Sustain. Energy Rev. 2017, 74, 1336–1345. [Google Scholar] [CrossRef]


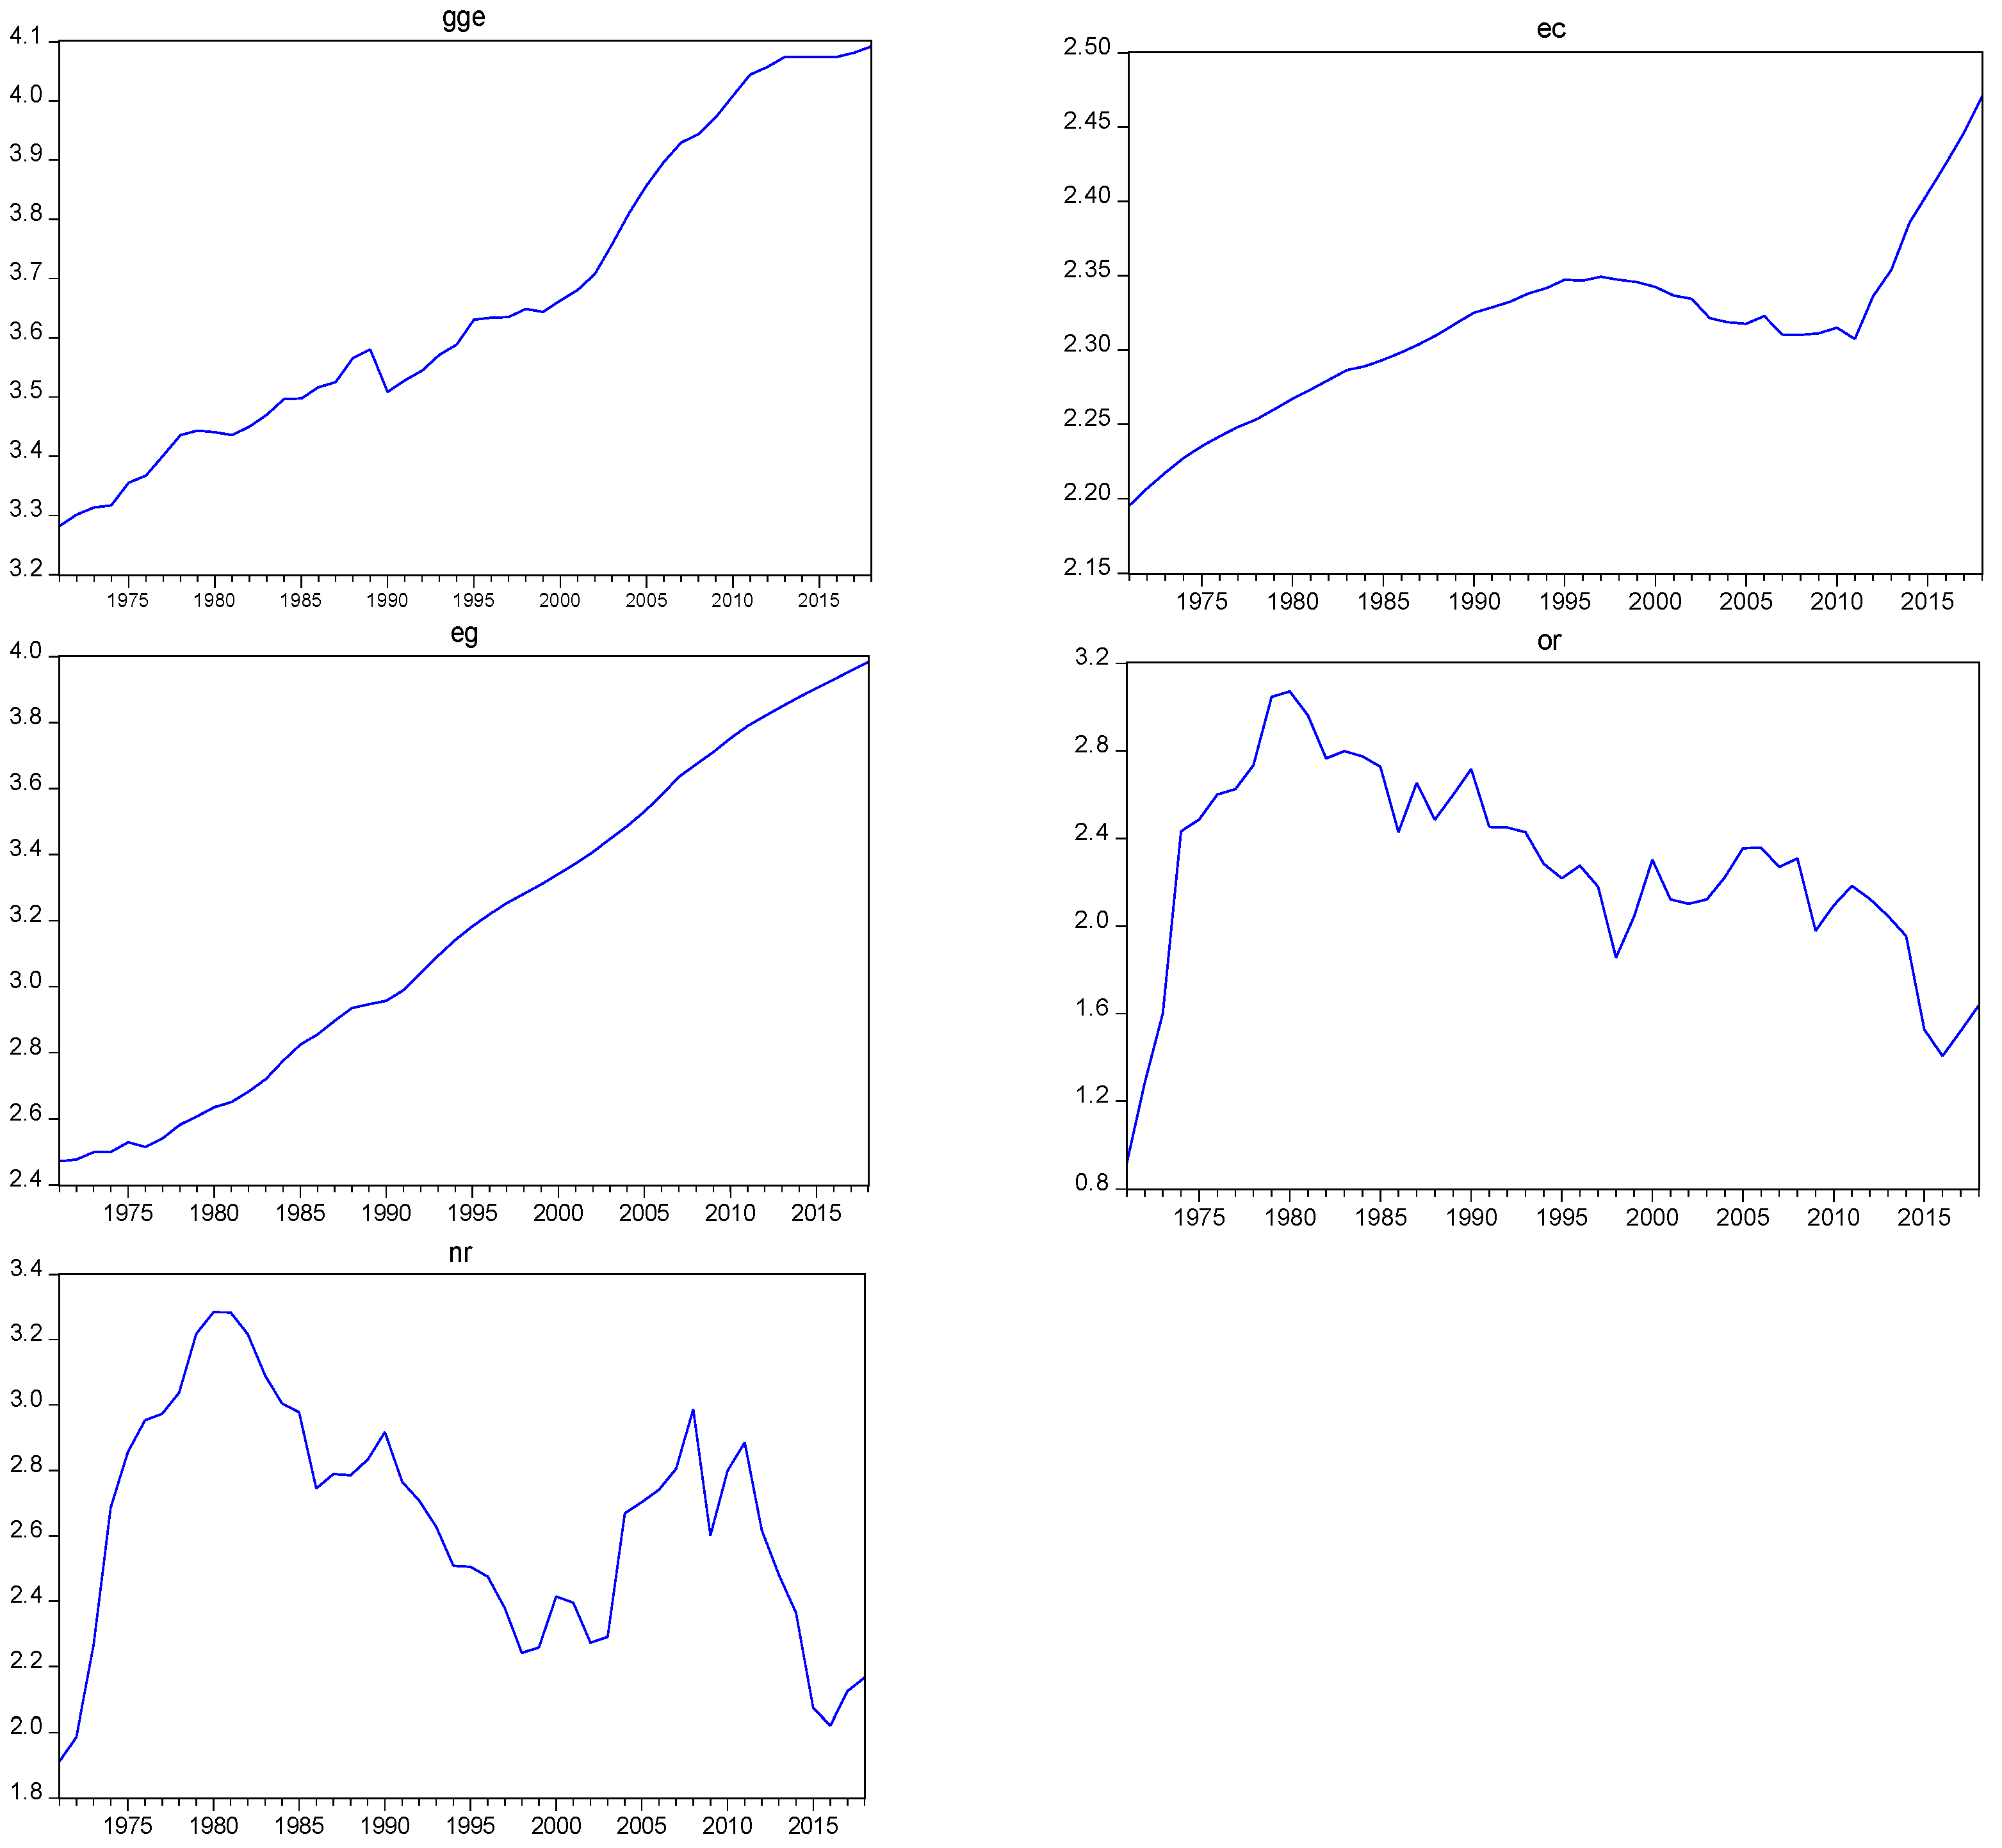
| Variable | Form | Definition |
|---|---|---|
| Greenhouse gas emissions | gge | Total greenhouse gas emissions (unit: million tons) |
| Renewable energy consumption | ec | Amount of renewable energy consumed (unit: million tons) |
| Economic growth | eg | GDP (constant 2015 USD, and unit: billion USD) |
| Oil rent | or | Oil rents (% of GDP) |
| Natural resources | nr | Total natural resources rents (% of GDP) |
| Panel A: Variable Characteristic Description | |||||
|---|---|---|---|---|---|
| Variable and Statistics | log gge | log ec | log eg | log or | log nr |
| Mean | 3.665 | 2.314 | 3.169 | 2.261 | 2.639 |
| Maximum | 4.092 | 2.470 | 3.983 | 3.072 | 3.284 |
| Minimum | 3.282 | 2.195 | 2.470 | 0.918 | 1.912 |
| Standard deviation | 0.255 | 0.057 | 0.491 | 0.461 | 0.357 |
| Observations | 48 | 48 | 48 | 48 | 48 |
| Panel B: Unit Root Test | |||||
|---|---|---|---|---|---|
| Statistic Level | log gge | log ec | log eg | log or | log nr |
| ADF-test | −1.694 | −2.795 | −3.249 * | −4.868 *** | −3.157 |
| PP-test | −1.587 | −1.393 | −3.842 ** | −5.484 *** | −3.137 |
| First Difference | gge | ec | eg | or | nr |
| ADF-test | −5.069 *** | −5.137 *** | −5.949 *** | −5.949 *** | −5.447 *** |
| PP-test | −5.066 *** | −4.445 *** | −4.224 *** | −5.913 *** | −5.466 *** |
| PanelC: Zivot and Andrews Unit Root Tests with Structural Breaks | |||||
| Statistic Level | log gge | log ec | log eg | log or | log nr |
| Z-A-test | −3.113 | −4.106 | −1.362 | −4.614 ** | −3.332 |
| Break year | 1990 | 2011 | 1991 | 1990 | 1990 |
| First Difference | log gge | log ec | log eg | log or | log nr |
| Z-A-test | −6.962 *** | −5.102 *** | −5.391 | −7.324 *** | −6.437 *** |
| Break year | 2001 | 2011 | 1976 | 1976 | 1976 |
| PanelD: Auto-Regressive Distributed Lag Bounds Test | |||||
| Test Statistics | Value | K | |||
| F-statistics | 6.956 *** | 4 | |||
| Critical Value Bounds | |||||
| Significance | I(0) bounds | I(1) bounds | |||
| 10% | 2.20 | 3.09 | |||
| 5% | 2.56 | 3.49 | |||
| 1% | 3.29 | 4.37 | |||
| Section model | auto-regressive distributed lag (1,0,1,0,0) | ||||
| Model: log gge = f(log nr, log ec, log eg, log or) | |||
|---|---|---|---|
| Variable | Long-run Effect | Variable | Short-run Effect |
| Section model | auto-regressive distributed lag (1,0,1,0,0) | ||
| log ec | −0.292 *** (−3.860) | log ec | −0.984 *** (−2.820) |
| log eg | 0.458 *** (12.447) | log eg | 0.519 ** (2.544) |
| log or | −0.142 *** (−4.378) | log or | −0.022 * (−1.817) |
| log nr | 0.242 *** (5.800) | log nr | 0.046 ** (2.074) |
| Du2001 | 0.047 * (1.938) | Du2001 | 0.096 * (1.869) |
| C | 2.057 *** (6.281) | ect−1 | −0.294 *** (−2.899) |
| Diagnostic Tests | F-statistic | p-value | |
| Normality test | 1.438 | 0.401 | |
| serial | 0.164 [2,34] | 0.849 | |
| white | 0.508 [9,36] | 0.479 | |
| ramsey | 2.121 [1,35] | 0.154 | |
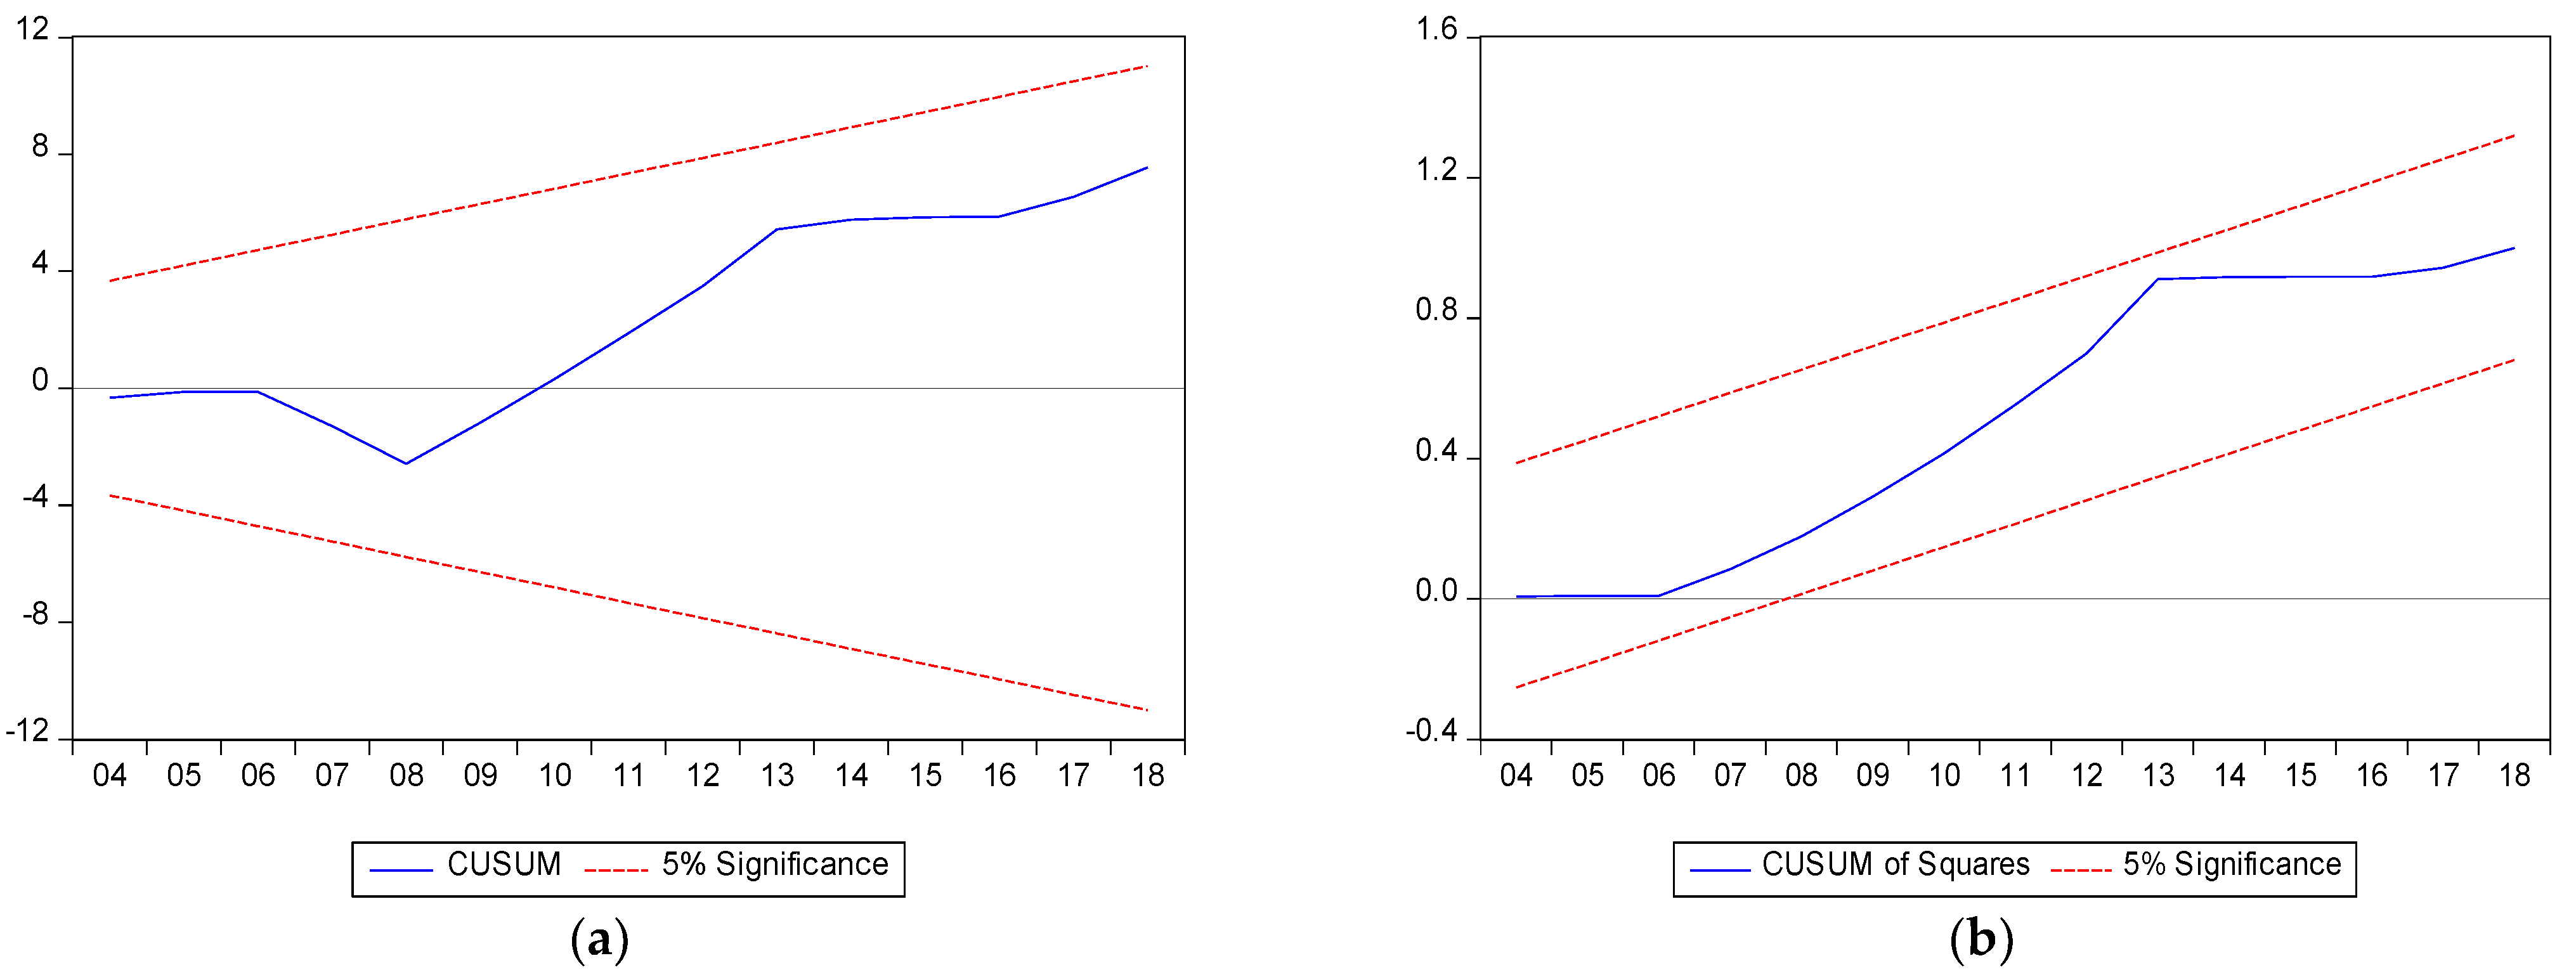
| CUSUM test | Stable | ||
| CUSUM of Squares Test | Stable | ||
| Dependent Variable: Greenhouse Gas Emissions | ||
|---|---|---|
| Approach | FMOLS | DOLS |
| log ec | −0.172 *** (−8.885) | −0.687 *** (−7.763) |
| log eg | 0.465 *** (13.760) | 0.496 *** (8.001) |
| log or | −0.126 *** (−3.856) | −0.235 *** (−4.077) |
| log nr | 0.233 *** (6.005) | 0.137 ** (2.085) |
| Du2001 | 0.054 ** (2.462) | 0.169 *** (4.199) |
Publisher’s Note: MDPI stays neutral with regard to jurisdictional claims in published maps and institutional affiliations. |
© 2022 by the authors. Licensee MDPI, Basel, Switzerland. This article is an open access article distributed under the terms and conditions of the Creative Commons Attribution (CC BY) license (https://creativecommons.org/licenses/by/4.0/).
Share and Cite
He, Y.; Li, X.; Huang, P.; Wang, J. Exploring the Road toward Environmental Sustainability: Natural Resources, Renewable Energy Consumption, Economic Growth, and Greenhouse Gas Emissions. Sustainability 2022, 14, 1579. https://0-doi-org.brum.beds.ac.uk/10.3390/su14031579
He Y, Li X, Huang P, Wang J. Exploring the Road toward Environmental Sustainability: Natural Resources, Renewable Energy Consumption, Economic Growth, and Greenhouse Gas Emissions. Sustainability. 2022; 14(3):1579. https://0-doi-org.brum.beds.ac.uk/10.3390/su14031579
Chicago/Turabian StyleHe, Yugang, Xiang Li, Panpan Huang, and Jingnan Wang. 2022. "Exploring the Road toward Environmental Sustainability: Natural Resources, Renewable Energy Consumption, Economic Growth, and Greenhouse Gas Emissions" Sustainability 14, no. 3: 1579. https://0-doi-org.brum.beds.ac.uk/10.3390/su14031579