Article

Level of Satisfaction among University Students Using Various Transport Modes

by
Efstathios Bouhouras
,
Socrates Basbas
*,
Georgios Mintsis
,
Christos Taxiltaris
,
Marios Miltiadou
,
Andreas Nikiforiadis
,
Maria Natalia Konstantinidou
and
Eleni Mavropoulou
School of Rural and Surveying Engineering, Faculty of Engineering, Aristotle University of Thessaloniki, 541 24 Thessaloniki, Greece
*
Author to whom correspondence should be addressed.
Sustainability 2022, 14(7), 4001; https://0-doi-org.brum.beds.ac.uk/10.3390/su14074001
Submission received: 12 March 2022 / Revised: 24 March 2022 / Accepted: 26 March 2022 / Published: 28 March 2022

Abstract

:
The level of satisfaction arising from a person’s transportation is an important factor, surely, for the provider of transport services, but its calculation is a rather complex case. Each attempt towards this objective has to be well designed and organized, thus requiring in most cases a significant amount of resources and time. The present paper presents the key findings of a questionnaire-based survey addressed to students at the Aristotle University of Thessaloniki (AUTH) regarding their level of satisfaction on the usage of the available transport modes in the Thessaloniki Metropolitan Area, Greece, and primarily public transport, which was conducted in the framework of the EN.I.R.I.S.S.T. project (a collaboration of 16 research teams representing 11 universities and research centers in Greece). Based on the collected data, a descriptive as well as in-depth statistical analyses were conducted identifying the attributes of the participants’ transportation. Furthermore, by using an algorithm developed in the framework of European research activities, the levels of satisfaction among the university students concerning various transport modes were calculated, emphasizing that a private car is more preferable than public transport, revealing the “weaknesses” of each mode in relation to their provided services, and out of which arises the necessity for measures to deal with them and a need to promote sustainable mobility by policy makers.

1. Introduction

Sustainable mobility in modern societies has become a prerequisite for future transport in relation to a better quality of life for residents and visitors. Public transport has to become the main pillar serving peoples movements in urban areas, by providing new, upgraded and innovative services. In this aspect, public transport operators/administrators must ensure that the level of the provided services are those required and needed, and for this to happen the users’ level of satisfaction has to be recorded through time and with ways less intrusive than those followed in the past.
The survey aimed to collect the necessary data to calculate the level of satisfaction on the usage of the available transport modes in the Thessaloniki Metropolitan Area. The collected data were then analyzed (descriptive and in-depth statistical analyses) and used as inputs (with the necessary assumptions) to an algorithm developed in the framework of the European Commission’s Urban Audit project [1]. Section 2 entitled “Literature review”, is presented in a summarized way relevant to the paper’s subject references. Section 3 entitled “Methodology” presents the methodology followed concerning the development of the questionnaire, the actions for ensuring the credibility of the survey and the context of the questionnaire. Section 4 entitled “Analysis and Results” present both the descriptive (Section 4.1) and the in-depth statistical analyses (Section 4.2) as well as the calculation of the level of satisfaction among university students using various transport modes in the Thessaloniki Metropolitan Area. Finally, Section 5 entitled “Discussion” presents the limitation of the process followed, the identified problems, and the future actions while Section 6 entitled “Conclusions” presents the main conclusions of the statistical analysis.
The AUTH students’ level of satisfaction over the usage of different transport modes is not often surveyed. Although AUTH’s authorities support and encourage surveys that are designed to improve students and staff’s quality of life, such a survey had not been conducted for many years (something we considered as a very important step towards the development of an integrated sustainable travel plan for the university). Through the collaboration of our research team, the Rectorate Authorities and the respective technical services, the survey was conducted in a short period of time ensuring the participants’ anonymity. The approach that was followed provides the opportunity to repeat the survey in due time and therefore collect valuable data, thus developing a data time series and obtaining crucial insights for public transport operators/administrators as well as policy makers at all levels.

2. Literature Review

The literature review was based on exploring digital paper data bases throughout the internet focusing on terms such as: level of satisfaction, university students’ mobility, wellbeing, questionnaire based surveys, quality-of-service, QOS. Although there were many references concerning the calculation of different transport modes users’ level of satisfaction, our research was limited to those that were related to university students.
Sukhov et al. [2] present a thorough description of the definition of the term ‘level of satisfaction’ as well as the methodologies used by transport researchers through time in order to capture travel satisfaction. The methodology that was followed concerning the data collection was fully aligned to the relevant international literature [3,4,5,6,7,8,9,10,11,12,13,14,15,16,17,18].
Specifically, the Customer Satisfaction Indexes (CSIs) were chosen to be collected and analyzed as they measure the quality of the provided services based on the users’ judgment with the help of a numerical scale (Likert scale in this case) [19,20]. As the descriptive statistics analysis provides an insight to the collected data [21,22], the in-depth analysis examines the correlation of predefined factors, specifically those used by the algorithm for the calculation of the level of satisfaction for the above-mentioned transport modes, with the majority of these predefined factors having been used in other case studies as well [23,24,25]. Although there are many different methodologies on calculating public transport users’ level of satisfaction (SERVQUAL—Service Quality model [26], European Customer Satisfaction Index—ECSI model [27], multi-criteria analysis [28], last kilometer bus satisfaction evaluation model [29], fuzzy clustering approach [30], Pythagorean fuzzy MULTIMOORA method [31], and Parsimonious Analytic Hierarch Process [32]), in our case it was decided to use an algorithm, as mentioned in the above, developed in the framework of a survey conducted in cities located in Member States of the European Union as well as other countries (Iceland, Norway, Switzerland and Turkey). Additionally, this was to avoid future potential problems regarding the definition of service quality by different types of travelers that can occur by the application of regression models [33].

3. Methodology

EN.I.R.I.S.S.T. is an innovative national research infrastructure that supports and promotes research and has the vision to be the center of excellence in shipping, transport and supply chains in Greece. It combines the collection and processing of data, the development of innovative models and programming techniques, the development of a useful application that is secure and user-friendly, and finally the development of digital observatories aimed at supporting public and private stakeholders [34]. In the framework of the project and specifically “Work Package 5” under the title “EN.I.R.I.S.S.T. Services”, the research team of the Laboratory of Transportation Planning, Transportation Engineering and Highway Engineering of the School of Rural and Surveying Engineering of the Aristotle University of Thessaloniki (hereafter mentioned as AUTH), conducted a questionnaire-based survey addressed to the students of AUTH. Similar to our survey addressed to the university’s students are also other surveys conducted not only in the city of Thessaloniki previously, but worldwide [35,36,37,38,39,40,41,42,43,44,45], as well as surveys addressed to students in general [46,47], that permitted the research team to better design, organize and conduct the current survey.
The questionnaire-based survey was conducted online using the LimeSurvey [48] platform based on the requirements of the Research Ethics Committee of AUTH [49]. The questionnaire was designed and developed in such a way that the anonymity of the users was ensured, in respect to the General Data Protection Regulation (GDPR). The survey was then communicated to all institutional email accounts (over 80,000 concerning personnel and students). The questionnaire was structured based on two distinct sections. The first was focused on collecting sociodemographic data while the second on collecting data regarding the choices, habits, and perceived level of satisfaction of the users regarding all available transport modes in the under-study area (Thessaloniki Metropolitan Area—TMA).
The Thessaloniki Metropolitan Area includes the Municipalities of Thessaloniki, Kalamaria, Neapoli-Sykies, Pavlos Melas, Kordelio-Evosmos, Ampelokipoi-Menemeni and Pylaia-Hortiati, Themraikos, Thermis and Oraiokastro (see Figure 1). The total population is over 1mo residents, and the area covers over 1200 km2 [50].
The first section of the questionnaire included six (6) questions as follows: (a) gender, (b) age, (c) marital status, (d) monthly income, (e) level of education and (f) municipality of residence. Questions a to e allowed the users to select their answer from a list (of possible answers) while for question f, the users were free to answer as they pleased.
The second sections of the questionnaire included eighteen (18) questionnaires:
i.
Access to a private car.
ii.
Access to a bicycle.
iii.
Frequency of using a private car as a driver during the period of seven (7) days in TMA.
iv.
Frequency of using a bicycle during the period of seven (7) days in the TMA.
v.
Frequency of using public transport during the period of seven (7) days in TMA.
vi.
Frequency of using a private car as a passenger during the time of seven (7) days in the area of interest.
vii.
Frequency of using a taxi during the period of seven (7) days in TMA.
viii.
Frequency of walking during the period of seven (7) days in the area of interest.
ix.
Define level of satisfaction from the usage of a private car as a driver.
x.
Define level of satisfaction from the usage of a private car as a passenger.
xi.
Define level of satisfaction from the usage of public transport.
xii.
Define level of satisfaction from the usage of a taxi.
xiii.
Define level of satisfaction from the usage of a bicycle.
xiv.
Define level of satisfaction from walking.
Questions i to viii required the users to provide a simple text answer (yes/no) or a single numerical value, while questions ix to xiv allowed the users to choose a value for the different provided services for each available transport mode based on a Likert scale (1–5).
The questionnaire-based survey endured from 20 March 2021, to 2 June 2021. The minimum sample size was determined equal to 320, by using the following sample size calculation formula and aiming to achieve a 5% margin of error at the significance level a = 5% [51,52]:
n = N × z 2 × p ( 1 p ) ε 2 ( N 1 ) + z 2 × p ( 1 p )
where:
  • n: the sample size
  • N: the population size
  • z: the Z statistic for a level of confidence (z = 1.96, since a = 5%)
  • p: the expected population proportion
  • ε: the margin of error
During this period, 466 valid questionnaires were filled from AUTH’s students performing as a solid sample allowing both a descriptive and in-depth analysis, which are presented on the following. This sample was extracted by a sample of almost 1500 questionnaires filled by academic and administrative staff as well as students (under and post-graduate, PhD candidates and post-doctoral researchers). The descriptive analysis was performed using Microsoft Corporation, Microsoft Excel software while the in-depth analysis used IBM Corp. Released 2020, IBM SPSS Statistics for Windows (Armonk, New York, USA, IBM Corp.) software (both under academic license provided by AUTH).
Furthermore, based on the collected data, the level of satisfaction as it was perceived by the AUTH’s students was calculated for public transport and a private car (as drivers and passengers) with the appropriate and necessary assumptions. The algorithm used for this task was the one developed in the framework of the European Commission’s survey which was conducted in June 2015 in order “to measure the local perceptions of quality of life in 79 cities, including cities in the Member States of the European Unions and cities in Iceland, Norway, Switzerland and Turkey as well” [1]. The usage of the specific algorithm was chosen over other methods (for example classical regression models) due to the fact that it was developed in order to calculate public transport users’ level of satisfaction by the European Commission, using a very large sample of participants in the framework of relevant research activities. Furthermore, the surveys were repeated over time, ensuring the algorithm’s successful development and implementation.
The algorithm calculates the perceived satisfaction of using public transport, but our team decided to use the algorithm with the appropriate assumptions and adjustments for a private car as well. The average reported through the survey satisfaction of moving in the urban area by public transport was calculated with the following equations:
S A T ¯ = m A S P E C T ¯ m m
where m is the number of aspects (dimensions):
A S P E C T ¯ m = h A G R E E ¯ h ,   m
where h is the four replies of the agreement scale.
The four replies of the agreement scale which the algorithm uses are (a) strongly agree, (b) somewhat agree, (c) somewhat disagree and (d) strongly disagree.
A G R E E ¯ h , m = # t i m e s   a g r e e m e n t   h   w a s   u s e d   i n   s a m p l e   f o r   a s p e c t   m #   p e o p l e   s a m p l e   o f   a s p e c t   m # D K N A a n s w e r s   i n   s a m p l e   m × C h
where:
C h = s t r o n g l y   a g r e e = 10 ,   C h = s o m e w h a t   a g r e e = 6.66 ,   C h = s o m e w h a t   d i s a g r e e = 3.33 ,   C h = s t r o n g l y   d i s a g r e e = 0
The above equations take into consideration the following indexes (which were included as questions in the questionnaire): (a) affordability, (b) safety, (c) easiness to get, (d) frequency and (e) reliability of public transport. A crucial parameter for the calculation of a user’s public transport level of satisfaction concerns those questionnaires in which the users did not provide feedback for the above-mentioned indexes.
As mentioned in the above, assumptions and adjustments were necessary to be made to properly match the indexes of the algorithm with the respective questions of the questionnaire as well to transform the 5-level Likert scale describing the level of satisfaction used in the questionnaire to the 4-level scale used by the algorithm (see Table 1). By examining the answers of the participants in the survey, it was identified that the majority of those stating neutrality had a rather negative opinion (somewhat disagree and/or strongly disagree) in the rest of the questions. Therefore, the authors decided the answers stating neutrality should be added to those answers stating somewhat disagree.
Another set of assumptions and adjustments that had to be made concerned the matching of the indexes required by the algorithm with the most relevant used in the questionnaire. These assumptions and adjustments concerning public transport were the following:
  • Affordability (algorithm) was matched with the price of the ticket for public transport (questionnaire).
  • Safety (algorithm) was matched with the perceived level of safety while using public transport (questionnaire).
  • Easiness to get (algorithm) was matched with the embarking/disembarking easiness to/from the public transport mode (questionnaire).
  • Frequency (algorithm) was matched with the frequency of the public transport modes (questionnaire).
  • Reliability (algorithm) was matched with the consistency as described by the administrators/operators of the public transport modes (questionnaire).
The assumptions and adjustments concerning using a private car as drivers were the following:
  • Affordability (algorithm) was matched with the comfortability the drivers feel during the trip (questionnaire).
  • Safety (algorithm) was matched with the perceived level of safety while driving (questionnaire).
  • Easiness to get (algorithm) was matched with the autonomy the drivers feel by using their private car (questionnaire).
  • Frequency (algorithm) was matched with the time spent while driving (questionnaire).
  • Reliability (algorithm) was matched with the effect of traffic congestion on the drivers’ movement (questionnaire).
The assumptions and adjustments concerning using a private car as passengers were the following:
  • Affordability (algorithm) was matched with the comfortability the drivers feel during the trip (questionnaire).
  • Safety (algorithm) was matched with the perceived level of safety while driving (questionnaire).
  • Easiness to get (algorithm was matched with the autonomy the drivers feel by using their private car (questionnaire).
  • Frequency (algorithm) was matched with the passengers’ confidence for moving with a private car (questionnaire).
  • Reliability (algorithm) was matched with the trips’ duration (questionnaire).

4. Analysis and Results

This section presents the statistical analysis of the collected data divided in two subsections. Specifically, Section 4.1 concerns the descriptive statistical analysis and Section 4.2 the in-depth statistical analysis.

4.1. Descritpive Statistical Analysis

Most of the sample consisted of women (65.4%). Regarding the monthly household income, there was sufficient representation of all income classes in the sample; however, the lower income class (EUR 0–400) was the most popular (31.5%). Similar were the percentages of the university students that had access to a private car and a bicycle. More specifically, 49.5% of the respondents had access to a private car, while 44.3% of them had access to a bicycle. Table 2 presents how frequently the university students used the various available transport modes in the Thessaloniki Metropolitan Area. It became understood that the university students mostly conducted their trips on foot, while many of their trips were also being carried out with public transport. On the other hand, only a small percent (11%) of the respondents used a bicycle on a regular basis, i.e., more than once per week.
The university students were also asked about which transport mode they would like to use more frequently, but where there were barriers that prevented them. The majority (38.9%) of the respondents stated that they would like to use a bicycle more frequently, while an important 23% stated that they would like to use a private car. An open-ended question was asked to those who stated that they would like to use a transport mode more frequently, about the barrier that prevented them for using it. The vast majority of those who would like to use a bicycle more frequently stated that the unsafe bicycling environment (due to the limited and fragmented bicycling network) of the city as the main barrier. On the other hand, the unavailability of a driving license was identified as the main barrier for not using a private car. These two barriers indicate that if no actions for making bicycling safer are taken, a private car will attract more and more young adults once they have access and permission to use it.
Figure 2 presents the assessment of the various transport modes in Thessaloniki, per the satisfaction indicator. Overall, walking, and private cars were assessed more positively, while public transport was assessed more negatively. It seems that private cars were considered very comfortable, especially by passengers, and that they also provided high levels of autonomy, mostly to the drivers. On the other hand, their main drawback, as it was identified by the drivers, was the negative impact of the traffic congestion. Public transport in Thessaloniki scored very low in most of the satisfaction indicators, i.e., time consistency, route frequency, boarding/disembarking process, and safety, indicating that the quality of service that is provided is insufficient. A bicycle was assessed very positive in terms of autonomy and self-confidence, but too negatively in terms of safety and traffic conditions. Safety and traffic conditions were linked to a large extent and their negative assessment enhanced the finding that the unsafe bicycling environment of the city is an important barrier for choosing that specific transport mode. Finally, walking gathered mainly positive responses, especially with regards to autonomy and self-confidence, but issues related with safety and infrastructure existed.

4.2. In Depth Statistical Analysis

In the context of the current section, specific perceived conditions experienced by the survey’s participants during commuting, such as comfort, safety, autonomy, confidence, travel time and transport costs, were examined. In terms of the Pearson correlation, the relative values were calculated based on the level of usage of the available transport modes. For car passengers the perceived level of comfort, safety, autonomy, and confidence were examined. For car drivers the perceived level of comfort, safety, autonomy, and congestion were examined. For public transport users the perceived level of in vehicle safety, timetable frequency, time schedule punctuality, process of embark/disembark and ticket price were examined. Table 3 demonstrates the results of this process, as well as non-statistically significant relationships which occurred in the considered correlations. Two variables were statistically significant, if the level of significance (asymptotic significance—2-sided in this case) was <0.05. Therefore, the correlations among these parameters that emerged are explained by taking into consideration the Pearson coefficient and the existence of statistical significance.
From the overall examined relationships, the cases that stood out were the following. The perceived level of comfort by the car drivers was negatively correlated with the degree of car usage (Finding 1). The perceived level of safety by the car drivers was negatively correlated with the degree of car usage (Finding 2). The perceived level of autonomy by the car drivers was negatively correlated with the degree of car usage (Finding 3). Thus, there were three significant findings referring, exclusively, to car drivers. These three findings indicate that as the degree of car use increases the perceived levels of comfort, safety and autonomy by car drivers decrease.

4.3. Level of Satisfaction Calculation

As mentioned in the above, for the calculation of the level of satisfaction, an algorithm, developed in the framework of a survey conducted in cities located in Member States of the European Union as well as other countries (Iceland, Norway, Switzerland, and Turkey, was used. Table 4, Table 5 and Table 6 present the results of this implementation for the public transport users (Table 4), for the drivers of private cars (Table 5) and for the passengers of private cars (Table 6).
Based on the presented scores, private cars are more preferable as transport modes than public transport in the case of the students at the Aristotle University of Thessaloniki, which is a rather alarming fact and requires deeper and further examination in order to identify the reasons behind it. Moreover, as students represent a significant part of the society of the Thessaloniki Metropolitan Area, it is obvious that the survey must be extended and addressed to the residents of the city.

5. Discussion

Both the descriptive and in-depth statistical analysis provide useful findings which should be taken into consideration by the decision makers at the local level as well as the operators of public transport in the case of Thessaloniki. It is worthy of attention that the students at the Aristotle University of Thessaloniki believe that private cars are more comfortable, safer and provide high levels of autonomy as transport modes especially when compared to public transport. One of the most significant problems identified by the private car users is traffic congestion although it seems not to deeply affect their decision on using their cars. If the above mentioned factors are combined with the very low scores achieved by public transport regarding most of the satisfaction indicators examined, it is rather clear that measures should be taken to reverse this perception. It also must be mentioned that this perception concerns young people and if it is allowed to become further established it will become a severe problem in the future. Even though cycling and walking as alternative and sustainable transport modes were assessed positively by the students, at least in terms of a provided autonomy and self-confidence, the perceived level of safety for both was rather low, indicating that measures should be taken towards the improvement of the existing infrastructure as well as the construction of new cycling and walking infrastructures in the examined area.
Based on the above, three (5) significant correlations were identified. Findings 1 to 3 concern the perceived levels of comfort, safety, and autonomy by car drivers. Although this initially appears as a paradox due to the fact that private cars offer a higher level of comfort compared to public transport (privacy, desired temperature depending on weather conditions, seat, etc.), a potentially higher level of safety and higher autonomy, the calculated negative strong correlations imply that they should be examined along with other parameters. Specifically, they should be examined in relation to the traffic conditions, difficulty of finding parking spaces and the congestion phenomena. It seems though, that car drivers do acknowledge that using their private cars could ultimately lead to a lower level of comfort, safety, and autonomy as they have to be extremely careful while driving, that they can face delays due to congestion phenomena and, additionally, they can spend time and money in order to find a parking space.
Furthermore, all examined variables regarding public transport usage revealed a negative correlation with the perceived level of safety (in vehicle), frequency, reliability, embarking/disembarking conditions, and transport costs, and although statistically these correlations cannot be considered as strong, they do capture the participant’s opinion on public transport in the Thessaloniki Metropolitan Area.
The achieved scores regarding the level of satisfaction are aligned with the findings from both the descriptive and in-depth statistical analysis and the students at the Aristotle University of Thessaloniki are not satisfied by the provided level of public transport services, as shown by almost all the examined satisfaction indicators [40]. At the same time, they do believe that a private car provides a higher level of safety, comfort and autonomy when compared to public transport, but the statistical analysis reveals that if these perceived levels are examined in relation to traffic congestion, delays, easiness of finding a parking space and transport costs, then they are not so high. Cycling and walking seem to have a rather important role to play as alternative transport modes but under specific conditions (mainly improvement of the cycling and walking infrastructure); however, as already mentioned, currently in the Thessaloniki Metropolitan Area only one public transport operator exists, while metro lines are under construction and are expected to become operational after 2023. It is unknown how the level of satisfaction will evolve after the metro system becomes operational.
Our study has the following limitations: The survey was conducted through the internet after an official invitation was sent to all academic email accounts and not in situ due to the COVID-19 pandemic. It is not easily estimated how many of the students checked their email accounts and became aware of the survey. Moreover, the questionnaire developed and used for the survey was not completely customized for the needs of the used algorithm for the calculation of the level of satisfaction, as its usage was decided in a later stage. Another limitation concerns the fact that at the time of our survey, the public transport operator in the Thessaloniki Metropolitan Area had already begun a renewal of its bus fleet acknowledging that the level of provided services perhaps have not previously been the desired one. Finally, since the survey was conducted in the framework of the EN.I.R.I.S.S.T. project, a strict time schedule had to be followed thus permitting the survey to only be available online for a short period.
The fact that private car usage (either as a driver or as a passenger) is preferable as a transport mode rather than public transport, bicycles and walking, should in terms of the level of satisfaction be alarming for decision makers as well as the respective stakeholders in Thessaloniki Metropolitan Area. It can be strongly assumed based on the combinatorial analysis of the collected data and calculated level of satisfactions that the participants were disappointed by the level of public transport services provided, thus, they had resorted to considering private cars as their best solution. Although the participants acknowledge the problems they face by using their private cars (delays, congestion phenomena, unavailability of an ensured free parking spaces, etc.), they felt “enforced” to use their private cars in order to enjoy a more comfortable and less stressful transportation experience. Concerning bicycle usage and/or walking, the participants did acknowledge their contribution to sustainable mobility as well as their role to play as alternatives to the private car transport mode, but their general feeling was that they are at the moment supplementary and not dominant transport modes due to many reasons (limited dedicated infrastructure, other users’ unawareness on how to behave in relation to bicyclists and pedestrians, etc.).
It is rather clear that the level of public transport services must be significantly improved, regarding the in-vehicle conditions, the reliability of vehicles’ schedules and the working staff’s ways of interacting with passengers. The number of vehicles (buses) serving daily schedules should be increased, especially for the lines with a high demand. At the same time, measures should be taken in order to communicate to people the benefits of using public transport but also the negative effects for them as well as for the environment by using their private cars [42]. It must be mentioned that any measures taken towards the minimization of private car usage should not be punitive. On the contrary, the measures taken should be focused on convincing people of the negative effects of using private cars based on detailed data per the types of users.
Furthermore, the networks of pedestrian and cycling roads should be improved; however, any interventions made must be properly designed and executed [42,43]. In parallel, people should be properly educated on how to use this infrastructure with respect to other users through campaigns, brochures and leaflets designed by experts (transportation engineers, graphic artists and others). Educational seminars on this issue could be conducted for primary and secondary schools by qualified staff.
As mentioned above, the metro line is expected to become operational in the near future. It is considered necessary that the survey be repeated on a yearly basis in order to capture the trends of people’s mobility in the Thessaloniki Metropolitan Area (not exclusively university students but residents in general) and extract useful results which will provide the necessary feedback to decision makers in order to adjust existing measures and to decide new approaches towards achieving sustainable mobility (at the moment the continuation of the survey is ongoing in the framework of our research activities). Furthermore, planners will be able to use frequently collected data in order to, among others:
  • Redesign public transport routes, increasing passenger safety and security.
  • Improve the types of stops as well as their surrounding environment, such as lighting, in order to make them more comfortable, safer and more secure.
  • Require a reallocation of public transport internal seat positions in order to meet student needs (both in terms of their number as well as increasing their safety and security) and to optimize the working staff’s required actions in order to keep the vehicles clean and well organized.
  • Redesign the cycling and walking networks in order to increase accessibility to the AUTH’s campus facilities, ensuring students safety and security and at the same time maximizing the number of students being able to use these networks.
  • Scheduling interventions and maintaining road infrastructure as well as cycling and walking networks not only outside the campus facilities but also internal networks in order to connect between them (internal and external) for safety and security for the students.
  • Developing and frequently updating the AUTH’s Sustainable Mobility Plan based on the students’ opinions about the level of provided services.
  • Finally, all the above can be easily implemented for all residents in the case of the survey being addressed to all Thessaloniki Metropolitan Area residents.

6. Conclusions

It is rather clear based on the results of our analysis that measures must be taken by the decision makers to reverse the perception of the Aristotle’s University of Thessaloniki students concerning their mobility, and specifically the usage of their private cars. In order to examine the evolution of their level of satisfaction, it has been decided to repeat the survey during spring 2022 and, if possible, to extend it to the rest of the residents of the Thessaloniki Metropolitan Area. The survey covers not only the attributes of the provided services but also infrastructural issues. The available (collected) data provide critical and crucial insights into the qualitative characteristics of students’ levels of satisfaction, suggesting that measures be taken in order to improve the provided services.
Although the number of AUTH’s members represent about 10% of the population of the Thessaloniki Metropolitan Area, it would be extremely interesting to expand the survey to all residents of the examined area and to capture their levels of satisfaction not only for comparing them with those of our survey and analysis, but most importantly for recording their perceived levels of performance of the available transport modes.

Author Contributions

Conceptualization, E.B.; methodology, E.B., A.N. and M.N.K.; validation, E.B., S.B. and M.M.; formal analysis, A.N. and M.N.K.; writing—original draft preparation, E.B., A.N. and M.N.K.; writing—review and editing, S.B. and E.M.; supervision, S.B., G.M. and C.T.; project administration, S.B., G.M. and C.T. All authors have read and agreed to the published version of the manuscript.

Funding

Co-financed by Greece and the European Union—European Regional Development Fund.

Institutional Review Board Statement

The study was conducted in accordance with the Declaration of Helsinki, and approved by the Institutional Ethics Committee of Aristotle University of Thessaloniki (protocol code 43670/2021 and date of approval 22 February 2021).

Informed Consent Statement

Informed consent was obtained from all subjects involved in the study.

Data Availability Statement

Not applicable.

Acknowledgments

We acknowledge support of this work by the project “ENIRISST—Intelligent Research Infrastructure for Shipping, Supply Chain, Transport and Logistics” (MIS 5027930) which is implemented under the Action “Reinforcement of the Research and Innovation Infrastructure”, funded by the Operational Programme “Competitiveness, Entrepreneurship and Innovation” (NSRF 2014–2020) and co-financed by Greece and the European Union (European Regional Development Fund).

Conflicts of Interest

The authors declare no conflict of interest.

References

  1. European Commission Urban Audit. Available online: https://ec.europa.eu/regional_policy/en/policy/themes/urban-development/audit/ (accessed on 12 November 2021).
  2. Sukhov, A.; Lattman, K.; Olsson, L.E.; Friman, M.; Fujii, S. Assessing travel satisfaction in public transport: A configurational approach. Transp. Res. Part D Transp. Environ. 2021, 93, 102732. [Google Scholar] [CrossRef]
  3. Rye, T.; Stantchev, D. City level Sustainable Mobility Indicator Descriptions. CIVITAS CAPITAL Advisory Group 5 Data and Statistic. CIVITAS CAPITAL Project. 2016. Available online: https://civitas.eu/sites/default/files/civitas_capital_ag5_brochure_indicators_final.pdf (accessed on 16 November 2021).
  4. Papantoniou, P.; Yannis, G.; Vlahogianni, E.; Attard, M.; Regattieri, A.; Piana, F.; Pilati, F. Developing a Sustainable Mobility Action Plan for University Campuses. Transp. Res. Procedia 2020, 48, 1908–1917. [Google Scholar] [CrossRef]
  5. Ribeiro, P.; Fonseca, F.; Meireles, T. Sustainable mobility patterns to university campuses: Evaluation and constraints. Case Stud. Transp. Policy 2020, 8, 639–647. [Google Scholar] [CrossRef]
  6. Azzali, S.; Sabour, E.A. A framework for improving sustainable mobility in higher education campuses: The case study of Qatar University. Case Stud. Transp. Policy 2018, 6, 603–612. [Google Scholar] [CrossRef]
  7. UNI EN 13816. Transportation—Logistics and Services—Public Passenger Transport—Service Quality Definition, Targeting and Measurement; CEN: Brussels, Belgium, 2002. [Google Scholar]
  8. Shannon, T.; Giles-Corti, B.; Pikora, T.; Bulsara, M.; Shilton, T.; Bull, F. Active commuting in a university setting: Assessing commuting habits and potential for modal change. Transp. Policy 2006, 13, 240–253. [Google Scholar] [CrossRef]
  9. Shaaban, K.; Kim, I. The influence of bus service satisfaction on university students’ mode choice. J. Adv. Transp. 2016, 50, 935–948. [Google Scholar] [CrossRef] [Green Version]
  10. Redman, L.; Friman, M.; Garling, T.; Hartig, T. Quality attributes of public transport that attract car users: A research review. Transp. Policy 2013, 25, 119–127. [Google Scholar] [CrossRef]
  11. Kazemzadeh, K.; Bansal, P. Electric bike level of service: A review and research agenda. Sustain. Cities Soc. 2021, 75, 103413. [Google Scholar] [CrossRef]
  12. Kazemzadeh, K.; Ronchi, E. From bike to electric bike level-of-service. Transp. Rev. 2022, 42, 6–31. [Google Scholar] [CrossRef]
  13. Saif, M.A.; Zefreh, M.M.; Torok, A. Public Transport Accessibility: A Literature Review. Period. Polytech. Transp. Eng. 2018, 47, 36–43. [Google Scholar] [CrossRef] [Green Version]
  14. Susilo, Y.O.; Cats, O. Exploring key determinants of travel satisfaction for multi-modal trips by different traveler groups. Transp. Res. Part A Policy Pract. 2014, 67, 366–380. [Google Scholar] [CrossRef]
  15. Stojic, D.; Ciric, Z.; Sedlak, O.; Horvat, A.M. Student’s Views on Public Transport: Satisfaction and Emission. Sustainability 2020, 12, 8470. [Google Scholar] [CrossRef]
  16. Minelgaite, A.; Dagiliute, R.; Lionikiene, G. The Usage of Public Transport and Impact of Satisfaction in the European Union. Sustainability 2020, 12, 9154. [Google Scholar] [CrossRef]
  17. Diana, M. Measuring the satisfaction of multimodal travelers for local transit services in different urban contexts. Transp. Res. Part A 2012, 46, 1–11. [Google Scholar] [CrossRef] [Green Version]
  18. Aljoufie, M. User’s satisfaction level of transport system quality in Jeddah city, Saudi Arabia. J. Eng. Appl. Sci. 2016, 11, 3494–3500. [Google Scholar]
  19. Eboli, L.; Mazzulla, G. A New Customer Satisfaction Index for Evaluating Transit Service Quality. J. Public Transp. 2009, 12, 21–37. [Google Scholar] [CrossRef] [Green Version]
  20. Silveira, T.; Romano, C.A.; Gadda, T. Public transport usage among university students: What to expect based on customer satisfaction survey (CSS) analysis. Transportes 2020, 28, 32–45. [Google Scholar] [CrossRef]
  21. Ji, J.; Gao, X. Analysis of people’s satisfaction with public transportation in Beijing. Habitat Int. 2010, 34, 464–470. [Google Scholar] [CrossRef]
  22. Shaaban, K.; Khalil, R.F. Investigating the Customer Satisfaction of the Bus Service in Qatar. Procedia—Soc. Behav. Sci. 2013, 104, 865–874. [Google Scholar] [CrossRef] [Green Version]
  23. Tyrinopoulos, Y.; Antoniou, C. Public transit user satisfaction: Variability and policy implications. Transp. Policy 2008, 15, 260–272. [Google Scholar] [CrossRef]
  24. Vicente, P.; Suleman, A.; Reis, E. Index of Satisfaction with Public Transport: A Fuzzy Clustering Approach. Sustainability 2020, 12, 9759. [Google Scholar] [CrossRef]
  25. Li, X.H.; Huang, L.; Li, Q.; Liu, H.C. Passenger Satisfaction Evaluation of Public Transportation Using Pythagorean Fuzzy MULTIMOORA Method under Large Group Environment. Sustainability 2020, 12, 4996. [Google Scholar] [CrossRef]
  26. Thomaz, P.S.; Nogueira, C.; Da Costa Coelho, L.; Volkmer de Azambuja, A.M.; Dias de Mattos, V.L. Satisfaction with public transport: The case of a university access. Int. J. Eng. Res. Appl. 2016, 6, 1–6. [Google Scholar]
  27. Inturri, G.; Giuffrida, N.; Le Pira, M.; Fazio, M.; Ignaccolo, M. Linking Public Transport User Satisfaction with Service Accessibility for Sustainable Mobility Planning. ISPRS Int. J. Geo-Inf. 2021, 10, 235. [Google Scholar] [CrossRef]
  28. Parasuraman, A.P.; Zeithaml, V.A.; Berry, L.L. SERVQUAL: A multiple-Item Scale for measuring consumer perceptions of service quality. J. Retail. 1988, 64, 12–40. [Google Scholar]
  29. Rovaha. Available online: https://www.van-haaften.nl/customer-satisfaction/customer-satisfaction-models/61-the-european-customer-satisfaction-index (accessed on 17 November 2021).
  30. Stanković, M.; Gladović, P.; Popović, V. Determining the importance of the criteria of traffic accessibility using fuzzy AHP and rough AHP method. Decis. Mak. Appl. Manag. Eng. 2019, 2, 86–104. [Google Scholar] [CrossRef]
  31. Ruisong, Y.; Junxiang, C. Satisfaction evaluation of the “last kilometer” on public transport system in Shanghai. Traffic Transp. 2012, 3, 6–8. [Google Scholar]
  32. Duleba, S.; Moslem, S. User Satisfaction Survey on Public Transport by a New PHAP Based Model. Appl. Sci. 2021, 11, 10256. [Google Scholar] [CrossRef]
  33. De Ona, J.; Estevez, E.; De Ona, R. Perception of public transport quality of service among regular private vehicle users in Madrid, Spain. Transp. Res. Rec. 2020, 2674, 213–224. [Google Scholar] [CrossRef]
  34. EN.I.R.I.S.S.T. Project Website. Available online: www.enirisst.gr/ (accessed on 12 November 2021).
  35. Pitsiava-Latinopoulou, M.; Basbas, S.; Gavanas, N. Implementation of alternative transport networks in university campuses: The case of Aristotle University of Thessaloniki, Greece. Int. J. Sustain. High. Educ. 2013, 48, 310–323. [Google Scholar] [CrossRef]
  36. Stamatiadis, N.; Nikiforiadis, A.; Basbas, S.; Kopelias, P.; Karantagli, E.; Sitra, A.; Mantas, N. Attitudes and Preferences of University Student Bicyclists: The Tale of Two Greek Cities. In Advances in Mobility-as-a-Service Systems, Proceedings of 5th Conference on Sustainable Urban Mobility, Online, 17–19 June 2020; Springer International Publishing: Cham, Switzerland, 2020. [Google Scholar] [CrossRef]
  37. Basbas, S.; Skandami, M.O.; Mintsis, G.; Taxiltaris, C.; Politis, I. Investigation of the use of e-ticketing in public transport by the students of the Aristotle University of Thessaloniki, Greece. Int. J. Transp. Dev. Integr. 2017, 1, 43–53. [Google Scholar] [CrossRef]
  38. Tsioulianos, C.; Basbas, S.; Georgiadis, G. How do passenger and trip attributes affect walking distances to bus public transport stops? Evidence from university students in Greece. Spatium 2020, 24, 12–21. [Google Scholar] [CrossRef]
  39. Vaitsis, P.; Basbas, S.; Nikiforiadis, A. How Eudaimonic Aspect of Subjective Well-Being Affect Transport Mode Choice? The Case of Thessaloniki, Greece. Soc. Sci. 2019, 8, 9. [Google Scholar] [CrossRef] [Green Version]
  40. Nikoforiadis, A.; Paschalidis, E.; Stamatiadis, N.; Raptopoulou, A.; Kostareli, A.; Basbas, S. Analysis of attitudes and engagement of shared e-scooter users. Transp. Res. Part D. Transp. Environ. 2021, 94, 102790. [Google Scholar] [CrossRef]
  41. Cappelletti, G.M.; Grilli, L.; Russo, C.; Santoro, D. Sustainable Mobility in Universities: The Case of the University of Foggia (Italy). Environments 2021, 8, 57. [Google Scholar] [CrossRef]
  42. Mikiki, F.; Oikonomou, A.; Katartzi, E. Sustainable Mobility Issues of Physically Active University Students: The Case of Serres, Greece. Future Transp. 2021, 1, 777–793. [Google Scholar] [CrossRef]
  43. Cirrincione, L.; Di Dio, S.; Peri, G.; Scaccianoce, G.; Schillaci, D.; Rizzo, G. A Win-Win Scheme for Improving the Environmental Sustainability of University Commuters’ Mobility and Getting Environmental Credits. Energies 2022, 15, 396. [Google Scholar] [CrossRef]
  44. Monteiro, M.M.; de Abreu e Silva, J.; Ingvardson, J.B.; Nielsen, O.A.; Pinho de Sousa, J. Public Transport Use and Satisfaction by International Students and Researchers. Sustainability 2021, 13, 8417. [Google Scholar] [CrossRef]
  45. Bakdur, A.; Masui, F.; Ptaszynski, M. Predicting Increase in Demand for Public Buses in University Students Daily Life Needs: Case Study Based on a City in Japan. Sustainability 2021, 13, 5137. [Google Scholar] [CrossRef]
  46. Szmelter-Jarosz, A.; Suchanek, M. Mobility Patterns of Students: Evidence from Tricity Area, Poland. Appl. Sci. 2021, 11, 522. [Google Scholar] [CrossRef]
  47. Prasetyanto, D.; Rizki, M.; Sunitiyoso, Y. Online Learning Participation Intention after COVID-19 Pandemic in Indonesia: Do Students Still Make Trips for Online Class? Sustainability 2022, 14, 1982. [Google Scholar] [CrossRef]
  48. LimeSurvey GmbH Survey Services & Consulting. Available online: www.limesurvey.org (accessed on 16 November 2021).
  49. Research Ethics Committee, Research Committee—Special Account for Research Funds. Aristotle University of Thessaloniki. Available online: www.rc.auth.gr/ed (accessed on 16 November 2021).
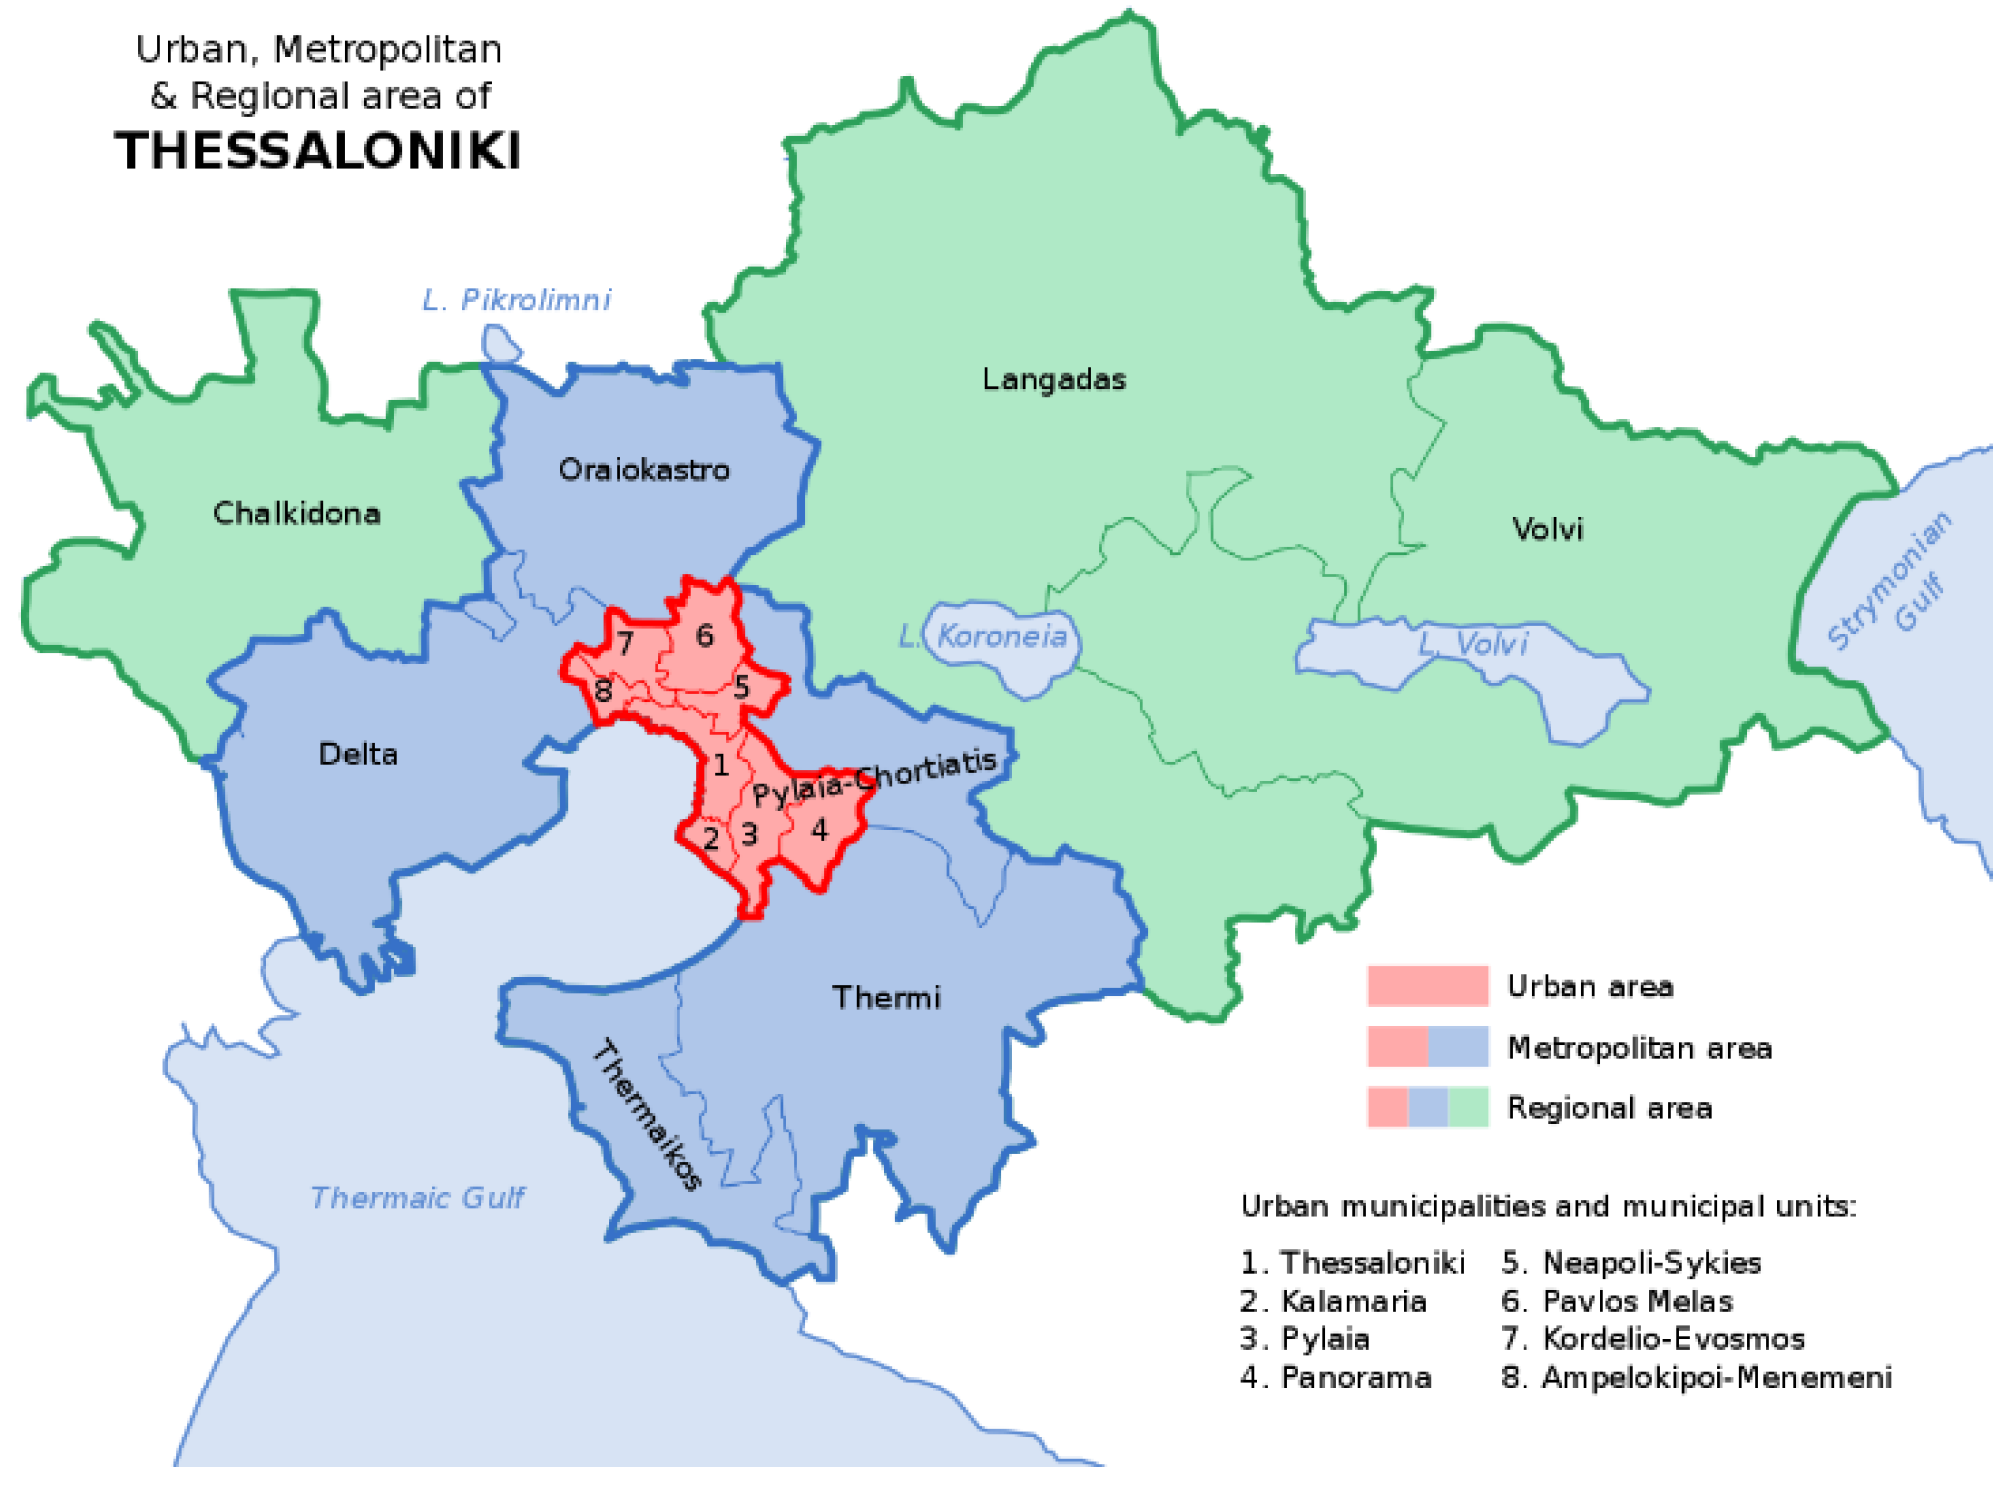
  50. Wikipedia. Available online: https://en.wikipedia.org/wiki/Thessaloniki_metropolitan_area_CC_BY-SA_3.0 (accessed on 25 February 2022).
  51. Daniel, W.W. Biostatistics: A Foundation for Analysis in the Health Sciences, 7th ed.; John Wiley & Sons, Inc.: Hoboken, NJ, USA, 1999. [Google Scholar]
  52. Naing, L.; Winn, T.; Rusli, B.N. Practical issues in calculating the sample size for prevalence studies. Arch. Orofac. Sci. 2006, 1, 9–14. [Google Scholar]
Figure 1. Thessaloniki Metropolitan Area map [50].
Sustainability 14 04001 g001
Figure 2. Satisfaction indicators for: (a) private car (as a driver); (b) private car (as a passenger); (c) public transport; (d) bicycling; (e) walking using a Likert scale 1 (not at all satisfied) to 5 (absolutely satisfied).
Sustainability 14 04001 g002
Table 1. Assumptions made to match those required by the algorithm scale concerning the level of satisfaction with those described and used in the questionnaire.
5-Level Likert Scale Used in the Questionnaire4-Level Scale Used in the Algorithm
Strongly agreeStrongly agree
Somewhat agreeSomewhat agree
NeutralSomewhat disagree
Somewhat disagree
Strongly disagreeStrongly disagree
Table 2. Transport modes usage frequency.
FrequencyPrivate Car
(As a Driver)
Private Car
(As a Passenger)
Public ΤransportBicycleWalking
>1/day4.3%5.2%10.8%1.9%43.9%
1/day4.3%2.6%16.3%1.1%23.2%
2–3/week8.6%21.1%10.1%4.6%21.1%
1/week4.5%15.5%26.4%3.4%4.7%
rarely13.1%37.4%22.4%16.1%5.6%
never65.2%18.2%14%72.9%1.5%
Table 3. Correlations between users’ perceived conditions, emerging through commuting, with the degree of use of the transport modes.
Transport ModeCommuting Conditions Degree of Mode Use
Car as passengerComfortPearson correlation−0.028
Sig. (2-tailed)0.615
SafetyPearson correlation−0.059
Sig. (2-tailed)0.289
AutonomyPearson correlation−0.001
Sig. (2-tailed)0.992
ConfidencePearson correlation0.013
Sig. (2-tailed)0.816
Public TransportIn vehicle safetyPearson correlation−0.014
Sig. (2-tailed)0.803
Timetable frequencyPearson correlation−0.012
Sig. (2-tailed)0.836
Time schedule punctualityPearson correlation−0.001
Sig. (2-tailed)0.983
Process of embark/DisembarkPearson correlation−0.019
Sig. (2-tailed)0.740
Ticket pricePearson correlation−0.075
Sig. (2-tailed)0.181
Car as driverComfortPearson correlation−0.126
Sig. (2-tailed)0.024 *
SafetyPearson correlation−0.184
Sig. (2-tailed)0.001 *
AutonomyPearson correlation−0.134
Sig. (2-tailed)0.016 *
CongestionPearson correlation−0.038
Sig. (2-tailed)0.423
* for statistically significant cases.
Table 4. Calculated level of satisfaction for the public transport users.
IndicatorAspectSurveyed Persons (j)DK/NAStrongly Agree (h)Somewhat Agree (h)Somewhat Disagree (h)Strongly
Disagree (h)
Satisfaction with Public TransportAffordable466817714010338
Safe42649211176
Access42032224186
Frequent42741199195
Reliable42639228169
Indicator value 2.9.
Table 5. Calculated level of satisfaction for the private car drivers.
IndicatorAspectSurveyed Persons (j)DK/NAStrongly Agree (h)Somewhat Agree (h)Somewhat Disagree (h)Strongly
Disagree (h)
Satisfaction with private carsAffordable46689810918467
Safe82086710974
Access81239215489
Frequent9397725091
Reliable92336272126
Indicator value 3.9.
Table 6. Calculated level of satisfaction for the private car passengers.
IndicatorAspectSurveyed Persons (j)DK/NAStrongly Agree (h)Somewhat Agree (h)Somewhat Disagree (h)Strongly
Disagree (h)
Satisfaction with private carsAffordable466615014113831
Safe610610420149
Access611812518334
Frequent613710517246
Reliable41637223186
Indicator value 4.2.
Publisher’s Note: MDPI stays neutral with regard to jurisdictional claims in published maps and institutional affiliations.

