Article

Effects of Agricultural Land and Urban Expansion on Peri-Urban Forest Degradation and Implications on Sustainable Environmental Management in Southern Ethiopia

Department of Geography and Environmental Studies, University of Gondar, Gondar P.O. Box 196, Ethiopia
*
Author to whom correspondence should be addressed.
Sustainability 2022, 14(24), 16527; https://0-doi-org.brum.beds.ac.uk/10.3390/su142416527
Submission received: 13 October 2022 / Revised: 22 November 2022 / Accepted: 1 December 2022 / Published: 9 December 2022
(This article belongs to the Special Issue Urban and Peri-Urban Forest Role in a Sustainable Ecosystem)

Abstract

:
Policy failure in controlling horizontal urban expansion coupled with agricultural/cultivated land expansion typically leads to forest degradation mostly in developing countries. Peri-urban areas are havens and vulnerable and dispute areas of uncontrolled urban expansion and forest degradation. This study was aimed to assess the effect of cultivated land and urban expansion land use/land cover change (LULCC) dynamics rate on peri-urban forest degradation and implications on sustainable environment management there by identifying the derivers of LULCC. The study used Landsat images of 2002, 2010 and 2018 and examines the underlying factors. The results revealed significant conversion from forest and grass land to built-up and cultivated land. The proportion of built-up area and cultivated land increased to 75 ha yr−1 and 85 ha yr−1 of the study area from 2002 to 2018, respectively. The identified drivers were generally grouped as proximate and underlying drivers. The effect of driving factors in shaping LULCC tends to remain stable over time, and the gradual enforcement of spatial planning policies appears to be important factors in dynamics of LULCC. Hence, it was suggested that integrated land-use planning and management has a paramount importance of reducing peri-urban forest degradation and maintaining sustainable environmental management.

1. Introduction

In the world, more than 21% of the population is living in cultivated land, which consists of 7% of the total earth’s land surface [1]. Land use pattern is directly responsible for land cover change. One of the land cover changes is forest degradation. It is mostly caused by agricultural land and urban expansion. In the past decades, LULCC has attained extensive research attention especially in the context of forest degradation. Still to date, the transition between agricultural lands or urban expansion and forest degradation has gained increasing attention. Many reports [2] shown that 70% of deforestation could be attributed to agricultural land expansion. Managing agriculture-forest presents particular challenges to balance sustainable environmental management.
Land use and land cover are concepts mostly which go together. The first is the indicator of complex human activities that alter land surface processes [3], whereas the latter indicates the physical and biological cover of the surface of the land. LULCC refers to the earth’s territorial surface modification by human activities [4]. Land use/cover (LULC) is the most prominent form of the global environmental change phenomenon occurring at spatial and temporal scales and the process of LULCC affects biodiversity, climate, soil, and as well as the ecosystem in particular and life support functions and human livelihoods [5] in general.
Land use pattern shows the social interrelationship with its physical environment. Physical environment has numerous economic, social, and ecological purposes. Thus, environmental degradation occurs due to population growth [6]. Understanding LULCC tendencies of alteration are remarkable for strategic planning and executing the aspects of sustainable environmental management [7,8]. The physical environment provides diverse ecosystem services that are necessary for human survival on the earth [9]. Consequently, LULCC took a key concern topic on the sustainable environmental agenda. In order to understand the trajectories and extents of land, LULCC is important to generate and provide helpful information to policymakers and development practitioners about the magnitude and trends of LULCC. The conversion of one land use type to another land use type to meet human needs has impact of environmental management problem. For example, the conversion of forest cover to agriculture and urban land-use types is a major contributor to environmental degradation [10] habitat destruction, and ecological imbalance on earth. Because forests are a means of income for many people and they can provide food, medicine [11], freshwater, clean air, and a storehouse for carbon [12].
Rapid conversion of forest land to agricultural and urban settlement purposes is threatening the ecological areas. The rapid urban expansion poses enormous effects on ecosystem services. Urban expansion is towards the peri-urban areas. Peri-urban areas are areas where urban core intermingles with adjacent rural areas. Peri-urban is an area of interface of heterogeneous mosaic of natural ecosystems, agro-ecosystems, and urban ecosystems affected by rural and urban interactions [13]. In most developing countries, urban expansion has resulted in a sprawl endangering the physical environment. According to previous studies on the impact factors of forest degradation, there is a positive effect of the urbanization level on forest loss rate. Urbanization is key driving of LULCC, and hence urban expansion is anticipated to increase forest loss rate [14].
Investigation of LULCC is essential for sustainable environmental management [15]. The most commonly used tool for LULCC study is remote sensing (RS) and Geographic Information Systems (GIS) which produced a maximum orientation result. It allows for more comprehensive studies of earth-system function, patterning, and spatio-temporal change at the local, regional, and global scales [16]. Spatio-temporal LULC knowledge is important to understand the dynamism of the physical environments [3]. Studies of LULC are important for understanding many of the observed phenomena that are responsible for changes [15], based on sustainable development [17].
Based on relevant literature, the authors of [15,18] had undertaken local level studies undertaken in highlands of Ethiopia suggest that a presence of significant LULCC were caused by a combination of varying factors depending on each locality condition. Increased deforestation, soil erosion and land degradation in the Ethiopian are common in areas where high population pressure exists whose livelihoods directly depend on the exploitation of natural resources [19,20]. LULC has become the greatest environmental concern for human beings to date [18,21,22]. Many researchers [3,23] pointed out that LULCC at temporal and spatial scales is useful to understand implications of environment and ecosystem.
The main significance of this article is to quantitatively analyze the LULCC in Wondo Genet and its surrounding area from 2000 to 2018 by using multitemporal Landsat imagery. In addition, this article has emphasized that integrated use of Remote Sensing and GIS advances quantification, mapping and improved understanding of the process of LULCC in order to determine the drivers of LULCC and its implication on sustainable environmental management. Even though several studies had been done pertaining towards LULC detection this study made use of LULCC for the implication of sustainable environmental management in the study area. The significance of sustainable environmental management helps land use planning, increase agricultural productivity which in turn improves livelihood of the society. Policy responses are needed to support sustainable environmental management, thus contributing to achieving the UN 2030 SDGs, especially Goal 15 “Life on Land”.
Spatiotemporal changes in LULC have witnessed the mounting pressure on the natural forest land uses [24,25]. However, studies of spatiotemporal LULC dynamics using change detection analysis to explain the net loss and/or gain of each LULC classes over space and time are rare in the study area. This study is, therefore, an important contribution to the literature by providing empirical evidence on the rate and patterns as well as LULC dynamics of the Wondo Genet district of southern Ethiopia. It can also provide insights into the major drivers of land-use transitions and a baseline study for examining their implications on sustainable land management in the area. Therefore, the main objective of this study is to provide empirical evidence on the effects of agricultural land and urban land expansion LULCC dynamics rate on peri-urban forest degradation using GIS and remote sensing approaches and implications on sustainable environment management there by identifying the major derivers of LULCC.

2. Materials and Methods
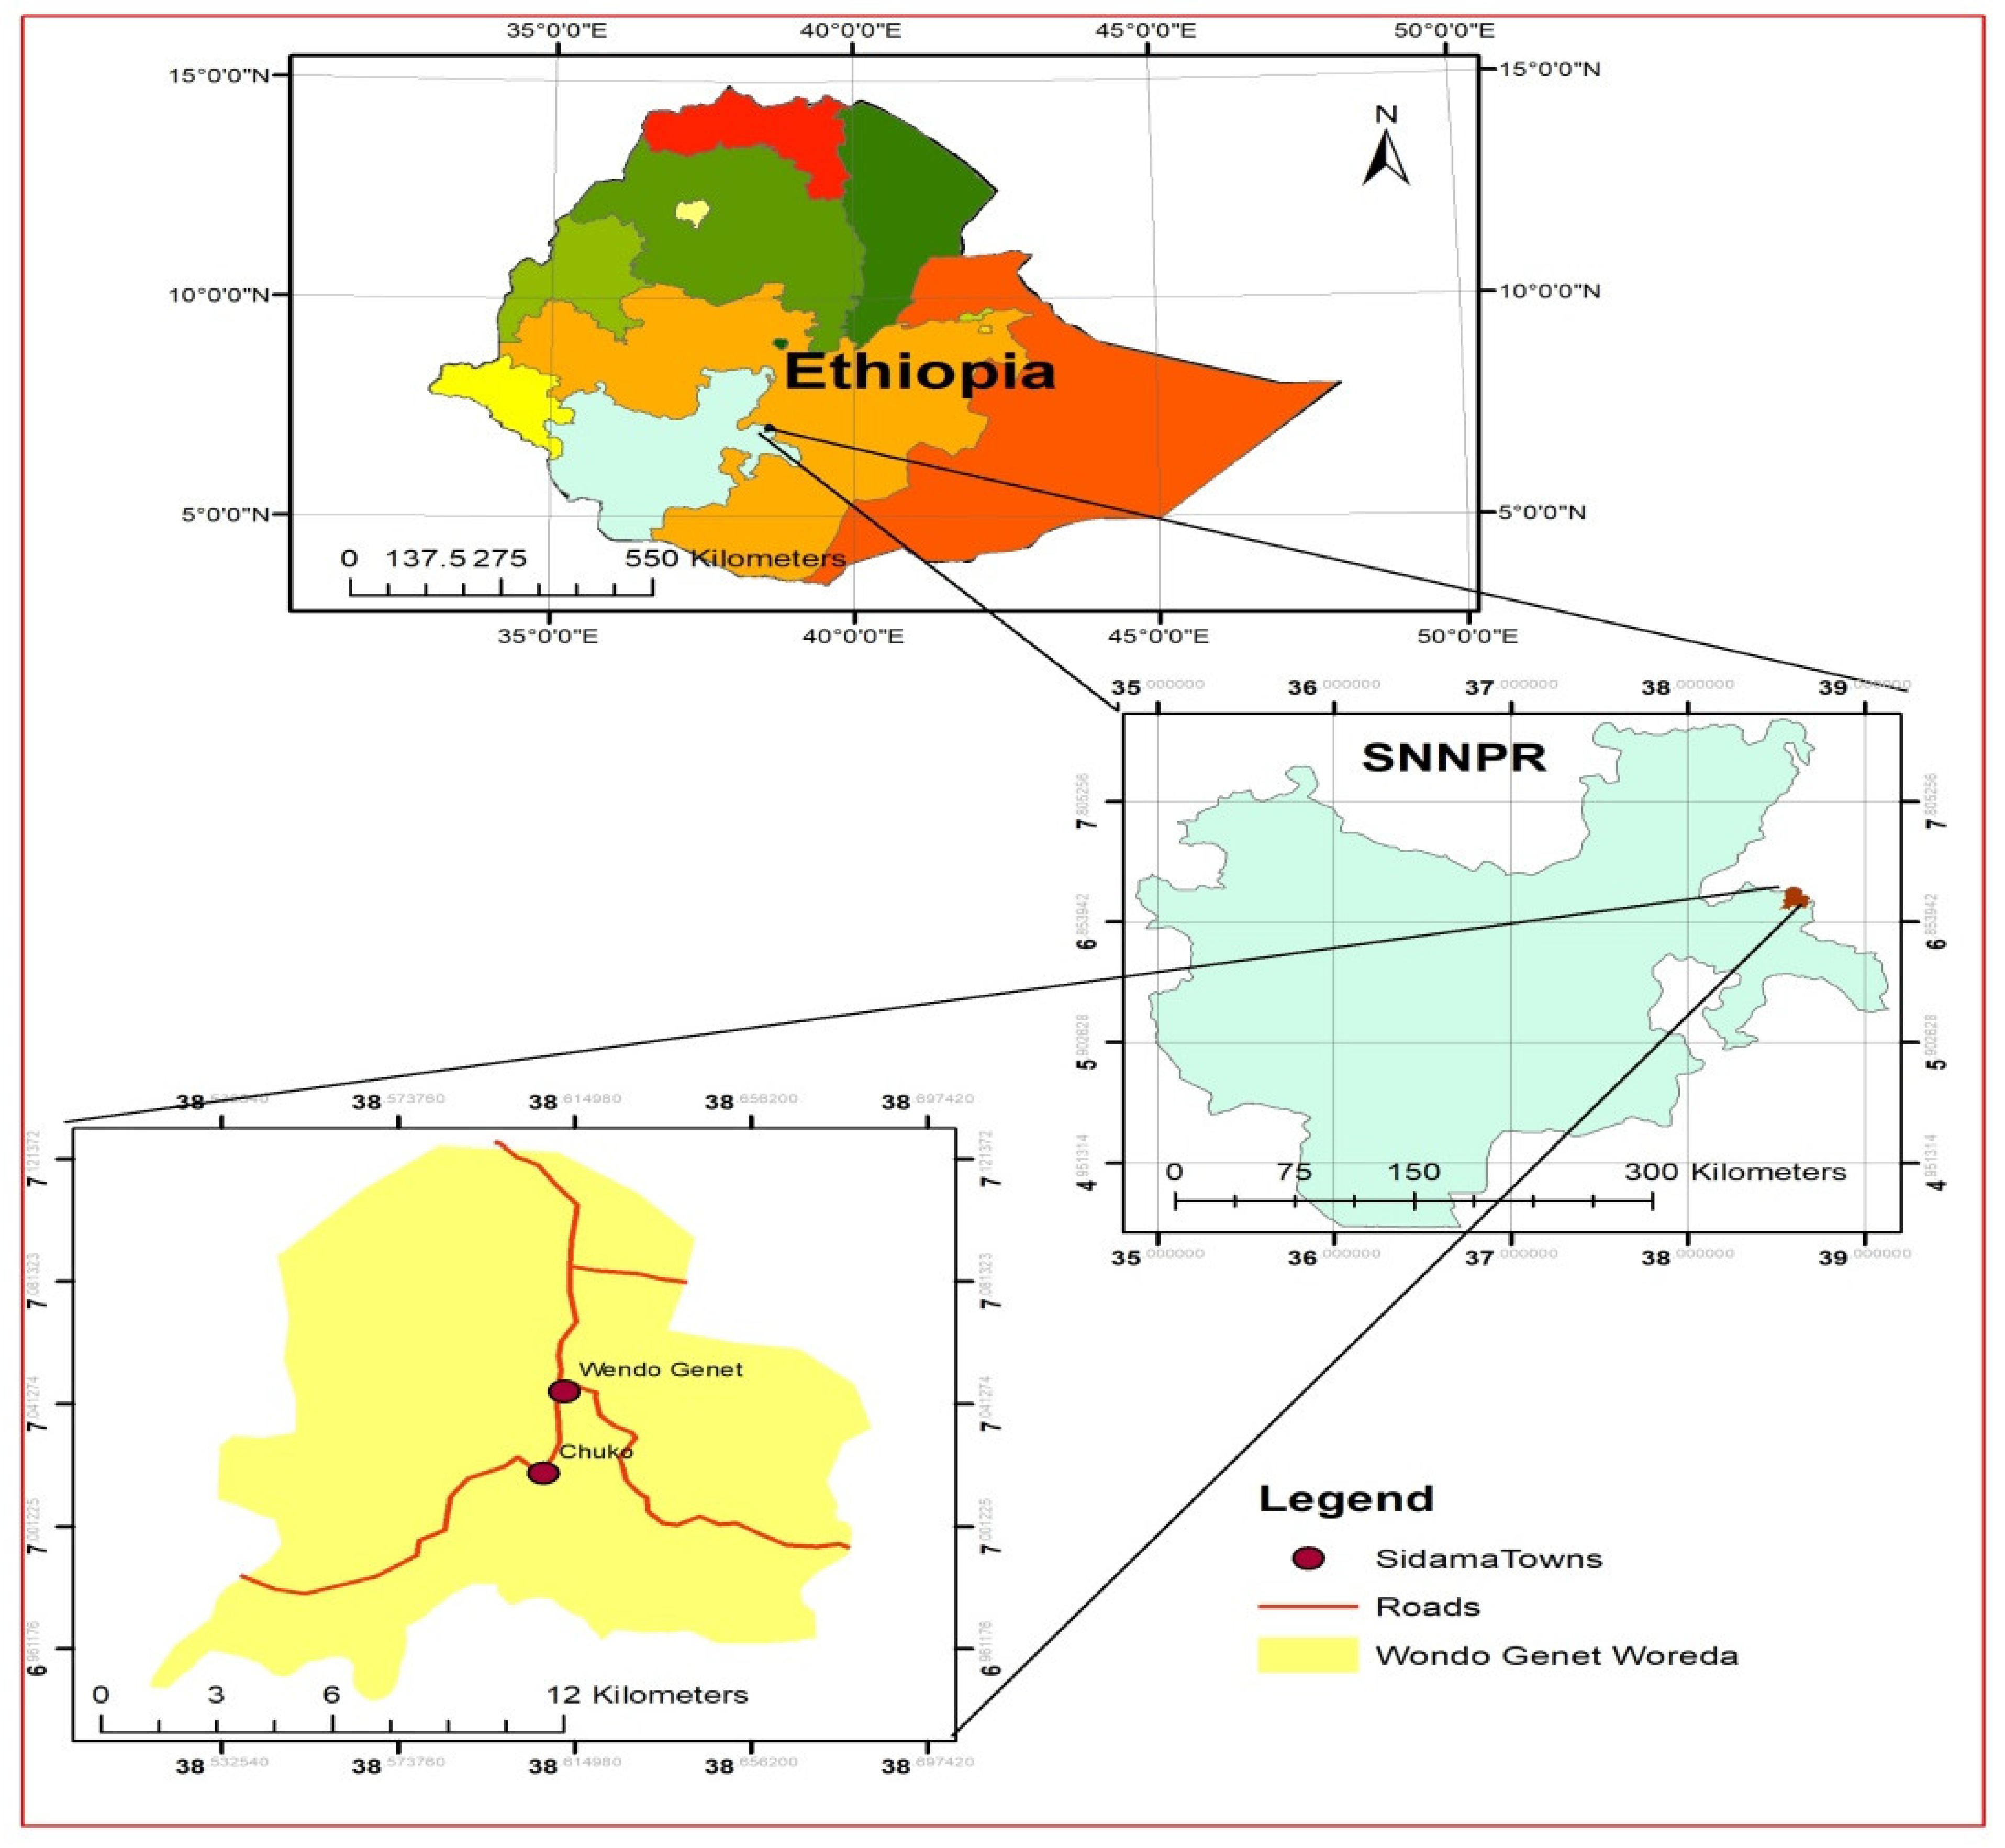
2.1. Study Area

Wondo Genet is one of the districts in Sidama zone of Sothern Nations Nationalities Peoples Region in Ethiopia. Historically its name as Wondo Genet went back to 1964 when the then Emperor Haile silassie who chose the place as his royal family’s place of leisure to mean “Wondo-paradise” [26]. It is located between 6°58′–7°60′ N and 38°32′–38°44′ E (Figure 1) about 270 km south of Addis Ababa, the capital of the country and 27 km from Hawassa, the regional capital. The district is bordered to the Malaga district, Hawassa zuria district and Oromia region on the South, West and North and East, respectively. It has 12 rural administrative units (kebeles) and two urban kebeles. Wondo Genet is one of the most well-known nature-based recreational place in Ethiopia having different natural tourist attractions such as natural hot springs, forest landscape, streams, birds and other wildlife [27]. The natural ecosystem can be described as “wet land” which can be categorized under fresh water or geothermal spring, or streams and creeks category based on classification of wet land types [28].
Wondo Genet is characterized by bi-modal rainfall where short rain falls during spring and the major rain during summer and stays for the first two months of autumn season [29]. The mean annual rainfall is 1400 mm with the main rainy season between July and October and a short rainy season between March and May having annual rainfall of 1248 mm. The mean monthly temperature is 19.5 °C with monthly maximum and minimum of 26 °C and 12.4 °C, respectively. The area is also rich in water resources and has four major streams: Wosha, Worqa, Hallo and Lango and also there are many small springs at the bottom of the hills [29].
Topographically Wondo Genet comprises hills, rugged and depression areas with altitude ranging between 1600 and 2580 a.m.s.l [29]. Wondo Genet also has forest resource, which serves as habitats for many mammals, birds and insects. Based on CSA [30] Wondo Genet district has a total population of 114,519 growing at a rate of 2.9% per annum of whom 58,348 are men and 56,221 are women. Different ethnic groups live in Wondo Genet area, and the major ones are Sidama, Oromo, Walayita, Kambata, Hadiya and Amhara. The major livelihood activities of the people in the area depend on subsistence mixed farming, which includes crop production and livestock husbandry. The study area is known for production of commercial crops such as sugarcane and khat (Catha edulis). Other crops grown in the area with rain fed and small-scale irrigation using water draining from upslope forests include sweet potato, maize, and enset [31].

2.2. Data Source

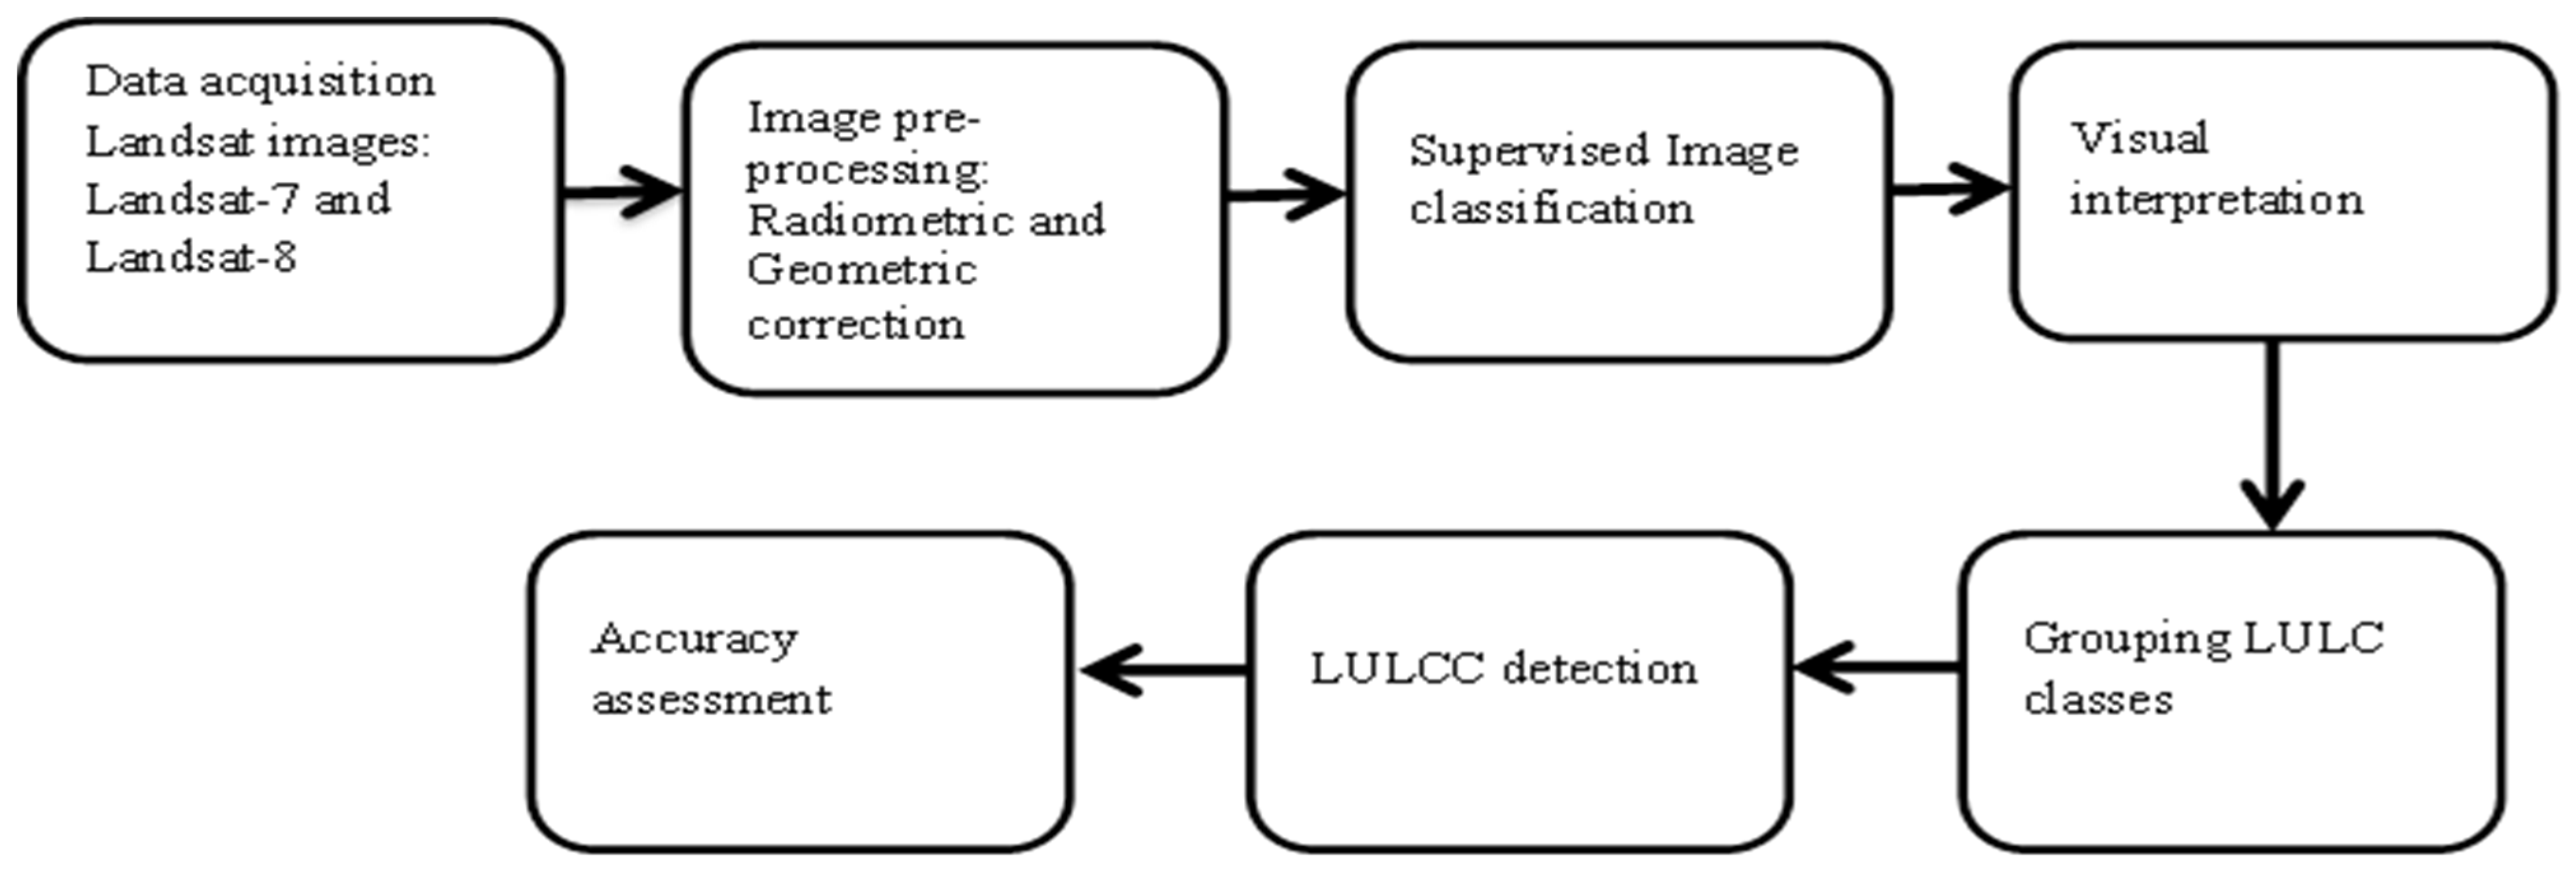
2.2.1. Input Data Acquisition

The land use/land cover of the study area was assessed and mapped using three temporal Landsat Enhanced thematic mapper plus (ETM+) which is Landsat-7 and OLI satellite images. The Landsat-7 satellite images were used to map the LULC in 2002 and 2010 of the study area, whereas OLI was used to map LULC in 2018. These satellite images (Landsat-7 and OLI) of the respective paths and rows have been downloaded from Google Earth explorer. In this study, five LULC classes for 2002 and 2010 and 2018, respectively were presented in this area: forest, shrub land, cultivated land, built-up and grass land. These LULC classifications for the years 2002, 2010 and 2018 are shown in Table 1 below.

2.2.2. Image Pre-Processing and Classification

Remote sensing and GIS tools are the most common methods for quantitative analysis of LULCC. The most broadly engaged method for LULCC using remote sensing method is change detection. The change detection method ability is analysis of land cover features spatially and temporally using remotely sensed imagery. LULCC were executed by using remote sensing images to verify the ground truth and for monitoring environmental resources. Remote sensing images were employed to map LULCC in any selected study area. Remote sensing images were used to evaluate LULCC and supplemented with qualitative approaches to verify implications of LULCC [32].
Landsat images, with 30 m resolution and Google Earth were utilized in this study. Ground control points were gathered during direct field observations with Global Positioning System. Temporal Landsat Enhanced thematic mapper plus (ETM+) which is Landsat-7 and OLI satellite images were used for 2002, 2010 and 2018, respectively. Landsat images were downloaded from Google Earth and used for the evaluation of LULC types (Table 1). Prior to image classification, detailed image pre-processing including radiometric and geometric correction) were performed to correct the surface feature reflectance characteristics.
The remote sensing images of 2002, 2010, and 2018 were passed over radiometric and geometric corrections [32]. Supervised image classification through the maximum likelihood algorism was performed. In maximum likelihood, it selects the set of values of the model parameters that maximize the likelihood functions [33]. Image classification was carried out based on multispectral data, spectral patterns together with cluster segmentation of the sensor images. After the image classification, thematic maps for 2002, 2010 and 2018 were developed.
Image classification was processed using supervised image classification technique according to the desired decision rule of maximum likelihood algorithm for the respective years (2002, 2010 and 2018) by using ERDAS IMAGINE v. 9.3. Visual interpretation of satellite images was made by using ERDAS IMAGINE v.9.3 and ArcGIS v.10.3 software package for satellite image processing and LULCC analysis (Figure 2). LULC types were identified from Landsat images and grouped and named as in Table 1 above.

2.2.3. Data Analysis

In order to compute the change detection of remotely sensed images, some researchers [34,35] pointed out there could be different methods. Among these, many researchers [34] stated the post-classification comparison method is particularly attractive due to its nature of clearly identified change. Hence, this study employs the post-classification method to detect changes. Hence, in this research we used the most obvious method of change detection which is used by many researchers [36] that involves a comparative analysis of spectral classifications for times t1 and t2 produced independently [37]. The percentages of change detection of LULCC were calculated using the following Equation (1):
%   of change   detection = Final   year   Area   Base   year   Area Base   Year   area * 100
In this equation, a gain is depicted by positive signs, whereas values a loss is shown by negative signs. Puyravaud [38] also suggested the LULCC rate was also computed using the following Formula (2):
r   =   1 Δ t   ln ( Final   year   area Baseyear   area ) * 100
where r is the annual rate of change in %, Δt is the time interval in years during the LULCC being assessed, ln is the base of the natural logarithm function.
The annual rates of urban area expansion (UAE) for the periods: 2002–2010, 2002–2018, and 2002–2018 are calculated for Wondo Genet using the following relationship [39] in a modified form in Formula (3):
UAE   = Ui + n Ui n   +   n × + n
where UAE is Urban Area Expansion, Ui+n and Ui are the urban area in Ha at time i + n and i, respectively, and n is the interval of the calculating period (in years).
The assessment of accuracy was performed using ground truth and visual interpretation based on 300 points. Based on the formula given by Congalton and Green [40], the accuracy assessment of producer’s, user’s, overall, and Kappa coefficient were calculated for the classified maps of 2002, 2010 and 2018. The formula for computing producer accuracy, user accuracy, overall accuracy, and Kappa index coefficient is given as follows:
produce s   accuracy   i = nii Gii
User s   accuracy   i = nii Cii
Over   all   accuracy = i = 1 k nii n
k   = i = 1 k nii   i = 1 k GiCi n 2 i = 1 k GiCi
where i is the class number, n is the total number of classified pixels that are being compared to ground truth, nii is the number of pixels belonging to the ground truth class i, that have also been classified with a class i, Ci is the total number of classified pixels belonging to class i and Gi is the total number of ground truth pixels belonging to class i.
Using formulas, 4, 5, 6 and 7, the kappa index results indicated that all of the images met the minimum of 85% accuracy in LULCC analysis to each classified object that matches (intersects) a given reference object (Table 2).

3. Results

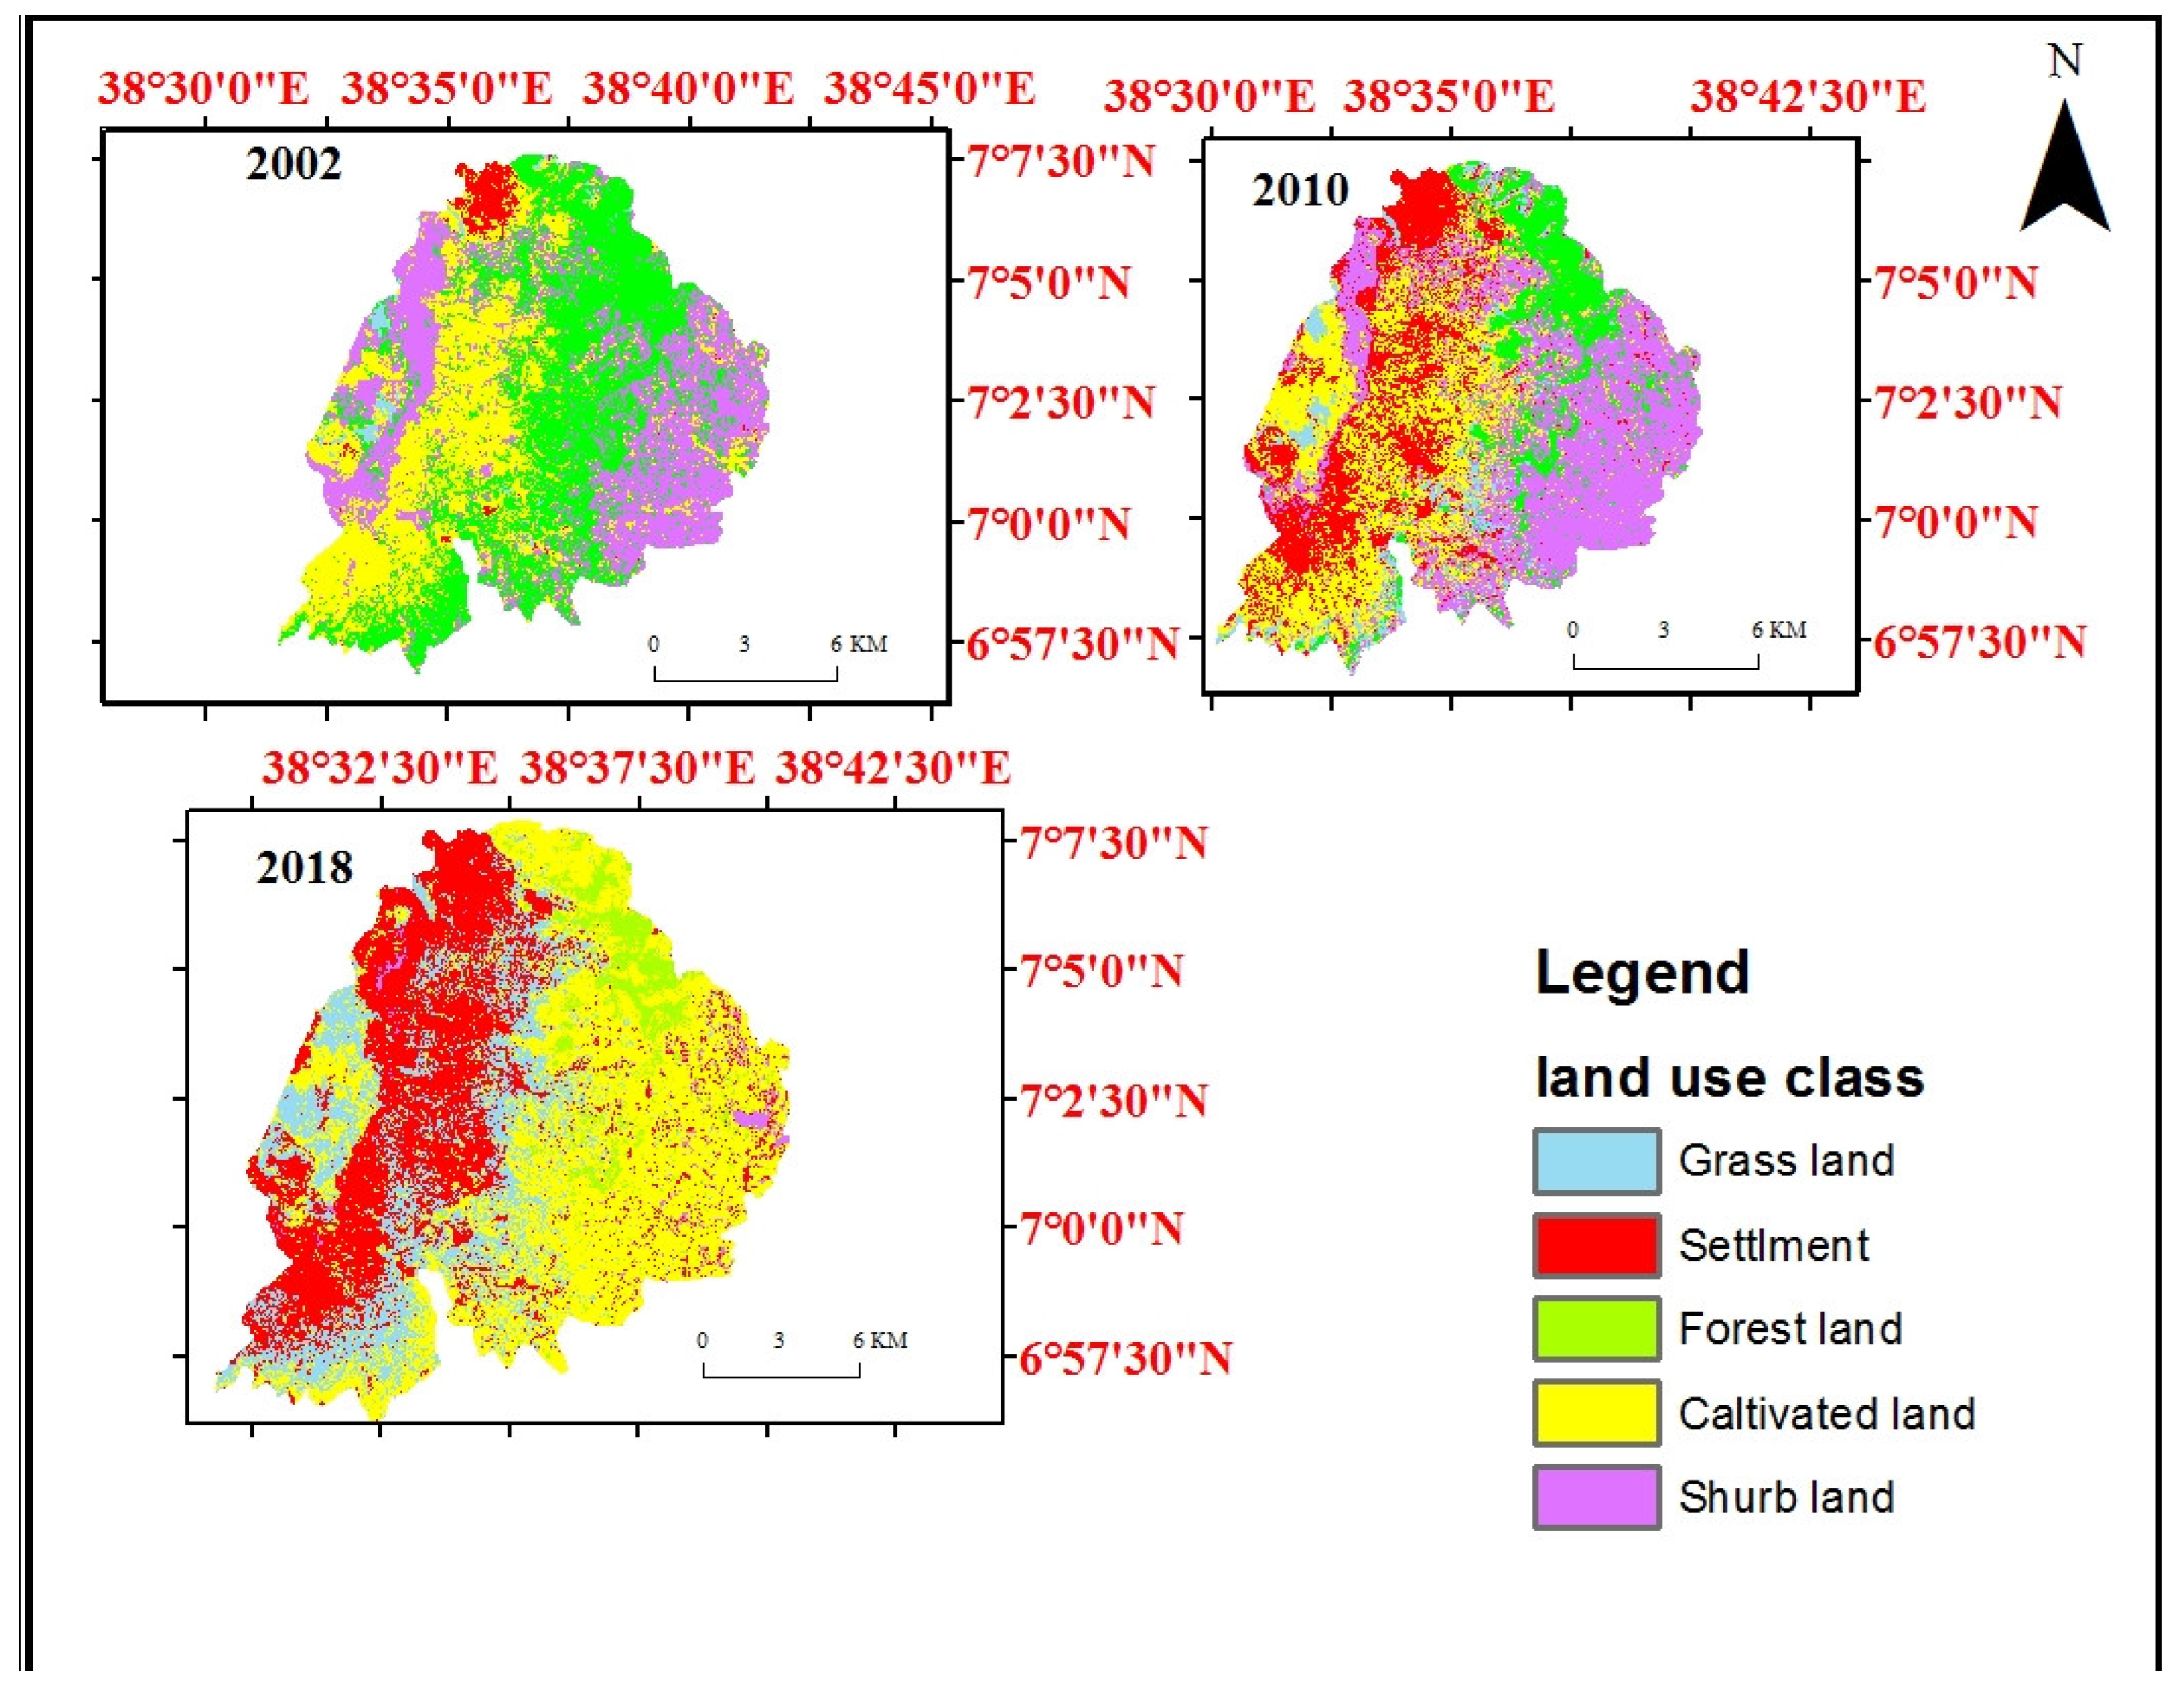
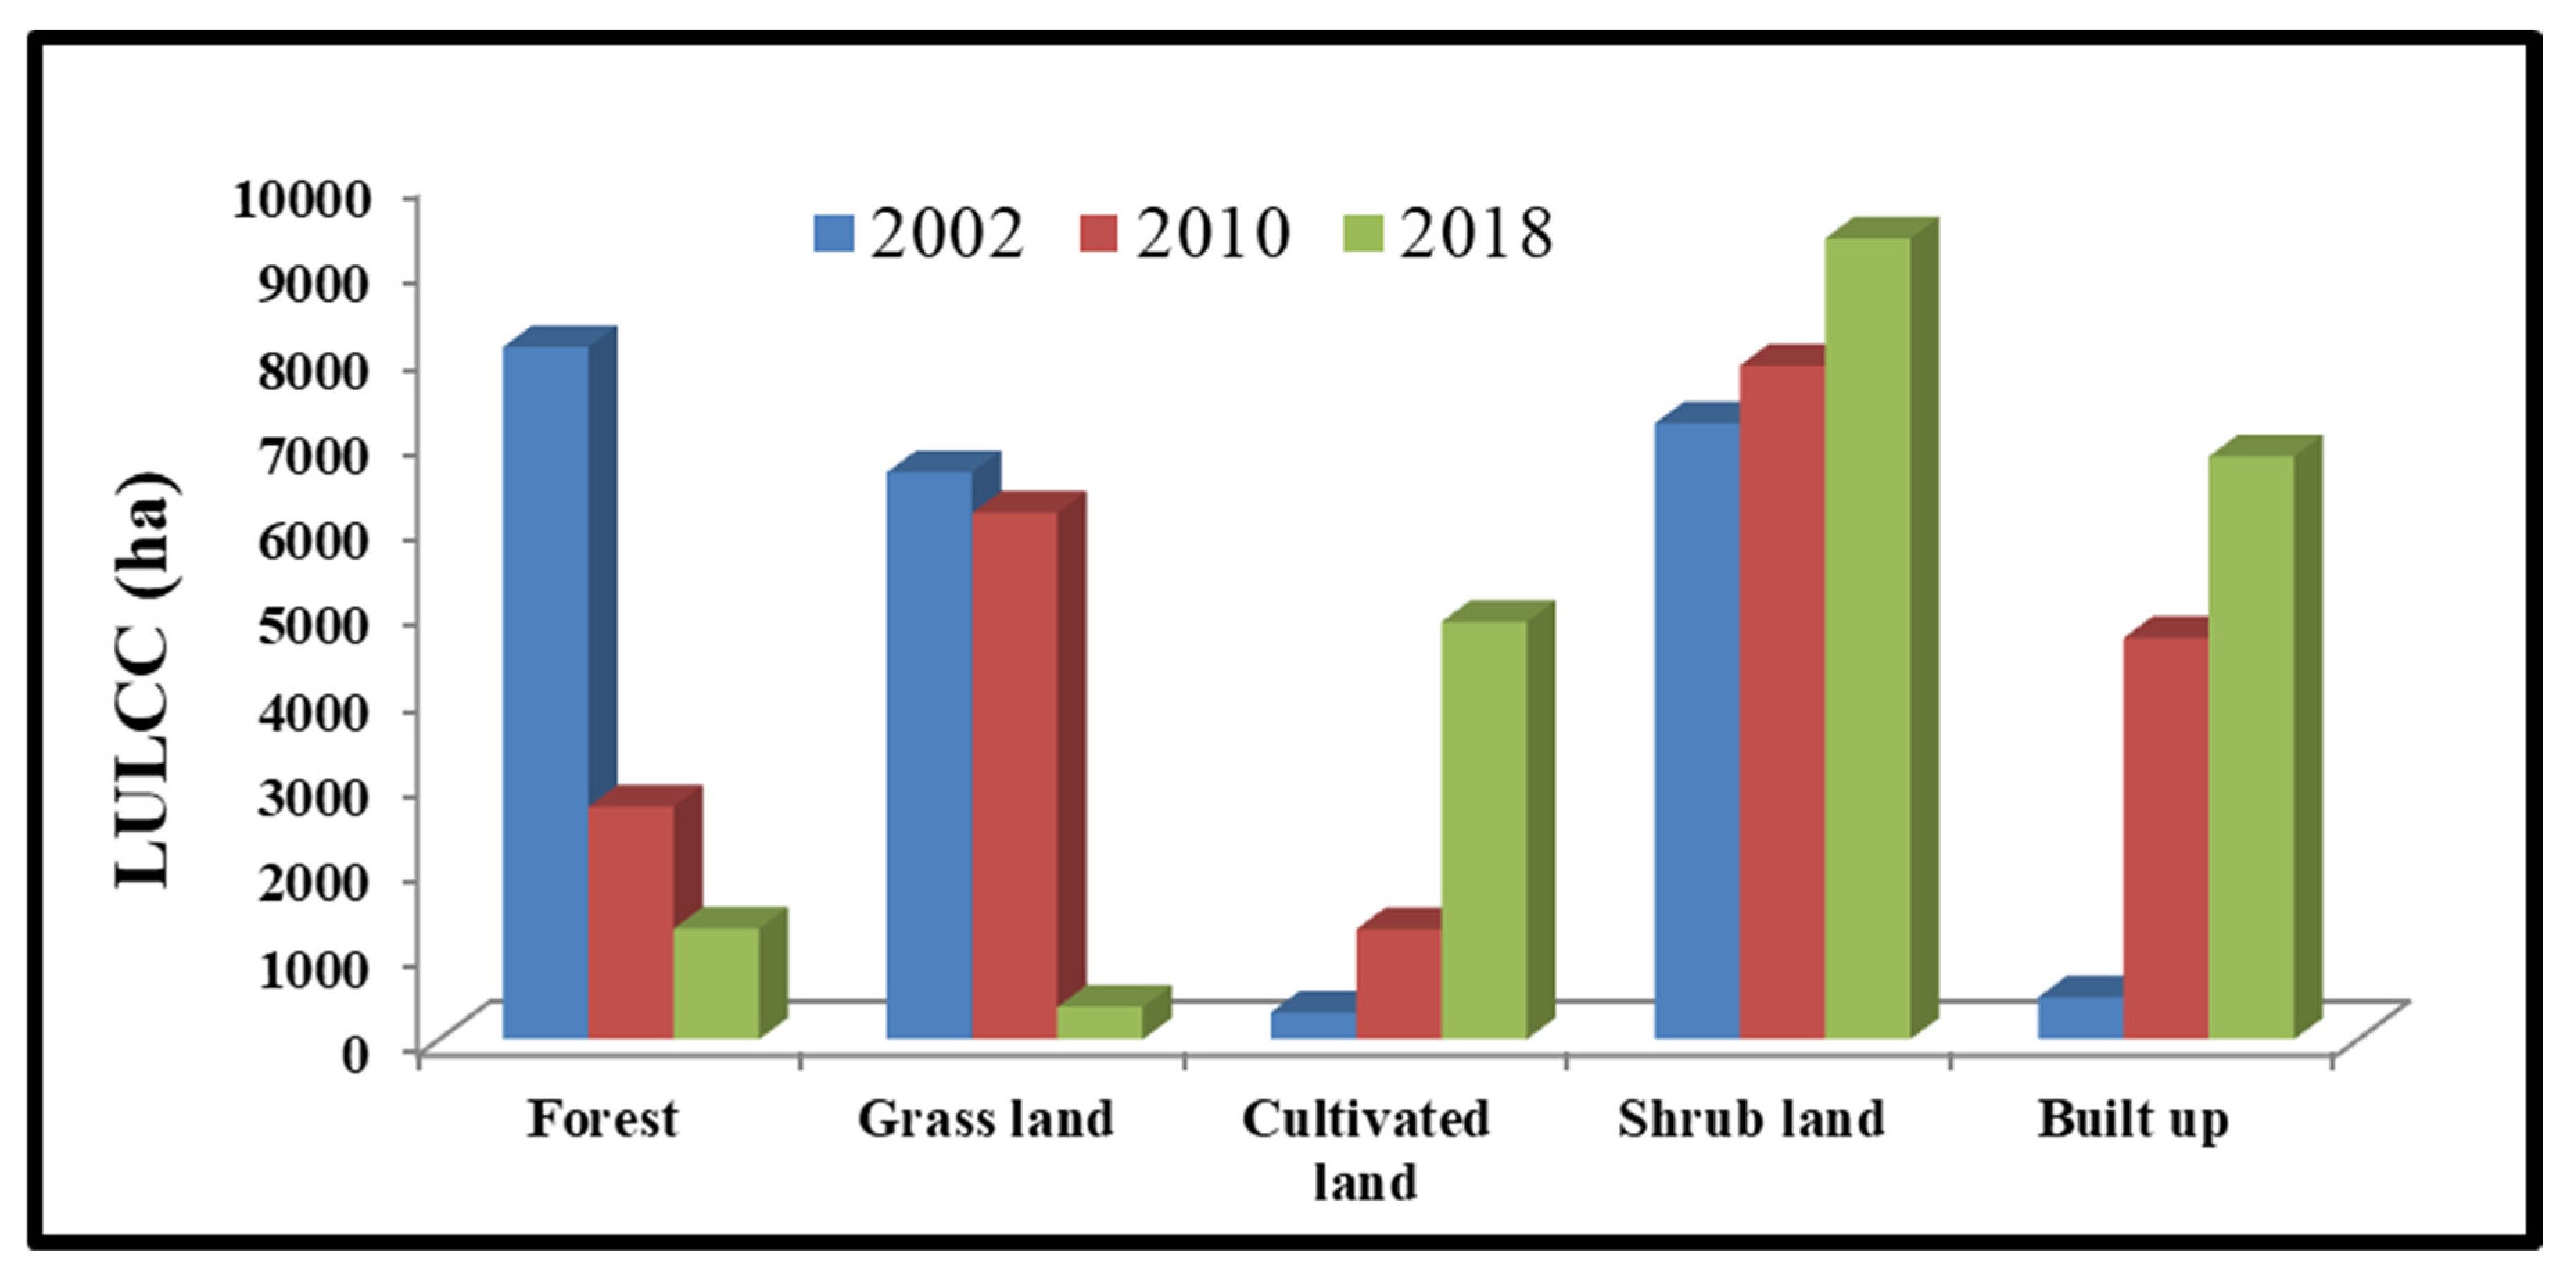
3.1. Land Use/land Cover Changes

The LULCC maps of the study area for the years 2002, 2010 and 2018 are presented in Figure 3, Table 3 and Table 4 that show the area coverage, trend of land-use and land cover types identified in wondo Genet area.
LULCC modifications are driven by space and time interactions between biophysical and human dimensions [41,42]. Such type of studies on LULCC gives important information for a variety of impacts such as climate change on human activities [20].

3.1.1. Forest Cover

The forest cover of the study area has shown a gradual decline during the study periods (2002–2018). In 2002, forest cover was 8063 ha (36%) of the study area and decreased to 2710.06 ha (10 %) in 2010 and further declined to 1289.3 ha (6%) in the year 2018 (Table 3). The annual rate of forest destruction was 7.4 ha year−1 in the first period (2002–2010), but the rate of forest destruction was about 5.8 ha year−1 in the second period (2010–2018) and 5 ha year−1 between the study periods (2002–2018). For the whole study period (2002–2018), the forest cover declined by 30% of the total area as compared to the total forest coverage of the year (2002) (Figure 3 and Table 4). In line with this, many researchers [26,32,43] pointed out that this destruction of forest is attributed to the rapid population growth and increasing demand of cultivable and grazing land as well as demand for construction and ever-increasing demand fuel wood in the study area. The impact of fuel energy in the form of fuel wood and charcoal takes the major share for this pronounced forest cover change [44]. In this study, LULCC magnitude, percentage change and annual rate of change in general are indicated below in the following Figure 4 and Table 4. There is a relatively high rate of deforestation in Africa compared to other continents. Even at regional level, previous assessments demonstrate the highest rate of deforestation is in Western and Eastern Africa [45]. Agricultural expansion leads to forest cover degradation and forest degradation leads to loss of biodiversity and ecosystem services.

3.1.2. Shrub Land

Shrub land occupied 7171 ha (32%), 7847.15 (35 %) and 9326 (41%) of the study area in 2002, 2010, and 2018, respectively. During the first period (2002–2010), shrub land increased by 3%, whereas in the second period (2010–2018), it increases by 7 % and 10% in the entire study period (2002–2018) (Table 3). The annual rate of shrub land was 1 ha year−1 in the first period (2002–2010), but the rate of shrub land increment was about 2 ha year−1 in the second period (2010–2018) and 2 ha year−1 between the whole study periods (2002–2018). For the whole study period (2002–2018), the shrub land was increased by 9% of the total area as compared to the total shrub land coverage of the year (2002) (Figure 3 and Table 4). The results clearly revealed the occurrence of significant LULCC from one land use class to another. Various previously conducted research in different parts of the country also reported the conversion of one land use class to others. This is evidenced in a study by Tsegaye et al. [23] in northern Afar rangelands that reported the conversions of scrubland, bushy grassland, and grassland to cultivated land between 1972 and 2007 periods. Woodlands were converted to bush land, scrubland and bushy grassland. Similarly, a study by Rientjes et al. [46] during 1973 to 1986 and 1986 to 2001 periods, also reported the conversions of one land category to the other in the form of either between or each category. In their study, the greatest conversions taken place were the conversions of shrub land, forest and grassland into cultivated lands. In addition, in recent times, a study by Gashaw et al. [47] also during 1985 to 2000 and 2000 to 2015 in Andassa watershed of Blue Nile basin pointed out the trend of increasing in cultivated land and built-up area and decreasing in forest, shrub land and grassland.

3.1.3. Cultivated Land/Agricultural Land

Agricultural expansion, often facilitated by urban expansion, emerges as the number one cause of deforestation on the planet. Cultivated land/agricultural land has dominated land use, occupying about 314.4 ha (1.4%) of the study area in 2002, 1283 ha (6%) in 2010 and 4862.3 ha (21.5%) in 2018 (Table 3). Cultivated land increased by 4.3% at a rate of 34 ha year−1 between 2002 and 2010 and 16% at a rate of 31 ha year−1 between 2010 and 2018 and 20% at a rate of 85 ha year−1 for the entire study period (2002–2018) (Table 4 and Figure 3). The analysis also revealed that there was considerable amount expansion of cultivated land in the study area. This expansion of cultivated/agricultural land is due to increasing population pressure. As the growth of population increased, the demand for agricultural products in general increased and also increased the demand for rural and urban settlement land, which resulted in the continuous expansion of cultivated land (Figure 3). In this regard, in their study, Shiferaw and Singh [48] in Borena Woreda, South Wollo highlands of Ethiopia between 1972 to 2003, there was a dramatic expansion of cultivated land followed by bare land with a reduction in coverage of shrub land, forest land and grass land. This has a severe impact on sustainable environmental management.

3.1.4. Grass Land

The study area under grass land cover decreased from 29% (6604 ha) in 2002 to 27 % (6131 ha) in 2010 and to 2% (378.7 ha) in 2018 (Table 3). The annual rate of decrease in grass land was 1 ha year−1 in the first period (2002–2010), but the rate of grass land decrease was about 10 ha year−1 in the second period (2010–2018) and 6 ha year−1 between the whole study periods (2002–2018). For the whole study period (2002–2018), the grass land was decreased by an average of 5.7% of the total study area (Figure 3 and Table 4). The observed decrease was due to the conversion grassland into other land uses; hence, this conversion might be attributable to the rapid population growth.
The finding of this research is in line with many other previously conducted studies such as Dessie and Kleman [49] in South Central Rift Valley Region of Ethiopia; Kindu et al. [50] in Munessa-Shashemene land scape of Ethiopia; Gebremicael [51] in Blue Nile basin; Gashaw et al. [47] in Dera District of northwestern Ethiopia; Gebrehiwot et al. [52] in Birr and Upper-Didesa watersheds of Blue Nile basin; Kibret et al. [53] in in south central Ethiopia. Moreover, other studies (Hassen and Assen, [54] in Gelda catchment and Tolessa et al. [55] in Central highlands of Ethiopia) reported the increment of cultivated lands at the reduction of forest cover in the study period of 1957–2014 and 1973–2015, respectively.

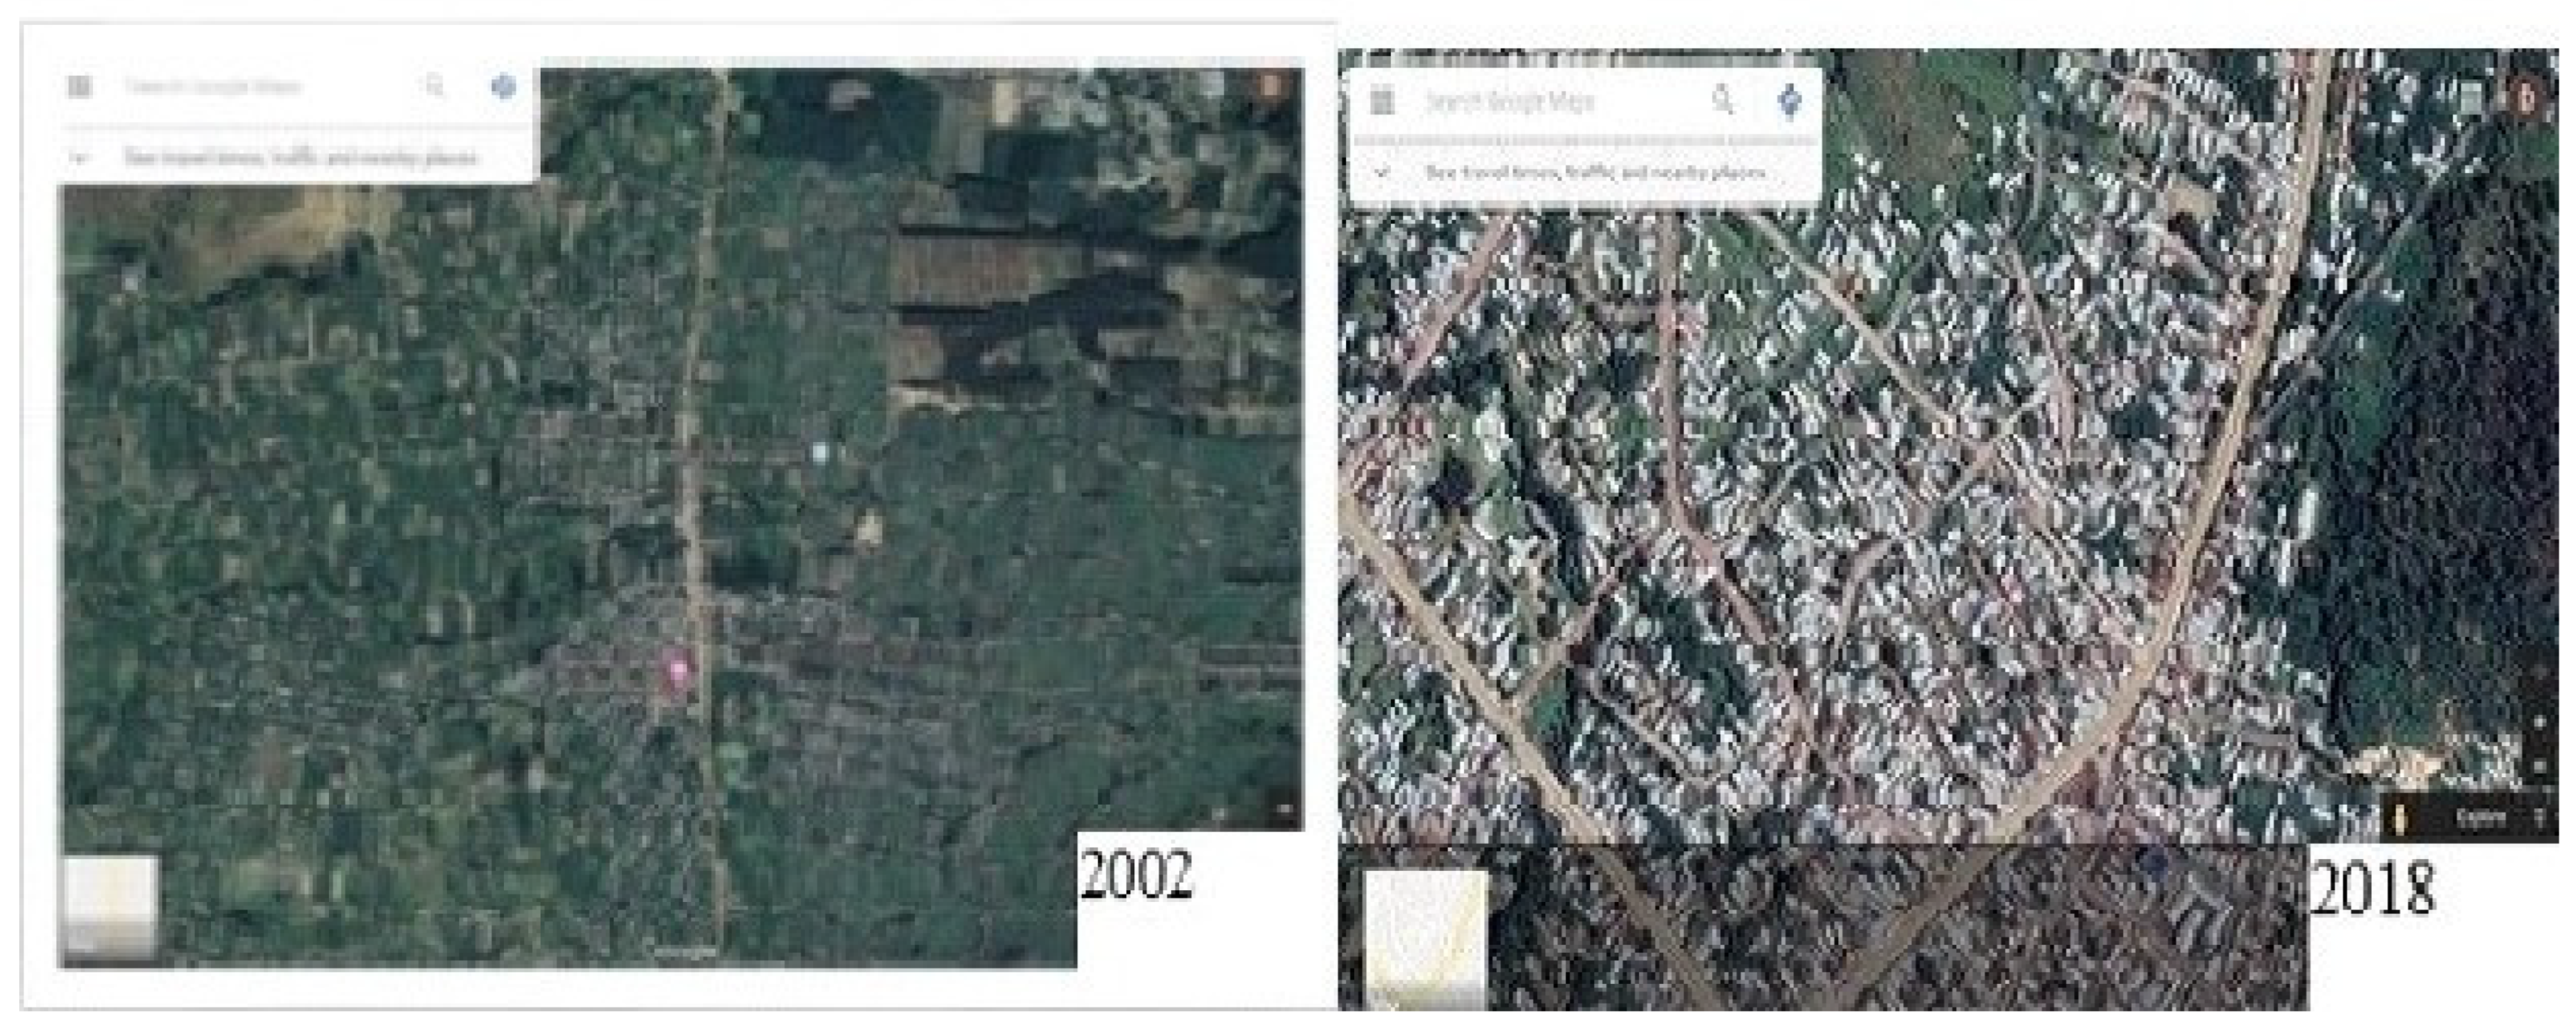
3.1.5. Built Up Area/Urban Expansion

Urban land covers a relatively small proportion of the global terrestrial land, but over half of the global population inhabits it. It is evident that despite its relatively small coverage, its expansion in the past decades has caused significant alteration to the environments globally [56]. Built up area/urban expansion increased from where it was 493.1 ha (2.2%) in 2002 to 4674.3 ha (21%) and 6788.9 ha (30%) in 2010 and 2018, respectively (Table 3). The data presented in Table 5 show that the annual rates of built-up area in the period 2002–2010, 2010–2018, and 2002–2018 were 94, 5, and 75% per year per hectares, respectively. It is thus clear that built up expansion was much higher during the period 2002–2010 than 2010–2018 and 2002–2018. The major reason for the expansion of urban built-up area was natural population increase and rural–urban migration. Increased in migration from the rural areas in order to get more employment opportunity in Wondo Genet town, gave rise to more residential area to be built on the periphery of the town (Figure 5).
It is evident that there is a clear impact of urbanization on LULCC through expansion of towns and cities on surrounding cultivated land. A study by Dewanand Yamaguchi [57] about the analysis of the LULCC in Dhaka over time revealed a considerable increase in the built-up areas by 6132 ha over the study period between 1975 and 1992, with an average of more than 360 ha yr−1. Similarly, there was an increment of 4422 ha in Dhaka from 1992 to 2003 of built-up area with an average of more than 400 ha yr−1. Arowolo and Deng [58] indicated that there is negative relationship between cultivated land expansion and distance to roads demonstrated the importance of road infrastructure on agricultural development.
Urbanization is an ongoing process. The lands converted to urban are mainly distributed on the outskirts of the cultivated land. This has been caused by the urban expansion and concentration of housing as the population also increased significantly during 1987 to 2001 in Shanghai metropolitan area of China [59]. On the other hand, the new increased residential land is mainly as a result of population growth in suburban region [60]. In their study, Fenta et al. [61] in Mekele city within the periods 1984–1994, 1994–2004, and 2004–2014, built-up area increased by 99%, 87%, and 79%, respectively, whereas agricultural land decreased by about 7%, 13%, and 24%, respectively, in the same periods. The annual rate of change for the built-up area increased with an average annual increment of 19% (100 ha year−1) for the whole study period (1984–2014). Among the numerous causes in LULCC, urbanization presents a lasting and irreversible impact on the environment.

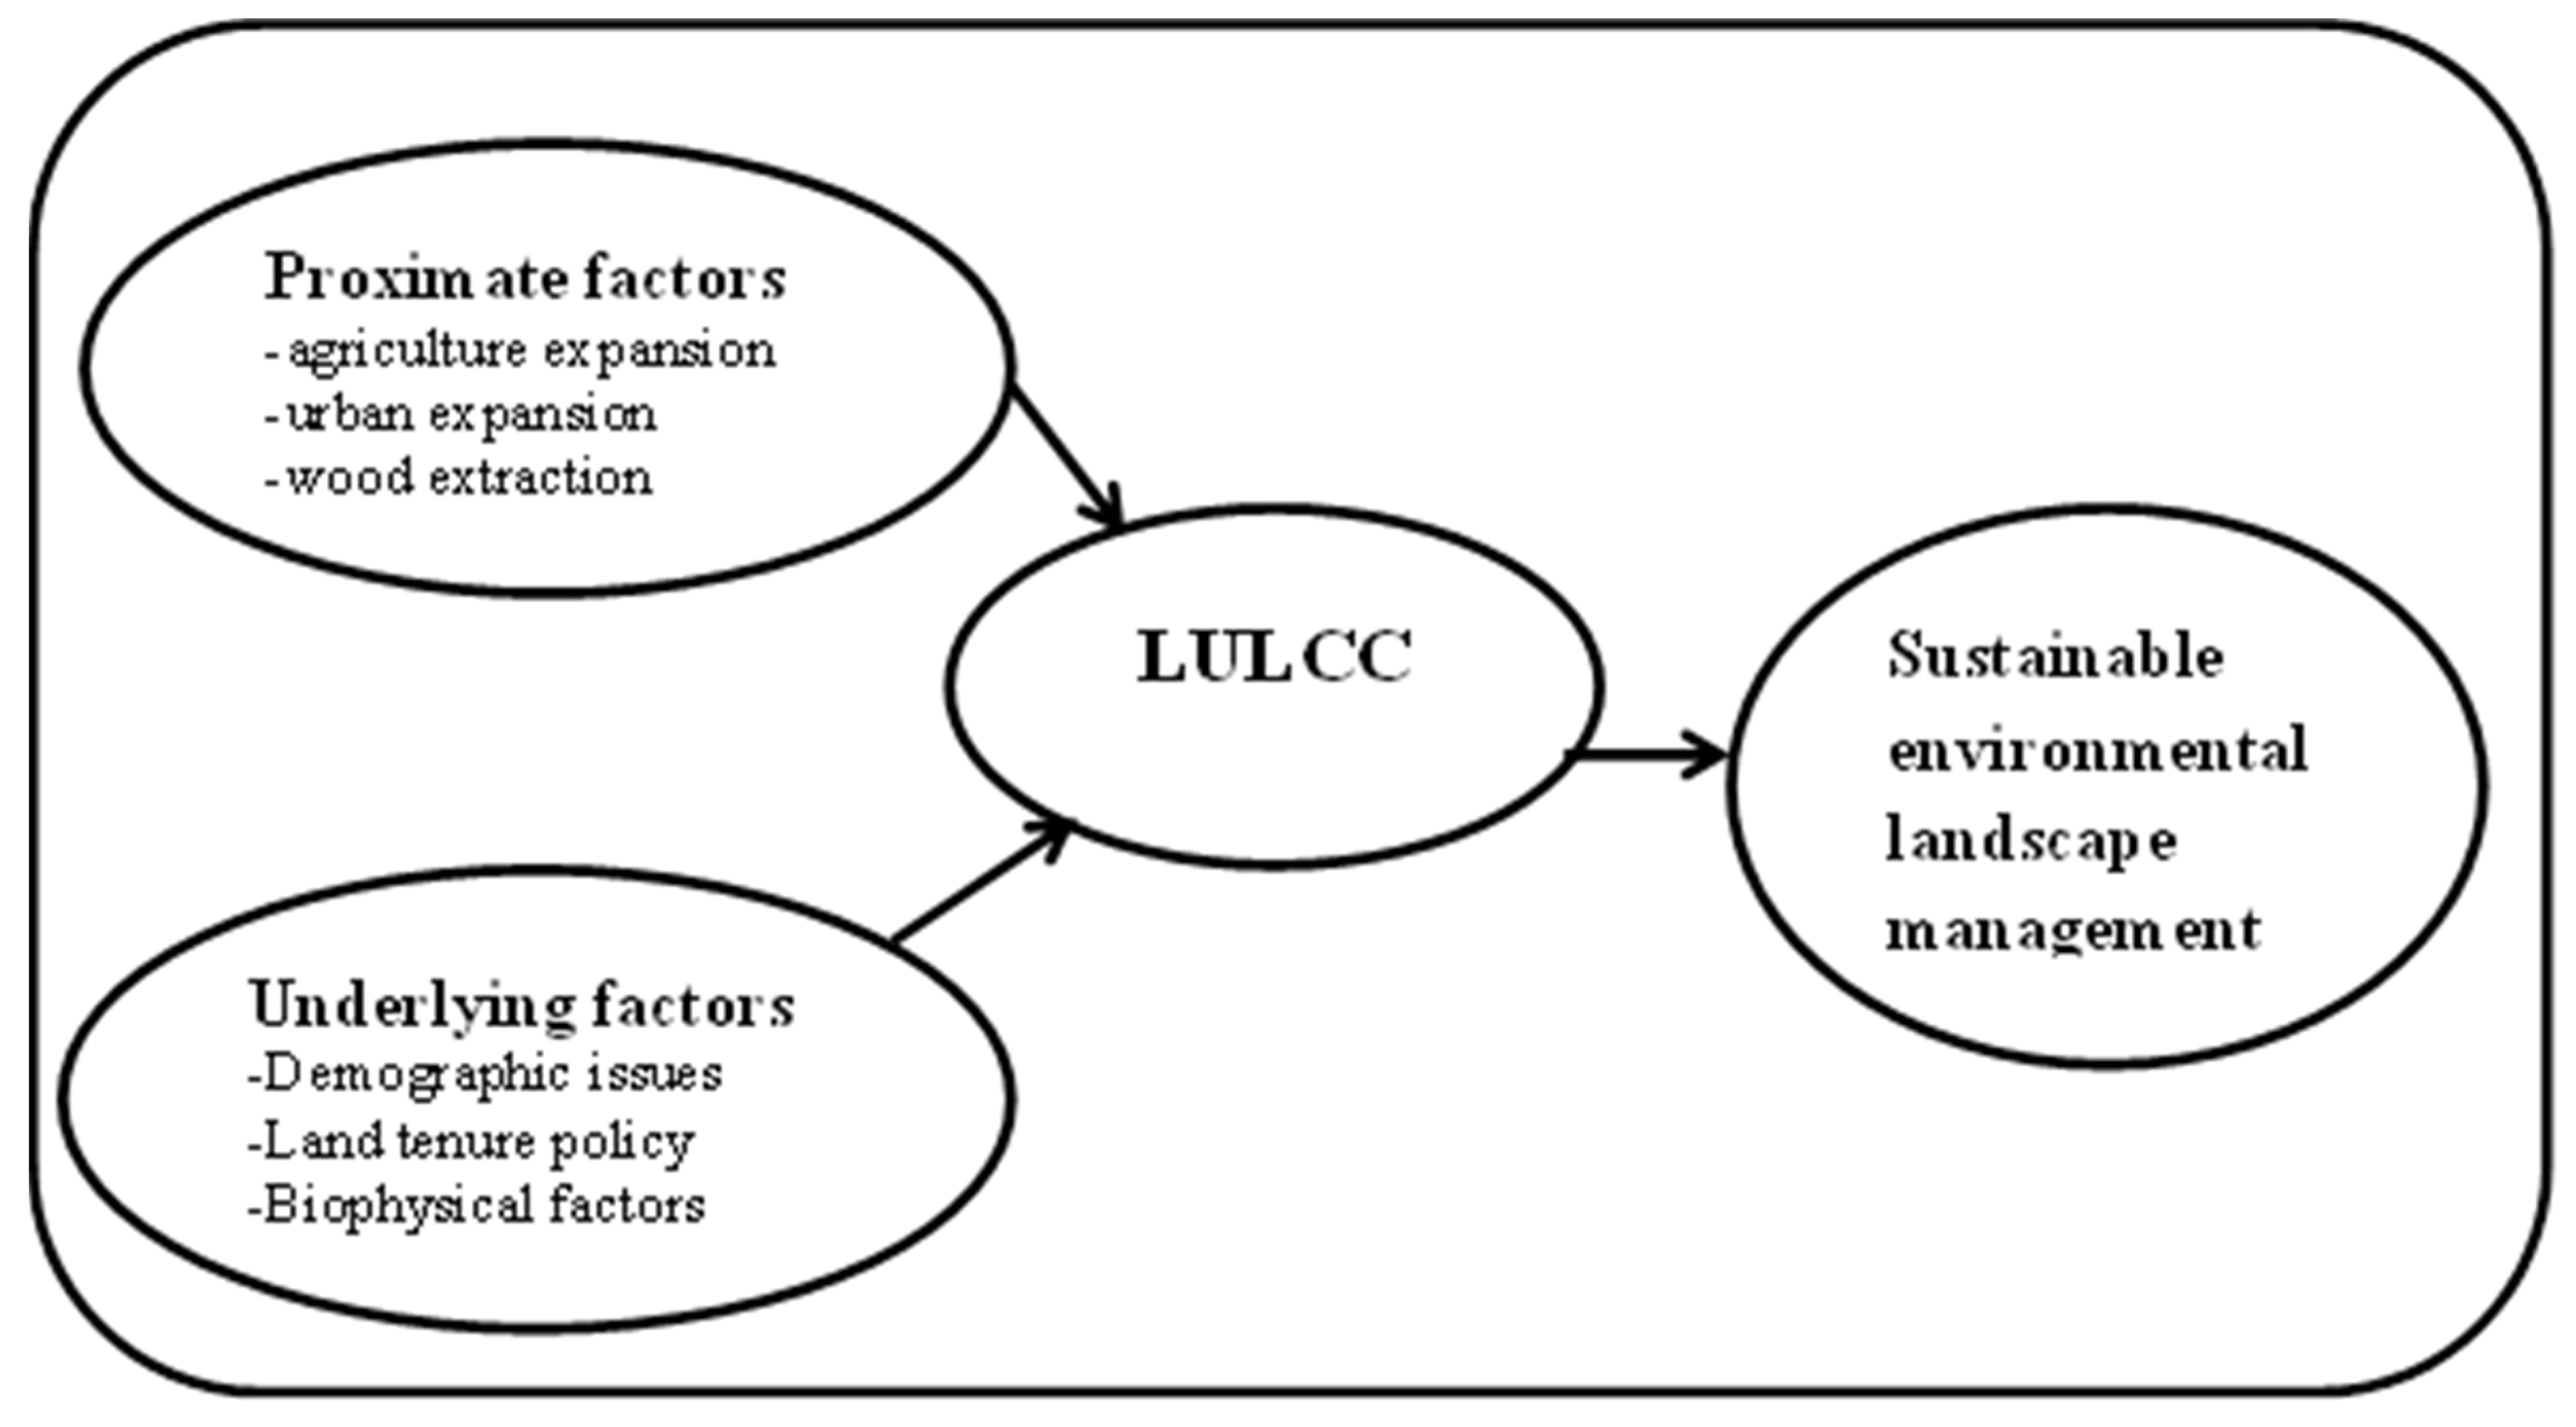
4. Drivers of Land Use Land Cover Change

There are possible drivers of LULCC. The classification of these drivers could be seen in different ways. LULCC is triggered by the interaction of complex driving factors including a set of political, social, economic and biophysical factors [62,63]. Different researchers such as Degife et al. [64] have put the reasons for LULCC in different broad categories as proximate (direct) or underlying (indirect/root causes). Agricultural activities, wood extraction and infrastructure extension are of proximate drivers of LULCC while sets of technological, economic, demographic, political, institutional and socio-cultural factors are few of them among underlying drivers of LULCC [57,65,66].
In this study, the major driving factors were proximate and underlying factors. The important proximate factors include expansion of agricultural practices (Figure 6), urban expansion and wood extraction while the underlying factors are demographic factors, land tenure policy and biophysical factors. The details are presented below.

4.1. Proximate Drivers

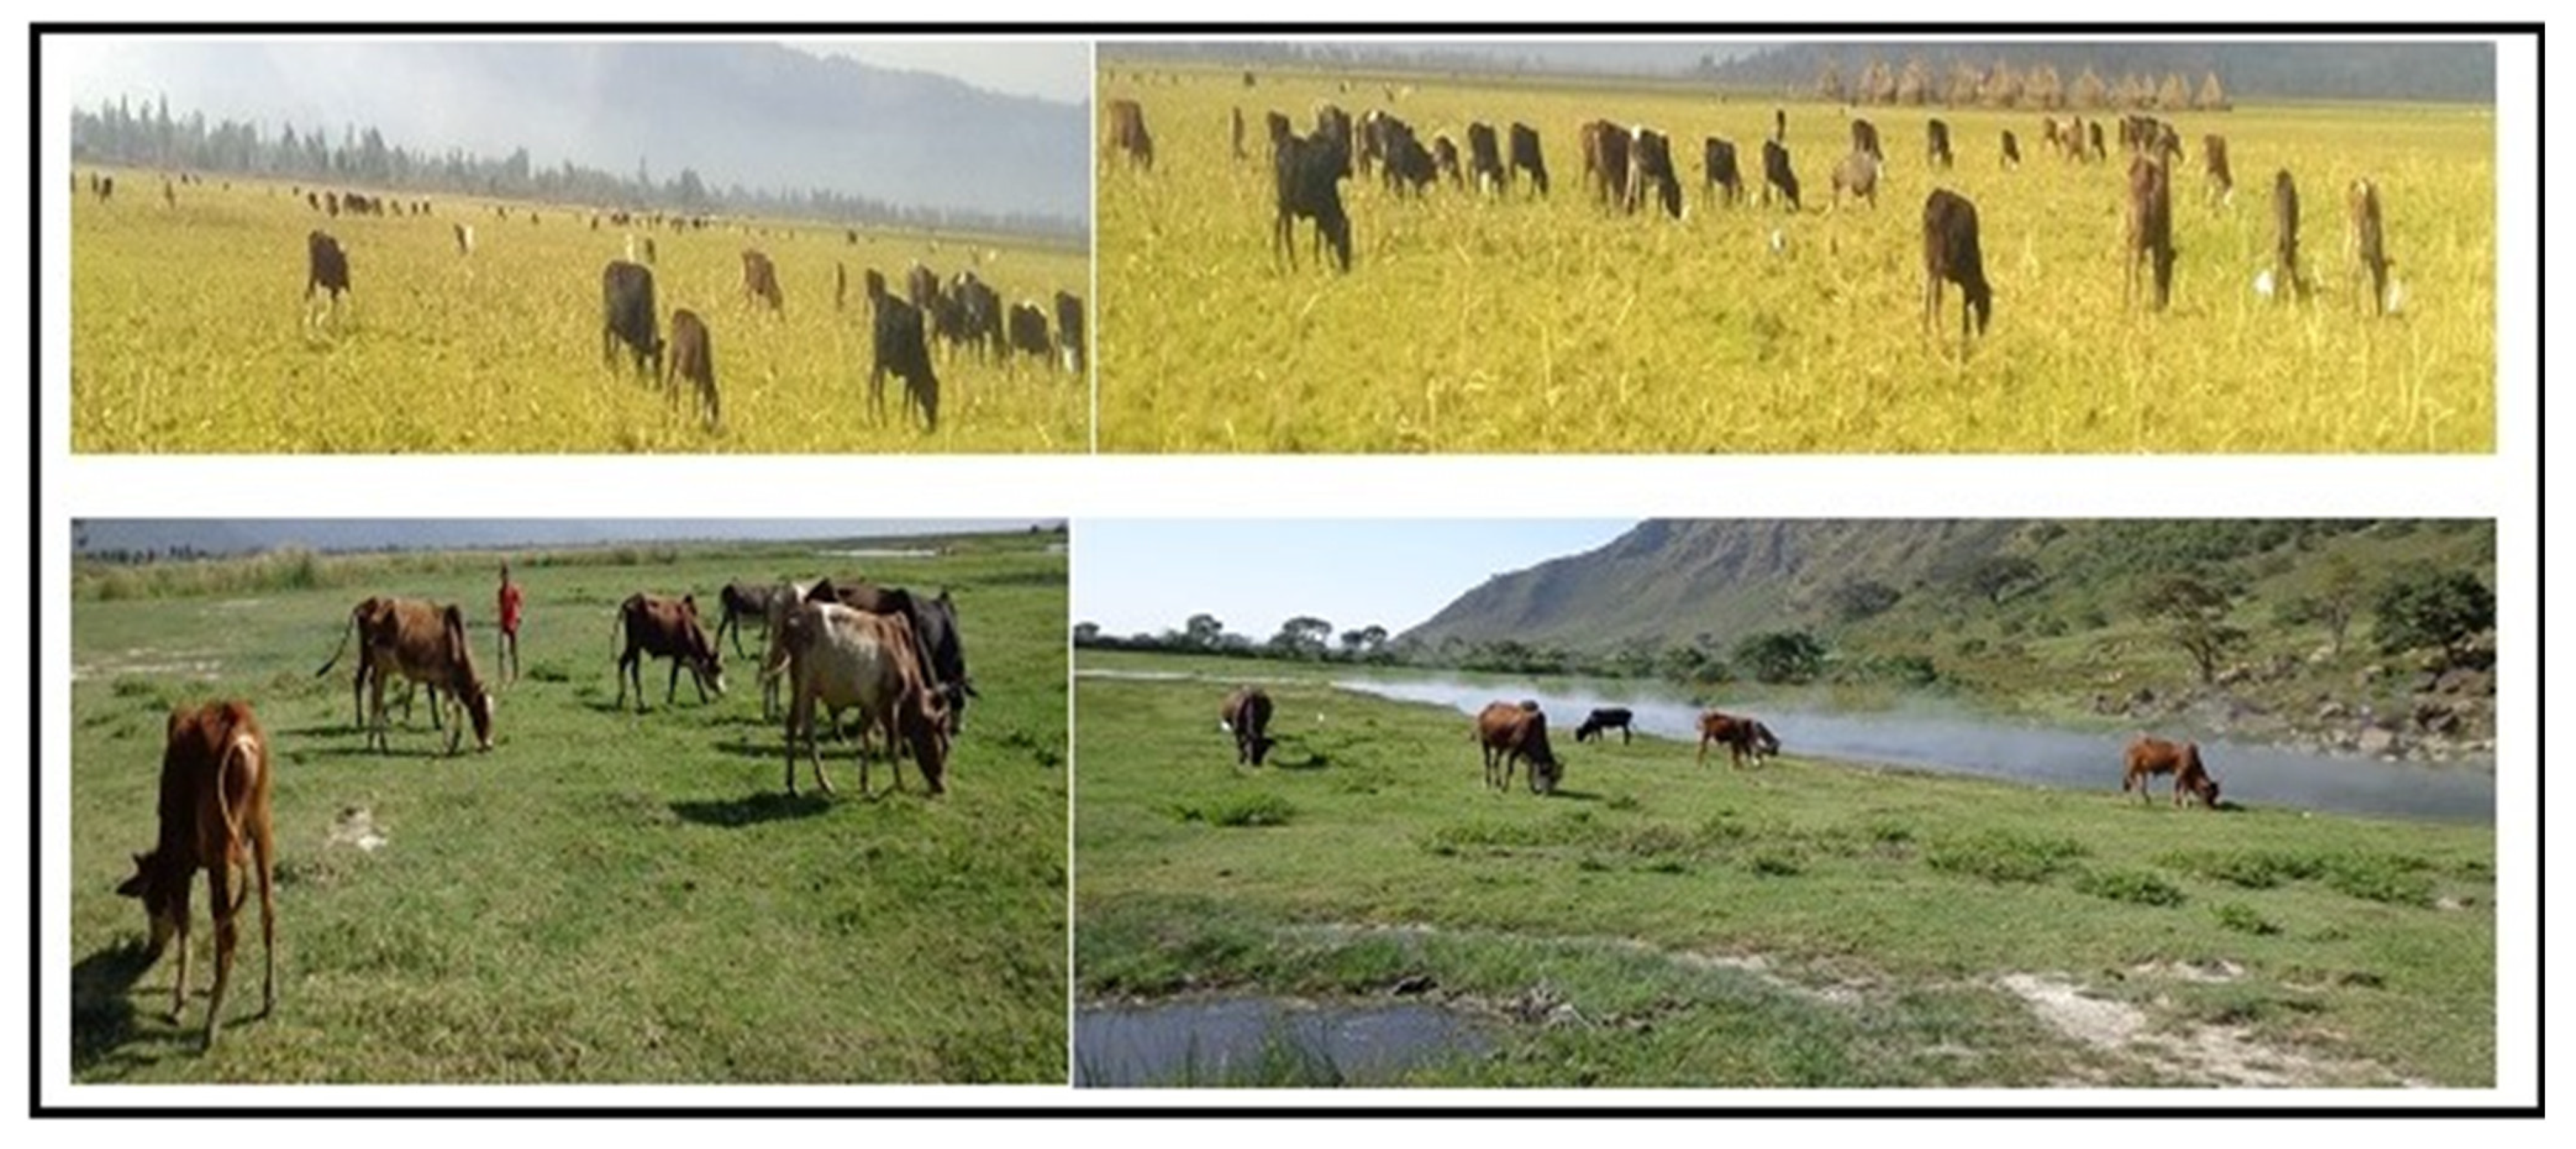
4.1.1. Expansion of Agricultural Activities

As it indicated in the forgoing section, the highest LULCC is exhibited in cultivated land. There was expansion of agricultural activities in the Wondo Genet area driven mainly by high population growth. In Wondo Genet area the expansion of cash crops such as sugarcane and chat, the practice of small and medium scale irrigation schemes increased the expansion agriculture for the last 20 years at the expense of forest, shrub land and grass land.

4.1.2. Urban Expansion

Apart from expansion of agricultural activities, the area experienced a tremendous change in urban built up area expansion (Figure 7). It is revealed that built-up area had grown from 2% in 2002 to 30% in 2018 with an annual rate of 75 ha yr−1. This is mainly driven by high population growth in the area. Obviously, this high population growth has increasing demand for housing and other services in the area which exerts pressure on natural resources of the Wondo Genet area through the conversion of, forestland, grassland and shrub land to built-up area and agricultural land. This can also substantiate the above Figure 5 and Table 5.

4.1.3. Wood Extraction

Extraction of wood for fuel, timber and other purposes is also among the main factors contributing to change in LULC in the area. In areas such as Wondo Genet town, the majority of its residents depend on wood for fuel and other purposes because of a lack of other alternative energy sources. It is indicated that about 50% of the urban households stated urban residents used for fuel wood and charcoal purpose is form forest resource of the surrounding area, while 41% revealed that they used forest for construction purposes and the remaining 9% for household furniture. This depicts that the high demand for fuel wood in urban areas coupled with a shortage of land in the area forced rural people and farmers around and nearby forest areas to chop down indigenous and exotic trees and sell them to meet their daily basic needs. Thus, the declining trend forest resources, as presented in Table 4, in the area is partly due to an ever-increasing wood extraction as source of energy, for construction, and household furniture.

4.2. Underlying Drivers

4.2.1. Demographic Factors

Based on the census report [33], the population density of Wondo Genet area (wet mid-highland) is 677 people /km2 and even the population is also expected to increase in the future. High population density resulted in small land holding sizes. According to Mihretu and Yimer [65] LULCC is highly attributable to the rapid growth of population.

4.2.2. Land Tenure Policy

Land tenure policies are among the indirect drivers in explaining LULCC. There were different land policies during Imperial, Derge and present governments. Land tenure during the imperial regime was controlled by feudal landlords until slogan of “land to the tillers” by the Derge regime, since 1975 which followed the socialist economic system that resulted in distribution of land to landless local people and peasants [64]. In addition, after the downfall of Derge regime in 1991, the EPDRF government moves to free market economy and privatization of government resources. EPDRF government of Ethiopia, unlike to the previous, follows land policy of “land is public and government property” and the users have only use rights. This resulted in a failure of land resources and forest management, and this led to LULCC.

4.2.3. Biophysical Factors

The complex interaction of human and physical factors results in LULCC [67]. Biophysical factors are the fundamental determinants of the extent of LULCC. According to the related studies [68,69] physical factors include soil type and fertility, topography, rainfall variability, temperature variability and wind intensity. According to Hassen, and Assen [54], biophysical characteristics such as the nature of the topography, soil and climate shape the type of human activities that can be practiced in an area and this in turn would shape the LULCC of an area.

5. Implications of LULCC for Sustainable Environmental Management

LULCC is one of the factors that determine the rate of soil loss due to erosion. The removal of vegetation cover means exposing the land to soil erosion [70]. The dramatically decrease in forest cover during study years, i.e., (2002–2018) was attributed due to many reasons rapid population growth and increasing demand of cultivable and grazing land (Figure 8) as well as demand for construction and ever-increasing demand fuel wood in the study area. Therefore, it is time to prioritize and design an environmentally friendly resource management strategy for integrated land-use planning and sustainable development of the study area.

6. Discussion

The present study provides evidence for future projections about LULCC in the Wondo Genet area, which may be checked in advance for further sustainable environmental management. Moreover, the findings of the present study can provide an important foundation in planning a future intervention to minimize the untoward impacts of LULCC on sustainable environmental management in the study area.
The occurrence of LULCC is inevitable and non-linear form due to complex and intertwined proximate and underlying drivers [71]. The LUC is a trend that will continue to unfold due to intervention of unlimited demand of human beings [3]. Since the history of humanity, land devoted to different uses has grown considerably and increases the demand for commodities production which further accelerated and abused the use of natural resources. This situation of unlimited demand and abuse use needs for a more efficient, effective, transparent and integrated land use and sustainable environmental management approach [4]. Since 2018, the Ethiopian Government and its development actors have applied a policy of green legacy on the possibility of safeguarding land from degradation as a basic intervention strategy. In this regard, more than 20 billion seedlings have been planted at the national level. In addition to this, the practice of free grazing and having much livestock per household remains a problem for sustainable environmental management [4]. Unquestionably, livestock plays an important contribution to the livelihood of rural households and is used for farming system. However, livestock more than the carrying capacity of the area and unmanaged grazing system has negatively affected the intended sustainable environmental management in the study area.
LULCC has also implications for meeting SDGs. The aim of SDGs is to transform the world by 2030 by addressing environmental, economic, and social components of sustainable development [72]. However, achieving a balance between these components is challenging [71]. SDGs are established by UN on September 2015 with tile “Transforming our world: the 2030 Agenda for Sustainable Development”, following MDGs but with some major differences. These SDGs have 17 themes with 169 targets and are applicable to all the countries and regions of the world [73,74]. Out of the 17 Goals, 6 (35%) of them such as Goals 6, 7, 12, 13, 14 and 15 are directly related to environmental sustainability. The targets in these goals are mainly linked to the natural environment but are lagging far behind and seem impossible to achieve in due time frame. To achieve the SDGs in southern Ethiopia should be viewed as multifunctional coupled social-ecological systems whose management should integrate LULCC and sustainable environmental management.
For proper sustainable environmental management, losing a sense of ownership and lack of cooperation among community members coupled with a lack of tenure security are gaps on how to manage and utilize the natural resources, such as grass, forest, water and other products from the environment. To avoid further deterioration of suitable LULC and to improve the quality of the ecosystem through sustainable environmental management, emphasis should be given to awareness creation and training of community members on environmental education, introduction of a cut-and-carry grazing system, job creation for rural youth on sustainable environmental management, amendment of the existing land tenure policy, scaling up of evidence-based best practices, boosting community participation on SWC, and enforcing laws and bylaws.

7. Future Land Use/Land Cover from Available Past Data

Analysis of future LULCC and measuring its impacts on sustainable environmental management is a key to sustainable land use management. This requires a comprehensive and complex understanding of multifunctionality between environmental and human systems. The impacts of LULCC are triggered by several drivers [75]. Finding a balance between LULCC and sustainable environmental management is the key role of quality and quantity ecosystem services. Therefore, measuring the impacts of future LULCC projections can effectively demonstrate how human wellbeing obtained from nature can directly promote the paradigm of future environmental sustainability [76].
This study analyzed the LULCC during 2002–2018 in the Wondo Genet areas of southern Ethiopia. The study shows an overall accuracy in the range 86.7–90.2% for the LULC classification during 2002–2018 (see Table 2). With regard to the status of the future land cover from the available past data, the present study helps to predict spatiotemporal changes of future LULCC based on the 2018 LULC simulation and further considers data with ancillary layers to identify areas across the Wondo Genet say for example in 2025. In this study, for each future LULC map preparation, referring to 2018 as the earlier example and 2025 as the recent one, and so on.

8. Conclusions

Information from LULCC studies is vital and necessary for planners and policy makers. Moreover, it provides an important data source for land-use potential determination and consideration of capability of the land. This study revealed that the forest and grass land are decreasing over the study period due to the increasing pace of crop land and built-up area. Of the total area of the study area, forest accounted for 36% in 2002, 10% in 2010 and 6% in 2018 and grass land accounted for 29%, 27% and 2% in 2002, 2010 and 2018, respectively. This depicts these land-use classes have significantly changed to other land-use categories either croplands or built-up areas for a period of a quarter of a century. LULCC significantly has the potential to affect natural resources and increase natural environment degradation. Moreover, this article has emphasized the driving factors to understand the process of LULCC. Therefore, there is a need to land use planning of the study area in particular and the country at large for sustainable natural resources management.

Author Contributions

Conceptualization D.T.; Methodology, D.T. and K.G.; Formal Analysis, D.T. and K.G.; Data, D.T., G.T.S.; Writing original draft, D.T.; G.T.S.; Writing, Review and editing, K.G.; Funding acquisition, D.T. All authors have read and agreed to the published version of the manuscript.

Funding

This research received no external funding.

Institutional Review Board Statement

Not applicable.

Informed Consent Statement

Informed consent was obtained from all subjects involved in the study.

Data Availability Statement

Data could be accessed from corresponding author up on reasonable request.

Acknowledgments

We are very much pleased for the University of Gondar giving MA Thesis grant for the first author.

Conflicts of Interest

The authors declare no conflict of interest.

References

  1. Patel, S.K.; Verma, P.; Shankar Singh, G. Agricultural growth and land use land cover change in peri-urban India. Environ. Monit. Assess. 2019, 191, 600. [Google Scholar] [CrossRef] [PubMed]
  2. Wang, H.; Qiu, F. Investigating the impact of agricultural land losses on deforestation: Evidence from a peri-urban area in Canada. Ecol. Econ. 2017, 1, 9–18. [Google Scholar] [CrossRef]
  3. Wubie, M.A.; Assen, M.; Nicolau, M.D. Patterns, causes and consequences of land use/cover dynamics in the Gumara watershed of lakeTana basin, Northwestern Ethiopia. Environ. Syst. Res. 2016, 5, 8. [Google Scholar] [CrossRef] [Green Version]
  4. Nath, B.; Wang, Z.; Ge, Y.; Islam, K.; PSingh, R.; Niu, Z. Land use and land cover change modeling and future potential landscape risk assessment using Markov-CA model and analytical hierarchy process. ISPRS Int. J. Geo-Inf. 2020, 9, 134. [Google Scholar] [CrossRef] [Green Version]
  5. Muriuki, G.; Seabrook, L.; McAlpine, C.; Jacobson, C.; Price, B.; Baxter, G. Land cover change under unplanned human settlements: A study of the Chyulu Hills squatters, Kenya. Landsc. Urban Plan. 2011, 99, 154–165. [Google Scholar] [CrossRef]
  6. Belay, T.; Mengistu, D.A. Land use and land cover dynamics and drivers in the Muga watershed, Upper Blue Nile basin, Ethiopia. Remote Sens. Appl. Soc. Environ. 2019, 15, 100249. [Google Scholar] [CrossRef]
  7. Mengistu, D.A.; Waktola, D.K.; Woldetsadik, M. Detection and analysis of land-use and land-cover changes in the Midwest escarpment of the Ethiopian Rift Valley. J. Land Use Sci. 2012, 7, 239–260. [Google Scholar] [CrossRef]
  8. Mariye, M.; Jianhua, L.; Maryo, M. Land use and land cover change, and analysis of its drivers in Ojoje watershed, Southern Ethiopia. Heliyon 2022, 8, e09267. [Google Scholar] [CrossRef]
  9. Tyagi, S.; Garg, N.; Paudel, R. Environmental degradation: Causes and consequences. Eur. Res. 2014, 81, 1491. [Google Scholar]
  10. Trozzo, K.; Munsell, J.; Niewolny, K.; Chamberlain, J.L. Forest food and medicine in contemporary Appalachia. Southeast. Geogr. 2019, 59, 52–76. [Google Scholar] [CrossRef]
  11. Joshi, G.; Negi, G.C. Quantification and valuation of forest ecosystem services in the western Himalayan region of India. Int. J. Biodivers. Sci. Ecosyst. Serv. Manag. 2011, 7, 2–11. [Google Scholar] [CrossRef]
  12. Olorunfemi, I.E.; Fasinmirin, J.T.; Olufayo, A.A.; Komolafe, A.A. GIS and remote sensing-based analysis of the impacts of land use/land cover change (LULCC) on the environmental sustainability of Ekiti State, southwestern Nigeria. Environ. Dev. Sustain. 2020, 22, 661–692. [Google Scholar] [CrossRef]
  13. OwusuAnsah, B.; Chigbu, U.E. The nexus between peri-urban transformation and customary land rights disputes: Effects on peri-urban development in Trede, Ghana. Land 2020, 9, 187. [Google Scholar] [CrossRef]
  14. Lin, Y.; Qiu, R.; Yao, J.; Hu, X.; Lin, J. The effects of urbanization on China’s forest loss from 2000 to 2012: Evidence from a panel analysis. J. Clean. Prod. 2019, 20, 270–278. [Google Scholar] [CrossRef]
  15. Tesfaye, B.; Lengoiboni, M.; Zevenbergen, J.; Simane, B. Mapping land use land cover changes and their determinants in the context of a massive free labourmobilisation campaign: Evidence from south wollo, Ethiopia. Remote Sens. 2021, 13, 5078. [Google Scholar] [CrossRef]
  16. Arimjaya, I.; Dimyati, M. Remote sensing and geographic information systems technics for spatial-based development planning and policy. Int. J. Electr. Comput. Eng. 2022, 12, 2088–8708. [Google Scholar] [CrossRef]
  17. Eyayu, M.; Heluf, G.; Tekalign, M.; Mohammed, A. Effects of land-use change on selected soil properties in the TeraGedam Catchment and adjacent agroecosystems, north-west Ethiopia. Ethiop. J. Nat. Resour. 2009, 11, 35–62. [Google Scholar]
  18. Gebrelibanos, T.; Assen, M. Land use/land cover dynamics and their driving forces in the Hirmi watershed and its adjacent agro-ecosystem, highlands of Northern Ethiopia. J. Land Use Sci. 2015, 10, 81–94. [Google Scholar] [CrossRef]
  19. Bewket, W.; Sterk, G. Dynamics in land cover and its effect on stream flow in the Chemoga watershed, Blue Nile basin, Ethiopia. Hydrol. Process. Int. J. 2005, 19, 445–458. [Google Scholar] [CrossRef]
  20. Yeshaneh, E.; Wagner, W.; Exner-Kittridge, M.; Legesse, D.; Blöschl, G. Identifying land use/cover dynamics in the Koga catchment, Ethiopia, from multi-scale data, and implications for environmental change. ISPRS Int. J. Geo-Inf. 2013, 2, 302–323. [Google Scholar] [CrossRef] [Green Version]
  21. Alemu, B. The effect of land use land cover change on land degradation in the highlands of Ethiopia. J. Environ. Earth Sci. 2015, 5, 1–12. [Google Scholar]
  22. Hurni, H.; Tato, K.; Zeleke, G. The implications of changes in population, land use, and land management for surface runoff in the upper Nile basin area of Ethiopia. Mt. Res. Dev. 2005, 25, 147–154. [Google Scholar] [CrossRef] [Green Version]
  23. Yesuf, H.M.; Assen, M.; Melesse, A.M.; Alamirew, T. Detecting land use/land cover changes in the L ake H ayq (Ethiopia) drainage basin, 1957–2007. Lakes Reserv. Res. Manag. 2015, 20, 1–18. [Google Scholar] [CrossRef]
  24. Hailemariam, S.N.; Soromessa, T.; Teketay, D. Land use and land cover change in the bale mountain eco-region of Ethiopia during 1985 to 2015. Land 2016, 5, 41. [Google Scholar] [CrossRef] [Green Version]
  25. Tsegaye, D.; Moe, S.R.; Vedeld, P.; Aynekulu, E. Land-use/cover dynamics in Northern Afar rangelands, Ethiopia. Agric. Ecosyst. Environ. 2010, 139, 174–180. [Google Scholar] [CrossRef]
  26. Haregeweyn, N.; Tesfaye, S.; Tsunekawa, A.; Tsubo, M.; Meshesha, D.T.; Adgo, E.; Elias, A. Dynamics of land use and land cover and its effects on hydrologic responses: Case study of the GilgelTekeze catchment in the highlands of Northern Ethiopia. Environ. Monit. Assess. 2015, 187, 4090. [Google Scholar] [CrossRef]
  27. Yesuph, A.Y.; Dagnew, A.B. Land use/cover spatiotemporal dynamics, driving forces and implications at the Beshillo catchment of the Blue Nile Basin, North Eastern Highlands of Ethiopia. Environ. Syst. Res. 2019, 8, 21. [Google Scholar] [CrossRef] [Green Version]
  28. Girma, Z.; Mamo, Y.; Mengesha, G.; Verma, A.; Asfaw, T. Seasonal abundance and habitat use of bird species in and around Wondo Genet Forest, south-central Ethiopia. Ecol. Evol. 2017, 7, 3397–3405. [Google Scholar] [CrossRef]
  29. Cross, P. The Butterflies of Wondo Genet: An Introduction to the Butterflies of Ethiopia; Wondo Genet College of Forestry: Wondo Genet, Ethiopia, 2003. [Google Scholar]
  30. Ango, T. Prospects of Sustainable Natural Resource Management and Livelihood Development in Wondo Genet Area, Southern Ethiopia. Ph.D. Thesis, Addis Ababa University, Addis Ababa, Ethiopia, 2005. [Google Scholar]
  31. Zewdie, B. Perceptions on Forest Resource Changes in and around Wondo Genet Catchment and Its near Future Impacts; Swedish University of Agricultural Sciences: Uppsala, Sweden, 2002. [Google Scholar]
  32. CSA. National Census Report; CSA: Addis Ababa, Ethiopia, 2007. [Google Scholar]
  33. Dessie, G.; Kinlund, P. Khat expansion and forest decline in Wondo Genet, Ethiopia. Geogr. Ser. B Hum. Geogr. 2008, 90, 187–203. [Google Scholar] [CrossRef]
  34. Kuma, H.G.; Feyessa, F.F.; Demissie, T.A. Land-use/land-cover changes and implications in Southern Ethiopia: Evidence from remote sensing and informants. Heliyon 2022, 8, e09071. [Google Scholar] [CrossRef]
  35. Vivekananda, G.N.; Swathi, R.; Sujith, A.V. Multi-temporal image analysis for LULC classification and change detection. Eur. J. Remote Sens. 2021, 54 (Suppl. 2), 189–199. [Google Scholar] [CrossRef]
  36. Rawat, J.S.; Kumar, M. Monitoring land use/cover change using remote sensing and GIS techniques: A case study of Hawalbagh block, district Almora, Uttarakhand, India. Egypt. Remote Sens. Space Sci. 2015, 18, 77–84. [Google Scholar] [CrossRef] [Green Version]
  37. Butt, A.; Shabbir, R.; Ahmad, S.S.; Aziz, N. Land use change mapping and analysis using Remote Sensing and GIS: A case study of Simly watershed, Islamabad, Pakistan. Egypt. J. Remote Sens. Space Sci. 2015, 18, 251–259. [Google Scholar] [CrossRef]
  38. Lu, D.; Mausel, P.; Batistella, M.; Moran, E. Comparison of land-cover classification methods in the Brazilian Amazon Basin. Photogramm. Eng. Remote Sens. 2004, 70, 723–731. [Google Scholar] [CrossRef] [Green Version]
  39. Islam, K.; Jashimuddin, M.; Nath, B.; Nath, T.K. Land use classification and change detection by using multi-temporal remotely sensed imagery: The case of Chunati wildlife sanctuary, Bangladesh. Egypt. J. Remote Sens. Space Sci. 2018, 21, 37–47. [Google Scholar] [CrossRef]
  40. Puyravaud, J.P. Standardizing the calculation of the annual rate of deforestation. For. Ecol. Manag. 2003, 177, 593–596. [Google Scholar] [CrossRef]
  41. Mohan, M.; Pathan, S.K.; Narendrareddy, K.; Kandya, A.; Pandey, S. Dynamics of urbanization and its impact on land-use/land-cover: A case study of megacity Delhi. J. Environ. Prot. 2011, 2, 1274. [Google Scholar] [CrossRef] [Green Version]
  42. Congalton, R.G.; Green, K. Assessing the Accuracy of Remotely Sensed Data: Principles and Practices; CRC Press: Boca Raton, FL, USA, 2019. [Google Scholar]
  43. Alemu, M.; Suryabhagavan, K.V.; Balakrishnan, M. Assessment of cover change in the Harenna habitats in Bale Mountains, Ethiopia, using GIS and remote sensing. Int. J. Ecol. Environ. Sci. 2012, 38, 39–45. [Google Scholar]
  44. Zewdu, S.; Suryabhagavan, K.V.; Balakrishnan, M. Land-use/land-cover dynamics in Sego Irrigation Farm, southern Ethiopia: A comparison of temporal soil salinization using geospatial tools. J. Saudi Soc. Agric. Sci. 2016, 15, 91–97. [Google Scholar] [CrossRef] [Green Version]
  45. Negash, M.; Kelboro, G. Effects of socio-economic status and food consumption pattern on household energy uses: Implications for forest resource degradation and reforestation around Wondo Genet Catchments, South-Central Ethiopia. East. Afr. Soc. Sci. Res. Rev. 2014, 30, 27–46. [Google Scholar] [CrossRef]
  46. Zeleke, G.; Hurni, H. Implications of land use and land cover dynamics for mountain resource degradation in the Northwestern Ethiopian highlands. Mt. Res. Dev. 2001, 21, 184–191. [Google Scholar] [CrossRef] [Green Version]
  47. Acheampong, E.O.; Macgregor, C.J.; Sloan, S.; Sayer, J. Deforestation is driven by agricultural expansion in Ghana’s forest reserves. Sci. Afr. 2019, 5, e00146. [Google Scholar] [CrossRef]
  48. Rientjes, T.H.; Haile, A.T.; Kebede, E.; Mannaerts, C.M.; Habib, E.; Steenhuis, T.S. Changes in land cover, rainfall and stream flow in Upper GilgelAbbay catchment, Blue Nile basin–Ethiopia. Hydrol. Earth Syst. Sci. 2011, 15, 1979–1989. [Google Scholar] [CrossRef] [Green Version]
  49. Gashaw, T.; Tulu, T.; Argaw, M.; Worqlul, A.W. Evaluation and prediction of land use/land cover changes in the Andassa watershed, Blue Nile Basin, Ethiopia. Environ. Syst. Res. 2017, 6, 17. [Google Scholar] [CrossRef]
  50. Shiferaw, A.; Singh, K.L. Evaluating the land use and land cover dynamics in BorenaWoreda South Wollo Highlands, Ethiopia. Ethiop. J. Bus. Econ. 2011, 2, 69–104. [Google Scholar]
  51. Dessie, G.; Kleman, J. Pattern and magnitude of deforestation in the South Central Rift Valley Region of Ethiopia. Mt. Res. Dev. 2007, 27, 162–168. [Google Scholar] [CrossRef] [Green Version]
  52. Kindu, M.; Schneider, T.; Teketay, D.; Knoke, T. Land use/land cover change analysis using object-based classification approach in Munessa-Shashemene landscape of the Ethiopian highlands. Remote Sens. 2013, 5, 2411–2435. [Google Scholar] [CrossRef] [Green Version]
  53. Gebremicael, T.G.; Mohamed, Y.A.; Betrie, G.D.; Van der Zaag, P.; Teferi, E. Trend analysis of runoff and sediment fluxes in the Upper Blue Nile basin: A combined analysis of statistical tests, physically-based models and landuse maps. J. Hydrol. 2013, 4, 57–68. [Google Scholar] [CrossRef]
  54. Gebrehiwot, S.G.; Bewket, W.; Gärdenäs, A.I.; Bishop, K. Forest cover change over four decades in the Blue Nile Basin, Ethiopia: Comparison of three watersheds. Reg. Environ. Chang. 2014, 14, 253–266. [Google Scholar] [CrossRef]
  55. Kibret, K.S.; Marohn, C.; Cadisch, G. Assessment of land use and land cover change in South Central Ethiopia during four decades based on integrated analysis of multi-temporal images and geospatial vector data. Remote Sens. Appl. Soc. Environ. 2016, 3, 1–19. [Google Scholar] [CrossRef]
  56. Hassen, E.E.; Assen, M. Land use/cover dynamics and its drivers in Gelda catchment, Lake Tana watershed, Ethiopia. Environ. Syst. Res. 2018, 6, 4. [Google Scholar] [CrossRef] [Green Version]
  57. Tolessa, T.; Senbeta, F.; Kidane, M. The impact of land use/land cover change on ecosystem services in the central highlands of Ethiopia. Ecosyst. Serv. 2017, 23, 47–54. [Google Scholar] [CrossRef]
  58. Asempah, M.; Sahwan, W.; Schütt, B. Assessment of land cover dynamics and drivers of urban expansion using geospatial and logistic regression approach in Wa municipality, Ghana. Land 2021, 10, 1251. [Google Scholar] [CrossRef]
  59. Dewan, A.M.; Yamaguchi, Y. Land use and land cover change in Greater Dhaka, Bangladesh: Using remote sensing to promote sustainable urbanization. Appl. Geogr. 2009, 29, 390–401. [Google Scholar] [CrossRef]
  60. Arowolo, A.O.; Deng, X. Land use/land cover change and statistical modelling of cultivated land change drivers in Nigeria. Reg. Environ. Chang. 2018, 18, 247–259. [Google Scholar] [CrossRef]
  61. Yin, J.; Yin, Z.; Zhong, H.; Xu, S.; Hu, X.; Wang, J.; Wu, J. Monitoring urban expansion and land use/land cover changes of Shanghai metropolitan area during the transitional economy (1979–2009) in China. Environ. Monit. Assess. 2011, 177, 609–621. [Google Scholar] [CrossRef] [PubMed]
  62. Ifeoluwa, A.B.; Debo, Z.A.; Ahmed, A.B.; Tobi, E.M. Analysis of urban expansion and land use changes in Akure, Nigeria, using remote sensing and geographic information system (GIS) techniques. J. Geogr. Reg. Plan. 2011, 4, 533–541. [Google Scholar]
  63. Fenta, A.A.; Yasuda, H.; Haregeweyn, N.; Belay, A.S.; Hadush, Z.; Gebremedhin, M.A.; Mekonnen, G. The dynamics of urban expansion and land use/land cover changes using remote sensing and spatial metrics: The case of Mekelle City of northern Ethiopia. Int. J. Remote Sens. 2017, 38, 4107–4129. [Google Scholar] [CrossRef]
  64. Degife, A.; Worku, H.; Gizaw, S.; Legesse, A. Land use land cover dynamics, its drivers and environmental implications in Lake Hawassa Watershed of Ethiopia. Remote Sens. Appl. Soc. Environ. 2019, 14, 178–190. [Google Scholar] [CrossRef]
  65. Serra, P.; Pons, X.; Saurí, D. Land-cover and land-use change in a Mediterranean landscape: A spatial analysis of driving forces integrating biophysical and human factors. Appl. Geogr. 2008, 28, 189–209. [Google Scholar] [CrossRef]
  66. Bekele, B.; Wu, W.; Yirsaw, E. Drivers of land use-land cover changes in the central rift valley of Ethiopia. Sains Malays 2019, 48, 1333–1345. [Google Scholar] [CrossRef]
  67. Mihretu, A.; Yimer, A.A. Land use/land cover changes and their environmental implications in the Gelana sub-watershed of Northern highlands of Ethiopia. Environ. Syst. Res. 2017, 6, 7. [Google Scholar] [CrossRef] [Green Version]
  68. Li, X.; Wang, Y.; Li, J.; Lei, B. Physical and socioeconomic driving forces of land-use and land-cover changes: A Case Study of Wuhan City, China. Discret. Dyn. Nat. Soc. 2016, 2016, 8061069. [Google Scholar] [CrossRef] [Green Version]
  69. Bajocco, S.; Ceccarelli, T.; Smiraglia, D.; Salvati, L.; Ricotta, C. Modeling the ecological niche of long-term land use changes: The role of biophysical factors. Ecol. Indic. 2016, 60, 231–236. [Google Scholar] [CrossRef]
  70. Kleemann, J.; Baysal, G.; Bulley, H.N.; Fürst, C. Assessing driving forces of land use and land cover change by a mixed-method approach in north-eastern Ghana, West Africa. J. Environ. Manag. 2017, 196, 411–442. [Google Scholar] [CrossRef] [PubMed]
  71. Kariuki, R.W.; Munishi, L.K.; Courtney-Mustaphi, C.J.; Capitani, C.; Shoemaker, A.; Lane, P.J.; Marchant, R. Integrating stakeholders’ perspectives and spatial modelling to develop scenarios of future land use and land cover change in northern Tanzania. PLoS ONE 2021, 16, e0245516. [Google Scholar] [CrossRef] [PubMed]
  72. Leemhuis, C.; Thonfeld, F.; Näschen, K.; Steinbach, S.; Muro, J.; Strauch, A.; López, A.; Daconto, G.; Games, I.; Diekkrüger, B. Sustainability in the food-water-ecosystem nexus: The role of land use and land cover change for water resources and ecosystems in the Kilombero Wetland, Tanzania. Sustainability 2017, 9, 1513. [Google Scholar] [CrossRef] [Green Version]
  73. Arora, N.K.; Mishra, I. United Nations Sustainable Development Goals 2030 and environmental sustainability: Race against time. Environ. Sustain. 2019, 2, 339–342. [Google Scholar] [CrossRef] [Green Version]
  74. Kelly-Fair, M.; Gopal, S.; Koch, M.; Pancasakti Kusumaningrum, H.; Helmi, M.; Khairunnisa, D.; Kaufman, L. Analysis of Land Use and Land Cover Changes through the Lens of SDGs in Semarang, Indonesia. Sustainability 2022, 14, 7592. [Google Scholar] [CrossRef]
  75. Dibaba, W.T.; Demissie, T.A.; Miegel, K. Drivers and implications of land use/land cover dynamics in Finchaa catchment, northwestern Ethiopia. Land 2020, 9, 113. [Google Scholar] [CrossRef] [Green Version]
  76. Gomes, E.; Inácio, M.; Bogdzevič, K.; Kalinauskas, M.; Karnauskaitė, D.; Pereira, P. Future land-use changes and its impacts on terrestrial ecosystem services: A review. Sci. Total Environ. 2021, 781, 146716. [Google Scholar] [CrossRef] [PubMed]
Figure 1. Map of the study area. (Source, Own GIS formulation).
Sustainability 14 16527 g001
Figure 2. Schematic representation of the LULCC analysis (source: own formulation).
Sustainability 14 16527 g002
Figure 3. LULCC of Wondo Genet Area in 2002, 2010, and 2018.
Sustainability 14 16527 g003
Figure 4. Photos of forest coverage in the study area normal forest (left) and degraded (right). (Source: Photo from field observation).
Sustainability 14 16527 g004
Figure 5. The expansion of built-up area towards periphery of Wondo Genet town (left, 2002 and right, 2018). Source: Digital globe Map.
Sustainability 14 16527 g005
Figure 6. LULCC linkages and flow dynamics among driving forces.
Sustainability 14 16527 g006
Figure 7. LULCC classes of Wondo Genet area between 2002–2018.
Sustainability 14 16527 g007
Figure 8. Clustered Cattle population grazing at smaller area as a result of LULCC (Photo filed observation).
Sustainability 14 16527 g008
Table 1. LULC classes identified in the study area.
LULC TypesDescription
Forest landAreas covered by trees both natural and planted
Shrub landAreas covered with shrubs, bushes and small trees, with little useful wood, mixed with some grasses
Cultivated landAreas used for crop cultivation both annuals and perennials
Built-up areaLand area devoted to urban settlement land and the scattered rural settlement. It
 includes areas with all types of artificial surfaces, including residential, commercial, and industrial land uses as well as transportation infrastructure
GrasslandGrassy areas used for communal grazing, as well as a bare land that has very little or no grass cover
Table 2. LULCC accuracy assessment.
YearOverall AccuracyKappa Coefficient
200289.3986.72
201090.186.70
201892.1890.19
Table 3. LULCC assessments of Wondo Genet area (2002–2018).
LULC Types200220102018
(ha)%(ha)%(ha)%
Forest 806335.612710.069.761289.35.69
Grass land660429.16613127.07378.71.67
Cultivated land314.41.391282.955.674862.2721.47
Shrub land717131.677847.1534.659326.2541.18
Built up493.12.184674.3120.646788.8829.98
Total22,645.510022,645.510022,645.5100
Source: Land sat images (2002, 2010 and 2018).
Table 4. LULCC magnitude, percentage change and annual rate of change of Wondo Genet area.
LULCCLULCC by YearMagnitude of ChangeAnnual Rate of Change
2002201020182002–20102010–20182002–2018(% Change Hayear−1)
ha %ha %ha %Ha%Ha%Ha%2002–20102010–20182002–2018
Forest 806335.612710.069.761289.35.69−5352.94−23.64−1420.76−6.27−6773.7−29.91−7.38−5.83−4.94
Grass land 660429.16613127.07378.71.67−473−2.09−5752.3−25.40−6225.3−27.49−0.79−10.42−5.55
Cultivated land 314.41.391282.955.674862.2721.47968.554.283579.3215.814547.8720.0834.2331.0085.09
Shrub land 717131.677847.1534.659326.2541.18676.152.981479.106.532155.259.521.052.091.77
Built up 493.12.184674.3120.646788.8829.984181.2118.462114.579.346295.7827.8094.225.0375.10
Total 22,645.510022,645.510022,645.5100
Table 5. Horizontal urban expansion of Wondo Genet Town (2002–2018).
YearWondo Genet
Built Up Area (ha)Change (Ha)
2002–20102010–20182002–2018
2002493.14181.21
20104674.31 2114.57
20186788.88 6295.78
% Change (ha year−1) 94.225.0375.10
Publisher’s Note: MDPI stays neutral with regard to jurisdictional claims in published maps and institutional affiliations.

