Article

Mapping the Essential Urban Land Use in Changchun by Applying Random Forest and Multi-Source Geospatial Data

1
Northeast Institute of Geography and Agroecology, Chinese Academy of Sciences, Changchun 130102, China
2
School of Geomatics and Prospecting Engineering, Jilin Jianzhu University, Changchun 130118, China
3
National Earth System Science Data Center, Beijing 100101, China
4
Changchun Institute of Urban Planning and Design, Changchun 130022, China
5
College of Geo-Exploration Science and Technology, Jilin University, Changchun 130026, China
*
Author to whom correspondence should be addressed.
Remote Sens. 2020, 12(15), 2488; https://0-doi-org.brum.beds.ac.uk/10.3390/rs12152488
Submission received: 21 June 2020 / Revised: 29 July 2020 / Accepted: 31 July 2020 / Published: 3 August 2020
(This article belongs to the Special Issue Urban Land Use Mapping and Analysis in the Big Data Era)

Abstract

:
Understanding urban spatial pattern of land use is of great significance to urban land management and resource allocation. Urban space has strong heterogeneity, and thus there were many researches focusing on the identification of urban land use. The emergence of multiple new types of geospatial data provide an opportunity to investigate the methods of mapping essential urban land use. The popularization of street view images represented by Baidu Maps is benificial to the rapid acquisition of high-precision street view data, which has attracted the attention of scholars in the field of urban research. In this study, OpenStreetMap (OSM) was used to delineate parcels which were recognized as basic mapping units. A semantic segmentation of street view images was combined to enrich the multi-dimensional description of urban parcels, together with point of interest (POI), Sentinel-2A, and Luojia-1 nighttime light data. Furthermore, random forest (RF) was applied to determine the urban land use categories. The results show that street view elements are related to urban land use in the perspective of spatial distribution. It is reasonable and feasible to describe urban parcels according to the characteristics of street view elements. Due to the participation of street view, the overall accuracy reaches 79.13%. The contribution of street view features to the optimal classification model reached 20.6%, which is more stable than POI features.

Graphical Abstract

1. Introduction

Acceleration of urbanization and the proposal of smart city brings new demands to the refinement of urban governance. Spatial pattern of urban land use, which affects urban activities, is an important information for urban investigation, modeling, and resource allocation [1,2,3,4]. Traditional methods for mapping urban land use rely on remote sensing, and identified land patches are relatively fragmented, which differ from the more regular spatial scope of urban management. Gong et al. (2019) regarded parcels which are bounded by road networks as the intrinsic segmentation of urban land use [5]. Many scholars used OpenStreetMap (OSM) to delimit the boundary of parcel, and the methods performed well [6,7]. Currently, OSM is the largest project in collaborative and publicly licensed geospatial data collection, and thus it was widely used as an alternative or supplement to authoritative data in related researches [8,9,10,11]. With the continuous development and growth of OSM, the data quality is constantly improving. OSM is thus considered to be a promising data source for rapid and reliable parcel delineation to meet the needs of fine urban management [3,12].
Cities with a strong human activity show amazing and continuous anthropogenic change properties in urban underlying surface [13]. Since the socio-economic characteristics have no direct relationship with the spectral reflectance that can be detected by various remote sensing sensors, it is very difficult to detect land use only from remote sensing images [14]. With enhanced accessibility of data generated by the Internet services and mobile devices, volunteered geographic information (VGI), and open sharing data of government departments, more researchers are committed to identifying urban land use with different combinations of physical characteristics and social attributes [15,16,17]. In terms of identifying residential and work functional areas, mobile signaling data and taxi trajectory data have proved effective [18,19,20], but the data are difficult to obtain. Point of interest (POI) data are closely related to human life and has the advantages of large sample size and easy accessibility. For examples, Song et al. (2018) directly used POI to identify the land use of polygons obtained from high-resolution remote sensing image segmentation [21]. Lu et al. (2020) mapped the urban spatial structure with POI [22]. At present, most researches on urban spatial structure are focused on two-dimensional spaces, which cannot fully reflect the state of modern urban spaces characterized by various high-rise buildings [23,
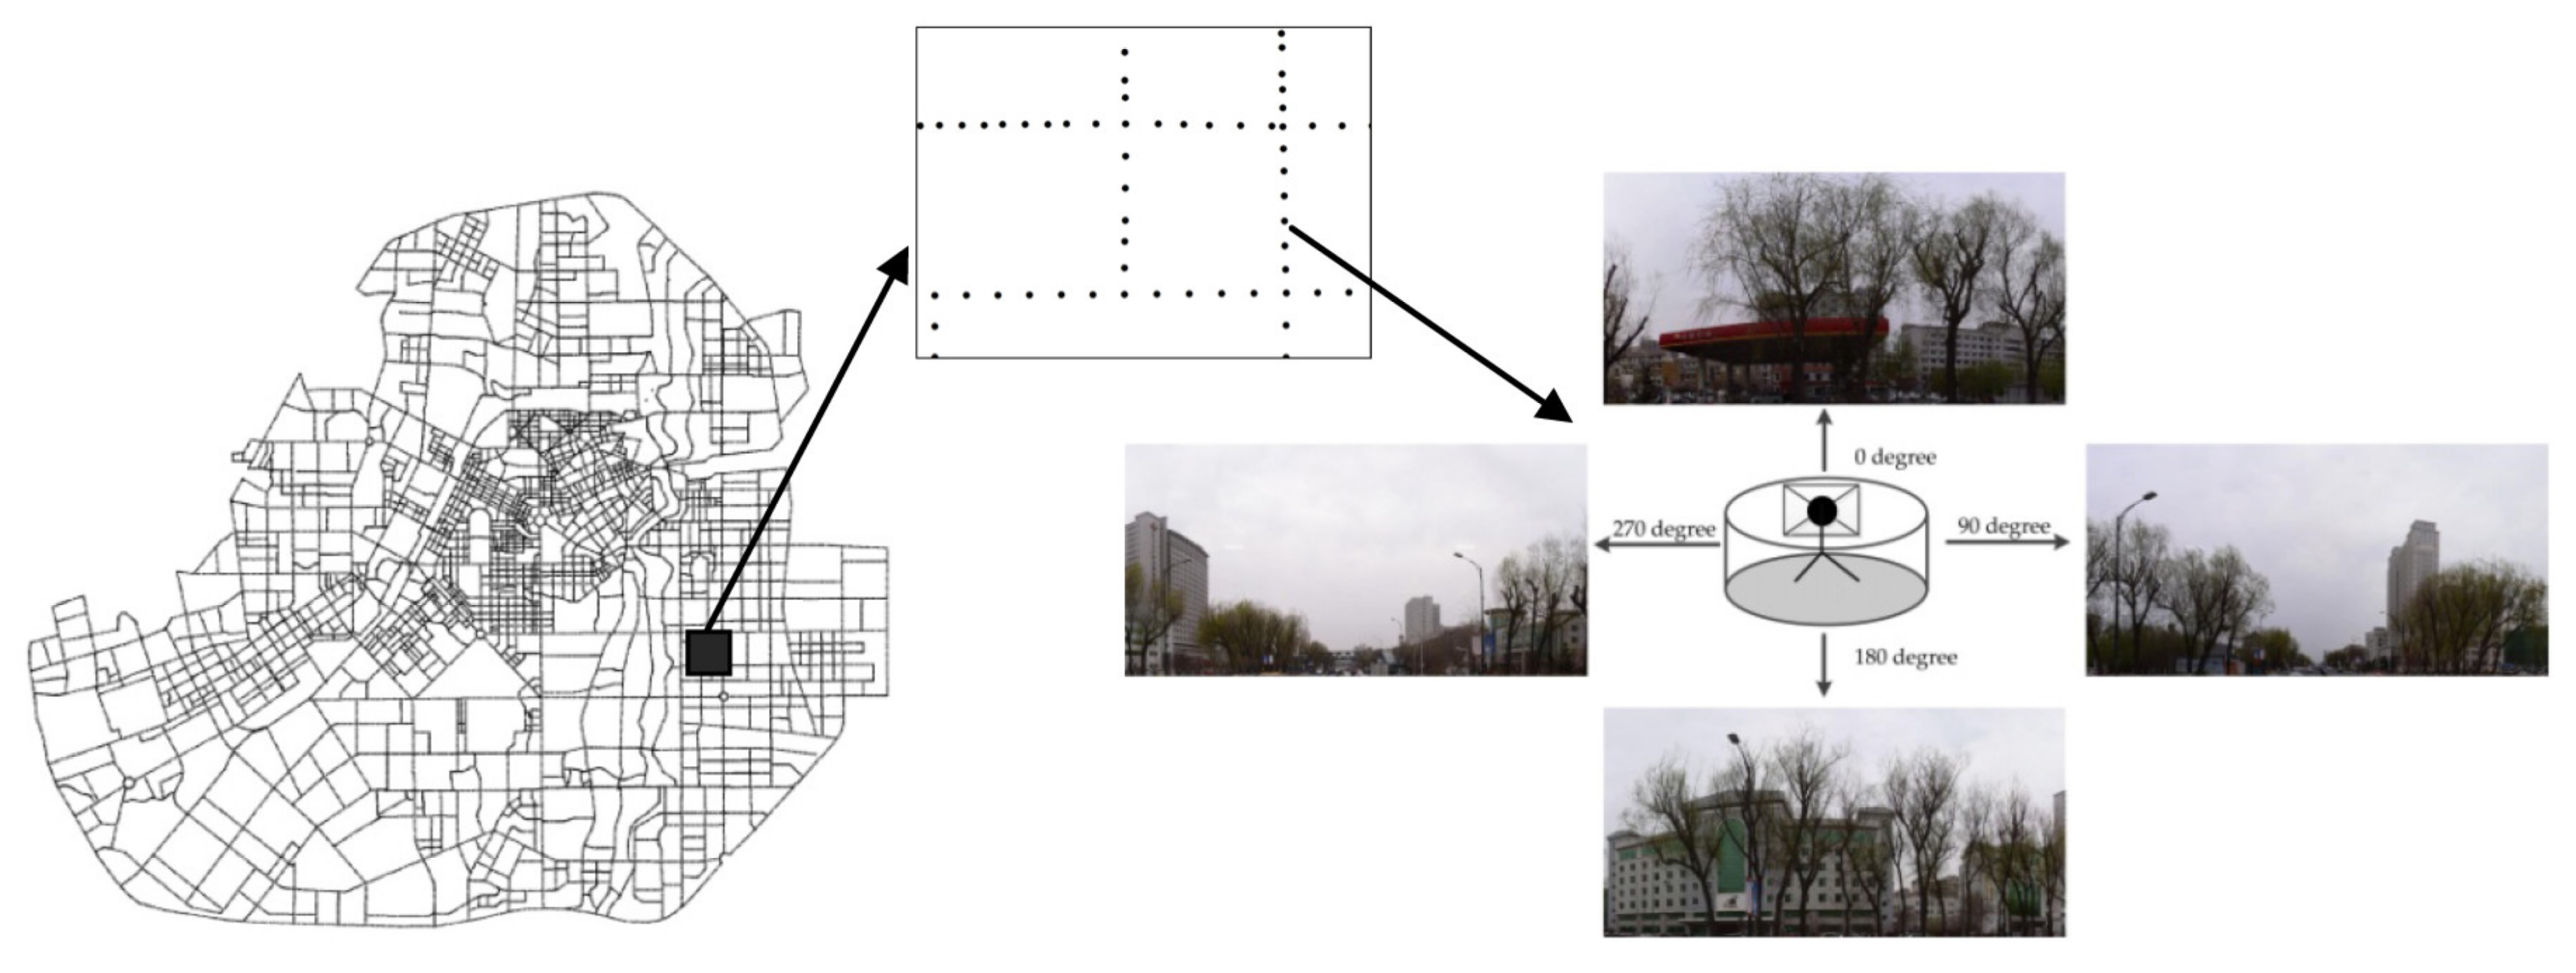
24]. Street view expands the evaluation scope from a two-dimensional plane to three-dimensional level, and enables people to observe the streetscape of a large city, thus providing the ability of close-range sensing and the ground details lacking in overhead images, as well as information about the socio-economic use of urban land. Li et al. (2017) used Google Street View to determine the land use types of different building units along the street [25]. Cao et al. (2018) achieved good results in the urban land use recognition at pixel scale by fusing a remote sensing image and street view [26]. Futhermore, the performance of street view in land use identification at parcel scale needs to be evaluated, which is more directly related to urban land management.
The fusion of technical sensor data with human sensor and collective sensing have good performance in urban research [27,28]. There is no doubt that the combination of street view and remote sensing data can improve the recognition accuracy of essential urban land use, while creative work is needed to integrate different data by developing models [29]. In addition, although the influence of street view on the accuracy of urban land use classification was evaluated in previous studies, there is a lack of the evaluation of different feature combinations. Machine learning algorithms (MLAs) have emerged in the field of accurate predictive modeling. It involves identifying complex structures, especially irregular data, and generating high-precision predictive models. Therefore, MLAs were widely used in the predictive modeling including image classification [30]. Among the existing MLAs, random forest (RF) is a supervised ensemble learning algorithm based on decision tree classification. It is a nonparametric classification, and therefore it does not require that values of variables follow a particular statistical distribution [31]. Previous studies have shown that the RF algorithm has good robustness and efficiency in training data [32,33].
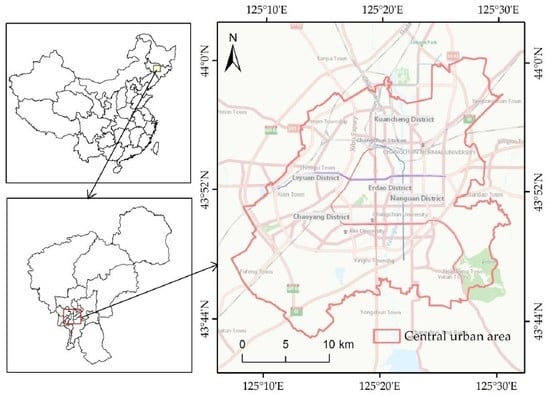
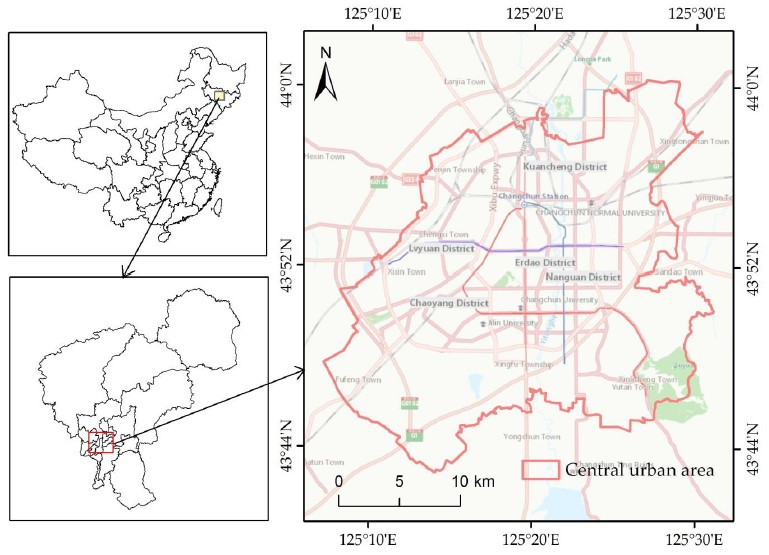
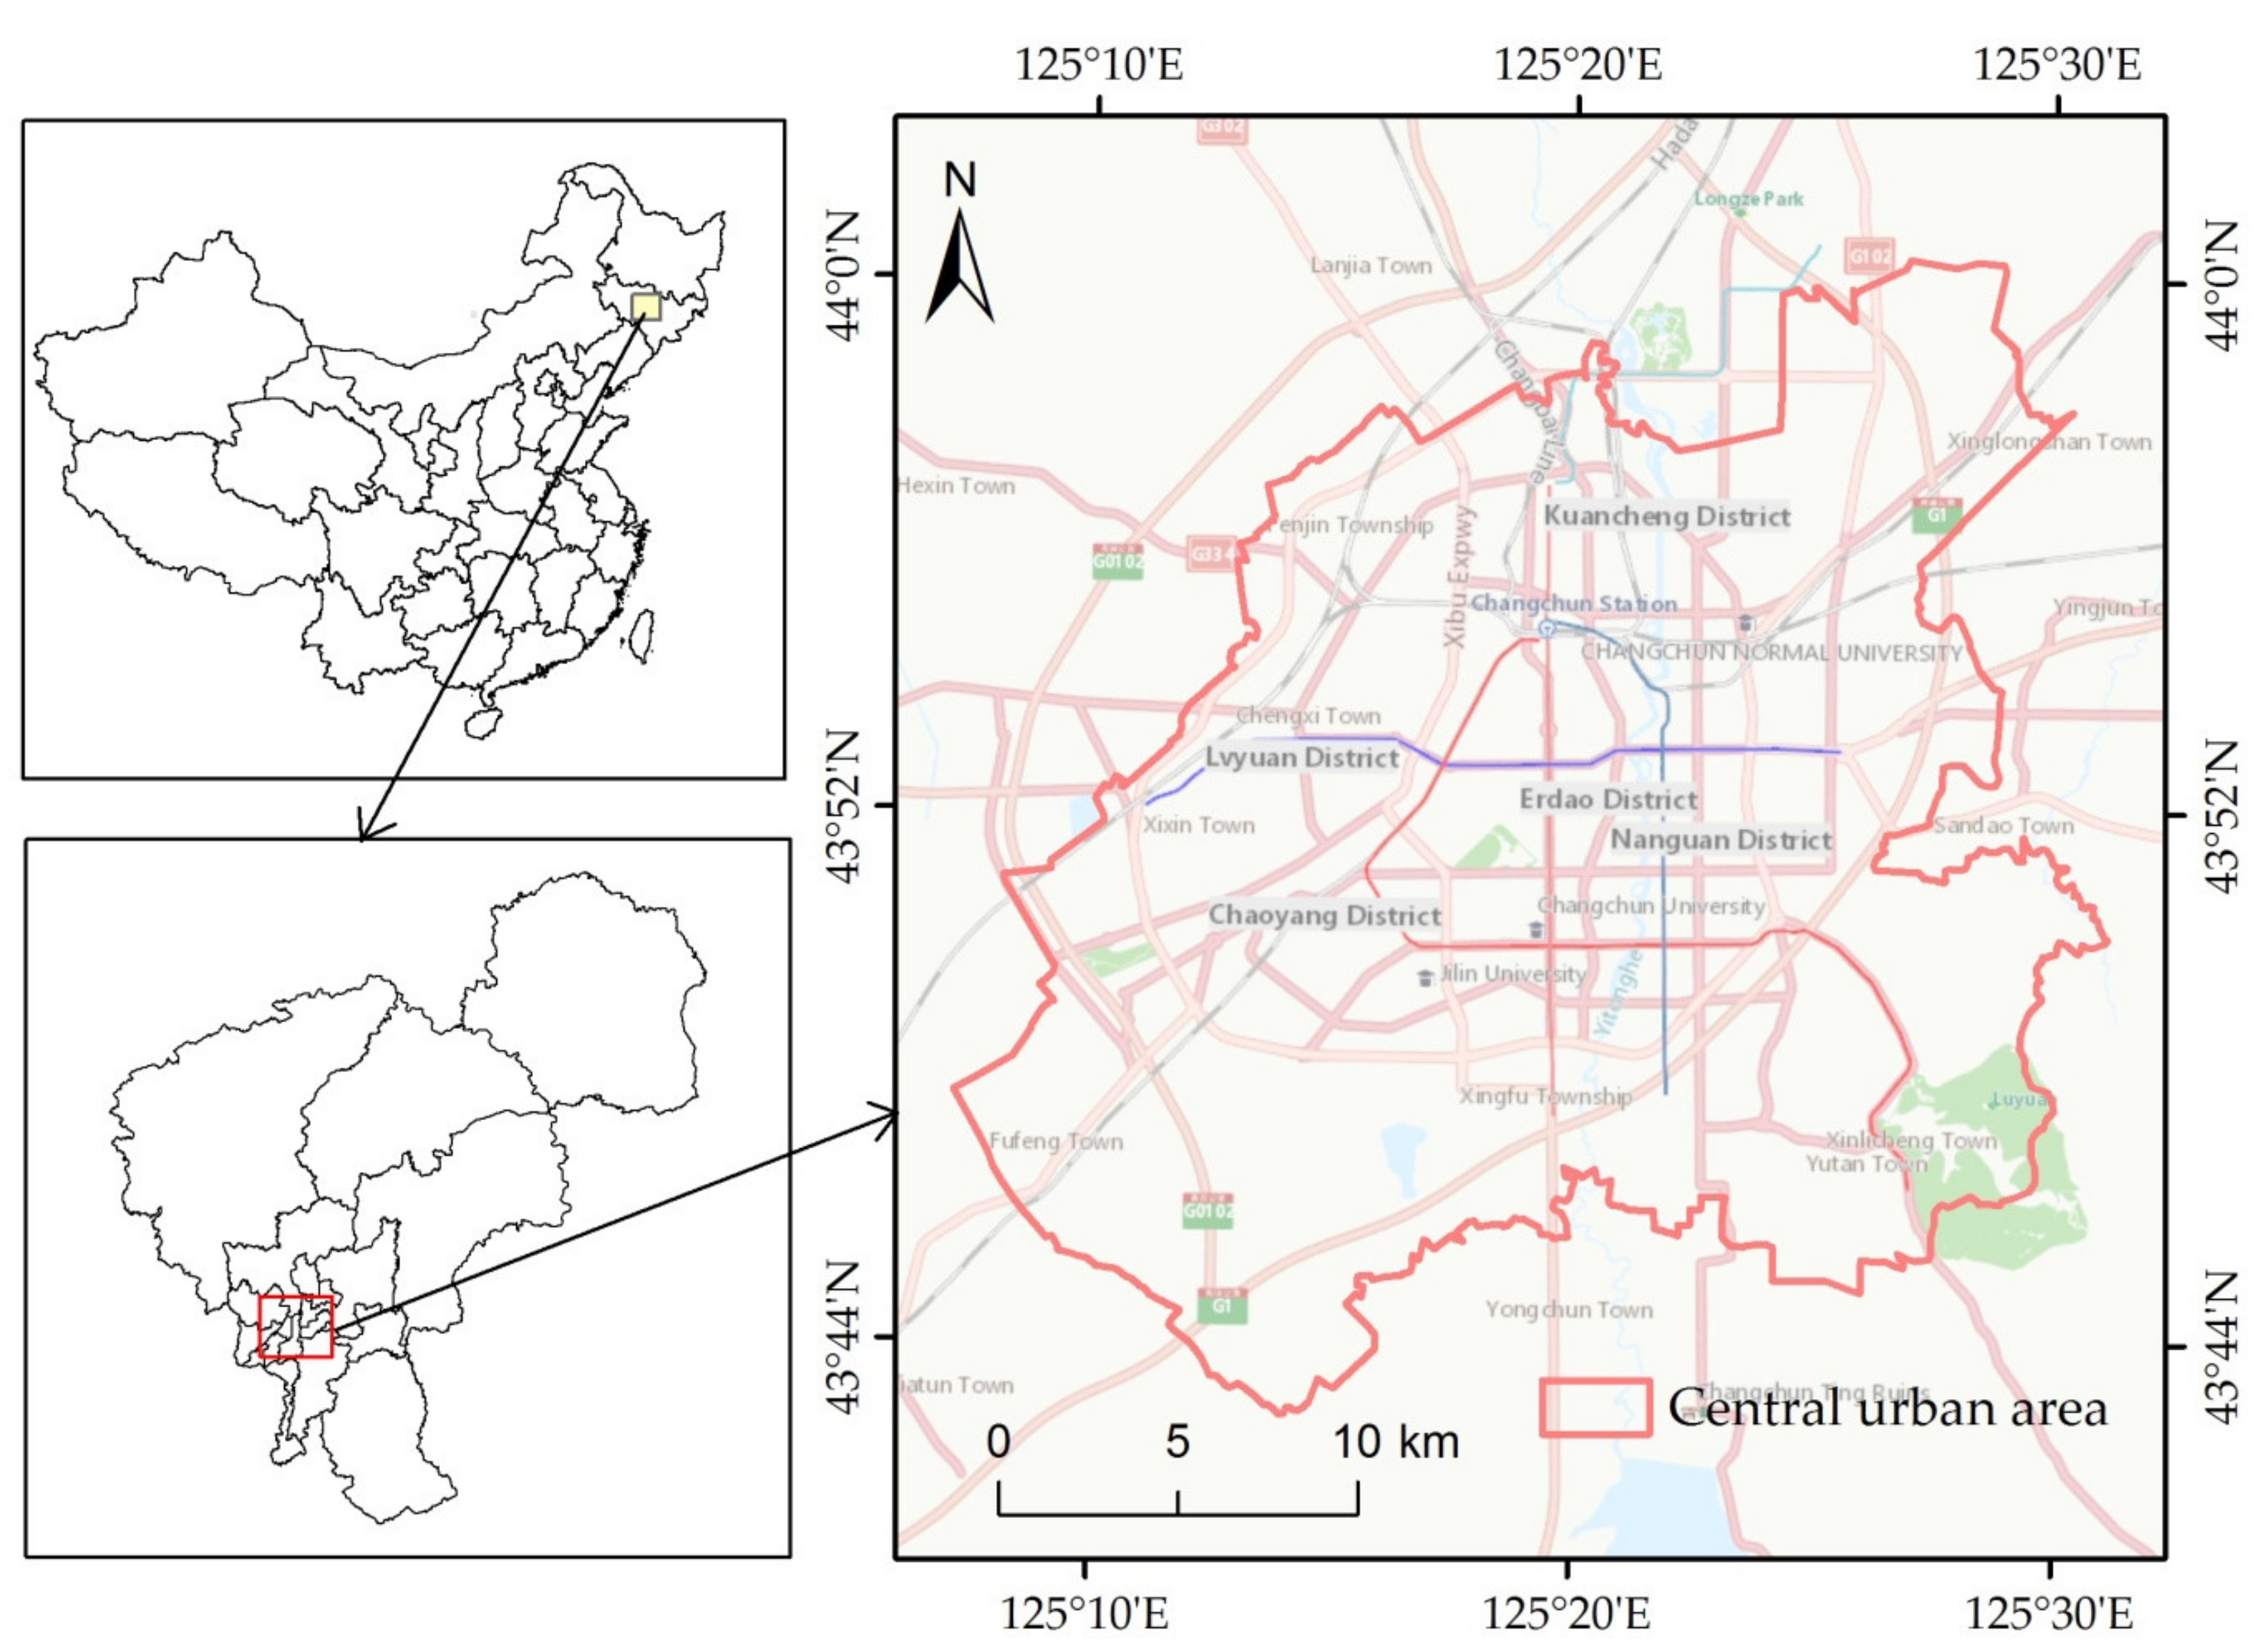
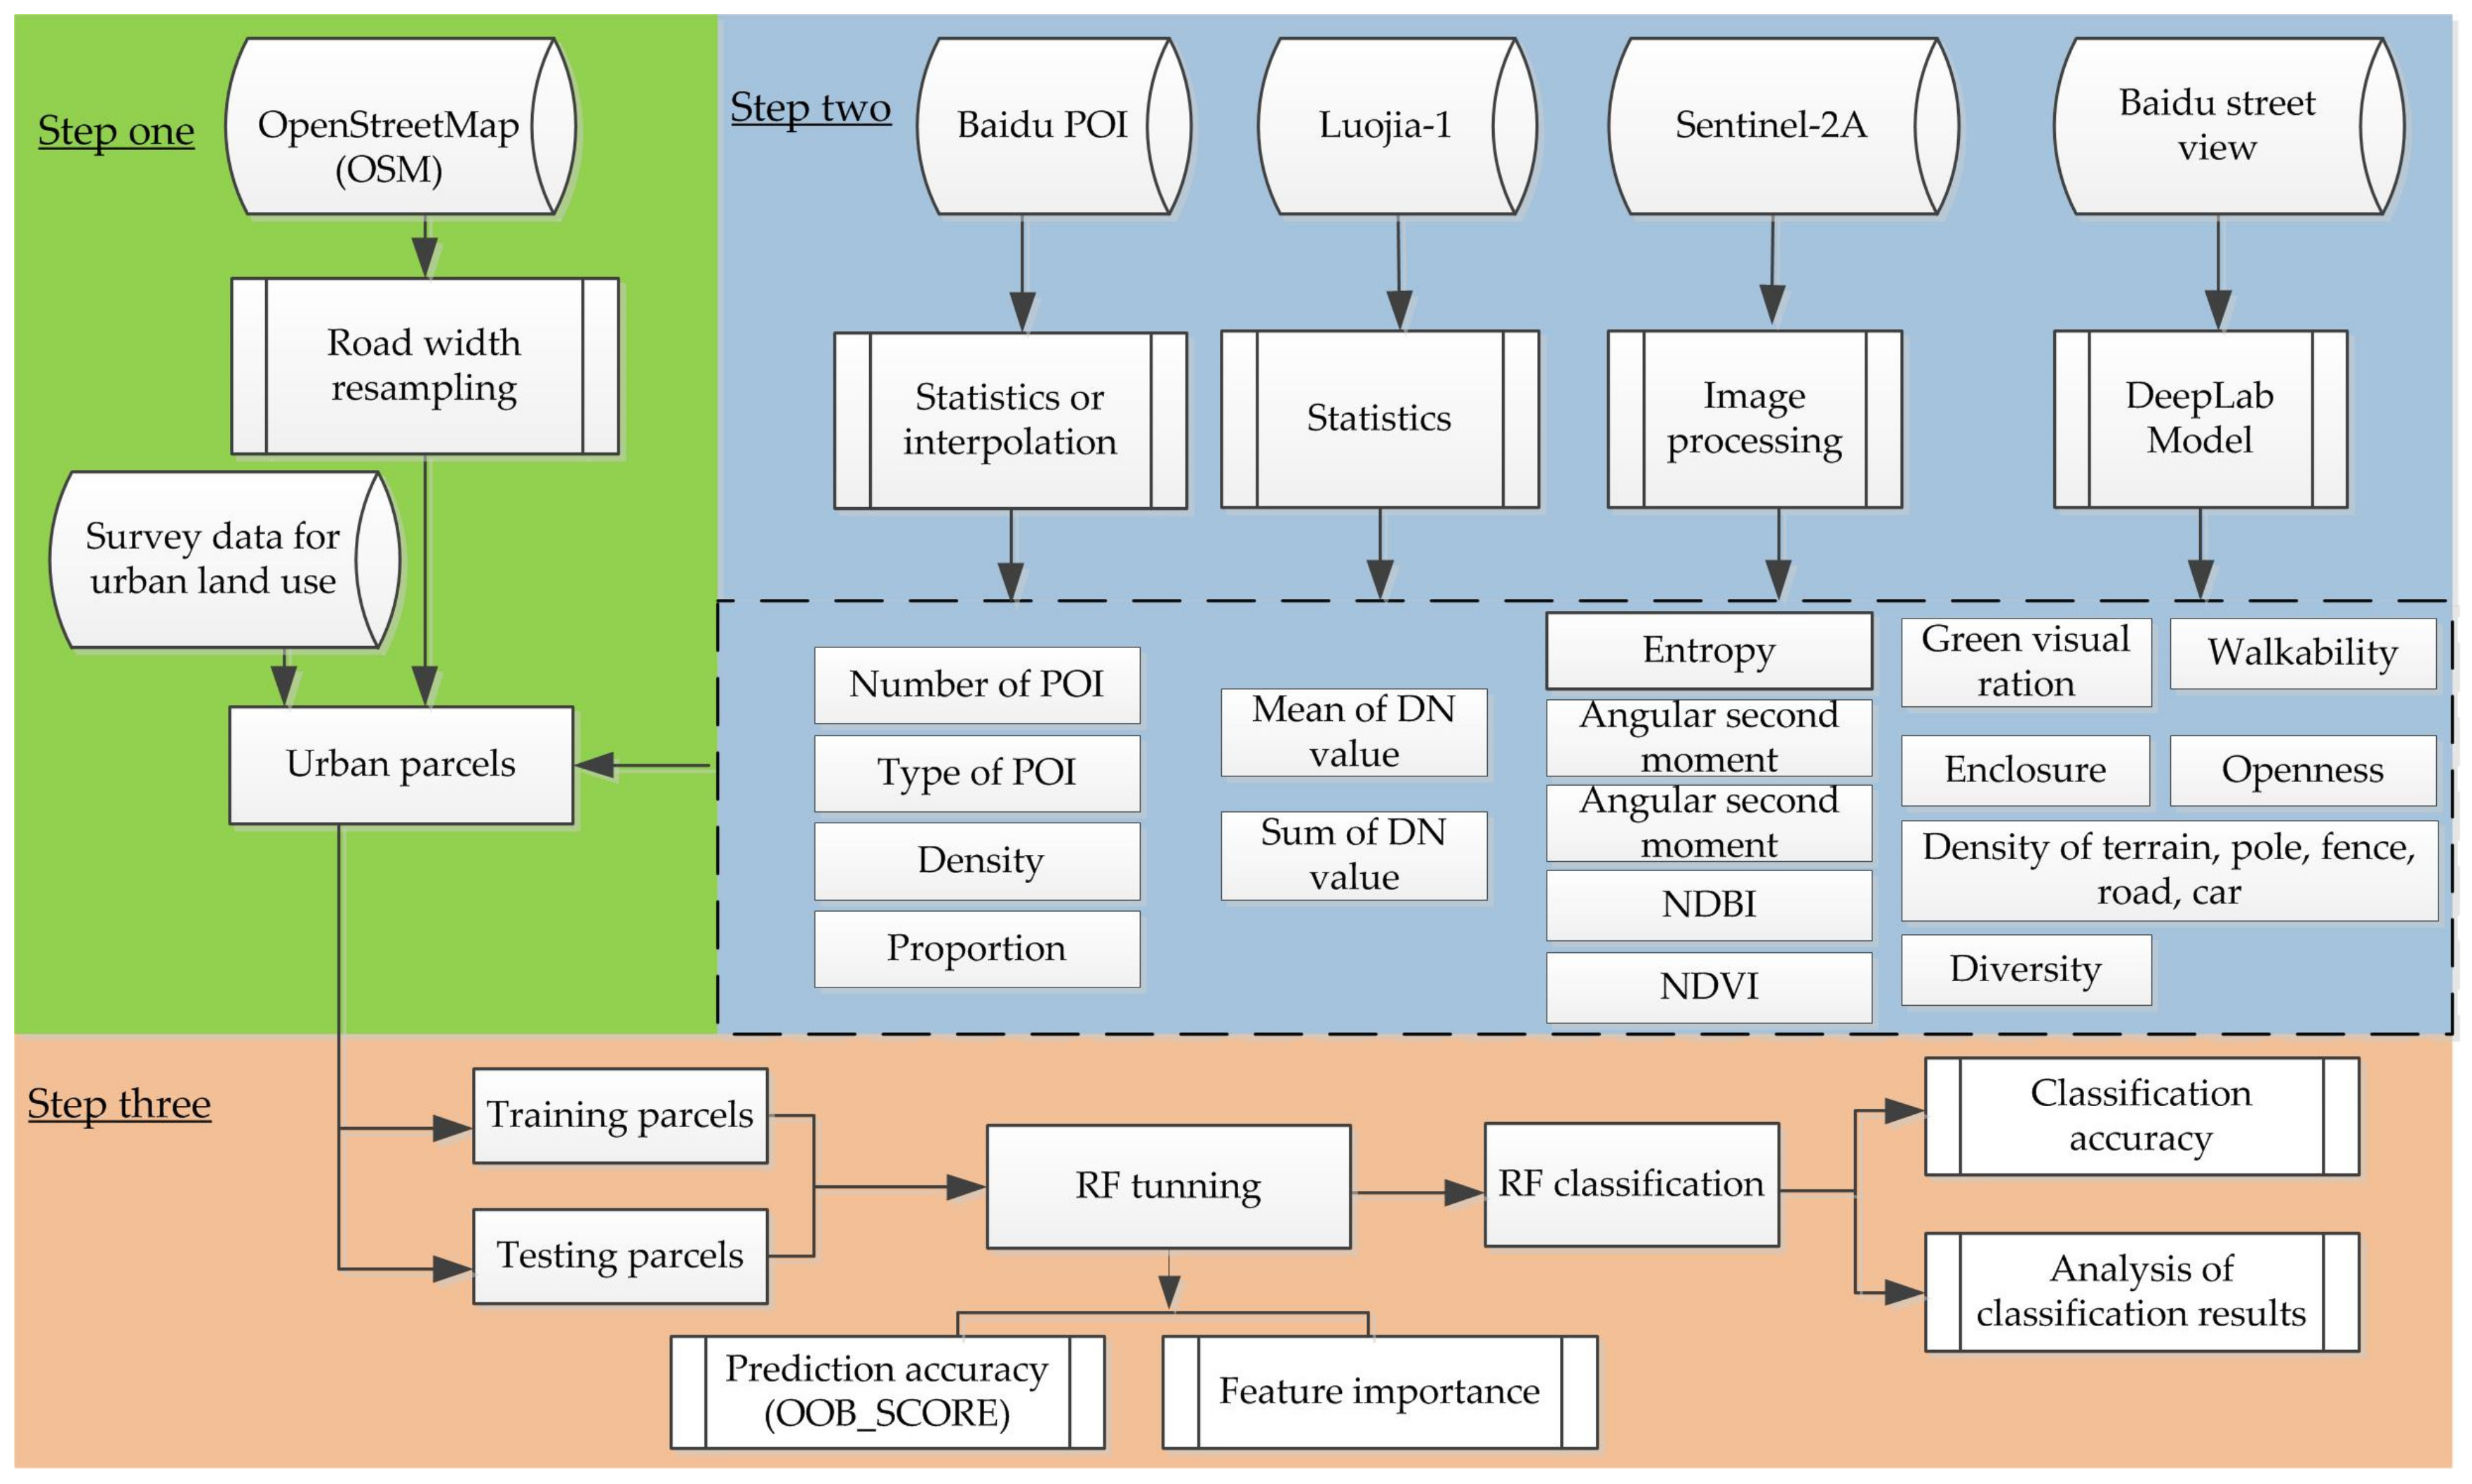
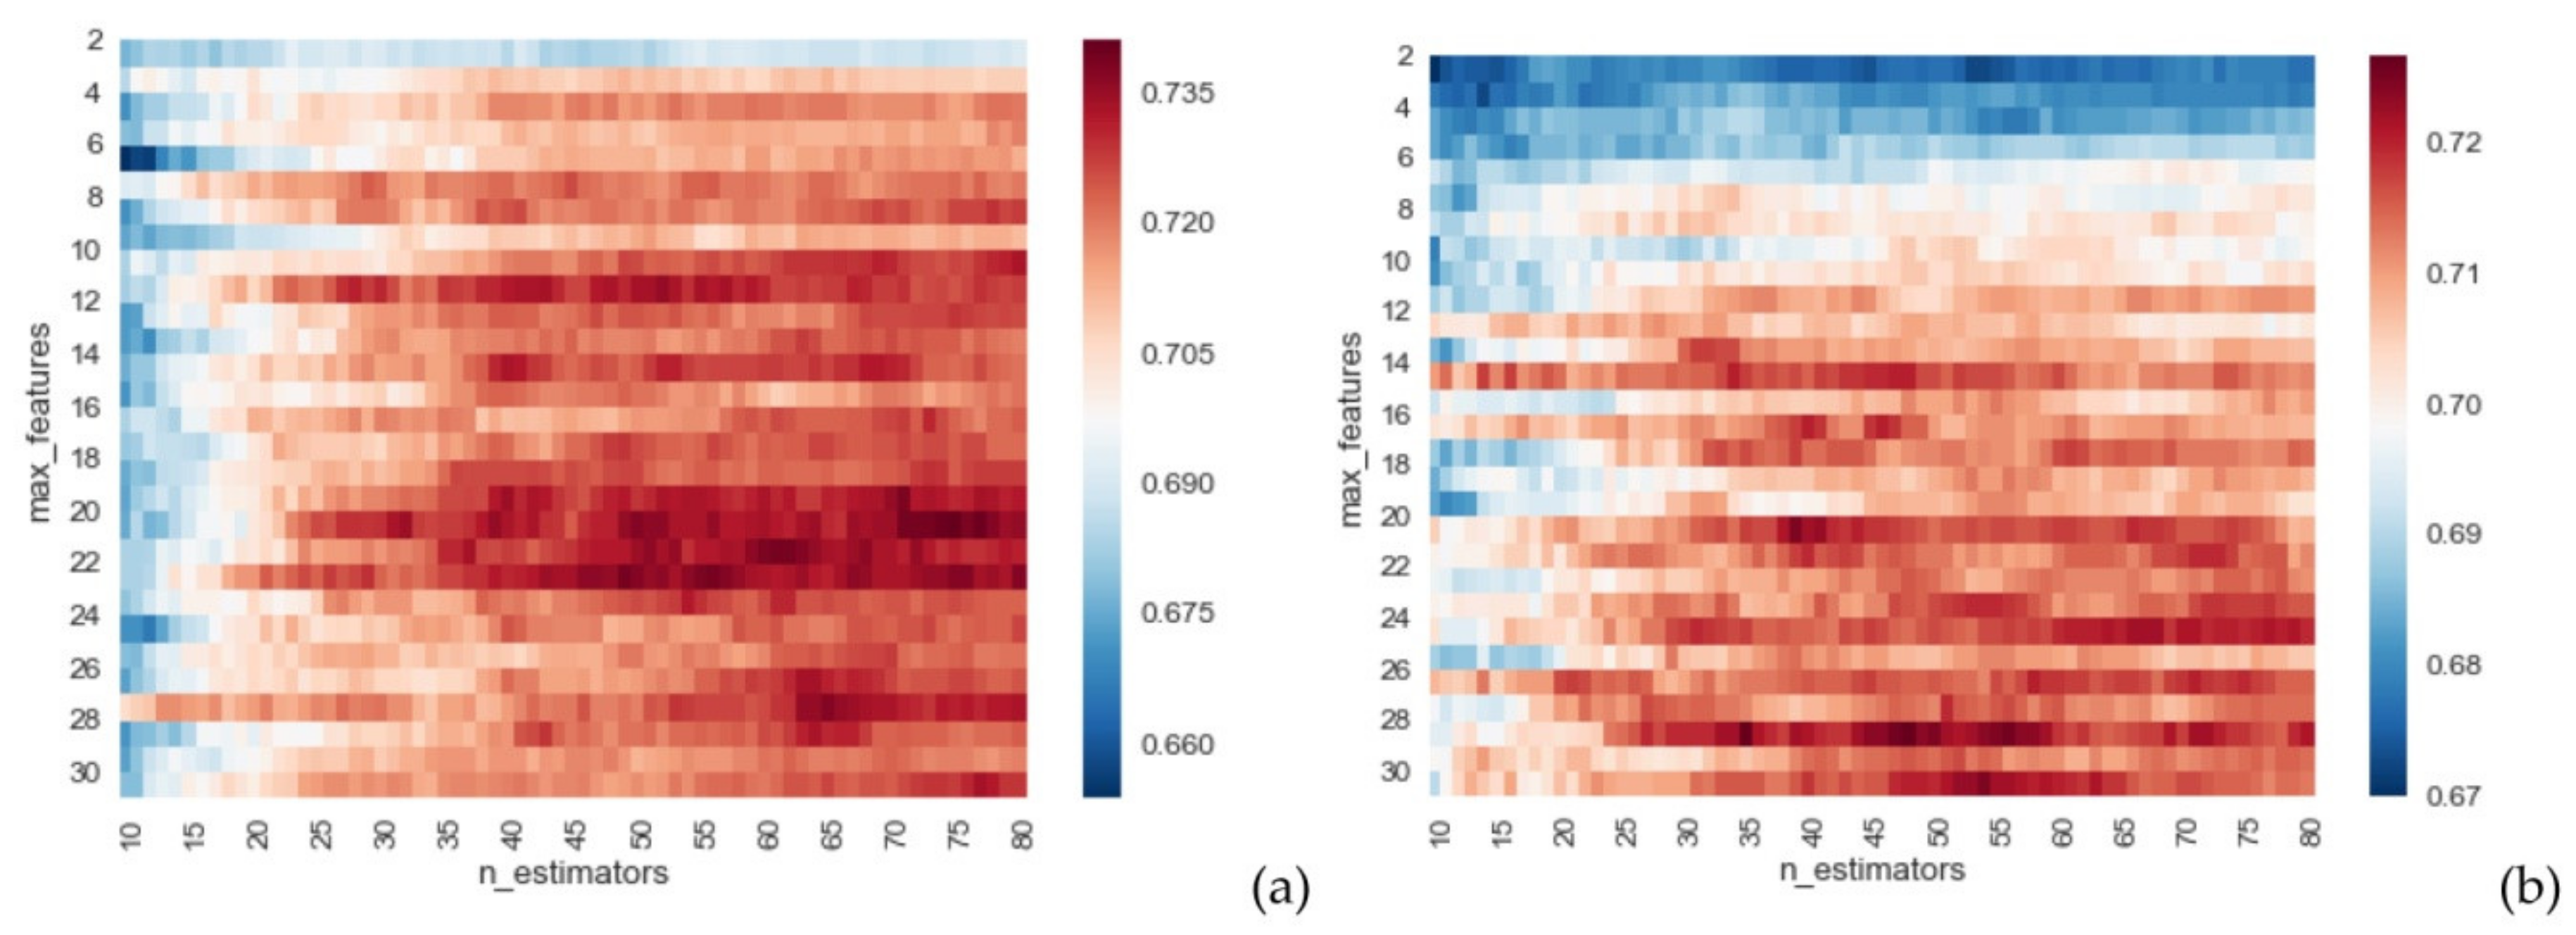
Changchun is the capital city of China’s Jilin Province, which is located in the geographic center of the Northeast China and even the Northeast Asia. As the important part of national Harbin-Changchun urban agglomeration, the development and construction of the city requires the support of urban land use data. On the basis of RF, this paper attempts to integrate remote sensing data, street view data, POI, and night light data to establish a classification method for mapping urban land use in Changchun city. Morever, we aim to assess the classification accuracies with and without street view features, and quantify the contribution of different features or combinations in the classification. This research can provide reference for urban multi-source data fusion, enrich urban feature indicators, and improve the accuracy of urban land use classification, as well as provide a technical route for management departments, scholars, and relevant consulting companies to obtain urban land use data, especially for regional research or comparative study between cities.

2. Study Area and Data

2.1. Study Area

The city of Changchun (43°14′–44°05′ N, 125°03′–126°00′ E) is a regional transportation hub with convenient transportation conditions. Changchun plays an important role in the provincial economy [34]. The downtown area, or named central urban area of Changchun, is the scope of land allowed for urban construction in the current urban master plan. It is a concentrated distribution area carrying the urban functions. According to the remote sensing image of Google Earth platform, the downtown area was selected as the study area, and the maximum range of urban land boundary was determined combined with the road network (Figure 1).

2.2. Data Collection and Preprocessing

2.2.1. OpenStreetMap

In this study, road data of OSM were used to delineate the boundaries of urban parcels and to provide the spatial location of the street view data. OSM data are made available for reuse under the Open Database License (ODbL) share-alike license for data. The OSM data used in this study were in 2016, and were processed in the following ways. First, expressways, primary roads, secondary roads, and residential roads were extracted according to the attribute information of the road network. Second, a buffer was built according to the road level to generate the road area for the segmentation of urban parcels, while the buffer distance was set to 21, 21, 14, and 7 m according to the number of lanes and the width of lane. Third, the road buffer data in vector format were converted into raster format, and the road centerline was obtained by the ArcGIS vectorization tool (Figure 2).

2.2.2. Street View Images

The density tool of ArcGIS was used to generate nodes on the road with an interval of 50 m, and the node coordinates were taken as the sampling position of street view. Finally, a total of 24,520 points were obtained. The Baidu and Tencent are the two major street view providers in China, and the data can be obtained through the application program interface (API). Users can directly use the service under the condition of following the Baidu Map API service terms (http://lbsyun.baidu.com/index.php?title=open/law) and Tencent location service open API service protocol (https://lbs.qq.com/terms.html). Users need to apply for the developer key first. The daily service calls of each key are limited. Users can pay to increase the number of calls. Baidu street view covers more than 95% of China’s cities and more than 3 million kilometers, and its updated frequency is faster than Tencent. Although Google has a large number of street views, their images are not freely available in China. Therefore, this study uses the Baidu street view as the data source. In order to obtain images close to the pedestrians’ visual angle, the vertical angle was set to 0°, which is the state of horizontal observation. The horizontal angle was set at 90° intervals, which were 0, 90, 180, and 270°, respectively (Figure 3) [35]. In order to avoid image distortion caused by a too large field angle, the field angle was set to 90°. The street view images in the study area were taken in May 2014, April 2016, and June 2017, corresponding to spring, with little difference in vegetation greening characteristics. Considering the different data update frequency, the date of other data was based on the street view.

2.2.3. POI Dataset

POI data were generated for navigation application, referring to the point representation of geographical entities in space. The POI dataset records a large amount of information about the types, names, and spatial locations of places in a comprehensive and detailed way, which is widely used in urban researches [36]. The POI data used in this study were obtained through the Baidu Map API.
The land use classification system used in this study referred to the essential urban land use categories (EULUC) classification system [5], which was adapted from the Chinese Standard of Land Use Classification. Considering the features of park green space, it was regarded as a separate category in the classification of urban functional areas. As for Changchun, most of the urban traffic facilities are parking lots, which support the facilities of residential areas and do not have a separate space. Therefore, this study did not include the traffic category. Then, the POI data were sorted according to the land use classification [5,6] (Table 1). A total of 25,094 points were obtained.

2.2.4. Luojia-1 Nighttime Light Data

Nighttime light data provide an effective analysis perspective for measuring the intensity of urban social and economic activities. The Luojia-1 satellite launched on 2 June, 2018 and can provide nighttime light data with a resolution of 130 m [37,38]. Nighttime light data, acquired in 31 August, 2018, were downloaded from the website http://59.175.109.173:8888/. Users can register an account on the website and apply for data download under the condition of following the usage method of Luojia-1 nighttime light data (http://www.hbeos.org.cn/xwzx/2/2018-07-09/363.html).

2.2.5. Sentinel-2A Remote Sensing Images

The Sentinel-2 satellites of Sentinel-2A and Sentinel-2B are two similar satellites with high spatial and multispectral resolution. The level L1C images of sentinel-2A can be freely downloaded from the website https://scihub.copernicus.eu/. The Copernicus Open Access Hub (previously known as Sentinels Scientific Data Hub) provides complete, free, and open accessibility to Sentinel-2 user products. This level of image denotes that the product of top-of-atmosphere (TOA) reflectance have performed radiometric and geometric corrections. Therefore, the Sen2cor module of the sentinel application platform (SNAP) software was used for atmospheric correction to obtain corrected bottom-of-atmosphere (BOA) reflectance values. Sentinel-2A satellite provides 13 spectral bands at various spatial resolutions [39,40,41]. In this study, the used image was taken on 28 October, 2016, and the near-infrared, red, and mid-infrared bands with a spatial resolution of 10, 10, and 20 m, respectively, were used to calculate the texture features, the normalized difference vegetation index (NDVI), and the normalized difference built-up index (NDBI) [42].

2.2.6. Survey Data for Urban Land Use

In this study, the current construction land survey data of Changchun City Planning Department in 2016 was used to label the urban land use and verify the classification results. Its classification system is an objective description and summary of land attributes and characteristics, with strong subjective desires and purposes [43]. This dataset reflects the socio-economic functional attributes of land, separated into eight categories including residential, administration and public service, commercial and business facilities, industrial and manufacturing, road and transportation, municipal utilities, green space and square, and logistics and warehouse. ArcGIS software was used for overlay analysis, and the area of different land use type in each parcel was obtained. The land use attribute with the largest proportion of area was regarded as the land use category of the urban parcel.

3. Methodology

The research work included three main parts. First, the road area obtained from OSM preprocessing was used to determine the scope of urban parcels through overlay analysis (for more details see Section 2.2.1. and previous publications [3,5]). Second, based on the semantic segmentation of street view, the features from POI data, Luojia-1 nighttime light data, and Sentinel-2A were constructed to describe the parcels. In the third step, the urban parcels were divided into two sections, namely, a training sample and a test sample, which were used for model training and testing, respectively. The land use of the urban parcels was predicted according to the optimized model, then the producer accuracy (PA) and the overall accuracy (OA) were used to evaluate the classification accuracy (Figure 4). Street view segmentation code (segmentation of street view.py), RF tunning code (random forest.py), and examples of urban parcels and related features (samples of input data.xls) are available in the Supplementary Materials Section.

3.1. Semantic Recognition of Street View Images

Semantic segmentation technology is a very important field in computer vision technology, and its goal is to assign the object category to each pixel in an image. Deep learning is an effective method in semantic segmentation, but the training of a model depends on a large number of datasets [44]. The Cityscapes dataset is an urban street view segmentation dataset designed for automatic driving applications, which includes different cities, seasons, and weather environments. All pixels of an image are divided into 19 elements, including vegetation, sky, roads, and buildings. Cityscapes provide a good foundation for street view semantic segmentation. DeepLab, developed by Google and based on convolutional neural network (CNN), is an advanced algorithm in the field of semantic segmentation of images [45,46]. In this study, DeepLab pre-trained on Cityscape data was used for the street view segmentation (https://github.com/tensorflow/models), and the area ratio of each element in the image was obtained.

3.2. Feature Construction

3.2.1. Features Constructed According to the Street View Segmentation

Green visual ratio (GVR) refers to the proportion of green plants in the visual field seen by the human eye, which is shown as the proportion of visible green elements in street view images (Equation (1)). It not only objectively reflects the quality of the public environment, but also emphasizes the three-dimensional characteristics of a space. Openness (OP) refers to the proportion of the sky seen by the human eye in the whole picture (Equation (2)) [47]. The enclosure index (Equation (3)) refers to the degree of public space enclosed by buildings, walls, and other structures [48,49]. The walkability index (Equation (4)) is the ratio of pedestrian roads to vehicle roads in a street view image [50].
G V R = i = 1 4 A r e a t r e e i = 1 4 A r e a t o t a l × 100 %
O P = i = 1 4 A r e a s k y i = 1 4 A r e a t o t a l × 100 %
E N C = i = 1 4 A r e a b u i l d i n g i = 1 4 A r e a t o t a l × 100 %
W A L = i = 1 4 A r e a s i d e w a l k i = 1 4 A r e a r o a d × 100 %
where A r e a t r e e , A r e a s k y , A r e a s i d e w a l k , A r e a r o a d , and A r e a b u i l d i n g refer to the areas of green trees, sky, sidewalks, roads, and buildings in a picture, respectively; A r e a t o t a l is the total area of the processed image; and i represents the number of pictures collected at the observation point.
The diversity index (DIV) of street elements is expressed by the Simpson index, which is usually used to measure the richness of an ecosystem [51]. There are great differences in the shape characteristics and colors between streets at different points. The size of the value can reflect the visual complexity and richness of the street space to a certain extent (Equation (5)).
D I V = 1 j = 1 j ( A r e a j j = 1 j A r e a j ) 2
where A r e a j is the proportion of the area of type j in a street view image at a certain point, and j is the total number of all types; the larger the D I V value, the higher the richness of an element.

3.2.2. Features Constructed According to Sentinel-2A Images

The gray level co-occurrence matrix is a common texture analysis method. It is a statistical form of the joint distribution of two gray levels in an image, which can better reflect the correlation law of the gray levels of texture. Haralick et al. extracted 14 features with the gray level co-occurrence matrix [52]. The effectiveness of these features in remote sensing image classification has been evaluated in a large number of studies [53,54]. In this study, the following three indicators were selected to extract the texture features of Sentinel-2A images. Their meanings and formulas are as follows:
Entropy (ENT) measures the randomness of the image texture. When all values in the spatial co-occurrence matrix are equal, ENT reaches the maximum value. On the contrary, if the values in the matrix are very uneven, the ENT value is small (Equation (6)).
E N T = i j p ( i , j ) log p 2 ( i , j )
The angular second moment (ASM) is the sum of the squares of the gray-scale co-occurrence matrix elements, and thus is also called energy, which reflects the uniformity of the gray-scale distribution and texture thickness (Equation (7)). If all values of the gray level co-occurrence matrix are equal, the ASM is small, the image texture is fine, and the energy is low. If some values are large and others are small, the ASM is large, the image texture is thick, and the energy is high.
A S M = i j P ( i , j ) 2
Correlation (COR) measures the similarity of the spatial gray level co-occurrence matrix elements in rows or columns. As Equation (8), the correlation value reflects the local gray level correlation in an image. When the element values of the matrix are even and equal, the correlation value is larger. On the contrary, if the pixel values of the matrix are very different, the correlation value is smaller.
C O R = i j ( i , j ) P ( i , j ) μ x μ y / σ x σ y
Based on Sentinel-2A band 8, 4, and 11, the above texture feature values were calculated, and the mean and standard deviation were obtained by taking the parcel as a unit.
The NDVI value, calculated by the spectral contrast of green plant leaves in red and near-infrared bands (Equation (9)), can fully reflect the condition of vegetation on the ground, and is one of the most widely used vegetation indices [42,55]. A positive NDVI value indicates vegetation coverage and increases with the increase in coverage. The NDBI, estimated using Equation (10), represents the distribution of construction land. An NDBI value greater than or equal to 0 indicates that the ground is covered by buildings or bare land [56].
N D V I = B n i r B r e d B n i r + B r e d
N D B I = B m i r B n i r B m i r + B n i r
where B n i r , B r e d , and B m i r refer to the reflectance of the near-infrared, red, and mid-infrared bands, respectively, corresponding to bands 8, 4, and 11 of Sentinel-2A.

3.2.3. Features Constructed According to POI

The urban land use category in this study refers to the dominant urban land use of an urban parcel. In fact, within an urban land use, there are often different types of functions. The total number of POI, the number of POI types, and the proportion of each type within an urban parcel were calculated in this study.
In addition, the spatial distribution of the POI of each type was obtained by using kernel density (KDE), and then the mean value of the POI density of each type in an urban parcel was calculated. KDE is an effective spatial interpolation method used to calculate the density of a continuous surface by using the kernel function superposed at each location (Equation (11)). It describes the spatial distribution characteristics of the events or objects according to the determination of the spatial location and relationship of the events or objects [55,56,57,58]. In the process of analyzing the spatial distribution of a POI, KDE was measured by Euclidean distance. With an increase in the distance from a POI point, the calculated continuous surface value gradually decreases.
f ( x , y ) = 1 n h 2 i = 1 n K ( d i n )
where f ( x , y ) is the estimated KDE at the position, n is the number of observation points, h is the bandwidth parameter, K is the kernel function, and d i represents the distance from the position to the observation position i .
According to the original data and the results of the analysis of street view, Luojia-1, Baidu POI, and Sentinel-2A, 70 features were constructed to describe the urban parcels (Table 2).

3.3. Developing of the RF Model

Bagging or bootstrap aggregating was used to generate the random forest, which changes the sample distribution of the data used in the model, introduces noise, and increases the generalization ability of the model. All the data to be trained are put into a black box, and then some of the data are randomly selected from the bag to train a model [59]. In addition, each tree grows completely without pruning. When the tree has finished growing, the variables of each node are only generated in a few randomly selected variables. That is to say, the used instances and variables are randomized. This double random process does not easily succumb to overfitting. The final decision tree is generated by voting on the potential random tree, that is, the random forest selection classification with the most votes [60]. The RF model is insensitive to multicollinearity and can effectively prevent over fitting in the lower scale process, and the prediction results of the algorithm are robust for missing data and unbalanced data, and can produce high accuracy classifiers for a variety of observation data [61]. It is applicable to the prediction of multiple urban land use in the case of no balanced sample.
When training samples are fixed, there are two main factors affecting the accuracy of RF classification, including the number of features (max_features) randomly selected to generate a decision tree and the number of decision trees (n_estimators). The number of features is related to the ability of the decision tree and the correlation between decision trees. A smaller max_features value generally reduces the performance of the model because there are fewer choices to be considered on each node. There is a tendency to reduce the ability of the RF classifiers. However, the smaller the correlation between decision trees, the stronger the ability of the classifier [33]. The prediction accuracy of out-of-bag samples (OOB_SCORE) can be used to estimate the performance of the model. In other words, the prediction accuracy of the unselected sample set is used to verify the performance of the model [62]. The higher the value, the more reliable the model [63,64]. In this study, scikit-learn was used to determine the optimal parameters according to the OOB_SCORE value calculated by the parameter cycle.

4. Results

4.1. Street View Segmentation

Through the street view semantic segmentation, each element in the image was obtained, and the proportion of each element in the image was calculated according to the number of pixels, which was used to construct the streetscape features (Figure 5). In terms of the proportion of street view elements in the study area, the top four are sky, roads, buildings, and vegetation, accounting for 25.09%, 20.89%, 16.96%, and 16.96%, respectively (Table 3).
Based on the distribution of the spatial street view elements, there is a correlation between the street view and the land use. Compared to the known land use in Changchun, it can be seen that the spatial distribution of the building elements in green space shows a lower value, while the spatial distribution of vegetation shows a higher value. In addition, it can also be seen that urban areas in different construction years show obvious spatial heterogeneity due to different urban planning concepts and urban construction technologies. In the third ring road area of Changchun, the time of urban construction is earlier, the road network is dense, the road width is small, and the building height is low. Accordingly, the spatial distribution of the sky shows a lower value, and that of the buildings shows a higher value. However, the completion time of urban construction outside of the third ring road is relatively late, which shows the opposite characteristics (Figure 6).

4.2. Parameter Optimization of the RF Model

In this study, the optimal RF model and its prediction accuracy were compared under two conditions, i.e., street view feature participation (S1) and no street view feature participation (S2). In the case of S1, the maximum OOB_SCORE value is 0.741, and the corresponding max_features and n_estimators values are 20 and 75, respectively. In the absence of street view features, the maximum OOB_SCORE is 0.727, and the corresponding max_features and n_estimators values are 28 and 35, respectively. It can be seen from Figure 7 that in the case of using the same random forest tree without the participation of streetscape features, participation of more features is needed in the construction of the model in order to obtain a similar prediction accuracy.
The optimal model obtained by training was used to predict the samples. With the participation of street view features, the recognition accuracy of public land and green space was effectively improved by 50% and 40%, respectively (Table 4 and Table 5).
In addition, the importance of each feature in the model was calculated by using the method of average impurity reduction [65,66]. The contribution of street view features to the model was 20.7%, and that of Sentinel-2A image features was 41.24% (Table 6). The most important features of the POI features were the “proportion of residential points” (Pro_Res), the “proportion of educational points” (Pro_Edu), and the “density of residential points” (Dens_Res). The actual functions of these three types of areas were relatively singular, and the degree of mixing of the POI types within these urban parcels was low, which is very representative of the function of urban parcels. In the street view features, the top two contributions were the “average value of building elements” (M_Buil) and the “standard deviation of GVR” (Std_GVR). Based on the degree of the dispersion of the contribution, the degree of the contribution of the POI characteristics is uneven (Figure 8). Generally, the contribution of the POI kernel density characteristics was higher than the contribution of the POI proportion characteristics. However, the contribution of the street view features was relatively stable, and the standard deviation was small.

4.3. Results of the Urban Land Use Classification

According to the trained model, the land use of all urban parcels were predicted, and a land use distribution map of the urban parcels within the downtown area of Changchun was obtained (Figure 9). The overall accuracy of the classification was up to 91.80%. Urban parcels whose predicted land use was different from the actual dominant land use category were concentrated in the southwest, middle, and north of the study area, while the prediction was good in the southeast and south of the study area. The reason lies in the late completion of the construction in the southeastern and southern areas of Changchun. The urban planning and management of the southeastern and southern areas are relatively perfect. Thus, the actual land use of the urban parcels is consistent with their planned land use. The southwest and central regions were built earlier, with a large number of historical buildings in these regions. However, the functions of the above-ground buildings have changed, and so the land use of the urban parcels is different from the original planning (Figure 10). Therefore, it is possible to improve the prediction accuracy by obtaining urban construction data across different years.

5. Discussion

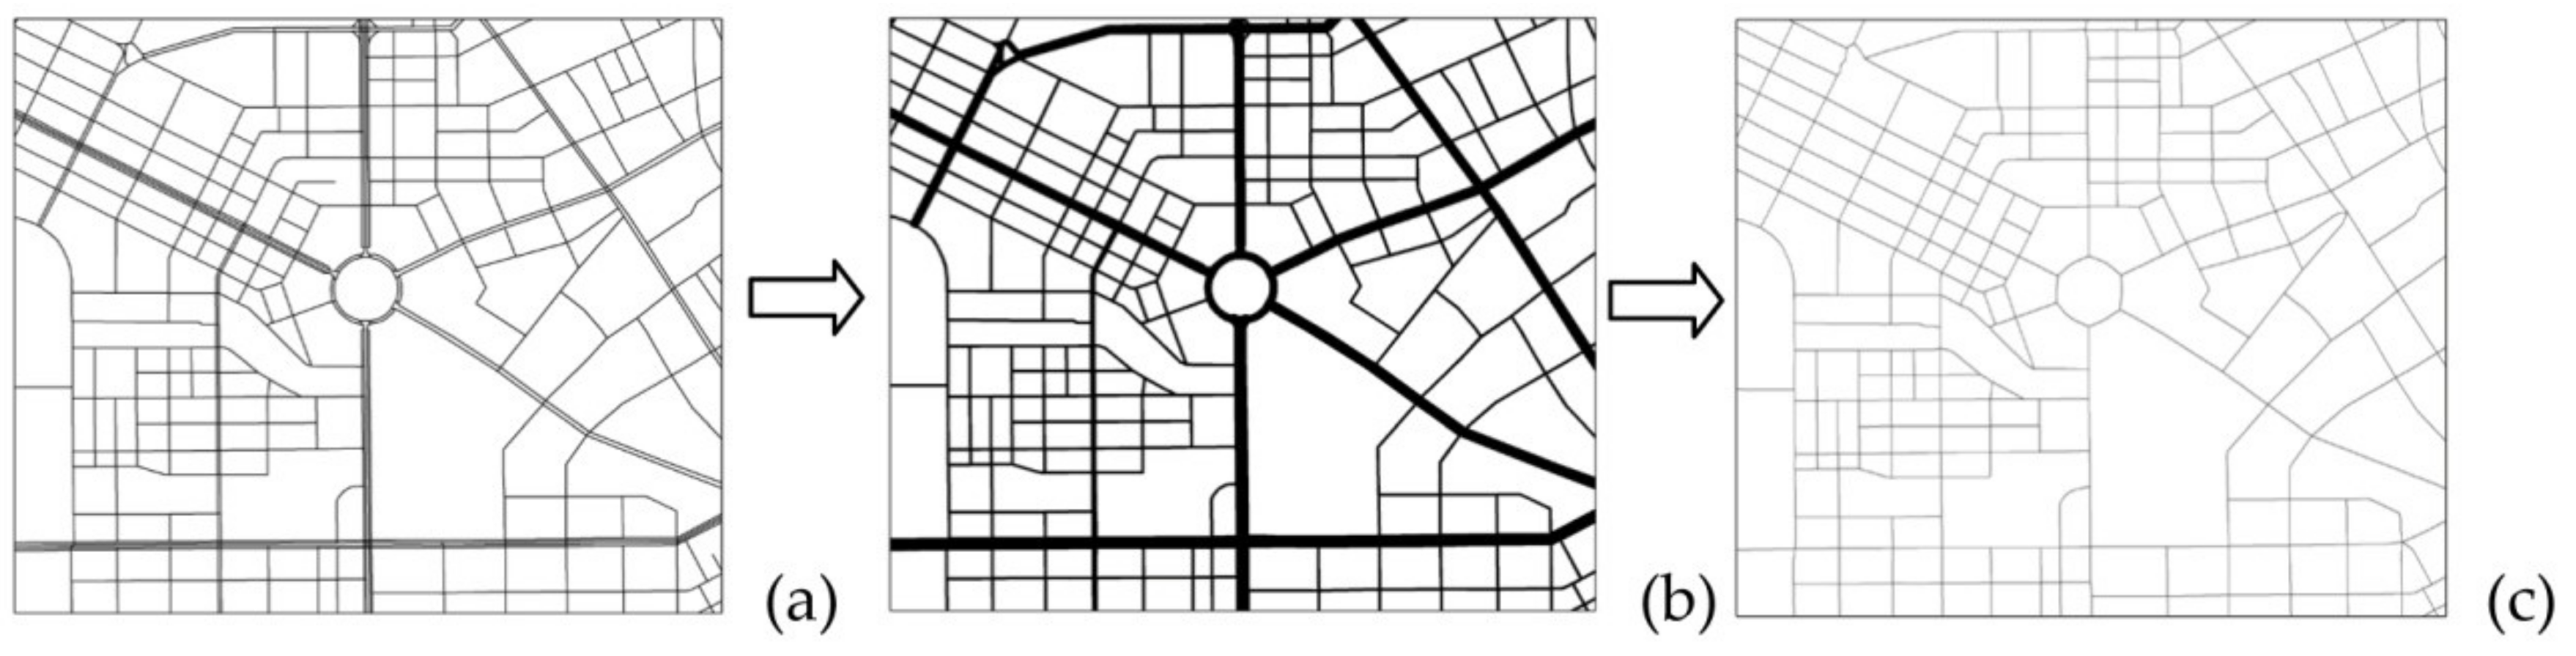
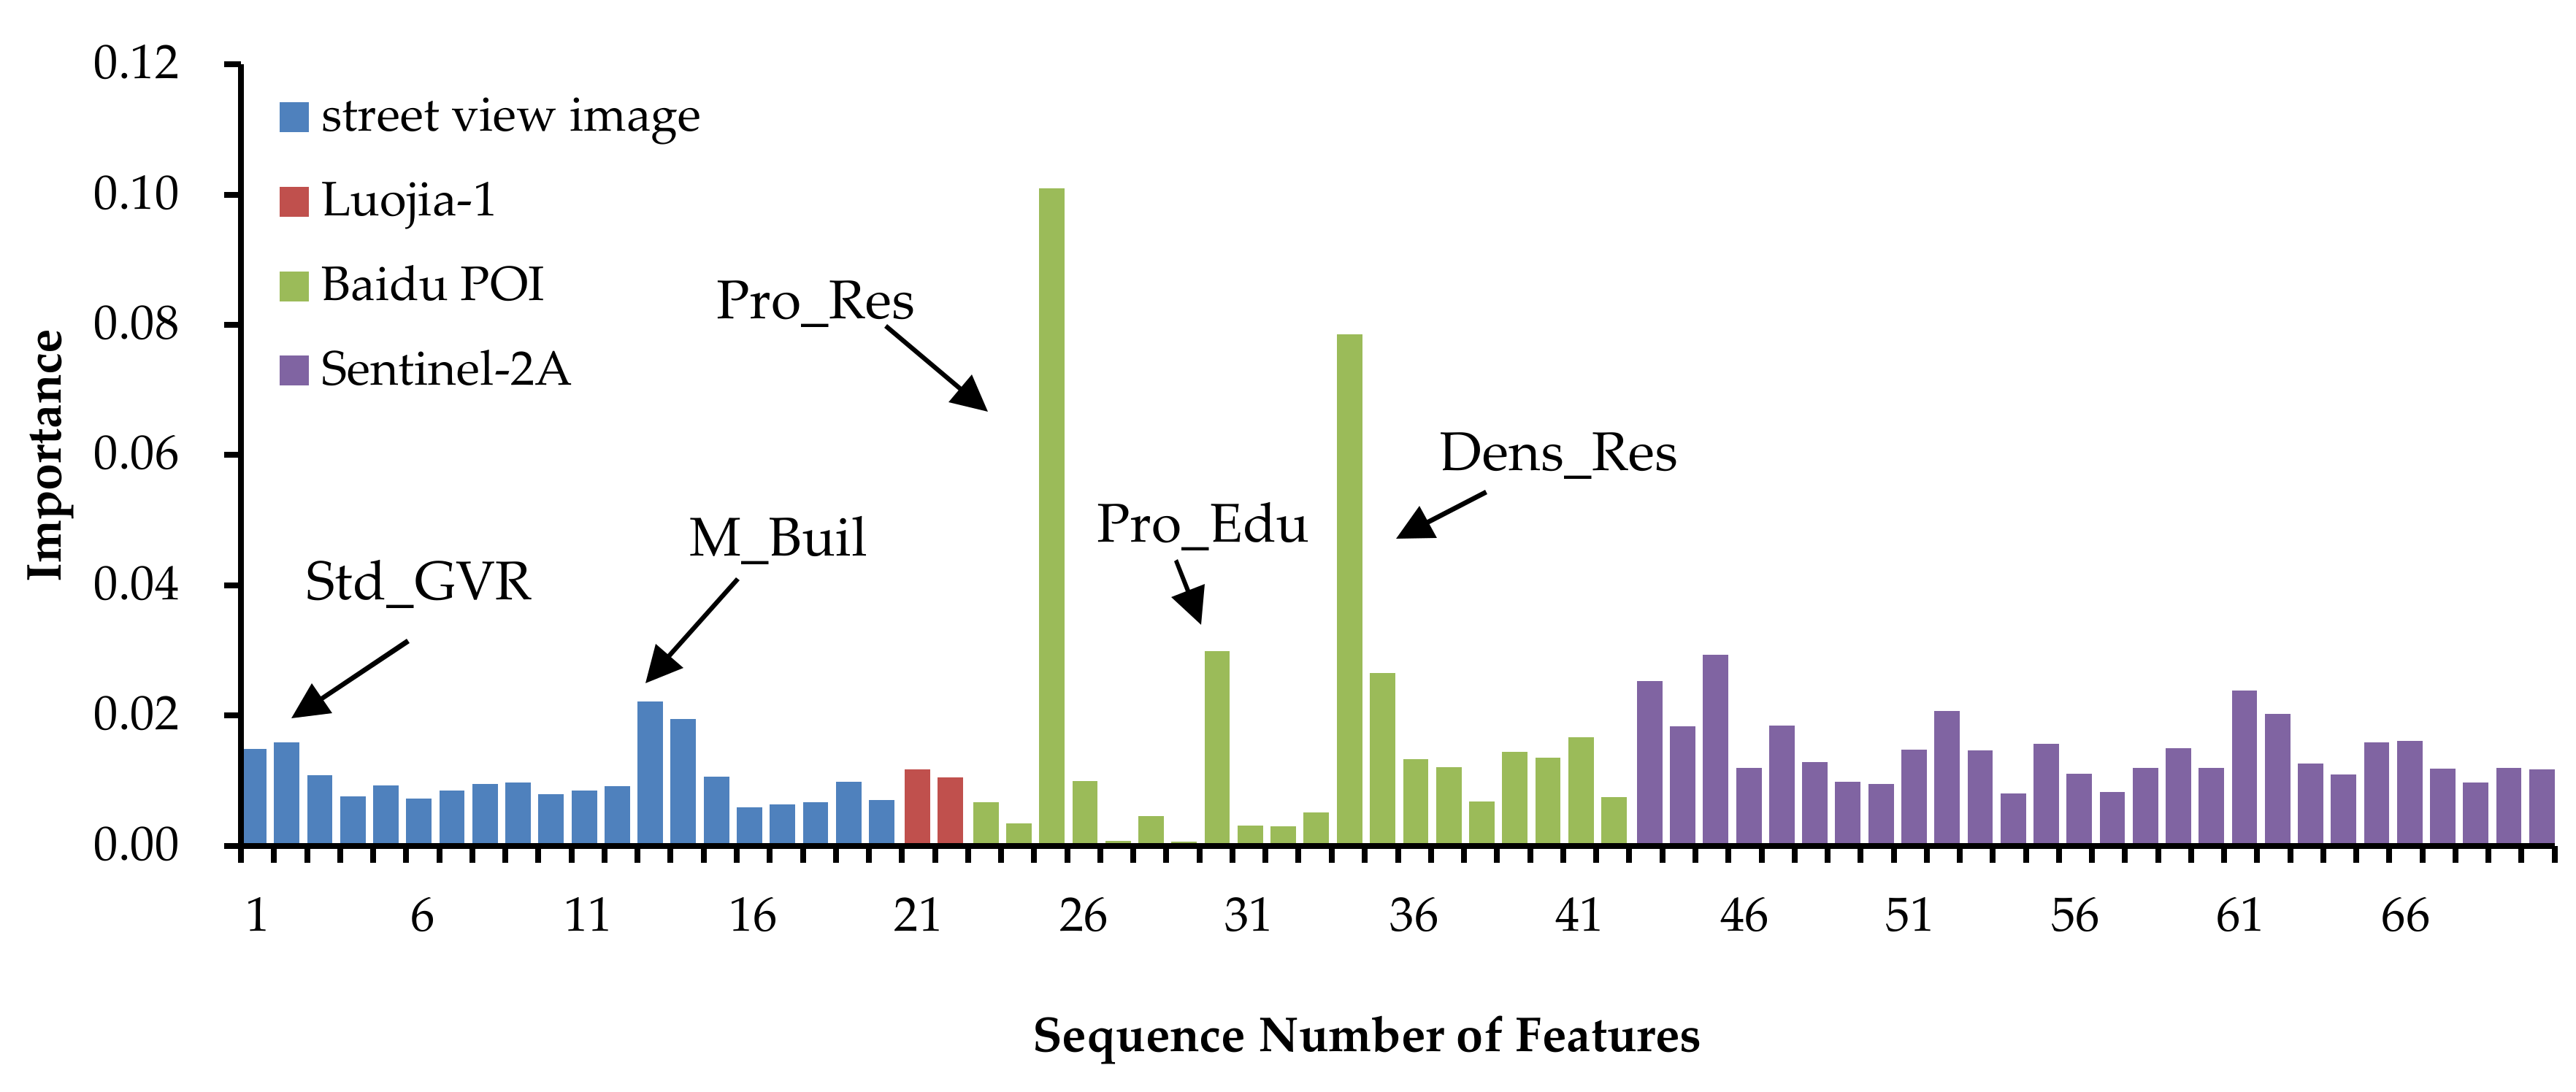
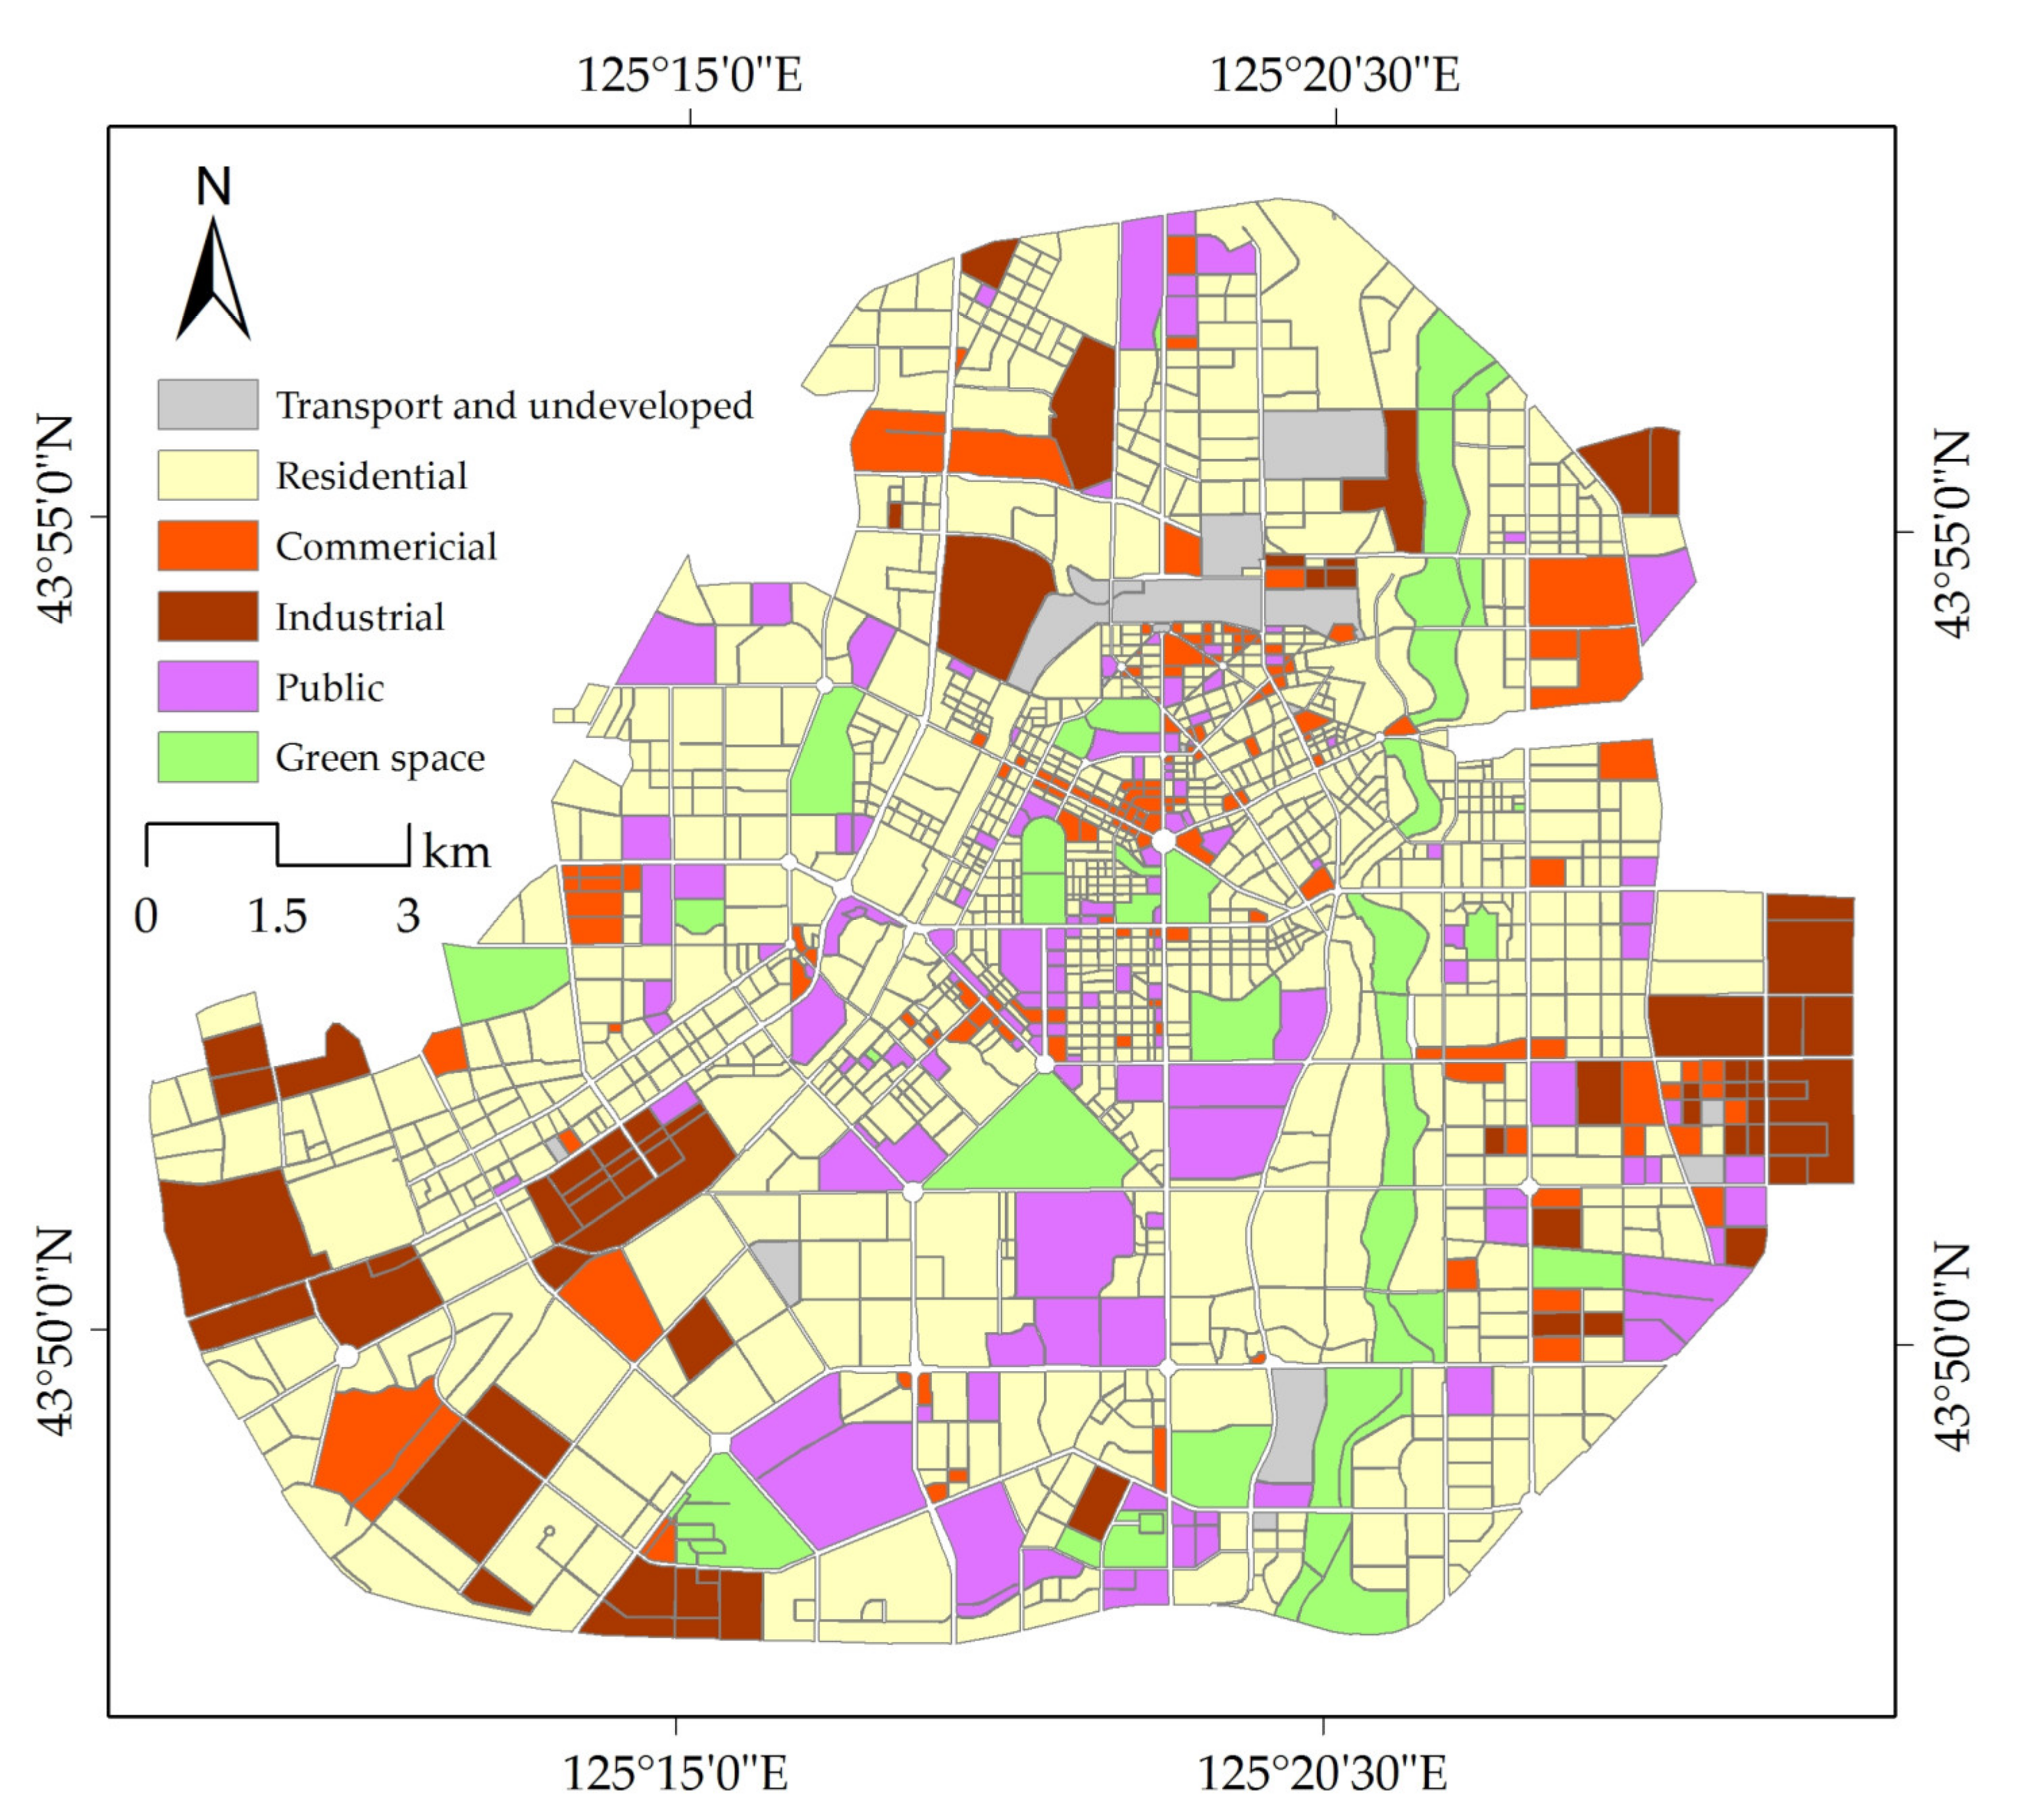
In this study, OSM was combined to delimit boundaries of urban parcels. The results of the urban street view semantic segmentation were applied to enrich the multi-dimensional description of urban parcels, and RF was used to identify the land use of the urban parcels. The results show that based on the spatial distribution characteristics, the street view elements were related to urban functions, and it is reasonable and feasible to describe an urban parcel according to characteristics of the street view elements. The contribution of the street view characteristics to the optimal model reached 20.6%. The mixing of the land use of urban parcels is an important obstacle to accurate identification of urban land use [67]. The accuracy of identification is related to the purity of the urban parcel. The results in this study show that the purity of residential land, industrial land, and green land is high, and thus the accuracies of their classifications are high. The land use type recorded in the survey data of the current construction land survey data of Changchun City is pure. The parcels of this data are finer than those divided by OSM, but there are no strict rules for their boundaries. There may be no roads or spaces between different functional parcels. At present, OSM is still a widely used data for segmentation, and the urban parcel boundary obtained is relatively regular, which conforms to the actual coverage of urban parcel [67,68].
POI data used in this study were obtained from commercial companies. The original goal of the data was to serve navigation. The type of POI does not exactly correspond to the land use of urban parcels. For example, the POI of medical facilities include clinics and pharmacies, but these facilities do not occupy separate land. Only specialized hospitals and large hospitals have independent land. Therefore, the POI data were filtered in the data preprocessing stage, and the POI characteristics contributed a lot to the accurate identification of urban parcels with independent land, such as residential and educational parcels, but not to other functional parcels. In the future, the introduction of a toponymic database managed by the government should be considered.
Street view can supplement the social attribute information of an urban parcel from the perspective of ground observation [69]. Street view complements the lack of ground detail in top view images and provides useful auxiliary information to be transmitted to remote sensing images for improving performance [26]. It can be seen that the introduction of street view effectively improves the accuracy of the urban land use classification of public service-type parcels, which are typically small with but with a high degree of mixing, and are difficult to identify. Street view images contain rich information, which need to be further explored [
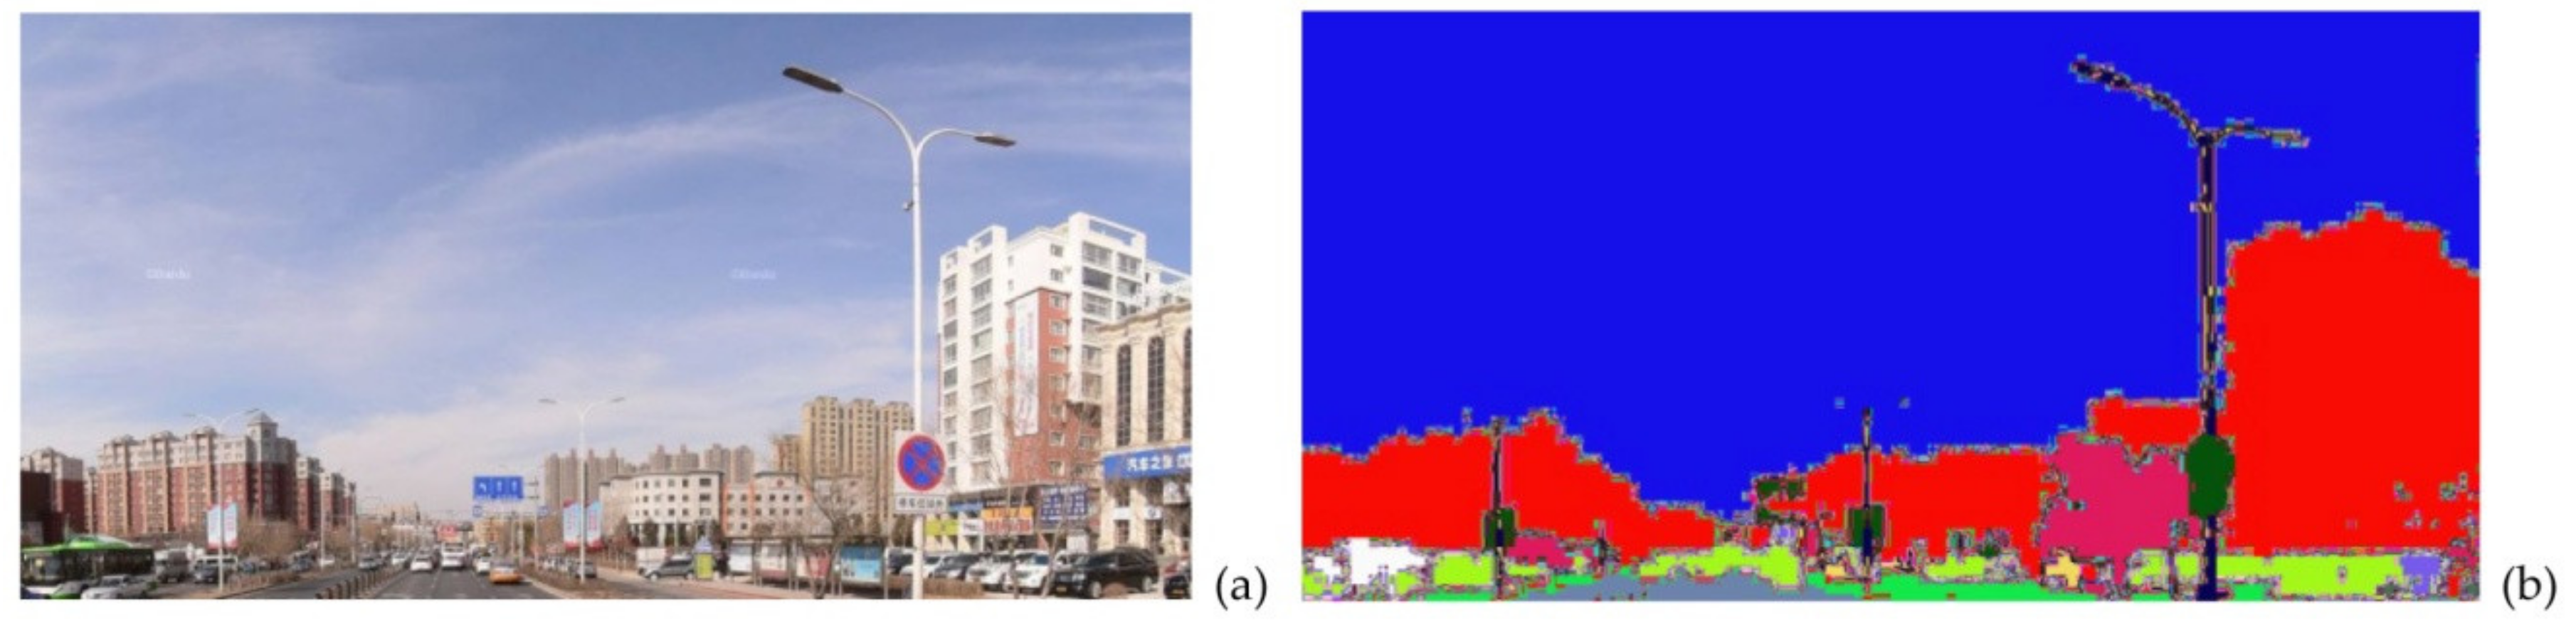
70,71]. The street view segmentation model used in this study was trained on the dataset of CityScapes. We need to identify the elements in the picture, and then establish features to identify urban land use type. It makes sense to build dataset directly related to urban land use in the future, although it is a complex and onerous task. For example, by collecting street view data and adding corresponding land use tags, combined with deep learning technology, it can be used to predict urban land use directly through pictures. Such a dataset would be helpful to improve the efficiency of the land use identification of urban parcels, and to provide convenience for street view applications in other cities.

6. Conclusions

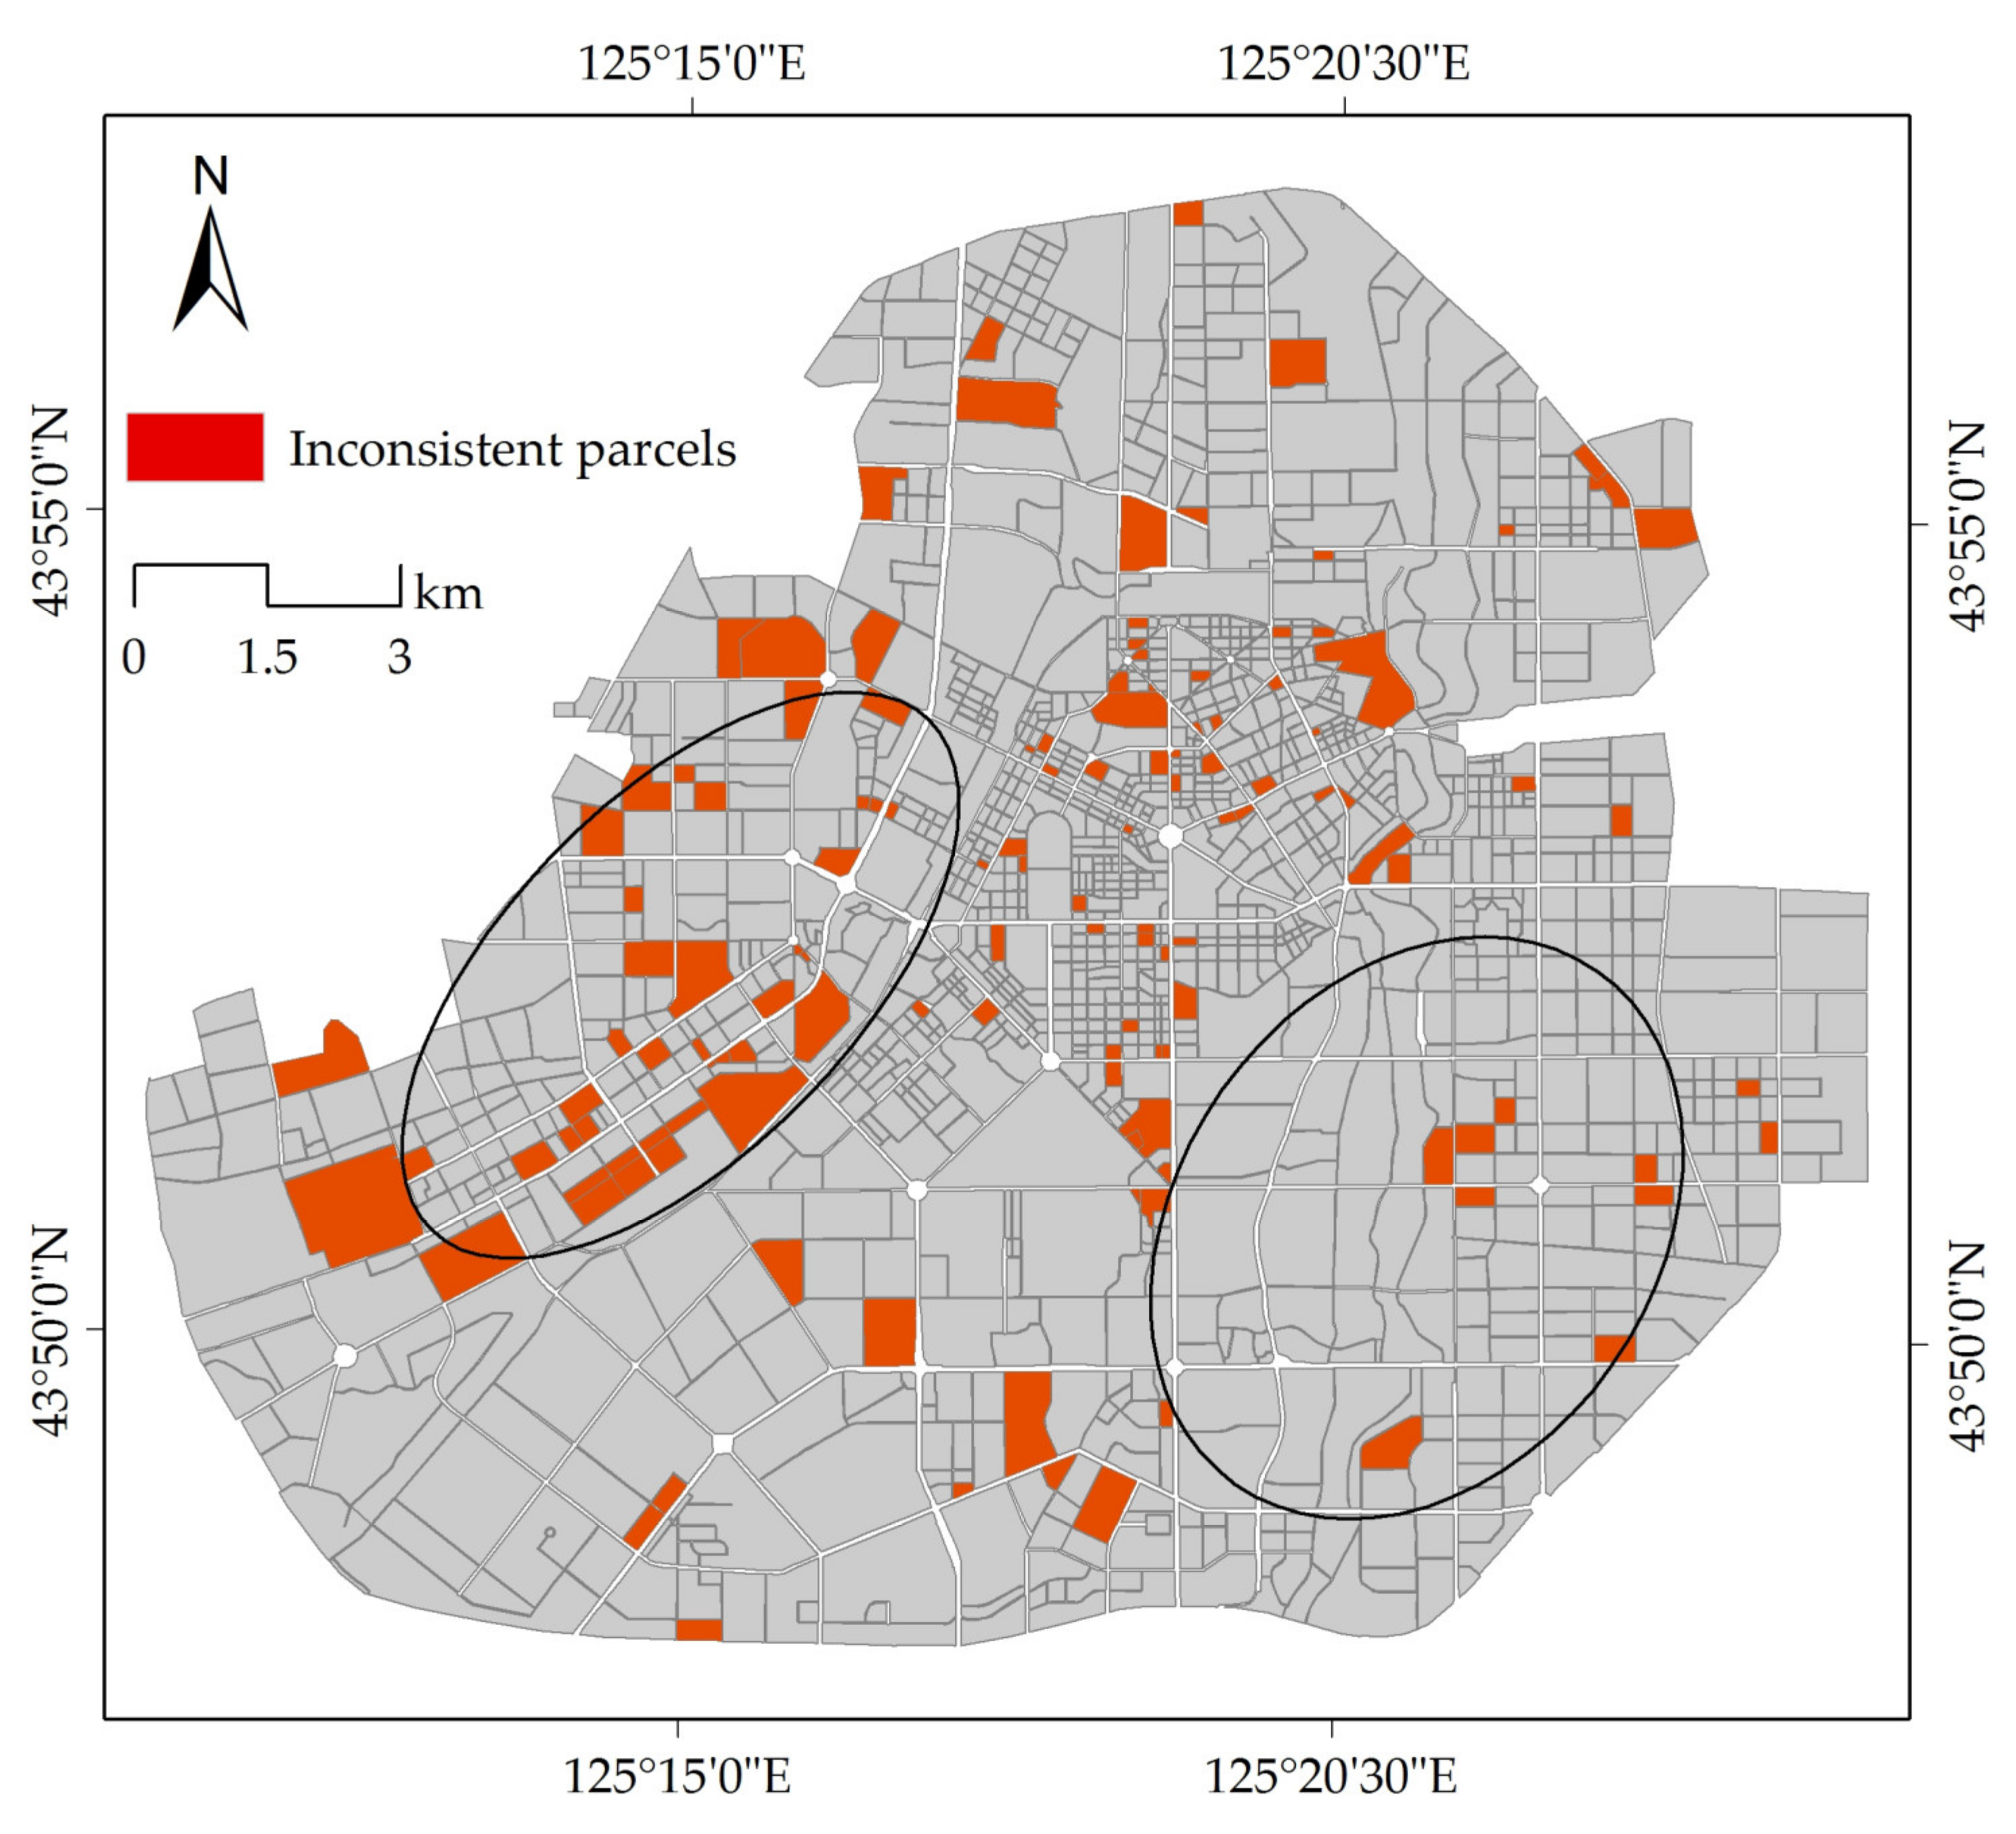
Given the need of urban land use classification and the new data environment, this study applied street view data, aiming to provide reference for urban multi-source data fusion, enrich urban characteristic indicators, and provide new ideas to improve the accuracy of urban land use classification. The street view features showed better performance compared to the POI characteristics. The prediction accuracy of the area built later was higher. Since the building function in the area built earlier has changed, its street view features can not effectively express its existing functions. If the study area is divided into different areas according to the construction time, and then the urban land use prediction is carried out separately, the higher accuracy could be obtained.
Although this study attempted to impove the classification of urban land use, there are still problems in this process that need further study. First of all, urban parcels delimited by OSM have mixed land use. The land use of the parcel was determined by the actual construction land type with the largest area proportion, while urban parcels have three-dimensional characteristics. The actual use is related to the building area and the business characteristics, and thus the classification system of urban land use needs to be improved. With the emergence of spatiotemporal big data, it is necessary to introduce human activity big data with finer time and spatial resolution.

Supplementary Materials

The following are available online at https://0-www-mdpi-com.brum.beds.ac.uk/2072-4292/12/15/2488/s1, Samples of input data.xls: Examples of urban parcels and related features; Random Forest.py: Code for RF tunning; Segmentation of street view.py: Street view segmentation code based on pre-trained DeepLab model.

Author Contributions

S.C., D.M., and Z.W. designed the paper; K.G. contributed to data collection; S.C. and D.M. analyzed the data and wrote the paper; M.J. and C.C. provided suggestions to improve the study and the manuscript. All authors have read and agreed to the published version of the manuscript.

Funding

This study was jointly supported by fundings from the Science and Technology Development Program of Jilin Province (20200301014RQ), the Youth Innovation Promotion Association, Chinese Academy of Sciences (2017277, 2012178), and the National Earth System Science Data Center (www.geodata.cn).

Acknowledgments

The authors would like to thank the anonymous reviewers and handling editors for their constructive comments.

Conflicts of Interest

The authors declare no conflict of interest.

References

  1. Mao, D.; Wang, Z.; Wu, J.; Wu, B.; Zeng, Y.; Song, K.; Yi, K.; Luo, L. China’s wetlands loss to urban expansion. Land Degrad. Dev. 2018, 29, 2644–2657. [Google Scholar] [CrossRef]
  2. O’Sullivan, D. Exploring spatial process dynamics using irregular cellular automation models. Geogr. Anal. 2011, 33, 1–18. [Google Scholar] [CrossRef]
  3. Liu, X.; Long, Y. Automated identification and characterization of parcels with OpenStreetMap and points of interest. Env. Plan. B 2015, 43, 498–510. [Google Scholar] [CrossRef]
  4. Lyu, H.; Lu, H.; Mou, L.; Li, W.; Wright, J.; Li, X.; Li, X.; Zhu, X.X.; Wang, J.; Yu, L.; et al. Long-Term Annual Mapping of Four Cities on Different Continents by Applying a Deep Information Learning Method to Landsat Data. Remote Sens. 2018, 10, 471. [Google Scholar] [CrossRef] [Green Version]
  5. Gong, P.; Chen, B.; Li, X.; Liu, H.; Wang, J.; Bai, Y.; Chen, J.; Chen, X.; Fang, L.; Feng, S.; et al. Mapping essential urban land use categories in China (EULUC-China): Preliminary results for 2018. Sci. Bull. 2019, 65, 182–187. [Google Scholar] [CrossRef] [Green Version]
  6. Tu, Y.; Chen, B.; Zhang, T.; Xu, B. Regional Mapping of Essential Urban Land Use Categories in China: A Segmentation-Based Approach. Remote Sens. 2020, 12, 1058. [Google Scholar] [CrossRef] [Green Version]
  7. Hu, T.; Yang, J.; Li, X.; Gong, P. Mapping Urban Land Use by Using Landsat Images and Open Social Data. Remote Sens. 2016, 8, 151. [Google Scholar] [CrossRef]
  8. Brovelli, M.; Zamboni, G. A new method for the assessment of spatial accuracy and completeness of OpenStreetMap building footprints. Isprs Int. J. Geo-Inf. 2018, 7, 289. [Google Scholar] [CrossRef] [Green Version]
  9. Ghaffarian, S.; Kerle, N.; Pasolli, E.; Jokar Arsanjani, J. Post-Disaster Building Database Updating Using Automated Deep Learning: An Integration of Pre-Disaster OpenStreetMap and Multi-Temporal Satellite Data. Remote Sens. 2019, 11, 2427. [Google Scholar] [CrossRef] [Green Version]
  10. Alhamwi, A.; Medjroubi, W.; Vogt, T.; Agert, C. Development of a gis-based platform for the allocation and optimisation of distributed storage in urban energy systems. Appl. Energy 2019, 251, 113360. [Google Scholar] [CrossRef]
  11. Alhamwi, A.; Medjroubi, W.; Vogt, T.; Agert, C. Openstreetmap data in modelling the urban energy infrastructure: a first assessment and analysis. Energy Procedia 2017, 142, 1968–1976. [Google Scholar] [CrossRef]
  12. Zong, L.; He, S.; Lian, J.; Bie, Q.; Wang, X.; Dong, J.; Xie, Y. Detailed Mapping of Urban Land Use Based on Multi-Source Data: A Case Study of Lanzhou. Remote Sens. 2020, 12, 1987. [Google Scholar] [CrossRef]
  13. Geiss, S.; Leichtle, T.; Wurm, M.; Pelizari, P.; Standfuß, I.; Zhu, X.; So, E.; Siedentop, S.; Esch, T.; Taubenböck, H. Large-Area Characterization of Urban Morphology-Mapping of Built-Up Height and Density Using TanDEM-X and Sentinel-2 Data. IEEE J. Sel. Top. Appl. Earth Obs. Remote Sens. 2019, 12, 2912–2927. [Google Scholar] [CrossRef]
  14. Wu, S.S.; Qiu, X.; Usery, E.L.; Wang, L. Using Geometrical, Textural, and Contextual Information of Land Parcels for Classification of Detailed Urban Land Use. Ann. Assoc. Am. Geogr. 2009, 99, 76–98. [Google Scholar] [CrossRef]
  15. Zhang, X.; Du, S.; Wang, Q. Hierarchical semantic cognition for urban functional zones with VHR satellite images and POI data. Isprs J. Photogramm. Remote Sens. 2017, 132, 170–184. [Google Scholar] [CrossRef]
  16. Hang, Y.; Li, Q.; Tu, W.; Mai, K.; Yao, Y.; Chen, Y. Functional urban land use recognition integrating multi-source geospatial data and cross-correlations. Comput. Env. Urban. Syst. 2019, 78, 1–11. [Google Scholar]
  17. Zhang, Y.; Li, Q.; Huang, H.; Wu, W.; Du, X.; Wang, H. The Combined Use of Remote Sensing and Social Sensing Data in Fine-Grained Urban Land Use Mapping: A Case Study in Beijing, China. Remote Sens. 2017, 9, 865. [Google Scholar] [CrossRef] [Green Version]
  18. Caceres, N.; Wideberg, J.P.; Benitez, F.G. Deriving origin-destination data from a mobile phone network. Iet Intell. Transp. Syst. 2007, 1, 15–26. [Google Scholar] [CrossRef] [Green Version]
  19. Wu, Q.; Zhang, L.; Wu, Z. Identifying city functional areas using taxi trajectory data. J. Geomat. Sci. Technol. 2018, 35, 413–418. [Google Scholar]
  20. Liu, X.; Tian, Y.; Zhang, X.; Wan, Z. Identification of Urban Functional Regions in Chengdu Based on Taxi Trajectory Time Series Data. Isprs Int. J. Geo-Inf. 2020, 9, 158. [Google Scholar] [CrossRef] [Green Version]
  21. Song, J.; Lin, T.; Li, X.; Prishchepov, A. Mapping Urban Functional Zones by Integrating Very High Spatial Resolution Remote Sensing Imagery and Points of Interest: A Case Study of Xiamen, China. Remote Sens. 2018, 10, 1737. [Google Scholar] [CrossRef] [Green Version]
  22. Lu, C.; Pang, M.; Zhang, Y.; Li, H.; Lu, C.; Tang, X.; Cheng, W. Mapping Urban Spatial Structure Based on POI (Point of Interest) Data: A Case Study of the Central City of Lanzhou, China. Isprs Int. J. Geo-Inf. 2020, 9, 92. [Google Scholar] [CrossRef] [Green Version]
  23. Qin, J.; Fang, C.; Wang, Y.; Li, G.; Wang, S. Evaluation of three-dimensional urban expansion: A case study of Yangzhou City, Jiangsu Province. Chin. Geogr. Sci. 2015, 25, 224–236. [Google Scholar] [CrossRef]
  24. Gal, T.; Lindberg, F.; Unger, J. Computing Continuous Sky View Factors Using 3d Urban Raster and Vector Databases: Comparison and Application to Urban Climate. Appl. Clim. 2009, 95, 111–123. [Google Scholar] [CrossRef]
  25. Li, X.; Zhang, C.; Li, W. Building block level urban land-use information retrieval based on Google Street View images. Gisci. Remote Sens. 2017, 1–17. [Google Scholar] [CrossRef]
  26. Cao, R.; Zhu, J.; Tu, W.; Li, Q.; Cao, J.; Liu, B.; Zhang, Q.; Qiu, G. Integrating Aerial and Street View Images for Urban Land Use Classification. Remote Sens. 2018, 10, 1553. [Google Scholar] [CrossRef] [Green Version]
  27. Vahidi, H.; Klinkenberg, B.; Johnson, B.A.; Moskal, L.M.; Yan, W. Mapping the Individual Trees in Urban Orchards by Incorporating Volunteered Geographic Information and Very High Resolution Optical Remotely Sensed Data: A Template Matching-Based Approach. Remote Sens. 2018, 10, 1134. [Google Scholar] [CrossRef] [Green Version]
  28. Blaschke, T.; Hay, G.J.; Weng, Q.; Resch, B. Collective Sensing: Integrating Geospatial Technologies to Understand Urban Systems—An Overview. Remote Sens. 2011, 3, 1743–1776. [Google Scholar] [CrossRef] [Green Version]
  29. Ball, J.E.; Anderson, D.T.; Chan, C.A. Comprehensive Survey of Deep Learning in Remote Sensing: Theories, Tools and Challenges for the Community. J. Appl. Remote. Sens. 2017, 11, 1. [Google Scholar] [CrossRef] [Green Version]
  30. Olden, J.D.; Lawler, J.J.; Poff, N.L. Machine learning methods without tears: a primer for ecologists. Q. Rev. Biol. 2008, 83, 171–193. [Google Scholar] [CrossRef] [Green Version]
  31. Puissant, A.; Rougier, S.; Stumpf, A. Object-oriented mapping of urban trees using random forest classifiers. Int. J. Appl. Earth Obs. 2014, 26, 235–245. [Google Scholar] [CrossRef]
  32. Chen, L.; Wang, Y.; Ren, C.; Zhang, B.; Wang, Z. Optimal Combination of Predictors and Algorithms for Forest Above-Ground Biomass Mapping from Sentinel and SRTM Data. Remote Sens. 2019, 11, 414. [Google Scholar] [CrossRef] [Green Version]
  33. Gislason, P.O.; Benediktsson, J.A.; Sveinsson, J.R. Random Forests for land cover classification. Pattern Recognit. Lett. 2006, 27, 294–300. [Google Scholar] [CrossRef]
  34. Chang, S.; Jiang, Q.; Wang, Z.; Xu, S.; Jia, M. Extraction and Spatial–Temporal Evolution of Urban Fringes: A Case Study of Changchun in Jilin Province, China. Isprs Int. J. Geo-Inf. 2018, 7, 241. [Google Scholar] [CrossRef] [Green Version]
  35. Ye, Y.; Zhang, L.; Yan, W.; Zeng, W. Measuning Street Greening Quality from Humanistic Perspective: A Large-scale Analysis Based on Baidu Street View Images and Machine Learning Algorithms. Landsc. Arch. 2018, 25, 24–29. [Google Scholar]
  36. Deng, Y.; Yan, Y.; Xie, Y.; Xu, J.; Jiang, H.; Chen, R.; Tan, R. Developing Shopping and Dining Walking Indices Using POIs and Remote Sensing Data. Isprs Int. J. Geo-Inf. 2020, 9, 366. [Google Scholar] [CrossRef]
  37. Wang, C.; Chen, Z.; Yang, C.; Li, Q.; Wu, Q.; Wu, J.; Zhang, G.; Yu, B. Analyzing parcel-level relationships between Luojia 1–01 nighttime light intensity and artificial surface features across Shanghai, China: A comparison with NPP-VIIRS data. Int. J. Appl Earth Obs. Geoinf. 2020, 85, 101989. [Google Scholar] [CrossRef]
  38. Li, X.; Zhu, J.; Yin, X.; Yao, C.; Huang, J.; Li, M. Mapping construction land of Guangzhou based on Luojia No.1 nightlight data. J. Geo-Inf. Sci. 2019, 21, 1802–1810. [Google Scholar]
  39. Pádua, L.; Guimarães, N.; Adão, T.; Sousa, A.; Peres, E.; Sousa, J.J. Effectiveness of Sentinel-2 in Multi-Temporal Post-Fire Monitoring When Compared with UAV Imagery. Isprs Int. J. Geo-Inf. 2020, 9, 225. [Google Scholar] [CrossRef] [Green Version]
  40. Huang, C.; Zhang, C.; He, Y.; Liu, Q.; Li, H.; Su, F.; Liu, G.; Bridhikitti, A. Land Cover Mapping in Cloud-Prone Tropical Areas Using Sentinel-2 Data: Integrating Spectral Features with NDVI Temporal Dynamics. Remote Sens. 2020, 12, 1163. [Google Scholar] [CrossRef] [Green Version]
  41. Jia, M.; Wang, Z.; Wang, C.; Mao, D.; Zhang, Y. A New Vegetation Index to Detect Periodically Submerged Mangrove Forest Using Single-Tide Sentinel-2 Imagery. Remote Sens. 2019, 11, 2043. [Google Scholar] [CrossRef] [Green Version]
  42. Mao, D.; Wang, Z.; Du, B.; Li, L.; Tian, Y.; Jia, M.; Zeng, Y.; Song, K.; Jiang, M.; Wang, Y. National wetland mapping in China: A new product resulting from object-based and hierarchical classification of Landsat 8 OLI images. Isprs J. Photogramm. Remote Sens. 2020, 164, 11–25. [Google Scholar] [CrossRef]
  43. Xue, H.; Zhang, W.; Chen, H.; Chi, S. Comparative analysis of new and old “Code for classification of urban land use and planing standards of development land”. Mod. Urban. Res. 2015, 11, 75–81. [Google Scholar]
  44. Cordts, M.; Omran, M.; Ramos, S.; Rehfeld, T.; Enzweiler, M.; Benenson, R.; Franke, U.; Roth, S.; Schiele, B. The cityscapes dataset for semantic urban scene understanding. Proc. IEEE Conf. Comput. Vison Pattern Recognit. 2016, 3213–3223. [Google Scholar]
  45. Huang, L.; Liu, L.; Jiang, L.; Zhang, T. Automatic Mapping of Thermokarst Landforms from Remote Sensing Images Using Deep Learning: A Case Study in the Northeastern Tibetan Plateau. Remote Sens. 2018, 10, 2067. [Google Scholar] [CrossRef] [Green Version]
  46. Shen, J.; Tao, Q.; Xiao, Z. Shorline detection algorithm based on the improved Deeplab v3+ network. J. Image Graph. 2019, 24, 2174–2182. [Google Scholar]
  47. Jiang, H. Evaluation and analysis of the interface quality of walking streets in residential streets—A case study of Xinzhu Road and Fengxiang Road. Master’s Thesis, Xiamen University, Xiamen, China, 2018. [Google Scholar]
  48. Qiu, Y. Research on Urban Street Spatial Vitality Evaluation Based on Multi-Source Data: A Case Study of Suzhou Ancient Downtown. Master’s Thesis, Suzhou University of Science and Technology, Suzhou, China, 2019. [Google Scholar]
  49. Chester, H.; Lisa, A.H.; Stephanie, E.H. Effects of skeletal streetscape design on perceived safety. Landsc. Urban. Plan. 2015, 142, 18–28. [Google Scholar]
  50. Liao, C. Study on the Quality Measurement and Influence Mechanism of Urban Street Based on Street View Data—Take the Central City of Nanjing as an Example. Master’s Thesis, Southeast University, Nanjing, China, 2018. [Google Scholar]
  51. Subburayalu, S.; Sydnor, T. Assessing street tree diversity in four Ohio communities using the weighted Simpson index. Landsc. Urban. Plann. 2012, 106, 44–50. [Google Scholar] [CrossRef]
  52. Haralick, R.M.; Shanmugam, K.; Dinstein, I. Textural Features for Image Classifification. IEEE Trans. Syst. Man Cybern. 1973, 4, 610–621. [Google Scholar] [CrossRef] [Green Version]
  53. Kupidura, P. The Comparison of Different Methods of Texture Analysis for Their Efficacy for Land Use Classification in Satellite Imagery. Remote Sens. 2019, 11, 1233. [Google Scholar] [CrossRef] [Green Version]
  54. Pathak, V.; Dikshit, O. A new approach for fifinding appropriate combination of texture parameters for classifification. Geocarto Int. 2010, 25, 295–313. [Google Scholar] [CrossRef] [Green Version]
  55. Griffith, J.A.; Martinko, E.A.; Whister, J.L.; Price, K.P. Preliminary comparison of landscape pattern-normalized difference vegetation index (NDVI) relationships to central plains stream conditions. J. Env. Qual. 2002, 31, 846–859. [Google Scholar]
  56. Liu, H.; An, H. Farmland surrounded villages extraction based on sentinel-2A data. J. Inn. Mong. Agric. Univ. Nat. Sci. Ed. 2019, 40, 41–45. [Google Scholar]
  57. Ouni, F.; Belloumi, M. Spatio-temporal pattern of vulnerable road user’s collisions hot spots and related risk factors for injury severity in Tunisia. Transp. Res. Part F Traffic Psychol. Behav. 2018, 56, 477–495. [Google Scholar] [CrossRef]
  58. Li, X.; Li, H.; Zhang, Y.; Yang, L. Spatial patterns and the regional differences of rural settlements in Jilin province, China. Sustainability 2017, 9, 2170. [Google Scholar] [CrossRef] [Green Version]
  59. Rodriguez-Galiano, V.F.; Ghimire, B.; Rogan, J.; Chica-Olmo, M.; Rigol-Sanchez, J.P. An assessment of the effectiveness of a random forest classifier for land-cover classification. Isprs J. Photogramm. Remote Sens. 2012, 67, 93–104. [Google Scholar] [CrossRef]
  60. Collins, L.; MaCarthy, G.; Mellor, A.; Newell, G.; Smith, L. Training data requirements for fire severity mapping using Landsat imagery and random forest. Remote Sens. Env. 2020, 245, 111839. [Google Scholar] [CrossRef]
  61. Junwei, H.; Shanyou, Z.; Guixin, Z. Downscaling land surface temperature based on random forest algorithm. Remote Sens. Land Resour. 2018, 30, 78–86. [Google Scholar]
  62. Fang, K.; Wu, J.; Zhu, J.; Xie, B. A Review of Technologies on Random Forests. Stat. Info. Forum. 2011, 26, 32–38. [Google Scholar]
  63. Eisavi, V.; Homayouni, S.; Yazdi, A.M.; Alimohammadi, A. Land cover mapping based on random forest classification of multitemporal spectral and thermal images. Env. Monit. Assess. 2015, 187, 291. [Google Scholar] [CrossRef]
  64. Tian, Y.; Jia, M.; Wang, Z.; Mao, D.; Du, B.; Wang, C. Monitoring Invasion Process of Spartina alterniflora by Seasonal Sentinel-2 Imagery and an Object-Based Random Forest Classification. Remote Sens. 2020, 12, 1383. [Google Scholar] [CrossRef]
  65. He, Y.; Huang, C.; Li, H.; Liu, Q.; Liu, G.; Zhou, Z.; Zhang, C. Land - cover classification of random forest based on Sentinel- 2A image feature optimization. Resour. Sci. 2019, 41, 992–1001. [Google Scholar]
  66. Cao, Z.; Fang, Z.; Yao, J.; Xiong, L. Loess landform classification based on random forest. J. Geo-Inf. Sci. 2020, 22, 452–463. [Google Scholar]
  67. Su, M.; Guo, R.; Chen, B.; Hong, W.; Wang, J.; Feng, Y.; Xu, B. Sampling Strategy for Detailed Urban Land Use Classification: A Systematic Analysis in Shenzhen. Remote Sens. 2020, 12, 1497. [Google Scholar] [CrossRef]
  68. Chen, W.; Huang, H.; Dong, J.; Zhang, Y.; Tian, Y.; Yang, Z. Social Functional Mapping of Urban Green Space Using Remote Sensing and Social Sensing Data. Isprs J. Photogramm. Remote Sens. 2018, 146, 436–452. [Google Scholar] [CrossRef]
  69. Zhang, W.; Li, W.; Zhang, C.; Hanink, D.M.; Li, X.; Wang, W. Parcel-based urban land use classification in megacity using airborne LiDAR, high resolution orthoimagery, and Google Street View. Comput. Env. Urban. Syst. 2017, 64, 215–228. [Google Scholar] [CrossRef] [Green Version]
  70. Hong, S.Y. Linguistic Landscapes on Street-Level Images. Isprs Int. J. Geo-Inf. 2020, 9, 57. [Google Scholar] [CrossRef] [Green Version]
  71. Seiferling, I.; Naik, N.; Ratti, C.; Proulx, R. Green streets—Quantifying and mapping urban trees with street-level imagery and computer vision. Landsc. Urban. Plan. 2017, 165, 93–101. [Google Scholar] [CrossRef]
Figure 1. Location of the study area. The base map is from ChinaOnlineCommunityENG (MapServer).
Remotesensing 12 02488 g001
Figure 2. OpenStreetMap (OSM) data processing flow diagram. (a) Filtered OSM; (b) buffer zones; (c) centerlines.
Remotesensing 12 02488 g002
Figure 3. Schematic diagram of the street view acquisition.
Remotesensing 12 02488 g003
Figure 4. Main flowchart of using street view data and random forest to identify essential urban land use. DN: Digital number; NDBI: Normalized difference built-up index; NDVI: Normalized difference vegetation index.
Remotesensing 12 02488 g004
Figure 5. Example of the street view image segmentation results. (a) Original image; (b) segmentation result.
Remotesensing 12 02488 g005
Figure 6. Spatial distribution characteristics of the street view elements. (a) Sky; (b) roads; (c) vegetation; (d) buildings.
Remotesensing 12 02488 g006
Figure 7. OOB_SCORE values under different parameter combinations. (a) S1: Street view feature participation; (b) S2: No street view feature participation.
Remotesensing 12 02488 g007
Figure 8. The importance of the different categories of features in the classification. Dens_Res: Density of residential points; M_Buil: Average value of building elements; Pro_Edu: Proportion of educational points; Pro_Res: Proportion of residential points; Std_GVR: Standard deviation of GVR.
Remotesensing 12 02488 g008
Figure 9. Essential urban land use map in the downtown area of Changchun.
Remotesensing 12 02488 g009
Figure 10. Distribution of inconsistent parcels.
Remotesensing 12 02488 g010
Table 1. Reclassification of the point of interest (POI) categories.
Classification of Urban Land UsePOI Type
ResidentialResidential areas
CommercialBanks and office buildings
Shopping malls, department stores, and starred hotels
IndustrialIndustry zones, factories, and mines
PublicGovernments at all levels (province, city, county, and street)
University, middle schools, and primary schools
General hospitals and specialized hospitals
Stadiums, art museums, exhibition halls, and culture museums
Green spaceParks, zoos, and botanical gardens
Table 2. Summary of the features describing urban parcels.
Data SourceFeaturesCount
Street view Mean kernel density of the green visual ratio, openness, enclosure, walkability, diversity, terrain, poles, fences, roads, and cars10
Density standard deviation of green visual ratio, openness, enclosure, walkability, diversity, terrain, poles, fence, roads, and cars10
Luojia-1Mean of DN value1
Sum of DN value1
Baidu POITotal POI and total POI types2
Proportion of points of each type of POI9
Mean kernel density of POI9
Sentinel-2A Mean of the near-infrared, red, and mid-infrared bands3
Standard deviation of the near-infrared, red, and mid-infrared bands3
Texture mean value and standard deviation of the near-infrared, red, and mid-infrared bands18
Mean value and standard deviation of NDVI and NDBI4
Table 3. Proportion of street view elements in the study area.
ElementsProportion (%)ElementsProportion (%)
Sky25.09Sidewalks4.34
Roads20.89Fences1.91
Buildings18.48Terrain1.65
Vegetation16.96Poles0.74
Cars6.18Others3.77
Table 4. Confusion matrix for the test samples with street feature participation.
ResidentialCommericialIndustrialPublic Green SpacePA
Residential18811527298.95%
Commericial27 4 30.43%
Industrial 39 60.00%
Public 219122.50%
Green space 770.00%
OA = 79.13%
Table 5. Confusion matrix for the test samples without street feature participation.
ResidentialCommericialIndustrialPublic Green SpacePA
Residential18812529398.95%
Commericial1715130.43%
Industrial139 160.00%
Public 1 6 15.00%
Greens pace 550.00%
OA = 77.34%
Table 6. Statistics of the importance of the features.
Feature CategoryFeature Importance
Summary (%)Standard Deviation
Baidu POI35.772.61
Luojia-122.200.08
Sentinel-2A41.240.53
Street view 20.690.44

