Thermal Imaging for Plant Stress Detection and Phenotyping †


Department of Biochemistry and Molecular and Cell Biology of Plants, Estación Experimental del Zaidín, Consejo Superior de Investigaciones Científicas, 18008 Granada, Spain
*
Author to whom correspondence should be addressed.
†
This paper is dedicated to Prof. Hartmut K. Lichtenthaler, a pioneer in imaging techniques applied to plant stress research in Europe.
Remote Sens. 2021, 13(1), 68; https://0-doi-org.brum.beds.ac.uk/10.3390/rs13010068
Submission received: 26 November 2020
/
Revised: 18 December 2020
/
Accepted: 24 December 2020
/
Published: 27 December 2020
(This article belongs to the Special Issue Plant Phenotyping for Disease Detection)
Abstract
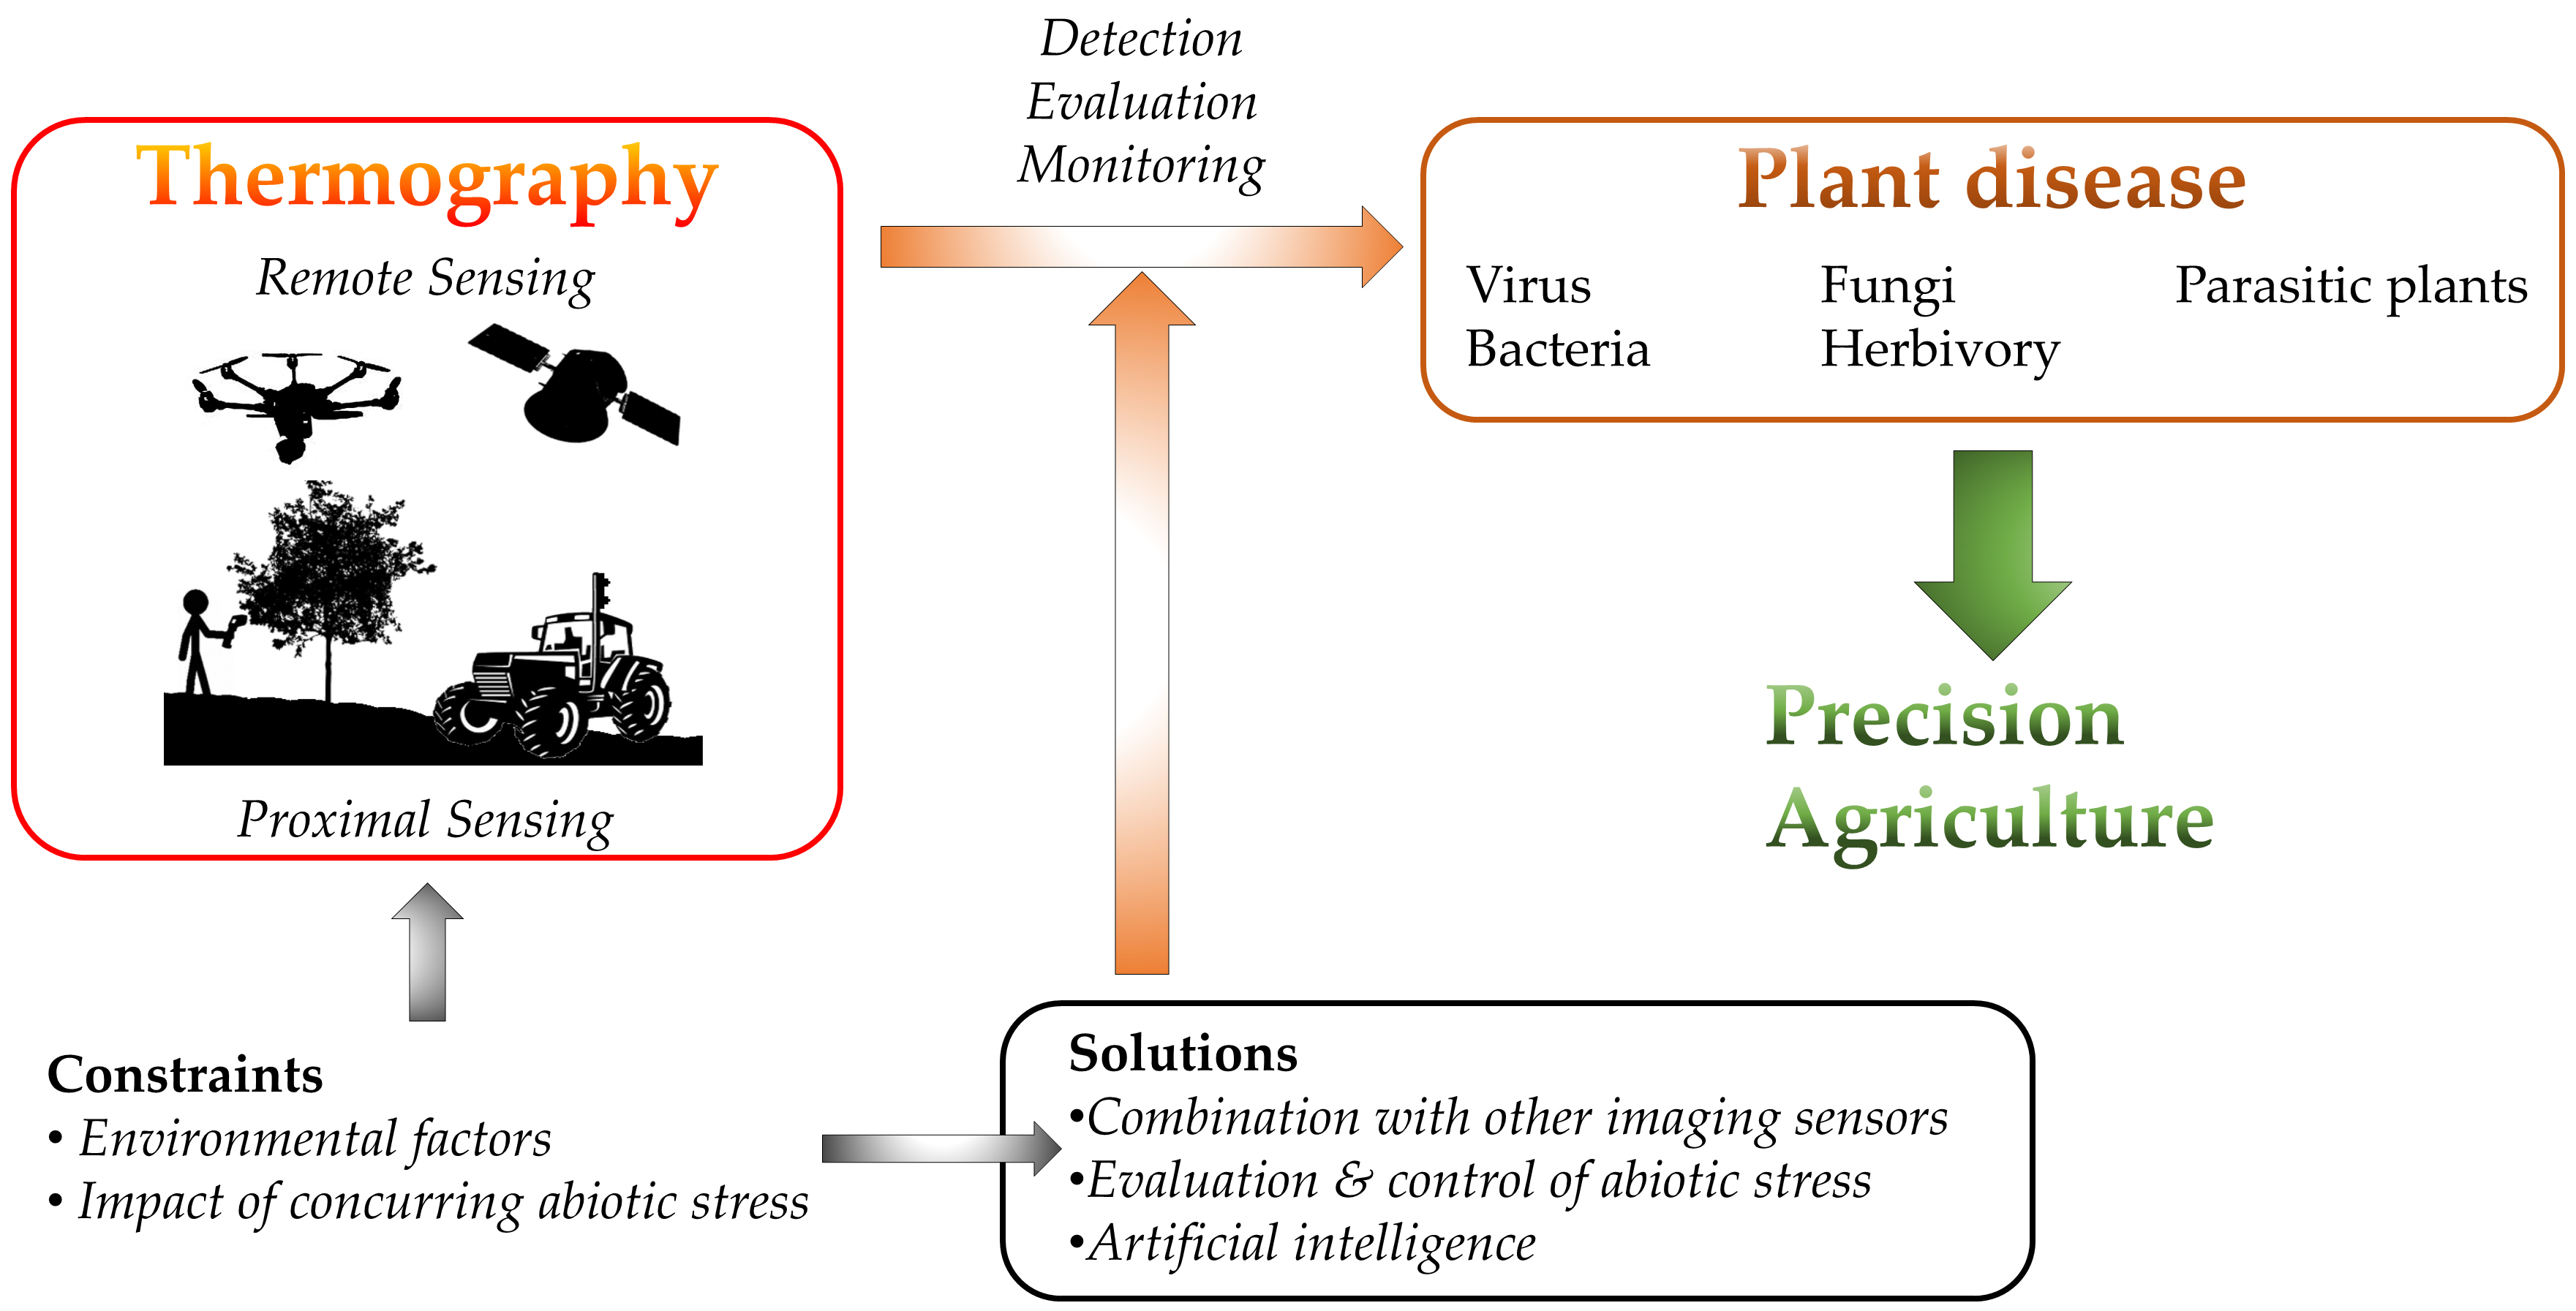
:In the last few years, large efforts have been made to develop new methods to optimize stress detection in crop fields. Thus, plant phenotyping based on imaging techniques has become an essential tool in agriculture. In particular, leaf temperature is a valuable indicator of the physiological status of plants, responding to both biotic and abiotic stressors. Often combined with other imaging sensors and data-mining techniques, thermography is crucial in the implementation of a more automatized, precise and sustainable agriculture. However, thermal data need some corrections related to the environmental and measuring conditions in order to achieve a correct interpretation of the data. This review focuses on the state of the art of thermography applied to the detection of biotic stress. The work will also revise the most important abiotic stress factors affecting the measurements as well as practical issues that need to be considered in order to implement this technique, particularly at the field scale.

1. Introduction
Environmental conditions driven by climate change and infections are great challenges that need to be overcome by modern agriculture. The economic loss in agriculture caused by increasing environmental pressures could reach an annual 0.3% to 0.8% of projected global gross domestic product by the end of the century [1]. Moreover, plant diseases are the main cause of the drop in production and economic losses in agriculture worldwide, reaching yield losses of 20 to 30% depending on the crop [2]. Current practices and social activities -such as intensified monoculture in large areas, the use of genetically uniform plant varieties and the development of global supply chains and logistic activities- contribute largely to the widespread of plant disease epidemics and rapid pathogen evolution [3].
Plant phenotyping based on imaging techniques is a pertinent approach to quantify the appearance and performance of crops under different environmental conditions while addressing the spatial heterogeneity of crop fields. Therefore, plant phenotyping, applied to precision agriculture, is a valuable tool for the diagnosis and detection of plant stress, even in the absence of symptoms. Optical sensors have been used to study (a) the response of plants to pathogens, pests and abiotic stressors; (b) to identify primary disease foci; (c) to monitor resistance or susceptibility of different plant genotypes to specific stress factors; (d) to evaluate the severity of symptoms; (e) and to assess plant biomass and yield [4].
Stomatal activity is one of the most important physiological traits for plant growth and development. It plays a crucial role in the carbon and water balance by controlling photosynthesis and transpiration [5]. Hence, stomatal conductance to water (gs) is related to yield and to the tolerance of environmental stresses [6] and correlates strongly with leaf temperature [7,8,9]. Thermal long-wave infrared (TIR) cameras (or simply thermal cameras) are calibrated sensors able to record emitted radiation in the thermal range (8–14 µm) and provide images representing temperature values per pixel. Thus, conventional, time-consuming ground-based gs measurements can be feasibly replaced by thermal images evaluating plant physiological status at different scales in short periods of time [10,11]. Additionally, highly sensitive thermal cameras with a relatively simple operational procedure have become more available to research groups, at a lower cost and at higher spatial resolution [12,13]. Moreover, TIR imaging is a very valuable method of stress detection prior to the appearance of symptoms since it operates out of the visual range of the spectrum [14]. However, some considerations must be taken when interpreting thermograms in terms of gs since plant surface temperature is mainly driven by environmental factors such as air temperature and relative humidity. Even though high-end thermal cameras carry out corrections for these two parameters, there are other factors affecting canopy temperatures, such as wind speed and light intensity, as well as by plant features, ranging from leaf size or angle to canopy structure. A number of corrections for these factors can be found in the literature as TIR stress indices (Table 1). Some of these parameters have been found to correlate with physiological traits related to the water balance status of plants (Table 2). The most common TIR parameters are:
- Normalized canopy or leaf temperature with reference to air temperature (ΔT), utilized as an index of crop water status. The applications of ΔT was recently reviewed by Still et al. [15];
- Crop water stress index (CSWI), which introduces two baselines: (Tcanopy − Tair)wet as the estimated difference for a well-watered plant, and (Tcanopy − Tair)dry for a dry (non-transpiring) plant. CWSI is one of the most commonly used normalization methods for TIR measurements, which overcomes the effects of other environmental parameters affecting plant temperature [16,17];
- Index of stomatal conductance (IG), since it is directly proportional to this parameter [18];
- Normalized relative canopy temperature (NRCT), based on the maximum and the minimum temperature measured in the whole field trial. This parameter has been found to be a valid estimation of the crop water status [22];
- Average canopy temperature (Tav), based on maximum and minimum values of temperature, was one of the first parameters used by the conventional infrared thermography [23,24]. However, this parameter can excessively simplify outcome data, and some important thermal information can be lost. Estimated shape factors derived by fitting the whole temperature data of the thermal images to the Weibull distribution could solve this constraint [25].

Table 1.
Most commonly used thermal long-wave infrared (TIR) parameters.
| TIR Stress Index | Formula | Ref. |
|---|---|---|
| ΔT, normalized canopy or leaf temperature | [26] | |
| CWSI, crop water stress index | [17,27] | |
| IG, index of stomatal conductance | [18] | |
| MTD, maximum temperature difference | [19] | |
| NRCT, normalized relative canopy temperature | [22] | |
| Tav, average canopy temperature | [24] |
Table 2.
Correlations between TIR stress indices (TIR SI) and physiological parameters (physiol. param.) applied to estimate physiological traits related to water stress or salinity at proximal (PS) and remote sensing (RS) scales. ΔT, normalized canopy temperature; AN, net photosynthesis rate; CWC, canopy water content; CWSI, crop water stress index; Em, leaf transpiration rate; Ψ, hydric potential; gs, stomatal conductance; IG, index of stomatal conductance; NRCT, normalized relative canopy temperature; RWC, relative water content; SM, soil moisture; Tav, average canopy temperature; Tcanopy, canopy temperature; Tleaf, leaf temperature.
| TIR SI | Physiol. Param. | Plant Species | Scale | Ref. |
|---|---|---|---|---|
| ΔT | gs | Papaya | PS | [28] |
| Vineyard, corn, olive, citrus, poplar, almond, apple, persimmon | RS | [29,30,31,32,33,34,35,36,37,38] | ||
| Em | Papaya | PS | [28] | |
| AN | Papaya | PS | [28] | |
| Ψ | Vineyard, olive, citrus, almond, Prunus sp., persimmon, apple | RS | [29,32,33,34,35,38,39,40,41,42,43] | |
| CWSI | gs | Fava bean, spinach | PS | [44,45] |
| Vineyard, olive, potato, almond, pistachio | RS | [29,31,38,46,47,48,49,50,51,52,53,54,55,56,57] | ||
| Ψ | Vineyard, Prunus sp., almond, cotton, olive, citrus, pistachio | RS | [29,38,40,43,48,49,53,55,56,57,58,59] | |
| Em | Olive | RS | [53] | |
| SM | Corn | PS | [60] | |
| IG | gs | Fava bean | PS | [44] |
| Vineyard | RS | [23,29,38,46,50,51,52,57] | ||
| Ψ | Vineyard | RS | [29,38,57] | |
| NRCT | RWC | Wheat | PS | [61] |
| CWC | Wheat | PS | [61] | |
| Tav | gs | Vineyard | RS | [46] |
| Tcanopy | gs | Vineyard, citrus, almond | RS | [29,52,55,62,63] |
| Ψ | Vineyard, cotton, citrus, almond | RS | [29,55,63,64] | |
| SM | Soybean | RS | [65] | |
| Tleaf | gs | Papaya, barley, wheat, rice | PS | [28,66,67] |
| Em | Papaya | PS | [28] | |
| AN | Papaya | PS | [28] |
Despite the wide use of thermography applied to agronomy, this technique per se has a very limited capacity for diagnosis. Indeed, temperature raises may be due to stomatal closure, which is on its own an unspecific mechanism of plant defense against both abiotic and biotic stressors. Even more, temperature raises can also respond to a decreased capacity for water evaporation or even to the loss of vegetation [10]. In contrast, some stresses can cause temporary decreases in leaf temperature. That would be the case of some pathogens that can interfere in the regulation of stomatal movements to favor their entry to the mesophyll [68]. As a consequence, alterations in TIR parameters stand as ambiguous clues for diagnosis. Moreover, abiotic stress factors (mostly drought, soil salinity or extreme ambient temperature) also cause increases in canopy temperature. This is most important under natural conditions, where abiotic stressors are difficult to assess and avoid. Keeping in mind that under such conditions, several stress factors often affect the vegetation simultaneously, possible misinterpretations of TIR data would lead to inaccurate determination of the incidence and severity of a particular pathogen infection or even to a wrong diagnosis.
To overcome the restraints of thermography as a diagnostic technique, authors have increasingly applied it in combination with other imaging techniques. Roitsch et al. [69] and Sperschneider [70] reviewed the implementation of TIR cameras with other sensors, such as RGB, multi- or hyperspectral cameras, in phenotyping platforms. The identification of spatial and temporal patterns of TIR parameters in combination with other relevant vegetation indices (VIs) could be of great help to establish robust methods for the early diagnosis in crop fields. However, a preliminary analysis of a given plant-stressor interaction is desirable to obtain a stress-specific signature [20].
The use of complementary imaging techniques provides valuable and very complex information. This complexity is caused by the increasing number of dimensions that can be considered and the incessant improvements in their spatial and temporal resolution. To enhance our capacity for data analysis, most recent works have included data-mining in their analysis. This multidisciplinary approach, based on probability theory, statistics, decision theory, visualization and optimization, outperforms more conventional statistical analysis in terms of finding patterns in data [71,72]. Classifiers are algorithms able to learn patterns from a database of known samples and, based on that knowledge, to identify or categorize new samples [73]. When applied to agriculture, this approach facilitates the interpretation of data and the decision-making process to such an extent that no study appears to be complete without this type of analysis.
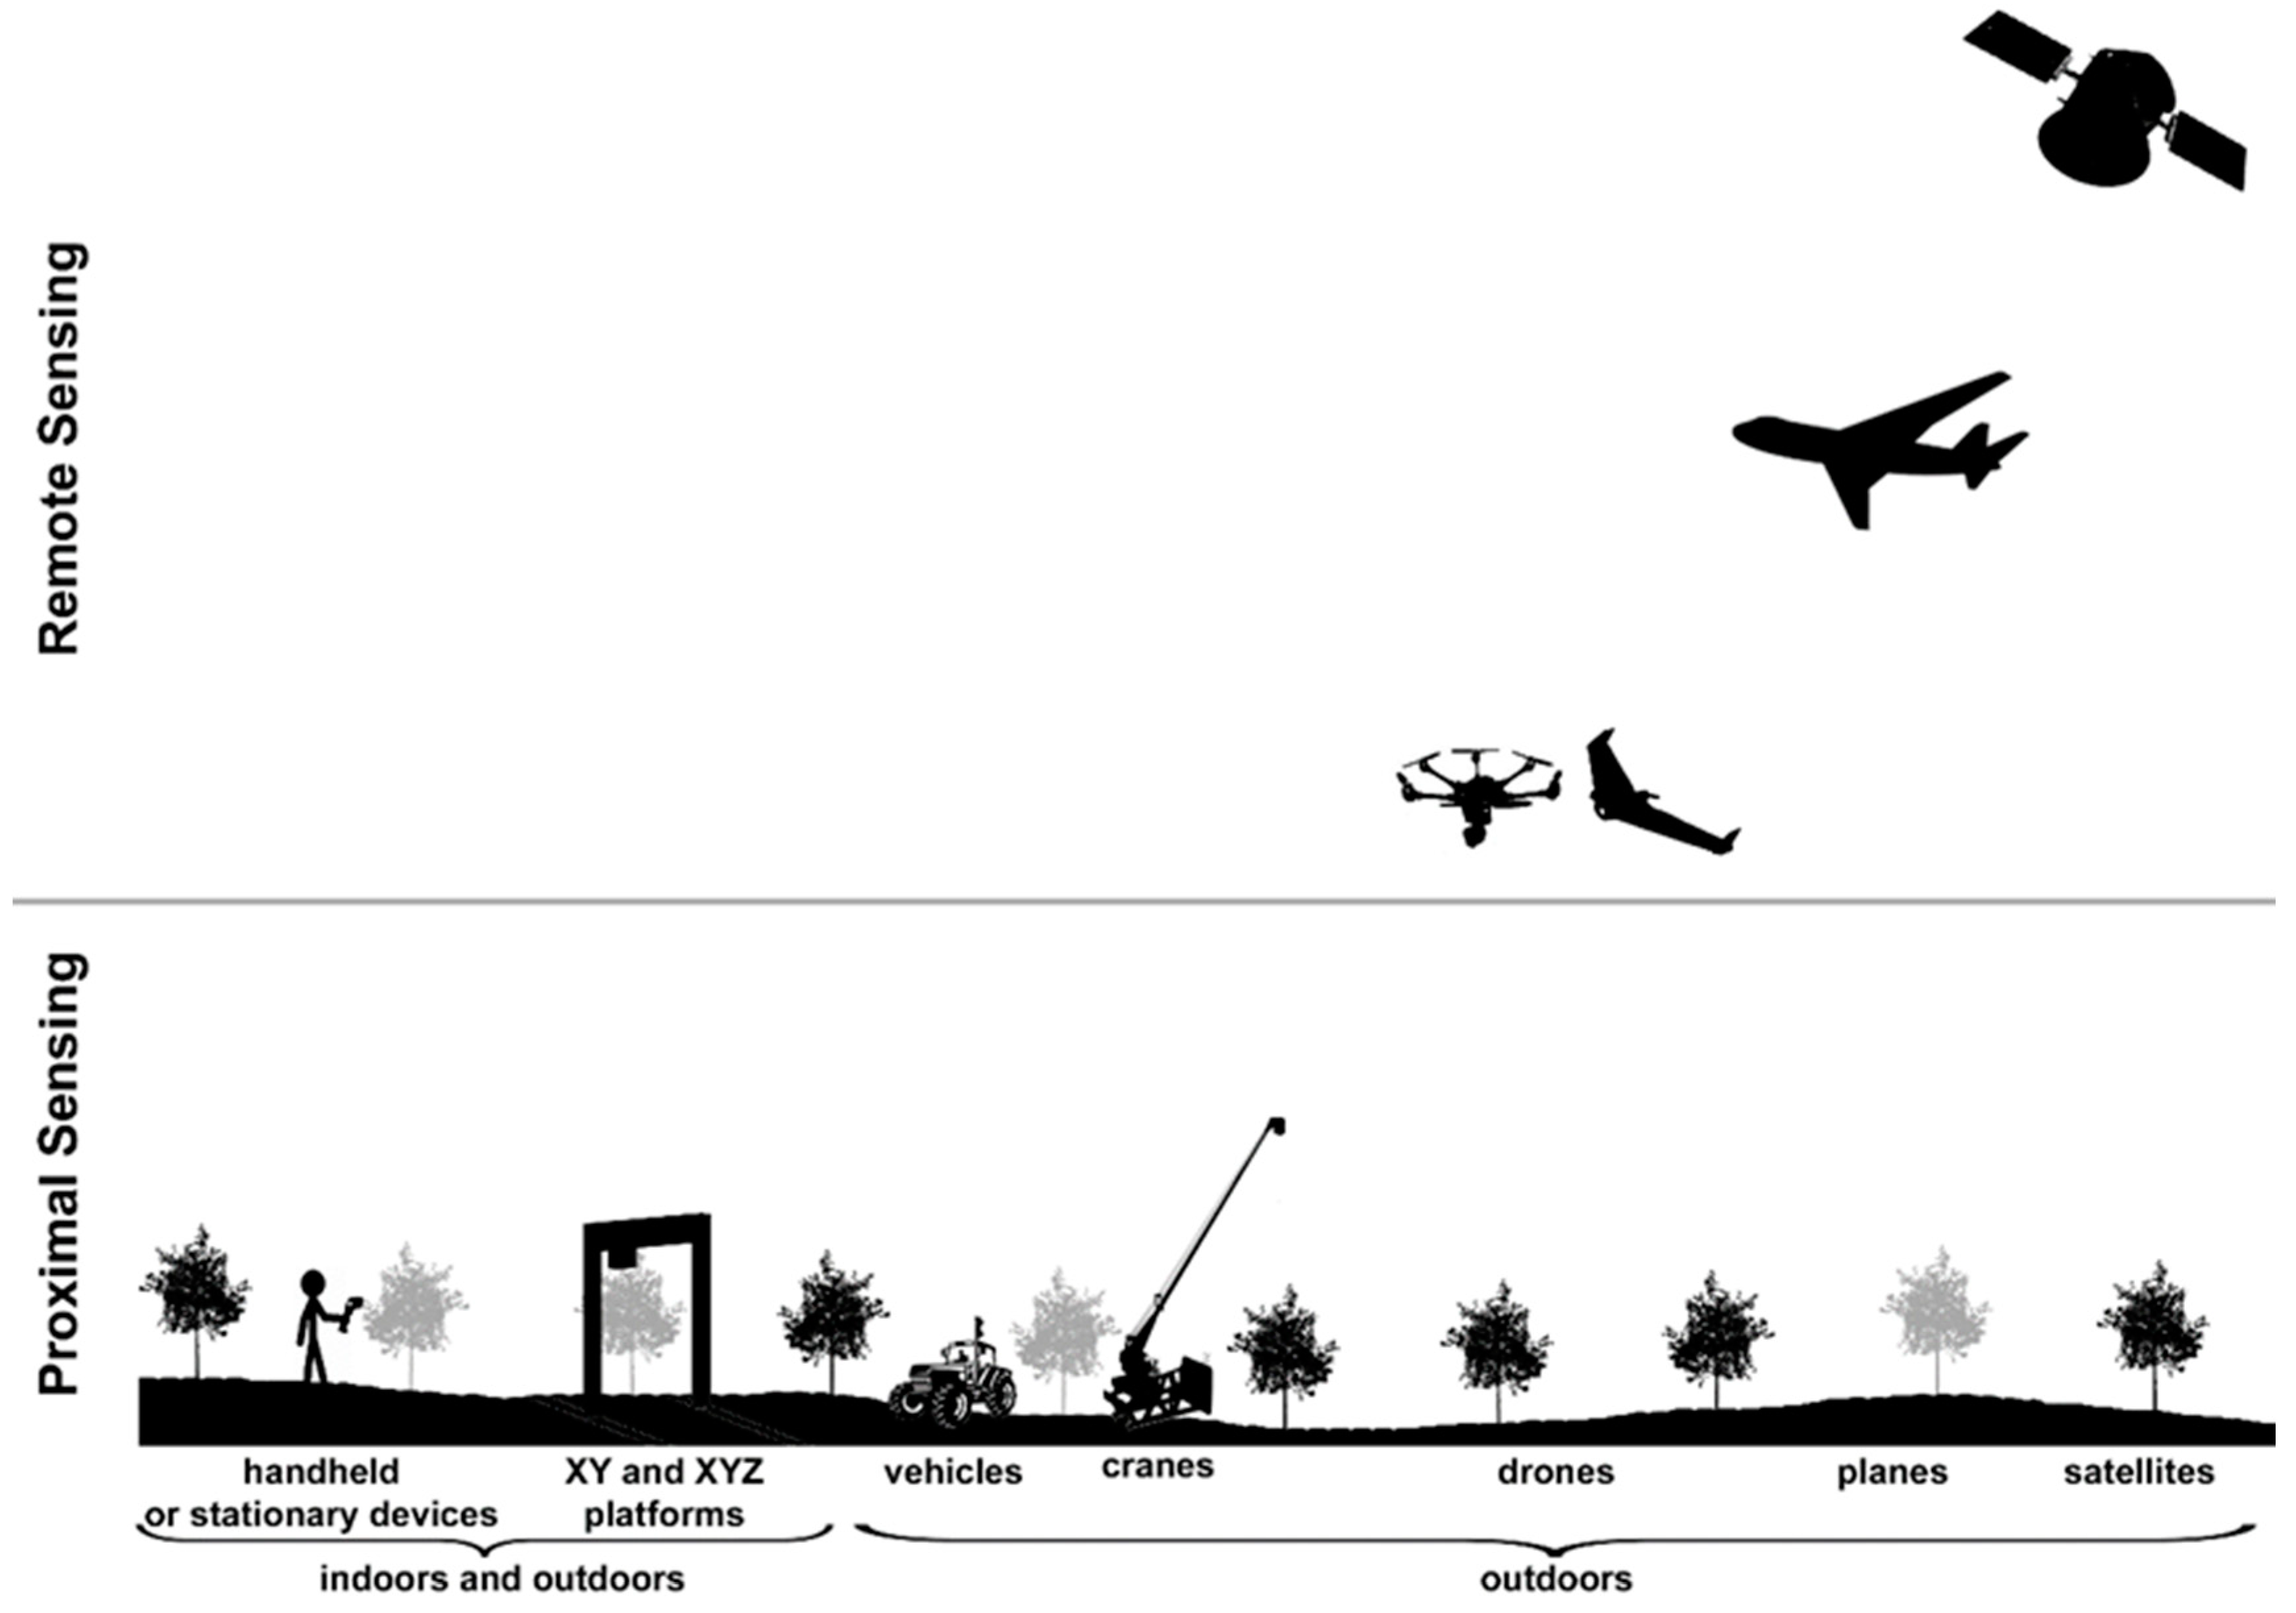
Thermography is extensively used for stress detection from lab to field scale by either proximal or remote sensing (Figure 1). On one hand, proximal sensing (mainly in growth chambers and greenhouses) refers to imaging single leaves or entire plants from a close distance to the target. The camera could be mounted on a static stand or small and medium-size robots, including high-throughput platforms. On the other hand, remote sensing refers to measurements taken in open fields with imaging sensors implemented on a wide range of devices, such as cranes, vehicles, robots and unmanned aerial vehicles (UAVs; in which the image resolution depends on the flight height) to cover whole crop fields. Even larger areas (district to region scales) can be tackled thanks to the sensors onboard satellites (i.e. ASTER, Sentinel-3, ECOSTREES, or Landsat-7 and 8, among others). These sensors differ in their spatial resolution and also on the time resolution, depending on the revisiting frequency of the satellite over the particular area.
Physical and technical aspects of thermography, such as scientific principles applied to measurements and data correction methods [15,74,75,76], as well as practical considerations affecting thermal imagery for plant phenotyping [77,78], have been recently reviewed. Other aspects related to thermography, such as available imaging sensors and evaluation of their potential [79,80], their use in phenotyping platforms [69,81,82] or UAVs [76,83,84,85], and their applications have also deserved special attention by many authors. Moreover, other TIR applications have also been thoroughly reviewed elsewhere [15,20]. Furthermore, very recent works reviewed the state of the art in the application of artificial intelligence to stress detection [70,72]. Despite the vast number of works addressing the use of thermography for plant stress detection, little attention has been paid to the physiological perspective of temperature alterations related to stressed plants. Attending to this need, this review will revise the most relevant applications of thermography to agriculture with the main aim of providing TIR camera users with a collection of host plant–pathogen systems described in the literature in terms of thermal response and the mechanisms of plant defense involved. Furthermore, a state-of-art review on the detection of abiotic stress by thermography will complement our current knowledge on thermography applied to the diagnosis of biotic stress in plants.
2. Biotic Stress Detection by Thermography at Different Scales
Stomata are the main natural entry of pathogens into the plant tissues. Hence, the regulation of the stomatal movements plays a key role in plant defense against microbes [86]. The recognition of a potential pathogen by plants usually triggers stomatal closure; to counteract this defense response, some pathogens are able to override the plant signaling pathways to activate stomatal aperture [87]. Other effects of pathogen infection include disturbances on leaf development, cell wall and leaf cuticle composition or integrity, alterations in the plant metabolism or even necrosis of the tissues. These physical and chemical disturbances affect the plant water status, which can be monitored by thermography [88,89,90].
2.1. Proximal Sensing on Growth Chambers and Greenhouses
2.1.1. Viral Infections
Even when some virosis cause alterations neither in gs nor in leaf temperature [91], thermography is very often helpful in tracking viral infections on plants. Most of those works report temperature increases between +0.5 and +1.5 K; on the contrary, some works reported decreases in leaf temperature of −0.5 K relative to mock-controls. Hypersensitive response (HR) to Tobacco mosaic virus (TMV) could be visualized as spots of elevated temperature before any disease symptoms became visible on tobacco leaves. Those spots were confined to the site of infection as a result of the HR triggered by salicylic acid. On the other hand, no thermal response was observed on susceptible tobacco-TMV-infected plants [92]. In the case of Pepper middle mottle virus (PMMoV)-Nicotiana benthamiana plants, virus spreading through asymptomatic leaves could be first detected by an increase in temperature on the tissues around the main veins. This effect extended to adjacent tissues before the spreading of the virus across the midrib of the leaf, as shown by immunolocalization. Interestingly, the thermal symptoms caused by the most severe strain of PMMoV were detected before those caused by the less virulent one [93]. Among other tobamoviruses, Cucumber mosaic virus (CMV) and Cucumber green mottle mosaic virus (CGMMV) have a particular impact on cucumber production. Plants infected with CMV displayed homogeneously higher temperature in the whole inoculated leaf relative to the controls, whereas leaves of CGMMV-infected cucumber plants showed a heterogeneous temperature pattern, consisting of cold spots at the infection sites. However, none of those changes was detectable presymptomatically. Nevertheless, classificatory algorithms could early detect the infection caused by each pathogen when combining data obtained by TIR, fluorescence and hyperspectral imaging [94]. Another virus of agricultural interest is the Sweet potato feathery mottle virus, which is the most widespread virus that infects sweet potato plants, causing devastating problems when co-infecting with Sweet potato chlorotic stunt virus. Higher leaf temperatures were associated with more severe symptoms; thus, plants co-infected with both viruses displayed higher temperatures than single virus-infected plants [95].
2.1.2. Bacterial Infections
In the case of bacterial-infected plants, literature reports temperature changes relative to the controls ranging between −3.3 K and +3 K. The tumor caused by Agrobacterium tumefaciens in the hypocotyl of castor oil plant produces irreversible disruption of the plant epidermis and hence, the tumor lacks a protective cuticle against water loss. Moreover, stomata located at the tumor edge are hypertrophied and non-functional; as a consequence, the tumor surface was the coldest part of the plant [96]. Some works have studied the role of plant defense elicitors produced by bacterial pathogens. That is the case of the proteinaceous harpin synthesized by the bacterium Erwinia amylovora. When infiltrated in the leaves of Nicotiana sylvestris wild plants, harpin induced a marked presymptomatic cooling at the inoculation sites, followed by an increase of temperature during the HR [97]. The same trend was described for spots of bacterial canker caused by Pseudomonas syringae pv. actinidiae on kiwifruit leaves [98]. The decrease in temperature localized at the infection sites could be related to bacterial virulence factors that actively open the stomata by interfering with hormonal signaling pathways leading to stomatal closure [99]. On the other hand, it is well known that recognition of some pathogen-associated molecular patterns triggers stomatal closure to impede bacterial entrance through these natural apertures [68]. In bean plants, P. syringae pv. tomato DC3000 induces an HR, whereas P. syringae pv. phaseolicola 1448A produces systemic infection. First symptoms are evident after 10 h and 2 days post-infection, respectively. Thermography could presymptomatically reveal those bacterial challenges as an increase of temperature of the inoculated areas at 1 and 2 h post-infection in the case of HR and systemic infection, respectively [100].
Several works have addressed the effect of the Dickeya dadantii infection on plant transpiration by thermography. This bacterium usually produces soft-rot, a characteristic tissue maceration, as in the case of N. benthamiana infected at high inoculum dose. After mechanical infiltration, the temperature of the affected areas raised presymptomatically, linked to an increase in hormones controlling stomatal closure. In subsequent days, the temperature continued rising, affecting the whole leaf. However, N. benthamiana can activate an efficient defense response against D. dadantii when the plant is inoculated at doses resembling the natural infection. In this case, after an initial increase in temperature of the infiltrated area, infected plants could recover, and temperature subsequently decreased [101]. Independently of the inoculum dose, D. dadantii does not cause tissue maceration on melon leaves. It produces brownish spots at the inoculation sites that evolve chlorosis in the surrounding tissues in successive days; those symptoms appeared earlier when high dose concentrations were applied. Only infiltrated areas shown increased temperatures at the beginning of the infection process when inoculated at a low dose; the whole leaf finally displaying higher temperature respecting to the controls. However, when a high inoculum dose was applied, the whole melon leaf displayed a higher temperature [102]. The whole leaf of another cucurbit, such as zucchini, displayed higher temperature relative to the controls when inoculated with D. dadantii, whereas visual symptoms (different degrees of chlorosis proportional to the inoculated dose) were circumscribed to the infiltrated spots [103,104]. Features extracted from TIR and multicolor fluorescence images were used to feed algorithms, which provided a good performance of classification of plants into categories of infected and controls in both melon and zucchini plants [102,103,104].
2.1.3. Interactions with Pathogenic Fungi and Oomycetes
Thermography has been widely used to assess the effect of fungi and oomycetes on host plant transpiration. Depending on how these pathogens interact with host plants, initial phases of pathogenesis can induce increases or decreases in leaf temperatures affecting only the inoculation sites or wholes leaves. Subsequent symptoms development may cause transitory drops in temperature as the affected cells die and lose water. Later infection phases usually lead to an increase in temperature due to the lack of natural cooling of the necrotic tissues. Concerning healthy areas, it is possible to find in the cited literature that biotrophic fungi and oomycetes can cause temperature decreases ranging from −0.1 to −2.5 K, whereas increases have been registered from +0.6 to +2 K. For their part, hemibiotrophic pathogens can decrease leaf temperature between −0.6 and −2.2 K, or contrary, increase it in +0.4 to +7.5 K. Finally, it is possible to register temperatures decreases between −2 and −5 K and increases ranging from +0.3 to +9 K when necrotrophic fungi are studied by TIR imaging.
Concerning infections caused by biotrophic fungi leaves from wheat plants infected with Blumeria graminis or Puccinia striiformis (fungi causing powdery mildew and stripe rust, respectively) displayed low temperatures due to the very low resistance to water evaporation of growing mycelia [105,106]. The phytopathogens Pseudoperonospora cubensis and Podosphaera xanthii are the causal agents of cucumber downy mildew and cucurbits powdery mildew, respectively. In cucumber leaves, these pathogens produce infective spots with lower temperatures than the surrounding healthy areas due to an abnormal stomatal opening. In the case of P. xanthii infection, the thermographic detection was not presymptomatic, whereas disease caused by P. cubensis could be revealed one day before the appearance of symptoms. Under laboratory conditions, the MTD increased during both pathogenesis and was related to disease severity [19,94,107,108]. Despite being a biotrophic oomycete, P. cubensis also produces necrosis in the latest infection phase associated with an increase in cucumber leaf temperature [19,108]. Leaves of rose infected with the fungus Podosphaera pannosa var. rosae (causal agent of powdery mildew in roses) showed a presymptomatic decrease in temperature. Furthermore, two algorithms were trained on features extracted from TIR images, obtaining high accuracy in classifying healthy and infected plants [109]. Raza et al. [110] also used information extracted from TIR and RGB pictures to automatically detect tomato plants infected with Oidium neolycopersici in a presymptomatic way, but the work did not address the physiological changes caused by the fungus.
Regarding hemibiotrophic fungi, TIR imaging could describe the severity of the infection, which could be related to the disease stages but also to the host plant resistance to the pathogen. Thus, Oerke et al. [111] and Belin et al. [112] analyzed apple trees suffering from apple scab. In that case, the detection of infection, as well as differences in the virulence of several Venturia inaequalis isolates infecting apple trees, were detected more accurately by thermography than by chlorophyll fluorescence imaging. The thermal response was presymptomatic and consisted of spots of decreased temperature due to the subcuticular growth of V. inaequalis. A soilborne fungus, Rhizoctonia solani, induces necrosis in lettuce plants, which could be visualized as an increase in leaf temperature and MTD [113]. The damage produced by another soilborne fungus, Fusarium oxysporum, to whole cucumber leaves could be detected as a presymptomatic raise in temperature induced by abscisic acid, followed by a slight decrease as wilt symptoms developed. Finally, the temperature of whole leaves presenting necrosis increased again [114]. On the contrary, pea plants infected with this fungus showed an early and slight reduction of temperature compared to the control plants. At an advanced stage of the infection, the leaf temperature increased above control levels in the case of susceptible plants, whereas the temperature of those showing F. oxysporum-resistance remained similar to the controls [115].
In the case of infections caused by necrotrophic fungi, sugar beet plants inoculated with Cercospora beticola (causal agent of Cercospora leaf spot) displayed spots of presymptomatic low temperature corresponding to the infection sites. Cold spots appeared progressively until covering the whole leaf surface, whereas lesions were hardly visible by the naked eye. Toxins influencing cell membrane permeability and produced by C. beticola could account for this temperature decrease [92]. Aspergillus carbonarius is a fungus causing sour rot of grape berries and produces ochratoxin-As, toxic for humans. Mycelium growth areas showed low temperatures that identified affected fruit sites at the very early-stages of A. carbonarius infection [25]. Thermography also revealed that Alternaria alternata, A. brassicae and A. brassicicola caused a decrease of temperature during the first seven days of infection on oilseed rape leaves, followed by a temperature increase in successive days. However, those plants inoculated with A. dauci only developed increases of mean temperature at 21 days after inoculation [116]. The infection with Botrytis cinerea (gray mold) on bean plants caused a presymptomatic increase of temperature at the infection sites. In subsequent days, leaves developed hot brownish necrotic lesions surrounded by a lower temperature area [117]. Contrary, B. cinerea–infected roses first showed a decrease of temperature at regions where lesions were initially formed, followed by a rise in temperature once necrosis occurred [109]. Rosellinia necatrix (soilborne fungus causing white root rot) is one of the most important constraints to production for a wide range of woody crops such as avocado. In the late phases of R. necatrix infection, trees undergo a water deficit in the aerial part due to failure of the root system [118]. As a result, infected plants experienced a significant increase in leaf temperature from the early symptomatic stage onwards [119]. Furthermore, infected avocado trees in an orchard could be detected by thermography (see Section 2.2) [120].
2.1.4. Herbivory and Parasitic Plants
Herbivore insects disrupt the integrity of leaves, leading to uncontrolled water loss from wounds and triggering intricate processes that affect gas exchange also in the remaining leaf tissue. Thus, it is possible to find temperature drops from −0.3 to −3 K in the literature. TIR images of soybean leaflets affected by corn earworm caterpillars (Helicoverpa zea) showed that leaf areas adjacent to wounds were cooler than distant regions or sister leaflets [121]. The same leaf temperature pattern was visible after injuries caused by cabbage looper (Trichoplusia ni) instars on Arabidopsis [122], tobacco hornworm (Manduca sexta) on Nicotiana attenuata [123], or larval gypsy moth (Lymantria dyspar) and gall damage produced by midge flies (Harmandia sp.) on aspen leaves [124]. When elevated CO2 was applied to the atmosphere, the cooling effect of gall formation on remaining leaf tissue was reduced [124].
Thermography was also useful in the detection of plants infested by parasites, revealing temperature increases (from +0.4 to +0.9 K) due to a reduction in the plant water uptake by affected roots. Examples of these interactions are the nematode Heterodera schachtii with susceptible sugar beet cultivars [125], as well as the obligatory root parasitic plant Orobanche cumana (broomrape) and sunflower [126]. The early detection of broomrape by nondestructive techniques was unprecedented since natural infestation causes subtle alterations on host physiology and proceeds unnoticed until the emergence of the floral shoots, by the time of sunflower bloom.
2.2. Remote Sensing on Crop Fields
In crop fields, thermography has facilitated the detailed analysis of crop fields affected by pathogens, helping in the localization of areas where plants are infected and requiring urgent intervention [127]. In general, pathogen-infected plants show changes in their temperature of -2 K to +3.1 K, relative to the temperature of healthy plants; however, it is worth noticing that these values should be handled with care depending on the sensitivity and the accuracy of the used TIR cameras. The identification of potentially infected plants using classifiers provides accuracies ranging between 59 and 89%, depending on the applied algorithm and parameters used to feed it.
In sugar beet, canopy temperature correlated significantly with the density of the nematode parasite H. schachtii in the case of a susceptible cultivar, whereas no correlation could be found for the resistant one [128]. P. syringae pv. actinidiae infection in kiwifruit orchards was assessed by TIR maps based on canopy temperature. Images revealed that infected trees were significantly warmer than the healthy ones, being localized in the outer canes of the canopy [98]. Temperature increases measured on pines infected with Dothistroma septosporum (causal agent of red band needle blight) and on winter wheat infected with Zymoseptoria tritici (causing septoria leaf blotch) could be positively correlated to the damages caused by these hemibiotrophic fungi [90,129]. Necrotic spots on leaves from three woody trees (oriental cherry, Japanese cornel and sawtooth oak) caused by three fungi (Mycosphaerella cerasella, Elsinoe corni and Tubakia dryina, respectively) can also be detected as dots with higher temperatures relative to healthy areas [130].
The fusion of thermography with other imaging techniques such as multi- or hyperspectral reflectance or chlorophyll fluorescence imaging cameras is very often an adequate approach for stress detection. The combination with chlorophyll fluorescence imaging allowed monitoring several constraints (fungal infection, galls and chewing damages caused by arthropods) in understory hardwood saplings. Thus, changes in transpiration could be related to photosynthesis impairment in affected trees [131]. However, the combination of TIR imaging with multi- or hyper-spectroscopy reflectance is more feasible since both techniques are based on passive measurements. Moreover, it is possible to obtain multiple reflectance VIs that could correlate with physiological parameters. Furthermore, VIs, together with temperature derived parameters, could be implemented on algorithms to classify plants into categories of interest in the earliest stages of infection. That was the case of important bacterial diseases causing a high impact on both agriculture and the environment, such as citrus greening or Huanglongbing in citrus trees [132], or Xylella fastidiosa, a quarantine pathogen in olive orchards [133].
In the case of diseases caused by foliar fungal pathogens, the joint use of thermography and reflectance made it possible to discriminate between severity levels. That was the case of red leaf blotch (caused by Polystigma amygdalinum) in almond trees [134] and also early and late leaf spot diseases (caused by Passalora arachidicola S. Hori and Cercosporidium personatum, respectively) on peanut trees [135]. Minimum temperature corrected by air temperature showed a negative correlation with the normalized difference vegetation index (NDVI) in opium poppy orchards infected by the oomycete Peronospora arborescens (causal agent of downy mildew) [136]. Furthermore, a strong relationship between yield, several VIs and canopy temperature was observed in maize plants suffering tar spot complex (caused by Phyllachora maydis and Monographella maydis) [137], as well as in chickpea infected with Ascochyta rabiei (causing Ascochyta blight disease) [138].
ΔT correlated with disease severity caused by soilborne fungal pathogens, such as Verticillium dahliae (causal agent of Verticillium wilt) in olive trees or R. necatrix in avocado trees. Moreover, classifying algorithms applied to the data obtained by spectral and TIR imaging could identify affected trees with high accuracy [120,139,140].
3. Assessing of Plant Abiotic Stress by Thermography
In natural environments, abiotic stress conditions often concur with biotic stresses, making their evaluation difficult. For this reason, it is important to understand how abiotic conditions can affect vegetation. The successive sections will review how thermography has been applied to monitor crop water stress, salinity, nutrient availability, and application of herbicides, among others, at proximal and remote scales.
3.1. Proximal Sensing on Growth Chambers and Greenhouses
Drought, which importance emerges from the damage caused and its extent, is consequently one of the main abiotic stresses monitored by TIR imaging to help farmers to establish precise water management and scheduling [141]. Most of the studies related to drought stress have been conducted in crop fields, but it is possible to find some works carried out on plants grown under controlled conditions (Table 2). Furthermore, salinity is essentially water stress that results from the osmotic effect of ions in the soil solution, reducing the water availability for plants. In addition, ions can accumulate in plant leaves up to toxic concentrations [142]. Thus, TIR imaging provides an opportunity to screen for salinity tolerance traits in a reliable, quantitative and efficient manner. The effects of different abiotic stress factors on leaf temperature at proximal sensing are summarized in Table 3. The increase in temperature registered in these works for infected plants ranges from +1.5 to +6 K.
3.2. Remote Sensing on Crop Fields
Temperature differences ranging from +0.7 to +7 K between healthy and stressed plants have been reported in the literature at a remote sensing scale. These alterations in canopy temperature allowed stress detection with accuracies up to 75% using classificatory algorithms based on TIR stress indices.
Vineyards under different water regimes are proposed as an exemplary study model thanks to the geometry of orchards. Moreover, climate change threatens the most important wine-producer countries worldwide, which will suffer increased frequency and severity of drought periods. On the contrary, fine-tuning irrigation management during the growing season leads to a slight-to-moderate water deficit, which stimulates optimal grape quality without significantly compromising yield [47]. Many authors have monitored physiological parameters related to water balance by handheld devices and correlated them with stress indices extracted from TIR images (Table 2). They found that TIR imaging can distinguish between irrigated and non-irrigated canopies and even between different deficit irrigation treatments. However, the relationship between TIR stress indices and physiological parameters was found to be stable throughout the season in some cases [47] or, on the contrary, affected by the phenological stage or the varieties [49,158]. All these works have used TIR ground-based cameras positioned (lateral or nadir) or implemented on UAVs. However, it is also possible to use TIR images from Landsat-5 for irrigation management purposes [159].
As the water demand for agriculture is steadily increasing, exploring indices obtained by thermography to evaluate drought stress in other crops different from vineyards also has been extensively addressed (Table 2). The efficiency of the VI named photochemical reflectance index (PRI) as an indicator of water stress was evaluated by TIR imaging in olive and peach orchards under different water regimes. It was found that PRI showed a higher correlation with ΔT and gs than other vegetation indices [30,160]. Regarding the monitoring of water regimes in crops using satellite images, thermal images taken with ASTER could distinguish between rain-fed and artificially irrigated olive tree orchards [161]. Based on these works, it can be concluded that thermal information remotely obtained by TIR cameras, alone or in combination with other imaging techniques, is robust enough to estimate the water status of crops and to help farmers to establish an appropriate irrigation scheduling for plantations. However, this conclusion should be taken with caution since there are exceptions to the rule. As an example, canopy temperature in maize fields under drought stress only partially reflected gas exchange rates and grain yield, presumably as a consequence of other alterations caused by this stress factor in plants, such as impairments in photosynthesis and partitioning rates or alterations in plant leaves and canopy structures (leading to fluctuations in energy absorption and/or dissipation) [162]. Moreover, the use of TIR imaging to figure out biologically relevant traits constitutes a challenge under fluctuating conditions, as recently reviewed by Vialet-Chabrand and Lawson [75].
In addition to physiological variables related to the water status of plants, production parameters such as grain yield could be evaluated by thermography in cereals. That was the case of spring barley [163], maize [162] and wheat [61,164,165], where grain yield under different water regimes showed good correlations with TIR stress indices. CWSI is a good predictor of garlic bulb biomass under different water availability levels [166]. Another production parameter, the average fruit weight of mandarins “clementina de Nules” at harvest, could also be correlated significantly with canopy temperature when different irrigation regimes were tested [32].
Regarding the nutrient availability in soils, wheat crops growing under higher nitrogen supplies exhibited lower canopy temperature (and thus, lower CWSI) than those that were not treated [167]. Kefauver et al. [168] compared different nitrogen treatments in three barley varieties and elaborated a detailed correlation network of physiological traits, TIR and other imaging data. Another common stress in crop fields is low temperatures. TIR imaging has been applied to study frost resistance in apple orchards. When the soil was defrosted, the whole tree froze starting from peripheral twigs, whereas when the soil was frosted, the tree started to freeze from the trunk at the tree base [169].
4. Future Perspectives
For more sustainable agriculture, the development of tools providing real-time information on the health status of plants is highly demanded, as well as on their physical and physiological interactions with their micro- and macro-environment, from soil to atmosphere. In this sense, the progressive implementation of high-throughput analysis based on imaging sensors and big data have represented an outstanding innovation [72]. Automation allows rapid evaluations of plants and crops, avoiding subjectivity associated with visual assessments, reducing the cost of labor and permitting more frequent assessments on the same plants over time [21]. Indeed, thermography implemented in high-throughput facilities is contributing to the development of next-generation crops by crop breeders. However, before thermal sensing is adopted as a routine tool in agriculture and integrated into decision-making for a wide range of users, further research is necessary to address current challenges of the technology and interpretation of thermal data [13,76].
4.1. Future Technical Development of Thermography
TIR cameras suffer from challenges common to sensors for image acquisition. At the proximal sensor scale, the volume of plants that can be monitored at the same time is a limitation. On the other hand, standardized environments of measurements at a short distance from the target may complicate the scale up to the field. Indeed, at a remote sensing scale, atmospheric conditions are challenging. Wind makes the crops move around or may destabilize UAVs affecting the quality of images. Rain, fog, and other atmospheric factors could delay scheduled measurements. Even more, satellites could not cover the entire desired area or do it when atmospheric conditions are inadequate, reducing their time resolution or even limiting the measurements during long periods in the rainy seasons.
Operational conditions of TIR cameras must be observed, whereas technical features, such as sensitivity and accuracy, should be taken into consideration when handling thermal data to avoid misinterpretation of the results. Thermography also needs corrections to the accuracy of leaf or canopy measurements via the development of more accurate complementary measurements of atmospheric conditions disturbing the temperature of the vegetation. That would include wind speed and reflection of solar radiation on canopy surfaces, dependent on the intensity and quality of light affected by weather conditions on day flights, as reviewed in [15,80]. Particular attention must be paid to the spatial and temporal variations in these factors during the actual measurement. Even though the last generation of thermal cameras can make corrections for relative humidity and temperature of the air, these atmospheric parameters should be taken into account for other TIR sensors. These complementary measurements are needed to improve the quality of the thermal data and to help in interpreting thermal information [15]. The use of current UAVs minimizes the time-of-measurement effects [76]. On the other hand, flight altitude affects the measurements due to thermal infrared radiation attenuation by the atmosphere, requiring some corrections [65]. Focal length, related to the flying altitude, is another technical feature to take into consideration in airborne thermography [170]. Nonetheless, nanosatellites and new generation satellites with increasingly higher time and spatial resolution could be the future of remote sensing applied to agriculture [84].
Public datasets are progressively gaining relevance in plant phenotyping, as in many other research fields since they offer great opportunities for networking and collaboration. However, comparing data with other researchers is limited by technical features. A possible solution for this issue would be the development of a system of standardization (similar to those issued by the International Commission on Illumination, CIE) that could be adopted by the international community.
4.2. Strategies to Overcome the Intrinsic Non-Specificity of Thermal Patterns
Thermography is a sensitive tool for plant stress detection. However, alterations in leaf or canopy temperature are intrinsically unspecific for the stressor. Indeed, on crop fields under natural conditions, plant diseases are often found concurrent with abiotic stresses. Consequently, in terms of diagnosis, thermography must be used in combination with other phenomics techniques with the aim of finding distinctive patterns that better explain the etiology of the disorder, thus helping to cut down potential causes of disease. Appropriate management and control of abiotic stress factors considering the heterogeneities of the farmed land appear mandatory to avoid misinterpretations of the thermal imagery. For example, in orchards, water management can be improved by precise measurements of soil humidity by thermography, as reviewed by [171]. Thus, an accurate diagnosis and quantification of the extent and severity of disease-related symptoms can only be achieved based on a collection of inputs such as the geological features and history of the farmed land or weather conditions at the time of image collection.
Deep learning is key in the process of turning data into knowledge, particularly when thermography is integrated with other imaging techniques in a multidimensional analysis, as recently reviewed by [72]. Public accessibility and interoperability of datasets, from high-throughput phenotyping platforms and satellites, promoted by cooperative initiatives such as those funded by the International Plant Phenotyping Network (https://www.plant-phenotyping.org), are contributing to develop the potential of plant phenotyping [172].
4.3. Uses of Plant Thermography for Agriculture in the Near Future
In recent years, huge investments have been made in plant phenotyping facilities to support basic and applied research. Further work is needed to widen our knowledge on plant physiology upon stress as well as developing improved stress detection methods. Future research should also address the development of more general stress detection methods, valid for a range of plant species and growth conditions, including location, or even independent from those factors. The contribution of thermography to precision agriculture should not be limited to the detection of stress.
Thermography also appears as a very convenient tool to study other aspects of plants that are out of the scope of this review, such as seeds vigor [173], investigations on circadian rhythms [174,175], the effects of microgravity on plant physiology [176], interactions with plant-symbiotic microorganisms [177,178,179,180], the impact of climate change in ecology [15], or food industry [181]. Thermography is also a very relevant tool for screening for mutants [182,183] and cultivars [21] with desirable phenotypes such as pathogen resistance or improved performance upon certain abiotic stress conditions. In summary, thermography implemented in high-throughput facilities is contributing to the development of next-generation crops by crop breeders.
5. Concluding Remarks
The huge collection of works applying thermography to plants and crops shows that this technique is overcoming inherent constraints, being able to determine plant water status and to detect plant stress in a robust, reliable, low-cost way. On one hand, TIR stress indices are often more reliable than actual temperature values as they counteract the effects of ambient conditions on the measurement, providing good correlations with physiological parameters related to the plant water status. On the other hand, the combined use of thermography with other imaging sensors and the application of big data tools are an advantageous approach that allows identifying stressed plants and even evaluating the severity of symptoms. In spite of this, more detailed studies are needed to build a solid base of knowledge applicable to practitioners. Additionally, platforms based on imaging technologies should be developed to cover the needs of a wide range of end-users.
Author Contributions
Conceptualization, M.P., M.-L.P.-B. and M.B.; investigation, resources, M.P.; writing—original draft preparation, M.P. and M.-L.P.-B.; writing—review and editing, M.P., M.-L.P.-B. and M.B.; project administration, M.B.; funding acquisition, M.B. All authors have read and agreed to the published version of the manuscript.
Funding
This research was funded by Junta de Andalucía, grant number P12-AGR-0370, and Ministerio de Ciencia, Innovación y Universidades (MCIU) by Agencia Estatal de Investigación (AEI) and European Regional Development Fund (ERDF), grant number RTI2018-094652-B-I00.
Conflicts of Interest
The authors declare no conflict of interest. The funders had no role in the design of the study; in the collection, analyses, or interpretation of data; in the writing of the manuscript, or in the decision to publish the results.
References
- Stevanović, M.; Popp, A.; Lotze-Campen, H.; Dietrich, J.P.; Müller, C.; Bonsch, M.; Schmitz, C.; Bodirsky, B.L.; Humpenöder, F.; Weindl, I. The impact of high-end climate change on agricultural welfare. Sci. Adv. 2016, 2, e1501452. [Google Scholar] [CrossRef] [PubMed] [Green Version]
- Carvajal-Yepes, M.; Cardwell, K.; Nelson, A.; Garrett, K.A.; Giovani, B.; Saunders, D.G.O.; Kamoun, S.; Legg, J.P.; Verdier, V.; Lessel, J.; et al. A global surveillance system for crop diseases. Science 2019, 364, 1237–1239. [Google Scholar] [CrossRef] [PubMed] [Green Version]
- Zhan, J.; Thrall, P.H.; Papaïx, J.; Xie, L.; Burdon, J.J. Playing on a Pathogen’s Weakness: Using Evolution to Guide Sustainable Plant Disease Control Strategies. Annu. Rev. Phytopathol. 2015, 53, 19–43. [Google Scholar] [CrossRef] [PubMed]
- Mahlein, A.-K. Plant disease detection by imaging sensors—Parallels and specific demands for precision agriculture and plant phenotyping. Plant Dis. 2016, 100, 241–251. [Google Scholar] [CrossRef] [PubMed] [Green Version]
- Jones, H. Plants and Microclimate: A Quantitative Approach to Environmental Plant Physiology, 3rd ed.; Cambridge University Press: Cambridge, UK, 2014; Volume 56. [Google Scholar]
- Prashar, A.; Yildiz, J.; McNicol, J.W.; Bryan, G.J.; Jones, H.G. Infra-red thermography for high throughput field phenotyping in Solanum tuberosum. PLoS ONE 2013, 8, e65816. [Google Scholar] [CrossRef] [PubMed]
- Milthorpe, F.L.; Spencer, E.J. Experimental studies of the factors controlling transpiration. J. Exp. Bot. 1957, 8, 413–437. [Google Scholar] [CrossRef]
- Scarth, G.W.; Loewy, A.; Shaw, M. Use of the infrared total absorption method for estimating the time course of photosynthesis and transpiration. Can. J. Res. 1948, 26c, 94–107. [Google Scholar] [CrossRef]
- Fuchs, M.; Tanner, C.B. Infrared thermometry of vegetation. Agron. J. 1966, 58, 597–601. [Google Scholar] [CrossRef]
- Jones, H.G. Use of thermography for quantitative studies of spatial and temporal variation of stomatal conductance over leaf surfaces. Plantcell Environ. 1999, 22, 1043–1055. [Google Scholar] [CrossRef] [Green Version]
- Jones, H.G. Application of thermal imaging and infrared sensing in plant physiology and ecophysiology. In Advances in Botanical Research; Academic Press: Cambridge, MA, USA, 2004; Volume 41, pp. 107–163. [Google Scholar]
- Ishimwe, R.; Abutaleb, K.; Ahmed, F. Applications of thermal imaging in agriculture—A review. Adv. Remote Sens. 2014, 3, 13. [Google Scholar] [CrossRef] [Green Version]
- Khanal, S.; Fulton, J.; Shearer, S. An overview of current and potential applications of thermal remote sensing in precision agriculture. Comput. Electron. Agric. 2017, 139, 22–32. [Google Scholar] [CrossRef]
- Chaerle, L.; Van der Straeten, D. Seeing is believing: Imaging techniques to monitor plant health. Biochim. Biophys. Acta 2001, 1519, 153–166. [Google Scholar] [CrossRef]
- Still, C.; Powell, R.; Aubrecht, D.; Kim, Y.; Helliker, B.; Roberts, D.; Richardson, A.D.; Goulden, M. Thermal imaging in plant and ecosystem ecology: Applications and challenges. Ecosphere 2019, 10, e02768. [Google Scholar] [CrossRef] [Green Version]
- Idso, S.B.; Jackson, R.D.; Pinter, P.J.; Reginato, R.J.; Hatfield, J.L. Normalizing the stress-degree-day parameter for environmental variability. Agric. Meteorol. 1981, 24, 45–55. [Google Scholar] [CrossRef]
- Jackson, R.D.; Idso, S.B.; Reginato, R.J.; Pinter, P.J. Canopy temperature as a crop water stress indicator. Water Resour. Res. 1981, 17, 1133–1138. [Google Scholar] [CrossRef]
- Jones, H.G. Use of infrared thermometry for estimation of stomatal conductance as a possible aid to irrigation scheduling. Agric. For. Meteorol. 1999, 95, 139–149. [Google Scholar] [CrossRef]
- Lindenthal, M.; Steiner, U.; Dehne, H.W.; Oerke, E.C. Effect of downy mildew development on transpiration of cucumber leaves visualized by digital infrared thermography. Phytopathology 2005, 95, 233–240. [Google Scholar] [CrossRef] [Green Version]
- Saglam, A.; Chaerle, L.; Van Der Straeten, D.; Valcke, R. Promising monitoring techniques for plant science: Thermal and chlorophyll fluorescence imaging. In Photosynthesis, Productivity and Environmental Stress; Wiley: Hoboken, NJ, USA, 2019; pp. 241–266. [Google Scholar] [CrossRef]
- Simko, I.; Jiménez-Berni, J.A.; Sirault, X.R.R. Phenomic approaches and tools for phytopathologists. Phytopathology 2017, 107, 6–17. [Google Scholar] [CrossRef] [Green Version]
- Elsayed, S.; Rischbeck, P.; Schmidhalter, U. Comparing the performance of active and passive reflectance sensors to assess the normalized relative canopy temperature and grain yield of drought-stressed barley cultivars. Field Crop. Res. 2015, 177, 148–160. [Google Scholar] [CrossRef]
- Jones, H.G.; Stoll, M.; Santos, T.; de Sousa, C.; Chaves, M.M.; Grant, O.M. Use of infrared thermography for monitoring stomatal closure in the field: Application to grapevine. J. Exp. Bot. 2002, 53, 2249–2260. [Google Scholar] [CrossRef]
- Heermann, D.; Duke, H. Electrical load and water management. Proc. Annu. Tech. Conf. 1978, 1978, 60–67. [Google Scholar]
- Mastrodimos, N.; Lentzou, D.; Templalexis, C.; Tsitsigiannis, D.I.; Xanthopoulos, G. Development of thermography methodology for early diagnosis of fungal infection in table grapes: The case of Aspergillus carbonarius. Comput. Electron. Agric. 2019, 165, 104972. [Google Scholar] [CrossRef]
- Idso, S.B.; Jackson, R.D.; Reginato, R.J. Remote-sensing of crop yields. Science 1977, 196, 19–25. [Google Scholar] [CrossRef] [PubMed]
- Idso, S.B.; Reginato, R.J.; Jackson, R.D.; Pinter, P.J. Foliage and air temperatures: Evidence for a dynamic “equivalence point”. Agric. Meteorol. 1981, 24, 223–226. [Google Scholar] [CrossRef]
- Lima, R.; García-Tejero, I.; Lopes, T.; Costa, J.; Vaz, M.; Durán-Zuazo, V.; Chaves, M.; Glenn, D.; Campostrini, E. Linking thermal imaging to physiological indicators in Carica papaya L. under different watering regimes. Agric. Water Manag. 2016, 164, 148–157. [Google Scholar] [CrossRef]
- Baluja, J.; Diago, M.P.; Balda, P.; Zorer, R.; Meggio, F.; Morales, F.; Tardaguila, J. Assessment of vineyard water status variability by thermal and multispectral imagery using an unmanned aerial vehicle (UAV). Irrig. Sci. 2012, 30, 511–522. [Google Scholar] [CrossRef]
- Jiménez-Berni, J.A.; Zarco-Tejada, P.J.; Suárez, L.; Fereres, E. Thermal and narrowband multispectral remote sensing for vegetation monitoring from an unmanned aerial vehicle. IEEE Trans. Geosci. Remote 2009, 47, 722–738. [Google Scholar] [CrossRef] [Green Version]
- Ben-Gal, A.; Agam, N.; Alchanatis, V.; Cohen, Y.; Yermiyahu, U.; Zipori, I.; Presnov, E.; Sprintsin, M.; Dag, A. Evaluating water stress in irrigated olives: Correlation of soil water status, tree water status, and thermal imagery. Irrig. Sci. 2009, 27, 367–376. [Google Scholar] [CrossRef]
- Ballester, C.; Castel, J.; Jimenez-Bello, M.A.; Castel, J.R.; Intrigliolo, D.S. Thermographic measurement of canopy temperature is a useful tool for predicting water deficit effects on fruit weight in citrus trees. Agric. Water Manag. 2013, 122, 1–6. [Google Scholar] [CrossRef]
- Ballester, C.; Jimenez-Bello, M.A.; Castel, J.R.; Intrigliolo, D.S. Usefulness of thermography for plant water stress detection in citrus and persimmon trees. Agric. For. Meteorol. 2013, 168, 120–129. [Google Scholar] [CrossRef]
- García-Tejero, I.; Durán-Zuazo, V.H.; Arriaga, J.; Hernández, A.; Vélez, L.M.; Muriel-Fernández, J.L. Approach to assess infrared thermal imaging of almond trees under water-stress conditions. Fruits 2012, 67, 463–474. [Google Scholar] [CrossRef]
- González-Dugo, V.; Zarco-Tejada, P.; Jiménez-Berni, J.A.; Suárez, L.; Goldhamer, D.; Fereres, E. Almond tree canopy temperature reveals intra-crown variability that is water stress-dependent. Agric. For. Meteorol. 2012, 154–155, 156–165. [Google Scholar] [CrossRef]
- Coupel-Ledru, A.; Pallas, B.; Delalande, M.; Boudon, F.; Carrie, E.; Martinez, S.; Regnard, J.L.; Costes, E. Multi-scale high-throughput phenotyping of apple architectural and functional traits in orchard reveals genotypic variability under contrasted watering regimes. Hortic. Res. Engl. 2019, 6, 15. [Google Scholar] [CrossRef] [PubMed] [Green Version]
- Ludovisi, R.; Tauro, F.; Salvati, R.; Khoury, S.; Mugnozza, G.S.; Harfouche, A. UAV-based thermal imaging for high-throughput field phenotyping of black poplar response to drought. Front. Plant Sci. 2017, 8, 18. [Google Scholar] [CrossRef]
- Pagay, V.; Kidman, C.M. Evaluating remotely-sensed grapevine (Vitis vinifera L.) water stress responses across a viticultural region. Agronomy 2019, 9, 682. [Google Scholar] [CrossRef] [Green Version]
- Sepulcre-Cantó, G.; Zarco-Tejada, P.J.; Jiménez-Muñoz, J.C.; Sobrino, J.A.; de Miguel, E.; Villalobos, F.J. Detection of water stress in an olive orchard with thermal remote sensing imagery. Agric. For. Meteorol. 2006, 136, 31–44. [Google Scholar] [CrossRef]
- González-Dugo, V.; Zarco-Tejada, P.; Nicolas, E.; Nortes, P.A.; Alarcón, J.J.; Intrigliolo, D.S.; Fereres, E. Using high resolution UAV thermal imagery to assess the variability in the water status of five fruit tree species within a commercial orchard. Precis. Agric. 2013, 14, 660–678. [Google Scholar] [CrossRef]
- García-Tejero, I.F.; Hernández, A.; Rodríguez, V.; Ponce, J.; Ramos, V.; Muriel, J.; Durán Zuazo, V. Estimating almond crop coefficients and physiological response to water stress in semiarid environments (SW Spain). J. Agric. Sci. Technol. 2015, 17, 1255–1266. [Google Scholar]
- Gómez-Candón, D.; Virlet, N.; Labbé, S.; Jolivot, A.; Regnard, J.-L. Field phenotyping of water stress at tree scale by UAV-sensed imagery: New insights for thermal acquisition and calibration. Precis. Agric. 2016, 17, 786–800. [Google Scholar] [CrossRef]
- Blaya-Ros, P.J.; Blanco, V.; Domingo, R.; Soto-Valles, F.; Torres-Sánchez, R. Feasibility of low-cost thermal imaging for monitoring water stress in young and mature sweet cherry trees. Appl. Sci. 2020, 10, 5461. [Google Scholar] [CrossRef]
- Leinonen, I.; Jones, H.G. Combining thermal and visible imagery for estimating canopy temperature and identifying plant stress. J. Exp. Bot. 2004, 55, 1423–1431. [Google Scholar] [CrossRef] [PubMed] [Green Version]
- Masseroni, D.; Ortuani, B.; Corti, M.; Gallina, P.M.; Cocetta, G.; Ferrante, A.; Facchi, A. Assessing the reliability of thermal and optical imaging techniques for detecting crop water status under different nitrogen levels. Sustainability 2017, 9, 1548. [Google Scholar] [CrossRef] [Green Version]
- Grant, O.M.; Tronina, L.; Jones, H.G.; Chaves, M.M. Exploring thermal imaging variables for the detection of stress responses in grapevine under different irrigation regimes. J. Exp. Bot. 2007, 58, 815–825. [Google Scholar] [CrossRef] [PubMed]
- Möller, M.; Alchanatis, V.; Cohen, Y.; Meron, M.; Tsipris, J.; Naor, A.; Ostrovsky, V.; Sprintsin, M.; Cohen, S. Use of thermal and visible imagery for estimating crop water status of irrigated grapevine. J. Exp. Bot. 2007, 58, 827–838. [Google Scholar] [CrossRef] [Green Version]
- Sepúlveda-Reyes, D.; Ingram, B.; Bardeen, M.; Zúñiga, M.; Ortega-Farías, S.; Poblete-Echeverría, C. Selecting canopy zones and thresholding approaches to assess grapevine water status by using aerial and ground-based thermal imaging. Remote Sens. 2016, 8, 822. [Google Scholar] [CrossRef] [Green Version]
- Santesteban, L.G.; Di Gennaro, S.F.; Herrero-Langreo, A.; Miranda, C.; Royo, J.B.; Matese, A. High-resolution UAV-based thermal imaging to estimate the instantaneous and seasonal variability of plant water status within a vineyard. Agric. Water Manag. 2017, 183, 49–59. [Google Scholar] [CrossRef]
- Gago, J.; Martorell, S.; Tomás, M.; Pou, A.; Millán, B.; Ramón, J.; Ruiz, M.; Sánchez, R.; Galmés, J.; Conesa, M. High-resolution aerial thermal imagery for plant water status assessment in vineyards using a multicopter-RPAS. In Proceedings of the VII Congreso Ibérico de Agroingenieria y Ciencias Hortícolas, Madrid, Spain, 26–29 August 2013. [Google Scholar]
- Pou, A.; Diago, M.P.; Medrano, H.; Baluja, J.; Tardaguila, J. Validation of thermal indices for water status identification in grapevine. Agric. Water Manag. 2014, 134, 60–72. [Google Scholar] [CrossRef]
- García-Tejero, I.F.; Costa, J.M.; Egipto, R.; Durán-Zuazo, V.H.; Lima, R.S.N.; Lopes, C.M.; Chaves, M.M. Thermal data to monitor crop-water status in irrigated Mediterranean viticulture. Agric. Water Manag. 2016, 176, 80–90. [Google Scholar] [CrossRef]
- Egea, G.; Padilla-Díaz, C.M.; Martinez-Guanter, J.; Fernández, J.E.; Pérez-Ruiz, M. Assessing a crop water stress index derived from aerial thermal imaging and infrared thermometry in super-high density olive orchards. Agric. Water Manag. 2017, 187, 210–221. [Google Scholar] [CrossRef] [Green Version]
- Rud, R.; Cohen, Y.; Alchanatis, V.; Levi, A.; Brikman, R.; Shenderey, C.; Heuer, B.; Markovitch, T.; Dar, Z.; Rosen, C.; et al. Crop water stress index derived from multi-year ground and aerial thermal images as an indicator of potato water status. Precis. Agric. 2014, 15, 273–289. [Google Scholar] [CrossRef]
- García-Tejero, I.; Rubio, A.; Viñuela, I.; Hernández, A.; Gutiérrez-Gordillo, S.; Rodríguez-Pleguezuelo, C.; Durán-Zuazo, V. Thermal imaging at plant level to assess the crop-water status in almond trees (cv. Guara) under deficit irrigation strategies. Agric. Water Manag. 2018, 208, 176–186. [Google Scholar] [CrossRef]
- González-Dugo, V.; Goldhamer, D.; Zarco-Tejada, P.; Fereres, E. Improving the precision of irrigation in a pistachio farm using an unmanned airborne thermal system. Irrig. Sci. 2015, 33, 43–52. [Google Scholar] [CrossRef]
- Belfiore, N.; Vinti, R.; Lovat, L.; Chitarra, W.; Tomasi, D.; De Bei, R.; Meggio, F.; Gaiotti, F. Infrared thermography to estimate vine water status: Optimizing canopy measurements and thermal indices for the varieties merlot and moscato in northern Italy. Agronomy 2019, 9, 821. [Google Scholar] [CrossRef] [Green Version]
- Cohen, Y.; Alchanatis, V.; Meron, M.; Saranga, Y.; Tsipris, J. Estimation of leaf water potential by thermal imagery and spatial analysis. J. Exp. Bot. 2005, 56, 1843–1852. [Google Scholar] [CrossRef] [Green Version]
- Jiménez-Berni, J.A.; Zarco-Tejada, P.J.; Sepulcre-Cantó, G.; Fereres, E.; Villalobos, F. Mapping canopy conductance and CWSI in olive orchards using high resolution thermal remote sensing imagery. Remote Sens. Environ. 2009, 113, 2380–2388. [Google Scholar] [CrossRef]
- Mangus, D.L.; Sharda, A.; Zhang, N. Development and evaluation of thermal infrared imaging system for high spatial and temporal resolution crop water stress monitoring of corn within a greenhouse. Comput. Electron. Agric. 2016, 121, 149–159. [Google Scholar] [CrossRef]
- Elsayed, S.; Elhoweity, M.; Ibrahim, H.H.; Dewir, Y.H.; Migdadi, H.M.; Schmidhalter, U. Thermal imaging and passive reflectance sensing to estimate the water status and grain yield of wheat under different irrigation regimes. Agric. Water Manag. 2017, 189, 98–110. [Google Scholar] [CrossRef]
- Zúñiga-Espinoza, C.; Khot, L.R.; Sankaran, S.; Jacoby, P.W. High resolution multispectral and thermal remote sensing-based water stress assessment in subsurface irrigated grapevines. Remote Sens. 2017, 9, 961. [Google Scholar] [CrossRef] [Green Version]
- Zarco-Tejada, P.J.; González-Dugo, V.; Jiménez-Berni, J.A. Fluorescence, temperature and narrow-band indices acquired from a UAV platform for water stress detection using a micro-hyperspectral imager and a thermal camera. Remote Sens. Environ. 2012, 117, 322–337. [Google Scholar] [CrossRef]
- Padhi, J.; Misra, R.K.; Payero, J.O. Estimation of soil water deficit in an irrigated cotton field with infrared thermography. Field Crop. Res. 2012, 126, 45–55. [Google Scholar] [CrossRef] [Green Version]
- Crusiol, L.G.T.; Nanni, M.R.; Furlanetto, R.H.; Sibaldelli, R.N.R.; Cezar, E.; Mertz-Henning, L.M.; Nepomuceno, A.L.; Neumaier, N.; Farias, J.R.B. UAV-based thermal imaging in the assessment of water status of soybean plants. Int. J. Remote Sens. 2020, 41, 3243–3265. [Google Scholar] [CrossRef]
- Siddiqui, Z.S.; Cho, J.-I.; Park, S.-H.; Kwon, T.-R.; Lee, G.-S.; Jeong, M.-J.; Kim, K.-W.; Lee, S.-K.; Park, S.-C. Phenotyping of rice in salt stress environment using high-throughput infrared imaging. Acta Bot. Croat. 2014, 73, 149–158. [Google Scholar] [CrossRef] [Green Version]
- Sirault, X.R.R.; James, R.A.; Furbank, R.T. A new screening method for osmotic component of salinity tolerance in cereals using infrared thermography. Funct. Plant Biol. 2009, 36, 970–977. [Google Scholar] [CrossRef] [PubMed]
- Zeng, W.; Melotto, M.; He, S.Y. Plant stomata: A checkpoint of host immunity and pathogen virulence. Curr. Opin. Biotechnol. 2010, 21, 599–603. [Google Scholar] [CrossRef] [Green Version]
- Roitsch, T.; Cabrera-Bosquet, L.; Fournier, A.; Ghamkhar, K.; Jiménez-Berni, J.A.; Pinto, F.; Ober, E.S. Review: New sensors and data-driven approaches—A path to next generation phenomics. Plant Sci. 2019, 282, 2–10. [Google Scholar] [CrossRef]
- Sperschneider, J. Machine learning in plant–pathogen interactions: Empowering biological predictions from field scale to genome scale. New Phytol. 2019. [Google Scholar] [CrossRef] [Green Version]
- Singh, A.; Ganapathysubramanian, B.; Singh, A.K.; Sarkar, S. Machine learning for high-throughput stress phenotyping in plants. Trends Plant Sci. 2016, 21, 110–124. [Google Scholar] [CrossRef] [Green Version]
- Gao, Z.; Luo, Z.; Zhang, W.; Lv, Z.; Xu, Y. Deep learning application in plant stress imaging: A review. AgriEngineering 2020, 2, 430–446. [Google Scholar] [CrossRef]
- Liakos, K.G.; Busato, P.; Moshou, D.; Pearson, S.; Bochtis, D. Machine learning in agriculture: A review. Sensors 2018, 18, 2674. [Google Scholar] [CrossRef] [Green Version]
- Jones, H.G. Thermal imaging and infrared sensing in plant ecophysiology. In Advances in Plant Ecophysiology Techniques; Springer: Berlin, Germany, 2018; pp. 135–151. [Google Scholar] [CrossRef]
- Vialet-Chabrand, S.; Lawson, T. Dynamic leaf energy balance: Deriving stomatal conductance from thermal imaging in a dynamic environment. J. Exp. Bot. 2019, 70, 2839–2855. [Google Scholar] [CrossRef] [PubMed] [Green Version]
- Messina, G.; Modica, G. Applications of UAV thermal imagery in precision agriculture: State of the art and future research outlook. Remote Sens. 2020, 12, 1491. [Google Scholar] [CrossRef]
- Prashar, A.; Jones, H.G. Infra-red thermography as a high-throughput tool for field phenotyping. Agronomy 2014, 4, 397–417. [Google Scholar] [CrossRef]
- Kelly, J.; Kljun, N.; Olsson, P.-O.; Mihai, L.; Liljeblad, B.; Weslien, P.; Klemedtsson, L.; Eklundh, L. Challenges and best practices for deriving temperature data from an uncalibrated UAV thermal infrared camera. Remote Sens. 2019, 11, 567. [Google Scholar] [CrossRef] [Green Version]
- Zhang, J.; Huang, Y.; Pu, R.; Gonzalez-Moreno, P.; Yuan, L.; Wu, K.; Huang, W. Monitoring plant diseases and pests through remote sensing technology: A review. Comput. Electron. Agric. 2019, 165, 104943. [Google Scholar] [CrossRef]
- Sagan, V.; Maimaitijiang, M.; Sidike, P.; Eblimit, K.; Peterson, K.T.; Hartling, S.; Esposito, F.; Khanal, K.; Newcomb, M.; Pauli, D. UAV-based high resolution thermal imaging for vegetation monitoring, and plant phenotyping using ICI 8640 P, FLIR Vue Pro R 640, and thermoMap cameras. Remote Sens. 2019, 11, 330. [Google Scholar] [CrossRef] [Green Version]
- Costa, J.M.; Marques da Silva, J.; Pinheiro, C.; Barón, M.; Mylona, P.; Centritto, M.; Haworth, M.; Loreto, F.; Uzilday, B.; Turkan, I.; et al. Opportunities and limitations of crop phenotyping in southern European countries. Front. Plant Sci. 2019, 10, 1125. [Google Scholar] [CrossRef] [Green Version]
- Li, Z.; Guo, R.; Li, M.; Chen, Y.; Li, G. A review of computer vision technologies for plant phenotyping. Comput. Electron. Agric. 2020, 176, 105672. [Google Scholar] [CrossRef]
- Zhang, C.; Valente, J.; Kooistra, L.; Guo, L.; Wang, W. Opportunities of UAVs in orchard management. Int. Arch. Photogramm. Remote Sens. Spat. Inf. Sci. 2019, XLII-2/W13, 673–680. [Google Scholar] [CrossRef] [Green Version]
- Maes, W.H.; Steppe, K. Perspectives for remote sensing with unmanned aerial vehicles in precision agriculture. Trends Plant Sci. 2019, 24, 152–164. [Google Scholar] [CrossRef]
- Barbedo, J.G.A. A review on the use of unmanned aerial vehicles and imaging sensors for monitoring and assessing plant stresses. Drones 2019, 3, 40. [Google Scholar] [CrossRef] [Green Version]
- Sawinski, K.; Mersmann, S.; Robatzek, S.; Bohmer, M. Guarding the green: Pathways to stomatal immunity. Mol. Plant Microbe Ineract. 2013, 26, 626–632. [Google Scholar] [CrossRef] [PubMed]
- Agurla, S.; Raghavendra, A.S. Convergence and divergence of signaling events in guard cells during stomatal closure by plant hormones or microbial elicitors. Front. Plant Sci. 2016, 7, 1332. [Google Scholar] [CrossRef] [PubMed] [Green Version]
- Barón, M.; Pineda, M.; Pérez-Bueno, M.L. Picturing pathogen infection in plants. Z. Naturforsch. C Bio. Sci. 2016, 71, 355–368. [Google Scholar] [CrossRef]
- Grimmer, M.K.; John Foulkes, M.; Paveley, N.D. Foliar pathogenesis and plant water relations: A review. J. Exp. Bot. 2012, 63, 4321–4331. [Google Scholar] [CrossRef] [Green Version]
- Smigaj, M.; Gaulton, R.; Suárez, J.C.; Barr, S.L. Canopy temperature from an Unmanned Aerial Vehicle as an indicator of tree stress associated with red band needle blight severity. For. Ecol. Manag. 2019, 433, 699–708. [Google Scholar] [CrossRef]
- Montero, R.; Pérez-Bueno, M.L.; Barón, M.; Florez-Sarasa, I.; Tohge, T.; Fernie, A.R.; El Aou Ouad, H.; Flexas, J.; Bota, J. Alterations in primary and secondary metabolism in Vitis vinifera ‘Malvasía de Banyalbufar’ upon infection with Grapevine leafroll associated virus 3 (GLRaV-3). Physiol. Plant. 2016, 157, 442–452. [Google Scholar] [CrossRef]
- Chaerle, L.; Hagenbeek, D.; De Bruyne, E.; Valcke, R.; Van der Straeten, D. Thermal and chlorophyll-fluorescence imaging distinguish plant-pathogen interactions at an early stage. Plant Cell Physiol. 2004, 45, 887–896. [Google Scholar] [CrossRef] [Green Version]
- Chaerle, L.; Pineda, M.; Romero-Aranda, R.; Van der Straeten, D.; Barón, M. Robotized thermal and chlorophyll fluorescence imaging of Pepper mild mottle virus infection in Nicotiana benthamiana. Plant Cell Physiol. 2006, 47, 1323–1336. [Google Scholar] [CrossRef] [Green Version]
- Berdugo, C.A.; Zito, R.; Paulus, S.; Mahlein, A.K. Fusion of sensor data for the detection and differentiation of plant diseases in cucumber. Plant Pathol. 2014, 63, 1344–1356. [Google Scholar] [CrossRef]
- Wang, L.; Poque, S.; Valkonen, J.P. Phenotyping viral infection in sweetpotato using a high-throughput chlorophyll fluorescence and thermal imaging platform. Plant Methods 2019, 15, 116. [Google Scholar] [CrossRef] [PubMed] [Green Version]
- Schurr, U.; Schuberth, B.; Aloni, R.; Pradel, K.S.; Schmundt, D.; Jahne, B.; Ullrich, C.I. Structural and functional evidence for xylem-mediated water transport and high transpiration in Agrobacterium tumefaciens-induced tumors of Ricinus communis. Bot. Acta 1996, 109, 405–411. [Google Scholar] [CrossRef]
- Boccara, M.; Boue, C.; Garmier, M.; De Paepe, R.; Boccara, A.C. Infra-red thermography revealed a role for mitochondria in pre-symptomatic cooling during harpin-induced hypersensitive response. Plant J. 2001, 28, 663–670. [Google Scholar] [CrossRef] [PubMed]
- Maes, W.H.; Minchin, P.E.H.; Snelgar, W.P.; Steppe, K. Early detection of Psa infection in kiwifruit by means of infrared thermography at leaf and orchard scale. Funct. Plant Biol. 2014, 41, 1207–1220. [Google Scholar] [CrossRef] [PubMed]
- Zheng, X.Y.; Spivey, N.W.; Zeng, W.; Liu, P.P.; Fu, Z.Q.; Klessig, D.F.; He, S.Y.; Dong, X. Coronatine promotes Pseudomonas syringae virulence in plants by activating a signaling cascade that inhibits salicylic acid accumulation. Cell Host Microbe 2012, 11, 587–596. [Google Scholar] [CrossRef] [PubMed] [Green Version]
- Pérez-Bueno, M.L.; Pineda, M.; Díaz-Casado, E.; Barón, M. Spatial and temporal dynamics of primary and secondary metabolism in Phaseolus vulgaris challenged by Pseudomonas syringae. Physiol. Plant. 2015, 153, 161–174. [Google Scholar] [CrossRef] [PubMed]
- Pérez-Bueno, M.L.; Granum, E.; Pineda, M.; Flors, V.; Rodríguez-Palenzuela, P.; López-Solanilla, E.; Barón, M. Temporal and spatial resolution of activated plant defense responses in leaves of Nicotiana benthamiana infected with Dickeya dadantii. Front. Plant Sci. 2016, 6, 1209. [Google Scholar] [CrossRef] [Green Version]
- Pineda, M.; Pérez-Bueno, M.L.; Barón, M. Detection of bacterial infection in melon plants by classification methods based on imaging data. Front. Plant Sci. 2018, 9, 164. [Google Scholar] [CrossRef] [Green Version]
- Pineda, M.; Luisa Perez-Bueno, M.; Paredes, V.; Baron, M. Use of multicolour fluorescence imaging for diagnosis of bacterial and fungal infection on zucchini by implementing machine learning. Funct. Plant Biol. 2017, 44, 563–572. [Google Scholar] [CrossRef] [Green Version]
- Pérez-Bueno, M.L.; Pineda, M.; Cabeza, F.; Barón Ayala, M. Multicolor fluorescence imaging as a candidate for disease detection in plant phenotyping. Front. Plant Sci. 2016, 7, 1790. [Google Scholar] [CrossRef] [Green Version]
- Hellebrand, H.J.; Herppich, W.B.; Beuche, H.; Dammer, K.-H.; Linke, M.; Flath, K. Investigations of plant infections by thermal vision and NIR imaging. Int. Agrophys. 2006, 20, 1–10. [Google Scholar]
- Yao, Z.; He, D.; Lei, Y. Thermal imaging for early nondestructive detection of wheat stripe rust. In Proceedings of the 2018 ASABE Annual International Meeting, Detroit, MI, USA, 29 July–1 August 2018; p. 1801728. [Google Scholar]
- Wen, D.-M.; Chen, M.-X.; Zhao, L.; Ji, T.; Li, M.; Yang, X.-T. Use of thermal imaging and Fourier transform infrared spectroscopy for the pre-symptomatic detection of cucumber downy mildew. Eur. J. Plant Pathol. 2019, 155, 405–416. [Google Scholar] [CrossRef]
- Oerke, E.C.; Steiner, U.; Dehne, H.W.; Lindenthal, M. Thermal imaging of cucumber leaves affected by downy mildew and environmental conditions. J. Exp. Bot. 2006, 57, 2121–2132. [Google Scholar] [CrossRef] [PubMed]
- Jafari, M.; Minaei, S.; Safaie, N. Detection of pre-symptomatic rose powdery-mildew and gray-mold diseases based on thermal vision. Infrared Phys. Technol. 2017, 85, 170–183. [Google Scholar] [CrossRef]
- Raza, S.; Prince, G.; Clarkson, J.P.; Rajpoot, N.M. Automatic detection of diseased tomato plants using thermal and stereo visible light images. PLoS ONE 2015, 10, e0123262. [Google Scholar] [CrossRef]
- Oerke, E.C.; Fröhling, P.; Steiner, U. Thermographic assessment of scab disease on apple leaves. Precis. Agric. 2011, 12, 699–715. [Google Scholar] [CrossRef]
- Belin, É.; Rousseau, D.; Boureau, T.; Caffier, V. Thermography versus chlorophyll fluorescence imaging for detection and quantification of apple scab. Comput. Electron. Agric. 2013, 90, 159–163. [Google Scholar] [CrossRef]
- Sandmann, M.; Grosch, R.; Graefe, J. The use of features from fluorescence, thermography, and NDVI imaging to detect biotic stress in lettuce. Plant Dis. 2018, 102, 1101–1107. [Google Scholar] [CrossRef] [Green Version]
- Wang, M.; Ling, N.; Dong, X.; Zhu, Y.; Shen, Q.; Guo, S. Thermographic visualization of leaf response in cucumber plants infected with the soil-borne pathogen Fusarium oxysporum f. sp. cucumerinum. Plant Physiol. Biochem. 2012, 61, 153–161. [Google Scholar] [CrossRef]
- Rispail, N.; Rubiales, D. Rapid and efficient estimation of pea resistance to the soil-borne pathogen Fusarium oxysporum by infrared imaging. Sensors 2015, 15, 3988–4000. [Google Scholar] [CrossRef] [Green Version]
- Baranowski, P.; Jedryczka, M.; Mazurek, W.; Babula-Skowronska, D.; Siedliska, A.; Kaczmarek, J. Hyperspectral and thermal imaging of oilseed rape (Brassica napus) response to fungal species of the genus Alternaria. PLoS ONE 2015, 10, e0122913. [Google Scholar] [CrossRef] [PubMed] [Green Version]
- Chaerle, L.; Hagenbeek, D.; Vanrobaeys, X.; Van Der Straeten, D. Early detection of nutrient and biotic stress in Phaseolus vulgaris. Int. J. Remote Sens. 2007, 28, 3479–3492. [Google Scholar] [CrossRef]
- Ploetz, R.; Schaffer, B. Effects of flooding and Phytophthora root rot on net gas exchange and growth of avocado. Phytopathology 1989, 79, 204–208. [Google Scholar] [CrossRef]
- Granum, E.; Pérez-Bueno, M.L.; Calderón, C.E.; Ramos, C.; de Vicente, A.; Cazorla, F.M.; Barón, M. Metabolic responses of avocado plants to stress induced by Rosellinia necatrix analysed by fluorescence and thermal imaging. Eur. J. Plant Pathol. 2015, 142, 625–632. [Google Scholar] [CrossRef]
- Pérez-Bueno, M.L.; Pineda, M.; Vida, C.; Fernández-Ortuño, D.; Torés, J.A.; de Vicente, A.; Cazorla, F.M.; Barón, M. Detection of white root rot in avocado trees by remote sensing. Plant Dis. 2019, 103, 1119–1125. [Google Scholar] [CrossRef]
- Aldea, M.; Hamilton, J.G.; Resti, J.P.; Zangerl, A.R.; Berenbaum, M.R.; DeLucia, E.H. Indirect effects of insect herbivory on leaf gas exchange in soybean. Plant Cell Environ. 2005, 28, 402–411. [Google Scholar] [CrossRef]
- Tang, J.Y.; Zielinski, R.E.; Zangerl, A.R.; Crofts, A.R.; Berenbaum, M.R.; DeLucia, E.H. The differential effects of herbivory by first and fourth instars of Trichoplusia ni (Lepidoptera: Noctuidae) on photosynthesis in Arabidopsis thaliana. J. Exp. Bot. 2006, 57, 527–536. [Google Scholar] [CrossRef] [Green Version]
- Nabity, P.D.; Zavala, J.A.; DeLucia, E.H. Herbivore induction of jasmonic acid and chemical defences reduce photosynthesis in Nicotiana attenuata. J. Exp. Bot. 2013, 64, 685–694. [Google Scholar] [CrossRef] [Green Version]
- Nabity, P.D.; Hillstrom, M.L.; Lindroth, R.L.; DeLucia, E.H. Elevated CO2 interacts with herbivory to alter chlorophyll fluorescence and leaf temperature in Betula papyrifera and Populus tremuloides. Oecologia 2012, 169, 905–913. [Google Scholar] [CrossRef]
- Joalland, S.; Screpanti, C.; Liebisch, F.; Varella, H.V.; Gaume, A.; Walter, A. Comparison of visible imaging, thermography and spectrometry methods to evaluate the effect of Heterodera schachtii inoculation on sugar beets. Plant Methods 2017, 13, 14. [Google Scholar] [CrossRef]
- Ortiz-Bustos, C.M.; Pérez-Bueno, M.L.; Barón, M.; Molinero-Ruiz, L. Use of blue-green fluorescence and thermal imaging in the early detection of sunflower infection by the root parasitic weed Orobanche cumana Wallr. Front. Plant Sci. 2017, 8, 833. [Google Scholar] [CrossRef] [PubMed] [Green Version]
- Sankaran, S.; Mishra, A.; Ehsani, R.; Davis, C. A review of advanced techniques for detecting plant diseases. Comput. Electron. Agric. 2010, 72, 1–13. [Google Scholar] [CrossRef]
- Schmitz, A.; Kiewnick, S.; Schlang, J.; Sikora, R.A. Use of high resolution digital thermography to detect Heterodera schachtii infestation in sugar beets. Commun. Agric. Appl. Biol. Sci. 2004, 69, 359–363. [Google Scholar] [PubMed]
- Wang, Y.; Zia-Khan, S.; Owusu-Adu, S.; Miedaner, T.; Müller, J. Early detection of Zymoseptoria tritici in winter wheat by infrared thermography. Agriculture 2019, 9, 139. [Google Scholar] [CrossRef] [Green Version]
- Park, J.; Kim, K.W. Outdoor infrared imaging for spatial and temporal thermography: A case study of necrotic versus healthy leaf areas on woody plants. J. Phytopathol. 2020. [Google Scholar] [CrossRef]
- Aldea, M.; Hamilton, J.G.; Resti, J.P.; Zangerl, A.R.; Berenbaum, M.R.; Frank, T.D.; Delucia, E.H. Comparison of photosynthetic damage from arthropod herbivory and pathogen infection in understory hardwood saplings. Oecologia 2006, 149, 221–232. [Google Scholar] [CrossRef]
- Sankaran, S.; Maja, J.M.; Buchanon, S.; Ehsani, R. Huanglongbing (citrus greening) detection using visible, near infrared and thermal imaging techniques. Sensors 2013, 13, 2117–2130. [Google Scholar] [CrossRef] [Green Version]
- Zarco-Tejada, P.J.; Camino, C.; Beck, P.S.A.; Calderon, R.; Hornero, A.; Hernández-Clemente, R.; Kattenborn, T.; Montes-Borrego, M.; Susca, L.; Morelli, M.; et al. Previsual symptoms of Xylella fastidiosa infection revealed in spectral plant-trait alterations. Nat. Plants 2018, 4, 432–439. [Google Scholar] [CrossRef]
- López-López, M.; Calderón, R.; González-Dugo, V.; Zarco-Tejada, P.; Fereres, E. Early detection and quantification of almond red leaf blotch using high-resolution hyperspectral and thermal imagery. Remote Sens. 2016, 8, 276. [Google Scholar] [CrossRef] [Green Version]
- Omran, E.-S.E. Early sensing of peanut leaf spot using spectroscopy and thermal imaging. Arch. Agron. Soil Sci. 2017, 63, 883–896. [Google Scholar] [CrossRef]
- Calderón, R.; Montes-Borrego, M.; Landa, B.; Navas-Cortés, J.; Zarco-Tejada, P. Detection of downy mildew of opium poppy using high-resolution multi-spectral and thermal imagery acquired with an unmanned aerial vehicle. Precis. Agric. 2014, 15, 639–661. [Google Scholar] [CrossRef]
- Loladze, A.; Rodrigues, F.A.; Toledo, F.; San Vicente, F.; Gerard, B.; Boddupalli, M.P. Application of remote sensing for phenotyping tar spot complex resistance in maize. Front. Plant Sci. 2019, 10, 10. [Google Scholar] [CrossRef] [PubMed] [Green Version]
- Zhang, C.Y.; Chen, W.D.; Sankaran, S. High-throughput field phenotyping of Ascochyta blight disease severity in chickpea. Crop Protect. 2019, 125, 11. [Google Scholar] [CrossRef]
- Calderón, R.; Navas-Cortés, J.A.; Zarco-Tejada, P.J. Early detection and quantification of Verticillium wilt in olive using hyperspectral and thermal imagery over large areas. Remote Sens. Environ. 2015, 7, 5584–5610. [Google Scholar] [CrossRef] [Green Version]
- Calderón, R.; Navas-Cortés, J.A.; Lucena, C.; Zarco-Tejada, P.J. High-resolution airborne hyperspectral and thermal imagery for early, detection of Verticillium wilt of olive using fluorescence, temperature and narrow-band spectral indices. Remote Sens. Environ. 2013, 139, 231–245. [Google Scholar] [CrossRef]
- Kwon, T.-r.; Kim, K.-h.; Yoon, H.-J.; Lee, S.-k.; Kim, B.-k.; Siddiqui, Z.S. Phenotyping of plants for drought and salt tolerance using infra-red thermography. Plant Breed. Biotechnol. 2015, 3, 299–307. [Google Scholar] [CrossRef] [Green Version]
- James, R.A.; Sirault, X.R.R. Infrared thermography in plant phenotyping for salinity tolerance. In Plant Salt Tolerance: Methods and Protocols; Shabala, S., Cuin, T.A., Eds.; Humana Press: Totowa, NJ, USA, 2012; pp. 173–189. [Google Scholar] [CrossRef]
- Kim, S.L.; Kim, N.; Lee, H.; Lee, E.; Cheon, K.-S.; Kim, M.; Baek, J.; Choi, I.; Ji, H.; Yoon, I.S.; et al. High-throughput phenotyping platform for analyzing drought tolerance in rice. Planta 2020, 252, 38. [Google Scholar] [CrossRef]
- Biju, S.; Fuentes, S.; Gupta, D. The use of infrared thermal imaging as a non-destructive screening tool for identifying drought-tolerant lentil genotypes. Plant Physiol. Biochem. 2018, 127, 11–24. [Google Scholar] [CrossRef]
- Pan, R.; Jiang, W.; Wang, Q.; Xu, L.; Shabala, S.; Zhang, W.Y. Differential response of growth and photosynthesis in diverse cotton genotypes under hypoxia stress. Photosynthetica 2019, 57, 772–779. [Google Scholar] [CrossRef] [Green Version]
- Vollsnes, A.V.; Eriksen, A.B.; Otterholt, E.; Kvaal, K.; Oxaal, U.; Futsaether, C.M. Visible foliar injury and infrared imaging show that daylength affects short-term recovery after ozone stress in Trifolium subterraneum. J. Exp. Bot. 2009, 60, 3677–3686. [Google Scholar] [CrossRef]
- Rippa, M.; Ambrosone, A.; Leone, A.; Mormile, P. Active thermography for real time monitoring of UV-B plant interactions. J. Photochem. Photobiol. B Biol. 2020, 208, 111900. [Google Scholar] [CrossRef] [PubMed]
- Fuller, M.P.; Wisniewski, M. The use of infrared thermal imaging in the study of ice nucleation and freezing of plants. J. Therm. Biol. 1998, 23, 81–89. [Google Scholar] [CrossRef]
- Wisniewski, M.; Glenn, D.M.; Fuller, M.P. Use of a hydrophobic particle film as a barrier to extrinsic ice nucleation in tomato plants. J. Am. Soc. Hort. Sci. 2002, 127, 358–364. [Google Scholar] [CrossRef] [Green Version]
- Workmaster, B.A.A.; Palta, J.P.; Wisniewski, M. Ice nucleation and propagation in cranberry uprights and fruit using infrared video thermography. J. Am. Soc. Hort. Sci. 1999, 124, 619–625. [Google Scholar] [CrossRef]
- Carter, J.; Brennan, R.; Wisniewski, M. Patterns of ice formation and movement in blackcurrant. HortScience 2001, 36, 1027–1032. [Google Scholar] [CrossRef] [Green Version]
- Gusta, L.V.; Wisniewski, M.; Nesbitt, N.T.; Gusta, M.L. The effect of water, sugars, and proteins on the pattern of ice nucleation and propagation in acclimated and nonacclimated canola leaves. Plant Physiol. 2004, 135, 1642–1653. [Google Scholar] [CrossRef] [Green Version]
- Pearce, R.S.; Fuller, M.P. Freezing of barley studied by infrared video thermography. Plant Physiol. 2001, 125, 227–240. [Google Scholar] [CrossRef] [Green Version]
- Stegner, M.; Schäfernolte, T.; Neuner, G. New insights in potato leaf freezing by infrared thermography. Appl. Sci. 2019, 9, 819. [Google Scholar] [CrossRef] [Green Version]
- Chaerle, L.; Hulsen, K.; Hermans, C.; Strasser, R.J.; Valcke, R.; Hofte, M.; Van der Straeten, D. Robotized time-lapse imaging to assess in-planta uptake of phenylurea herbicides and their microbial degradation. Physiol. Plant. 2003, 118, 613–619. [Google Scholar] [CrossRef] [Green Version]
- Takayama, K.; Omasa, K. Early detection of photosynthetic dysfunction caused by a herbicide (Basta) using chlorophyll fluorescence and thermal imaging system. J. Agric. Meteorol. 2005, 60, 1179–1181. [Google Scholar] [CrossRef]
- Vítek, P.; Veselá, B.; Klem, K. Spatial and temporal variability of plant leaf responses cascade after PSII inhibition: Raman, chlorophyll fluorescence and infrared thermal imaging. Sensors 2020, 20, 1015. [Google Scholar] [CrossRef] [PubMed] [Green Version]
- Bellvert, J.; Marsal, J.; Girona, J.; Zarco-Tejada, P. Seasonal evolution of crop water stress index in grapevine varieties determined with high-resolution remote sensing thermal imagery. Irrig. Sci. 2014, 33, 81–93. [Google Scholar] [CrossRef]
- González-Dugo, M.P.; González-Piqueras, J.; Campos, I.; Andréu, A.; Balbontín, C.; Calera, A. Evapotranspiration monitoring in a vineyard using satellite-based thermal remote sensing. In Proceedings of the Remote Sensing for Agriculture, Ecosystems, and Hydrology XIV, Edinburgh, UK, 24–26 September 2012. [Google Scholar]
- Suárez, L.; Zarco-Tejada, P.J.; Sepulcre-Cantó, G.; Pérez-Priego, O.; Miller, J.R.; Jiménez-Muñoz, J.C.; Sobrino, J. Assessing canopy PRI for water stress detection with diurnal airborne imagery. Remote Sens. Environ. 2008, 112, 560–575. [Google Scholar] [CrossRef]
- Sepulcre-Cantó, G.; Zarco-Tejada, P.J.; Sobrino, J.A.; Jiménez-Berni, J.A.; Jiménez-Muñoz, J.C.; Gastellu-Etchegorry, J.P. Discriminating irrigated and rainfed olive orchards with thermal ASTER imagery and DART 3D simulation. Agric. For. Meteorol. 2009, 149, 962–975. [Google Scholar] [CrossRef] [Green Version]
- Casari, R.A.C.N.; Paiva, D.S.; Silva, V.N.B.; Ferreira, T.M.M.; Souza, M.T.; Oliveira, N.G.; Kobayashi, A.K.; Molinari, H.B.C.; Santos, T.T.; Gomide, R.L.; et al. Using thermography to confirm genotypic variation for drought response in maize. Int. J. Mol. Sci. 2019, 20, 2273. [Google Scholar] [CrossRef] [PubMed] [Green Version]
- Rischbeck, P.; Cardellach, P.; Mistele, B.; Schmidhalter, U. Thermal phenotyping of stomatal sensitivity in spring barley. J. Agron. Crop Sci. 2017, 203, 483–493. [Google Scholar] [CrossRef]
- Romero-Bravo, S.; Mendez-Espinoza, A.M.; Garriga, M.; Estrada, F.; Escobar, A.; Gonzalez-Martinez, L.; Poblete-Echeverria, C.; Sepulveda, D.; Matus, I.; Castillo, D.; et al. Thermal imaging reliability for estimating grain yield and carbon isotope discrimination in wheat genotypes: Importance of the environmental conditions. Sensors 2019, 19, 2676. [Google Scholar] [CrossRef] [Green Version]
- Gracia-Romero, A.; Kefauver, S.C.; Fernández-Gallego, J.A.; Vergara-Diaz, O.; Nieto-Taladriz, M.T.; Araus, J.L. UAV and ground image-based phenotyping: A proof of concept with durum wheat. Remote Sens. 2019, 11, 1244. [Google Scholar] [CrossRef] [Green Version]
- Sánchez-Virosta, Á.; Sánchez-Gómez, D. Thermography as a tool to assess inter-cultivar variability in garlic performance along variations of soil water availability. Remote Sens. 2020, 12, 2990. [Google Scholar] [CrossRef]
- Tilling, A.K.; O’Leary, G.J.; Ferwerda, J.G.; Jones, S.D.; Fitzgerald, G.J.; Rodriguez, D.; Belford, R. Remote sensing of nitrogen and water stress in wheat. Field Crop. Res. 2007, 104, 77–85. [Google Scholar] [CrossRef]
- Kefauver, S.C.; Vicente, R.; Vergara-Díaz, O.; Fernández-Gallego, J.A.; Kerfal, S.; López, A.; Melichar, J.P.E.; Molins, M.D.S.; Araus, J.L. Comparative UAV and field phenotyping to assess yield and nitrogen use efficiency in hybrid and conventional barley. Front. Plant Sci. 2017, 8, 15. [Google Scholar] [CrossRef] [PubMed]
- Pramsohler, M.; Hacker, J.; Neuner, G. Freezing pattern and frost killing temperature of apple (Malus domestica) wood under controlled conditions and in nature. Tree Physiol. 2012, 32, 819–828. [Google Scholar] [CrossRef] [PubMed] [Green Version]
- Sangha, H.S.; Sharda, A.; Koch, L.; Prabhakar, P.; Wang, G. Impact of camera focal length and sUAS flying altitude on spatial crop canopy temperature evaluation. Comput. Electron. Agric. 2020, 172, 105344. [Google Scholar] [CrossRef]
- Furbank, R.T.; Jiménez-Berni, J.A.; George-Jaeggli, B.; Potgieter, A.B.; Deery, D.M. Field crop phenomics: Enabling breeding for radiation use efficiency and biomass in cereal crops. New Phytol. 2019, 223, 1714–1727. [Google Scholar] [CrossRef] [PubMed] [Green Version]
- Coppens, F.; Wuyts, N.; Inzé, D.; Dhondt, S. Unlocking the potential of plant phenotyping data through integration and data-driven approaches. Curr. Opin. Syst. Biol. 2017, 4, 58–63. [Google Scholar] [CrossRef] [PubMed]
- Liu, L.; Wang, Z.; Li, J.; Zhang, X.; Wang, R. A non-invasive analysis of seed vigor by infrared thermography. Plants 2020, 9, 768. [Google Scholar] [CrossRef] [PubMed]
- Dakhiya, Y.; Green, R.M. Thermal imaging as a noninvasive technique for analyzing circadian rhythms in plants. New Phytol. 2019, 224, 1685–1696. [Google Scholar] [CrossRef]
- Lei, L. Imaging plant rhythms. Nat. Plants 2019, 5, 911. [Google Scholar] [CrossRef]
- Kitaya, Y. Plant Factory and Space Development, “Space Farm”; Elsevier Science Bv: Amsterdam, The Netherlands, 2019; pp. 363–379. [Google Scholar] [CrossRef]
- Govindasamy, V.; George, P.; Aher, L.; Ramesh, S.V.; Thangasamy, A.; Anandan, S.; Raina, S.K.; Kumar, M.; Rane, J.; Annapurna, K.; et al. Comparative conventional and phenomics approaches to assess symbiotic effectiveness of Bradyrhizobia strains in soybean (Glycine max L. Merrill) to drought. Sci. Rep. 2017, 7, 14. [Google Scholar] [CrossRef]
- Jiang, W.; Pan, R.; Wu, C.; Xu, L.; Abdelaziz, M.E.; Oelmüller, R.; Zhang, W. Piriformospora indica enhances freezing tolerance and post-thaw recovery in Arabidopsis by stimulating the expression of CBF genes. Plant Signal. Behav. 2020, 15, 1745472. [Google Scholar] [CrossRef]
- Tsai, H.-J.; Shao, K.-H.; Chan, M.-T.; Cheng, C.-P.; Yeh, K.-W.; Oelmüller, R.; Wang, S.-J. Piriformospora indica symbiosis improves water stress tolerance of rice through regulating stomata behavior and ROS scavenging systems. Plant Signal. Behav. 2020, 15, 1722447. [Google Scholar] [CrossRef] [PubMed]
- Carlson, R.; Tugizimana, F.; Steenkamp, P.A.; Dubery, I.A.; Hassen, A.I.; Labuschagne, N. Rhizobacteria-induced systemic resilience in Sorghum bicolor (L.) moench against Fusarium pseudograminearum crown rot under drought stress conditions. Biol. Control 2020, 151, 104395. [Google Scholar] [CrossRef]
- Vadivambal, R.; Jayas, D. Applications of thermal imaging in agriculture and food industry—A review. Food Bioprocess Technol. 2011, 4, 186–199. [Google Scholar] [CrossRef]
- Negi, J.; Hashimoto-Sugimoto, M.; Kusumi, K.; Iba, K. New approaches to the biology of stomatal guard cells. Plant Cell Physiol. 2014, 55, 241–250. [Google Scholar] [CrossRef] [PubMed] [Green Version]
- Wang, Y.B.; Holroyd, G.; Hetherington, A.M.; Ng, C.K.Y. Seeing ‘cool’ and ‘hot’-infrared thermography as a tool for non-invasive, high-throughput screening of Arabidopsis guard cell signalling mutants. J. Exp. Bot. 2004, 55, 1187–1193. [Google Scholar] [CrossRef] [PubMed] [Green Version]
Figure 1.
The most common platforms implementing thermal cameras at proximal and remote sensing scale.
Figure 1.
The most common platforms implementing thermal cameras at proximal and remote sensing scale.

Table 3.
Effects of several abiotic stress factors on leaf temperature as measured by thermography at proximal sensing scale. Arrows (↑) denote increment in leaf temperature due to the stress condition.
Table 3.
Effects of several abiotic stress factors on leaf temperature as measured by thermography at proximal sensing scale. Arrows (↑) denote increment in leaf temperature due to the stress condition.
| Category | Stress Factor | Application | Plant | Effect on Leaf Temperature | Ref. |
|---|---|---|---|---|---|
| Water | Drought | Roots | Papaya, spinach, fava bean, corn, wheat, rice, lentil | ↑ detected as alterations in TIR stress indices | [28,44,45,60,61,143,144] |
| Salinity | Roots | Barley, rice, wheat | ↑ proportional to salt concentration | [66,67] | |
| Nutrient deficiency | O2 | Roots | Cotton | ↑ stomatal closure | [145] |
| Mg | Roots | Bean | ↑ prior to chlorosis | [117] | |
| Atmosph. | High O3 | Leaves | Subterranean clover | ↑ under long-day conditions | [146] |
| UV-B | Leaves | Pothos plant, Arabidopsis | ↑ under UV-B light | [147] | |
| Low T | Ice nucleation | Potato, cranberry, oilseed rape, barley blackcurrant, tomato | ↑ since ice nucleation is an exothermic process | [148,149,150,151,152,153,154] | |
| Herbicide | Linuron | Roots | Bean | ↑ from vascular tissues towards the leaf edges | [155] |
| Glufosinate | Leaves (spray) | Bean | ↑ gradually | [156] | |
| Metribuzin | Leaves (droplets) | Goosefoot | ↑ in the spot, expanding to the rest of the leaf | [157] |
Publisher’s Note: MDPI stays neutral with regard to jurisdictional claims in published maps and institutional affiliations. |
© 2020 by the authors. Licensee MDPI, Basel, Switzerland. This article is an open access article distributed under the terms and conditions of the Creative Commons Attribution (CC BY) license (http://creativecommons.org/licenses/by/4.0/).
Share and Cite
MDPI and ACS Style
Pineda, M.; Barón, M.; Pérez-Bueno, M.-L. Thermal Imaging for Plant Stress Detection and Phenotyping. Remote Sens. 2021, 13, 68. https://0-doi-org.brum.beds.ac.uk/10.3390/rs13010068
AMA Style
Pineda M, Barón M, Pérez-Bueno M-L. Thermal Imaging for Plant Stress Detection and Phenotyping. Remote Sensing. 2021; 13(1):68. https://0-doi-org.brum.beds.ac.uk/10.3390/rs13010068
Chicago/Turabian StylePineda, Mónica, Matilde Barón, and María-Luisa Pérez-Bueno. 2021. "Thermal Imaging for Plant Stress Detection and Phenotyping" Remote Sensing 13, no. 1: 68. https://0-doi-org.brum.beds.ac.uk/10.3390/rs13010068
Note that from the first issue of 2016, this journal uses article numbers instead of page numbers. See further details here.