Article

Leaf Age Matters in Remote Sensing: Taking Ground Truth for Spectroscopic Studies in Hemiboreal Deciduous Trees with Continuous Leaf Formation

1
Department of Experimental Plant Biology, Faculty of Science, Charles University, Vinicna 5, 128 44 Prague 2, Czech Republic
2
Tartu Observatory, Faculty of Science and Technology, University of Tartu, Observatoorium 1, Tõravere, Nõo Parish, 61602 Tartu County, Estonia
*
Author to whom correspondence should be addressed.
Submission received: 5 March 2021 / Revised: 26 March 2021 / Accepted: 30 March 2021 / Published: 1 April 2021

Abstract

:
We examined the seasonal changes in biophysical, anatomical, and optical traits of young leaves, formed throughout the vegetative season due to sylleptic growth, and mature leaves formed by proleptic growth in spring. Leaf developmental categories contribute to the top-of-canopy reflectance and should be considered when taking ground truth for remote sensing studies (RS). Deciduous tree species, Betula pendula, Populus tremula, and Alnus incana, were sampled from May to October 2018 in an Estonian hemiboreal forest. Chlorophyll and carotenoid content were detected biochemically; leaf anatomical traits (leaf, palisade, and spongy mesophyll thickness) were measured on leaf cross-sections; leaf reflectance was measured by a spectroradiometer with an integrating sphere (350–2500 nm). Biophysical and anatomical leaf traits were related to 64 vegetation indices (VIs). Linear models based on VIs for all tested leaf traits were more robust if both juvenile and mature leaves were included. This study provides information on which VIs are interchangeable or independent. Pigment and leaf thickness sensitive indices formed PC1; water and structural trait related VIs formed an independent group associated with PC3. Type of growth and leaf age could affect the validation of biophysical and anatomical leaf trait retrieval from the optical signal. It is, therefore, necessary to sample both leaf developmental categories—young and mature—in RS, especially if sampling is only once within the vegetation season.

Graphical Abstract

1. Introduction

Under ongoing climate change, plants are exposed to an ever-increasing load of environmental stress, which may affect the vegetative net primary production and carbon sequestration [1,2,3]. Forests are the most important of all terrestrial ecosystems, representing the greatest terrestrial carbon storage pool [4]. However, the ability of forests to sequester carbon is dependent on the physiological status of trees. Remote sensing provides a suitable tool for large-scale i.e., spatial temporal monitoring of tree and forest status, as well as carbon fluxes and pools at large scales [5].
Hemiboreal forests represent a transitional zone between boreal and temperate forest biomes [6]. The territory of hemiboreal forests is expected to expand north, gradually replacing boreal forests [7] due to climate change, particularly warming, which is more progressive in the northern boreal region. Moreover, hemiboreal forest stands are characterized by greater seasonal variability in forest microclimate, canopy structure, and plant activity when compared to boreal forests [7]. In all ecosystems where seasonality in phenology occurs, including hemiboreal forests, remote sensing must account for dynamic changes in optical signals during the vegetative season. Also, knowledge of seasonal variability in leaf-level traits which determine the optical signal of vegetation (such as photosynthetic pigment content, dry matter and water content, and leaf internal structure) is essential for scaling the optical signal to the canopy level and interpreting airborne and satellite-based data.
Crown architecture can be regarded as the integrated link between form and function in a tree [8]. There are two major patterns of tree crown branching: (a) prolepsis, a rhythmic branching process from buds formed before a period of dormancy, and (b) syllepsis, a continuous branching process during the vegetative season from incompletely formed lateral buds [9]. Prolepsis and syllepsis can both occur in the same tree [8]. Thus, in many woody species, two types of leaf development occur: (1) pre-formed leaves (also called early leaves) that originate from overwintering buds after a dormancy stage, and (2) neoformed leaves (late leaves) from buds without passing through the dormant period and instead developing entirely during the current growing season [10,11]. Sylleptically formed young leaves play a critical role in maximizing the carbon productivity of a tree’s crown [12], and are often found in fast-growing tree species. Usually, the pre-formed leaves grow on both short and long shoots [10] while the neoformed leaves develop on long shoots, as confirmed recently in silver birch (B. pendula) [13]. Neoformed leaves on sylleptic branches could form a substantial part of the upper- and external, sun-exposed crown layer [14] and, thus, they are thought to have a significant contribution to the top-of-canopy reflectance signal. However, based on our knowledge to date, not much attention has been paid to variation in leaf optical signal as a result of developmental origin in deciduous temperate and hemiboreal trees.
Regarding anatomical traits, leaves of different developmental origins—either proleptic or sylleptic—usually differ quantitatively [15,16]. Otherwise, the anatomy of both leaf developmental categories corresponds to a typical dorsiventral structure [17]. In dorsiventral leaves, dermal tissue is comprised of an upper (adaxial) and lower (abaxial) epidermis, ground tissue—photosynthetic mesophyll differentiated into palisade (toward the adaxial epidermis) and spongy (toward the abaxial epidermis) parenchyma (Figure 1) and vascular tissue formed by an isotropic net of vascular bundles (not shown in Figure 1). Elongated cylindrical palisade parenchyma cells are well adapted for capturing light and the palisade parenchyma thickness is strongly correlated with leaf thickness and photosynthetic capacity [18]. Spongy parenchyma cells are irregularly shaped and the thickness of the spongy parenchyma layer, alongside the proportion of intercellular spaces compared to the palisade parenchyma, affects the conductance of CO2 inside the leaves [19].
Within-canopy variation of leaf structural and biophysical traits should be considered when designing spectroscopic studies at the leaf level [20] or taking ground truth for remote sensing data calibration. From this point of view, sun- and shade-acclimated leaves are usually taken into account and sampling designs are based on the vertical gradient within the canopy, reflecting differences in leaf anatomical, biophysical, and optical traits [21]. Many recent studies have shown that the within-canopy variation of leaf traits and optical properties is remarkable and should be taken into account for upscaling [13,22]. However, leaf traits related to optical properties are rarely studied regarding proleptic and sylleptic growth; only poplar species have been significantly studied from this perspective [10,12,15,23].
Tree phenology and leaf ontogenesis in deciduous trees are closely related to meteorological conditions during a particular vegetative season [24,25]. After bud burst originating from proleptically formed buds, leaf anatomical and biophysical traits gradually change to promote photosynthetic activity. Leaf thickness increases remarkably at the beginning of the season [26], remains constant during the mid-season [24,26] and then decreases during leaf senescence [21]. Photosynthetic pigments follow a similar trend as leaf structural traits during the growing season: their content increases in juvenile leaves, reaches a maximum in mature leaves in the middle of leaf lifespan [27], and then decreases during senescence [28,29,30].
Just as leaf traits change within a vegetative season, optical properties are dynamic over time in temperate deciduous trees [24,31]. Dillen et al. [32] observed that leaf foliar reflectance provided a good indicator of leaf photosynthesis and nitrogen content from early bud break to leaf fall in Quercus rubra L. and Betula papyrifera Marsh. A similar pattern of temporal dynamics in optical properties was observed in P. tremuloides and Populus balsamifera [21]. Changes in the leaf optical properties of European boreal deciduous tree species are especially significant at the beginning and end of the season [33,34]. Since leaf structure determines leaf optical properties, seasonal changes in leaf optical properties usually follow trends in leaf structural and biochemical traits: not only pigment content changes, but also in other traits such as leaf mass per area, nitrogen, and carbon content [31]. Furthermore, dynamics in optical properties at the leaf level affect the spectral signal at the canopy level [24,35,36]. Thus, interpreting remotely acquired optical information at larger spatial and temporal scales should account for factors such as leaf structural and biochemical traits influencing leaf-level optical properties [37].
The influence of leaf anatomy on leaf-level optical properties has been studied since the 1970s [38,39]. Nowadays, the opinion that leaf anatomical traits affect mainly optical properties in the near infra-red region (NIR) is widely accepted. Slaton et al. [40] observed that reflectance in NIR was positively correlated with leaf thickness, similar to other studies [41,42], which confirmed a positive relation between NIR reflectance and intercellular space-volume in spongy parenchyma. However, a recent study [43] showed that light scattering within the leaf is a result of tissue layer and cell arrangement, and thus could affect optical properties, not only in NIR but also in the visible part of the spectrum (VIS). Usually, investigations focused on the relation of leaf optical properties to anatomical traits aim to improve the detection of chlorophyll content as a non-specific physiological status marker [44]. Variation in leaf anatomy may complicate chlorophyll content estimates, even when using well-established spectroscopic methods for processing leaf optical data, such as vegetation indices (VIs) [30,45]. Our previous study, Lukeš et al. [24] pointed out that the asymmetric internal structure of dorsiventral leaves had a significant impact on top-of-canopy reflectance and, thus, should be taken into account when upscaling from leaf to canopy optical traits.
To date, various methods of biophysical traits retrieval from optical signal are available (reviewed by [46]). The parametric regression models are those with the longest tradition and they generally work with a limited number of spectral bands relating to a target biophysical variable. Beside single band reflectance at given wavelengths, many different spectral transformations, such as derivatives and vegetation indices, can be used [47,48,49]. The term “vegetation index” originates from the beginning of spaceborne vegetation remote sensing in the 1970s. In current usage, this term refers to any transformation of two or more discrete spectral bands, either at leaf or canopy level, for estimating vegetation properties [50]. By now, a vast number of different vegetation indices have been developed (review by [51]). The most widely used vegetation index is a Normalized Difference Vegetation Index (NDVI) [52,53] using reflectance at two bands: one band from the red spectral region and the other one in the NIR reflectance plateau. Another widely used group of vegetation indices describing the physiological status of vegetation uses the red edge region (700–730 nm) (e.g., [30,54]).
The main goals of the present study were to provide insight on how leaf developmental stage affects (1) biophysical, anatomical, and optical properties at the leaf level during the growing season; and (2) linear relationships of commonly used vegetation indices (VIs) in remote sensing to leaf biophysical and anatomical traits. We examined the seasonal changes in biophysical, anatomical, and optical traits of three hemiboreal deciduous tree species: silver birch (Betula pendula), black alder (Alnus incana), and Eurasian aspen (Populus tremula). All studied species exhibit both proleptic and sylleptic growth, which implies gradual leaf development and emergence of new neoformed leaves throughout the growing season. We hypothesized that there are systematic differences in biophysical, anatomical, and optical properties of young, sylleptically neoformed leaves compared to proleptically pre-formed leaves, which have regular phenological development following a vegetative season changes from spring to autumn.
First, we aimed to describe the seasonal course and variability in leaf biophysical, anatomical, and optical properties related to simultaneous occurrence of leaves in different developmental stage (mature pre-formed leaves and juvenile neoformed leaves) within a single crown. Second, we aimed to relate a broad range of commonly used VIs in remote sensing to leaf biophysical and anatomical traits and evaluate the effect of leaf developmental stage on these relations. It is necessary to emphasize that young neoformed leaves usually form the uppermost and external crown leaf layer, and thus, may have a significant contribution to the top-of-canopy reflectance measurements. We hypothesized that tighter relations of VIs to biophysical and anatomical traits could be achieved with inclusion of both pre-formed adult and neoformed juvenile leaves to the model. Our final aim was to evaluate the performance of various vegetation indices in biophysical and anatomical trait prediction. We hypothesized that vegetation indices strongly intercorrelate and form distinctive groups according to the predicted leaf traits.

2. Materials and Methods

2.1. Plant Sampling

Sampled deciduous trees, silver birch (Betula pendula), black alder (Alnus incana), and common aspen (Populus tremula) are the most abundant deciduous tree species in Estonian hemiboreal forests [55]. During the 2018 growing season, seven field trips for collecting leaf samples were conducted: 21 May, 6 June, 18 June, 2 July, 10 July, 10 September, and 1 October, corresponding to Day of Year (DOY) 141, 157, 169, 183, 191, 253, and 274, respectively. Sampling started in spring after bud burst, which occurred in the middle of April, 2018, when leaves had reached the minimum required size for optical measurements to cover the 1 cm diameter sample port of the integrating sphere. Sample collection campaigns were conducted five times over a two-month period—following regular leaf development of proleptically formed leaves from spring to summer when proleptically formed leaves reached full maturity. Each field collection lasted two days. For wider geographic coverage, the first day was spent sampling birch in the Tõravere park, adjacent to the Tartu Observatory (58°16′N 26°28′E, elevation 70 m). The next day, sampling of birch, alder and poplar was accomplished in the Järvselja Experimental Forest district (58°22′N, 27°20′E, elevation 38–40 m) (Figure 2). Only healthy leaves without apparent visual color changes or damage were sampled. Leaves were placed in plastic bags and stored at +4 °C. Leaf optical properties were measured within a few hours. All leaves from the first sampling date (DOY 141) were classified as juvenile leaves. Due to gradual leaf development caused by sylleptic growth, juvenile neoformed leaves were sampled from all studied tree species throughout the whole season. Mature (proleptically pre-formed) leaves represented typical foliage for a given canopy at a given time and were collected from short shoots and from the bases of the long shoots with high to moderate light availability due to their canopy positions. Juvenile (neoformed) leaves were located at the top of a crown at branch tips having high to excessive light availability. Sampling of juvenile leaves at later sampling dates was based primarily on their terminal position on the long shoots at the top of the crown. Taking into consideration that major anatomical adjustments occur during leaf formation while leaf senescence is dominated by pigment degradation, two additional smaller field campaigns were also conducted in the fall to describe pigment composition at the end of the growing season (DOYs 253 and 274). First senescent leaves were classified on DOY 253, based on visual color changes with prevailing yellow area on a leaf blade. There were still juvenile-looking leaves present on branch tips on DOY 253. The last sampling was conducted on DOY 274 when most remaining leaves were fully senescent, and a significant amount of foliage had already fallen. Leaves located on branch tips, where juvenile leaves were collected throughout the whole growing season, had reached the appearance of mature leaves and were classified as mature leaves on DOY 274 collection. Leaves located in the crown, where the mature leaf category was in previous collections, were classified as senescent leaves on DOY 274.

2.2. Measurement of Leaf Optical Properties

Leaf adaxial side hemispherical reflectance was measured in laboratory conditions. Leaf reflectance was measured with a spectroradiometer SVC HR-1024 (Spectra Vista Corporation, Poughkeepsie, NY, USA) equipped with an integrating sphere AvaSphere-50-REFL, and light source AvaLight-HAL (both Avantes, Apeldoorn, The Netherlands). The integrating sphere was coupled to the spectroradiometer and the light source with optical fibers. The SVC HR-1024 spectroradiometer has 1024 spectral bands covering the spectral range from 350 nm to 2500 nm. The spectral resolution is about 3.5 nm, 8.5 nm, and 2.5 nm in the spectral range 350–1000 nm, 1000–1850 nm, and 1850–2500 nm, respectively. The measurement time was set to 3 s, using automatic integration time and automatic subtraction of the dark signal. Reflectance spectra were measured with the integrating sphere using the substitution method. We measured the hemispherically integrated reflectance as the directional-hemispherical reflectance factor (DHRF) of the adaxial side of the leaf. The raw signal of the sample was compared to the raw signal from the working reference WS-2 (Avantes), which was calibrated against a reflectance standard SRT-99-050 (Labsphere Inc., Reflectance Calibration Laboratory, North Sutton, NH, USA). In addition to the sample and reference measurements, a signal from the light trap was recorded to account for the stray light inside the sphere caused by a fraction of the illuminating flux hitting the edge of the sample port instead of the sample. Raw data were processed with a custom script in statistical program R (3.5.0) [56] according to the theory of the integrating sphere [57]. During processing, the raw spectra were smoothed over 7 spectral bands of the spectroradiometer with a Hamming window (α0 = 0.54) [58]. Leaf spectra were quite noisy below 400 nm and above 2000 nm, therefore only the spectral range from 400 nm to 2000 nm was used for final analyses and visualization.

2.3. Biophysical and Anatomical Analysis

After measuring the leaf optical properties on the leaf blade, excluding the midrib if possible, leaves from each field collection (seven total) were sampled for pigment content from the same leaf blade: one disk from each leaf, 0.8 cm in diameter, was sampled and plunged into a vial with DMF (dimethylformamide). After 7 days of DMF extraction, leaf pigment content—chlorophyll a + b (Chl) and carotenoids (Car)—were determined using spectroradiometric methods. The DMF extracts were measured in 3.5 mL cuvettes (CV10Q3500, Thorlabs Inc., NJ, USA) in a cuvette holder (CVH100, Thorlabs), illuminated with an incandescent light source (Avantes AvaLight-HAL, Apeldoorn, The Netherlands) and the transmitted radiation was measured with a spectroradiometer (SVC HR-1024, Spectra Vista Corporation, Poughkeepsie, NY, USA). Pure DMF was used as a reference. The reference measurement with pure DMF was made only once. However, a second cuvette with pure DMF was occasionally measured to correct for any potential drifts due to instability of the lamp or the spectroradiometer. Chl and Car contents were calculated based on absorbance at specific wavelengths according to Wellburn (1994) [59].
For anatomical analysis, approximately 0.5 cm2 segments of selected leaves (five times in the 2018 season DOYs 141, 157, 169, 183, and 191) were fixed in FAA (70% ethanol, 40% formalin, and acetic acid in a volume ratio 90:5:5). Leaf cross-sections (about 50–80 µm thick) were prepared using a hand microtome and stained with toluidine blue. Light microscope images (five per leaf segment) were acquired using an Olympus BX40 microscope equipped with camera (EOS100D, Canon Inc., Tokyo, Japan) and processed in ImageJ image analysis software (https://imagej.net/, accessed on 31 March 2021). Leaf anatomical traits (leaf thickness, mesophyll thickness, palisade and spongy parenchyma thickness (PP, SP), adaxial and abaxial epidermis thickness) were measured three times on each image in regular intervals and the palisade to spongy parenchyma thickness ratio (PP/SP) was calculated.
Finally, fresh leaves were weighed, scanned for leaf area, and kept in an oven at 60 °C for three days; after drying, samples were weighed again. Leaf area was obtained from scanned images using ImageJ. Leaf area, and leaf fresh and dry weights were used to calculate the following leaf traits: leaf mass per area (LMA), fresh leaf mass per area (fLMA), water content per leaf area (WCLA) and dry weight to fresh weight ratio (DW/FW). Total nitrogen (N) and carbon (C) contents of the oven-dried samples were determined by the dry combustion method on a vario MAX CNS elemental analyzer (ELEMENTAR, Langenselbold, Germany).
We classify leaf traits into two groups (a) biophysical traits: Chl, Car, N, and C contents and there we also included traits involving structural parameters: LMA, fLMA, WCLA, and DW/FW; and (b) anatomical traits: traits based on solely quantitative anatomical parameters—leaf thickness, palisade, and spongy parenchyma thickness (PP and SP, respectively), palisade and spongy parenchyma ratio (PP/SP).

2.4. Statistical Processing of Optical, Biophysical, and Anatomical Leaf Traits

One-way analysis of variance (ANOVA) was performed to identify the differences in leaf anatomical, biophysical, and optical properties (represented as reflectance at particular wavelengths—R551, R673, R705, R800, R1242, R1511) among sampling dates (DOYs 141–274) and leaf development stages. To identify significant differences among groups after ANOVA application, multiple comparison tests were used: if the distribution was normal then the Tukey-Kramer test was used, if not the non-parametric Kruskal-Wallis test was used. Differences of reflectance in selected wavelengths, biophysical, and anatomical traits between juvenile and mature leaves during the season were tested with a Student’s t-test. All variability tests (Student’s t-test, ANOVA, multiple comparison tests) were performed with NCSS 9 software (NCSS, LCC Kaysville, Utah, USA).
To evaluate the effect of leaf developmental stage and phenology (DOY of sampling) principal component analysis (PCA) was applied on leaf reflectance spectra. PCA was based on the NIPALS algorithm [60], and the model was cross-validated with random 20 segments. Leaf developmental categories (juvenile, mature, or senescent) and DOY were treated as categorical variables. PCA of leaf spectra was performed in Unscrambler 11 (CAMO Analytics, Oslo, Norway).
Based on the literature, we analyzed 64 vegetation indices (VIs) and related them with biophysical and anatomical traits, see in Supplementary material Table S1. For visualization purposes, the relationships of VIs with biophysical and anatomical traits, coefficients of determination (R2) were summed and the “Summarized coefficient of determination” (SumR2) was created. All values of 64 VIs for all leaf samples across the vegetation season were also analyzed by PCA to reveal intercorrelation or independence of vegetation indices. Relation of VIs with biophysical and anatomical traits, and PCA on VIs were processed in R (4.0.3) using the ggfortify package [61].

3. Results

Results are presented in the following sequence: first, seasonal course of anatomical and biophysical traits for three developmental leaf categories separately: juvenile, mature, and senescent; second, leaf traits compared among the juvenile neoformed leaves and mature physiologically active leaves in relation to the time in the vegetation season (characterized by DOY); finally, seasonal course of anatomical and biophysical traits for all sampled leaves together to demonstrate overall canopy trends in studied leaf traits.

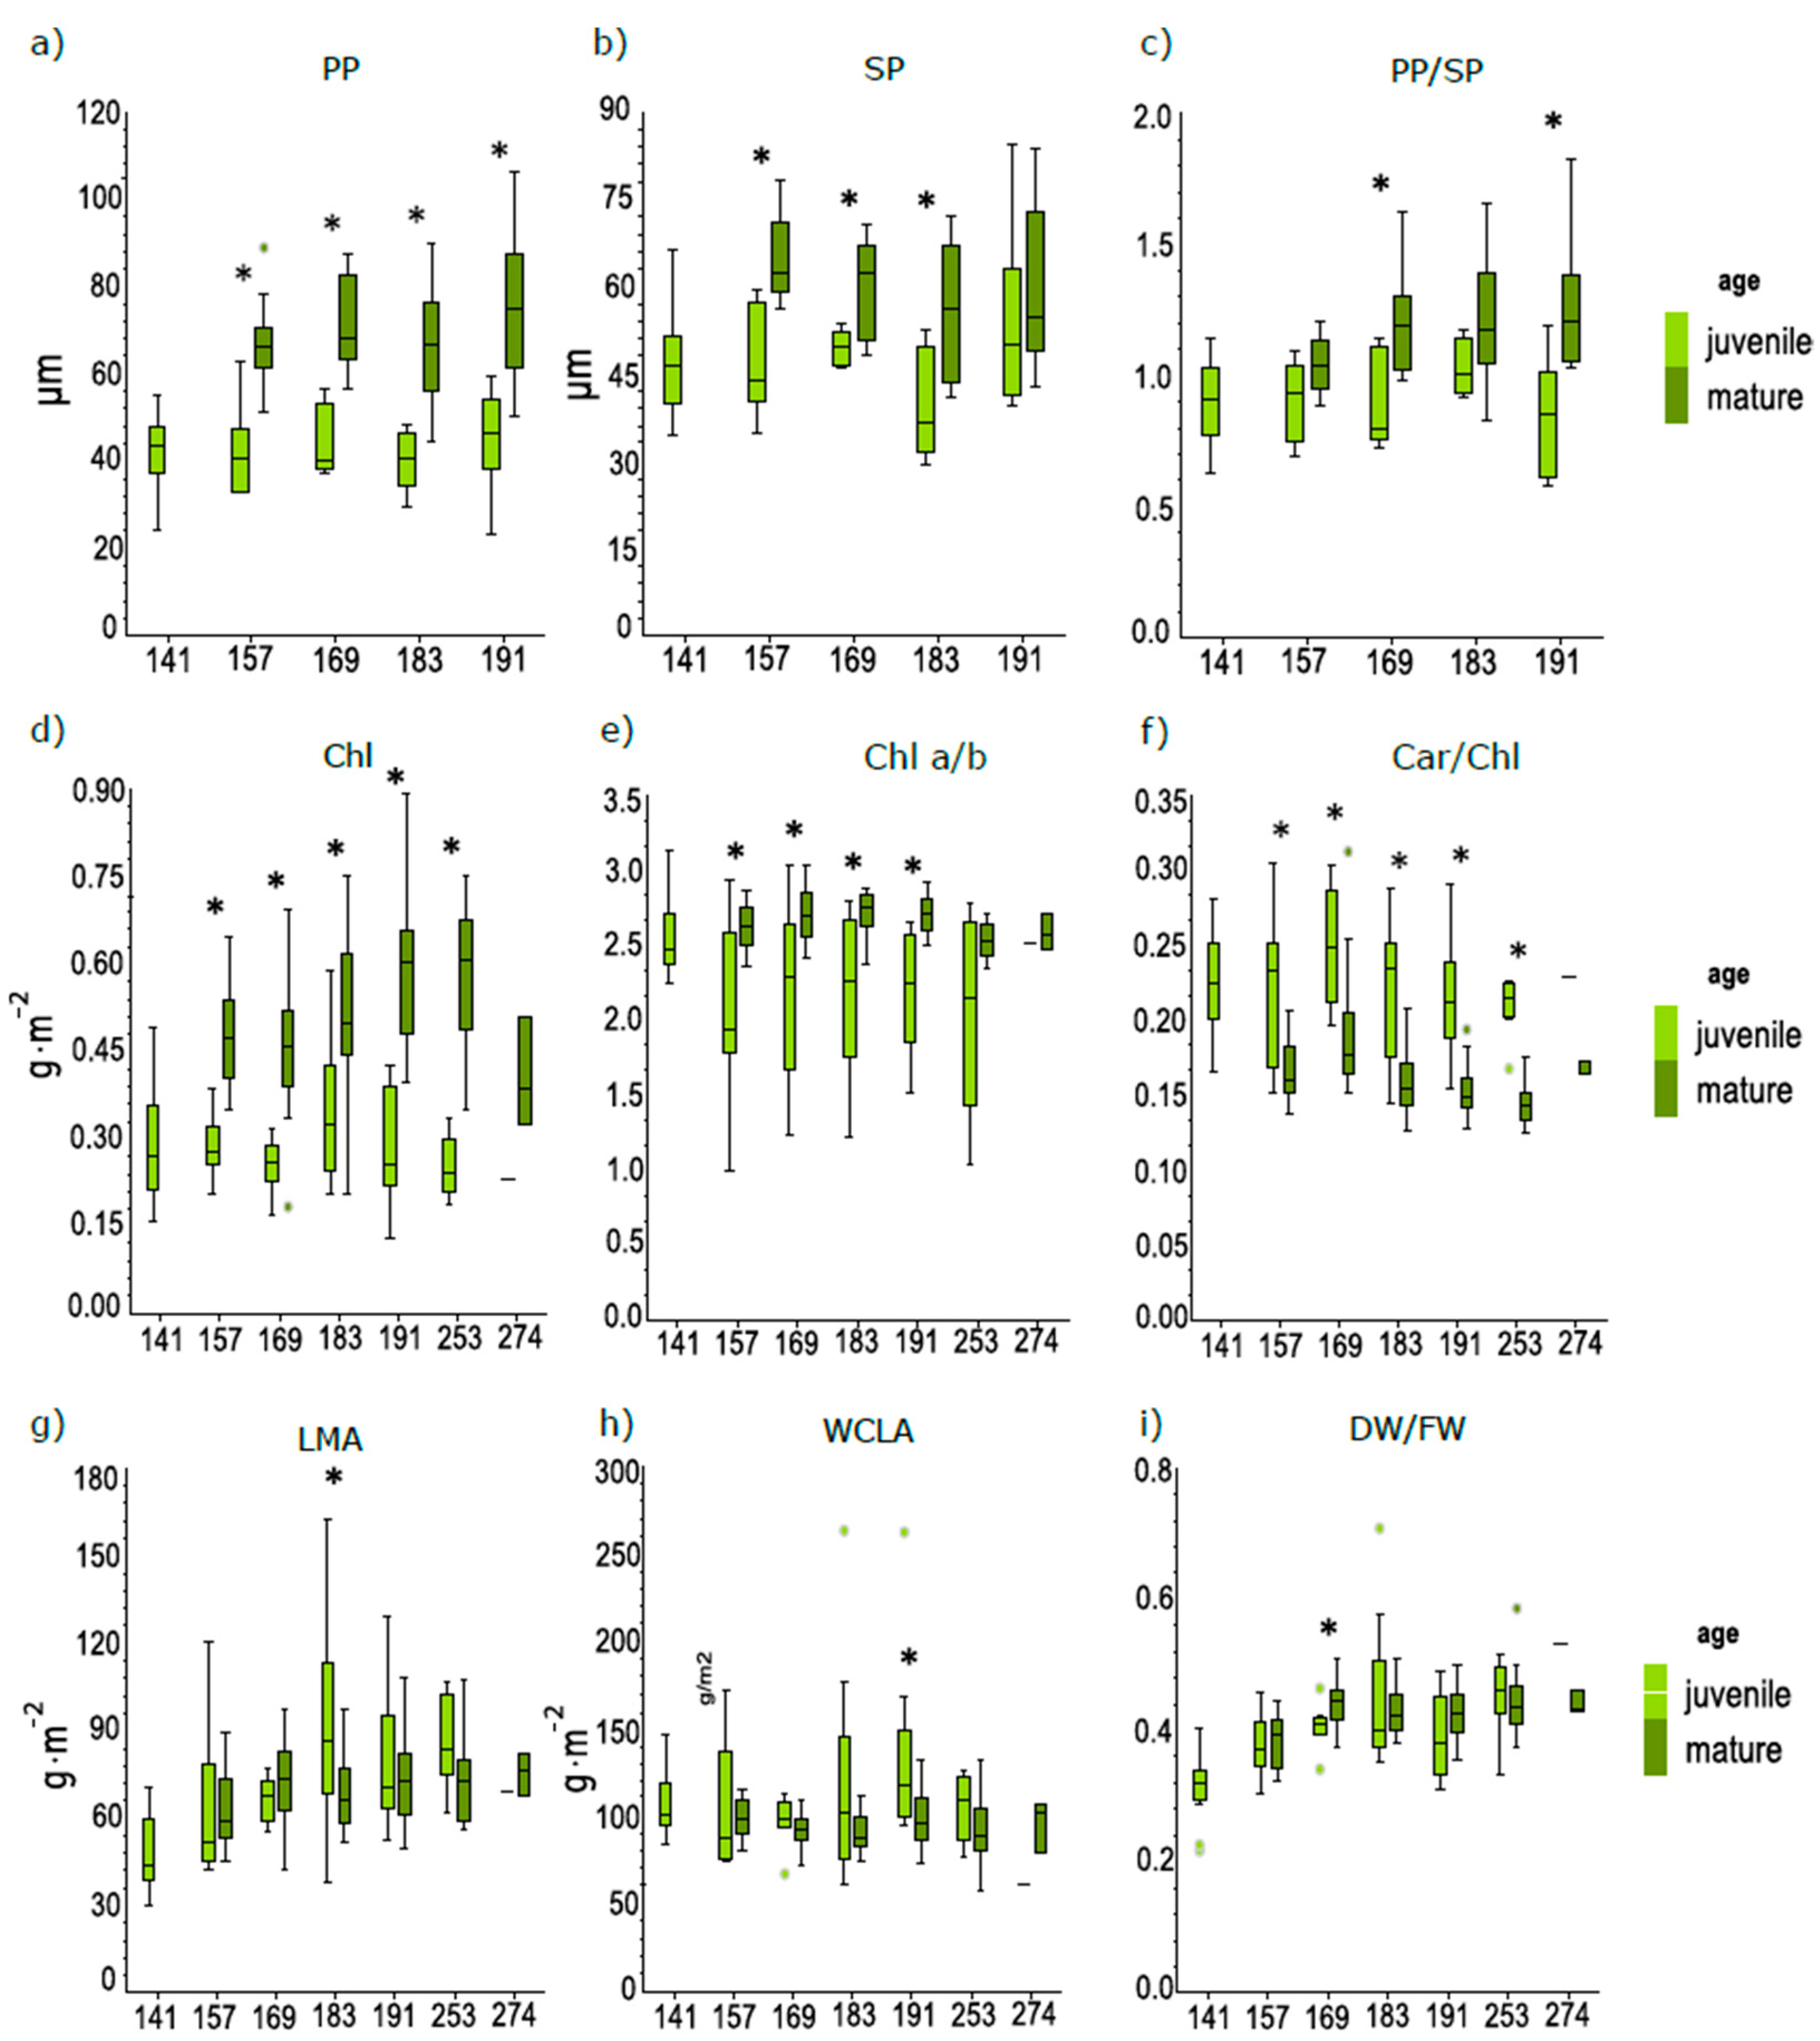
3.1. Seasonal Course of Anatomical and Biophysical Traits of Juvenile, Mature, and Senescent Leaves

Figure 3a–c shows the seasonal course of selected anatomical traits: palisade parenchyma thickness (PP), spongy parenchyma thickness (SP), and palisade/spongy parenchyma thickness ratio (PP/SP) of both juvenile and mature leaves for all three studied tree species (B. pendula, A. incana, P. tremula). Based on the comparisons of PP and SP separately in juvenile and mature leaves, no differences were observed within juvenile and mature leaves in sampling dates (DOYs 141–191). However, the increasing trend of the palisade to spongy parenchyma ratio in mature leaves was observed in leaves sampled in DOYs 169–191 (Figure 3c).
Later in the season only the biophysical traits were assessed till leaf senescence (DOYs 254 and 274), while anatomical traits were not studied due to technical reasons. In the two last sampling dates, senescent leaves were also included. Pigment contents (Chl and Car) and their ratios during the season for all three developmental leaf categories (juvenile, mature, and senescent) are separately shown in (Figure 3d–g). We did not observe any differences in pigment content or ratio in juvenile leaves from DOYs 141–274 and the data variability, particularly in Chl a/b and Car, was remarkable. In contrast, mature leaves showed a typical seasonal dynamic in Chl content with a peak on DOY 191. Ratios of Chl a/b and Car/Chl slightly decreased toward the end of the season, meanwhile the Car content was stable over the studied period. For senescent leaves (DOYs 253–274), values of Chl, Chl a/b, and Car were lower than the rest of the leaves except the Car/Chl ratio, which exhibited a sharp increase in values on DOY 274 and extreme variability compared to juvenile and mature leaves (Figure 3d–g).
Structural traits LMA and DW/FW showed a gradual increase during the season for juvenile leaves, compared to the mature leaves, for which both traits remained stable; and for senescent leaves, LMA and DW/FW exhibited a rapid increase from DOYs 253 to 274. The WCLA was stable for juvenile, mature, and senescent leaves from DOYs 141 to 274 (Figure 3h–j).

3.2. Differences in Anatomical and Biophysical Traits between Juvenile and Mature Leaves during the Season

We compared three anatomical traits: the thickness of palisade parenchyma, spongy parenchyma, and the ratio of palisade/spongy parenchyma thickness (PP, SP, PP/SP, respectively, on juvenile and mature leaves of pooled data for all three species B. pendula, A. incana, P. tremula; (Figure 4a–c).
In the first sampling (DOY 141), all leaves were classified as juvenile, however, from DOY 157 we distinguished the fully expanded leaves as mature, while leaves from sylleptic growth, which showed the same phenotype as on DOY 141 were classified as juvenile. When comparing juvenile and mature leaves during the season, the PP was significantly higher in mature leaves than in juvenile leaves in all sampling dates (Figure 4a). The SP showed the same pattern with an exception later in the season (DOY 191), when mature and juvenile leaves did not significantly differ (Figure 4b). The difference between the juvenile and mature leaves in the PP/SP was significant only on DOY 169 and DOY 191 (Figure 4c).
Comparing the pigment content and their ratios in all sampling days (Figure 4d–f), a significantly higher Chl content was observed in mature leaves compared to juvenile leaves from DOYs 157 to 253 (Figure 4d). Both pigment ratios (Chl a/b and Car/Chl) differed significantly between mature and juvenile leaves starting from DOY 157. The Chl a/b ratio was higher for mature than for juvenile leaves; the values for the Car/Chl ratio were lower for mature than for juvenile leaves (Figure 4e,f).
Dry-mass and water-related traits (LMA, WCLA, and DW/FW; (Figure 4g–i)) showed high variances, particularly in juvenile leaves compared to the mature ones. Therefore, the differences in these traits were not significant with a few exceptions: higher LMA and WCLA in juvenile leaves than mature ones in the peak season (DOYs 183 and 191) and lower FW/DW ratio in juvenile leaves compared to mature ones in DOY 169 (Figure 4i). Juvenile leaves were naturally more folded than fully mature leaves. Thus, it was not possible to fully stretch these leaves either during optical measurements or during area-based sampling for pigment contents and LMA and implies possible small error into those measurement values. Nevertheless, the pigment content per unit of “non-stretched” leaf area was significantly lower in juvenile leaves. Despite the considerable variability in LMA, there was an apparent trend of increase from spring to peak season in both juvenile and mature leaves. There was also a trend of increasing DW/FW ratio from DOY 141 to 169 for both juvenile and mature leaves (Figure 4i).

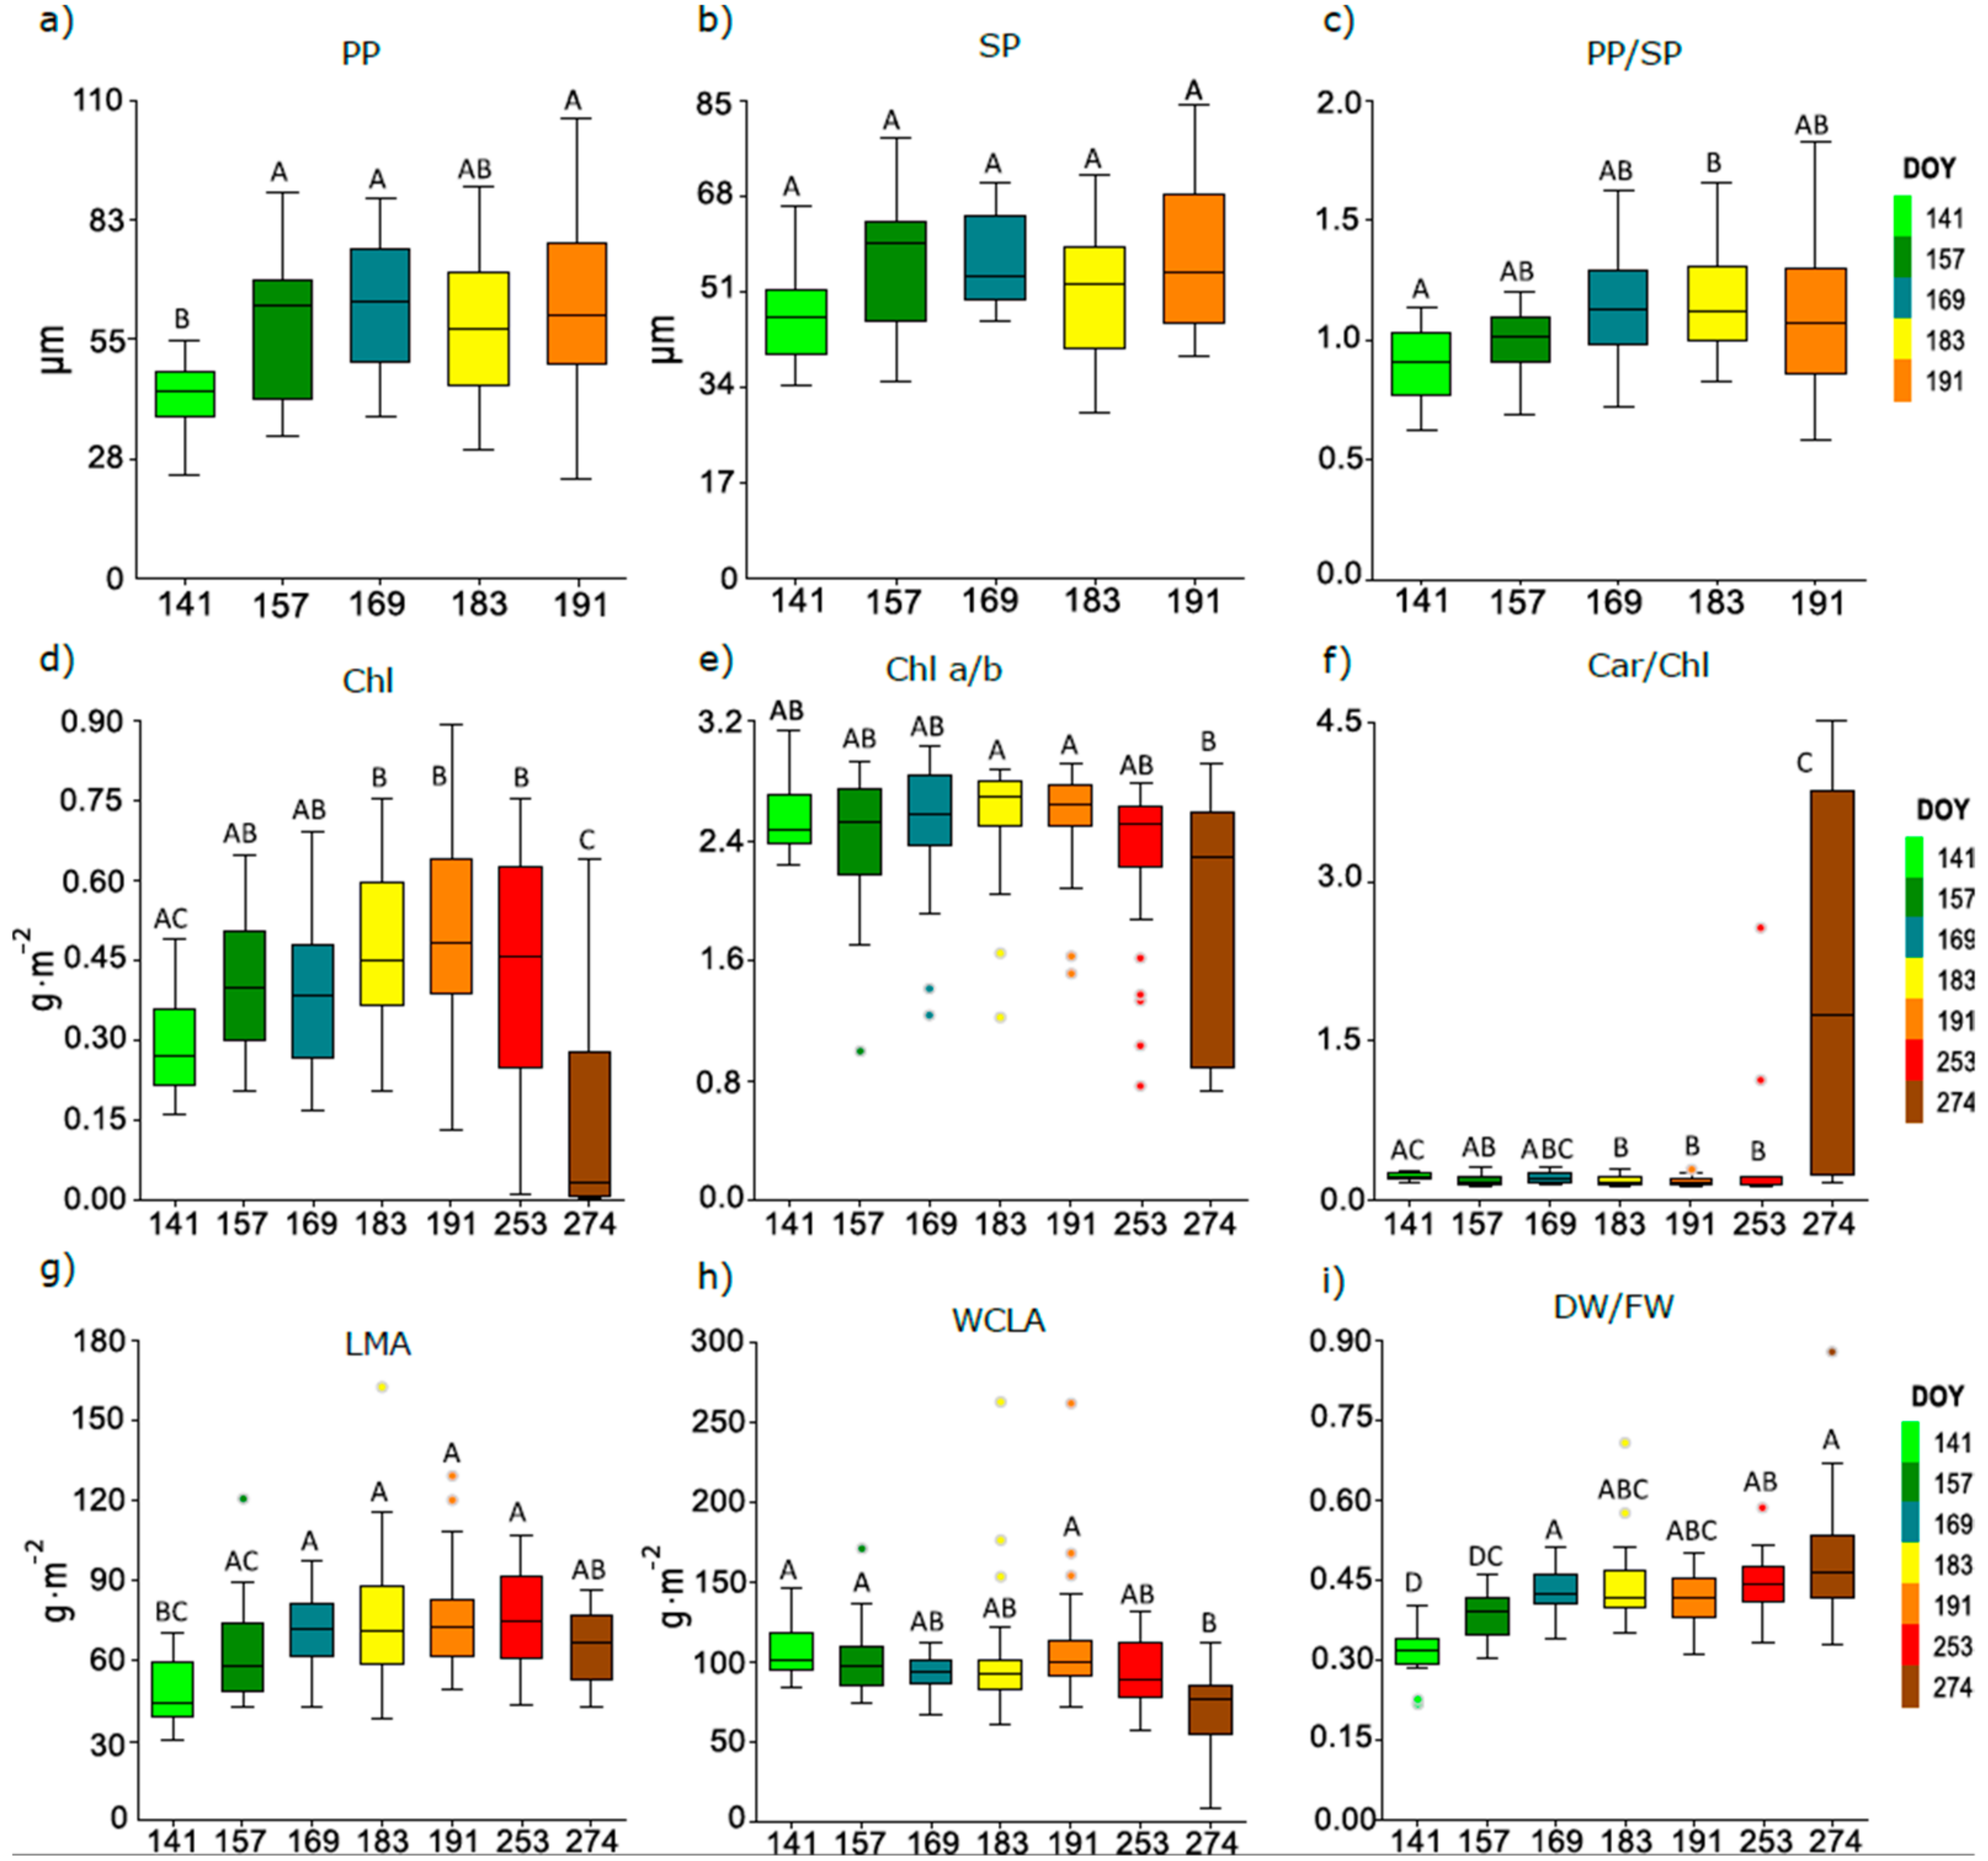
3.3. Seasonal Course of Anatomical and Biophysical Traits of Pooled Leaves

Finally, the data for all leaf developmental categories were pooled together and general seasonal courses of studied anatomical and biophysical leaf traits were described (Figure 5). The PP increased from May to June (DOYs 141 and 157) and then remained stable until the end of the season (Figure 5a). In contrast, the SP remained unchanged during the season and it was fully developed since the first sampling (DOY 141) (Figure 5b). Thus, the moderately rising PP/SP (Figure 5c) resulted from increasing thickness of PP (Figure 5a).
Similar to the anatomical traits, the seasonal changes in pigment content and their ratios (Chl a/b, Car/Chl) in pooled juvenile, mature, and senescent leaves of all three studied species were analyzed. We observed an increasing trend of Chl content from the beginning of the season till the maximum in DOY 191 and then the significant drop during senescence between DOY 254 and DOY 274 (Figure 5d). The Chl a/b ratio was quite stable during the season, only showing larger variance in last sampling DOY 274 (Figure 5e). Similarly, Car/Chl was also stable until the DOY 274, when a sharp increase was caused by the seasonal drop of chlorophyll content during leaf senescence (Figure 5f).
Finally, the seasonal trends in structural traits were evaluated for all leaves pooled together (Figure 5g–i). The LMA showed seasonal dynamics, increasing from DOY 141 with the peak of values on DOY 183 and decreasing toward the end of the season (Figure 5g), the seasonal LMA pattern was similar as shown for separated leaf developmental categories (Figure 4g). The WCLA seasonal course for all leaf developmental categories was the most stable with the highest values on DOYs 183 and 191 and significant drop at the end of the season (Figure 5h). The DW/FW followed an increasing trend toward the season peak (DOY 183), then remained stable only with increasing variability in data (Figure 5i), which agrees with the pattern shown for the DW/FW of both juvenile and adult leaves analyzed separately (Figure 4i).

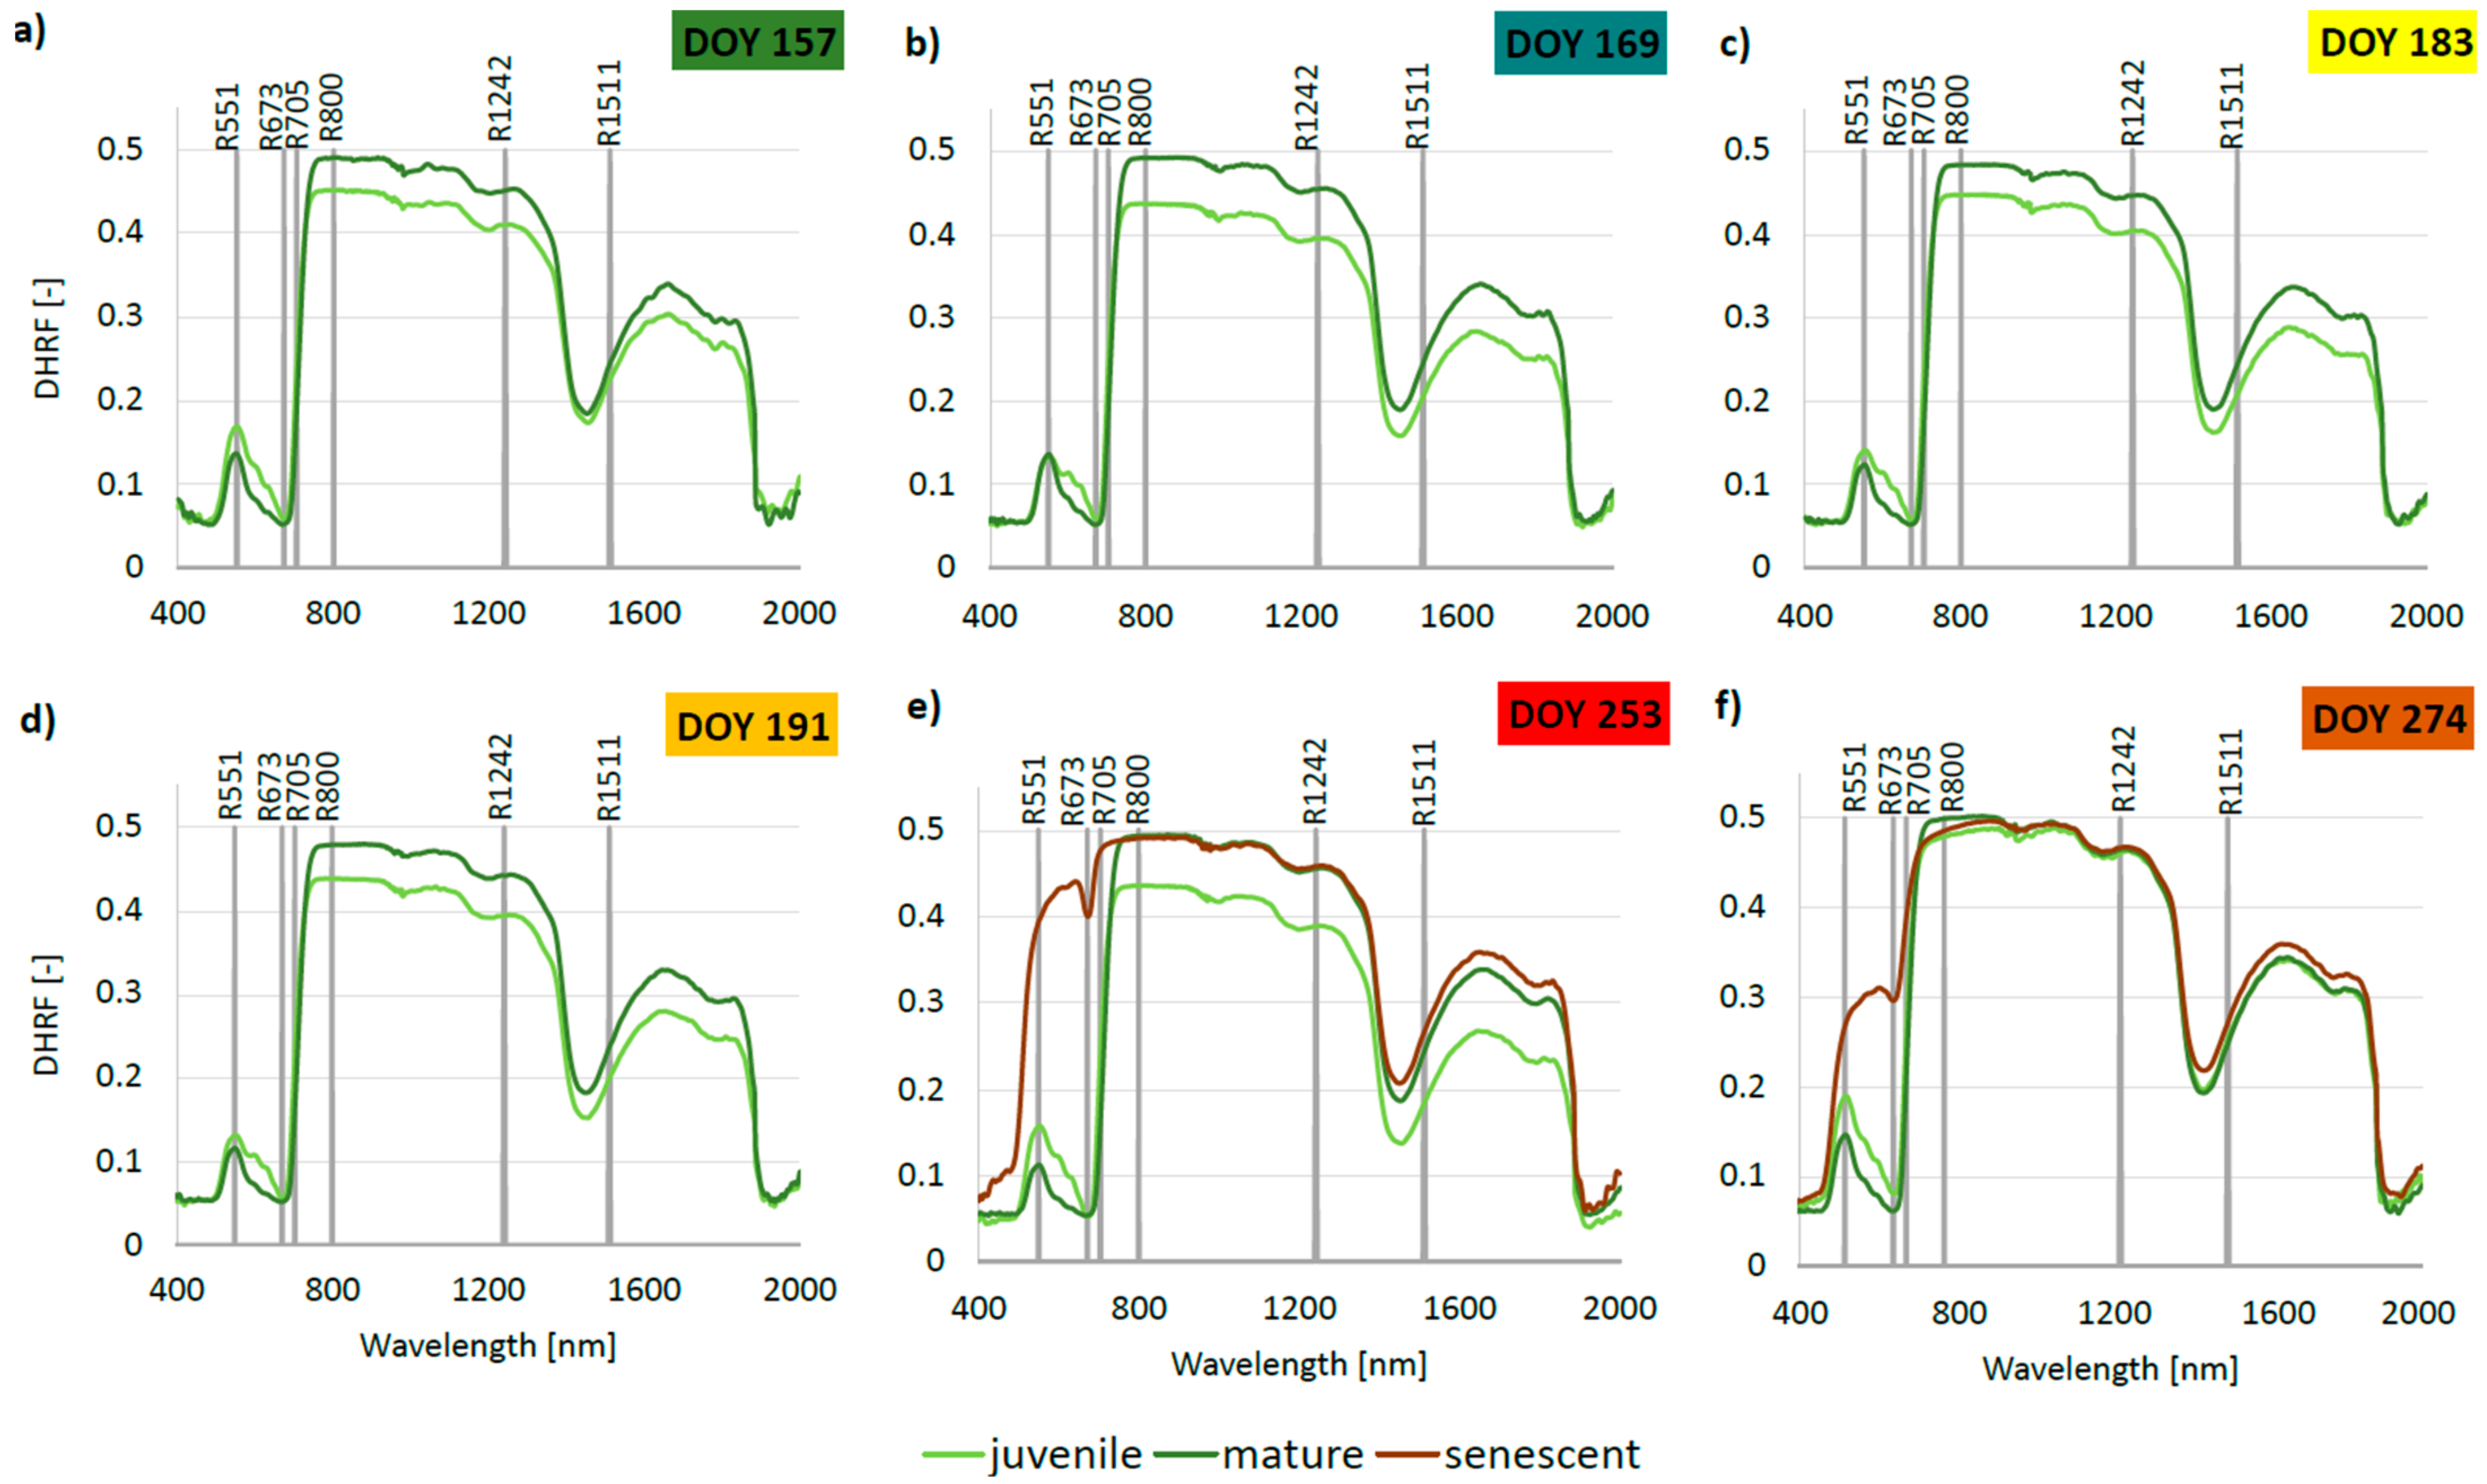
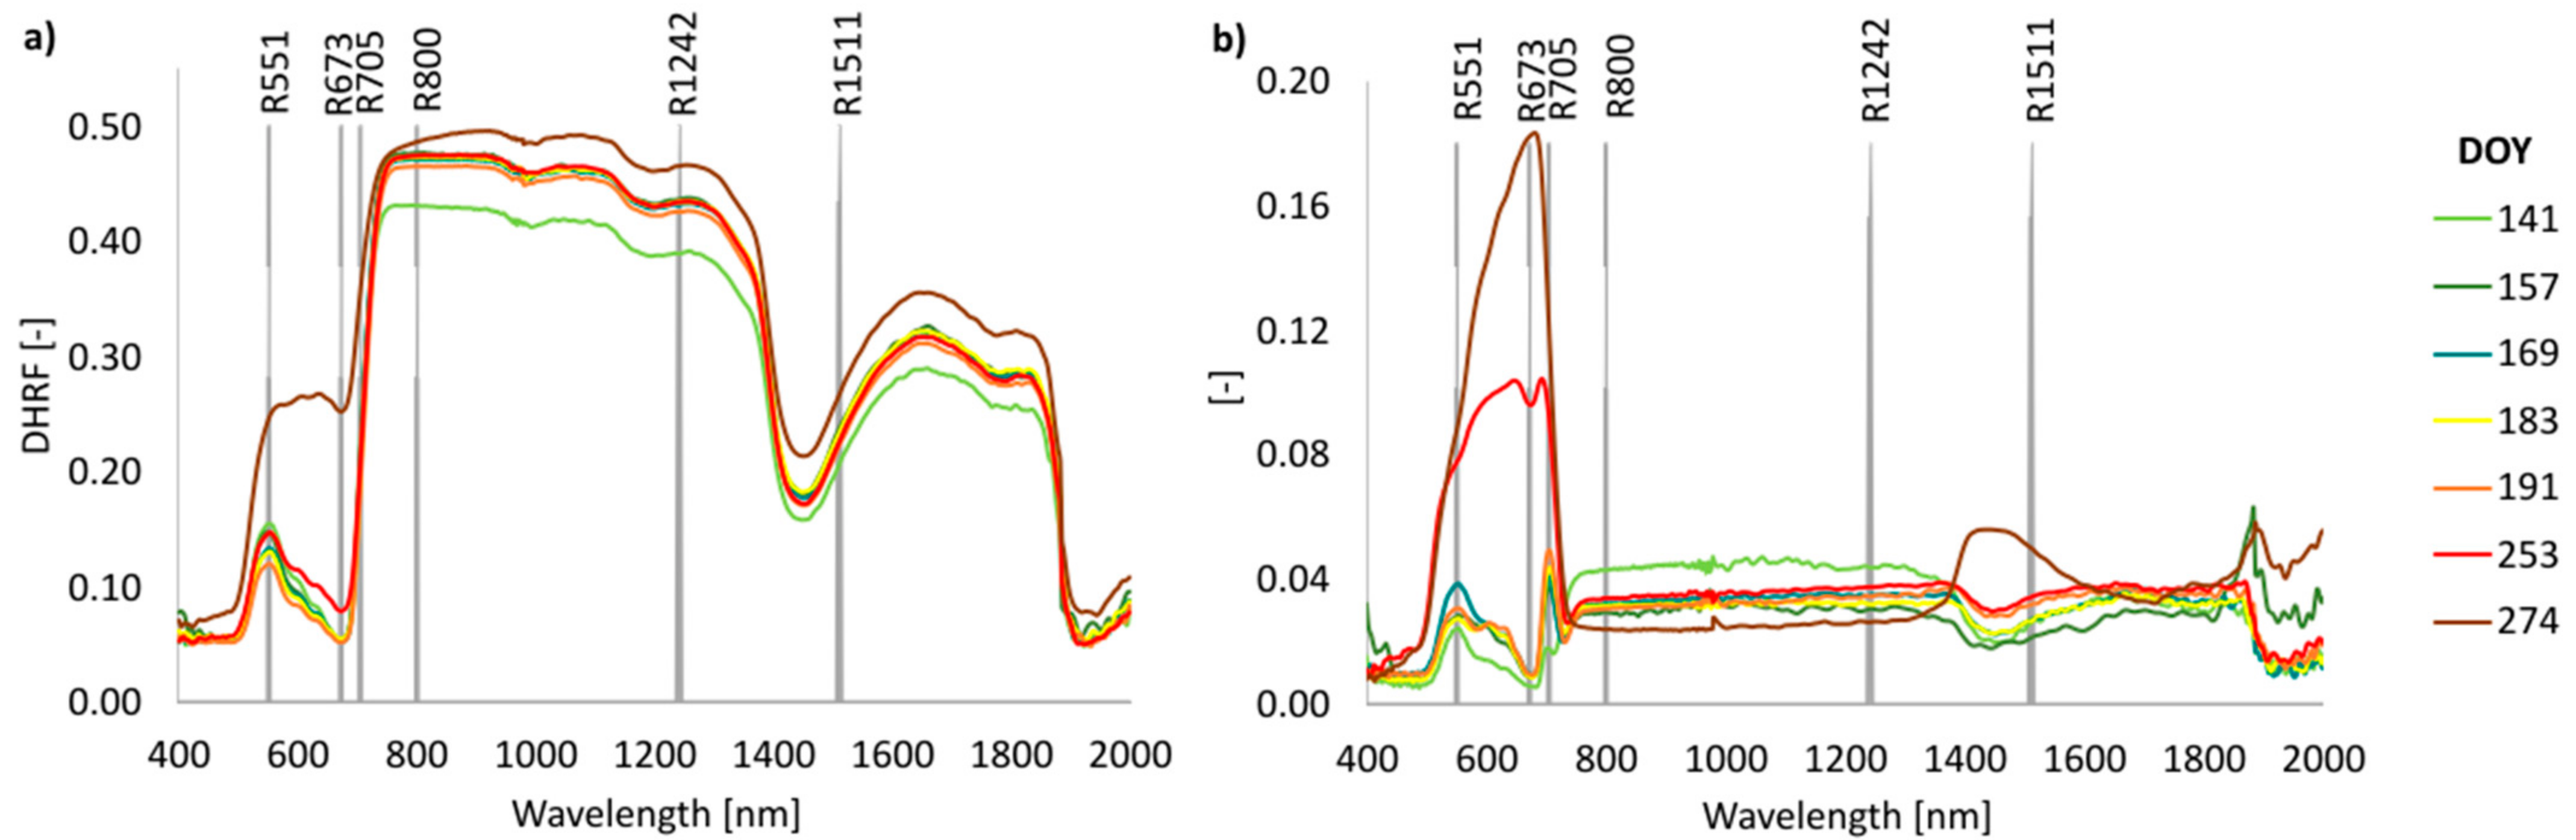
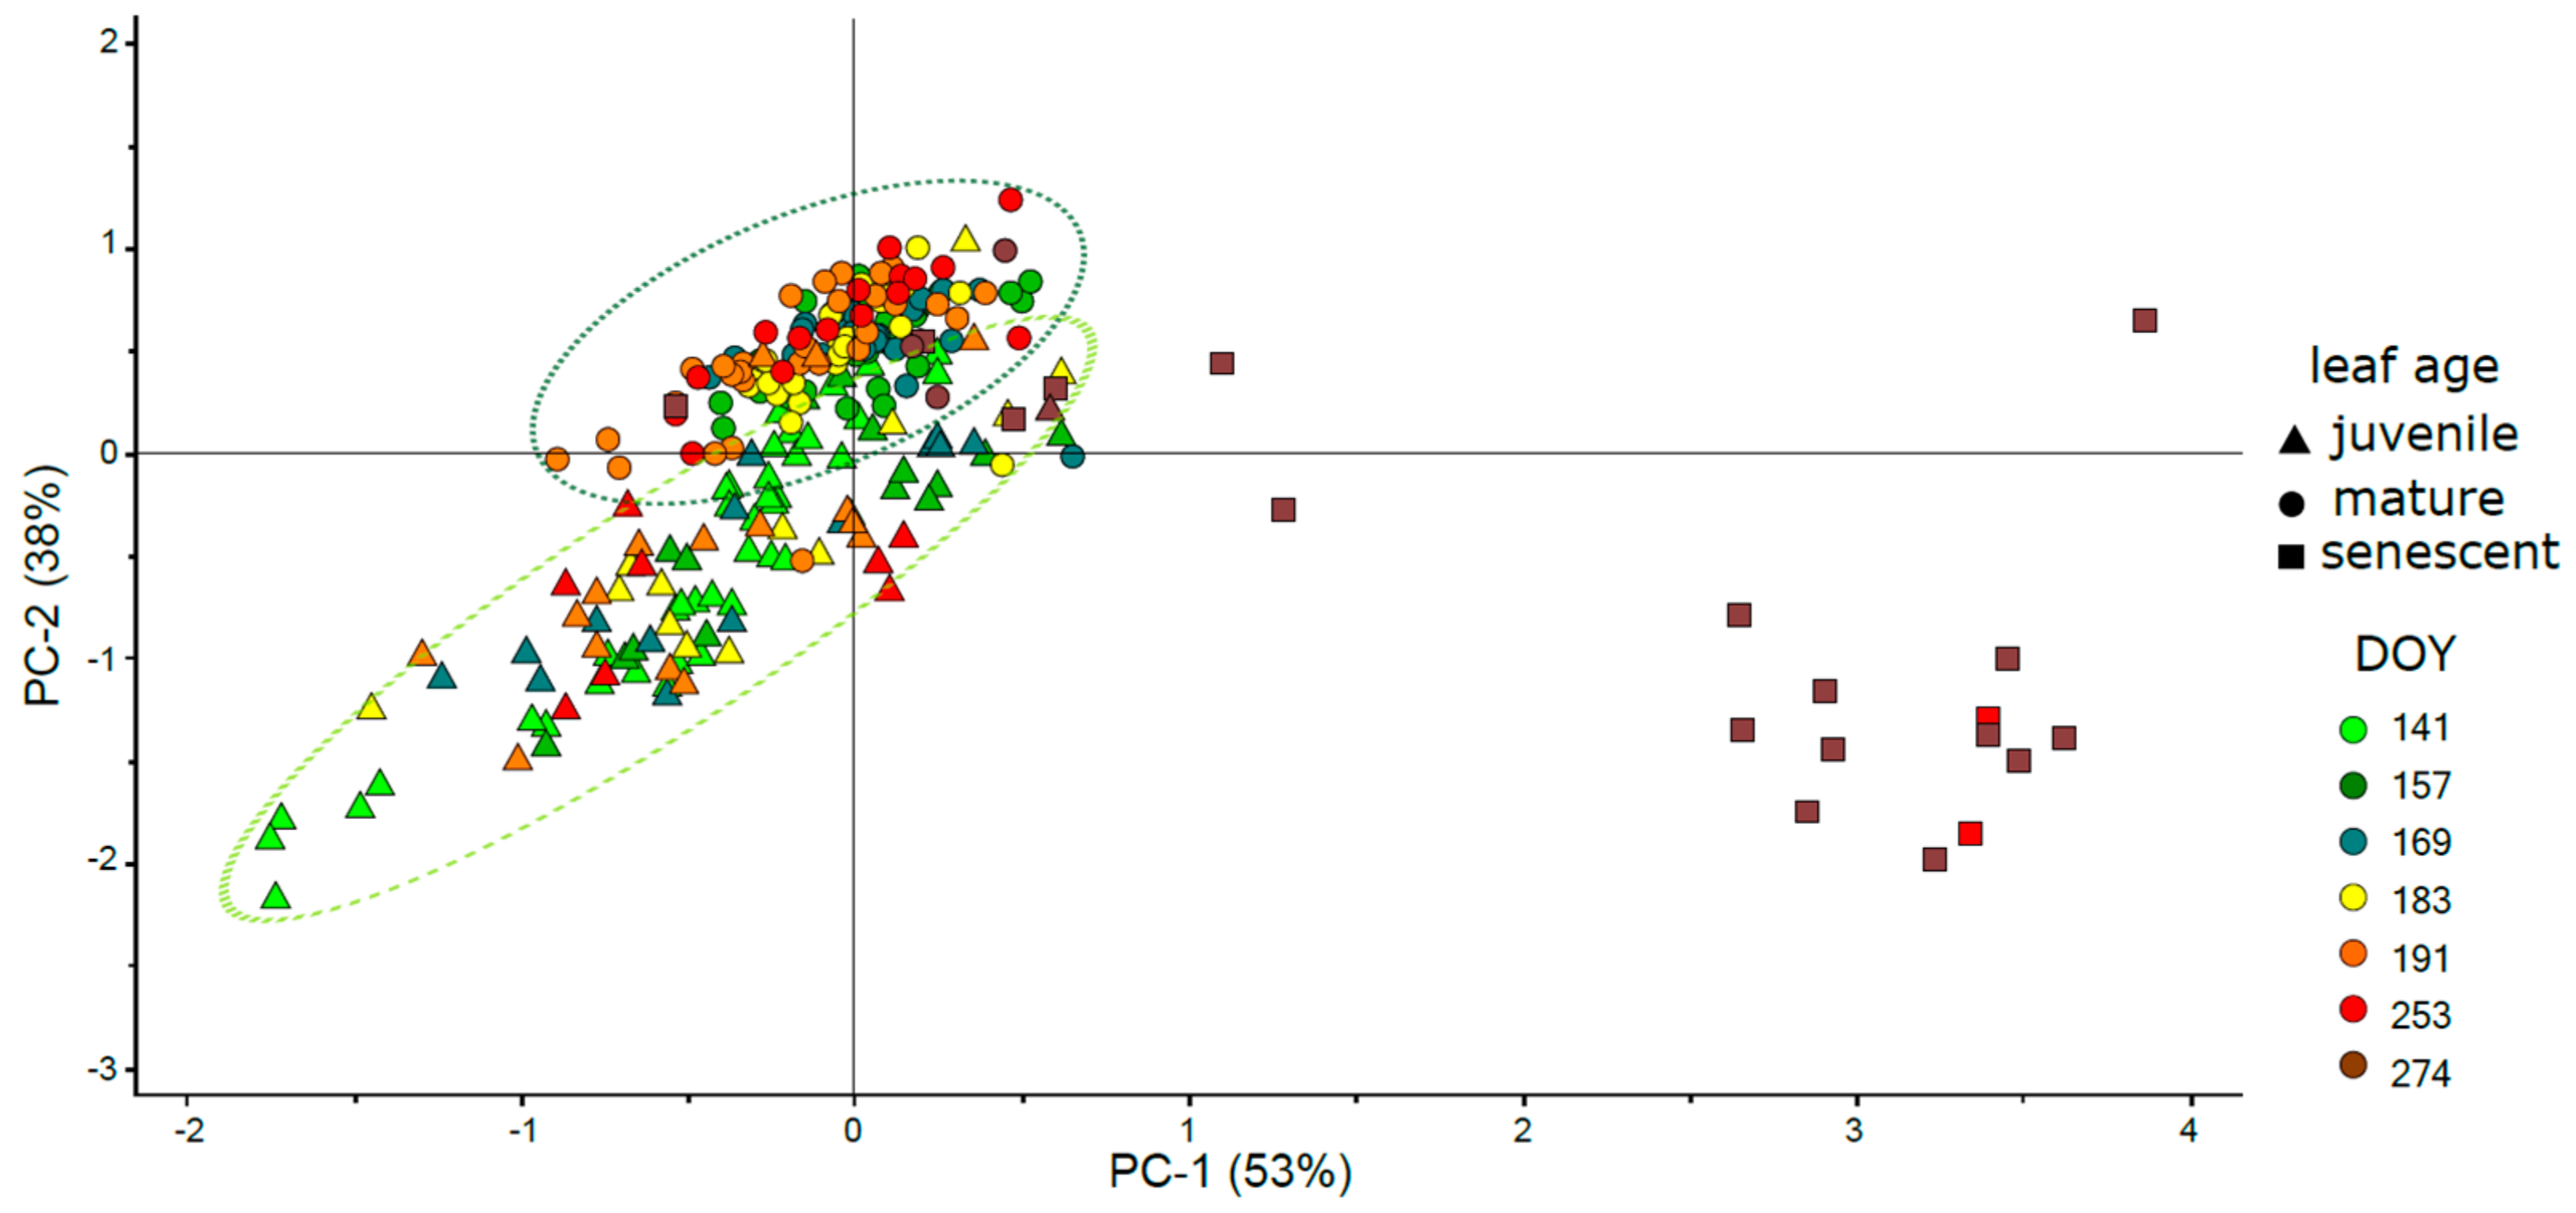
3.4. Phenology of Leaf Reflectance Related to Leaf Developmental Category

Figure 6 shows the leaf reflectance during the growing season accounting for the presence of leaves in different developmental stage within a tree crown. The spectra for the first sampling (DOY 141) are not shown, as all leaves in the canopy were classified as juvenile. Between DOYs 157 and 253 there are apparent differences between juvenile and mature leaves’ reflectance, particularly in green, red, NIR and SWIR spectral regions. In the last sampling (DOY 274), the difference between juvenile and mature leaves was less pronounced (Figure 6f). Senescent leaves were detected first on DOY 253 and their spectral signal is obviously different from juvenile and mature leaves in VIS, and from juvenile leaves also in NIR and SWIR spectral regions.
In Figure 6, grey vertical lines highlight the reflectance in representative wavelengths for the visible (VIS = 400–700 nm), near-infrared (NIR = 700–1000 nm), and the shortwave infrared region (SWIR = 1000–2000 nm), being of basic interest for vegetation spectroscopy. As representative wavelengths for given wavelength intervals, we present the nearest wavelengths measured by our spectroradiometer: green = 551 nm; red = 673 nm; red edge = 705 nm [45]; near infra-red = 800 nm, related to structural absorption features [40]; water absorption features = 1242 nm [62]; nitrogen absorption features = 1511 nm [63]. Differences among sampling dates and leaf developmental categories in these wavelengths are presented in (Figures S5–S7).
Seasonal trends in described wavelengths for juvenile, mature, and senescent leaves are shown in (Figure S5). In juvenile leaves, the seasonal effect on values of reflectance at 551 nm, 673 nm, 800 nm, and 1242 nm was absent; however, the reflectance at 705 nm exhibited an increasing trend toward the peak and end of the season; the reflectance in the SWIR spectral region showed a decreasing trend toward the end of the season. Reflectance of mature leaves was less stable: reflectance at 673 nm, 800 nm, 1242 nm, and 1511 nm did not change during the growing season, whereas reflectance at 551 nm and 705 nm decreased from DOY 157 to 253 and increased in DOY 274. Senescent leaves showed high variance of reflectance at 551 nm, 673 nm, and 705 nm at the end of the season (DOY 274); while variance of reflectance at 800 nm, 1242 nm, and 1511 nm was small at the end of the season, (Figure S5a–f).
Differences in reflectance in selected wavelengths between juvenile and mature leaves during the season are shown in Figure S6. The difference between juvenile and mature leaf reflectance in green and red spectral regions was unstable with large variance, particularly for the reflectance of juvenile leaves, with differences in mid-summer season (Figure S6a,b). In general, juvenile leaves exhibited higher reflectance than mature leaves in the VIS region, most profoundly in the red-edge spectral region (Figure S6c) where juvenile leaves had significantly higher reflectance at 705 nm compared to mature leaves throughout the whole growing season. At longer wavelengths (800 nm, 1242 nm, and 1511 nm), mature leaves consistently showed significantly higher reflectance than the juvenile leaves during the period from DOY 157 to 253 (Figure S6c–f).
Finally, Figure 7 shows the seasonal trends in reflectance and its variability (standard deviations) for all leaf developmental categories pooled together. In the VIS spectral region, the main differences are obvious at the green peak (R551) and also in the red region (R673), where the increase of reflectance in DOYs 253 and 257 corresponds to chlorophyll content decrease in the end on the season. The variability in reflectance in VIS and red edge spectral regions also increases toward the end of the season. In the NIR, the lowest reflectance is apparent at the beginning of the season (DOY 141) when the leaves were not fully developed. Between DOYs 157 and 253, the reflectance was rather stable. An increase in NIR and SWIR reflectance was also observed during late fall (DOY 274) when senescent leaves prevailed in the canopy. The local maximum of reflectance standard deviation around 1400 nm probably corresponds with water loss before leaf abscission.
Figure S7 shows the seasonal trends in reflectance in selected wavelengths. Despite significant seasonal effects in the green and red-edge spectral regions, leaf reflectance kept similar values until DOY 253 and then sharply increased on DOY 274 Figure S7a,c. In the red spectral region, there was no significant difference during the season except for the DOY 274, when reflectance rose sharply (Figure S7). In NIR- and SWIR-specific wavelengths, we observed significant differences in reflectance at the beginning of the season (DOY 141) (Figure S7d–f) and at the end of the season (Figure S7e,f) compared to the peak of the season, where reflectance at 800, 1242, and 1511 nm was stable.
The principal component analysis was applied on the whole spectral range of leaf reflectance (400–2000 nm). The first component (PC1) explained 53% variability and the second component (PC2) explained 38% of the total variability in leaf spectra (Figure 8). The model was constructed with four principal components in total, explaining 96% of the total variability in leaf reflectance. Using leaf developmental category and leaf phenology (DOY of sampling) as categorical variables, there were apparent separation trends in spectral data. Sample scores were diagonally spread along both the main components (PC1 and PC2 axes); however, the juvenile and mature leaves formed distinctive clusters—triangles and dots, respectively. Mature leaves cluster more compactly (dots in a dark green ellipse), closer to the coordinates center in comparison to looser cluster of juvenile leaves with higher variability in spectra (triangles in larger light green ellipse in Figure 8). Senescent leaves mostly formed the third cluster (squares) with a few sample scores overlapping with the mature leaves’ cluster.
In case of leaf phenology (DOY), the separation trend was much less pronounced. Probably due to continuous leaf development, there were not very distinctive clusters for individual sampling dates (Figure 8). Only senescent leaves sampled at the end of the season (DOY 274) were partly separated from other sampling dates. Results of PCA of leaf spectra showed similar trends as recorded for biophysical and anatomical traits—the effect of leaf developmental stage was strong during the whole season and the effect of leaf phenology (DOY) was more apparent toward the end of the season.

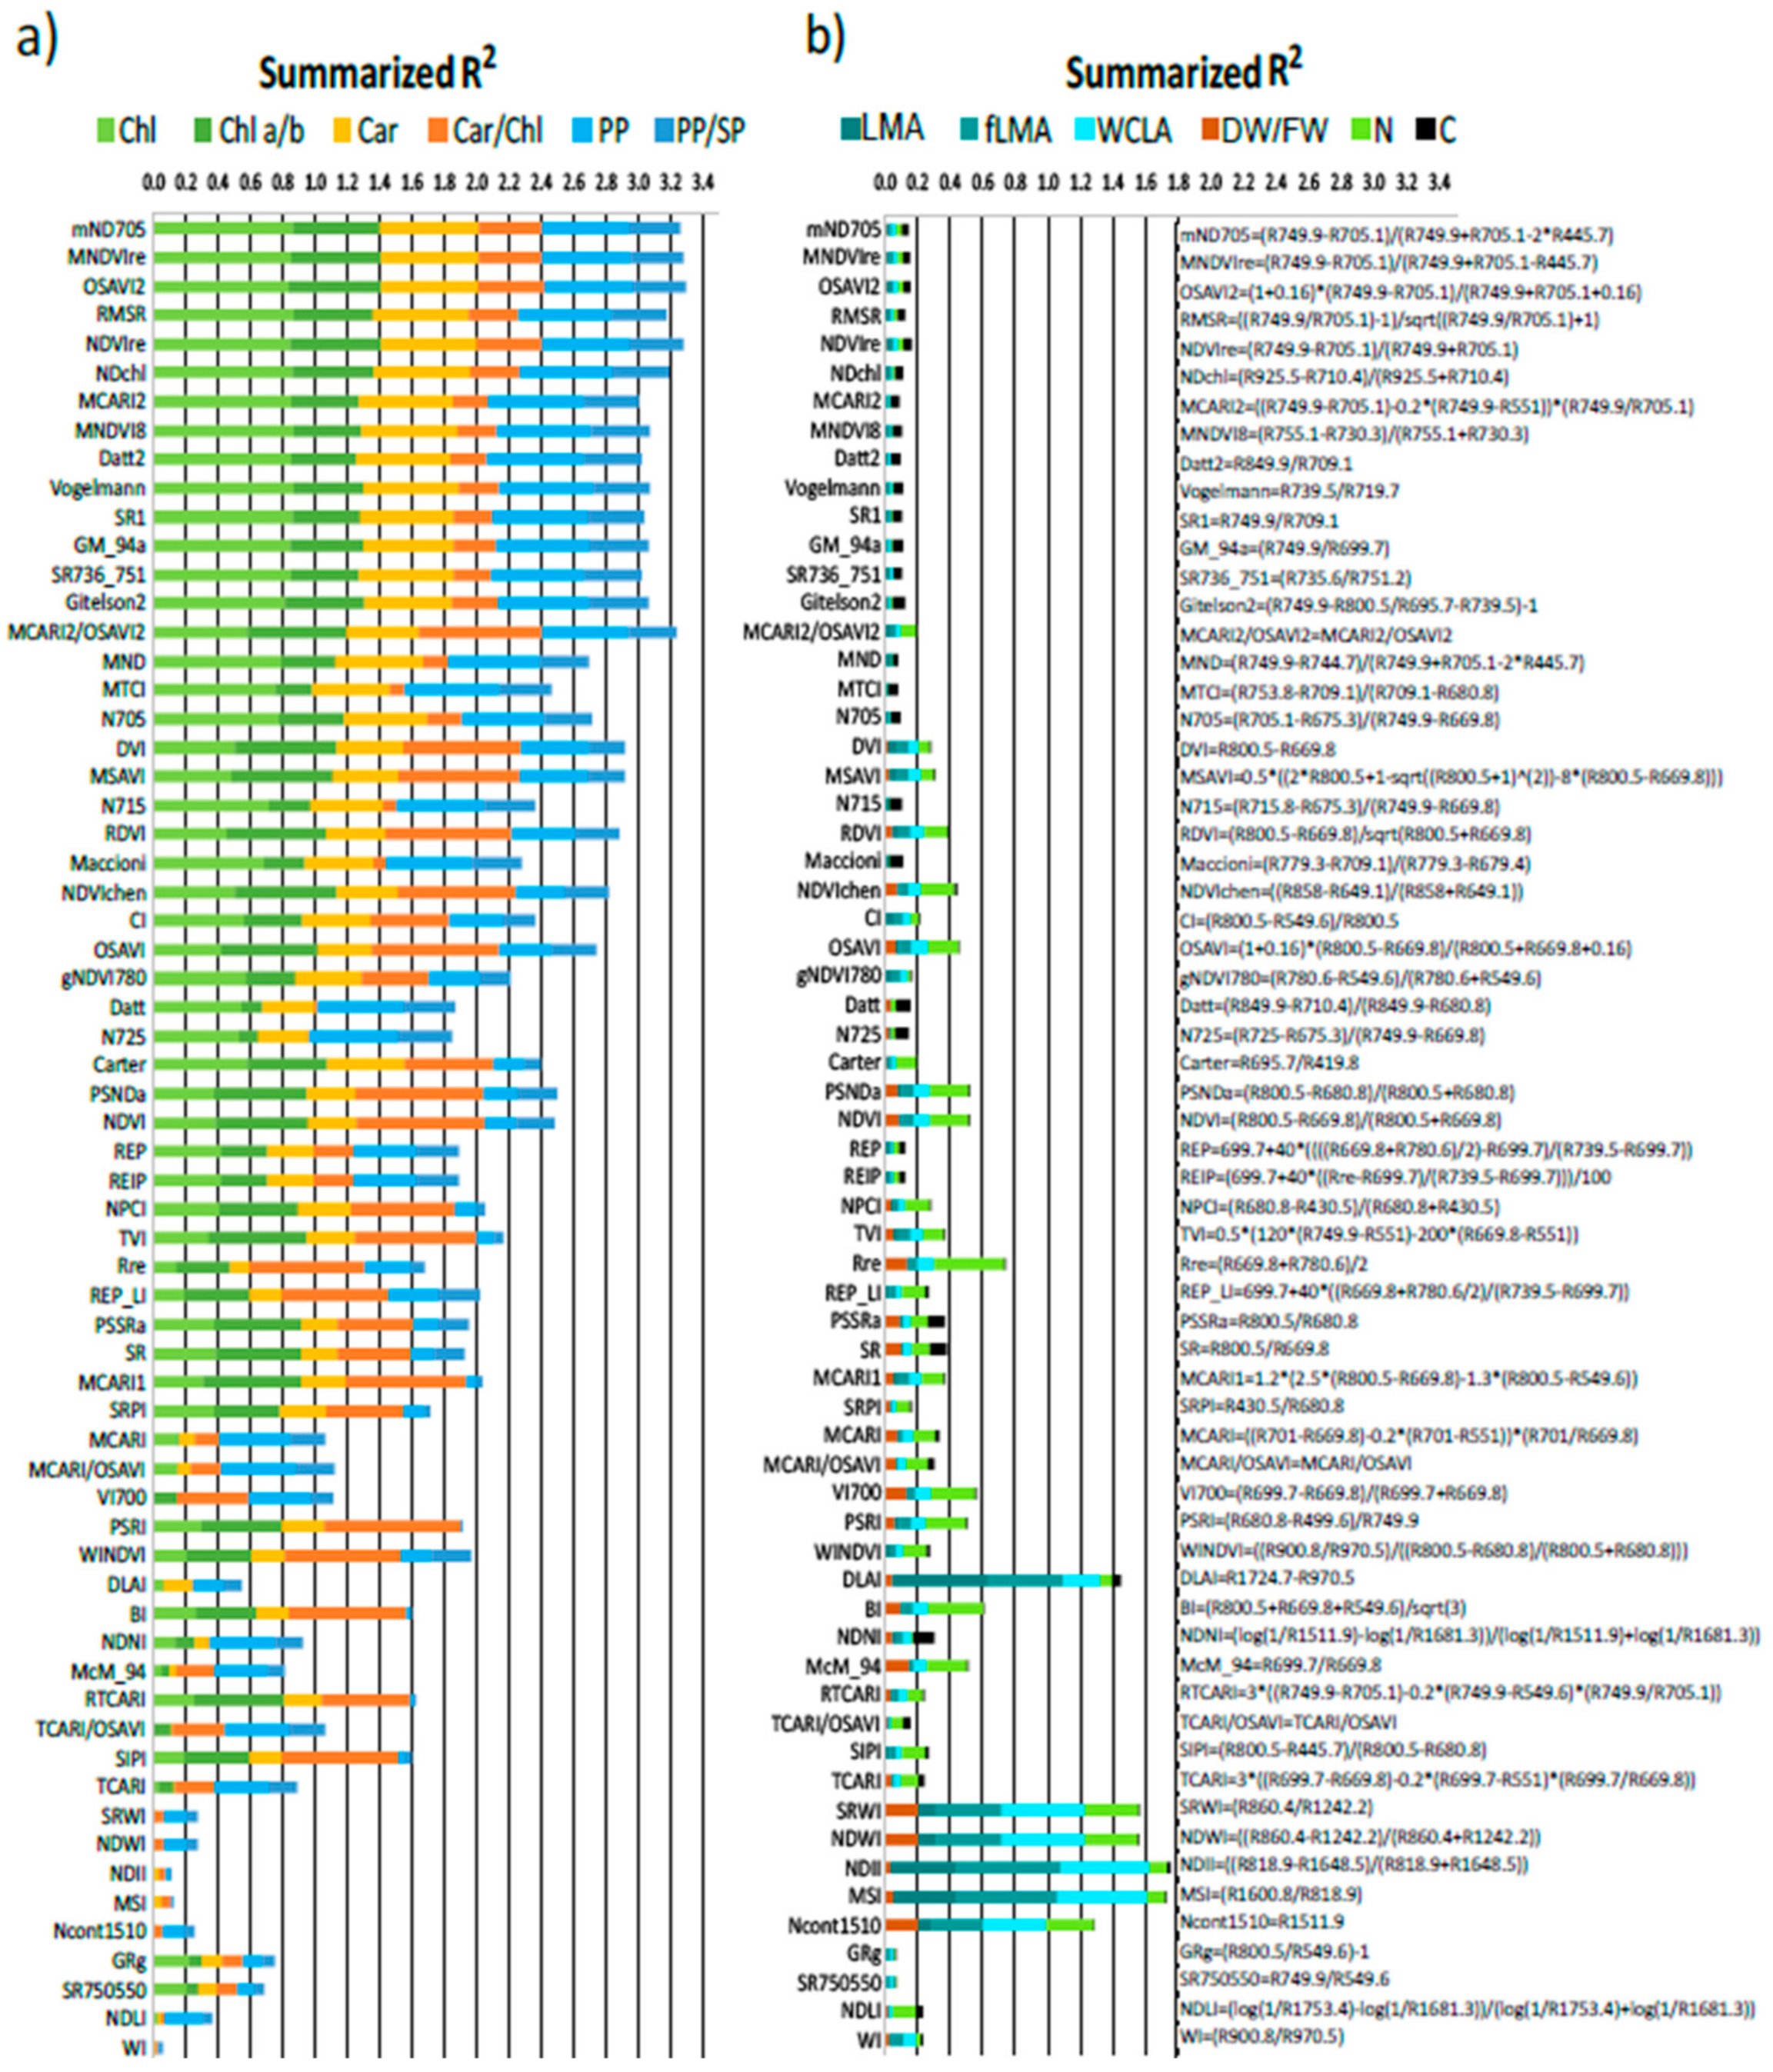
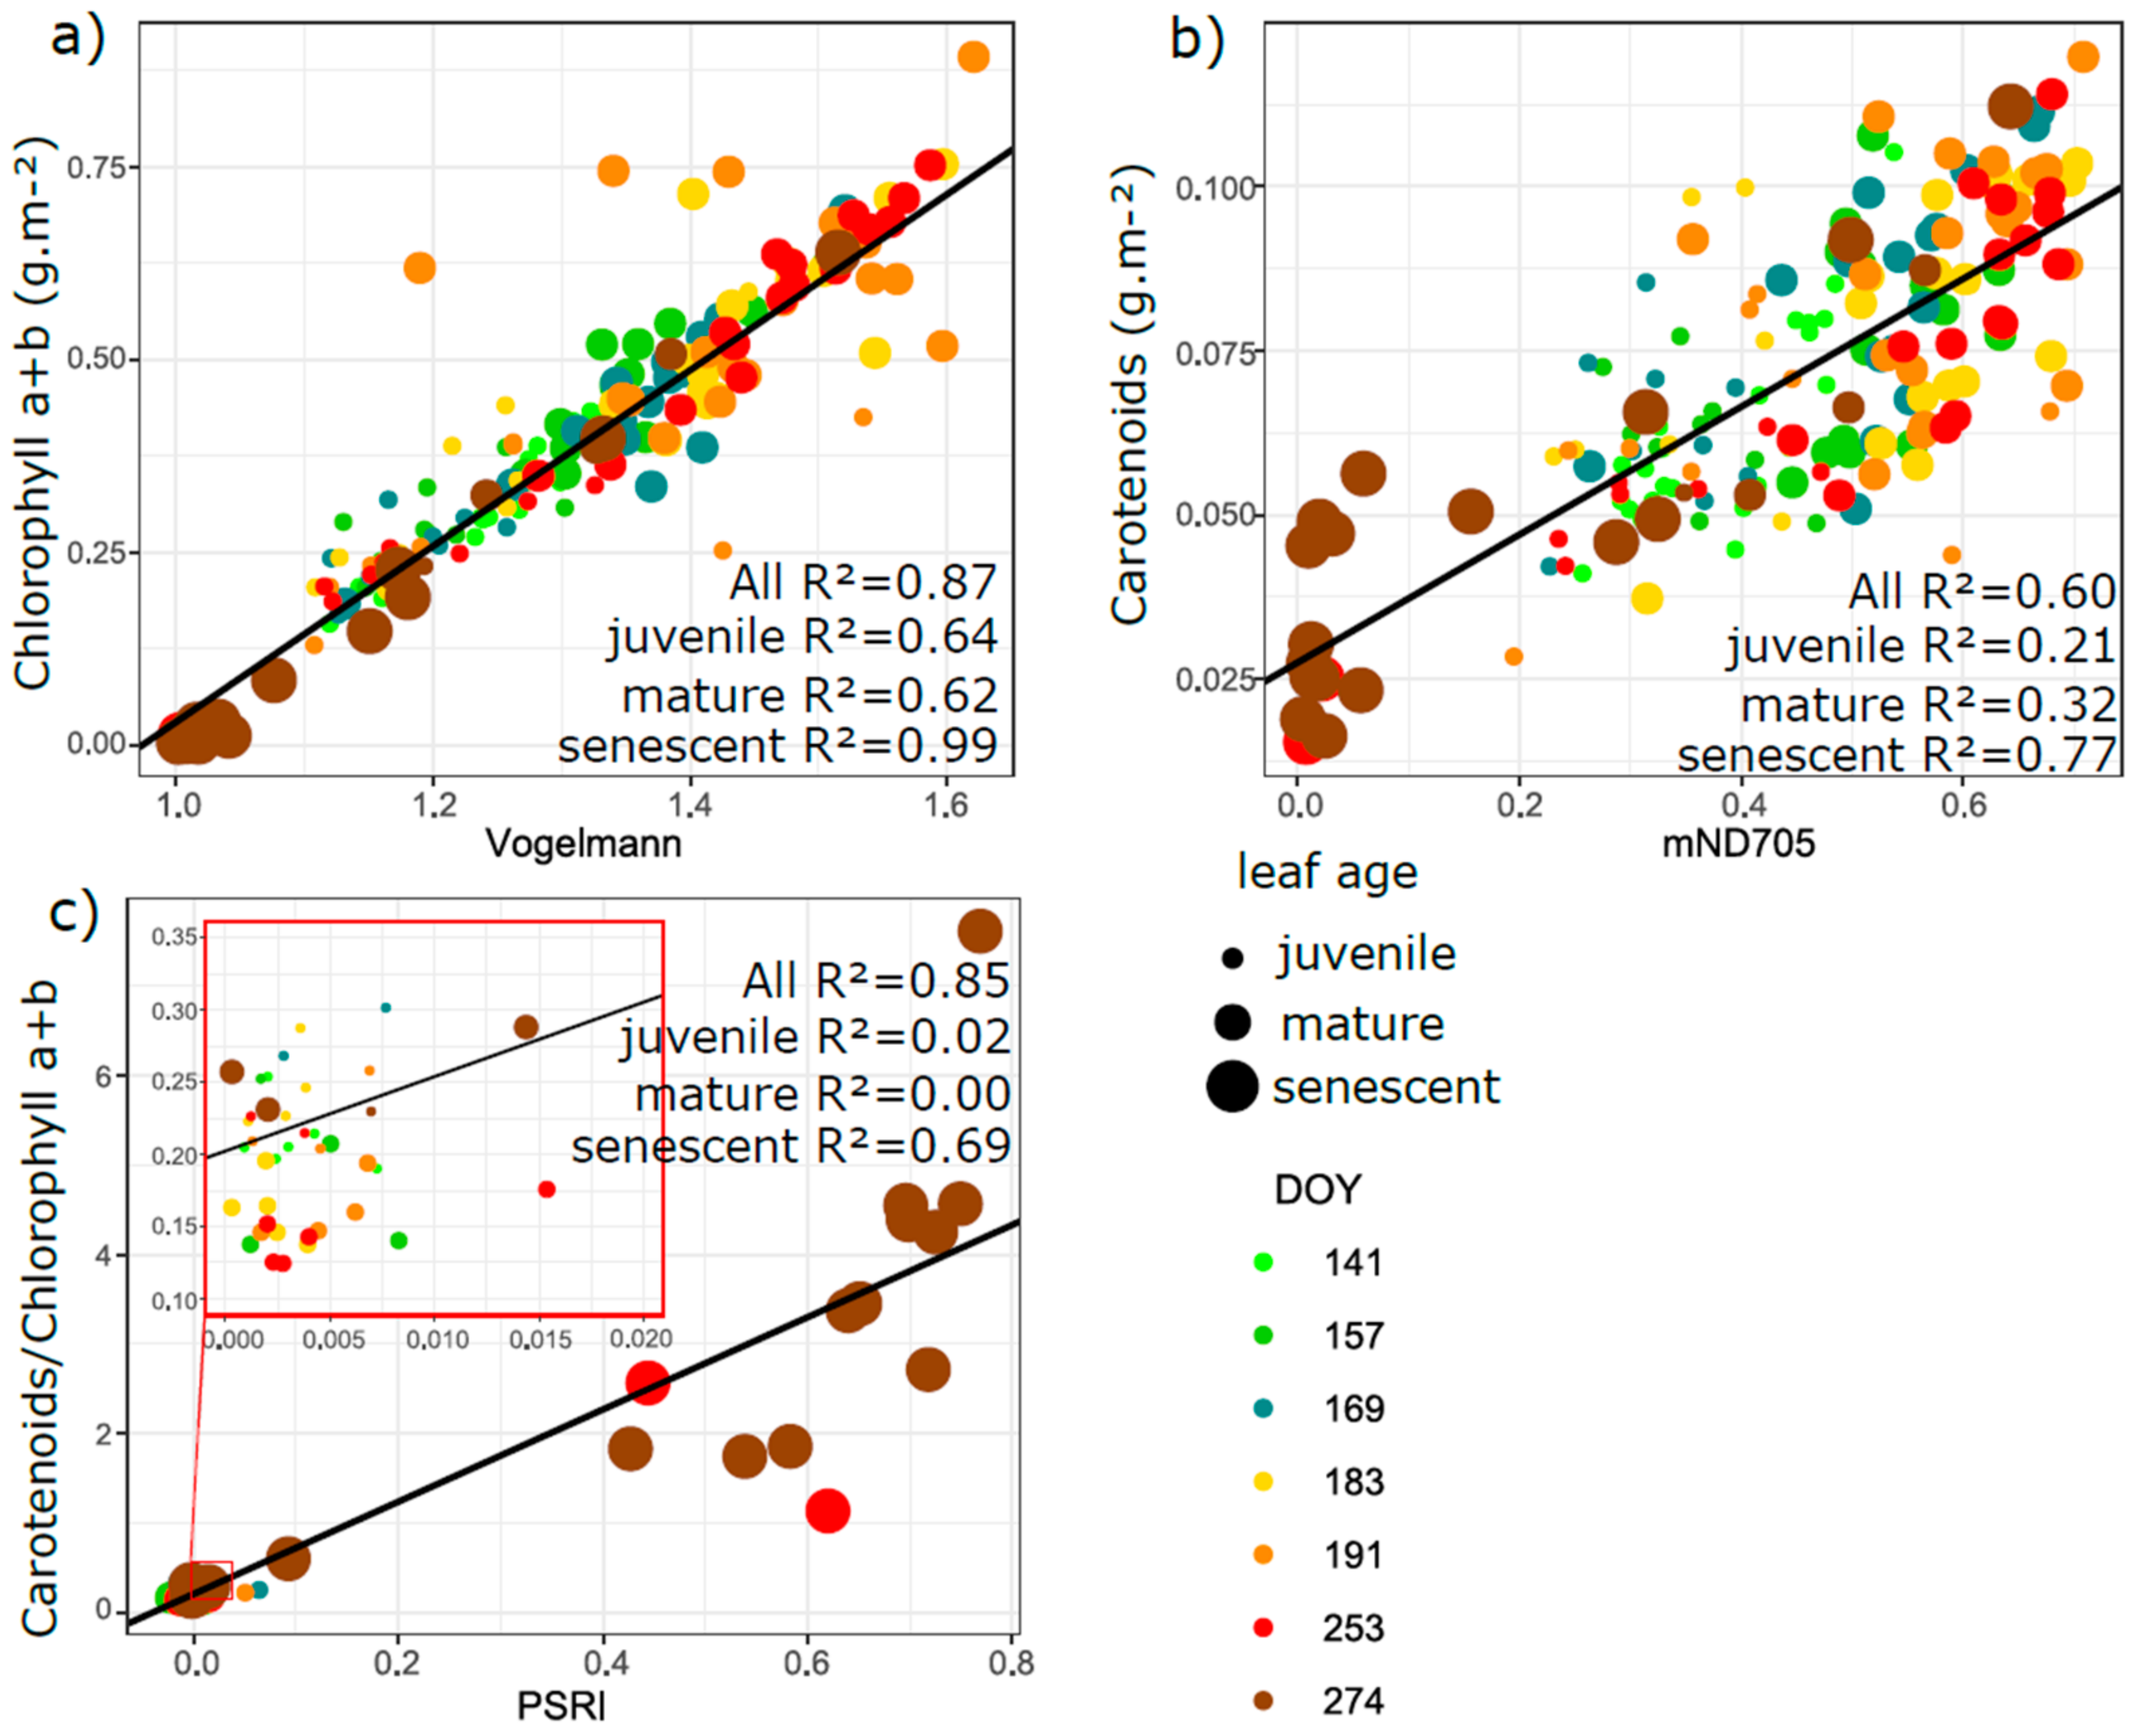
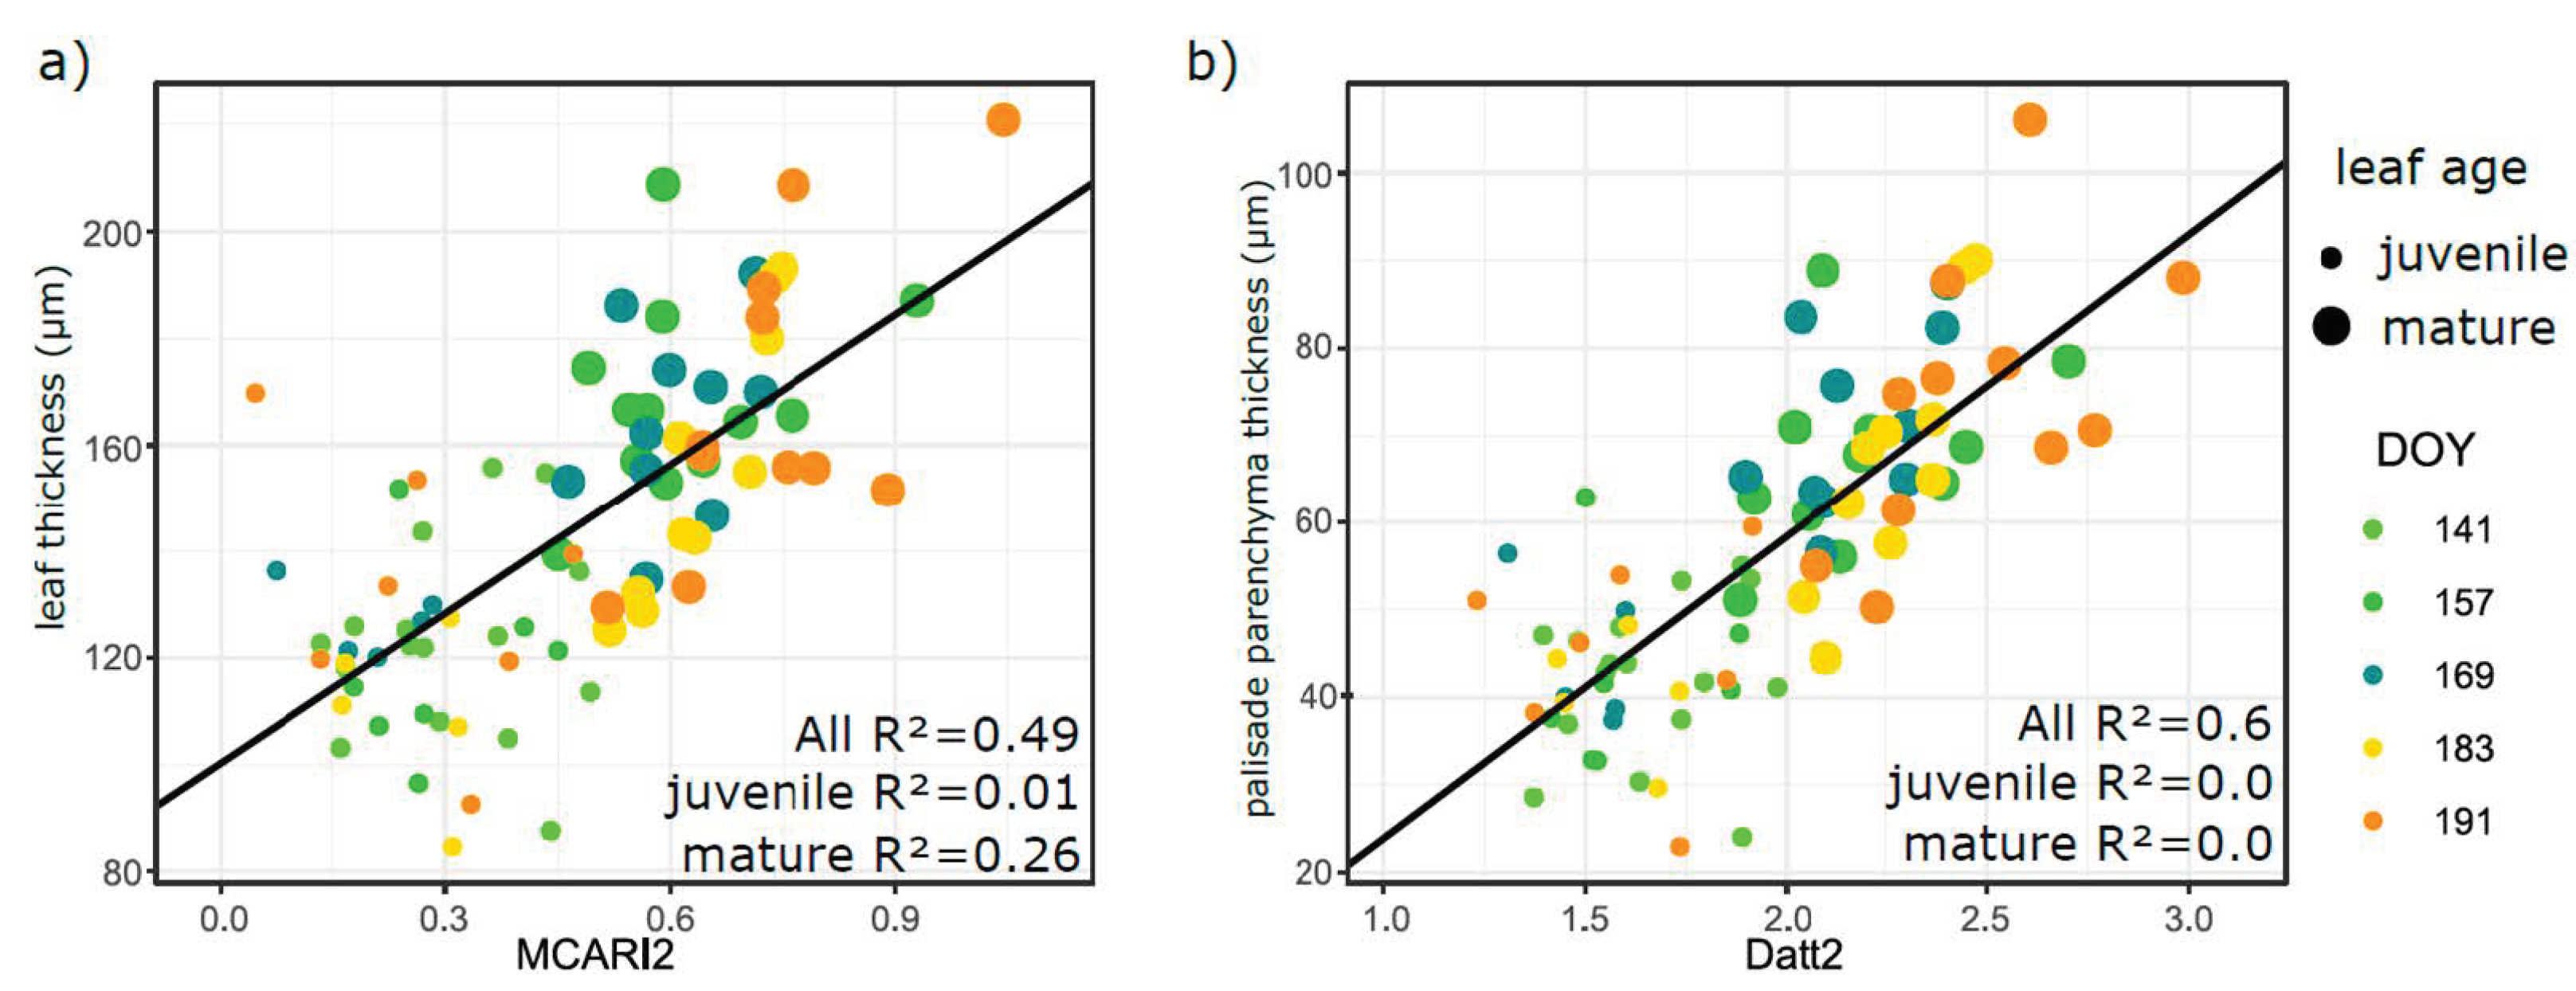
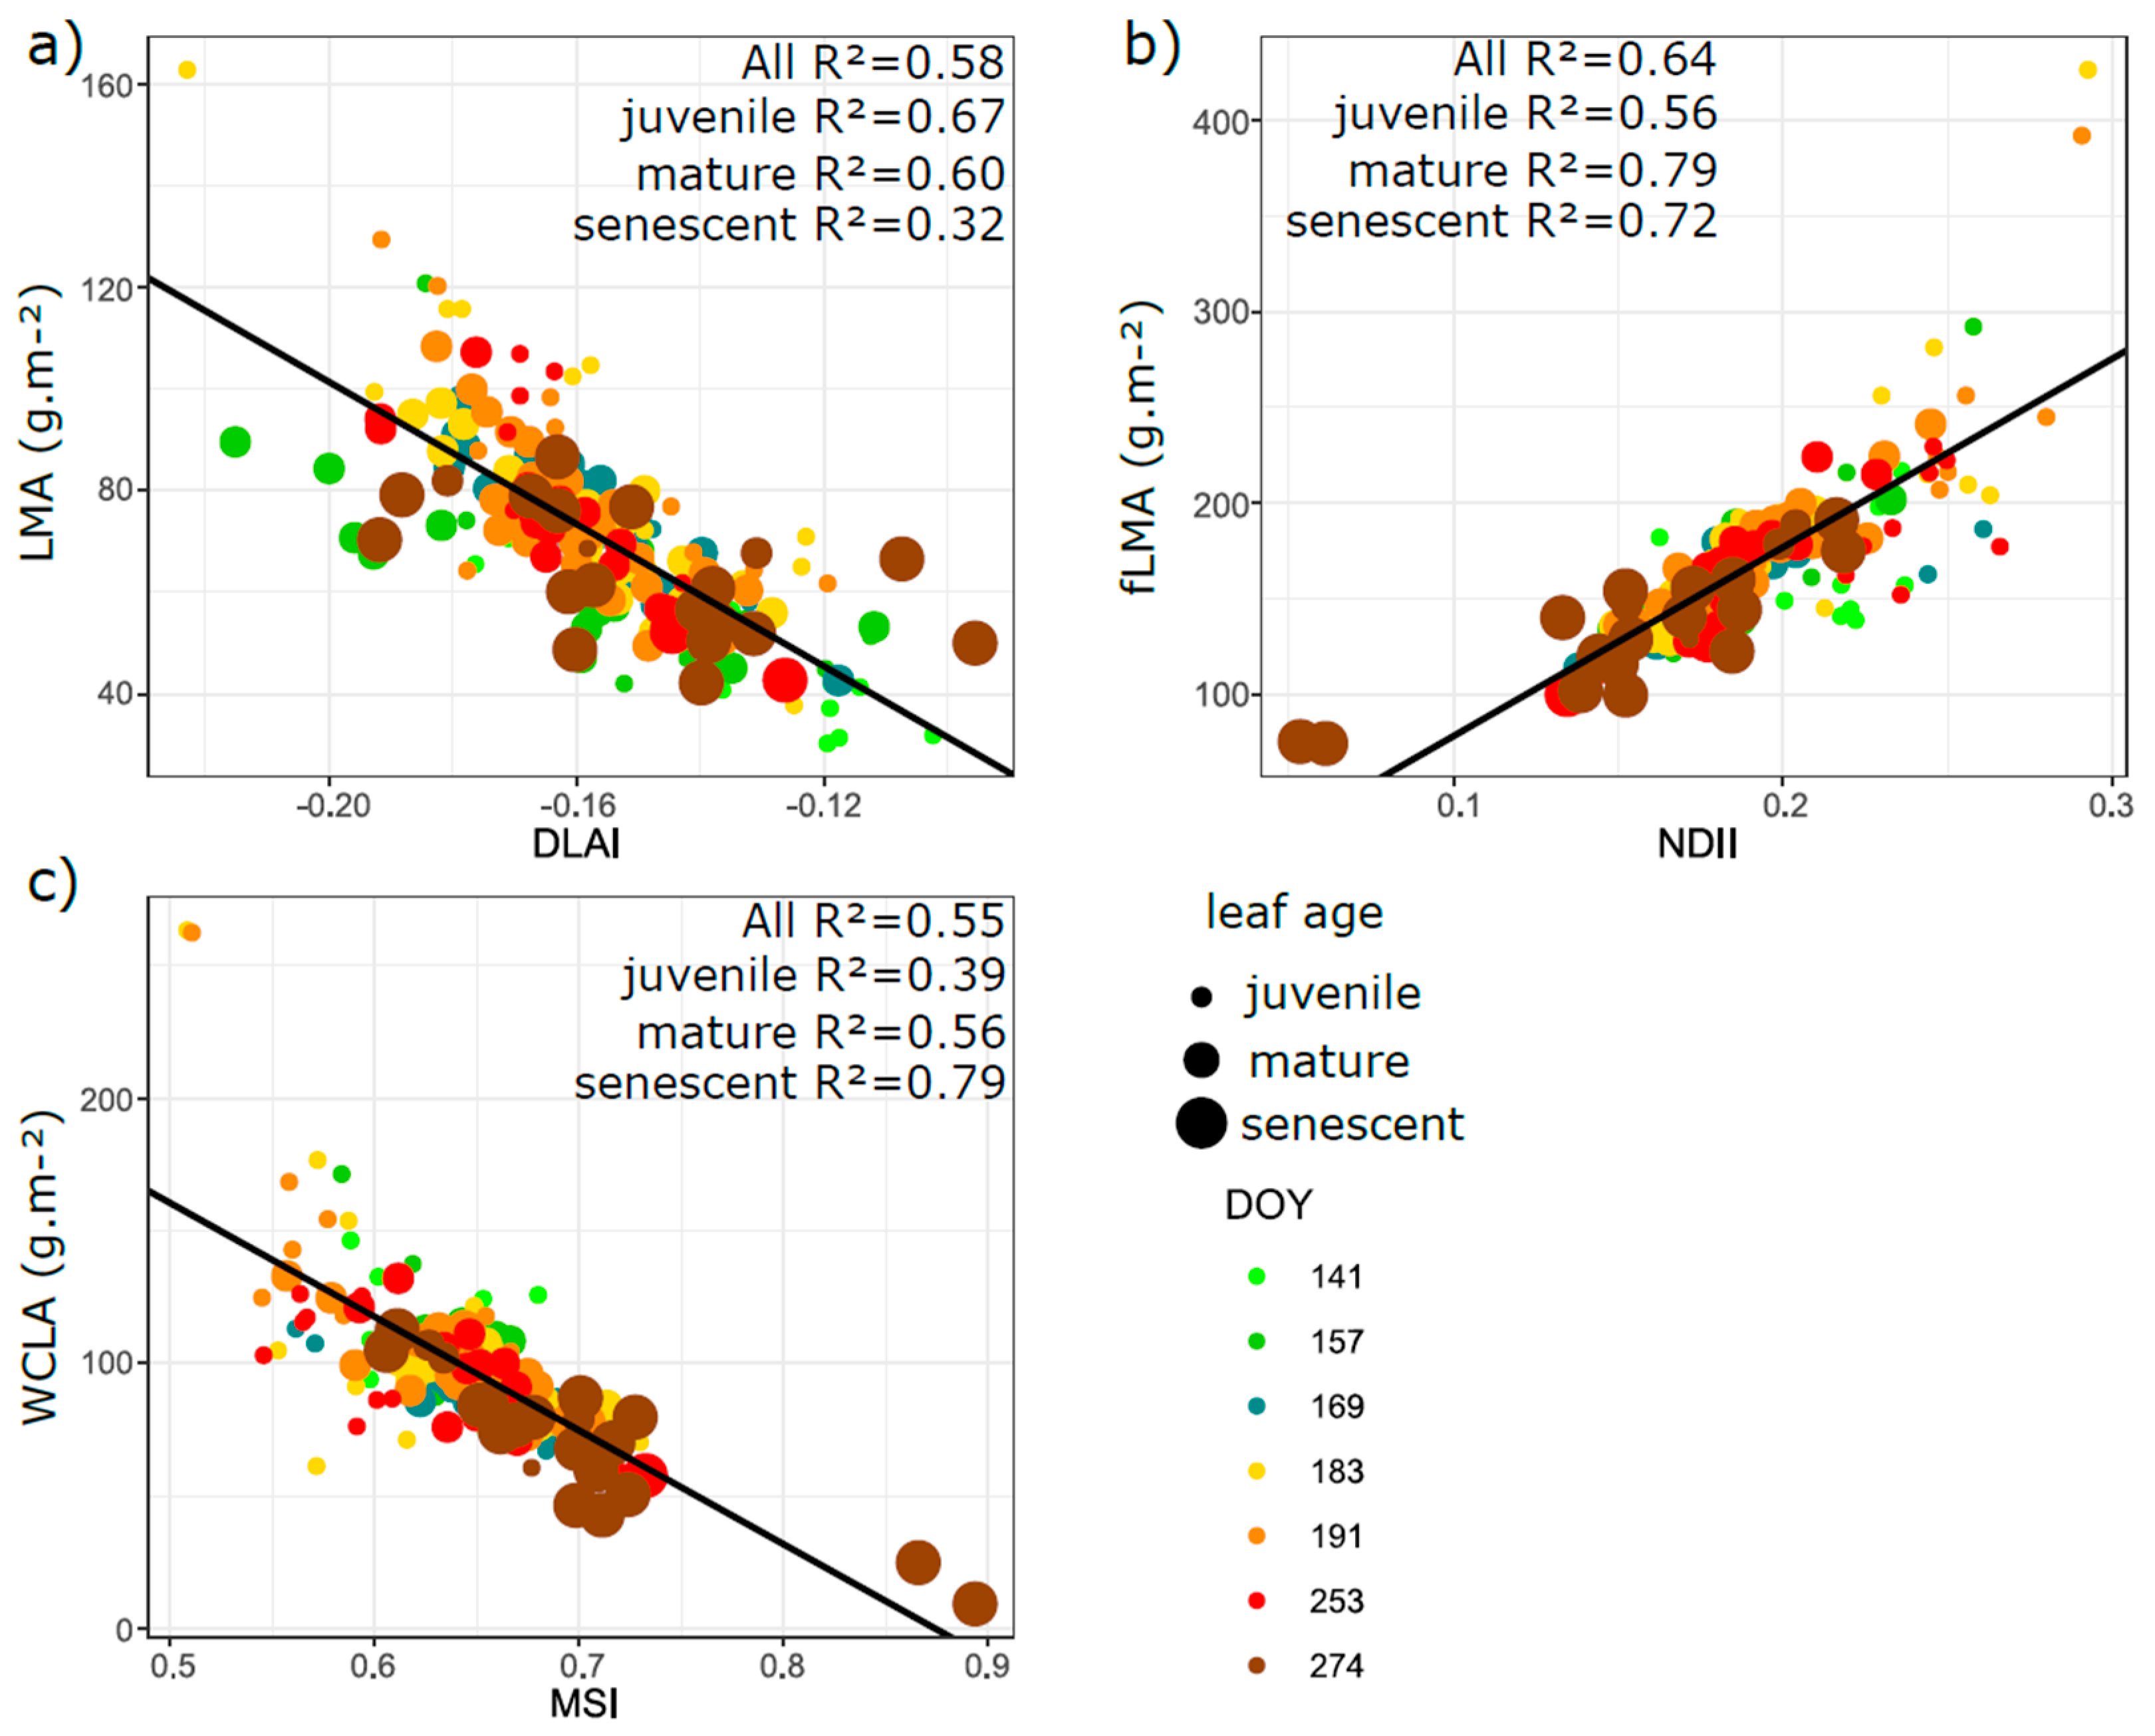
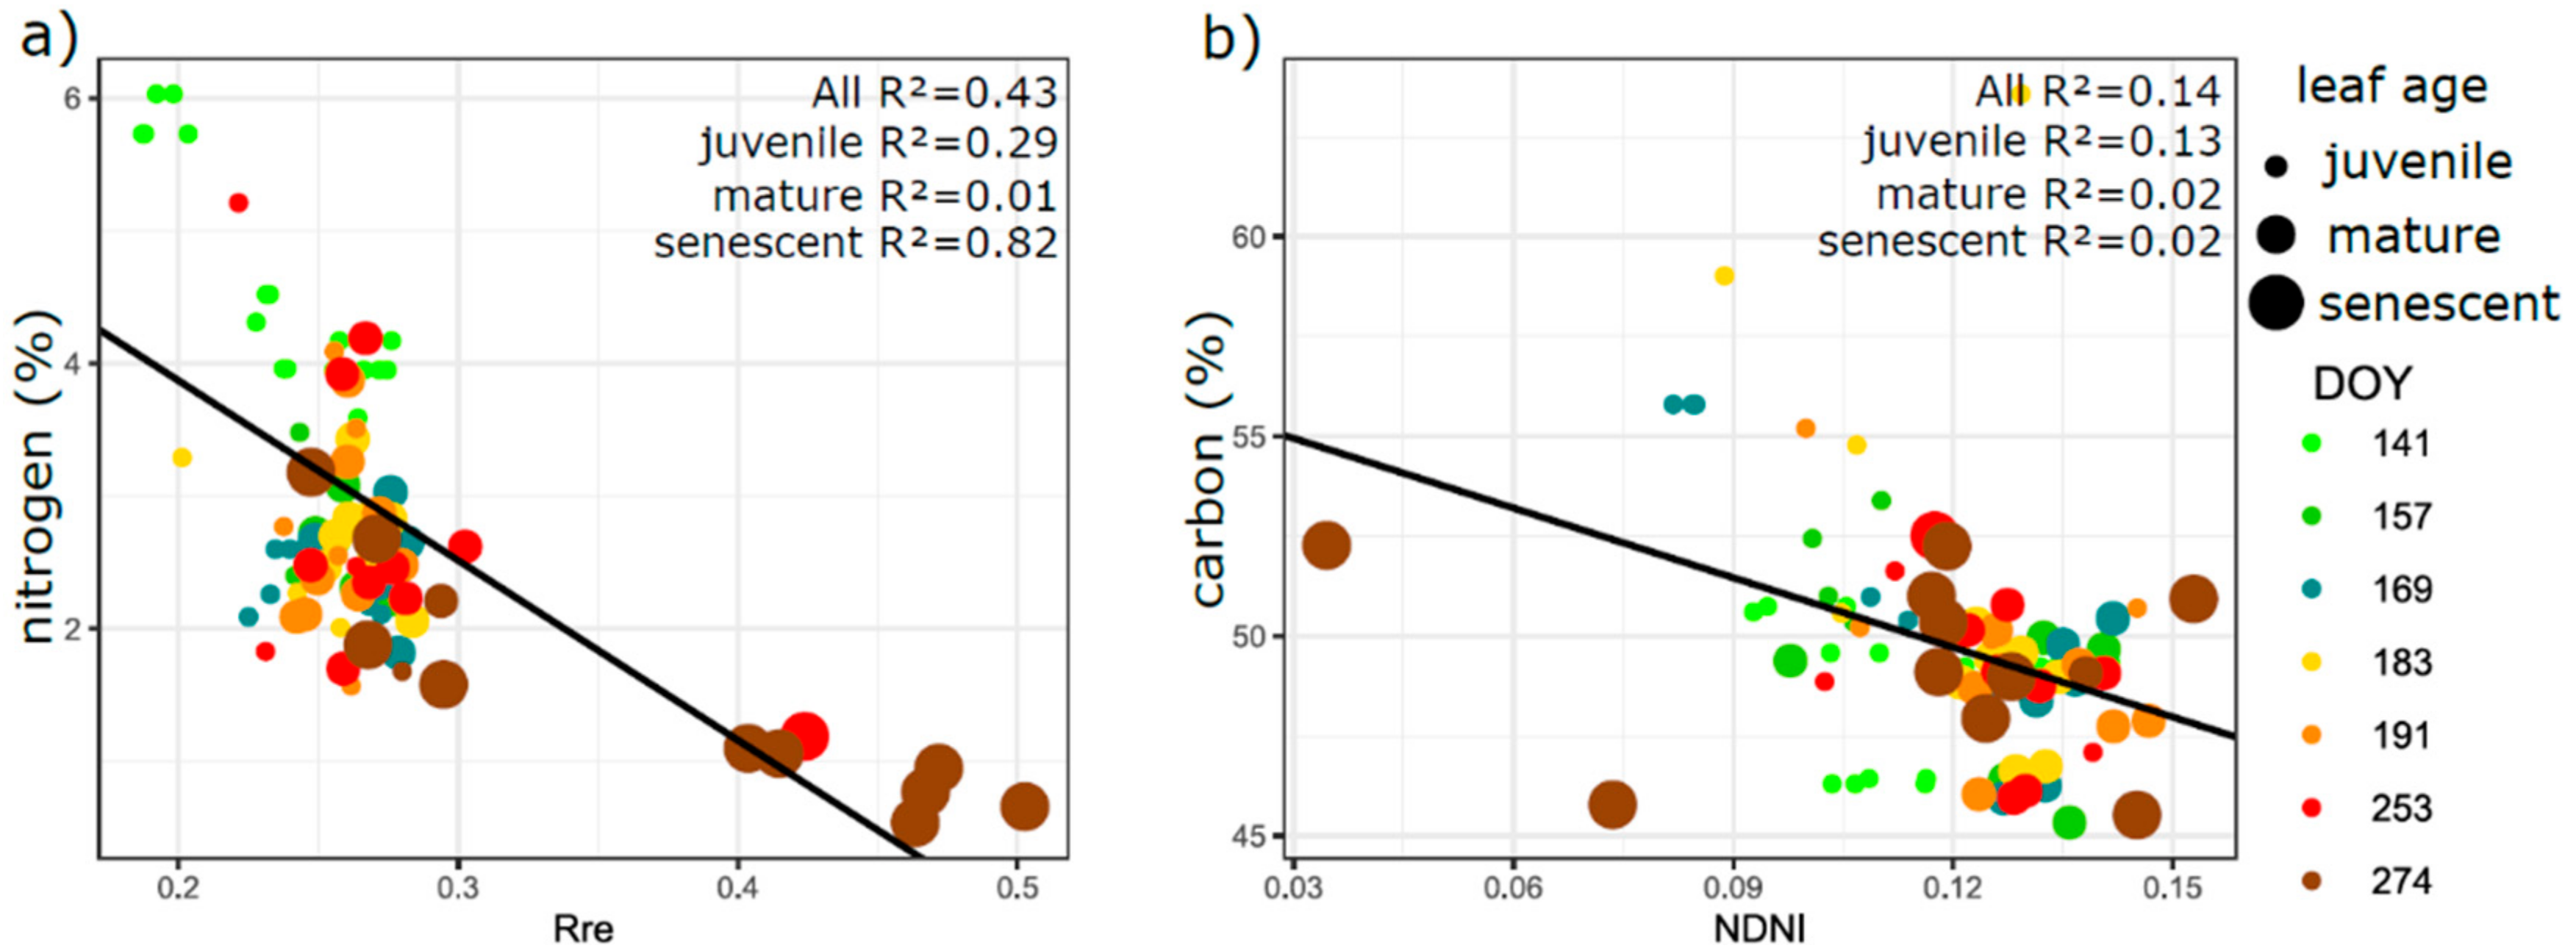
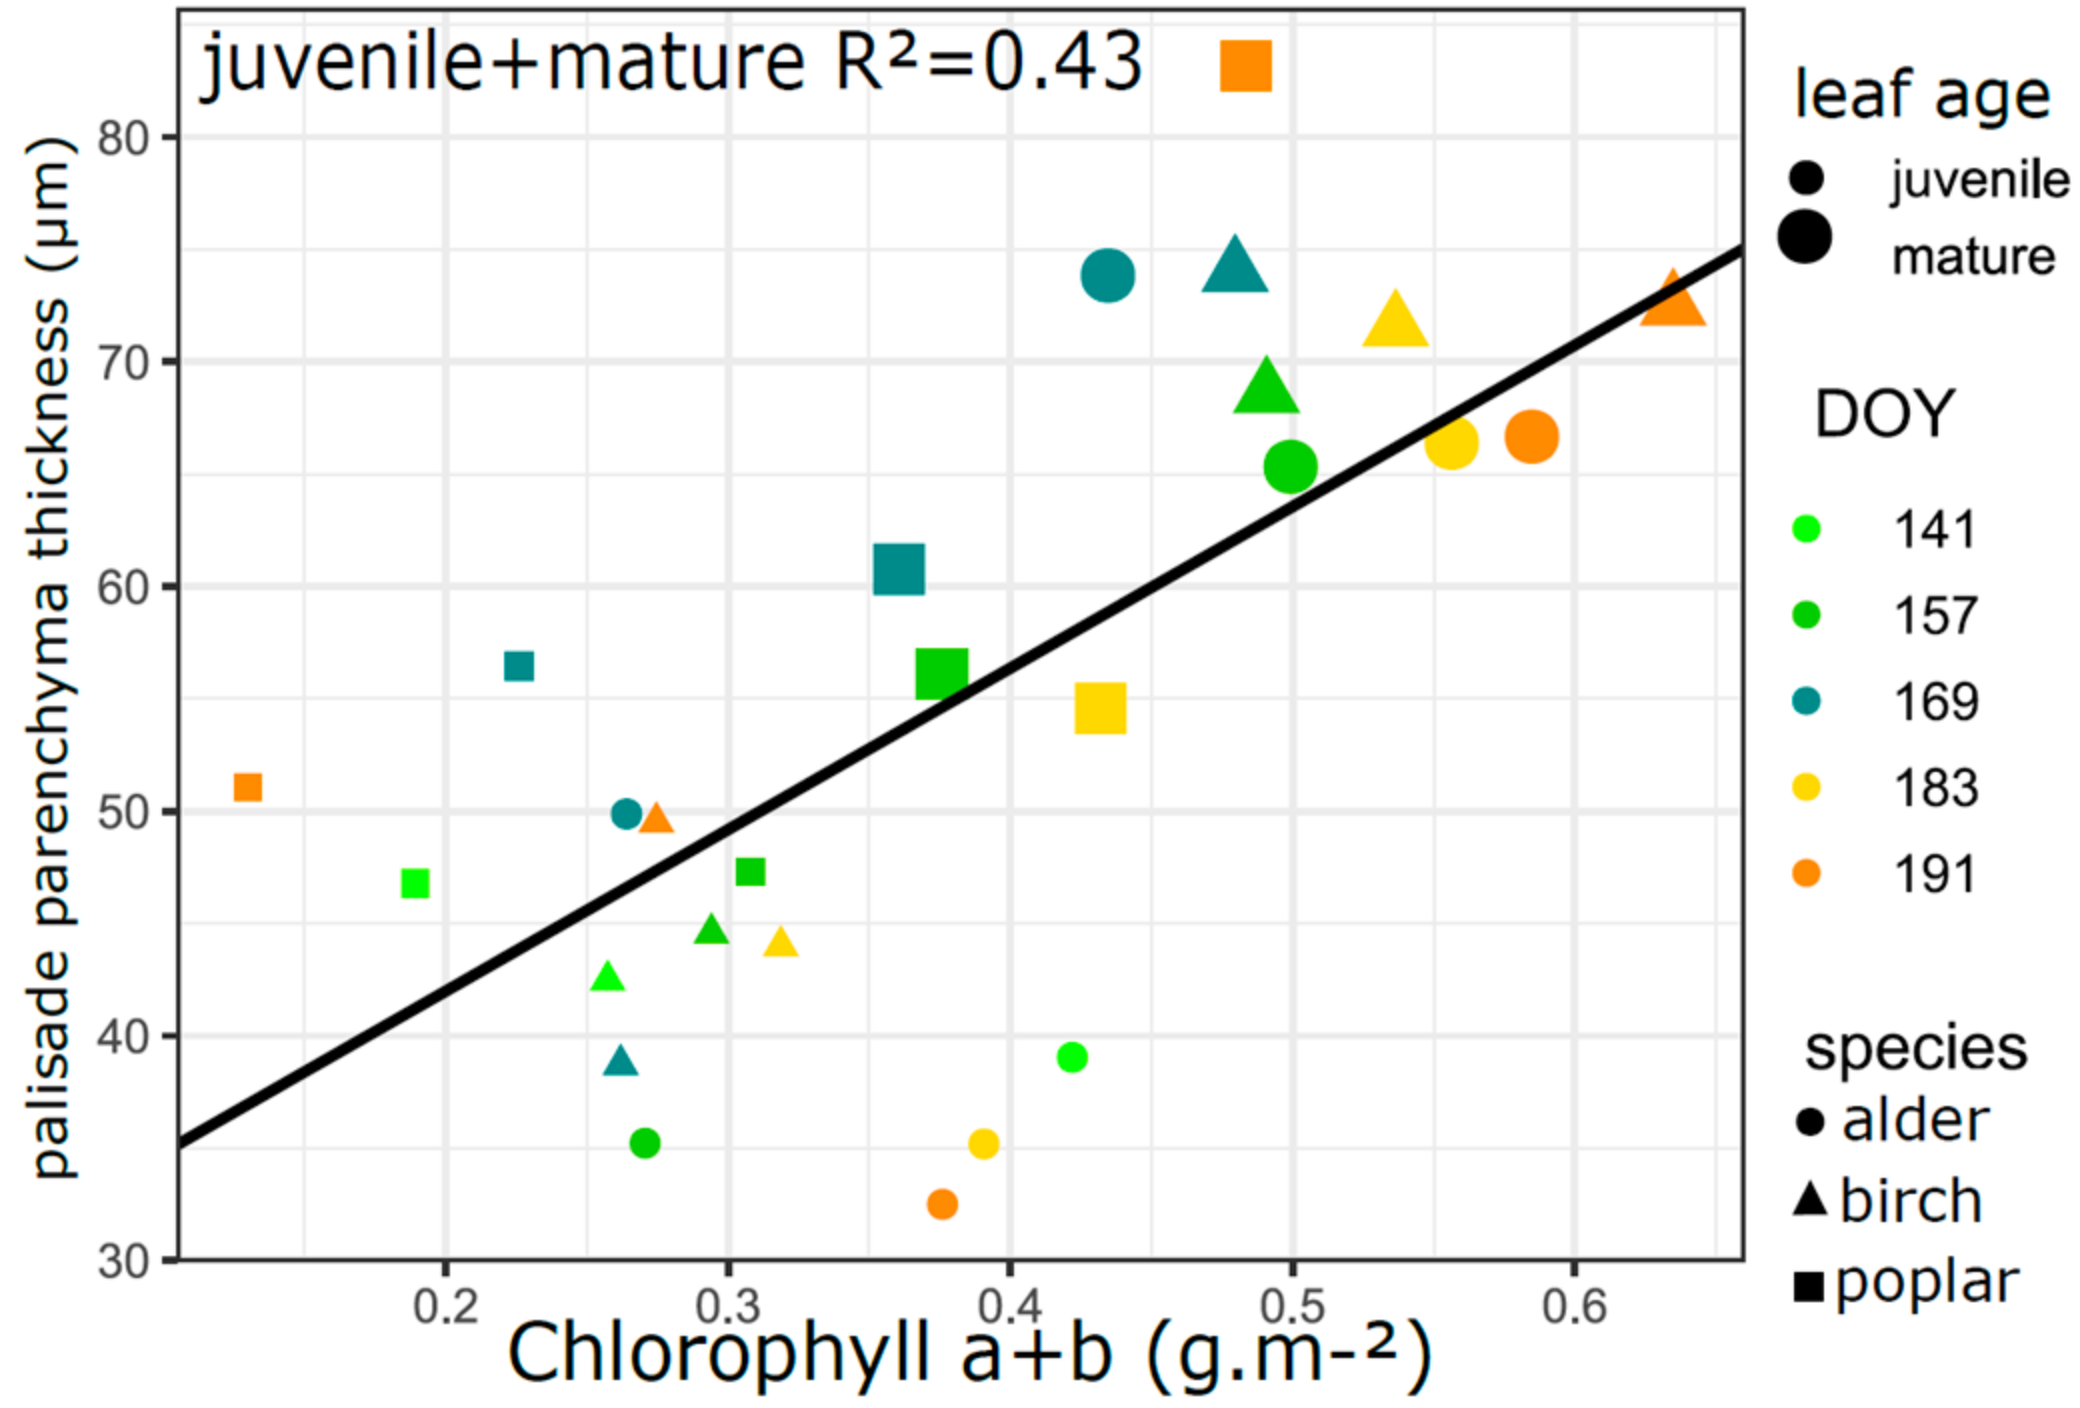
3.5. Relation of VIs with Biophysical and Anatomical Traits

We tested the correlations of leaf biophysical and anatomical traits with 64 selected vegetation indices calculated from the leaf adaxial reflectance (for all coefficients of determination see Table S1). For each vegetation index, values of R2 were summed to so-called “Summarized R2” for better visualization purposes. According to the strength of relationship defined by the coefficient of determination (R2) we detected two groups of leaf traits: (1) Leaf pigment-related traits (Chl, Chl a/b, Car and Car/Chl) and anatomical traits involving palisade parenchyma thickness—PP and PP/SP—related with the same vegetation indices mainly based on reflectance in wavelengths from 419.8 nm up to 925 nm (Figure 9a); and (2) leaf structural traits (dry and fresh LMA, water content leaf area, and nitrogen and carbon content) related with vegetation indices involving reflectance in wavelengths from 800 nm to 1724.7 nm (Figure 9b).
Figure 10, Figure 11, Figure 12 and Figure 13 show the relations of selected leaf biophysical and anatomical traits with the best-performing vegetation index for all leaf developmental categories together, and for juvenile, mature, and senescent leaves separately. The strongest relation for pooled leaf developmental categories was observed between VI Vogelmann and the contents of biochemically assessed chlorophyll a (R2 = 0.88), total chlorophyll content (R2 = 0.87), and chlorophyll b (R2 = 0.78), see in Table S1. Samples for juvenile and mature leaves formed two partially overlapping clusters along the regression line (Figure 10a,b). Relation of total chlorophyll content to VI Vogelmann differed among the leaf developmental categories, according to R2 values: 64%, 62%, and 99% of variability in chlorophyll content was explained in juvenile, mature, and senescent leaves, respectively (Figure 10a). For carotenoids, the highest correlation was observed with VI mND705 (R2 = 0.6) for all leaf developmental categories; the relation explained 20%, 32%, and 77% of carotenoid content variability in juvenile, mature, and senescent leaves, respectively (Figure 10b). Surprisingly, for both pigments the indices showed the highest R2 for senescent leaves (Chl R2 = 0.99; Car R2 = 0.77). The Car/Chl related the best to PSRI (R2 = 0.85) if all leaves were pooled. However, for juvenile and mature leaves the explained proportion of variability was almost zero. For senescent leaves, the relation explained 69% of variability in Car/Chl (Figure 10c).
Leaf thickness showed the strongest relation to MCARI2 index (R2 = 0.49) if juvenile and mature leaves were pooled (Figure 11a). For juvenile leaves alone, the relation between leaf thickness and MCARI2 was absent (R2 = 0.01); for mature leaves, the correlation was weak (R2 = 0.26). Among the anatomical leaf traits, PP correlated strongest with VI Datt2 (R2 = 0.6) for juvenile and mature leaves pooled together. In contrast, there was no relation between PP and Datt2 if the juvenile and mature leaves were treated separately (Figure 11b).
Regarding the traits derived from structural parameters and water content, LMA, fLMA, DW/FW, and WCLA, relationships were looser than in pigment-related traits (Table S1). The DW/FW ratio did not correlate meaningfully with any of our tested indices: the maximum coefficient of determination for LMA was with vegetation index DLAI (R2 = 0.58) for all leaf developmental stages together. The relation to DLAI index explained 67%, 60%, and 32% variability in LMA for juvenile, mature, and senescent leaves, respectively (Figure 12a). If all leaf developmental categories were pooled together, the fLMA correlated with NDII index quite well (R2 = 0.64); however, for separated juvenile, mature, and senescent leaves the relation explained 56%, 79%, and 72% of variability, respectively (Figure 12b). The WCLA showed the best relation to MSI index (R2 = 0.55) for all samples together; the variability explained by this relationship was different for juvenile, mature, and senescent leaves: 39%, 56%, and 79%, respectively (Figure 12c). The N content correlated loosely with VI Rre (R2 = 0.43) for all leaf categories pooled together. If leaf developmental stages were separated, the relation was looser for juvenile leaves (R2 = 0.29); absent for mature (R2 = 0.01); and the strongest for senescent ones (R2 = 0.82; (Figure 13a)). The C content did not meaningfully correlate to any index with exception of VI NDNI (R2 = 0.14), where the correlation was significant but R2 very low for all leaf developmental categories together and separated (Figure 13b).
In all the scatterplots (Figure 10, Figure 11, Figure 12 and Figure 13), we used different colors for individual sampling dates (DOYs) as well as different symbol size for leaf developmental categories (juvenile, mature, and senescent leaves), to be able to distinguish the patterns along the regression lines. For biophysical leaf traits, Chl, Car, fLMA, WCLA, and N content, there were three clusters representing the leaf developmental categories more distinctly. Similarly, for anatomical traits, leaf thickness and PP, two clusters were present along regression line corresponding to the juvenile and mature leaves. The Car/Chl ratio relation to vegetation index PSRI was mainly driven by senescent leaves showing high variability in values in contrast to a cluster of juvenile and mature leaves with low Car/Chl ratio variability (Figure 10c). The LMA showed the most homogeneous distribution of points along the regression line (Figure 12a). The nitrogen content (Figure 13a) exhibited similar pattern to the Car/Chl ratio variability.
Figure 14 shows the linear relationship between chlorophyll content and palisade parenchyma thickness for juvenile and mature leaves together (R2 = 0.43).

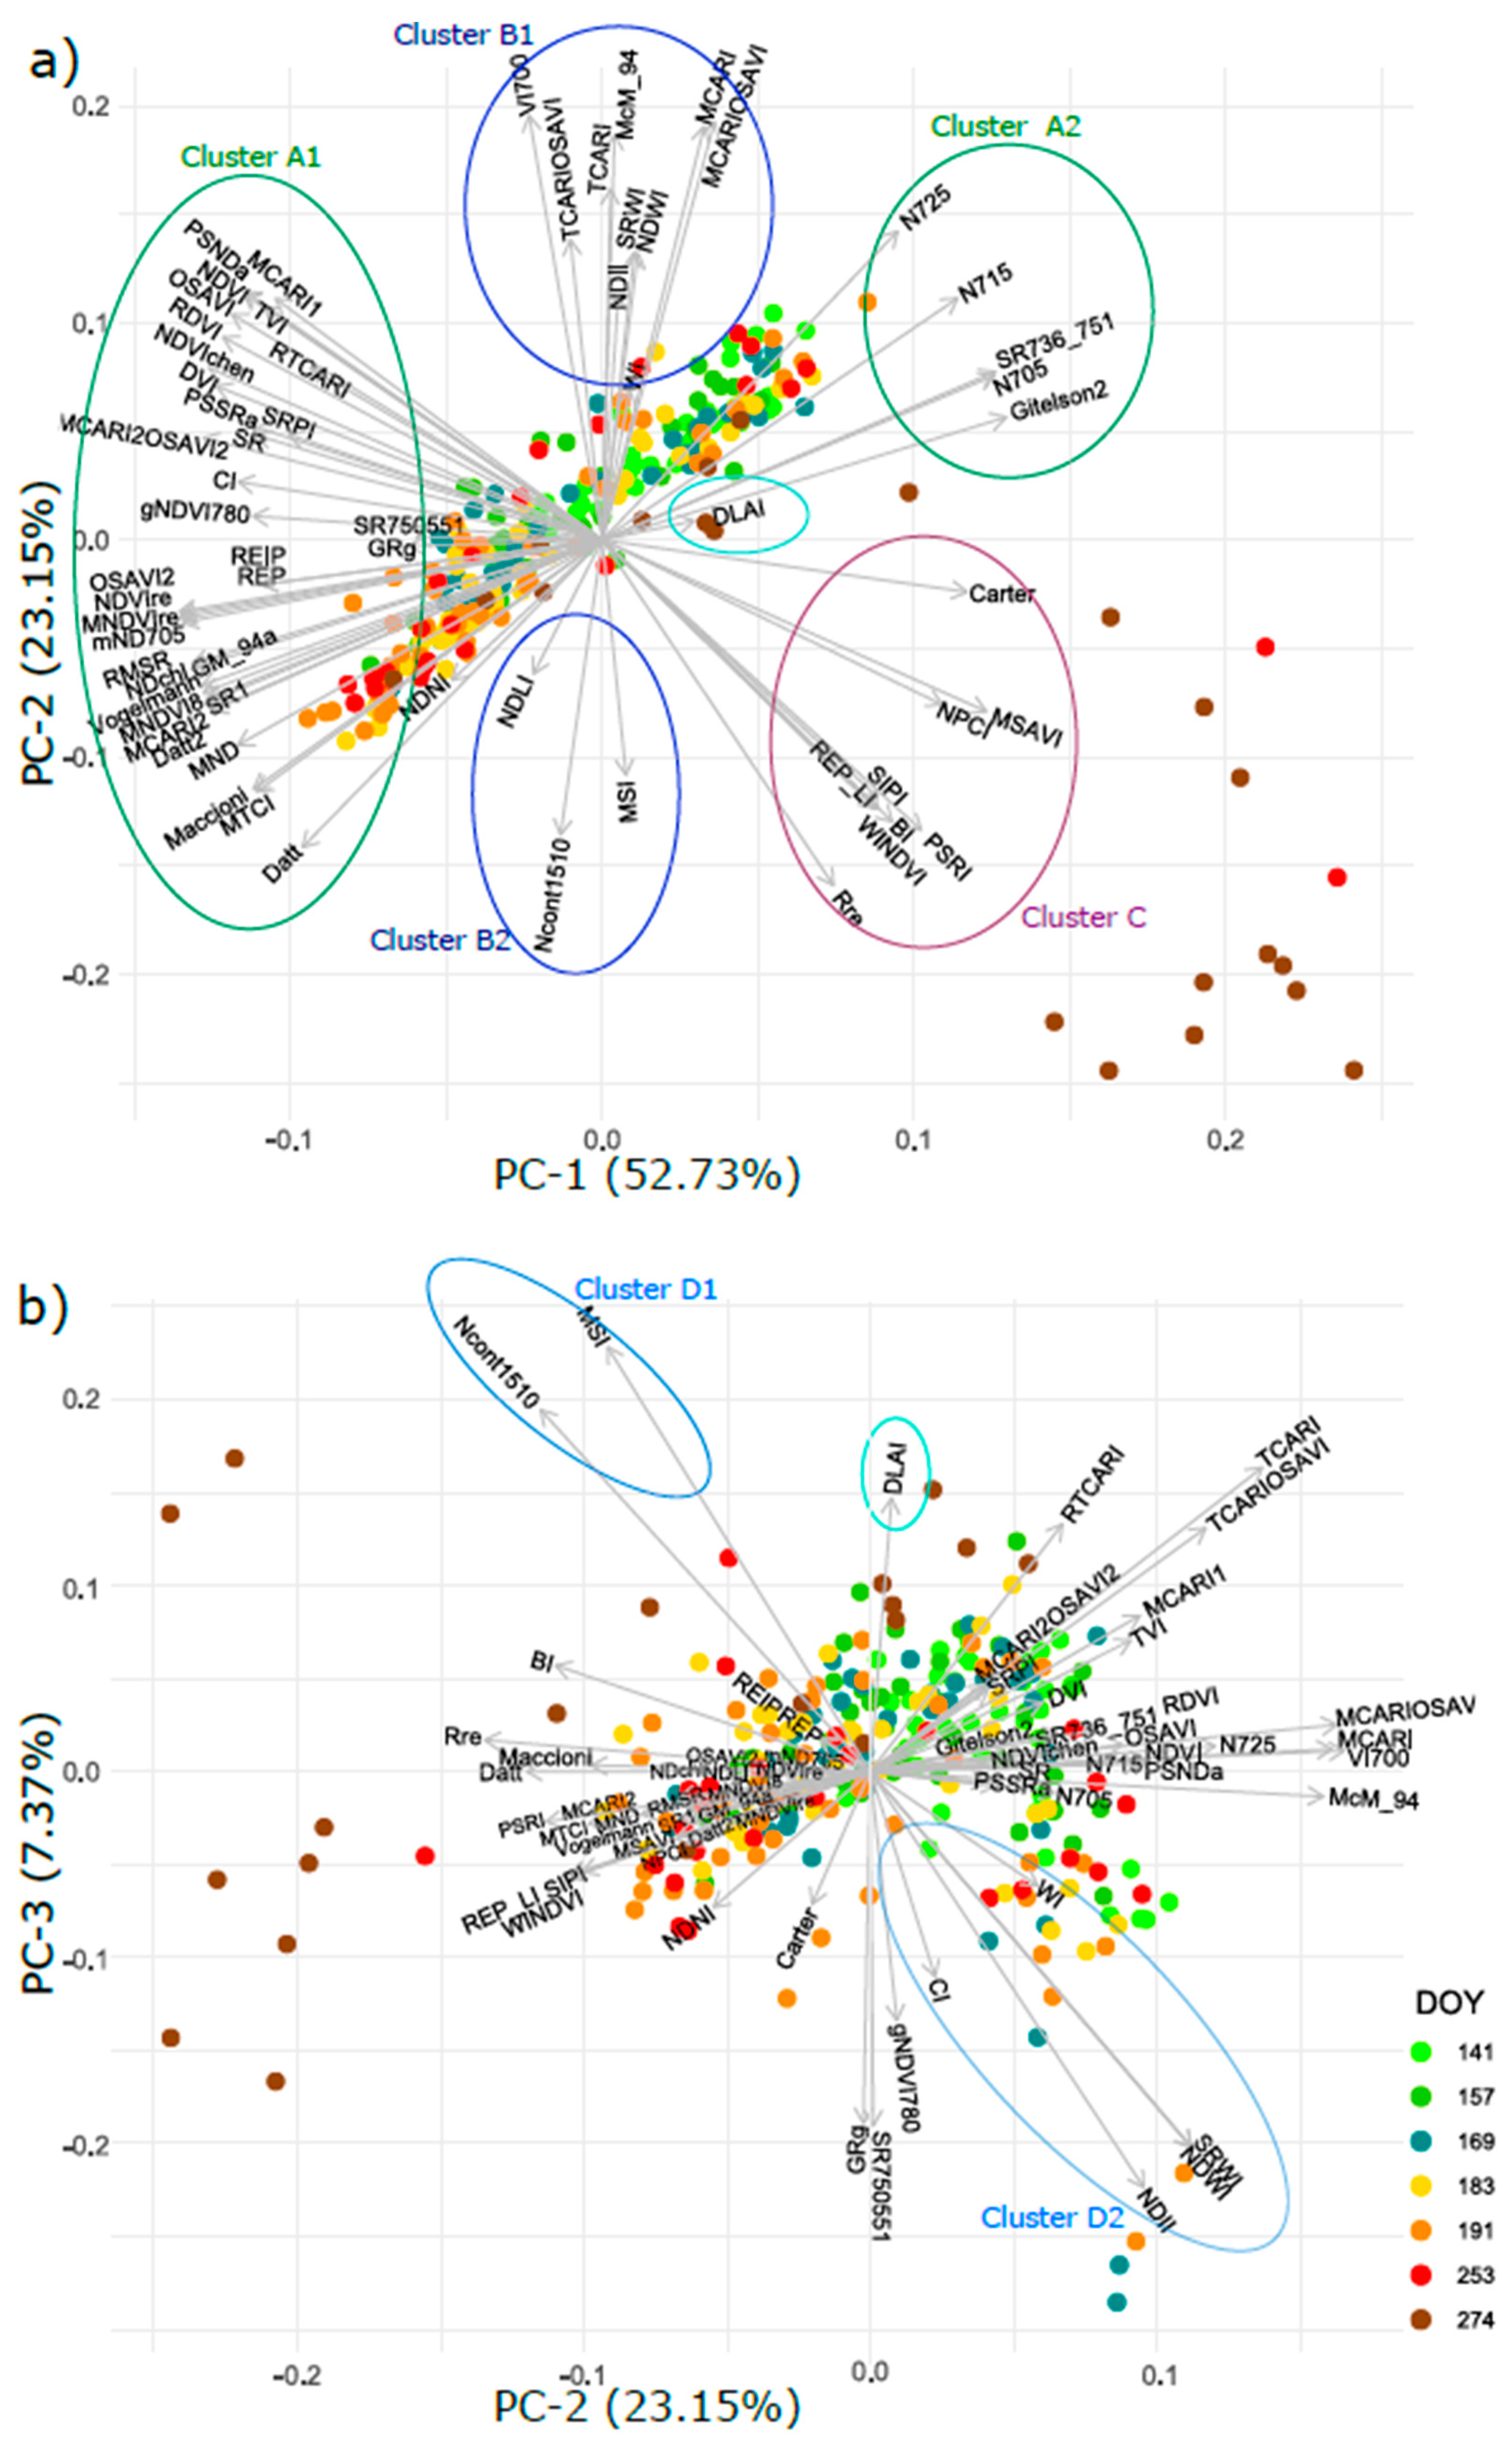
3.6. Intercorrelation of Vegetation Indices and Their Clustering

The relations among the selected VIs were tested by principal component analysis. Although many different VIs have been developed, these are often strongly correlated with each other and actually tend not to give much independent information due to their formulas and similar wavelengths used. PCA was conducted to characterize the major groups of VIs and to evaluate how much independent information for the pooled data across all phenological stages (juvenile, mature, and senescent leaves pooled) are provided by VIs included to our study. The first principal component explained 53% of total variability. The first two components together described 76% and three components 83% of total variability captured by all 64 VIs in our study.
The first axis of PCA was related to all the various indices usually computed from red and red-edge wavelengths and most of them were primarily designed as chlorophyll indices. Those indices formed a big cluster toward the negative values of PC1 axis Cluster A1 in (Figure 15a). The best performing indices for chlorophyll and carotenoid prediction (Vogelmann and mND705, respectively, (Figure 10a,b)) belong to this cluster. The smaller Cluster A2 in (Figure 15a) formed toward the positive values of PC1 and contained indices related to leaf damage (N705, N715, N725) and leaf level chlorophyll (Gitelson2 and SR736/751). The majority of indices with high Summarized R2 for pigments and mesophyll based anatomical traits (Figure 9a) belonged to the Clusters A1 and A2. The distribution of VIs among three principal components correspond well with the summarized R2 of VIS and leaf traits. On the one hand, the pigment-related indices included into the PC1 and PC2 exhibited high SumR2 with pigment contents and anatomical parameters (PP, SP, and PP/SP). On the other hand, VIs contributing to PC3 were related to water and dry mass contents and showed high SumR2 with those structural traits derived from water and dry mass contents.
The second axis (PC2) was related to VIs that used reflectance around 670 nm, close to the chlorophyll absorption maximum, wavelengths close to 700 nm, and partly NIR (800, 900, 1200, and 1600 nm). Indices separated by PC2 formed two clusters located opposite each other along the PC2 axis: Clusters B1 and B2, (Figure 15a), almost independent of PC1. VIs from Clusters B1 and B2 were mostly designed for canopy-level parameters, such as LAI, canopy chlorophyll, canopy nitrogen, lignin, and water content Table S1. Some indices from Clusters B (DLAI, SRWI, NDWI, NDII, MSI, Ncont1510) also showed high summarized R2 for structural and water-related traits (Figure 9b). The last one, a rather loose Cluster C, was distinguished equally by PC1 and PC2 (Figure 15a) and contained various indices designed primarily for detection of Car/Chl ratio, leaf level stress, and water content. The PSRI index from this Cluster C related best with Car/Chl ratio (Figure 10c).
Although PC3 explained only 7.37% of total variability in VIs values, together with PC2 it distinguished several VIs marked as Clusters D1 and D2 (Figure 15b). Most indices from Cluster D were associated with NIR and SWIR wavelengths and sensitive to water and lignin content, similarly, as described for Clusters B1 and 2. The best predictors of fresh mass and water related traits fLMA and WCLA (NDII and MSI, respectively) belonged to the Cluster D. The DLAI index (marked by cyan ellipse in (Figure 15a,b)) did not strongly correlate with any of the described clusters and contributed mainly to PC3. The DLAI was the best predictor of LMA. VIs in Clusters marked with identical letter are determined based on the same traits and correlate with each other.

4. Discussion

4.1. Seasonal Course and Variability in Biophysical and Anatomical Traits Related to Leaf Developmental Category

We are aware that to some extent, differences are present in leaf biophysical, anatomical, and optical traits among temperate trees [24,34,64]. Those differences are usually connected to shade tolerance [64], however the species in the present study are all shade-intolerant, early succession species. Therefore, we paid increased attention to the effect of leaf developmental stages and phenology, and in accordance with other spectroscopic studies [24,31,37], all analyses were conducted for biophysical and anatomical properties of three studied species pooled together. We observed leaf developmental asynchrony in all studied species, which was described earlier [10,13,65]. In all species, juvenile leaves were present on sylleptic branches during the whole season until the 1 October. Those neoformed leaves kept their juvenile character in most studied leaf traits (palisade and spongy parenchyma thickness and their ratio, chlorophyll content and pigment ratios), significantly differing from mature leaves in the canopy (Figure 4a–i). Liu et al. [66] confirmed the differences among young and mature leaves in various leaf structural traits (LMA, leaf thickness, dry mass) in three Chinese temperate deciduous species and highlighted the effect of leaf phenology on leaf traits. However, the effect of sylleptic and proleptic leaf growth was not considered in their study. Our results confirm previously described differences in Chl and Car between juvenile (neoformed) and mature (pre-formed) leaves (Figure 4d–f) throughout the whole season [67]. The exceptions were the first and the last samplings, where we observed that leaves were all juvenile or mature, respectively, regardless their developmental origin by either proleptic or sylleptic growth giving origin to neoformed leaves during the whole season. Our findings of thicker mature (pre-formed) leaves with thicker palisade and spongy parenchyma in comparison to neoformed ones was confirmed in Populus tremula [23].
Although we did not quantify the proportion of leaf developmental categories within the crowns of studied trees, we analyzed the seasonal courses of leaf traits for all developmental leaf categories pooled together (Figure 5). The trend in palisade parenchyma thickness and PP/SP increased early in the season or later (between 21 May and 6 June157; between 21 May and 2 July, respectively) which is in accordance with [24,68] (Figure 5a,c). Seasonal changes in chlorophylls and carotenoids followed typical courses for temperate broadleaves [24,29,30,31]: pigment accumulation until the peak season (from the 2 July to the 10 September) and later decrease during the leaf senescence (the 1 October). Increasing variance in chlorophyll content (Figure 5d) toward the end of the season was probably a result of different nitrogen intake and metabolism management by studied species. A. incana is a nitrogen-fixing species, thus, nitrogen is not much reabsorbed from senescent leaves in comparison to non-fixing species [69]. This corresponds with relatively high nitrogen and chlorophyll contents in alder senescent leaves in comparison to birch and poplar leaves (data not shown).
Pigment ratios and their seasonal dynamics give information about changing photosynthetic capacity and light acclimation. Although pooled leaves did not exhibit a significant seasonal pattern in Chl a/b ratio (Figure 5e), this trait was consistently higher for mature than juvenile leaves until the 10 July. Similarly, Car/Chl ratio was rather stable, with exception of significant increase in absolute value and variability in fall (the 1 October; Figure 5f). Carotenoids have dual role participating in (1) light harvesting by absorbing green-blue light and transferring energy to chlorophylls, and (2) dissipation of excess energy [70,71,72,73]. Higher Car/Chl ratio of high light exposed juvenile leaves in the peripheral crown (Figure 4f) can be also interpreted as protection against excess irradiance.
The phenological course of LMA for pooled juvenile and mature leaves (Figure 5g) was typical for mixed temperate stand [31]. Juvenile leaves showed a more pronounced seasonal pattern than mature leaves (Figure 3h). Similar LMA of juvenile and mature leaves (Figure 4g) may have resulted partly from overestimating LMA in juvenile leaves due to their folding. The most likely explanation for the increased LMA would be an accumulation of photosynthetic products in juvenile leaves [74]. Variability in LMA of temperate broadleaves at regional scales is largely attributed to leaf anatomical traits, mainly palisade parenchyma thickness [64]. Our observations confirm this relationship, as the trend in palisade parenchyma thickness of pooled leaves (Figure 5a) follows a similar seasonal course as LMA (Figure 5g).
A dilution effect (decrease of mass-based nitrogen content—(N%)) due to the accumulation of carbon-based metabolites could explain the drop from spring to summer in juvenile leaves (Figure S4a), similarly to [31]. Similar N% pattern of both juvenile and mature leaves (Figure S4c), suggests comparable photosynthetic capacity of both developmental categories of leaves.
Due to the time demanding and technically challenging field collections (e.g., sampling of sun-exposed leaves of high mature trees) for biophysical, anatomical, and optical traits at the leaf level, it is reasonable to pool samples of studied trees together in remote sensing studies dealing with coarser spatial resolution. In studies focused on mixed broadleaved forests, the species are usually pooled together as e.g., Demarez [37] dealt with hornbeam, oak, and beech with comparable LMA and leaf thickness. At the canopy level, both leaf developmental categories—mature pre-formed and juvenile neoformed leaves—contribute to the top-of-canopy reflectance. It has been reported that neoformed leaves on sylleptic branches may contribute with over 50% to total LAI in various poplar genotypes [14] and thus, should be taken into account from remote sensing point of view.

4.2. Seasonal Course of Leaf Optical Properties Related to Leaf Developmental Category

The juvenile leaves growing on branch tips were generally brighter in the VIS and darker in NIR and SWIR spectral regions compared to the mature leaves within one canopy (Figure 6a–c). The generally higher reflectance of these high-light exposed leaves in VIS [51,75,76] could be explained by lower chlorophyll content of juvenile leaves (Figure 4d). Therefore, the lower chlorophyll content and higher reflectance of upper-most juvenile leaves represent the strategy to avoid damage from excess irradiance [77,78]. Previous studies confirmed dominant leaf scattering from leaf internal structure in NIR [40,41,42], which explains why significantly thicker mature leaves have higher NIR reflectance than the thinner juvenile ones (Figure 6).
From a remote sensing perspective, different species and canopy positions of leaves contribute simultaneously to the spectral signal, which justifies pooling all leaves together for a generalization of patterns of leaf optical properties. For all species and leaf phenological phases pooled, leaf optical properties had some seasonal variation (Figure 8) in accordance with previous studies [24,31,34,79]. Due to stronger chlorophyll absorbance in the red spectral region, the reflectance signal can saturate in this region and therefore reflectance in the green and red-edge parts of spectrum are often preferred for chlorophyll estimation [45,51]. The seasonal course of reflectance in green (Figure S7a) and red-edge (Figure S7c) spectral regions followed better the seasonal course of Chl content (Figure 5d) than the reflectance in the red region (Figure 6b) for pooled leaves across species and phenological phases in our study as well.

4.3. Performance of Vegetation Indices in Leaf Traits Prediction—Implications for Interpretation of Canopy Level Remote Sensing Signal

4.3.1. Effect of Phenology and Leaf Developmental Category

We have presented examples of linear relationships of best performing indices to key leaf biophysical and anatomical traits (Figure 9, Figure 10 and Figure 11). We focused on the effect of leaf developmental category and leaf phenology on VI linear model performance. The effect of leaf age on modelling of biophysical traits from spectra is currently a topical theme for evergreen conifers bearing several needle age classes at once [20,36,80]; and also tropical tree species with leaf developmental asynchrony [81,82]. Moreover, in some tropical trees with asynchronous leaf development and long leaf lifespan (e.g., 360 days), even the leaf age could be modelled from leaf spectra [83].
In the case of chlorophyll and carotenoid content prediction, the best predictors were the vegetation indices Vogelmann and mND705, respectively, with best relation of senescent leaves. The regressions for senescent leaves were driven by Alnus incana samples, maintaining high pigment contents until the end of the season. Most of the temperate deciduous species reutilize the biochemical compounds and nutrients during the leaf senescence before abscission [27] and, thus, pigment and nitrogen content decreases in senescing leaves. Nitrogen reutilization and chlorophyll decay in the fall are suppressed in Alnus species due to their ability of nitrogen fixing. If chlorophyll and carotenoid contents were modelled for juvenile and mature leaves separately, R2 remarkably decreased. If all developmental categories were pooled together, the indices for Chl and Car estimation performed very well (Chl R2 = 0.87; Car R2 = 0.60) approaching to partial least squares regression (PLSR) modelling (Chl R2 = 073.; Car R2 = 0.71) in [31] or chlorophyll modelling from vegetation indices (Chl R2 = 0.80) in [84]. A similar finding applies to the Car/Chl ratio related to PSRI index, where the relationships were absent for juvenile and mature leaves separately, and the best performing model was for all developmental categories pooled (R2 = 0.85). From the remote sensing perspective, the regression for all leaf developmental categories pooled together is more realistic, because it covers the full range of pigment contents and, thus, provides a more robust model. Similar findings were reported for PLSR modelling of chlorophyll and carotenoids contents in Norway spruce using several needle age classes [20].
Assessing the leaf anatomical traits derived from microscopy images is more time- and labor-demanding than assessing the routinely measured biophysical traits, which could be the reason why not many spectroscopic studies focus on anatomical trait prediction. However, Ref. [85] recently showed that anatomical traits such as spongy parenchyma to leaf thickness ratio and palisade to spongy parenchyma thickness ratio correlate to forest water use efficiency and gross primary production at regional scales. Therefore, we are convinced that modelling anatomical traits from spectral signal may contribute to understanding ecosystem functioning. We evaluated linear relationships of leaf anatomical traits to 64 vegetation indices and we achieved good relation for leaf and palisade parenchyma thickness (Figure 9). Both anatomical traits are influenced by developmental status and the relationships were absent for juvenile and mature leaves treated separately. Same pattern was observed in linear relationship between chlorophyll content and palisade parenchyma thickness (Figure 14). Despite being weaker, this relation demonstrates that the correlation of anatomical traits with vegetation indices presented here, is mediated primarily by photosynthetic pigment content and then by cellular structure affecting reflectance in longer wavelengths. Nevertheless, both leaf developmental categories occur within the crown for the long period of vegetative season (between 6 of June and 10 September; being assessed for anatomical traits only until the 10 July) and thus should be considered if taking a ground truth for remote sensing studies. Both indices Datt and MCARI2 are primarily designed as chlorophyll indices, however, they both calculate with NIR wavelengths (849 nm and 749 nm, respectively) and, thus, may relate well to leaf cellular structure. Palisade parenchyma is usually very dense tissue with only a small proportion of intercellular spaces and a high density of chloroplasts compared to spongy parenchyma, thus, a strong correlation with chlorophyll content can be expected. Total mesophyll thickness and leaf blade thickness followed a similar pattern.
Structural traits LMA, fLMA, and WCLA were best related to DLAI, NDII, and MSI indices, respectively (Figure 12). Correlation of LMA and DLAI (VI developed for LAI estimation) due to significant covariance of both structural traits (LMA and LAI), manifested mutual correlation of both structural traits during the season [86]. All traits were modelled with moderate accuracy if all leaf developmental categories were pooled (LMA R2 = 0.58; fLMA R2 = 0.64; and WCLA R2 = 0.55). Separate models for juvenile, mature, and senescent leaves showed some variability in R2 see (Figure 12), but not as remarkable as for carotenoids, Car/Chl ratios, and anatomical traits. Because estimated traits were coupled with water content (WCLA, fLMA), mature and senescent leaves contributed considerably more to the model than juvenile leaves. Yang et al. [31] retrieved LMA by PLSR with better results if data from the whole season were used (R2 = 0.85), compared to only a spring (R2 = 0.13) or summer sampling data (R2 = 0.71). This confirms our results that the estimation of LMA is better from wider seasonal period than from only one sampling term. Parameters based on dry matter content (LMA) are useful inputs for various simulations at a landscape scale and for radiative transfer models [86].
Due to the strong covariance of nitrogen content with other leaf compounds, such as chlorophyll and proteins, it is not reasonable to estimate the nitrogen content using VIs since many spectral bands can be used for N estimation as summarized in Homolová et al. [87]. Even radiative transfer models at the leaf level are not the best way to predict nitrogen content—it is incorporated only in RTM LIBERTY [88], which is not as widely used as RTM PROSPECT [89]. For that reason, nitrogen content is usually well estimated by PLSR from hyperspectral data with results R2 = 0.81–0.96 [90].

4.3.2. Effect of Vegetation Indices Intercorrelation

A vast number of different vegetation indices have been developed to estimate plant traits, such as pigment content, from reflectance data [84]. Similar to a previous study [51], we confirmed that vegetation indices using the red-edge spectral region, perform the best in estimating total chlorophyll content. Indices using this spectral region have an even stronger correlation with chlorophyll a than with total chlorophylls a + b Table S1. Total carotenoid content also varies together with chlorophyll content and therefore the same indices that perform well for estimating chlorophyll content are also good predictors for carotenoids. These pigment-sensitive indices formed the first axis of PCA, and leaf thickness was also related to the same group of Vis, see (Figure 9a and Figure 11a).
The Vis sensitive to leaf water, as well as fresh and dry mass contents formed another independent group associated with the PC3 Clusters D1 and 2, (Figure 15b), which also proved linear models (Figure 9b). Due to the strong covariation of different leaf traits, it is quite common that Vis originally developed for predicting one trait turn out to be good estimators for another related foliar trait, (e.g., estimation of nitrogen content [87]). For example, NDNI, which was developed for estimating foliar nitrogen, was primarily related better to leaf and palisade thickness in our data Table S1. Nitrogen content itself was then estimated better by red-edge indices developed originally for chlorophyll predictions. However, nitrogen content is known to be strongly correlated with chlorophyll content, thus, used in remote sensing studies, e.g., using hyperspectral data [91]. Canopy level indices developed to remove soil signal and extract vegetation may also perform well at the leaf level, such as DLAI to estimate LMA from leaf level reflectance measurements in our data. The Car/Chl ratio of senescent foliage produces a clear unique signal Cluster C, (Figure 15a), which is the best captured by indices designed to detect senescence [92]. A similar approach of evaluating redundancy and independence of various fluorescence parameters—indices extracted from chlorophyll a fluorescence fast kinetics (i.e., OJIP transient, or JIP-test) was used by [93].
The 64 vegetation indices used in the present study covered a broad spectral range from the visible spectrum to SWIR (1800 nm). Therefore, it is not surprising that PCA applied on values of 64 VIS gives similar score distribution as the PCA applied on the whole spectral range (Figure 8 and Figure 15a,b). With the current wide availability of hyperspectral data at leaf and canopy levels, the multivariate approaches to leaf trait modelling, such as PLSR, exploiting the whole spectral range, are preferentially used [20,46,81]. Although our source data were hyperspectral, we built the present study on vegetation indices, which are still widely used due to rise of various affordable multispectral sensors [80,94,95,96] or satellite multispectral data [97]. On a large scale, starting in 2015 thanks to a NASA initiative, the Harmonized Landsat and Sentinel-2 (HLS) surface reflectance data set represents a novel type of multispectral satellite data [98,99] and vegetation indices derived from HLS have potential to monitor land surface phenology [100].

5. Conclusions

We presented differences in leaf biophysical, anatomical, and optical traits and their seasonal dynamics among leaves of different developmental category: pre-formed mature and neoformed juvenile leaves in three common hemiboreal tree species. In general, juvenile leaves exhibited higher reflectance than mature leaves in the VIS. The difference was even more pronounced in the red-edge spectral region (705 nm) within the season, during which chlorophyll content correlated well with the palisade parenchyma thickness.
Both leaf developmental categories—juvenile and mature—contribute to the top-of-canopy reflectance and should be considered when taking ground truth (i.e., leaf biophysical and anatomical traits). The linear models of leaf traits from vegetation indices usually performed better if all leaf developmental categories (juvenile, mature, and senescent) were included. From a remote sensing perspective, the prediction models constructed using all leaf developmental categories composing the monitored tree canopy pooled together are more realistic, because they cover the full range of leaf trait values and, thus, provide a more robust model. Structural and anatomical traits relate to plant physiological processes at leaf and canopy levels and serve as inputs to radiative transfer models. This justifies why modelling of anatomical traits from leaf and canopy spectra should not be neglected.
Our study provides information on which indices are good predictors of particular leaf traits and how these indices are interchangeable or independent when dealing with temperate or hemiboreal deciduous trees. VIs are still a valuable approach regarding current increase of affordable multispectral cameras combined with unmanned aerial systems with very high spatial resolution, or HLS product, and can be used for precision agriculture, forestry, or vegetation monitoring.
The take home message of this study is that even in temperate deciduous forests, the type of growth and leaf formation of target species should be regarded when taking ground truth for calibrating and validating models for biophysical and anatomical leaf trait retrieval from optical signal. When dealing with species with continuous- or semi-continuous of leaf formation (such as Salix spp. or young Alnus spp., Betula spp., and Populus spp. [65], it is necessary to sample both leaf developmental categories, pre-formed and neoformed leaves, especially if the sampling is conducted only once within the vegetation season. The same approach, to construct the models represented by different leaf age groups, was recommended by [81] for ecosystems with unsynchronized phenology (e.g., evergreen tropical forests) and by [20,36] for evergreen conifers.

Supplementary Materials

The following are available online at https://0-www-mdpi-com.brum.beds.ac.uk/article/10.3390/rs13071353/s1. Table S1: Coefficient of determination of all biophysical traits used in this study and all 64 VIs. Figure S1: The mean values of other traits during the season (DOY: 141, 157, 169, 183, 191, 253, 274). Pooled for all species (Betula pendula, Alnus incana, Populus tremula) and juvenile, mature, and senescent leaves together. Figure S2: The mean values of other traits during the season (DOY: 141, 157, 169, 183, 191, 253, 274). Pooled for all species (Betula pendula, Alnus incana, Populus tremula) for two group of leaves (juvenile and mature). Figure S3: The mean values of other traits during the season (DOY: 141, 157, 169, 183, 191, 253, 274). Pooled for all species (Betula pendula, Alnus incana, Populus tremula) for three age of leaves (juvenile, mature, and senescent). Figure S4: The mean values of nitrogen and carbon content (%) during the season (DOY: 141, 157, 169, 183, 191, 253, 274). Pooled for all species (Betula pendula, Alnus incana, Populus tremula) and juvenile, mature, and senescent leaves together; for two group of leaves (juvenile and mature); and juvenile, mature, and senescent leaves together. Figure S5: The reflectance at selected wavelength during the season (DOY: 141, 157, 169, 183, 191, 253, 274). Data were pooled for all species (B. pendula, A. incana, P. tremula) for three age of leaves (juvenile, mature, and senescent). Figure S6: The reflectance at selected wavelength during the season (DOY: 141, 157, 169, 183, 191, 253, 274). Pooled for all species (B. pendula, A. incana, P. tremula) for two group of leaves (juvenile and mature). Figure S7: The reflectance at selected wavelength during the season (day of the year - DOY: 141, 157, 169, 183, 191, 253, 274). Data were pooled for all species (B. pendula, A. incana, P. tremula) and juvenile, mature, and senescent leaves together.

Author Contributions

Conceptualization L.H. and E.N.; methodology L.H., E.N., A.K., J.K., Z.L., J.A.; software A.K., J.K., E.N., L.H.; formal analysis E.N., L.H., A.K., J.K.; investigation E.N., L.H., A.K., J.K., Z.L., J.A.; resources L.H. (EST), J.A. (CZE); writing—original draft preparation E.N.; writing—review and editing E.N., L.H., A.K., J.K., Z.L., J.A.; visualization E.N.; supervision J.A., L.H.; project administration L.H. (EST), J.A. (CZE); funding acquisition L.H. (EST), J.A. (CZE). All authors have read and agreed to the published version of the manuscript.

Funding

This research was funded in Estonia by the European Union’s Horizon 2020 research and innovation programme under grant agreement No. 687320 (MULTIscale SENTINEL land surface information retrieval Platform, MULTIPLY); the European Regional Development Fund within National Programme for Addressing Socio-Economic Challenges through R&D (RITA), and in Czechia by the Ministry of Education, Youth and Sports of the Czech Republic, INTER-EXCELLENCE, LTAUSA18154. Jana Albrechtova discussed the manuscript in the framework of the project NASA, LCLUC, MuSLI NNH17ZDA001N (Prototyping MuSLI canopy Chlorophyll Content for Assessment of Vegetation Function and Productivity). The stay of Eva Neuwirthová in the laboratory of Lea Hallik in 2018 was supported by the Erasmus EU funding scheme.

Data Availability Statement

The data presented in this study are available on reasonable request from the corresponding author.

Acknowledgments

We thank to Mait Lang (TO) for help with field sampling and the project support, Miroslav Barták (CUNI) for graphical technical help, Drahomíra Bartáková (CUNI) for help with leaf hand sectioning. We greatly acknowledge proof-reading of the paper by a native speaker Lena Hunt from USA who is a Ph.D. student in the lab of J. Albrechtová (CUNI). J. Albrechtová thanks to Petya Campbell from NASA Goddard Space Flight Center and UMBC, (USA), for inspiring discussions on the topic.

Conflicts of Interest

The authors declare that the research was conducted in the absence of any commercial or financial relationships that could be construed as a potential conflict of interest.

References

  1. DeLucia, E.H.; Hamilton, J.G.; Naidu, S.L.; Thomas, R.B.; Andrews, J.A.; Finzi, A.C.; Lavine, M.; Matamala, R.; Mohan, J.E.; Hendrey, G.R.; et al. Net Primary Production of a Forest Ecosystem with Experimental CO2 Enrichment. Science 1999, 284, 1177–1179. [Google Scholar] [CrossRef] [Green Version]
  2. Zhao, M.; Running, S.W. Drought-Induced Reduction in Global Terrestrial Net Primary Production from 2000 through 2009. Science 2010, 329, 940–943. [Google Scholar] [CrossRef] [Green Version]
  3. Walker, A.P. Integrating the Evidence for a Terrestrial Carbon Sink Caused by Increasing Atmospheric CO2. New Phytol. 2020, 229, 2413–2445. [Google Scholar] [CrossRef]
  4. Pan, Y.; Birdsey, R.A.; Fang, J.; Houghton, R.; Kauppi, P.E.; Kurz, W.A.; Phillips, O.L.; Shvidenko, A.; Lewis, S.L.; Canadell, J.G.; et al. A Large and Persistent Carbon Sink in the World’s Forests. Science 2011, 333, 988–993. [Google Scholar] [CrossRef] [PubMed] [Green Version]
  5. Frank, D.; Reichstein, M.; Bahn, M.; Thonicke, K.; Frank, D.; Mahecha, M.D.; Smith, P.; van der Velde, M.; Vicca, S.; Babst, F.; et al. Effects of Climate Extremes on the Terrestrial Carbon Cycle: Concepts, Processes and Potential Future Impacts. Glob. Chang. Biol. 2015, 21, 2861–2880. [Google Scholar] [CrossRef] [PubMed] [Green Version]
  6. Ahti, T.; Hämet-Ahti, L.; Jalas, J. Vegetation Zones and Their Sections in Northwestern Europe. Ann. Bot. Fenn. 1968, 5, 169–211. [Google Scholar]
  7. Hickler, T.; Vohland, K.; Feehan, J.; Miller, P.A.; Smith, B.; Costa, L.; Giesecke, T.; Fronzek, S.; Carter, T.R.; Cramer, W.; et al. Projecting the Future Distribution of European Potential Natural Vegetation Zones with a Generalized, Tree Species-Based Dynamic Vegetation Model. Glob. Ecol. Biogeogr. 2012, 21, 50–63. [Google Scholar] [CrossRef]
  8. Wu, R.; Hinckley, T.M. Phenotypic Plasticity of Sylleptic Branching: Genetic Design of Tree Architecture. Crit. Rev. Plant Sci. 2001, 20, 467–485. [Google Scholar] [CrossRef]
  9. Halle, F.; Oldeman, R.A.A.; Tomlinson, P.B. Tropical Trees and Forests: An Architectural Analysis; Springer Science & Business Media: Berlin/Heidelberg, Germany, 2012; ISBN 978-3-642-81190-6. [Google Scholar]
  10. Critchfield, W.B. Leaf Dimorphism in Populus Trichocarpa. Am. J. Bot. 1960, 47, 699–711. [Google Scholar] [CrossRef]
  11. Cox, S.E. Elevational Gradient of Neoformed Shoot Growth in Populus tremuloides. Can. J. Bot. 2005, 83, 1340–1344. [Google Scholar] [CrossRef]
  12. Ceulemans, R.; Stettler, R.F.; Hinckley, T.M.; Isebrands, J.G.; Heilman, P.E. Crown Architecture of Populus Clones as Determined by Branch Orientation and Branch Characteristics. Tree Physiol. 1990, 7, 157–167. [Google Scholar] [CrossRef] [PubMed]
  13. Deepak, M.; Keski-Saari, S.; Fauch, L.; Granlund, L.; Oksanen, E.; Keinänen, M. Leaf Canopy Layers Affect Spectral Reflectance in Silver Birch. Remote Sens. 2019, 11, 2884. [Google Scholar] [CrossRef] [Green Version]
  14. Broeckx, L.S.; Verlinden, M.S.; Vangronsveld, J.; Ceulemans, R. Importance of Crown Architecture for Leaf Area Index of Different Populus Genotypes in a High-Density Plantation. Tree Physiol. 2012, 32, 1214–1226. [Google Scholar] [CrossRef] [PubMed] [Green Version]
  15. Curtis, J.D.; Lersten, N.R. Heterophylly in Populus Grandidentata (Salicaceae) with Emphasis on Resin Glands and Extrafloral Nectaries. Am. J. Bot. 1978, 65, 1003–1010. [Google Scholar] [CrossRef]
  16. Liu, Y.; Li, X.; Chen, G.; Li, M.; Liu, M.; Liu, D. Epidermal Micromorphology and Mesophyll Structure of Populus Euphratica Heteromorphic Leaves at Different Development Stages. PLoS ONE 2015, 10, e0137701. [Google Scholar] [CrossRef]
  17. Evert, R. Esau’s Plant Anatomy, Meristems, Cells, and Tissues of the Plant Body: Their Structure, Function, and Development, 3rd ed.; John Wiley and Sons: Hoboken, NJ, USA, 2006; Volume 99, pp. 785–786. [Google Scholar] [CrossRef] [Green Version]
  18. Kenzo, T.; Ichie, T.; Yoneda, R.; Kitahashi, Y.; Watanabe, Y.; Ninomiya, I.; Koike, T. Interspecific Variation of Photosynthesis and Leaf Characteristics in Canopy Trees of Five Species of Dipterocarpaceae in a Tropical Rain Forest. Tree Physiol. 2004, 24, 1187–1192. [Google Scholar] [CrossRef] [PubMed] [Green Version]
  19. Evans, J.; Caemmerer, S.; Setchell, B.; Hudson, G. The Relationship Between CO2 Transfer Conductance and Leaf Anatomy in Transgenic Tobacco With a Reduced Content of Rubisco. Funct. Plant Biol. 1994, 21, 475. [Google Scholar] [CrossRef]
  20. Lhotáková, Z.; Kopačková-Strnadová, V.; Oulehle, F.; Homolová, L.; Neuwirthová, E.; Švik, M.; Janoutová, R.; Albrechtová, J. Foliage Biophysical Trait Prediction from Laboratory Spectra in Norway Spruce Is More Affected by Needle Age Than by Site Soil Conditions. Remote Sens. 2021, 13, 391. [Google Scholar] [CrossRef]
  21. Castro, K.L.; Sanchez-Azofeifa, G.A. Changes in Spectral Properties, Chlorophyll Content and Internal Mesophyll Structure of Senescing Populus Balsamifera and Populus Tremuloides Leaves. Sensors 2008, 8, 51–69. [Google Scholar] [CrossRef] [Green Version]
  22. Gara, T.W.; Darvishzadeh, R.; Skidmore, A.K.; Wang, T. Impact of Vertical Canopy Position on Leaf Spectral Properties and Traits across Multiple Species. Remote Sens. 2018, 10, 346. [Google Scholar] [CrossRef] [Green Version]
  23. Mähler, N.; Schiffthaler, B.; Robinson, K.M.; Terebieniec, B.K.; Vučak, M.; Mannapperuma, C.; Bailey, M.E.S.; Jansson, S.; Hvidsten, T.R.; Street, N.R. Leaf Shape in Populus tremula Is a Complex, Omnigenic Trait. Ecol. Evol. 2020, 10, 11922–11940. [Google Scholar] [CrossRef] [PubMed]
  24. Lukeš, P.; Neuwirthová, E.; Lhotáková, Z.; Janoutová, R.; Albrechtová, J. Upscaling Seasonal Phenological Course of Leaf Dorsiventral Reflectance in Radiative Transfer Model. Remote Sens. Environ. 2020, 246, 111862. [Google Scholar] [CrossRef]
  25. Nezval, O.; Krejza, J.; Světlík, J.; Šigut, L.; Horáček, P. Comparison of Traditional Ground-Based Observations and Digital Remote Sensing of Phenological Transitions in a Floodplain Forest. Agric. For. Meteorol. 2020, 291, 108079. [Google Scholar] [CrossRef]
  26. Dengler, N.G.; Mackay, L.B.; Gregory, L.M. Cell Enlargement and Tissue Differentiation during Leaf Expansion in Beech, Fagus grandifolia. Can. J. Bot. 1975, 53, 2846–2865. [Google Scholar] [CrossRef]
  27. Maillard, A.; Diquélou, S.; Billard, V.; Laîné, P.; Garnica, M.; Prudent, M.; Garcia-Mina, J.-M.; Yvin, J.-C.; Ourry, A. Leaf Mineral Nutrient Remobilization during Leaf Senescence and Modulation by Nutrient Deficiency. Front. Plant. Sci. 2015, 6. [Google Scholar] [CrossRef] [PubMed] [Green Version]
  28. Keskitalo, J.; Bergquist, G.; Gardeström, P.; Jansson, S. A Cellular Timetable of Autumn Senescence. Plant Physiol. 2005, 139, 1635–1648. [Google Scholar] [CrossRef] [PubMed] [Green Version]
  29. Junker, L.V.; Ensminger, I. Relationship between Leaf Optical Properties, Chlorophyll Fluorescence and Pigment Changes in Senescing Acer saccharum Leaves. Tree Physiol. 2016, 36, 694–711. [Google Scholar] [CrossRef] [Green Version]
  30. Neuwirthová, E.; Lhotáková, Z.; Albrechtová, J. The Effect of Leaf Stacking on Leaf Reflectance and Vegetation Indices Measured by Contact Probe during the Season. Sensors 2017, 17, 1202. [Google Scholar] [CrossRef] [Green Version]
  31. Yang, X.; Tang, J.; Mustard, J.F.; Wu, J.; Zhao, K.; Serbin, S.; Lee, J.-E. Seasonal Variability of Multiple Leaf Traits Captured by Leaf Spectroscopy at Two Temperate Deciduous Forests. Remote Sens. Environ. 2016, 179, 1–12. [Google Scholar] [CrossRef] [Green Version]
  32. Dillen, S.Y.; de Beeck, M.O.; Hufkens, K.; Buonanduci, M.; Phillips, N.G. Seasonal Patterns of Foliar Reflectance in Relation to Photosynthetic Capacity and Color Index in Two Co-Occurring Tree Species, Quercus Rubra and Betula Papyrifera. Agric. For. Meteorol. 2012, 160, 60–68. [Google Scholar] [CrossRef]
  33. White, K.; Pontius, J.; Schaberg, P. Remote Sensing of Spring Phenology in Northeastern Forests: A Comparison of Methods, Field Metrics and Sources of Uncertainty. Remote Sens. Environ. 2014, 148, 97–107. [Google Scholar] [CrossRef]
  34. Hovi, A.; Raitio, P.; Rautiainen, M. A Spectral Analysis of 25 Boreal Tree Species. Silva Fenn. 2017, 51. [Google Scholar] [CrossRef] [Green Version]
  35. Jacquemoud, S.; Verhoef, W.; Baret, F.; Bacour, C.; Zarco-Tejada, P.J.; Asner, G.P.; François, C.; Ustin, S.L. PROSPECT + SAIL Models: A Review of Use for Vegetation Characterization. Remote Sens. Environ. 2009, 113 (Suppl. 1), S56–S66. [Google Scholar] [CrossRef]
  36. Wu, Q.; Song, C.; Song, J.; Wang, J.; Chen, S.; Yu, B. Impacts of Leaf Age on Canopy Spectral Signature Variation in Evergreen Chinese Fir Forests. Remote Sens. 2018, 10, 262. [Google Scholar] [CrossRef] [Green Version]
  37. Demarez, V. Seasonal Variation of Leaf Chlorophyll Content of a Temperate Forest. Inversion of the PROSPECT Model. Int. J. Remote Sens. 1999, 20, 879–894. [Google Scholar] [CrossRef]
  38. Gausman, H.W.; Allen, W.A. Optical Parameters of Leaves of 30 Plant Species. Plant Physiol. 1973, 52, 57–62. [Google Scholar] [CrossRef]
  39. Allen, W.A.; Gausman, H.W.; Richardson, A.J. Willstätter-Stoll Theory of Leaf Reflectance Evaluated by Ray Tracing. Appl. Opt. 1973, 12, 2448–2453. [Google Scholar] [CrossRef] [PubMed]
  40. Slaton, M.R.; Hunt, E.R.; Smith, W.K. Estimating Near-Infrared Leaf Reflectance from Leaf Structural Characteristics. Am. J. Bot. 2001, 88, 278–284. [Google Scholar] [CrossRef]
  41. Buschmann, C.; Lenk, S.; Lichtenthaler, H.K. Reflectance Spectra and Images of Green Leaves with Different Tissue Structure and Chlorophyll Content. Isr. J. Plant Sci. 2012, 60, 49–64. [Google Scholar] [CrossRef]
  42. Rapaport, T.; Hochberg, U.; Rachmilevitch, S.; Karnieli, A. The Effect of Differential Growth Rates across Plants on Spectral Predictions of Physiological Parameters. PLoS ONE 2014, 9, e88930. [Google Scholar] [CrossRef]
  43. Van Wittenberghe, S.; Alonso, L.; Verrelst, J.; Moreno, J.; Samson, R. Bidirectional Sun-Induced Chlorophyll Fluorescence Emission Is Influenced by Leaf Structure and Light Scattering Properties—A Bottom-up Approach. Remote Sens. Environ. 2015, 158, 169–179. [Google Scholar] [CrossRef]
  44. Lu, S.; Lu, X.; Zhao, W.; Liu, Y.; Wang, Z.; Omasa, K. Comparing Vegetation Indices for Remote Chlorophyll Measurement of White Poplar and Chinese Elm Leaves with Different Adaxial and Abaxial Surfaces. J. Exp. Bot. 2015, 66, 5625–5637. [Google Scholar] [CrossRef] [Green Version]
  45. Sims, D.A.; Gamon, J.A. Relationships between Leaf Pigment Content and Spectral Reflectance across a Wide Range of Species, Leaf Structures and Developmental Stages. Remote Sens. Environ. 2002, 81, 337–354. [Google Scholar] [CrossRef]
  46. Verrelst, J.; Malenovský, Z.; Van der Tol, C.; Camps-Valls, G.; Gastellu-Etchegorry, J.-P.; Lewis, P.; North, P.; Moreno, J. Quantifying Vegetation Biophysical Variables from Imaging Spectroscopy Data: A Review on Retrieval Methods. Surv. Geophys. 2019, 40, 589–629. [Google Scholar] [CrossRef] [Green Version]
  47. Gitelson, A.A.; Merzlyak, M.N. Signature Analysis of Leaf Reflectance Spectra: Algorithm Development for Remote Sensing of Chlorophyll. J. Plant Physiol. 1996, 148, 494–500. [Google Scholar] [CrossRef]
  48. Gitelson, A.A.; Merzlyak, M.N. Remote Sensing of Chlorophyll Concentration in Higher Plant Leaves. Adv. Space Rese. 1998, 22, 689–692. [Google Scholar] [CrossRef]
  49. Hallik, L.; Kuusk, A.; Lang, M.; Kuusk, J. Reflectance Properties of Hemiboreal Mixed Forest Canopies with Focus on Red Edge and Near Infrared Spectral Regions. Remote Sens. 2019, 11, 1717. [Google Scholar] [CrossRef] [Green Version]
  50. Main, R.; Cho, M.A.; Mathieu, R.; O’Kennedy, M.M.; Ramoelo, A.; Koch, S. An Investigation into Robust Spectral Indices for Leaf Chlorophyll Estimation. ISPRS J. Photogramm. Remote Sens. 2011, 66, 751–761. [Google Scholar] [CrossRef]
  51. Hallik, L.; Kazantsev, T.; Kuusk, A.; Galmés, J.; Tomás, M.; Niinemets, Ü. Generality of Relationships between Leaf Pigment Contents and Spectral Vegetation Indices in Mallorca (Spain). Reg. Environ. Chang. 2017, 17, 2097–2109. [Google Scholar] [CrossRef]
  52. Rouse, J.W.; Haas, R.H.; Schell, J.A.; Deering, D.W.; Harlan, J.C. Monitoring the Vernal Advancement and Retrogradation (Green Wave Effect) of Natural Vegetation; NASA/GSFC Type III Final Report; NASA: Washington, DC, USA, 1974; 371p. [Google Scholar]
  53. Huete, A.; Didan, K.; Miura, T.; Rodriguez, E.P.; Gao, X.; Ferreira, L.G. Overview of the Radiometric and Biophysical Performance of the MODIS Vegetation Indices. Remote Sens. Environ. 2002, 83, 195–213. [Google Scholar] [CrossRef]
  54. Campbell, P.K.E.; Rock, B.N.; Martin, M.E.; Neefus, C.D.; Irons, J.R.; Middleton, E.M.; Albrechtova, J. Detection of Initial Damage in Norway Spruce Canopies Using Hyperspectral Airborne Data. Int. J. Remote Sens. 2004, 25, 5557–5583. [Google Scholar] [CrossRef]
  55. Kuusk, A.; Lang, M.; Nilson, T. Forest Test Site at Järvselja, Estonia. In Proceedings of the Third Workshop CHRIS/Proba, Frascati, Italy, 21–23 March 2005; ESA Publication SP-593. ISBN 92-9092-904-9. ISSN 1609-042X. [Google Scholar]
  56. R Core Team R: The R Project for Statistical Computing, R Foundation for Statistical Computing, Vienna, Austria. Available online: https://www.r-project.org/ (accessed on 24 November 2020).
  57. Wendlandt, W.W.; Hecht, H.G. Reflectance Spectroscopy; John Wiley and Sons, Inc.: New York, NY, USA, 1966; Volume 21, vii+298p. [Google Scholar]
  58. Rabiner, L.R.; Gold, B. Theory and Application of Digital Signal Processing; Prentice-Hall, Inc.: Upper Saddle River, NJ, USA, 1975; 777p. [Google Scholar]
  59. Wellburn, A.R. The Spectral Determination of Chlorophylls a and b, as Well as Total Carotenoids, Using Various Solvents with Spectrophotometers of Different Resolution. J. Plant Physiol. 1994, 144, 307–313. [Google Scholar] [CrossRef]
  60. Esbensen, K.H.; Swarbrick, B.; Westad, F.; Whitcomb, P.; Anderson, M. Multivariate Data Analysis: An Introduction to Multivariate Analysis. In Process Analytical Technology and Quality by Design, 6th ed.; CAMO Software AS: Oslo Magnolia, TX, USA, 2018; ISBN 978-82-691104-0-1. [Google Scholar]
  61. Tang, Y.; Horikoshi, M.; Li, W. Ggfortify: Unified Interface to Visualize Statistical Results of Popular R Packages. R J. 2016, 8, 474. [Google Scholar] [CrossRef] [Green Version]
  62. Gao, B. NDWI—A Normalized Difference Water Index for Remote Sensing of Vegetation Liquid Water from Space. Remote Sens. Environ. 1996, 58, 257–266. [Google Scholar] [CrossRef]
  63. Curran, P.J. Remote Sensing of Foliar Chemistry. Remote Sens. Environ. 1989, 30, 271–278. [Google Scholar] [CrossRef]
  64. Zhang, X.; Jin, G.; Liu, Z. Contribution of Leaf Anatomical Traits to Leaf Mass per Area among Canopy Layers for Five Coexisting Broadleaf Species across Shade Tolerances at a Regional Scale. For. Ecol. Manag. 2019, 452, 117569. [Google Scholar] [CrossRef]
  65. Cline, M.G.; Harrington, C.A. Apical Dominance and Apical Control in Multiple Flushing of Temperate Woody Species. J. For. Res. 2007, 37, 74–83. [Google Scholar] [CrossRef]
  66. Liu, Z.; Jiang, F.; Li, F.; Jin, G. Coordination of Intra and Inter-Species Leaf Traits According to Leaf Phenology and Plant Age for Three Temperate Broadleaf Species with Different Shade Tolerances. For. Ecol. Manag. 2019, 434, 63–75. [Google Scholar] [CrossRef]
  67. Blackburn, G.A. Relationships between Spectral Reflectance and Pigment Concentrations in Stacks of Deciduous Broadleaves. Remote Sens. Environ. 1999, 70, 224–237. [Google Scholar] [CrossRef]
  68. Marchi, S.; Tognetti, R.; Minnocci, A.; Borghi, M.; Sebastiani, L. Variation in Mesophyll Anatomy and Photosynthetic Capacity during Leaf Development in a Deciduous Mesophyte Fruit Tree (Prunus persica) and an Evergreen Sclerophyllous Mediterranean Shrub (Olea europaea). Trees 2008, 22, 559–571. [Google Scholar] [CrossRef]
  69. Uliassi, D.D.; Ruess, R.W. Limitations to Symbiotic Nitrogen Fixation in Primary Succession on the Tanana River Floodplain. Ecology 2002, 83, 88–103. [Google Scholar] [CrossRef]
  70. Müller, P.; Li, X.-P.; Niyogi, K.K. Non-Photochemical Quenching. A Response to Excess Light Energy. Plant Physiol. 2001, 125, 1558–1566. [Google Scholar] [CrossRef] [Green Version]
  71. Demmig-Adams, B.; Adams, W.W. Photoprotection in an Ecological Context: The Remarkable Complexity of Thermal Energy Dissipation. New Phytol. 2006, 172, 11–21. [Google Scholar] [CrossRef]
  72. Matsubara, S.; Krause, G.H.; Aranda, J.; Virgo, A.; Beisel, K.G.; Jahns, P.; Winter, K. Sun-Shade Patterns of Leaf Carotenoid Composition in 86 Species of Neotropical Forest Plants. Funct. Plant Biol. 2009, 36, 20–36. [Google Scholar] [CrossRef] [PubMed]
  73. Marin, A.; Passarini, F.; van Stokkum, I.H.M.; van Grondelle, R.; Croce, R. Minor Complexes at Work: Light-Harvesting by Carotenoids in the Photosystem II Antenna Complexes CP24 and CP26. Biophys. J. 2011, 100, 2829–2838. [Google Scholar] [CrossRef] [Green Version]
  74. Niinemets, Ü. Responses of Forest Trees to Single and Multiple Environmental Stresses from Seedlings to Mature Plants: Past Stress History, Stress Interactions, Tolerance and Acclimation. For. Ecol. Manag. 2010, 260, 1623–1639. [Google Scholar] [CrossRef]
  75. Féret, J.-B.; François, C.; Gitelson, A.; Asner, G.P.; Barry, K.M.; Panigada, C.; Richardson, A.D.; Jacquemoud, S. Optimizing Spectral Indices and Chemometric Analysis of Leaf Chemical Properties Using Radiative Transfer Modeling. Remote Sens. Environ. 2011, 115, 2742–2750. [Google Scholar] [CrossRef] [Green Version]
  76. Mänd, P.; Hallik, L.; Peñuelas, J.; Kull, O. Electron Transport Efficiency at Opposite Leaf Sides: Effect of Vertical Distribution of Leaf Angle, Structure, Chlorophyll Content and Species in a Forest Canopy. Tree Physiol. 2013, 33, 202–210. [Google Scholar] [CrossRef] [Green Version]
  77. Kull, O. Acclimation of Photosynthesis in Canopies: Models and Limitations. Oecologia 2002, 133, 267–279. [Google Scholar] [CrossRef] [PubMed]
  78. Hallik, L.; Kull, O.; Niinemets, Ü.; Aan, A. Contrasting Correlation Networks between Leaf Structure, Nitrogen and Chlorophyll in Herbaceous and Woody Canopies. Basic Appl. Ecol. 2009, 10, 309–318. [Google Scholar] [CrossRef]
  79. Mottus, M.; Sulev, M.; Hallik, L. Seasonal Course of the Spectral Properties of Alder and Birch Leaves. IEEE J. Sel. Top. Appl. Earth Obs. Remote Sens. 2014, 7, 2496–2505. [Google Scholar] [CrossRef]
  80. Kopačková-Strnadová, V.; Koucká, L.; Jelének, J.; Lhotáková, Z.; Oulehle, F. Canopy Top, Height and Photosynthetic Pigment Estimation Using Parrot Sequoia Multispectral Imagery and the Unmanned Aerial Vehicle (UAV). Remote Sens. 2021, 13, 705. [Google Scholar] [CrossRef]
  81. Chavana-Bryant, C.; Malhi, Y.; Anastasiou, A.; Enquist, B.J.; Cosio, E.G.; Keenan, T.F.; Gerard, F.F. Leaf Age Effects on the Spectral Predictability of Leaf Traits in Amazonian Canopy Trees. Sci. Total Environ. 2019, 666, 1301–1315. [Google Scholar] [CrossRef] [PubMed] [Green Version]
  82. Wu, J.; Rogers, A.; Albert, L.P.; Ely, K.; Prohaska, N.; Wolfe, B.T.; Oliveira, R.C.; Saleska, S.R.; Serbin, S.P. Leaf Reflectance Spectroscopy Captures Variation in Carboxylation Capacity across Species, Canopy Environment and Leaf Age in Lowland Moist Tropical Forests. New Phytol. 2019, 224, 663–674. [Google Scholar] [CrossRef] [PubMed]
  83. Wu, J.; Chavana-Bryant, C.; Prohaska, N.; Serbin, S.P.; Guan, K.; Albert, L.P.; Yang, X. Convergence in Relationships between Leaf Traits, Spectra and Age across Diverse Canopy Environments and Two Contrasting Tropical Forests. New Phytol. 2017, 214, 1033–1048. [Google Scholar] [CrossRef] [PubMed] [Green Version]
  84. Croft, H.; Chen, J.M.; Zhang, Y. The Applicability of Empirical Vegetation Indices for Determining Leaf Chlorophyll Content over Different Leaf and Canopy Structures. Ecol. Complex. 2014, 17, 119–130. [Google Scholar] [CrossRef]
  85. He, N.; Liu, C.; Tian, M.; Li, M.; Yang, H.; Yu, G.; Guo, D.; Smith, M.D.; Yu, Q.; Hou, J. Variation in Leaf Anatomical Traits from Tropical to Cold-temperate Forests and Linkage to Ecosystem Functions. Funct. Ecol. 2018, 32, 10–19. [Google Scholar] [CrossRef] [Green Version]
  86. Le Maire, G.; Francois, C.; Soudani, K.; Berveiller, D.; Pontailler, J.; Breda, N.; Genet, H.; Davi, H.; Dufrene, E. Calibration and Validation of Hyperspectral Indices for the Estimation of Broadleaved Forest Leaf Chlorophyll Content, Leaf Mass per Area, Leaf Area Index and Leaf Canopy Biomass. Remote Sens. Environ. 2008, 112, 3846–3864. [Google Scholar] [CrossRef]
  87. Homolová, L.; Lukeš, P.; Malenovský, Z.; Lhotáková, Z.; Kaplan, V.; Hanuš, J. Measurement Methods and Variability Assessment of the Norway Spruce Total Leaf Area: Implications for Remote Sensing. Trees 2013, 27, 111–121. [Google Scholar] [CrossRef] [Green Version]
  88. Dawson, T.P.; Curran, P.J.; Plummer, S.E. LIBERTY—Modeling the Effects of Leaf Biochemical Concentration on Reflectance Spectra. Remote Sens. Environ. 1998, 65, 50–60. [Google Scholar] [CrossRef]
  89. Jacquemoud, S.; Baret, F. PROSPECT: A Model of Leaf Optical Properties Spectra. Remote Sens. Environ. 1990, 34, 75–91. [Google Scholar] [CrossRef]
  90. Du, L.; Shi, S.; Yang, J.; Sun, J.; Gong, W. Using Different Regression Methods to Estimate Leaf Nitrogen Content in Rice by Fusing Hyperspectral LiDAR Data and Laser-Induced Chlorophyll Fluorescence Data. Remote Sens. 2016, 8, 526. [Google Scholar] [CrossRef] [Green Version]
  91. Schlemmer, M.R.; Francis, D.D.; Shanahan, J.F.; Schepers, J.S. Remotely Measuring Chlorophyll Content in Corn Leaves with Differing Nitrogen Levels and Relative Water Content. Agron. J. 2005, 97, 106–112. [Google Scholar] [CrossRef] [Green Version]
  92. Merzlyak, M.N.; Gitelson, A.A.; Chivkunova, O.B.; Rakitin, V.Y.U. Non-Destructive Optical Detection of Pigment Changes during Leaf Senescence and Fruit Ripening. Physiol. Plant. 1999, 106, 135–141. [Google Scholar] [CrossRef] [Green Version]
  93. Bussotti, F.; Gerosa, G.; Digrado, A.; Pollastrini, M. Selection of Chlorophyll Fluorescence Parameters as Indicators of Photosynthetic Efficiency in Large Scale Plant Ecological Studies. Ecol. Indic. 2020, 108, 105686. [Google Scholar] [CrossRef]
  94. Jay, S.; Bendoula, R.; Hadoux, X.; Féret, J.-B.; Gorretta, N. A Physically-Based Model for Retrieving Foliar Biochemistry and Leaf Orientation Using Close-Range Imaging Spectroscopy. Remote Sens. Environ. 2016, 177, 220–236. [Google Scholar] [CrossRef] [Green Version]
  95. Vanbrabant, Y.; Tits, L.; Delalieux, S.; Pauly, K.; Verjans, W.; Somers, B. Multitemporal Chlorophyll Mapping in Pome Fruit Orchards from Remotely Piloted Aircraft Systems. Remote Sens. 2019, 11, 1468. [Google Scholar] [CrossRef] [Green Version]
  96. Singhal, G.; Bansod, B.; Mathew, L.; Goswami, J.; Choudhury, B.U.; Raju, P.L.N. Chlorophyll Estimation Using Multi-Spectral Unmanned Aerial System Based on Machine Learning Techniques. Remote Sens. Appl. Soc. Environ. 2019, 15, 100235. [Google Scholar] [CrossRef]
  97. Švik, M.; Oulehle, F.; Krám, P.; Janoutová, R.; Tajovská, K.; Homolová, L. Landsat-Based Indices Reveal Consistent Recovery of Forested Stream Catchments from Acid Deposition. Remote Sens. 2020, 12, 1944. [Google Scholar] [CrossRef]
  98. Claverie, M.; Ju, J.; Masek, J.G.; Dungan, J.L.; Vermote, E.F.; Roger, J.-C.; Skakun, S.V.; Justice, C. The Harmonized Landsat and Sentinel-2 Surface Reflectance Data Set. Remote Sens. Environ. 2018, 219, 145–161. [Google Scholar] [CrossRef]
  99. Shang, R.; Zhu, Z. Harmonizing Landsat 8 and Sentinel-2: A Time-Series-Based Reflectance Adjustment Approach. Remote Sens. Environ. 2019, 235, 111439. [Google Scholar] [CrossRef]
  100. Zhang, X.; Wang, J.; Henebry, G.M.; Gao, F. Development and Evaluation of a New Algorithm for Detecting 30 m Land Surface Phenology from VIIRS and HLS Time Series. ISPRS J. Photogramm. Remote Sens. 2020, 161, 37–51. [Google Scholar] [CrossRef]
Figure 1. Branch of B. pendula during taking ground truth in 25 June (right photo). White circle mark juvenile appearance of the leaf surrounded by mature leaves. In the middle cross-sections of two developmental stages (juvenile and mature) of B. pendula leaves sampled in June (18 June = DOY 169). (Right) description of leaf internal structure with a description of leaf tissues that were quantified in the present study. Palisade and spongy parenchyma comprise the photosynthetic mesophyll tissue. Dermal tissue is represented by the adaxial epidermis on the upper surface and abaxial epidermis on the lower surface. Fresh hand sections stained with toluidine blue, bright field microscopy, magnification 400×.
Remotesensing 13 01353 g001
Figure 2. Map of sampling location in Estonia (upper left corner), map of location of both sites: Tõravere park adjacent to Tartu Observatory (left) and Järvselja Experimental Forest district (right) with aerial photos of sites.
Remotesensing 13 01353 g002
Figure 3. The mean values of anatomical and biophysical traits during the season (DOYs: 141, 157, 169, 183, 191, 253, and 274). Data were pooled according to the leaf developmental category (juvenile, mature, and senescent) (a) PP: palisade parenchyma thickness; (b) SP: spongy parenchyma thickness; (c) PP/SP: palisade/spongy parenchyma thickness ratio; (the analysis for DOYs 253, 274 were not performed for a–c); (d) Chl: chlorophyll a + b content; (e) Chl a/b: chlorophyll a/b ratio; (f) Car: carotenoids content; (g) Car/Chl: carotenoids/chlorophyll ratio; (h) LMA: leaf mass per area; (i) WCLA: water content per leaf area; (j) DW/FW: dry/fresh weight ratio. The difference among the DOYs in one group tested by analysis of variance, α = 0.05. Different colors correspond to individual DOYs during the season; line in boxes show median, bars in boxes show inter-quartile range (IQR); dots correspond to outliers defined as three times IQR; same letters show no significance, different letter show significant difference among DOYs within one graph at α = 0.05.
Remotesensing 13 01353 g003
Figure 4. The mean values of anatomical and biophysical traits during the season (DOYs: 141, 157, 169, 183, 191, 253 and 274). Data were pooled according to the leaf developmental category (juvenile and mature) (a) PP: palisade parenchyma thickness; (b) SP: spongy parenchyma thickness; (c) PP/SP: palisade/spongy parenchyma thickness ratio; (the analysis for DOYs 253, 274 were not performed for a–c); (d) Chl: chlorophyll a + b content; (e) Chl a/b: chlorophyll a/b ratio; (f) Car/Chl: carotenoids/chlorophyll ratio; (g) LMA: leaf mass per area; (h) WCLA: water content per leaf area; (i) DW/FW: dry/fresh weight ratio. Juvenile and mature leaves were compared in the particular DOY by one-sample T-test, α = 0.05. Line in color boxes corresponds to median value, bars in boxes show inter-quartile range (IQR); dots correspond to outliers defined as three times IQR; an asterisk denotes significant difference between juvenile and mature leaves at α = 0.05.
Remotesensing 13 01353 g004
Figure 5. The mean values of biophysical and anatomical traits during the season (DOYs: 141, 157, 169, 183, 191, 253, and 274). Data were pooled for all species (B. pendula, A. incana, P. tremula) independently on leaf developmental category (juvenile, mature, and senescent leaves). (a) PP: palisade parenchyma thickness; (b) SP: spongy parenchyma thickness; (c) PP/SP: palisade/spongy parenchyma thickness ratio; (the analysis for DOYs 253, 274 were not performed for a–c); (d) Chl: chlorophyll a + b content; (e) Chl a/b: chlorophyll a/b ratio; (f) Car/Chl: carotenoids/chlorophyll ratio; (g) LMA: leaf mass per area; (h) WCLA: water content per leaf area; (i) DW/FW: dry/fresh weight ratio. Difference among the values for different DOYs in one group was tested by the analysis of variance, α = 0.05. Different colors correspond to individual DOYs during the season; line in boxes corresponds to the median value, error bars show inter-quartile range (IQR); dots correspond to outliers defined as three times IQR; same letters above boxes indicate no significance, different letters correspond to significant difference among DOYs within one graph at α = 0.05.
Remotesensing 13 01353 g005
Figure 6. The mean values of Directional-Hemispherical Reflectance Factor (DHRF) for different leaf developmental categories (juvenile, mature, and senescent) during the season: (a) DOY 157; (b) DOY 169; (c) DOY 183; (d) DOY 191; (e) DOY 253; (f) DOY 274. Grey vertical lines correspond to reflectance in selected wavelengths representative for red, green, red-edge, NIR, and SWIR spectral regions that were evaluated for differences by ANOVA (see Supplementary Figures S5–S7).
Remotesensing 13 01353 g006
Figure 7. Mean DHRF—Directional Hemispherical Reflectance Factor and its variability (represented by standard deviation) for all leaf developmental stages pooled during the season: (a) Mean DHRF [–]; (b) standard deviation of DHRF; grey vertical lines correspond to reflectance of selected wavelengths representative for red, green, red-edge, NIR, and SWIR spectral regions that were evaluated for differences by ANOVA (see Supplementary Figures S5–S7).
Remotesensing 13 01353 g007
Figure 8. Scores plot of principal component analysis applied on reflectance spectra (400–2000 nm). Scores (colored symbols) show sample grouping separation according to categorical variables mentioned in the figure legend: leaf age—leaf developmental category; DOY—day of year. Each score corresponds to leaf sample spectra visualized in the coordinates system of the first two principal components explaining together 91% of variance in leaf spectra. The clustering of juvenile (triangles) and mature (circles) leaves are highlighted with light green and dark green ellipses, respectively.
Remotesensing 13 01353 g008
Figure 9. Summarized correlation coefficient R2 of parameters connected with photosynthetic pigments (a) Chl: chlorophyll a + b content (light green); Chl a/b: chlorophyll a/b ratio (dark green); Car: carotenoids content (yellow); Car/Chl: carotenoids/chlorophyll ratio (orange); PP: palisade parenchyma thickness (blue color); PP/SP: palisade/spongy parenchyma thickness ratio (dark blue); and parameters connected with dry matter (b) LMA: leaf mass per area (dark cyan); fLMA: fresh leaf mass per area light cyan); WCLA: water content per leaf area (light blue); DW/FW: dry/fresh weight ratio (brown); N: nitrogen content (light green); C: carbon content (black).
Remotesensing 13 01353 g009
Figure 10. Linear relationship between the best-performing vegetation index and leaf pigment content or their ratio. (a) Vogelmann index (R739.5/R719.7) and chlorophyll a + b content; (b) mND705 ((R749.9 − R705.1)/(R749.9 + R705.1 − 2*R445.7)) and carotenoids’ content; (c) PSRI ((R680.8-R499.6)/R749.9) and carotenoids/chlorophyll ratio, (nested red square = graph, show detail of the main concentration of dots in graph (c)); different size of circles corresponds to leaf age (juvenile—small, mature—middle, and senescent leaves—large). Different colors correspond to individual DOYs during the season. R2: coefficient of determination is shown for all leaf developmental stages pooled together (All); juvenile, mature, and senescent leaves separately.
Remotesensing 13 01353 g010
Figure 11. Linear relationship between best-performing vegetation index and a leaf anatomical trait (a) MCARI2 index (1.2*(2.5*(R800.5 − R669.8) − 1.3*(R800.5 − R549.6))) and leaf thickness; (b) Datt2 (R849.9/R709.1) and palisade parenchyma thickness. Different size of circles corresponds to leaf age (juvenile—small, mature leaves—big). Different colors correspond to individual DOYs during the season. Coefficient of determination (R2) is shown for all leaf developmental stages pooled together (All); juvenile, mature separately.
Remotesensing 13 01353 g011
Figure 12. Linear relationship between best-performing vegetation index and a leaf structural trait (a) DLAI index (R1724.7 − R970.5) and LMA: leaf mas per area; (b) NDII ((R818.9 − R1648.5)/(R818.9 + R1648.5)) and fLMA: fresh leaf mass per area; (c) MSI (R1600.8/R818.9) and WCLA: water content per leaf area. Different size of circles corresponds to leaf age (juvenile—small, mature—middle, and senescent leaves—large). Different colors correspond to individual DOYs during the season. Coefficient of determination (R2) is shown for all leaf developmental stages pooled together (All); juvenile, mature, and senescent leaves separately.
Remotesensing 13 01353 g012
Figure 13. Linear relationship between the best-performing vegetation index and nitrogen or carbon contents. (a) Rre index ((R669.8 + R780.6)/2) and nitrogen content (% of dry mass); (b) NDNI ((log(1/R1511.9) − log(1/R1681.3))/(log(1/R1511.9) + log(1/R1681.3))) and carbon content (% of dry mass). Different size of circles corresponds to leaf age (juvenile—small, mature—middle, and senescent leaves—large). Different colors correspond to individual DOYs during the season. Coefficient of determination (R2) is shown for all leaf developmental stages pooled together (All); juvenile, mature, and senescent leaves separately.
Remotesensing 13 01353 g013
Figure 14. Linear relationship of Chlorophyll a + b content and palisade parenchyma thickness. Different symbol size corresponds to leaf age—juvenile (small), mature leaves (large), different colors correspond to DOYs during the season, different symbols correspond to tree species. R2—coefficient of determination of linear model.
Remotesensing 13 01353 g014
Figure 15. Biplot from PCA—principal component analysis: loadings of 64 vegetation indices and scores of all leaf samples collected during the season. (a) Biplot of the PC1 (53% of explained variance) and PC2 (23% of explained variance), Clusters A1 and A2 in green correspond mainly to chlorophyll-related indices, Clusters B1 and B2 in blue correspond to canopy-related traits indices, Cluster C in purple corresponds to Car/Chl and stress indices, cyan—DLAI; (b) Biplot of the PC2 and PC3 representing 23% and 7% (of explained variance), respectively, Clusters D1 and D2 in light blue correspond to water and lignin related indices, cyan—DLAI, the best predictor of LMA.
Remotesensing 13 01353 g015
Publisher’s Note: MDPI stays neutral with regard to jurisdictional claims in published maps and institutional affiliations.

