Temporal Characteristics of Waterfronts in Wuhan City and People’s Behavioral Preferences Based on Social Media Data

School of Urban Design, Wuhan University, Wuhan 430072, China
*
Author to whom correspondence should be addressed.
Sustainability 2019, 11(22), 6308; https://0-doi-org.brum.beds.ac.uk/10.3390/su11226308
Submission received: 21 October 2019
/
Revised: 4 November 2019
/
Accepted: 6 November 2019
/
Published: 10 November 2019
Abstract
:The appeal and vibrancy of urban waterfronts are catalysts for urban progress and sustainable urban development. This study aims to thoroughly explore the temporal characteristics of waterfront vibrancy and explore people’s behavioral preferences for various types of waterfronts at various times. On the basis of social media data, this study uses the seasonal index analysis method to classify waterfronts. Then, the kernel density estimation was used to analyze the spatial structure of different types of waterfronts. Finally, temporally weighted regression was used to indicate people’s preferences for various types of waterfronts. In general, results show the different temporal characteristics of users in waterfronts at different times and their behavioral preferences for waterfronts as the reasons behind these preface characteristics. First, on weekdays, people tend to visit daily waterfronts close to residences, and people find it convenient to walk after 18:00 and engage in recreational activities dominated by consumption and exercise, which reach a peak at 22:00–24:00. Second, on weekends, people prefer the weekend waterfronts with complete entertainment facilities and cultural themes. The natural seasonal waterfronts with seasonal landscapes attract people in various seasons, such as spring and autumn, whereas the social seasonal waterfront may be more attractive during high seasons, especially in March and June, due to big water events or nearby colleges and universities. Therefore, the government should improve the facilities of various types of waterfronts to satisfy people’s preferences at different times and help in proposing targeted suggestions with reference to future city waterfront planning and space design, contributing to the waterfronts’ vitality improvement, urban features, and promotion of urban sustainable development.
1. Introduction
An urban waterfront area is a general term for a specific urban land that is adjacent to a body of water. This area can be divided into three types: riversides, lakefronts, and seafronts, according to the nature of its adjacent water bodies [1]. The dependent relationship between humanity and water contributes to the hydrophilic instincts of people. Therefore, urban waterfronts may become vital public open spaces to provide citizens with a leisure and entertainment area to improve the quality of the urban public space environment and standard of living [2]. Nowadays, waterfront construction is a global trend [3]. Several waterfronts have been developed in many cities to restore or enhance the vitality of urban development and shape the regional characteristics and image of an area. The revitalization of urban waterfronts may provide modern cities in transition with sustainable and creative development opportunities that were previously unavailable [4]. A few important bodies of water are inseparable from the growth and development of the majority of major cities in China. For example, Wuhan, which is known as the ‘city of hundred lakes’ was formed beside lakes, while its culture flourished along with them. Thus, the revitalization of urban waterfronts has become a necessary catalyst for sustainable urban development [4,5,6]. However, regardless of well-designed waterfront spaces, the public utilization rate remains low, leading to a lack of urban vibrancy [5,7]. Paying attention to the temporal characteristics of urban waterfront vibrancy and people’s behavioral preferences for waterfronts is necessary to provide references for cities to build human-friendly waterfront environments.
However, the reality is that the lack of useful information about time variation characteristics of waterfront vibrancy and people’s behavioral preferences has hindered progress toward understanding what draws and repels people and how to satisfy citizens’ needs, stimulating the vitality of urban waterfront spaces. Thus, this study used the seasonal index analysis method based on check-in data in various timeframes to observe the temporal pattern of check-in behaviors, which was further used to classify waterfronts. The kernel density estimation was used to analyze the spatial structure of the urban waterfront vibrancy. Temporally weighted regression was used to calculate the local spatiotemporal relationships between urban waterfront vibrancy and external influences of an urban facility point of interest (POI), which can be quantified by the geographic field model. Regression results can show temporal diversity of the influences of POIs on waterfronts, which indicate people’s preferences for various types of waterfronts. Here, we innovatively applied the implicit temporal behavioral message of social media data to offer new perspectives on the research of waterfronts, revolutionizing the way we study people’s dynamic behaviors and understand the variation characteristics of several time series of people’s preferences for urban waterfronts, bridging the gap in the literature.
Our contributions can be summarized as follows:
- (1)
- We develop a methodological framework to explore different temporal contexts of waterfront vibrancy and the variation characteristics of several time series of people’s preferences for urban waterfronts with the combination of POIs, which can give insight into where, when, why, and to what extent humans converge in urban waterfronts. This study allows other researchers to observe waterfronts from a dynamic perspective.
- (2)
- On the basis of social media data in waterfronts from Wuhan, China, we classify four temporal types of waterfronts and discuss the relationship between these types and people’s behavioral preferences at various times. The contribution could deepen our understanding about the temporal variation of the characteristics of people’s behavioral preference for waterfronts in Wuhan, which can serve as references for designers to make better waterfront constructions, such as road traffic organization modes, in-depth research of configuration of public service facilities, and green landscape designs to satisfy the needs of citizens as well as administrative departments to implement the corresponding policy to improve the vitality of waterfronts and promote urban sustainable development.
The remainder of this paper is structured as follows. After a brief literature review in Section 2, we describe the basic social and natural background of the research area, the data content used in this study, the preprocessing stage, and the methodology of the study in Section 3. Results are reported in Section 4. The paper concludes with a discussion of implications of our findings (Section 5) and general conclusions (Section 6).
2. Literature Review
In this section, we provide a brief review of some relevant research about understanding human mobility using emerging mobile phone data and hotspot detection analyses.
Urban waterfronts have experienced the effects of boom to bust [2] and now revitalization plans for urban waterfronts are important contents in urban planning [3]. Therefore, a considerable amount of previous research studied successful cases of revitalization of urban waterfronts in some developed countries [8], including the design and landscape construction methods of urban waterfront spaces [9], development modes [10,11,12], and the policies on the treatment of waterfront environments [13,14]. Since we entered the 21st century, studies on waterfronts and their influences have gradually enriched, such as the openness characteristics of lakefronts in Wuhan central urban area [2], using accessibility to assess a riverfront rehabilitation project [15], taking leisure function into consideration during planning missions for waterfront spaces [16,17], and some integrated waterfront cultural planning of some waterfronts with rich cultures [18,19]. With the enhancement of ecological awareness, the ecology of urban waterfronts became an area of focus. For example, some researchers explored the temporal and spatial characteristics of waterfronts [20] and the influence of urban expansion on land use in urban waterfronts and their water system [21,22,23]. Recently, the evaluation of an urban waterfront’s value, such as the relationship between waterfront landscape and the prices of the surrounding residential areas [24], has also been included. However, these studies just focused on the revitalization and development of the waterfront itself, and not from the angle of people’s behavior. Therefore, this study combines waterfront vibrancy with people’s behaviors.
With the environmental improvement and the rise in the standard of living, a few scholars became aware of the lingering behaviors of people in waterfronts and influence elements [7], however, they only used traditional investigation methods in the research field of waterfronts.
Recently, the development of modern information and communication technology is offering people richer information environments than before [25], exerting a significant influence on decision making by people [26]. The research emphasis on urban public spaces has switched to the relationship between human behavior and the environment. Social media data have been applied by researchers to explore the urban vibrancy and the temporal characteristics of human behaviors [27,28]. The development of mobile technology provides several opportunities for the research on temporal characteristics of waterfronts and people’s behavioral preferences in these places, thereby bridging information gaps in traditional surveys [29,30]. Compared with traditional data, check-in data are more seamless, more accurate, and easier to be shared. Not only can these data help decrease the research costs [31], but also provide value to researchers because mobile data can reveal real occurrences and patterns of human behaviors [32]. However, research on waterfronts using media data is rare and in an embryonic stage, and it mainly concentrates on using check-in data alone to reflect the quantitative relationship analysis between people’s behavior and waterfronts’ vibrancy. Although, a few studies have attempted to combine social data with urban spatial potential to study the relationship between waterfronts and human settlements [33]. Scholars have also noticed gender differences in check-in behavior [34,35]. Thus, this study aims to take full advantage of social media check-in data with the combination of POIs to explore the variation characteristics of several time series of waterfront vibrancy and people’s preferences for urban waterfronts.
3. Methodology
3.1. Study Area
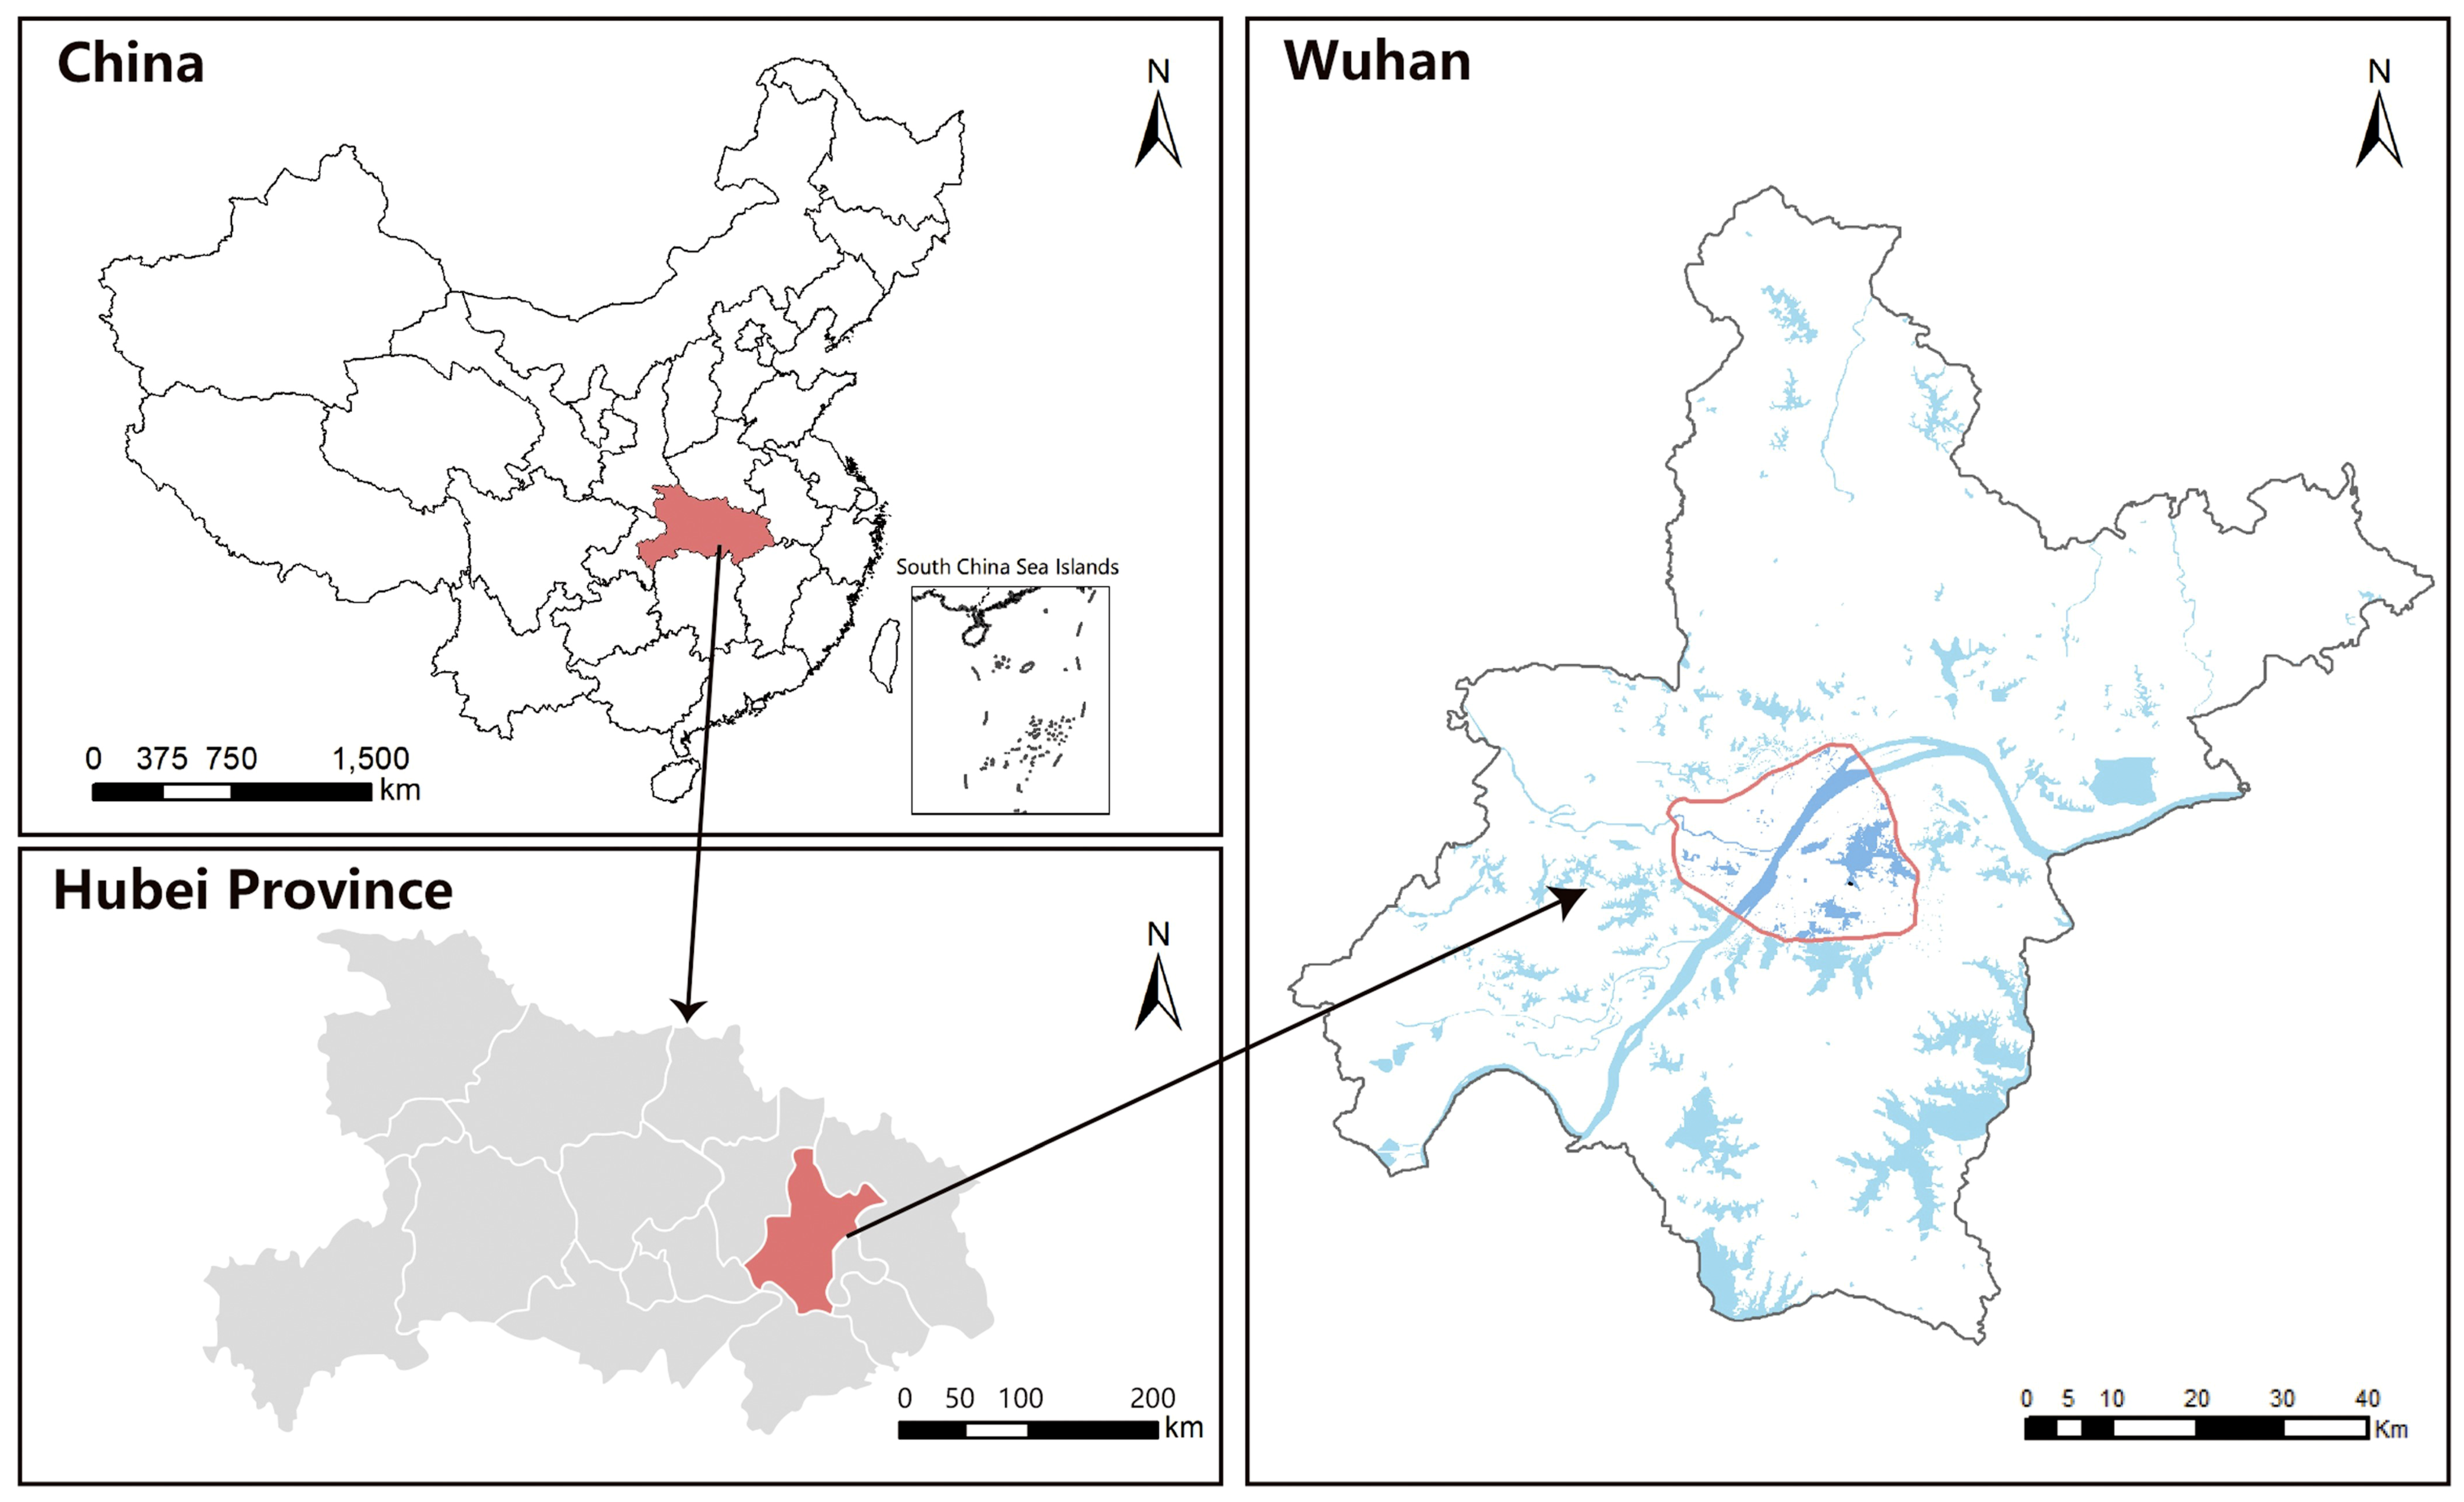
The study area is concentrated in Wuhan (113°41′–115°05′ E, 29°58′–22°31′ N), within three lake waterfronts (Figure 1). Wuhan is the capital city of the Hubei Province. Wuhan is located in Central China, the eastern part of the Jianghan Plain, and the middle of the Yangtze River Delta and is the seventh largest city in China, with a population of 6.6 million. The Yangtze River and Han River flow through Wuhan, geographically dividing the city into three towns: Wuchang, Hankou, and Hanyang. Wuhan has many rivers, lakes, and ports, thus gaining the name ‘river town’ or ‘the city of a hundred lakes’. The bodies of water account for 25% of the total urban area. In 2012, a total of 166 lakes of various sizes were found in Wuhan [36], and water is the unique feature of this city. In the transitional period of social development and in response to national strategy, Wuhan is changing the layouts and developments of urban waterfronts, devoted to explore a way for the ecological city construction of metropolis to let waterfront spaces come back as the core of urban life [37].
The Third Ring Road in Wuhan City is found near the dividing line of urban and suburban areas, and its total length is 91 km [38]. Given that the city within the Third Ring Road has a mature development, Sina Weibo users and the POI data are mainly distributed in the area. Thus, this research is focused on the waterfront area within the Third Ring Road.
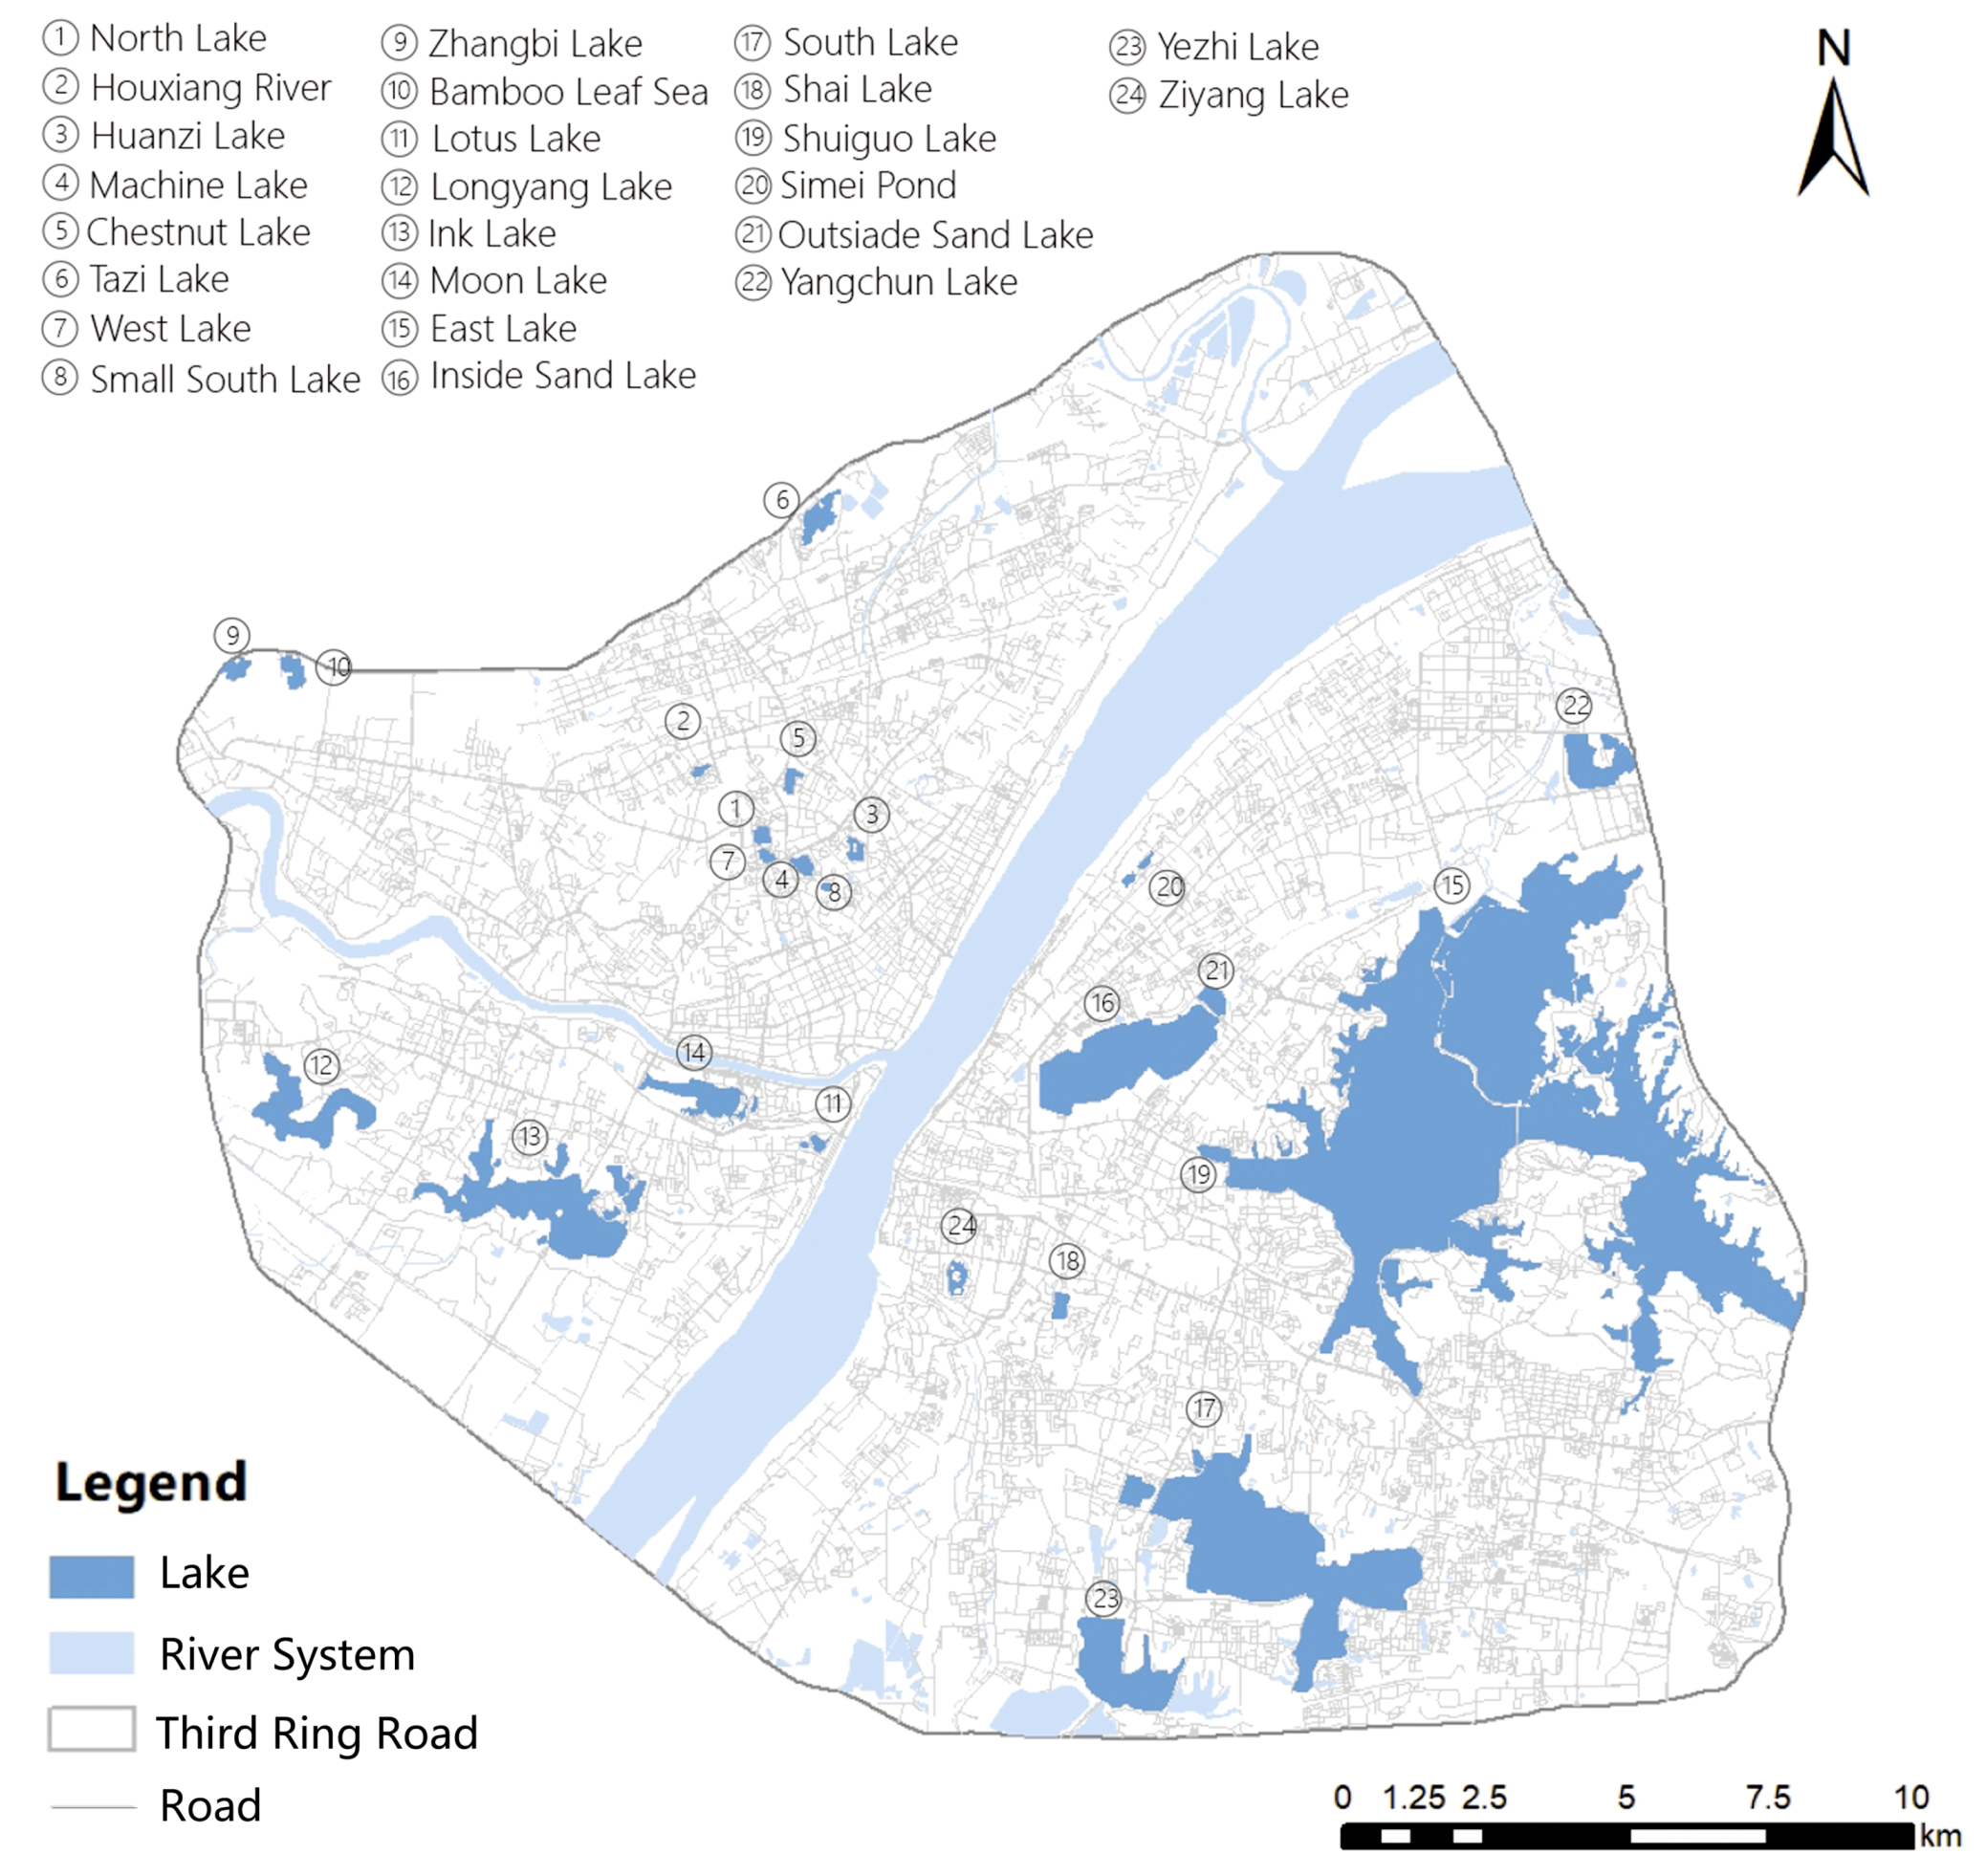
According to the Regulations of Wuhan Municipality with regard to the protection of lakes revised in 2015, a total of 27 lakes are located in the central urban area of Wuhan. This research will use the 24 lakes within the Third Ring Road, except for the South Taizi Lake, Triagle Lake, and North Tazi Lake, which are situated outside the Third Ring Road (Figure 2).
3.2. Data Sources and Pre-Processing
3.2.1. Data Sources
Sina Weibo is a social media platform that encourages users to share, disseminate, and receive information. Users can upload pictures and videos either on the website or on the mobile app. Other users can comment with text, pictures, and videos, or use a multimedia instant messaging service. Approximately 57% of its users are located in China, and 87% of the activities on the platform occur in China. Sina Weibo is one of the most visited websites in mainland China.
We obtained check-in data points through the official open API (application programming interface, Wbm.SinaV2API, Sina, Beijing, China) of Sina Weibo, including names, geographical location (longitude and latitude), check-in time, and gender of users (27 June 2019). The data set covers Wuhan and the period from 1 January 2018 (solstice) to 31 December 2018, including 997,832 check-in times. The POI data were acquired from the China POI data network. The POI data of Wuhan City in 2018 were obtained according to administrative regions and time.
3.2.2. Data Preprocessing
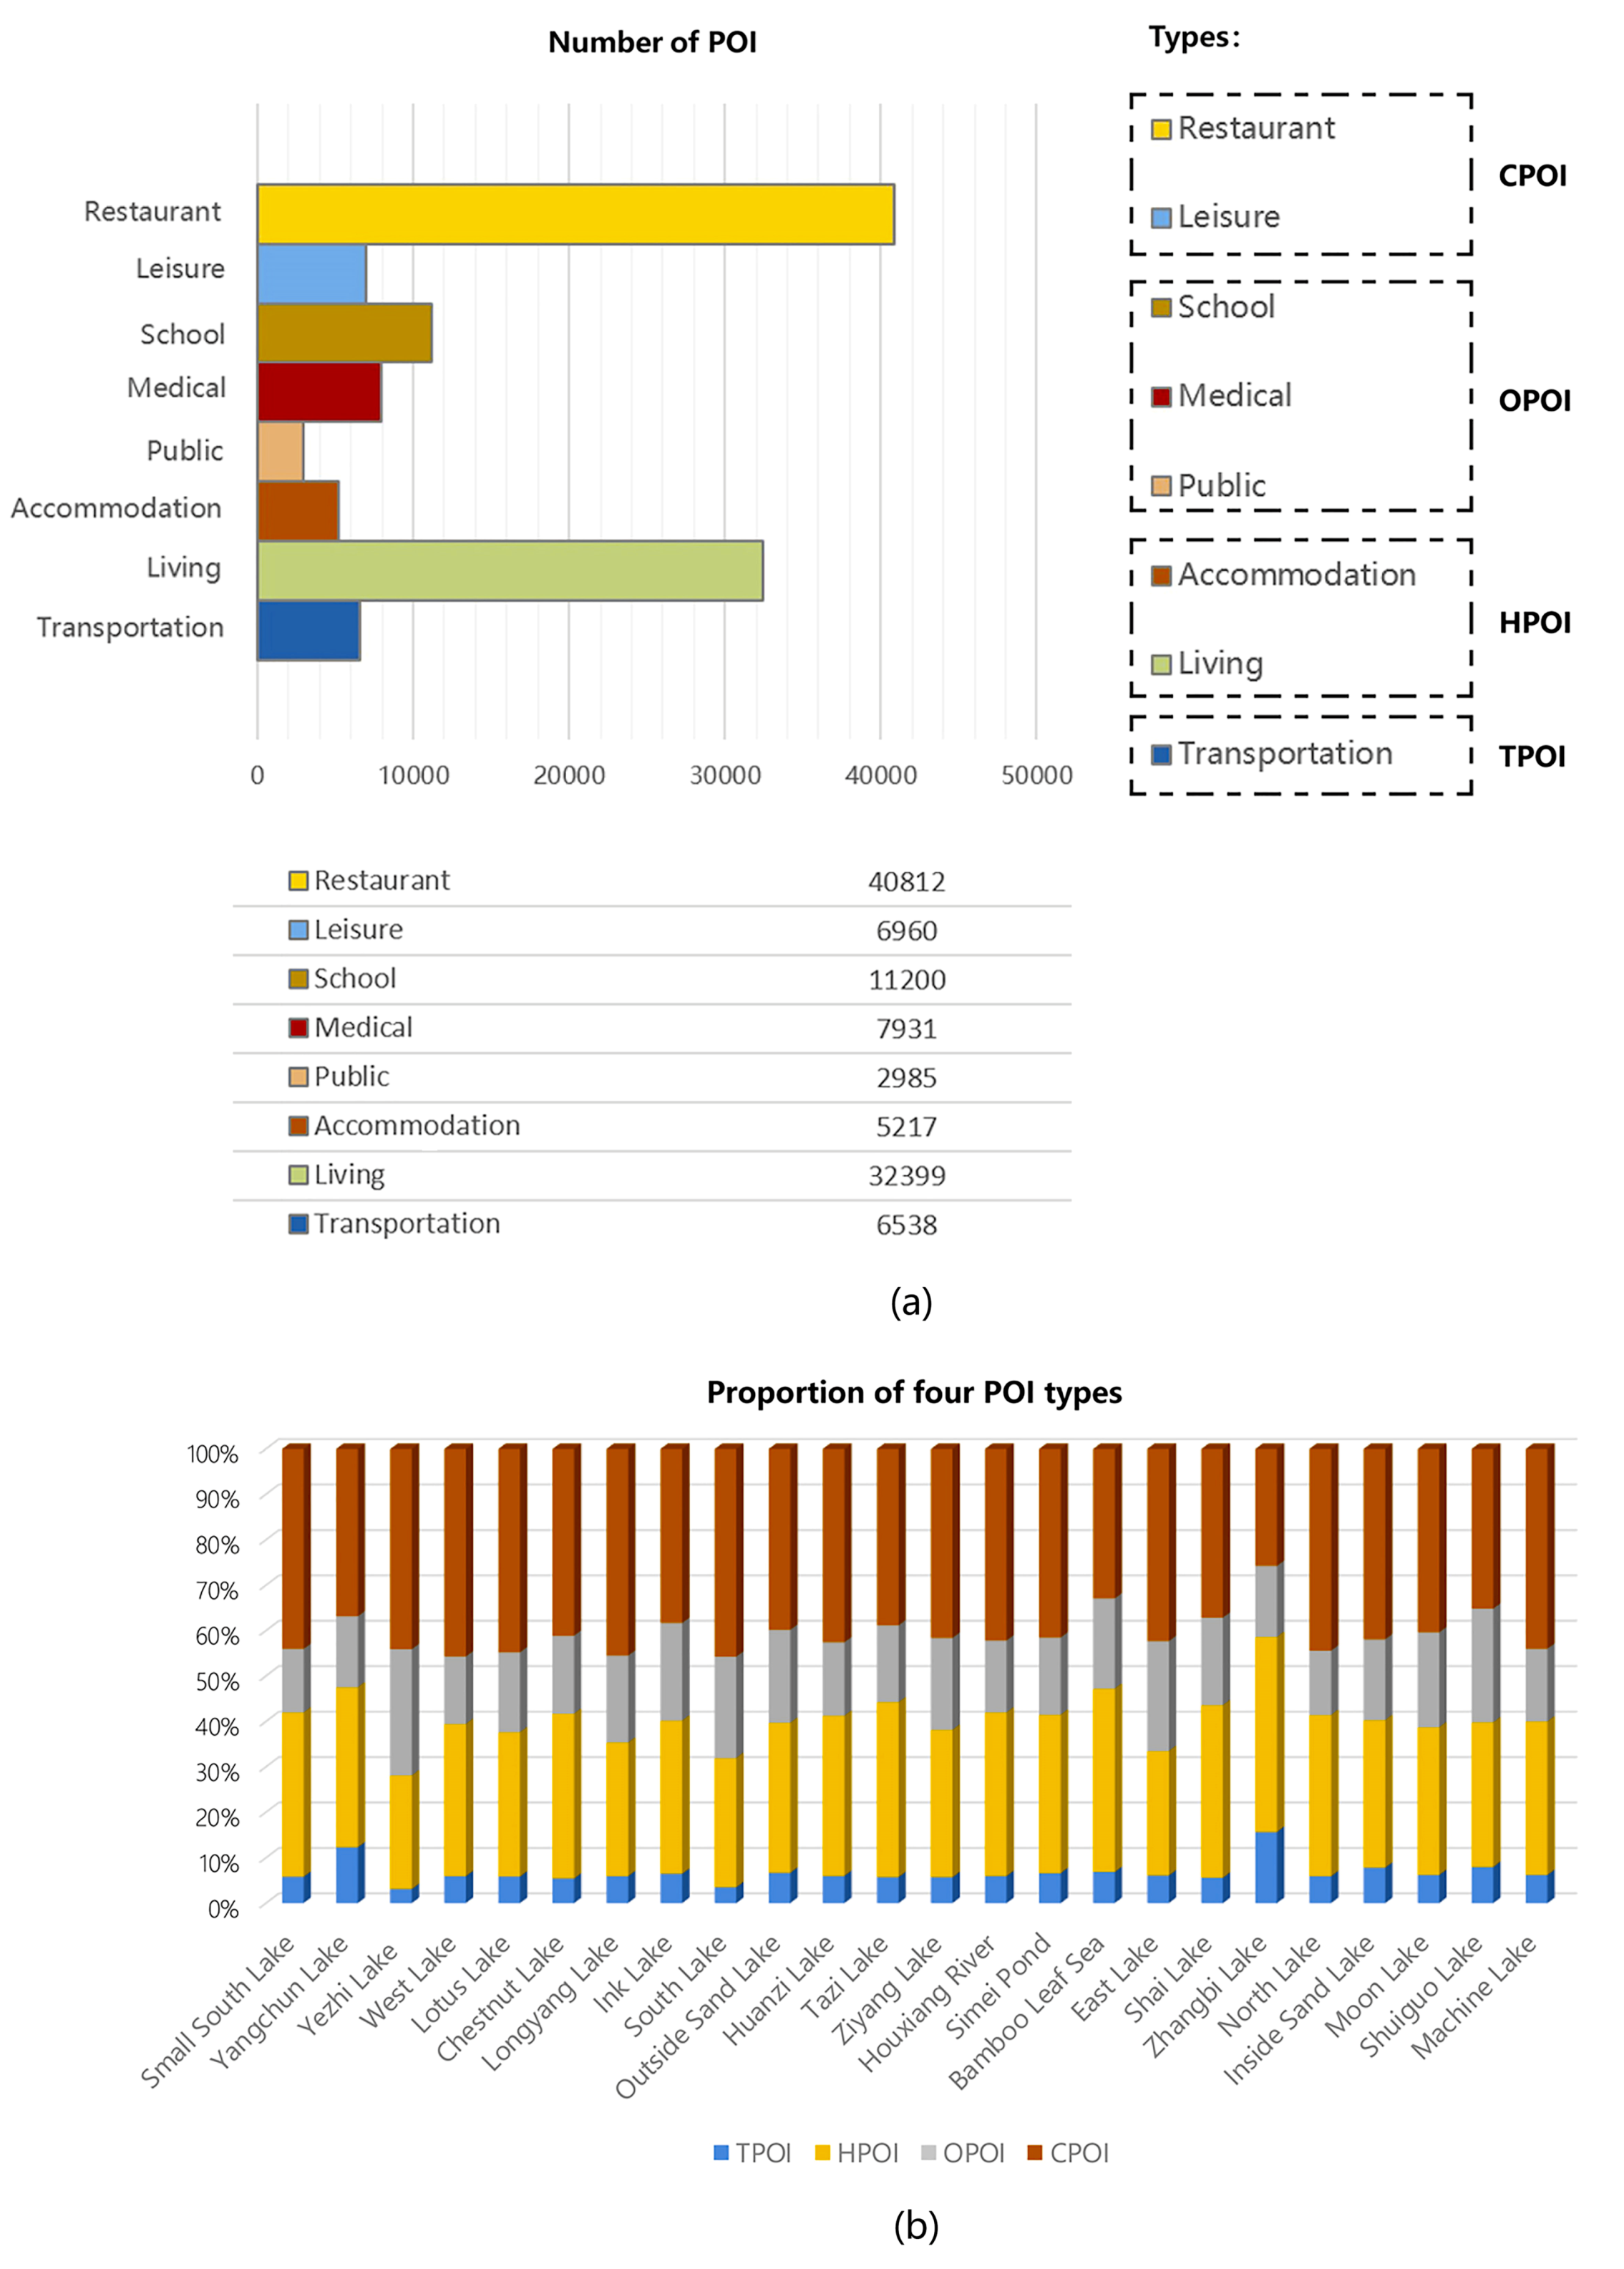
In the early stage of this study, after repeated tests using ArcGIS 10.3 (Environmental Systems Research Institute, Redlands, CA, USA), the 1200 m buffer zone of the 24 lakes within the Third Ring Road in Wuhan was rasterized into several 250 m × 250 m grids. Thus, urban waterfronts in Wuhan were divided into 3448 grids, and each grid was used as the analysis unit to reflect the characteristics of waterfronts on a fine scale [39]. The check-in data obtained from Sina Weibo were intercepted in grids according to the geographic coordinates. POIs within the Third Ring Road were cleaned and sorted into four categories, namely, consumption-related POI (CPOI), public service-related POI (OPOI), traffic-related POI (TPOI), and housing-related POI (HPOI). CPOI includes catering services, shopping services, life services, and sport leisure services. OPOI includes schools and hospitals, whereas HPOI includes residential districts and residential services, such as hotels. TPOI consists of bus stations, railway stations, and airports, among others.
Through these procedures, 379,977 check-in data points remained. Furthermore, after the reclassification of eight types of POIs, CPOI was predominant in terms of quantity and most waterfronts lacked TPOI (Figure 3).
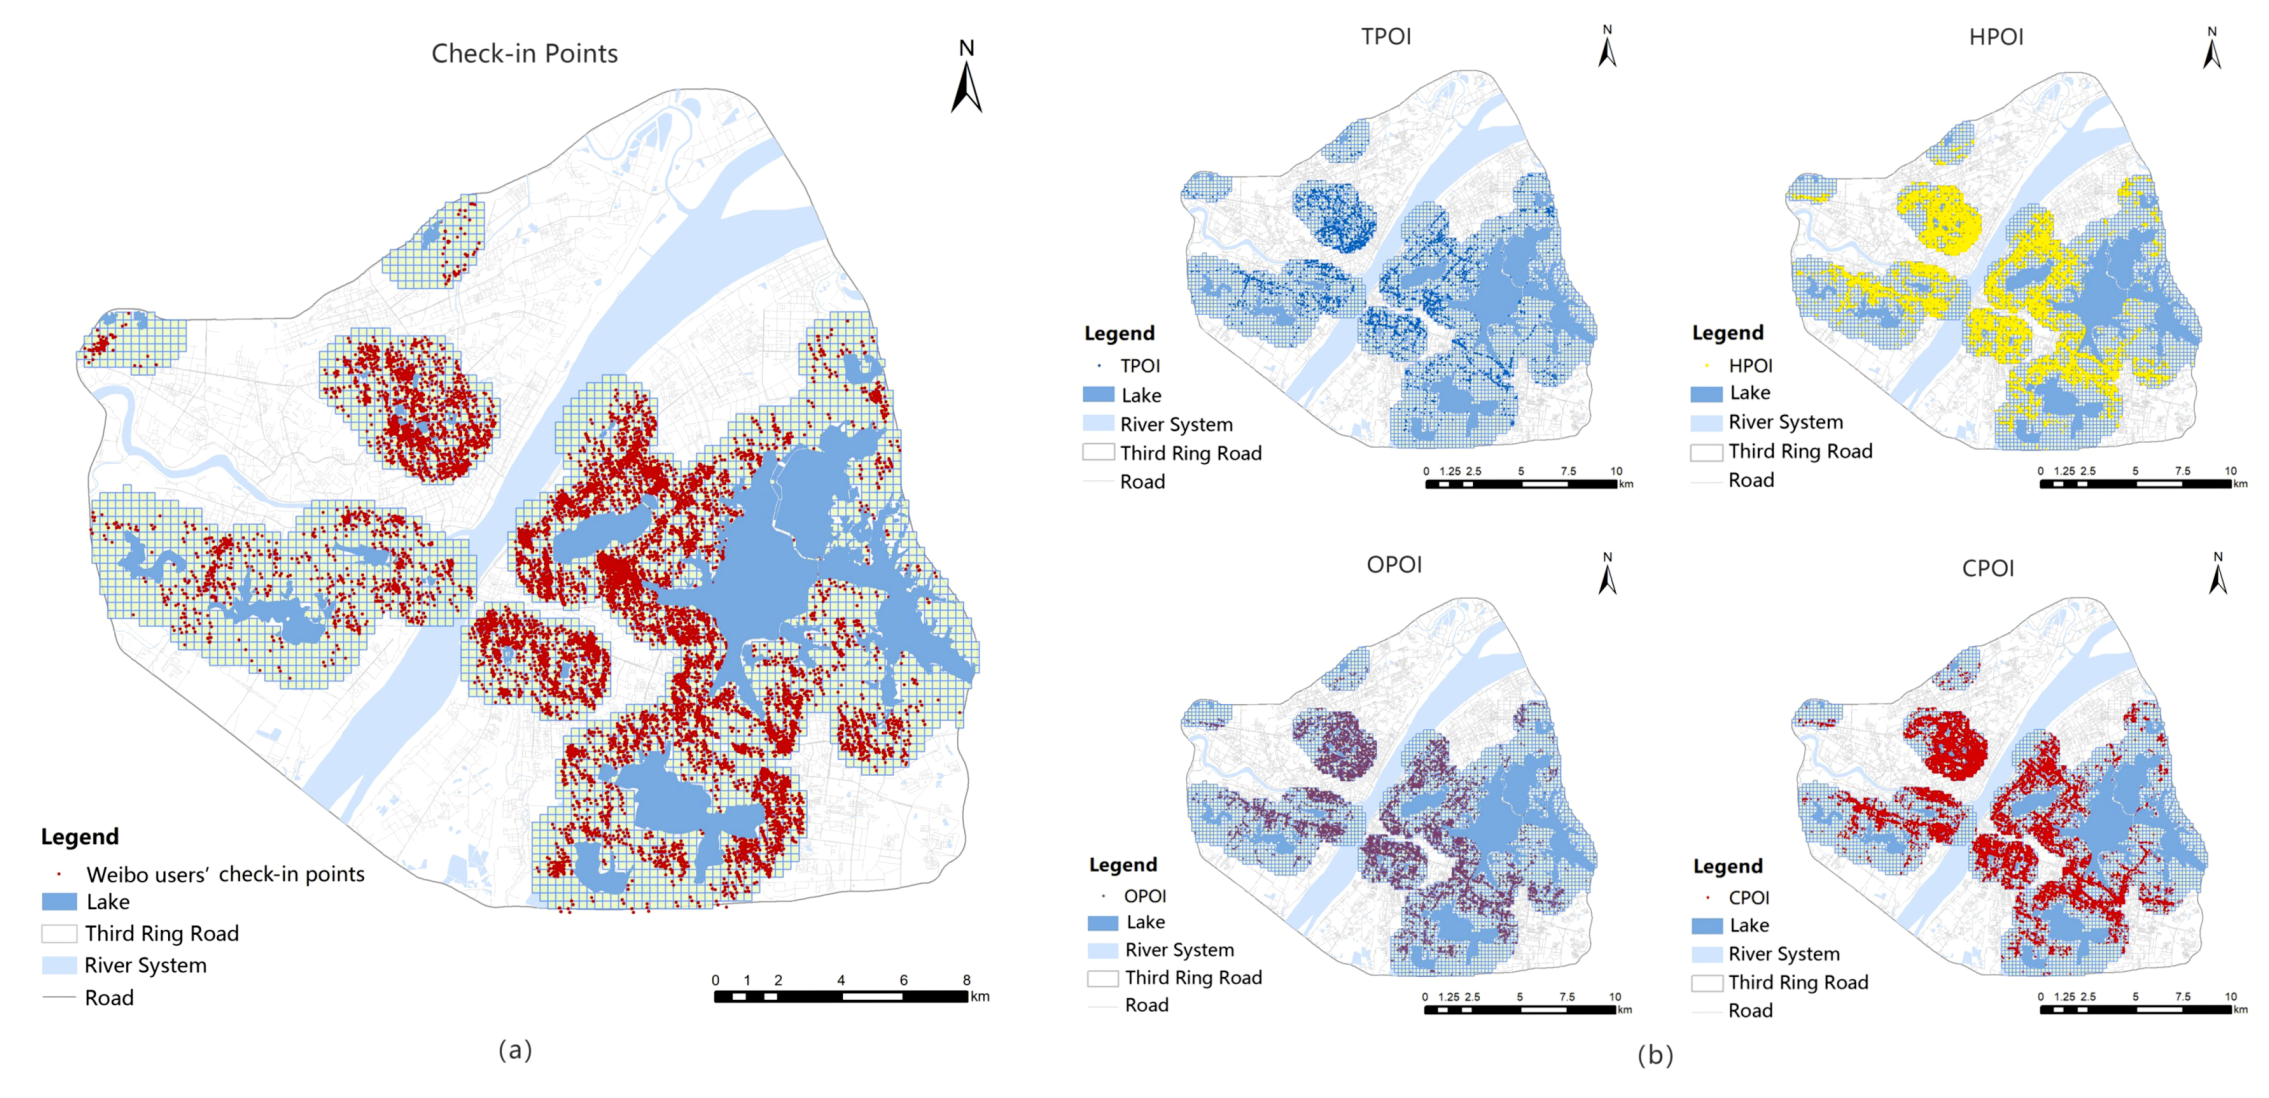
The POIs and check-in data were imported into ArcGIS 10.3 and were visualized (Figure 4 and Figure 5). After the pre-processing stage, such as coordinate correction, a distribution map of check-in and POI points in the study area was generated to reflect the vibrancy of urban waterfronts and facility POIs. In general, both check-in data and POI points were mainly distributed in the Wuchang Town, especially those areas near East Lake, showing that this town was the most active area. The next most active area was Hankou Town.
3.3. Methods
3.3.1. Seasonal Index Analysis Method of Time Series Data
A time series is a series of data points indexed (listed or graphed) in order of time. Depending on the time to be analyzed, the time in the time series can be based on year, season, month, week, and so on. The seasonal index analysis method of the time series data can be adopted to estimate the seasonal indexes of each season, which can be used to analyze the temporal patterns of waterfront vibrancy (season, month, week, holiday, and weekend) [40].
The extracted data were calculated and analyzed using MS Excel 2016 (Table 2). The first step of this study was to explore the temporal patterns of waterfront vibrancy by analyzing the seasonal indexes, which can be the basis of the classification of urban waterfronts in the following step.
3.3.2. Kernel Density Estimation (KDE)
Kernel density estimation (KDE) is a popular spatiotemporal investigation method used to observe the features of location (i.e., destination and time) comparative to each other [41,42,43]. It is a statistical method for nonparametric density estimation [44], which is a generalization of Rosenblatt [45] and Parzen’s [46] idea of histogram density estimation. When a histogram is used for density estimation, the histogram is always a discontinuous step function, even if the random variables are continuous. Thus, KDE can solve this shortcoming. The algorithm functions by setting the search scope (window) to produce a smooth density surface that signifies the density of the point group. The central grid of the window gives the weight of each grid unit to an outward grid according to the principle of anti-distance weight. Moreover, the weights and density values are the sum of kernel density value that belongs to the central grid in the window.
To measure the density of waterfront check-in points at point x, let be a density function at geolocation x.
where x represents the geolocation (longitude and latitude) of the check-in dataset 1 < i < n, and h represents the bandwidth when the density estimation algorithm functions. In KDE, bandwidth is an important parameter [13]. Although KDE has many different mathematical forms in practical applications, as long as the bandwidth is determined, the influence of kernel functions in various mathematical forms on kernel density is small [47]. Bandwidth h is dependent on the resulting density estimate , whereas X is the total number of check-in points in the dataset, j points to a signal geolocation, K is a standard normal density function, ‖ denotes the Euclidean norm [48,49,50], and is the geolocation of check-in j.
The log-probability data-driven option is used to assess the value of bandwidth h in constructing the density estimate below.
where and are data points in the dataset X. A high value of L(h) is better because it shows that a high probability is being allocated to new, but invisible, data. Hence, a simple method for bandwidth selection is used to perform a grid-search on h using a validation set.
In this study, ArcGIS 10.3 was used to conduct a core density analysis and relevant mapping of check-in points of Sina Weibo users.
3.3.3. Geographic Field Model (GFM)
In the process of choosing independent variables, judging the appeal of a POI on numbers alone is inappropriate. The accessibility of the POI around waterfronts plays an important role in attracting users. Considering that distance is an important component of accessibility [51], this article applied the geographic field model to quantify the external effects of POIs, which can be defined as the appeal of various POIs. Based on this model, each type of POI’s individual f values in each grid was superimposed as quantified independent variables to participate in the calculation.
A geographic field is an abstraction of the external influences of a spatial object, which includes points, lines, and polygons, whose influence degree on other objects, such as, the intensity of the field gradually decays from the origin to the surroundings [52]. Therefore, the intensity of a geographic field is quantified by a function of distance. When the distance is zero, the intensity is the highest. This model is commonly used to study the evolution of urban land and residential development [53].
Generally, an intensity function is a continuous and monotonically decreasing function. Common functional forms include linear functions, logarithmic functions, and exponential functions. Owing to its common application and ease of use, the linear distance decay assumption was employed in this study. The linear intensity function with a limited boundary can be expressed as follows:
where is the field intensity at location , is the original field intensity, is the distance from to the object, is the influence range of the object, and is the relative distance measure given by dividing by . and must be predetermined when computing the intensities of the geographic fields.
Relevant research shows that the external influence of parks and other public service facilities gradually weakens with an increase in the distance. Therefore, a geographic field model was used to describe the external influences of all types of POIs. The calculation procedure is described in the following steps:
(1) Determine the original field intensity F.
The first step is to calculate the original field intensity F of POIs according to attribute value (area, quality, and functionality). For convenience, the original field intensity F of each POI in each grid is specified as 1.
(2) Determine the influence range R.
The second step is to determine the influence range R of each POI. Today, under the theoretical framework of “people first,” China has built a 15-minute life circle oriented to public service facilities [54]. Involved land and facilities have exceeded the scope of residential land, taking the influence of mixed function on urban vibrancy into account [55]. With the average walking speed of 4–5 km/h, a 15-minute walk covers a distance of 1000–1250 m, which is a convenient distance. After repeated tests using ArcGIS 10.3, the influence range R of each POI is determined as 12.
(3) Calculate path distance d and the relative distance r.
The third step is to calculate the path distance d from the POI to each lake, whose influence range contains the POI, using ArcGIS. The influence range R is then divided by the path distance to obtain the relative distance r.
(4) Calculate the effect score f.
The fourth step is to calculate the effect score f of each lake according to Equation (1).
The quantification result is an matrix, which is the basis for geographically and temporally weighted regression analysis.
3.3.4. Geographically and Temporally Weighted Regression (GTWR)
To overcome the shortage of general linear regression models, geographically weighted regression embeds the geographic location of the sample data into regression parameters and calculates local regression for each observation value and the similar observation value around it in the data. This process creates a rendered coefficient map. In previous studies, the GTWR was widely used in economic research especially in the field of spatial correlation and heterogeneity of regional economy development and trends in housing prices [54]. Recently, this model has been applied to the urban planning field to conduct research on the influencing factors of urban public spaces, entertainment, and leisure activities. The coefficients of the variables in this model can be visualized in an identifiable manner, which can provide insightful suggestions for city planners and check-in behavior analysis [56,57]. As a temporal extension of geographically weighted regression, GTWR embeds time data into regression parameters to assess the local relationships between independent and dependent variables [58]. GTWR was used in this study to calculate the local spatiotemporal relationships between urban waterfronts’ vibrancy and external influences of urban facility POIs. This model is defined as follows:
where the dependent variable refers to the vibrancy of urban waterfronts within the Third Ring Road of Wuhan, using the number of check-in records as a proxy. is the POI-related variable; is the space–time coordinates of grid ; are the longitude, latitude, and time, respectively; is the th variable for grid ; denotes the intercept value; represents a set of parameter values at grid ; and is the random error of grid .
According to the idea that the observation data close to grid has more influence on the estimation than the farther one, the regression coefficients of GTWR are estimated based on local weighted least squares. The estimated parameters can be expressed as follows:
where the weighing matrix is an n × n diagonal matrix. A Gaussian kernel function is employed to calculate the spatiotemporal weighing matrix with the greatest efficiency:
where h is named the bandwidth that produces a decay of influence with spatiotemporal distance between locations i and j. The choice of bandwidth has a great impact on the result of GTWR. Akaike information criterion (AIC) is usually used to identify the fitness of the bandwidth selection. Considering that the sample size in waterfronts is small, this study used the corrected Akaike information criterion (AICc ) to replace the AIC for more accurate results.
4. Results
4.1. Temporal Change Characteristics of Urban Vibrancy
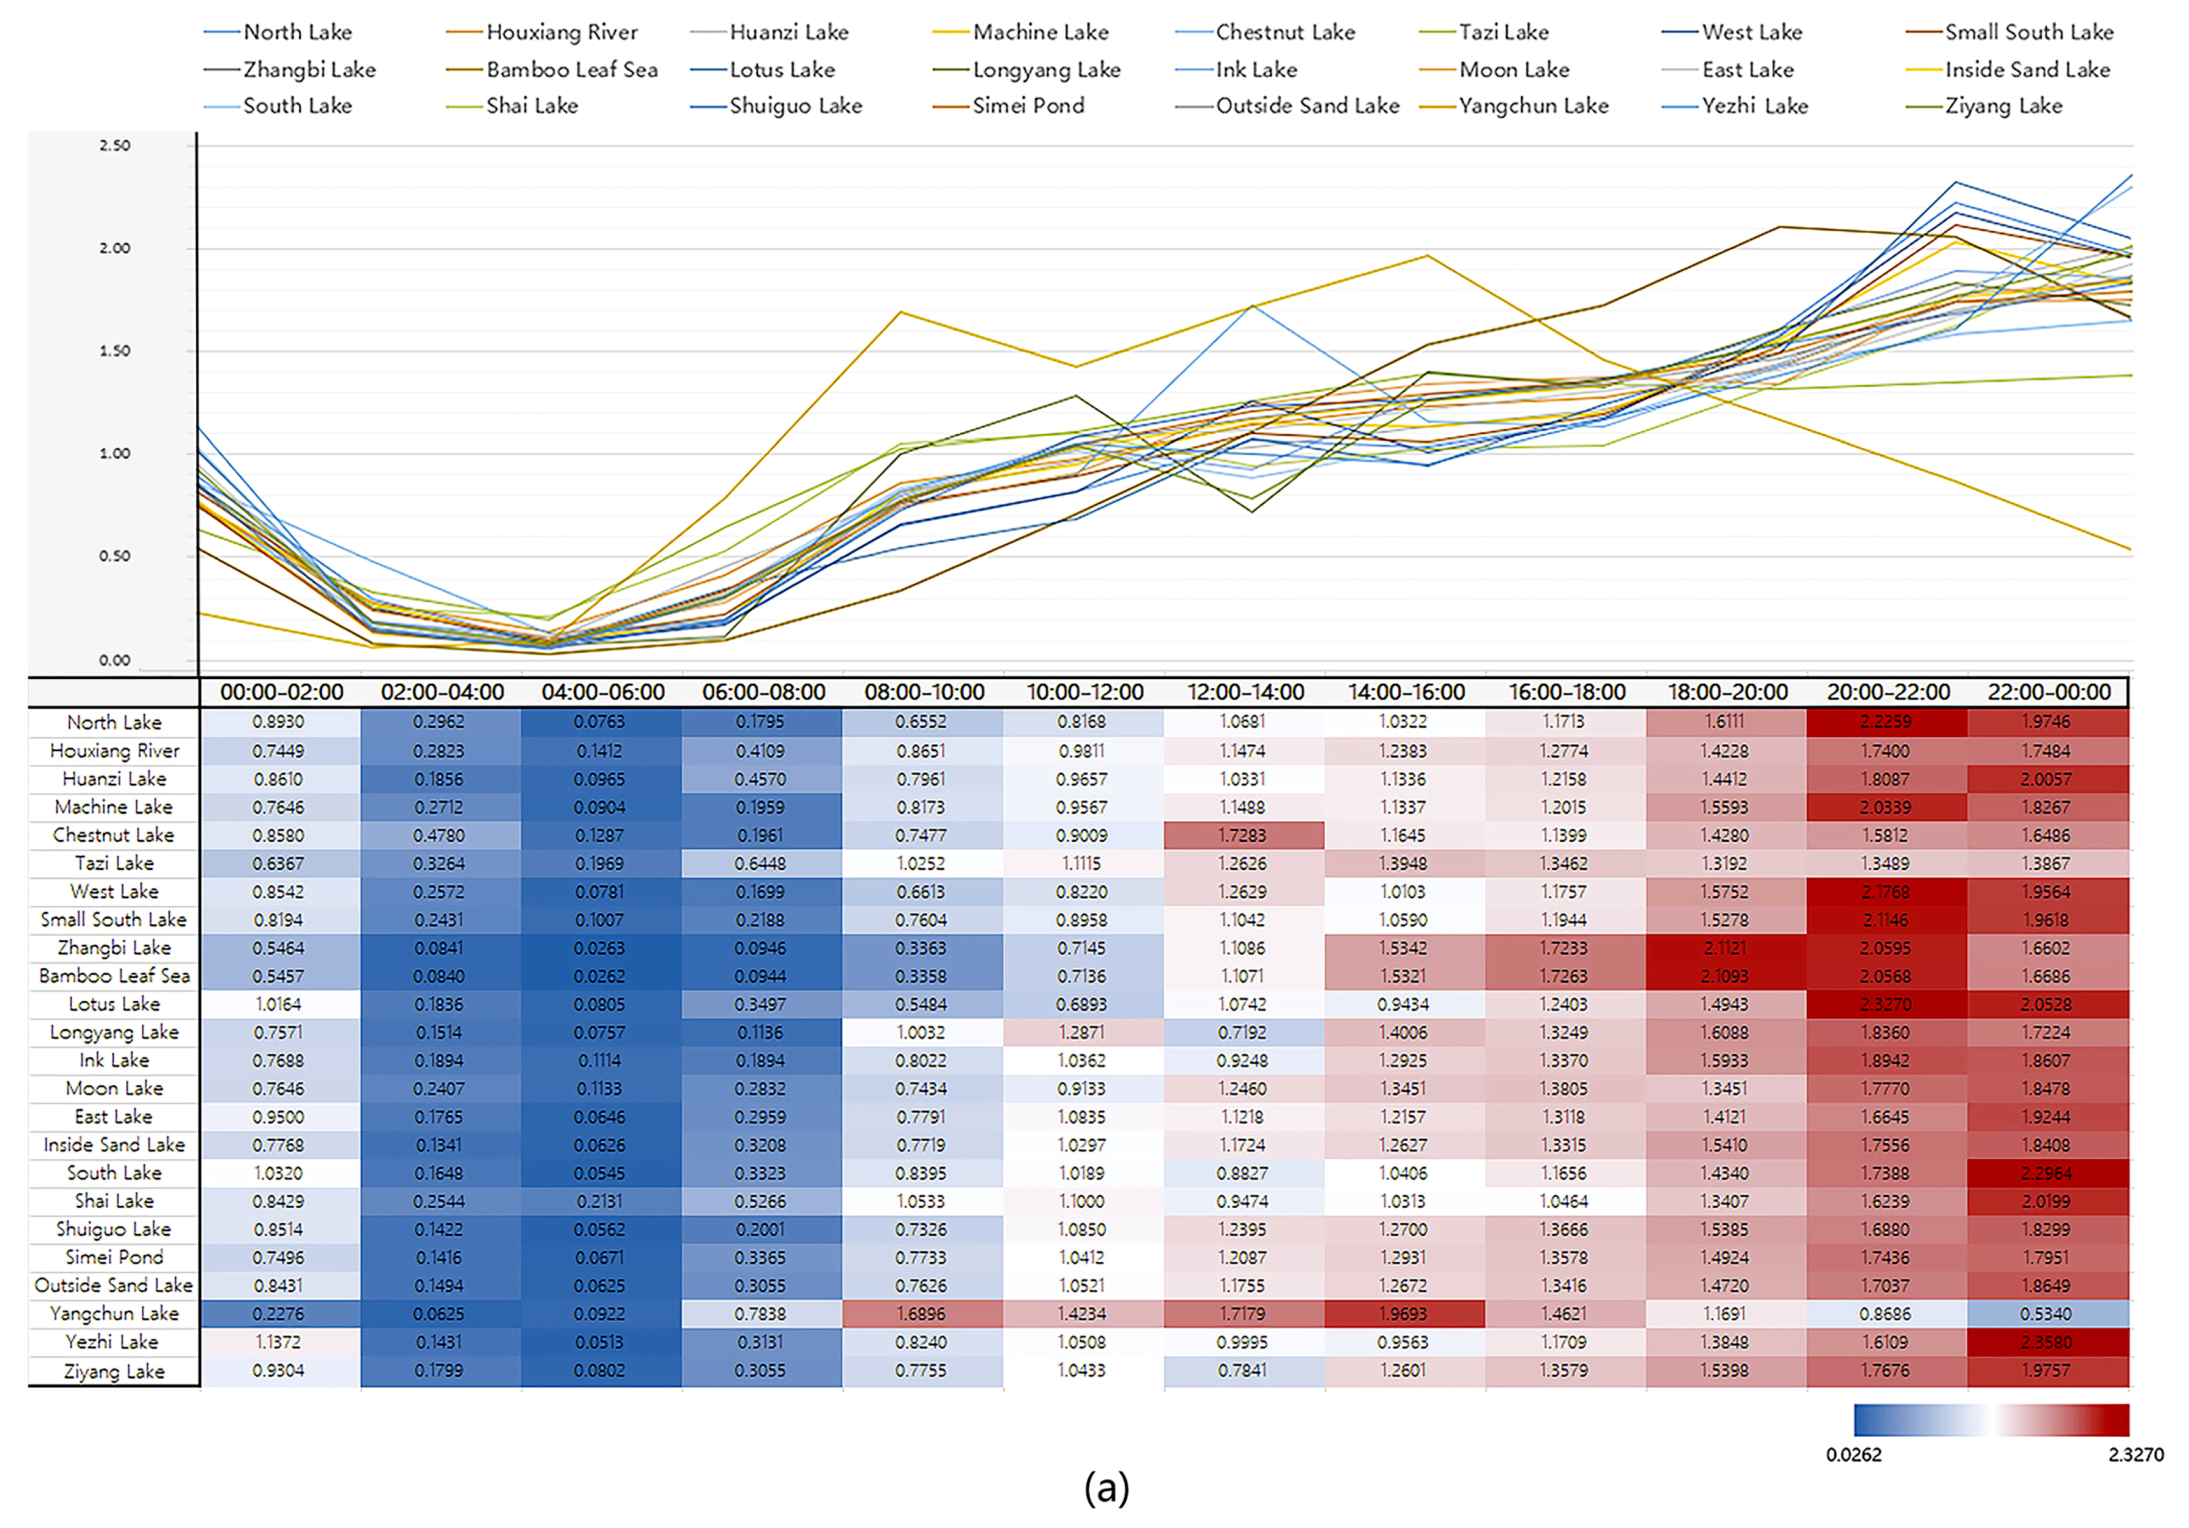
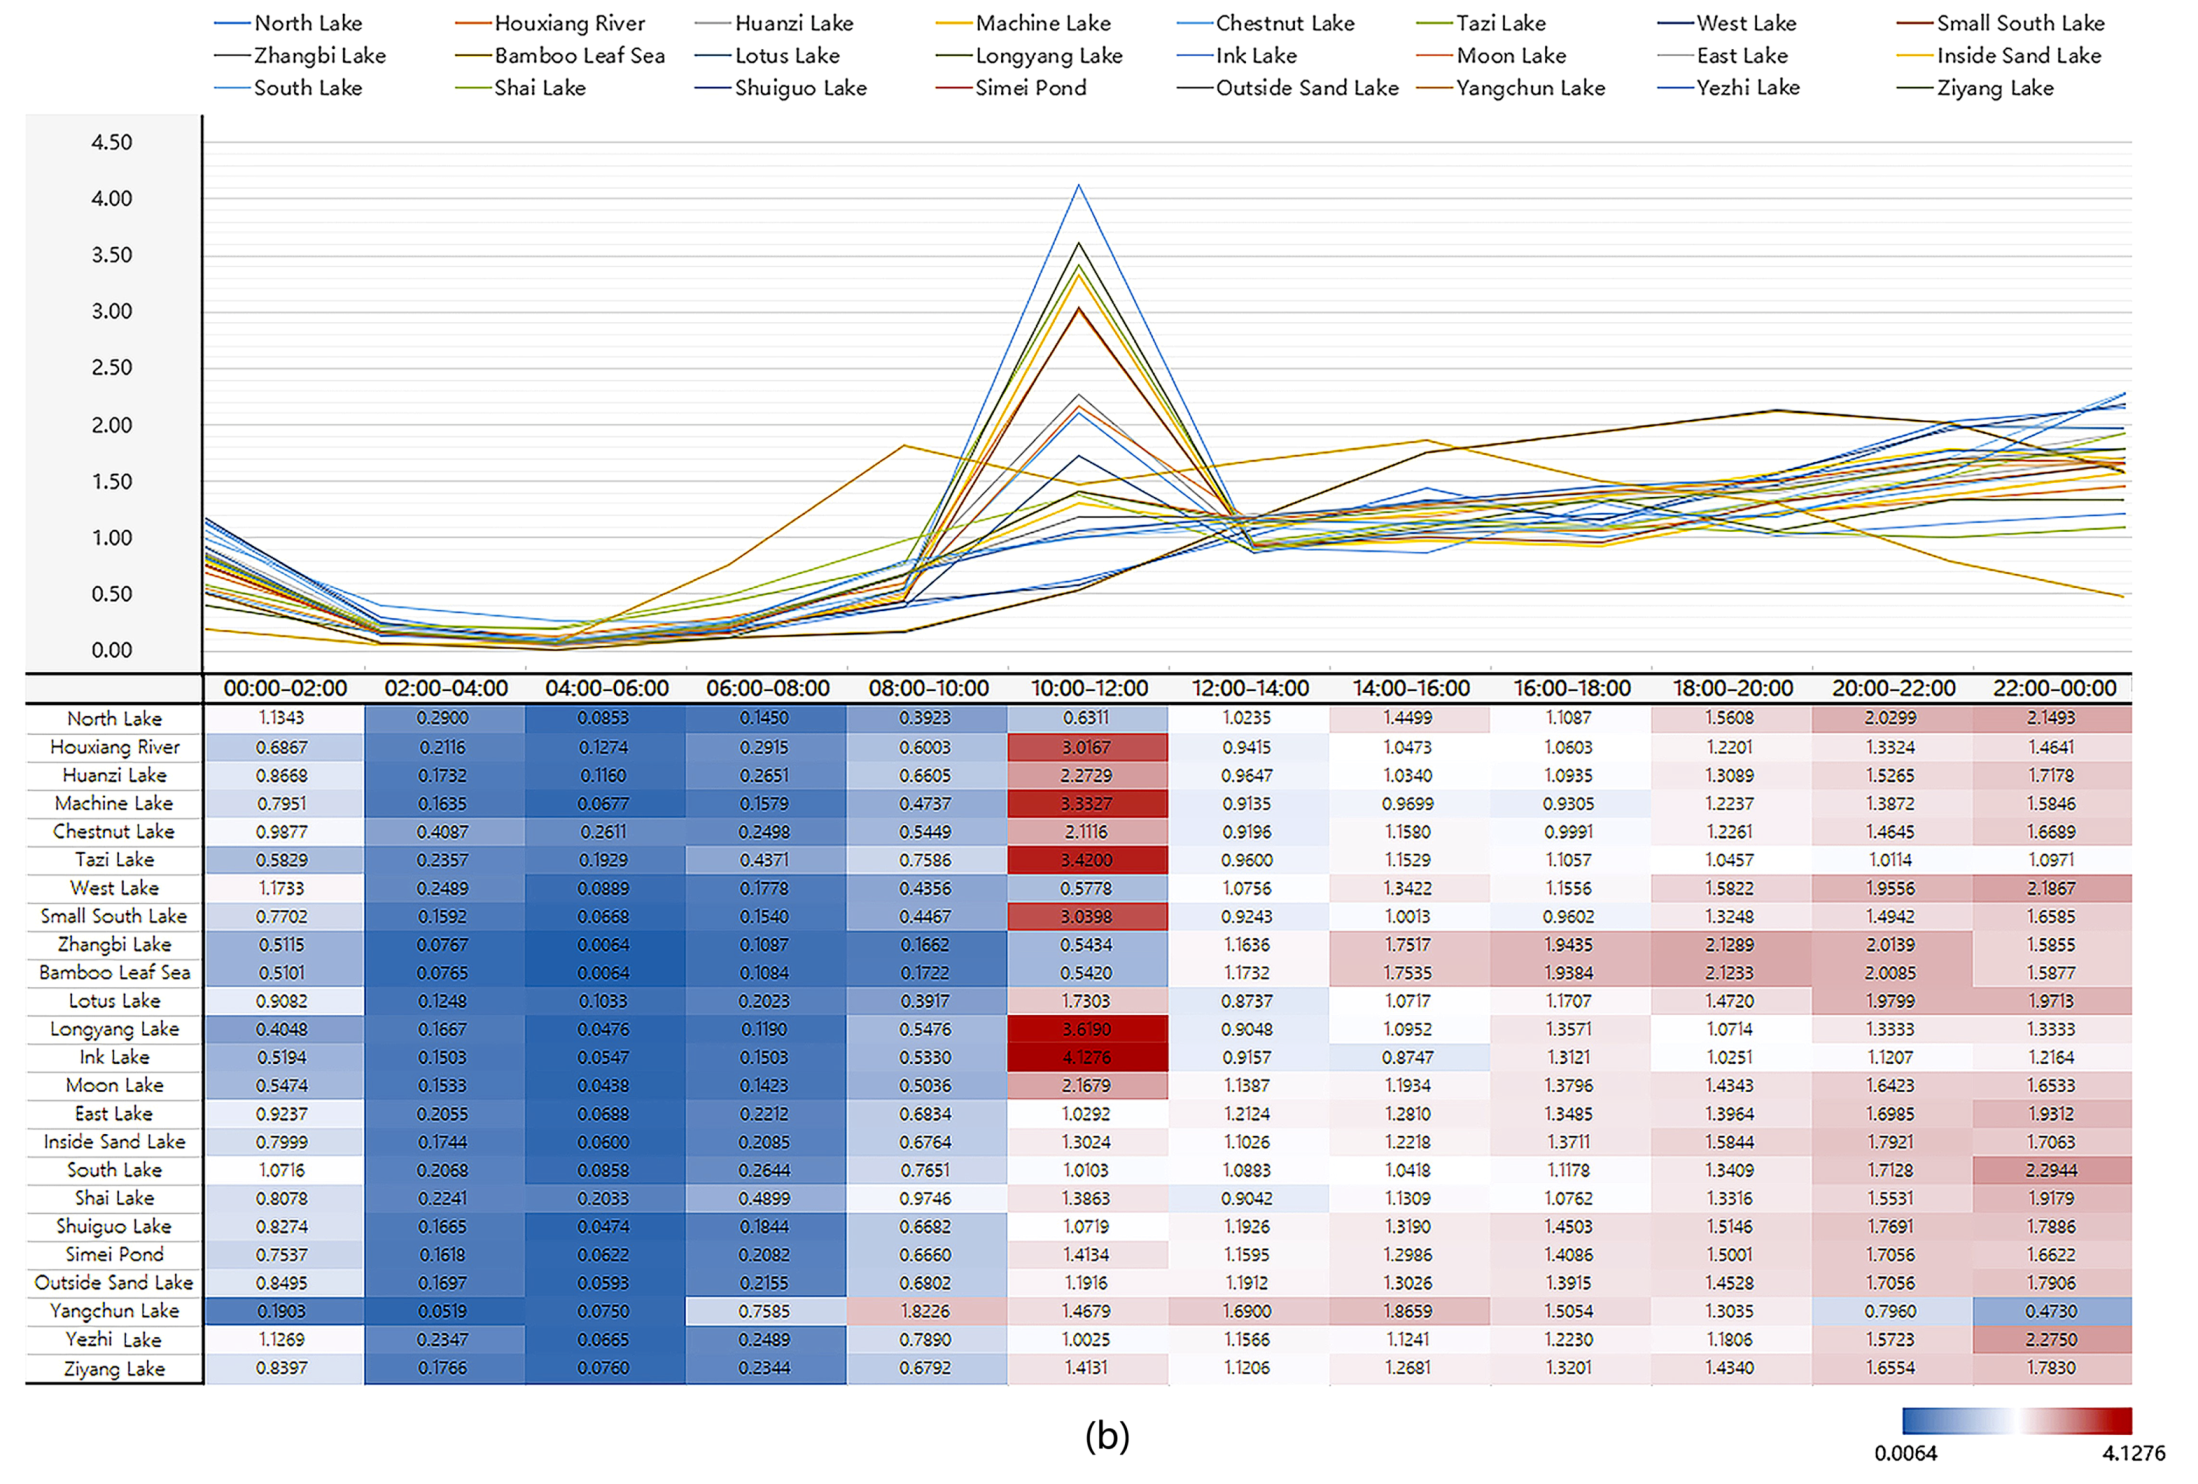
The seasonal indexes (season, month, week, and day) were counted as line charts, which showed the changing trend of check-in points in waterfronts and a thermal map was drawn for analysis (Figure 5), where colors, from blue to red, represented the vibrancy level from high to low. The dynamic analyses of waterfront visits at various times are shown in Figure 5.
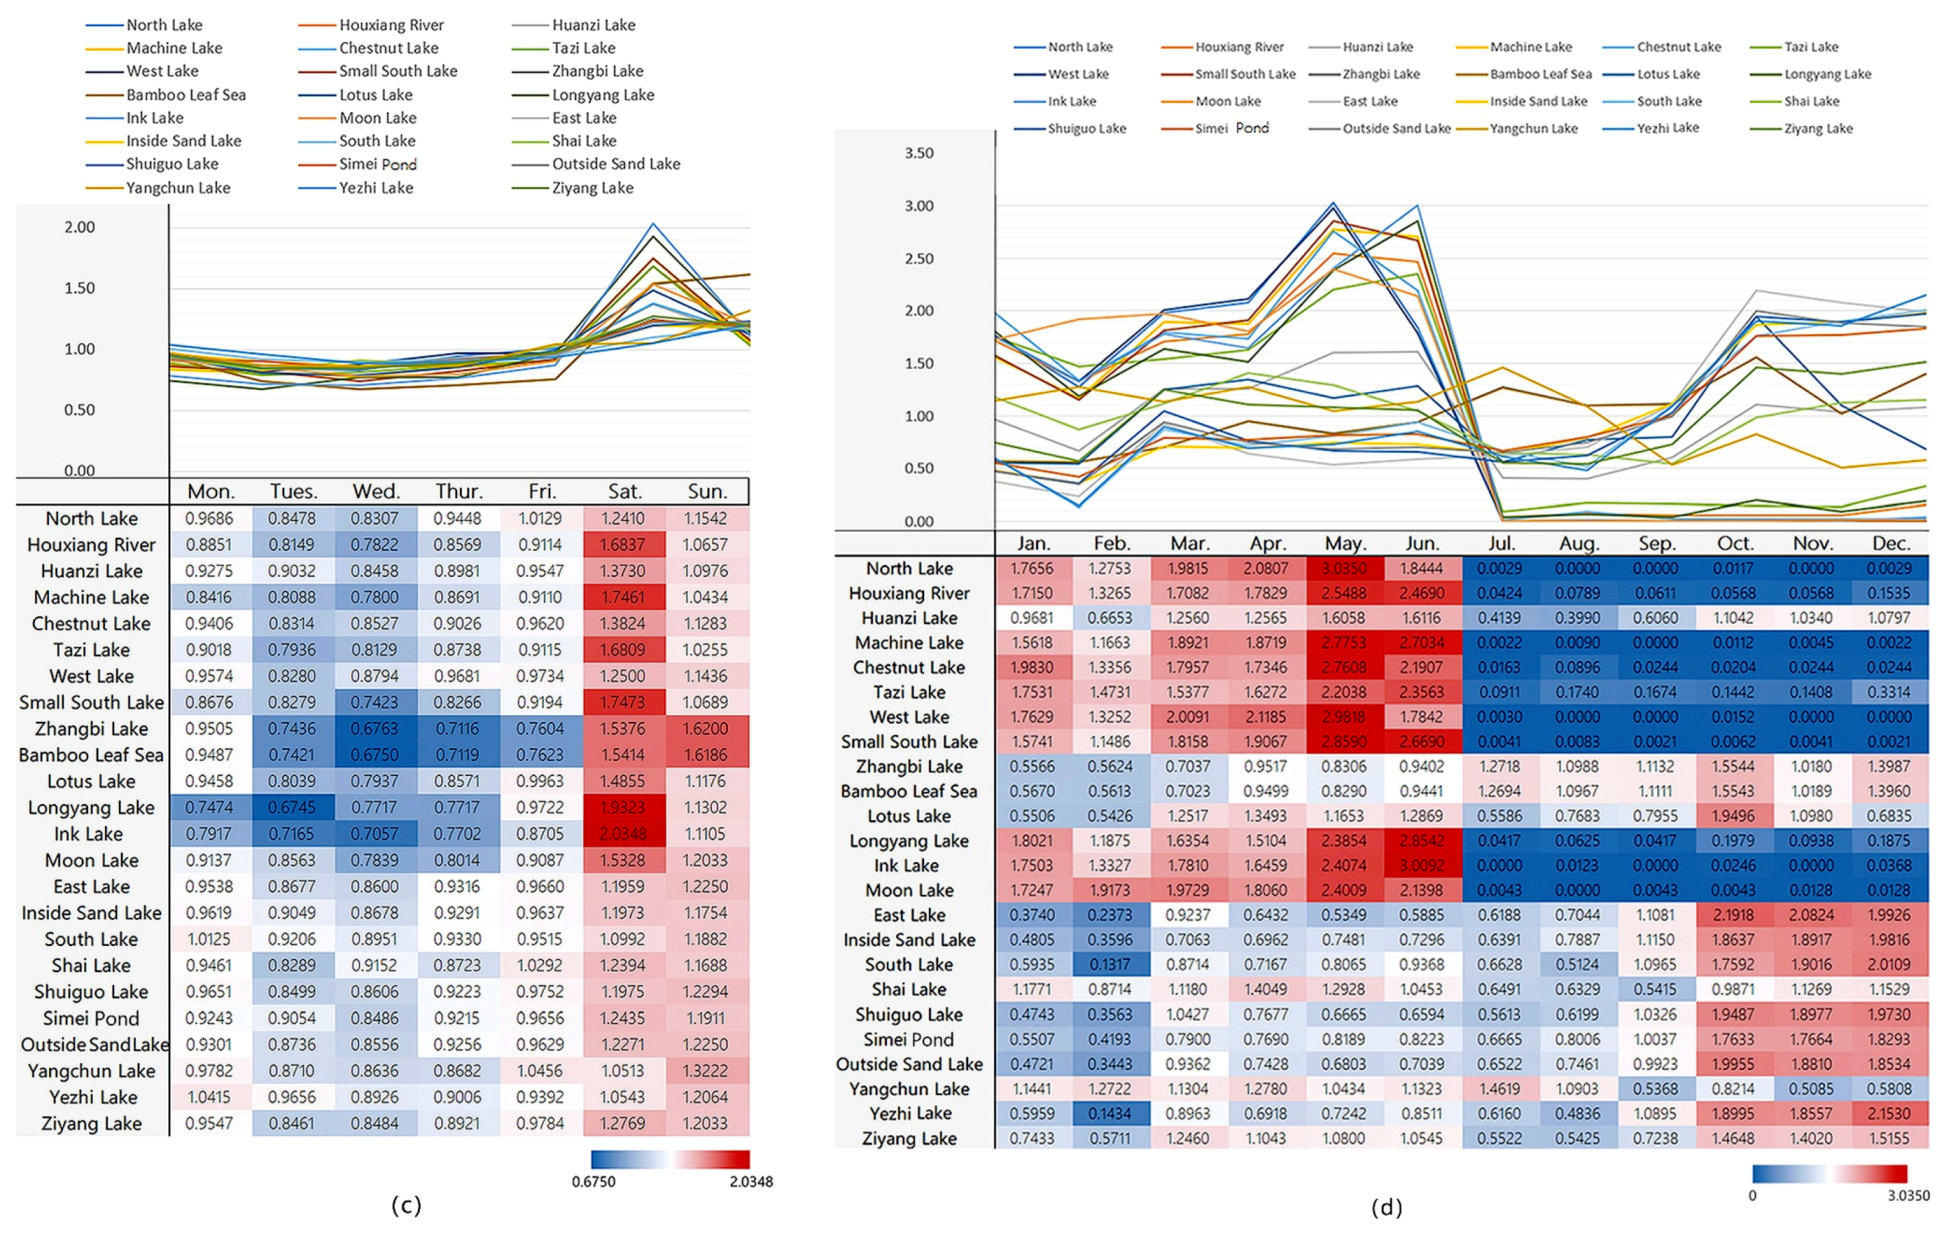
People’s activity frequencies in waterfronts were low during typical sleeping and working times and high during commuting, leisure, and dinner times. Vibrancy on weekdays continued to rise, and reached a peak at 22:00–24:00. The vibrancy of Houxiang Lake, Machine Lake, Small South Lake, Zhangbi Lake, Bamboo Leaf Sea, Longyang Lake, Ink Lake, and Moon Lake waterfronts stayed stable during the weekends, except during the peak period of 10:00–12:00 (Figure 5a,b). People also tended to visit waterfronts during weekends (Figure 5c).
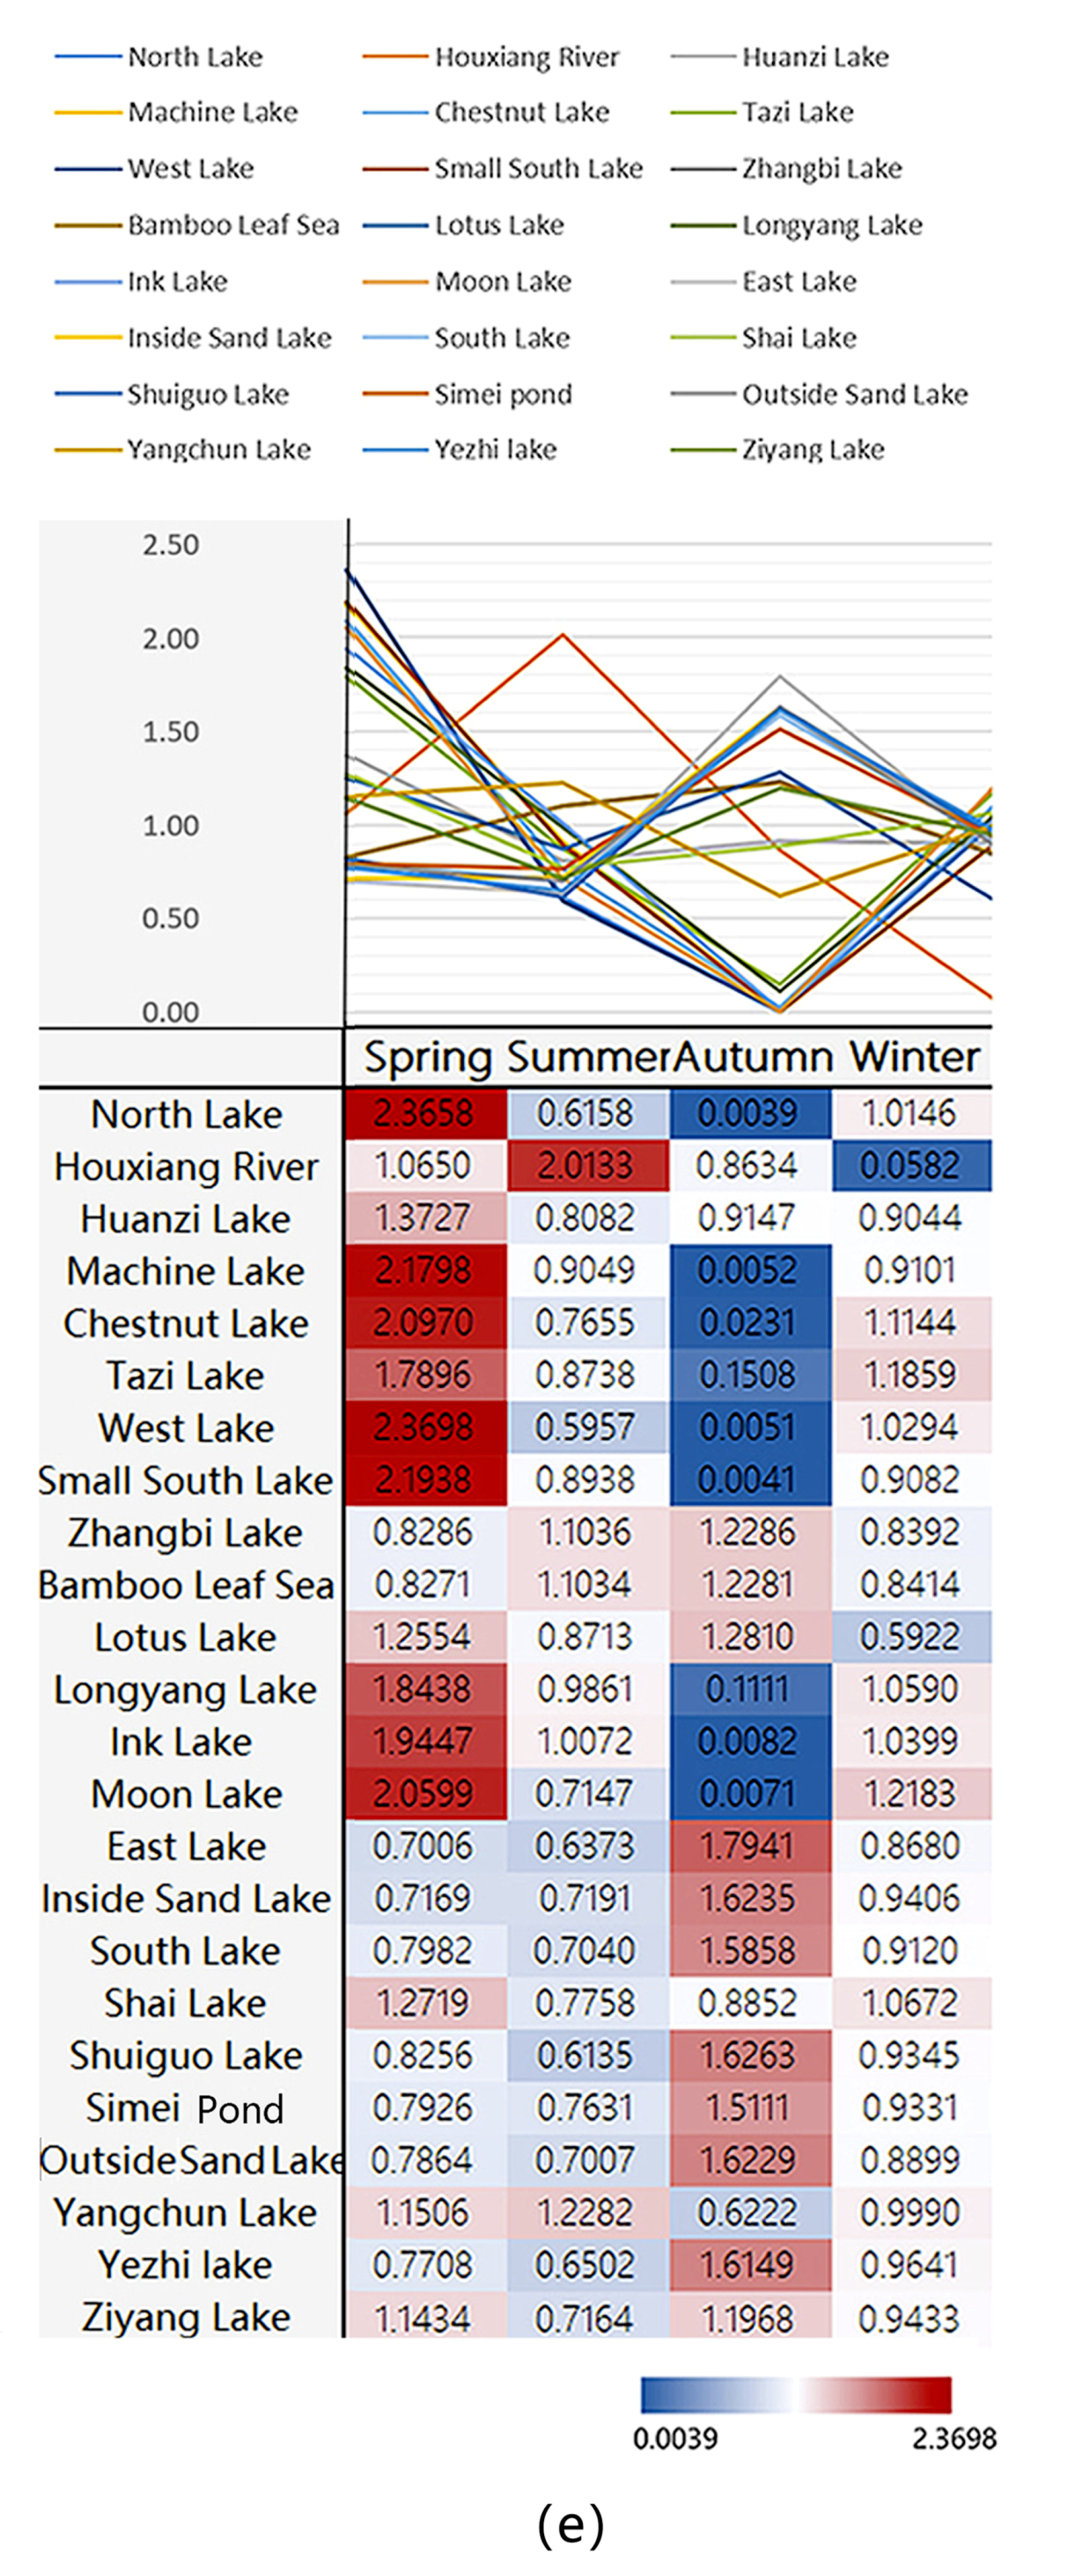
As shown in Figure 5e, spring was a booming season for North Lake, West Lake, and Chestnut waterfronts. The vibrancy of waterfronts, such as Outside Sand Lake, Shuiguo Lake, Yezhi Lake, South Lake, and Inside Sand Lake waterfronts, peaked in autumn.
As shown in Figure 5d, East Lake and Shuiguo Lake waterfronts had two minor peak periods in March and December. The peak periods of Moon Lake, North Lake, West Lake, and Ink Lake waterfronts occurred in May and June. Yezhi Lake, South Lake, and Simei Pond waterfronts had a high peak period in December. By contrast, Zhangbi Lake and Bamboo Leaf Sea waterfronts remained stable through all seasons.
Waterfronts were classified into four types, according to the temporal pattern of people’s check-in behaviors in urban waterfronts (Table 3): daily waterfront (A) with minimal changes on weekdays or weekends, weekend waterfront (B) with evident changes on weekends, natural seasonal waterfront (C) with seasonal changes due to climate and seasons, and social seasonal waterfront (D) with changes in the number of check-in points across months because of social activities.
The vibrancy of waterfronts was closely linked to people’s daily routines. During a good time for recreation and leisure, regardless of time and season, vibrancy will be high. The classification of waterfronts based on the temporal pattern of people’s check-in behaviors will be useful in the following steps.
4.2. Spatial Structure of Urban Waterfront Vibrancy
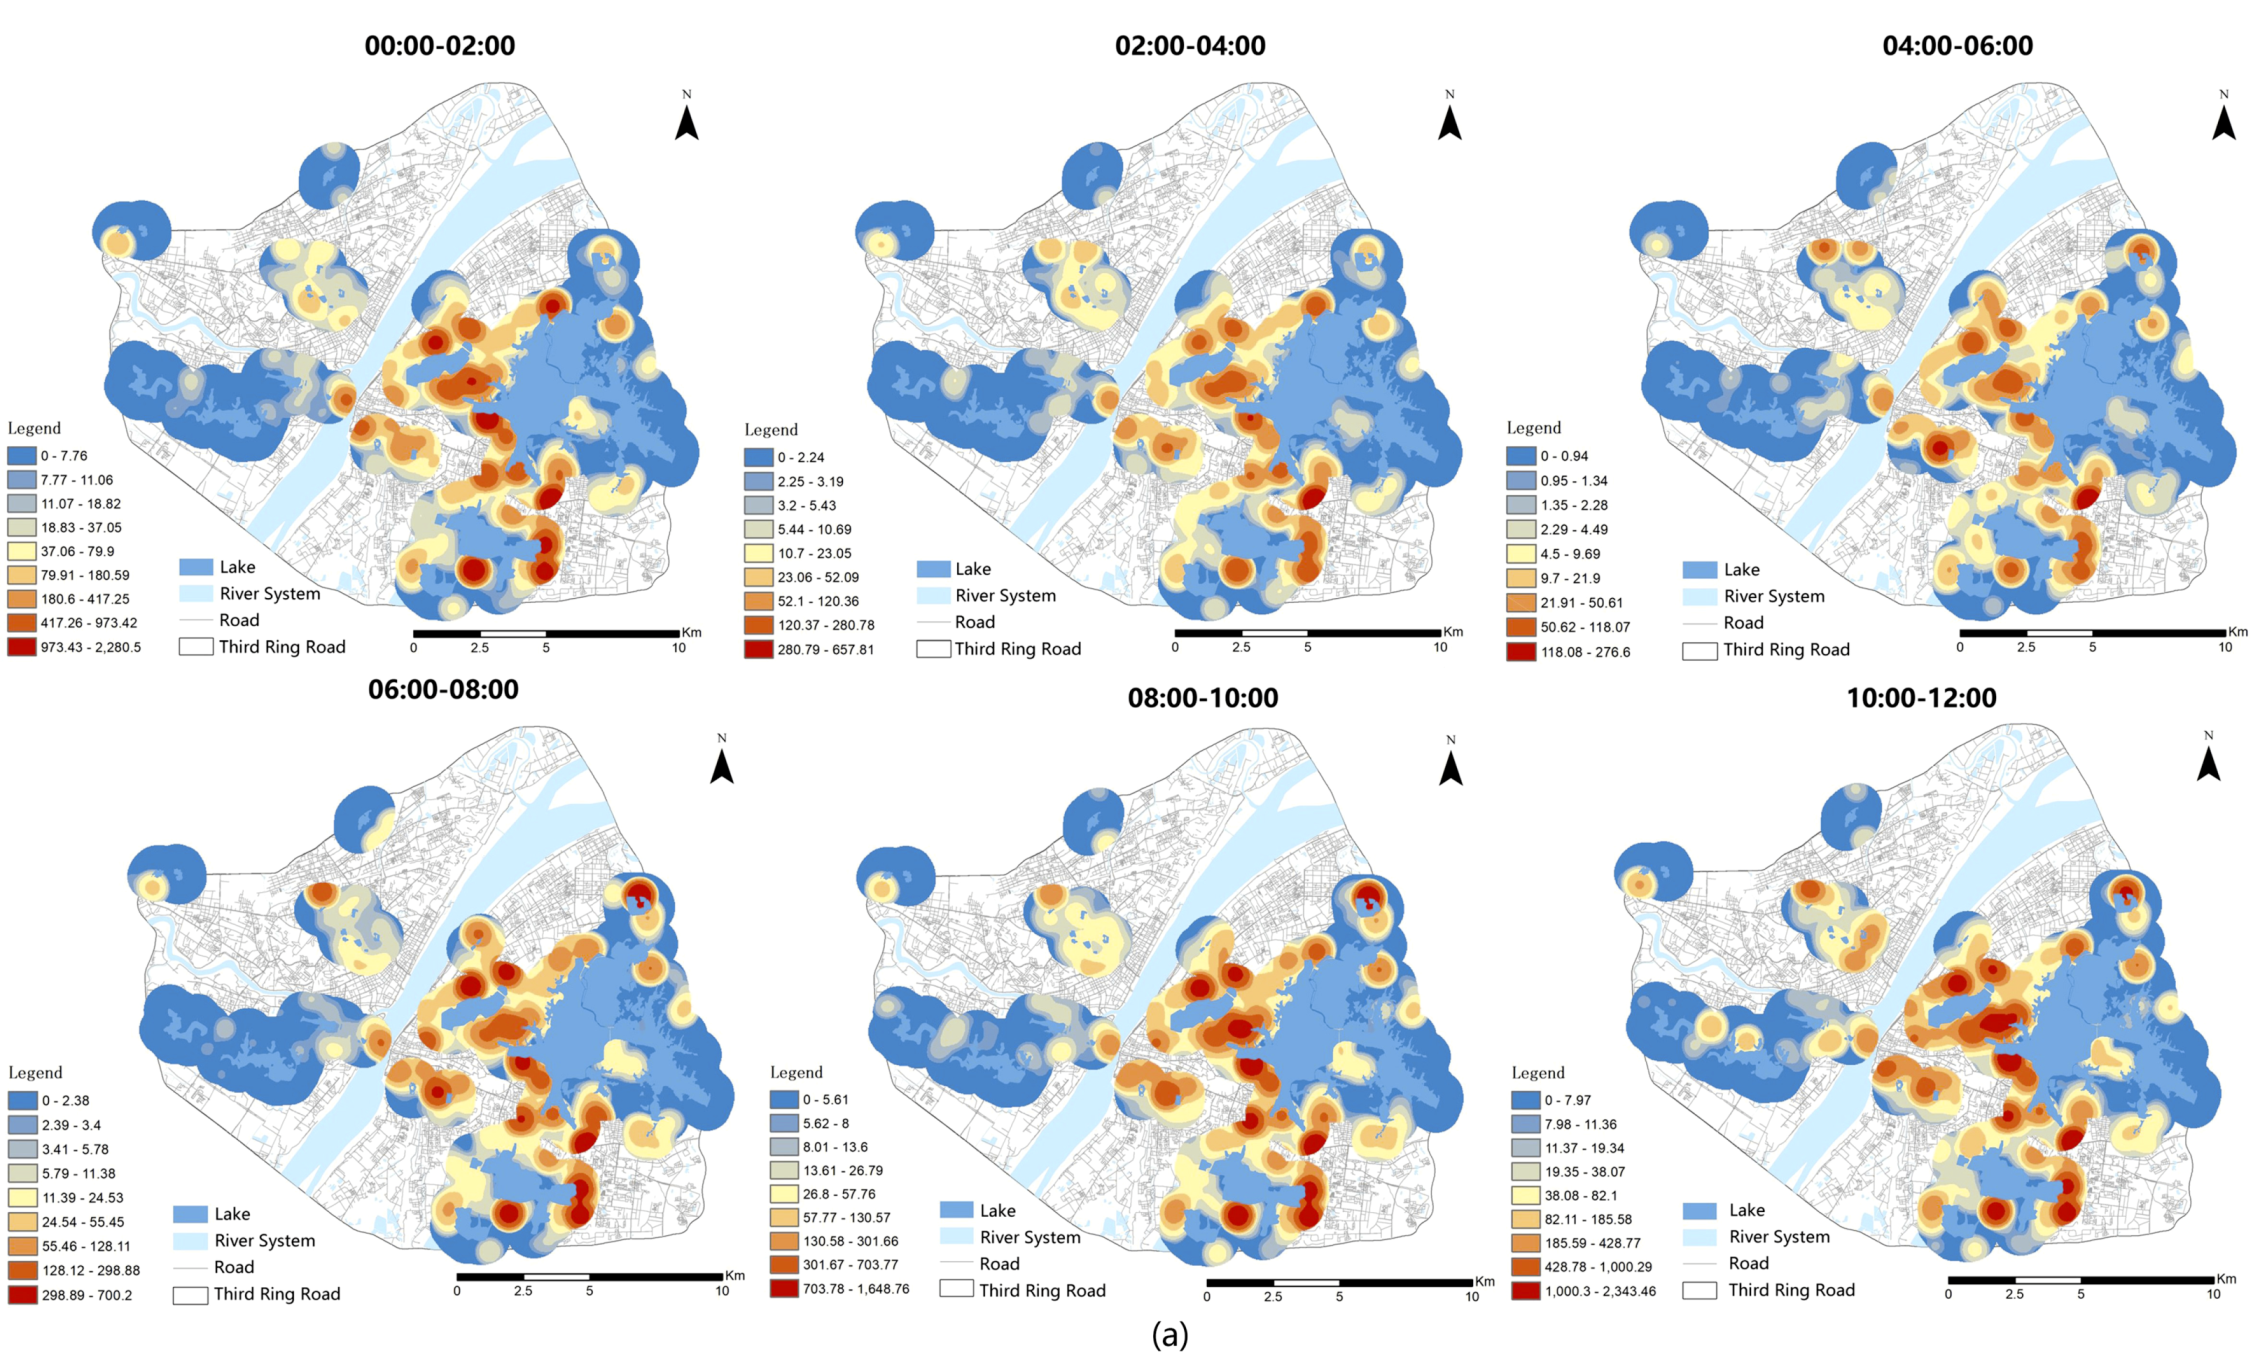
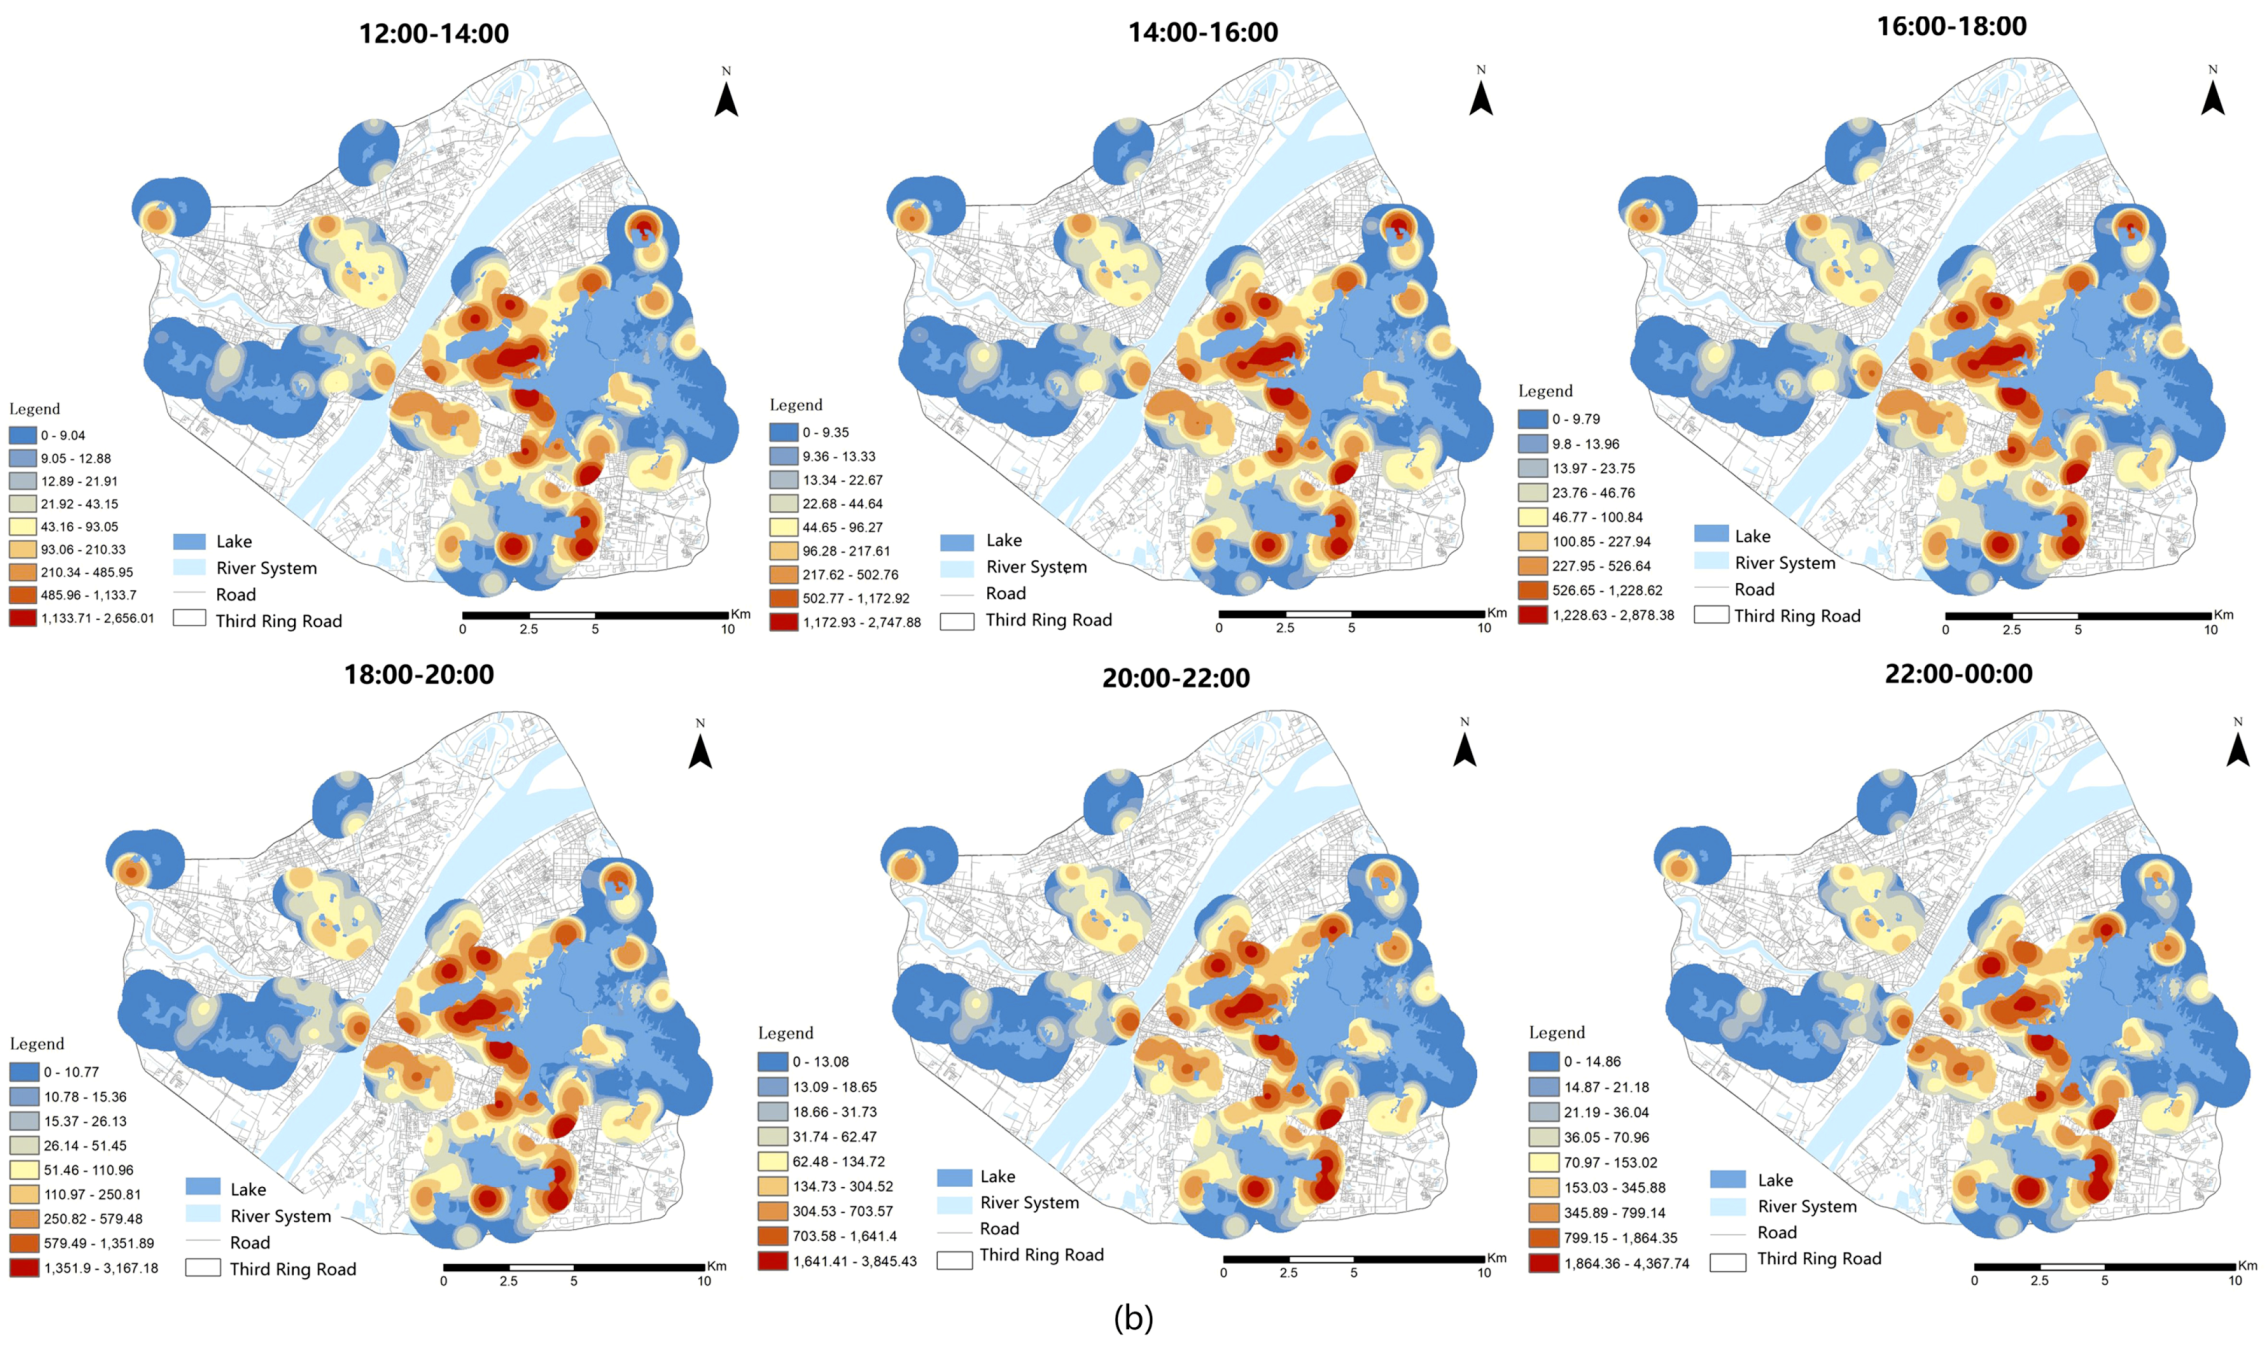
The KDE method was applied to analyze the locations of spatial agglomerations of urban waterfronts as well as their distribution characteristics. The spatial pattern of the distribution of people and the KDE value for visitor numbers at various times are clearly shown in Figure 6, Figure 7 and Figure 8. Core agglomeration was used to reflect the gathering places where the high-density spots of people in waterfronts were located.
Figure 6 shows the spatial pattern of the distribution of visitors and the KDE value for the number of daily visitors. The changes in the KDE value agreed with people’s daily routines and agglomerations occurred in Wuchang waterfronts, which were dominated by single-core agglomerations. Dual-core agglomeration may only occur part-time. After 10:00, visitor density started to increase in some waterfronts, such as East Lake, Shuiguo Lake, and South Lake waterfronts compared with the Hankou and Hanyang waterfronts.
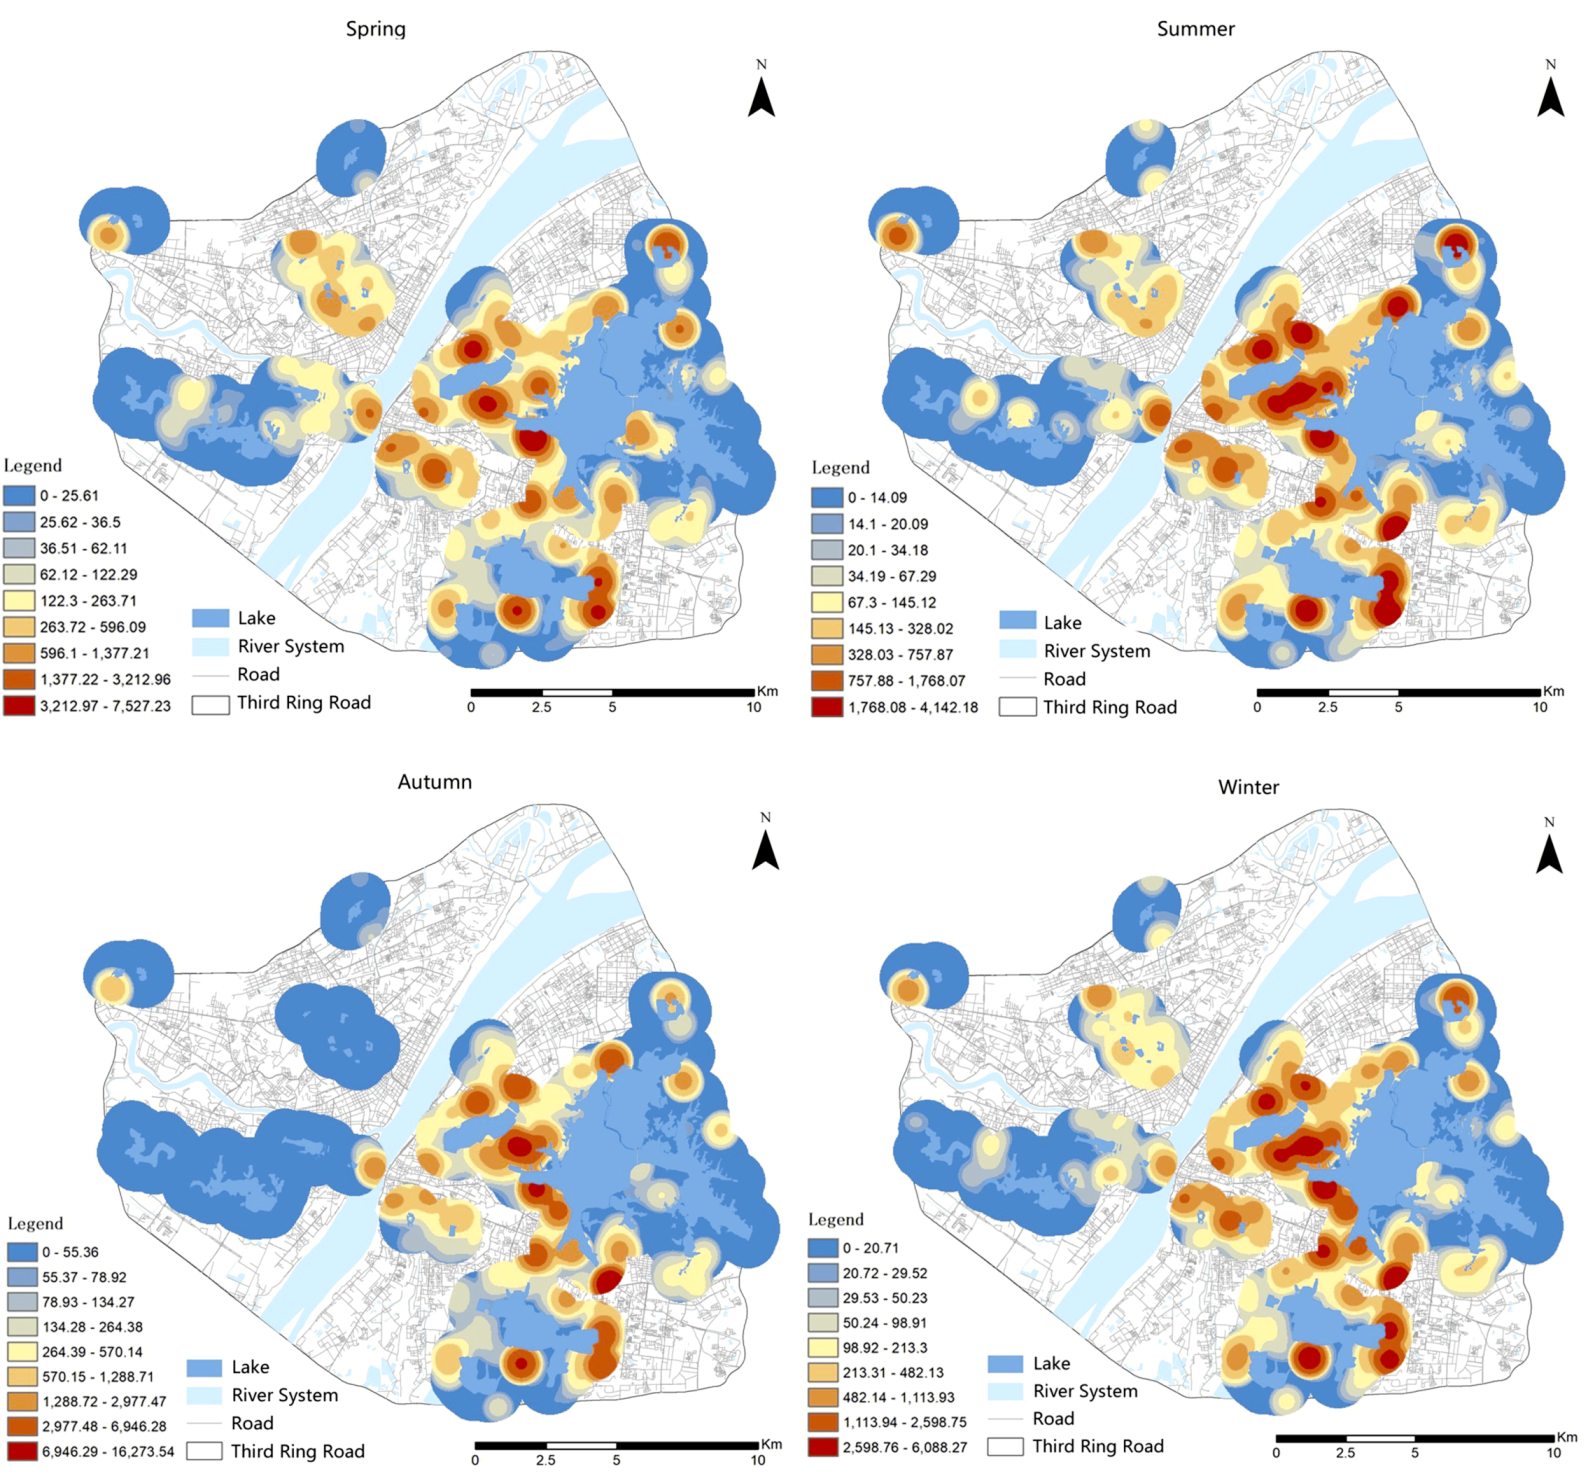
Figure 7 illustrates the spatial agglomeration and distribution characteristics of check-in points. The value of the kernel density of the natural seasonal waterfronts varied markedly with four seasons and single-core or dual-core agglomerations that occurred there. In autumn, agglomeration regions were concentrated in Wuchang waterfronts, such as the southwestern area of the East Lake waterfront, the east and south of the South Lake waterfront, and the northern area of Inside Lake and Shuiguo Lake waterfronts. For Hankou waterfronts, the coverage of high visitor density expanded with less cores. The density of check-in points increased during the peak period.
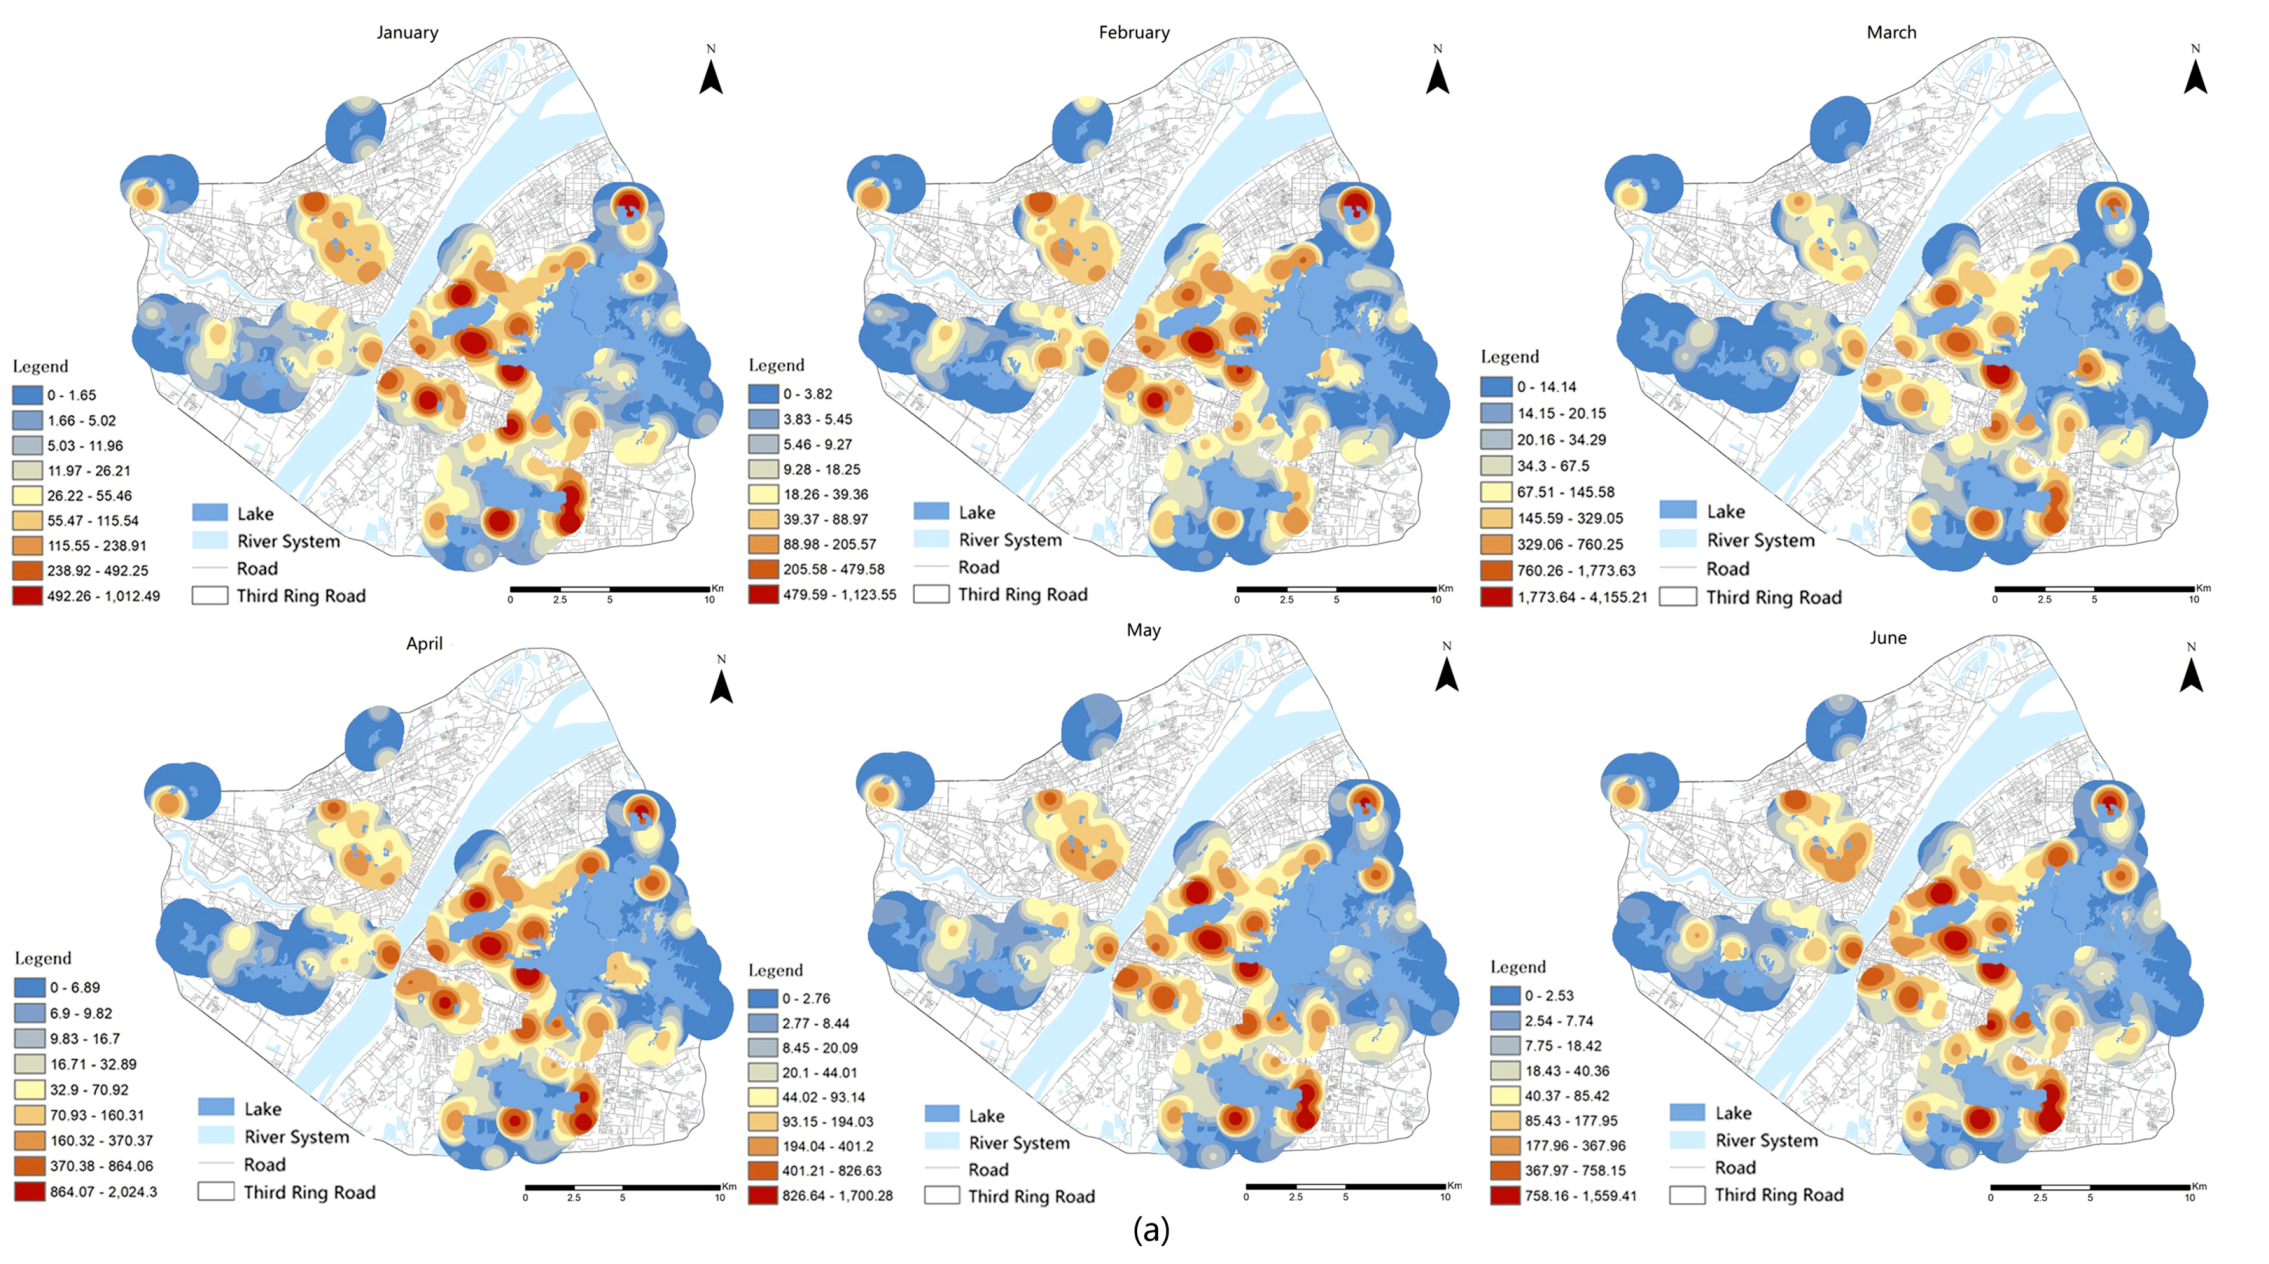
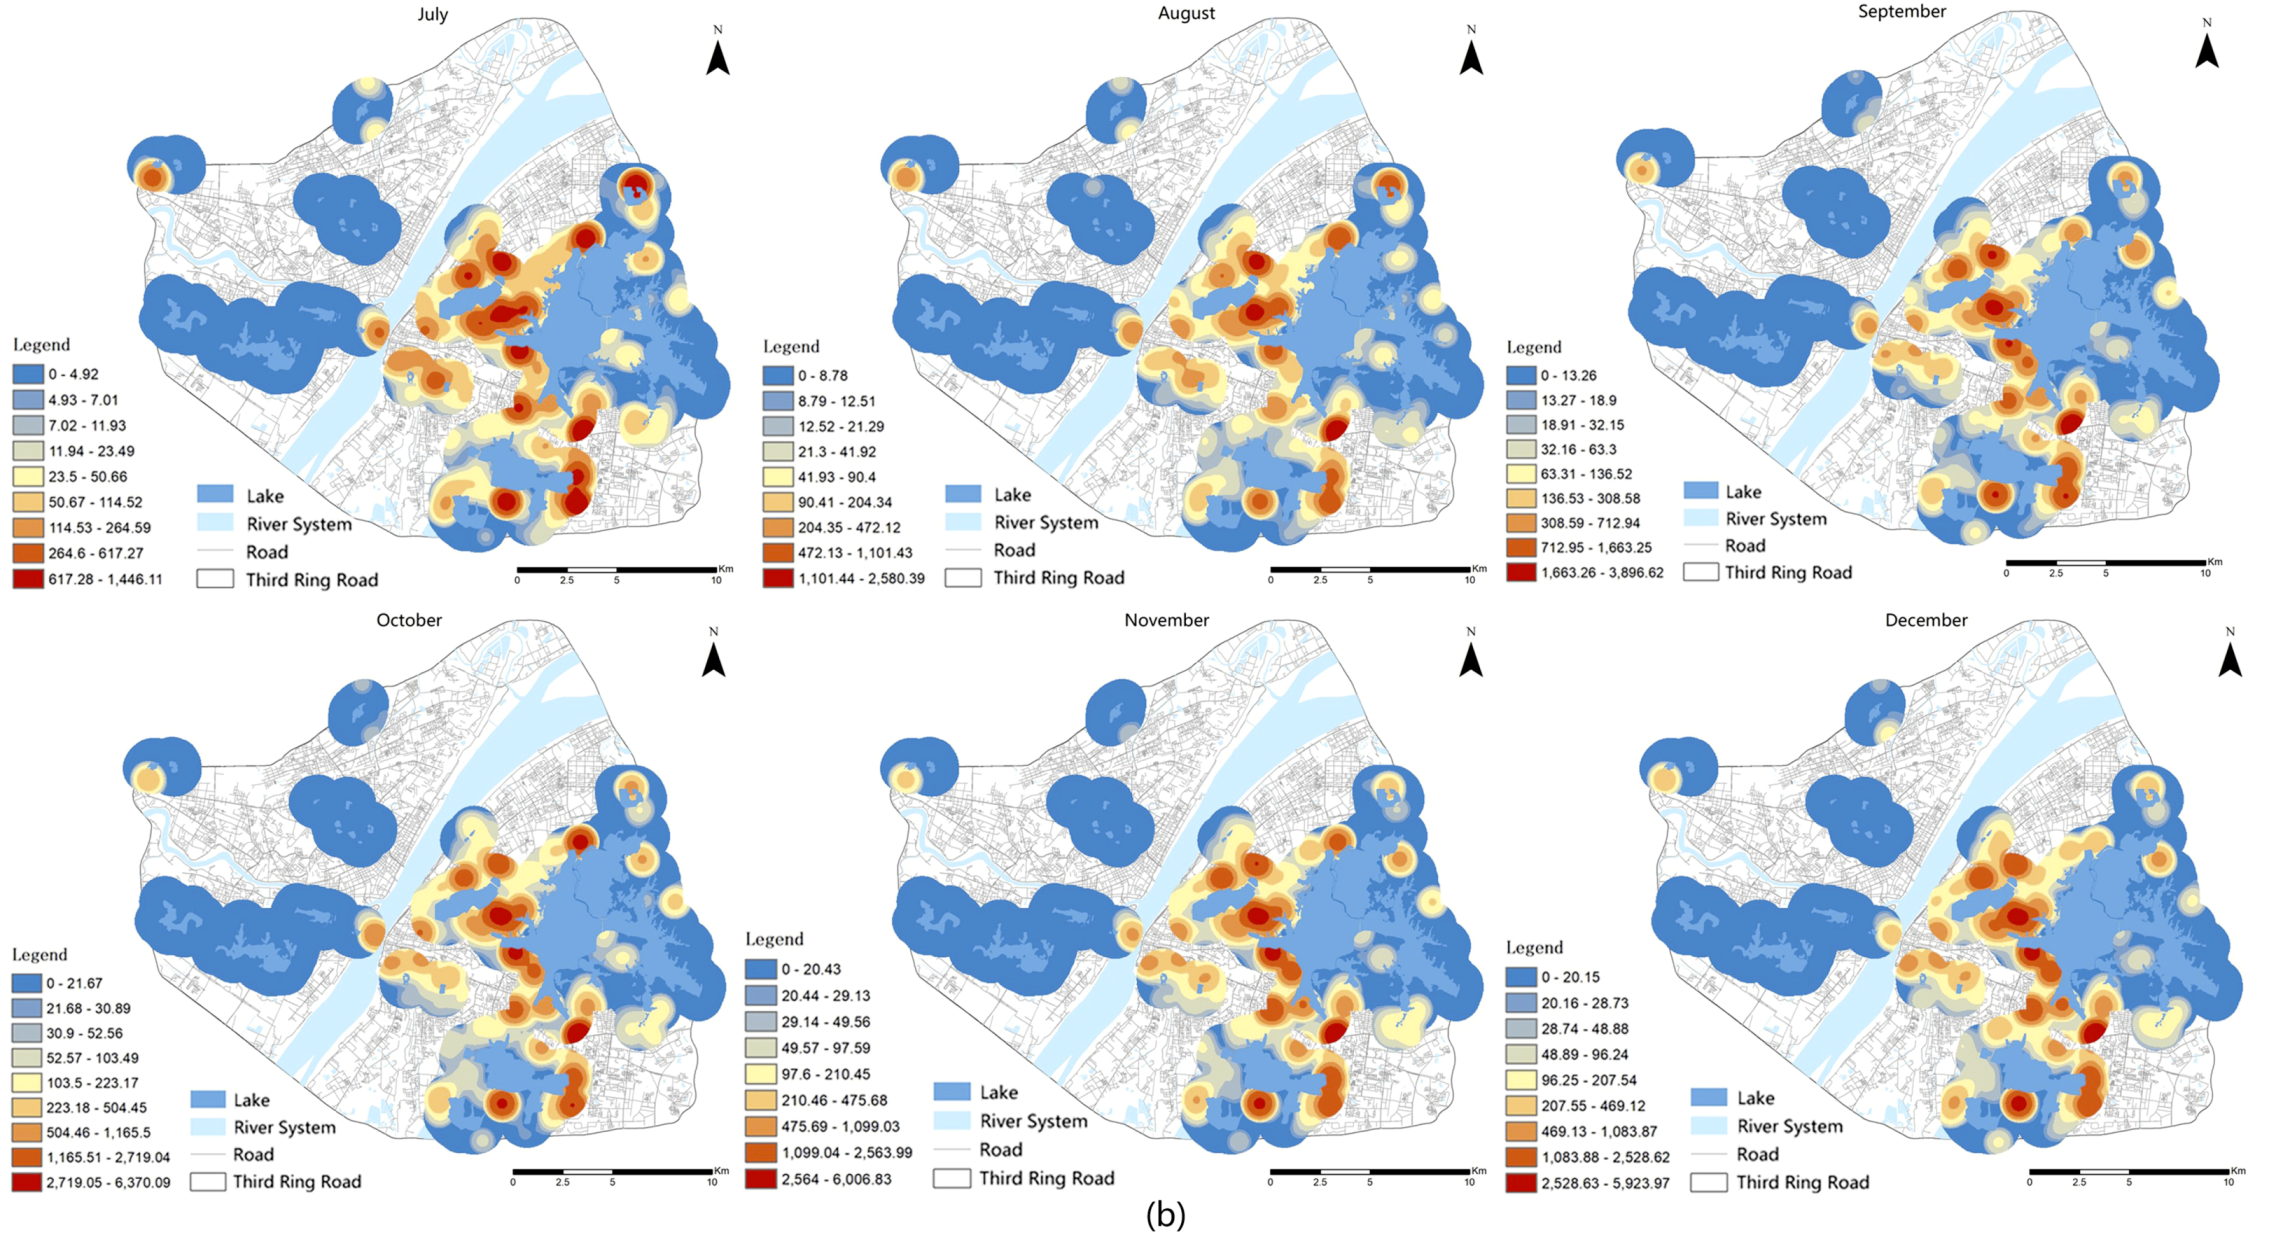
After dividing four seasons, the kernel estimation results of the check-in densities in 12 months (Figure 8) showed that the values of the kernel density of visitor numbers were higher in March than in April and May, with the core of agglomerations located in the southwestern area of East Lake, Wuhan University. The values of the kernel density of visitor numbers were the highest in East Lake, Shuiguo Lake, and Outside Sand Lake waterfronts. Single-core agglomeration mostly occurred in January and February, with their cores located between South Lake, Shai Lake, and Ziyang Lake, even with low overall values of the kernel density.
Generally, agglomerations most often occurred in Wuchang waterfronts with a single-core structure. With the expansion of the coverage of vibrancy, the aggregation degree was relatively decreased. However, the overall values of the kernel density were relatively high during good recreation and leisure times, such as weekends and spring. These results were consistent with previous analyses.
4.3. Characteristics of the Effects of POI on Urban Waterfronts
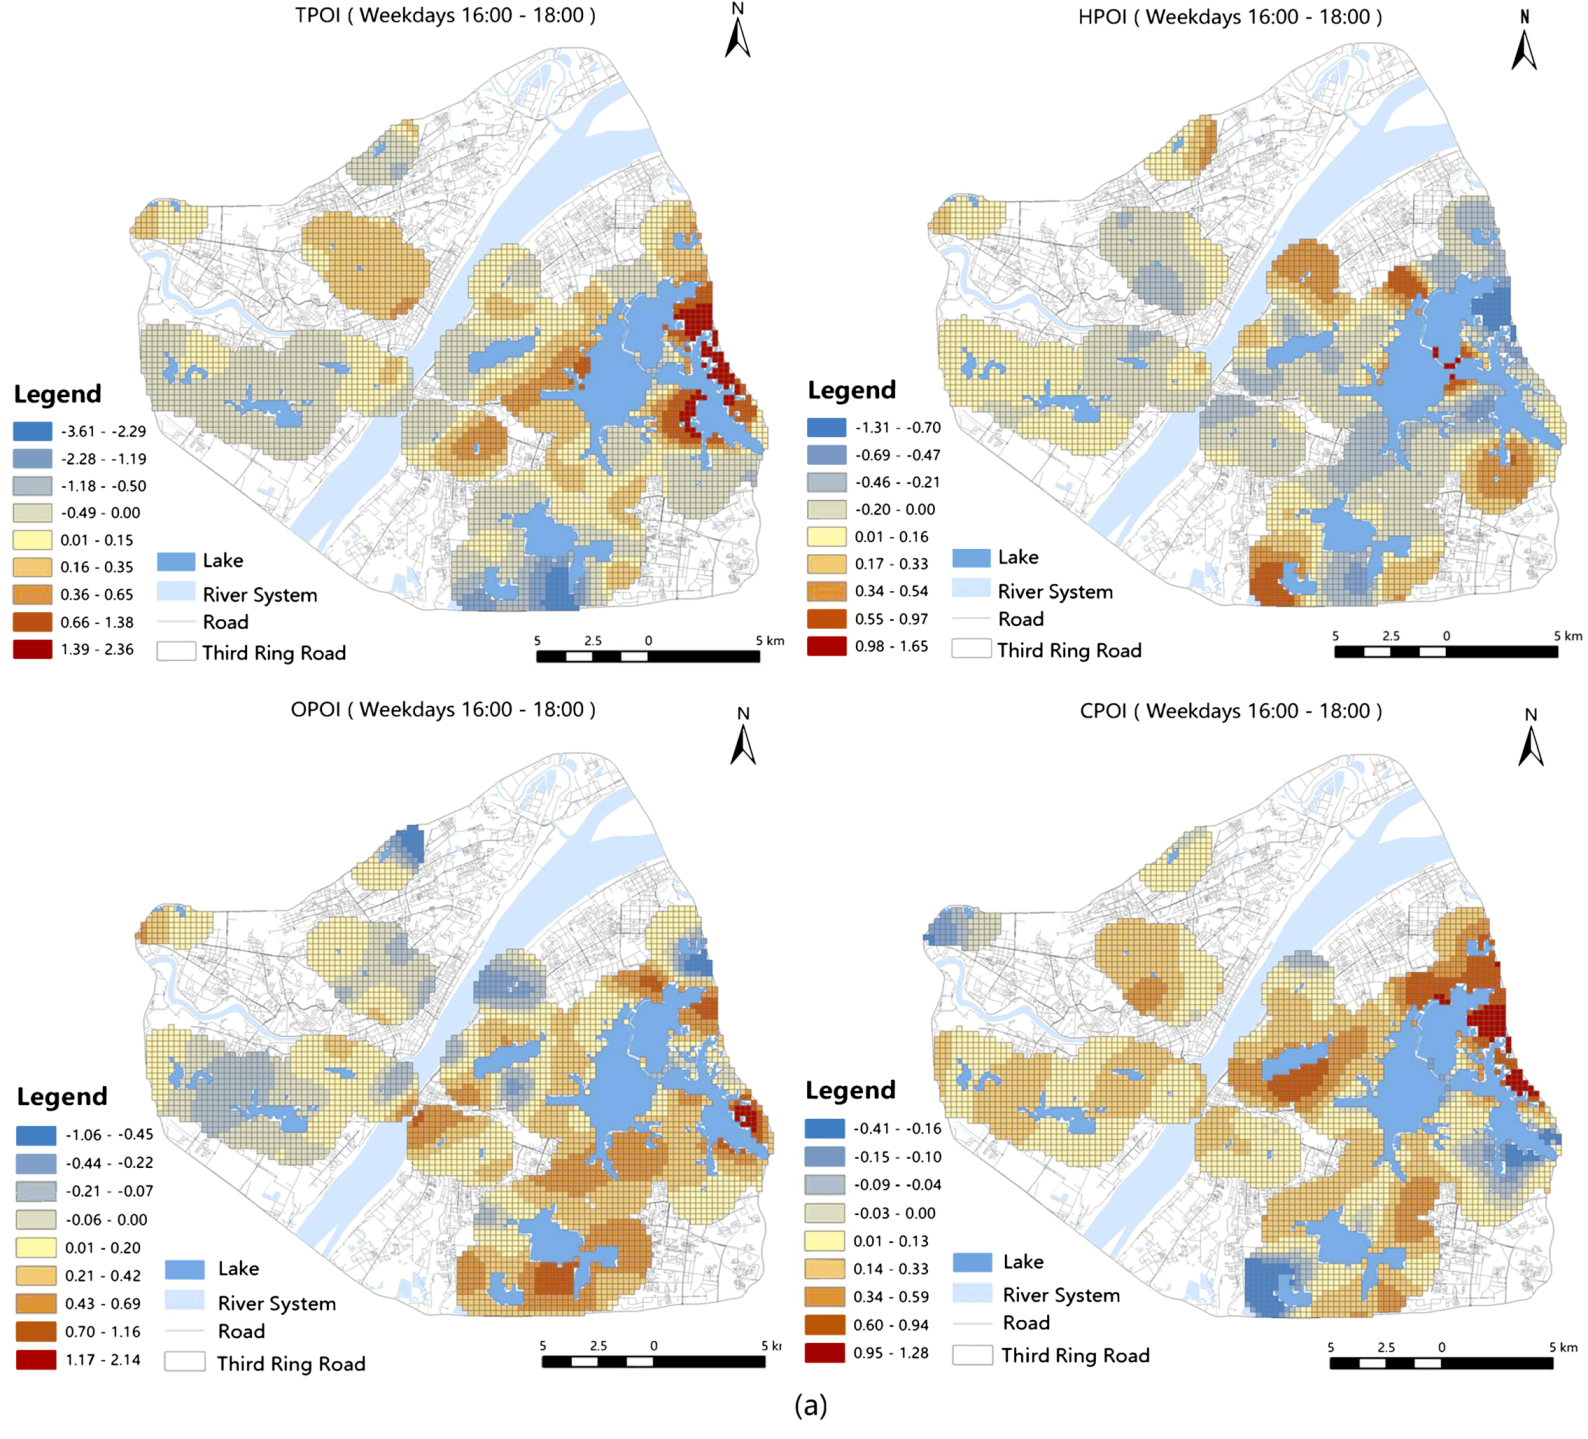
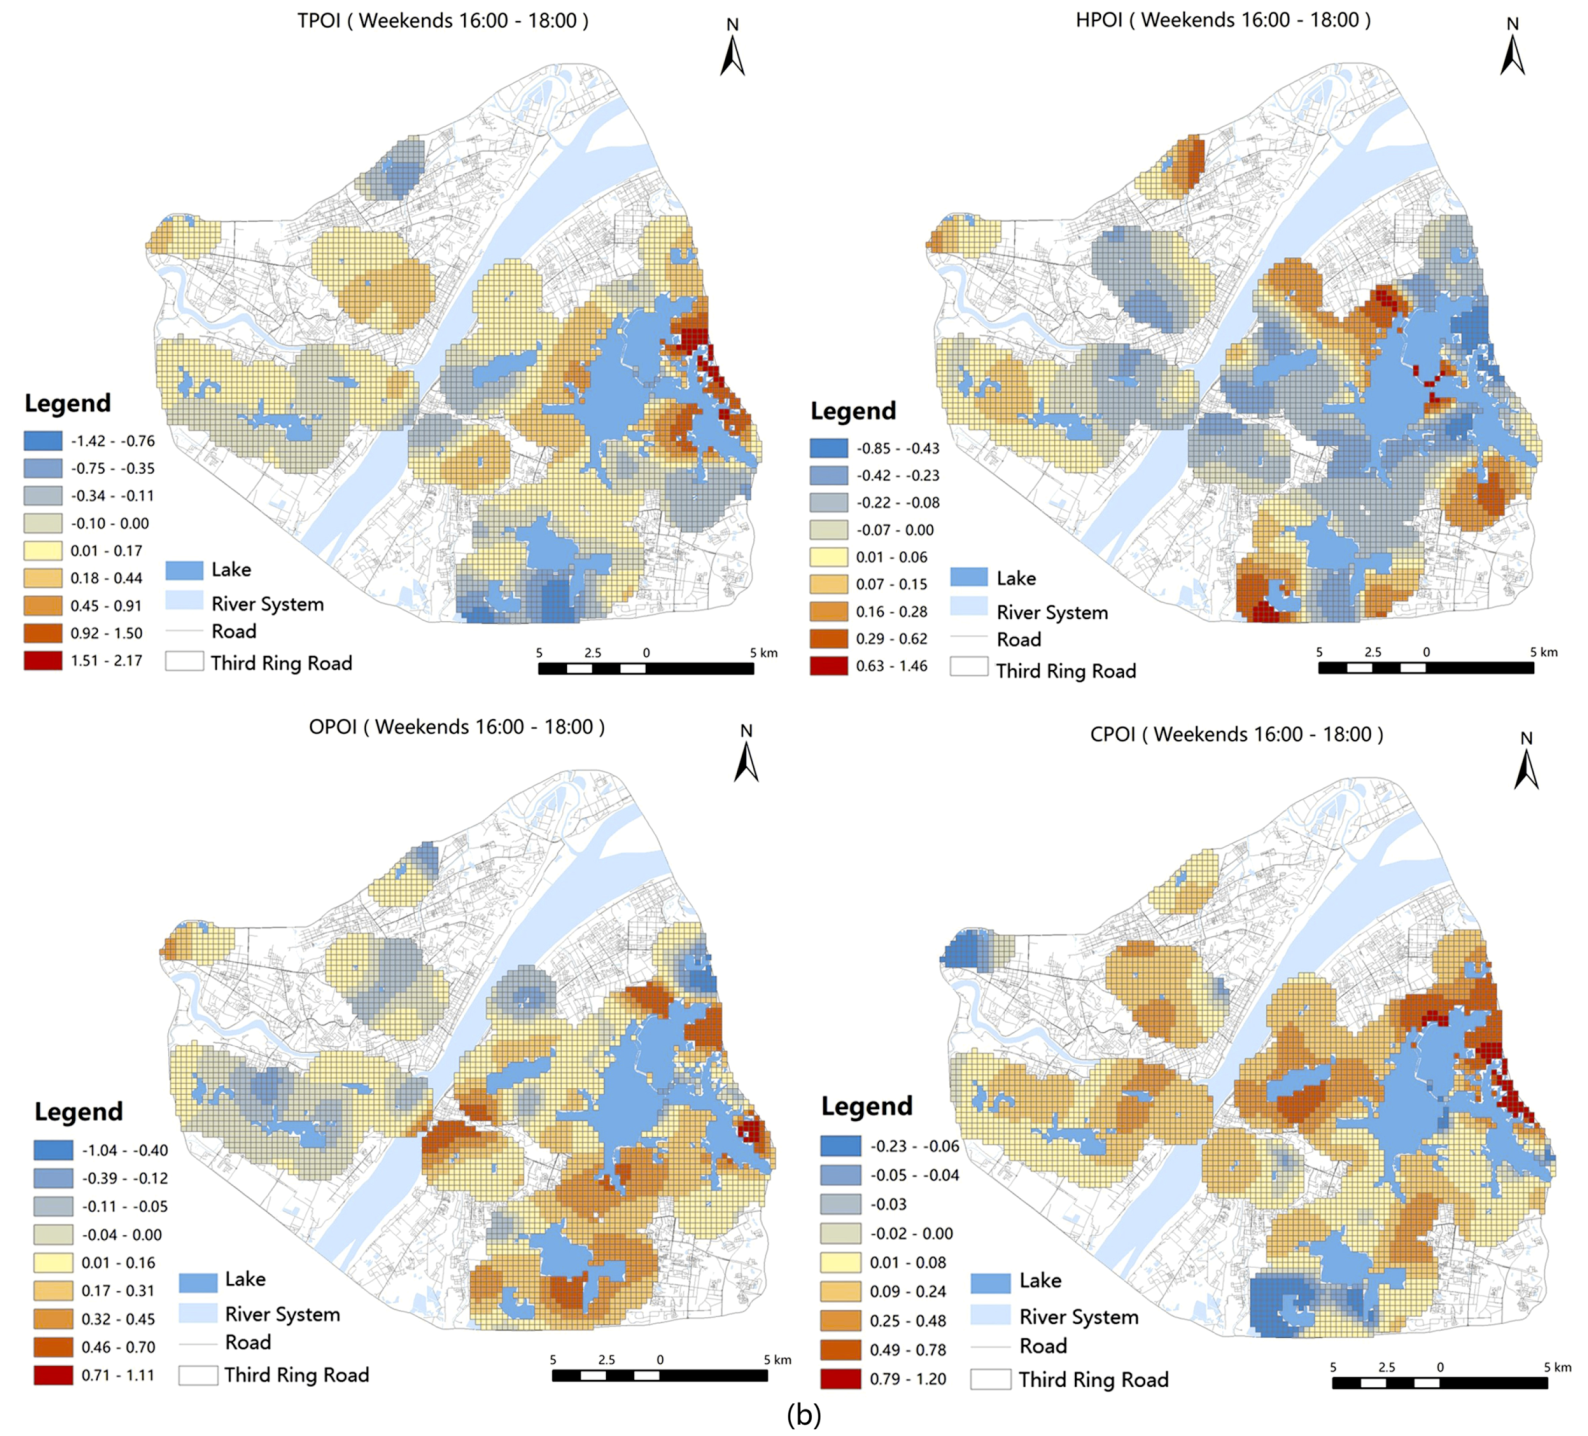
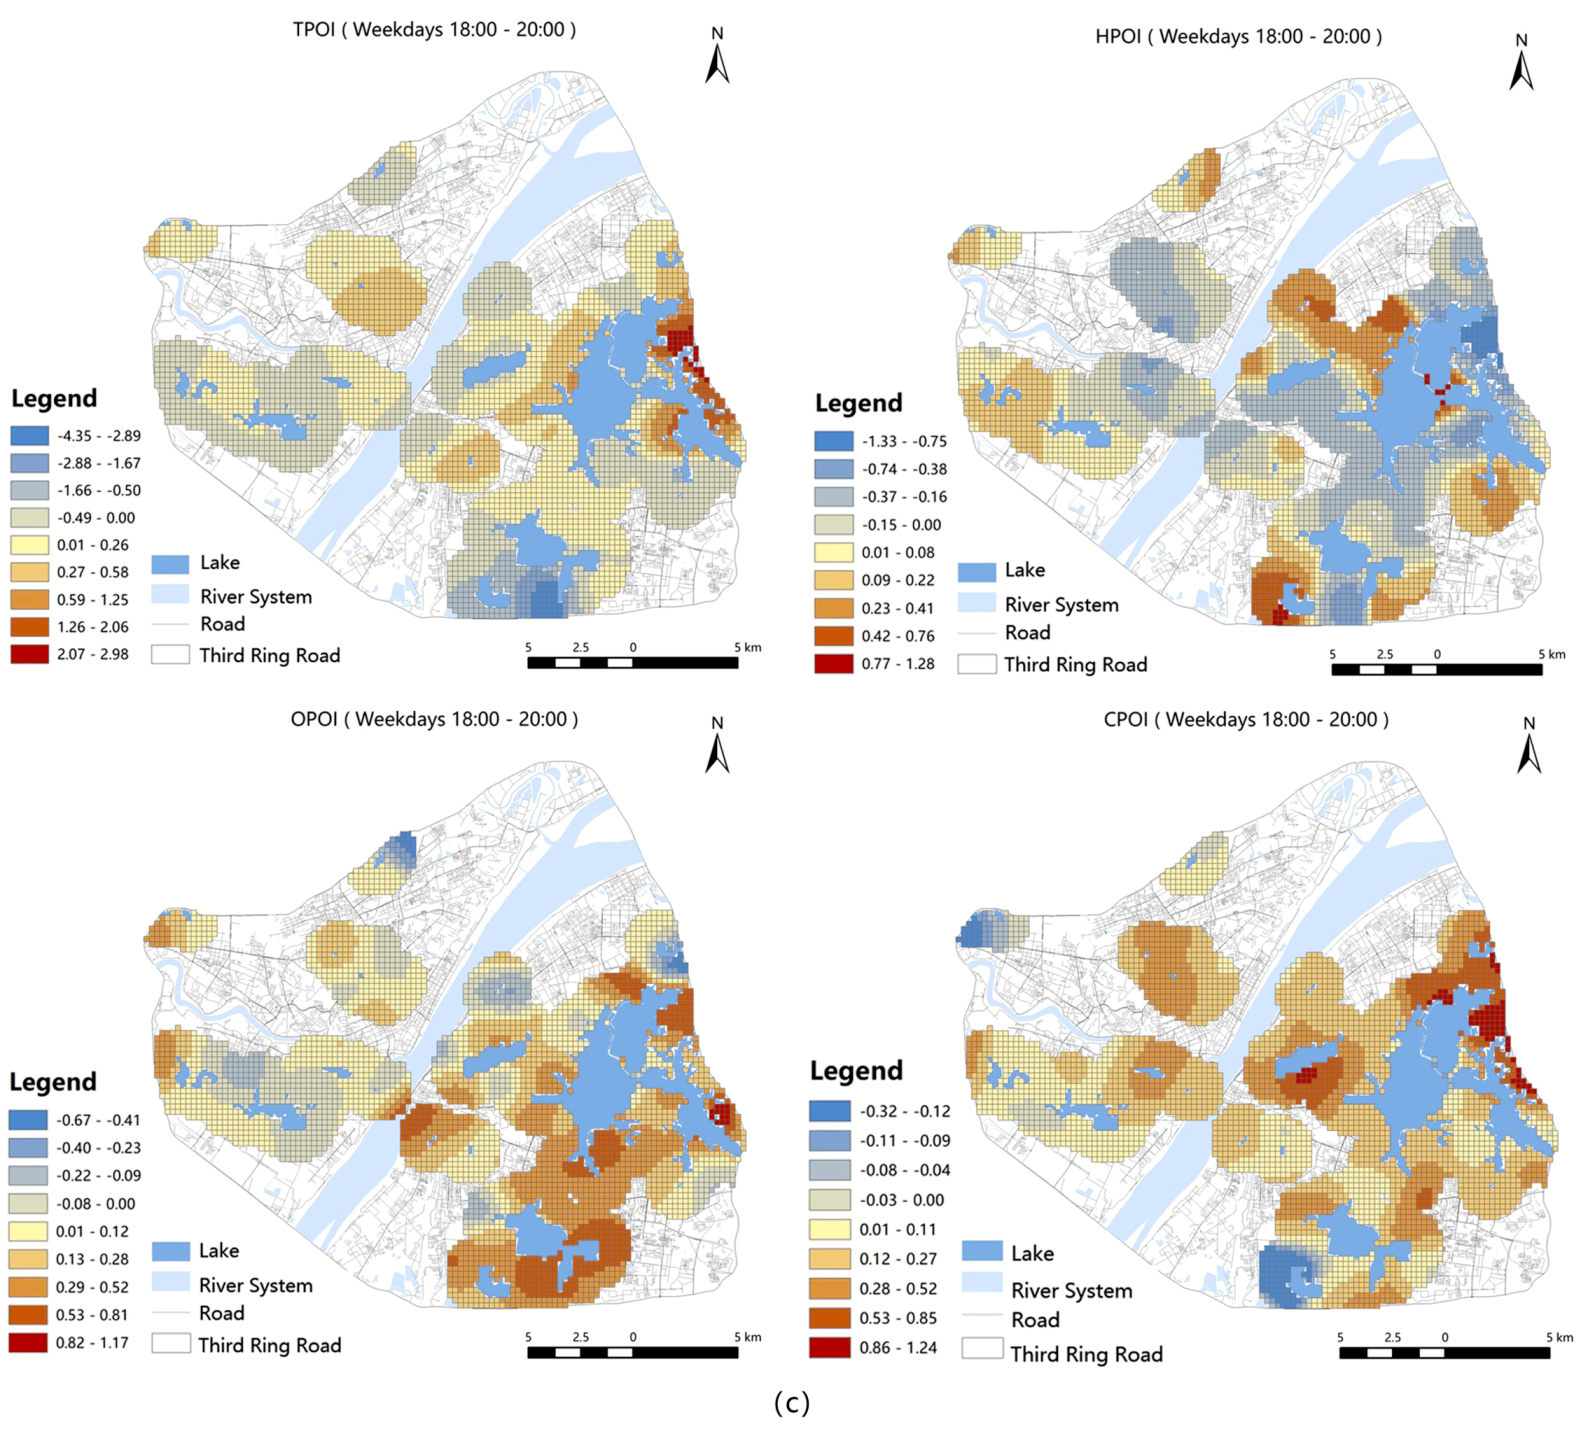
Taking the gird as the statistical unit, we calculated the average values of regression coefficients over different times and the most representative calculated results of various times were chosen to be rendered into coefficient distribution maps. The boundary of the classification of POIs was manually set to zero to distinguish positive and negative effects, which can intuitively reflect the attractiveness or the restraint of various effects on waterfront vibrancy. The spatial distributions of the estimated coefficients of the indicators are shown in Figure 9, Figure 10 and Figure 11.
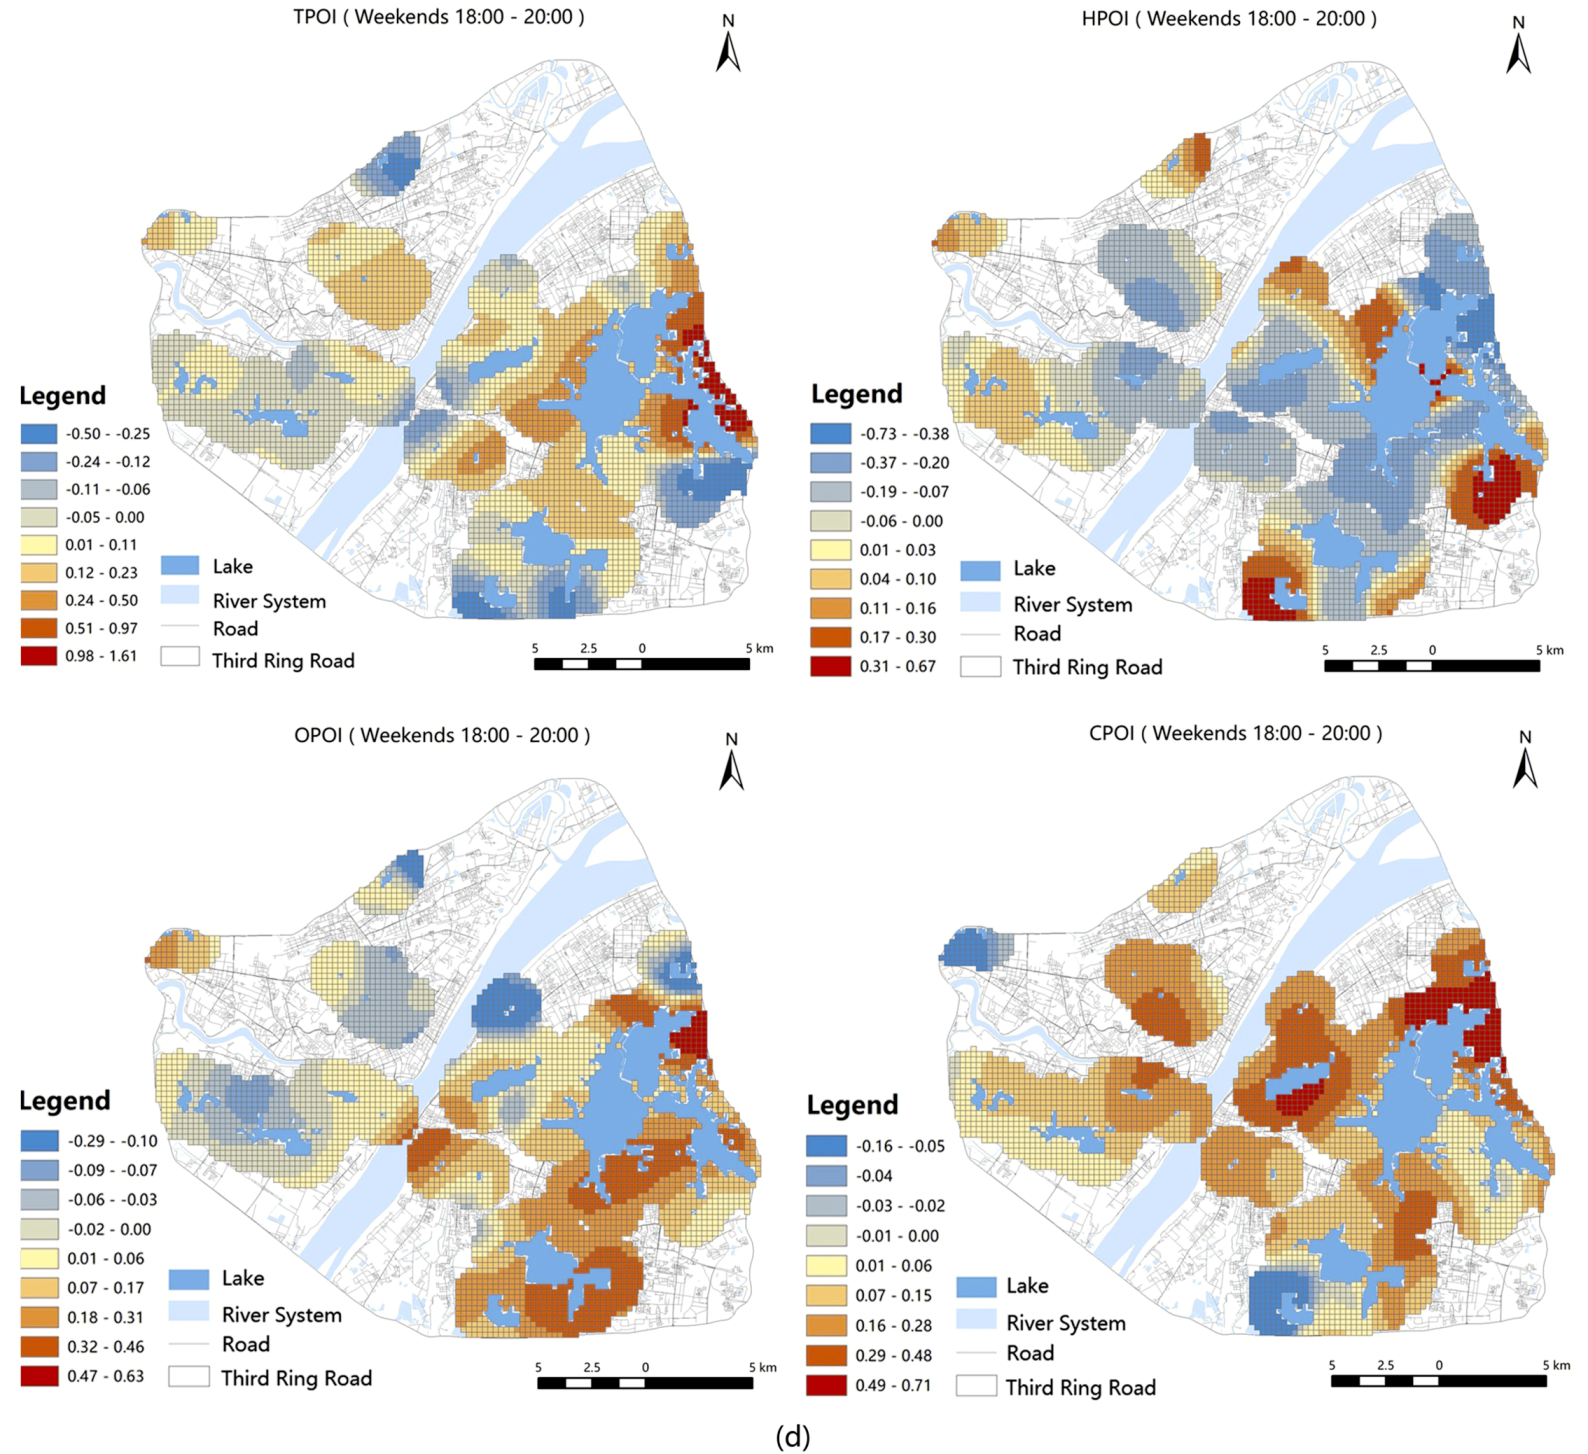
As shown in Figure 9, for the East Lake Waterfront in Wuchang Town, TPOI largely affected its eastern area, whereas CPOI had a greater impact on the southwest. Moreover, OPOI made a difference in the southern area, whereas the Inside Sand Lake waterfront was dominated by CPOI, especially in the southern area. In contrast to OPOI, TPOI showed a remarkably negative impact on the South Lake waterfront. In addition to these waterfronts in Wuchang Town, most Hankou waterfronts (e.g., West Lake and North Lake) were under the positive influence of TPOI, whereas CPOI became the dominated factor between 16:00 and 18:00. The effects of CPOI on Hanyang waterfronts (e.g., Ink Lake and Moon Lake) on weekends were greater than that observed on weekdays.
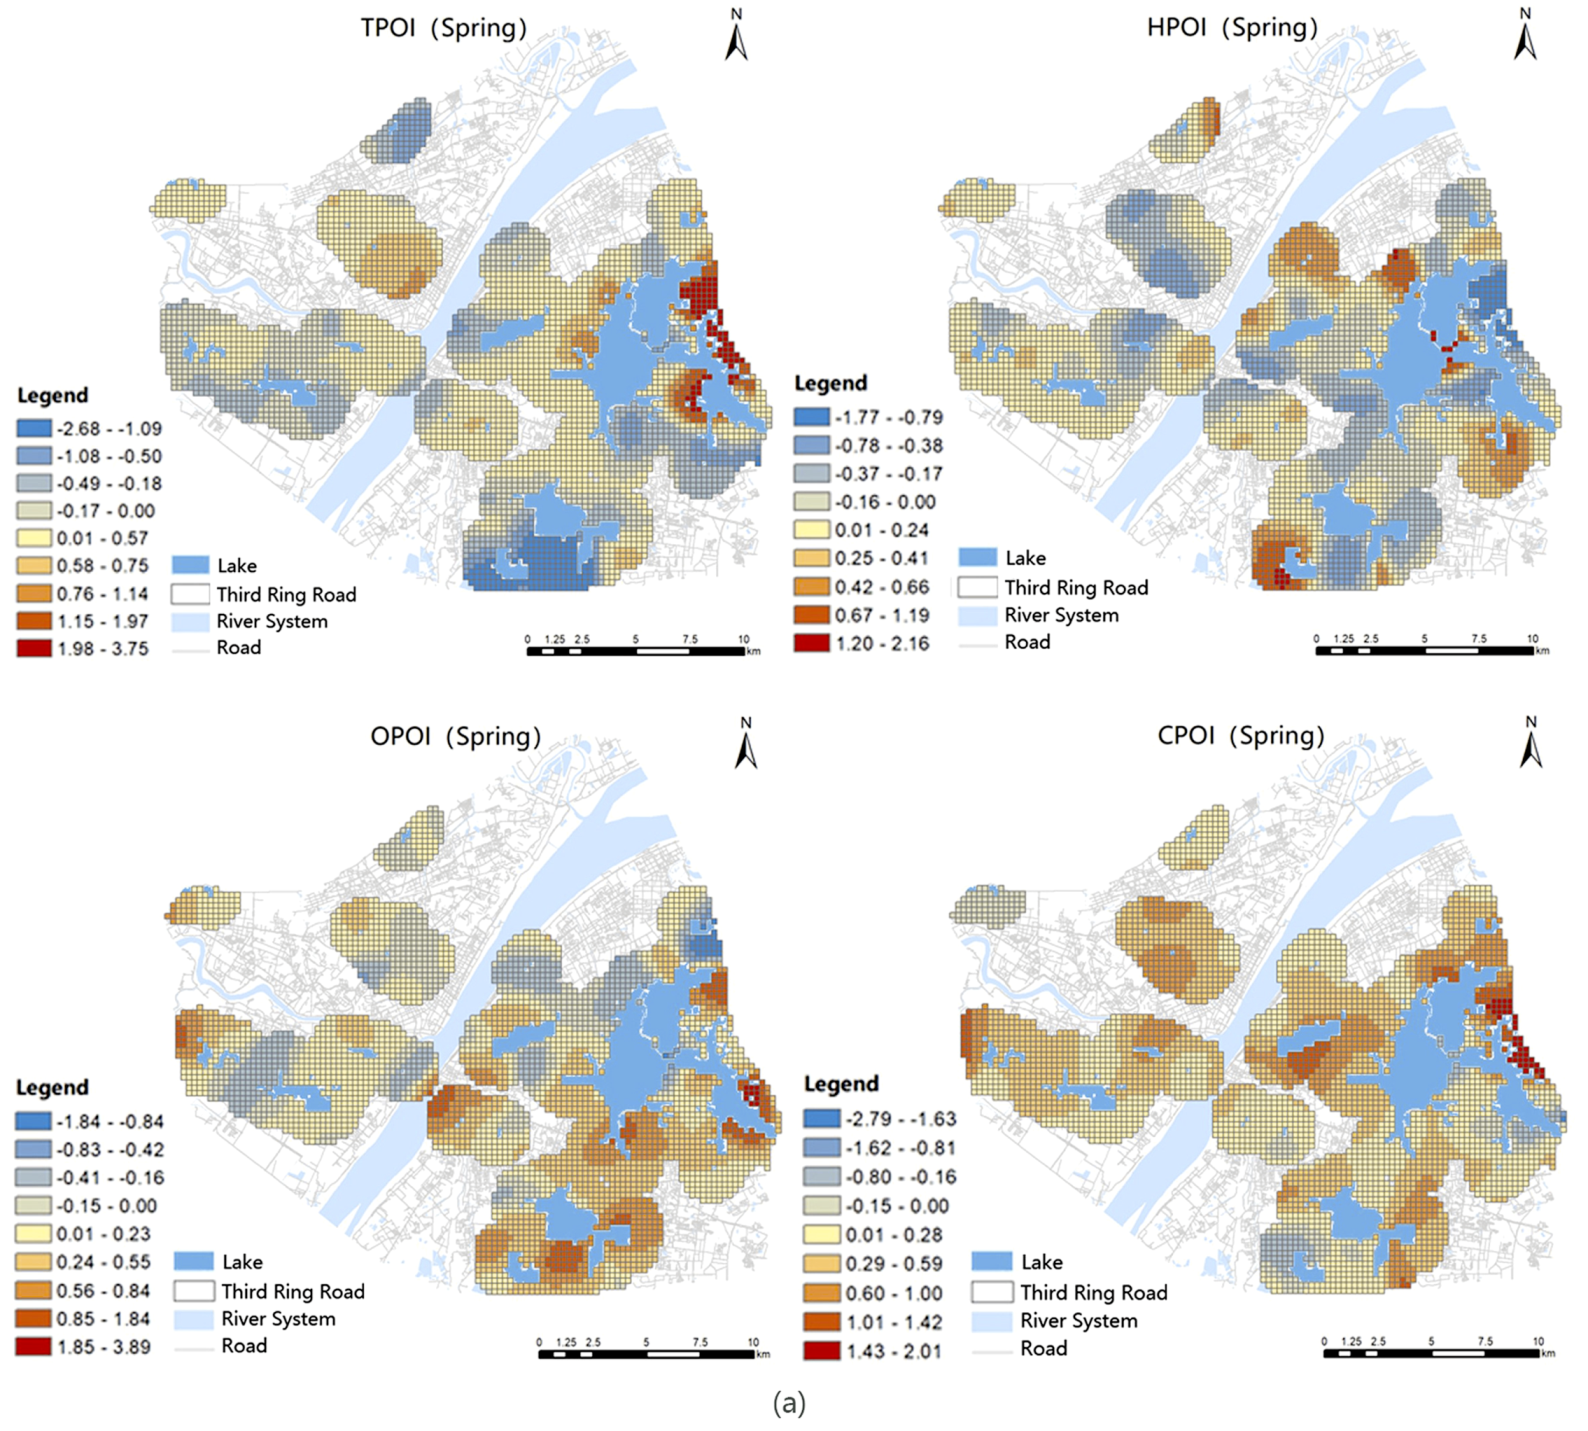
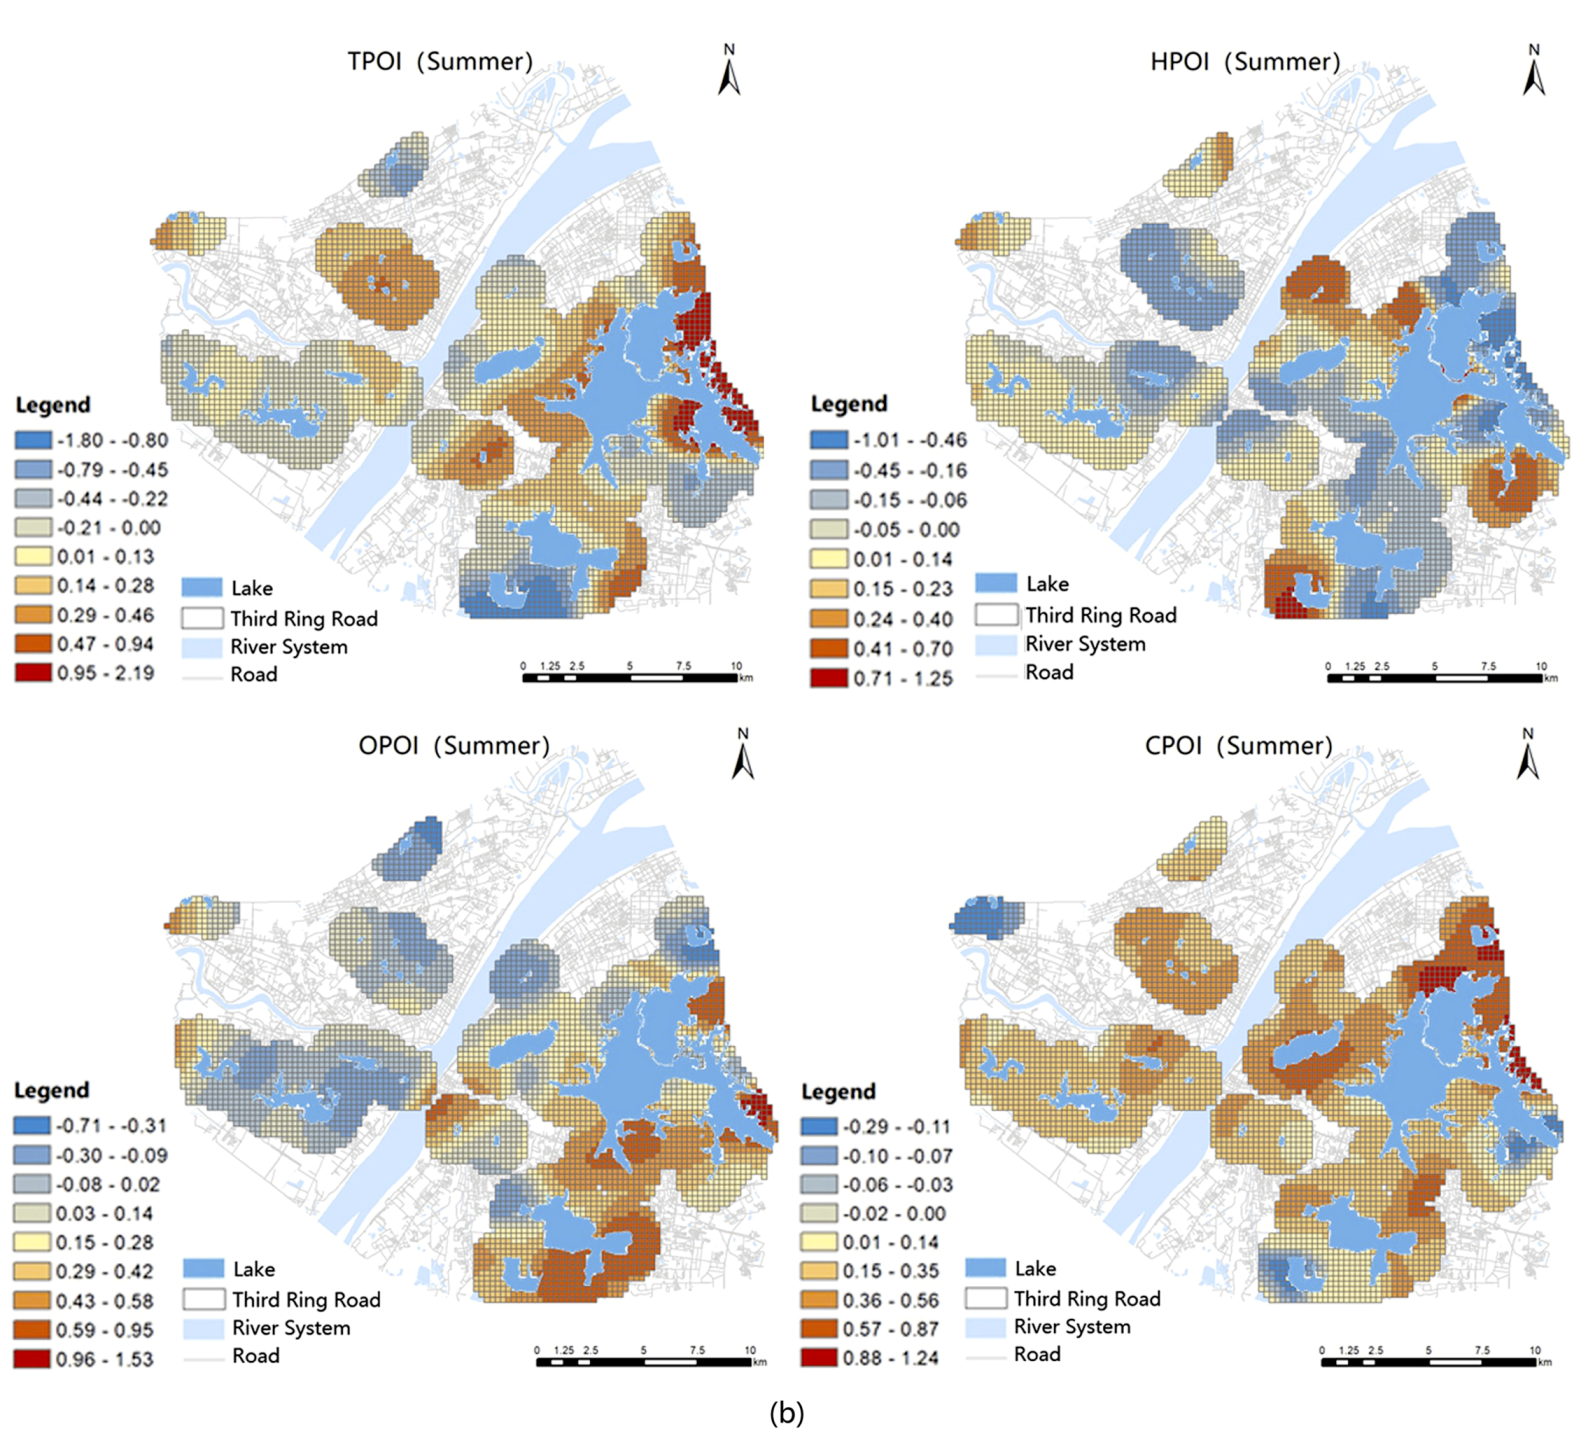
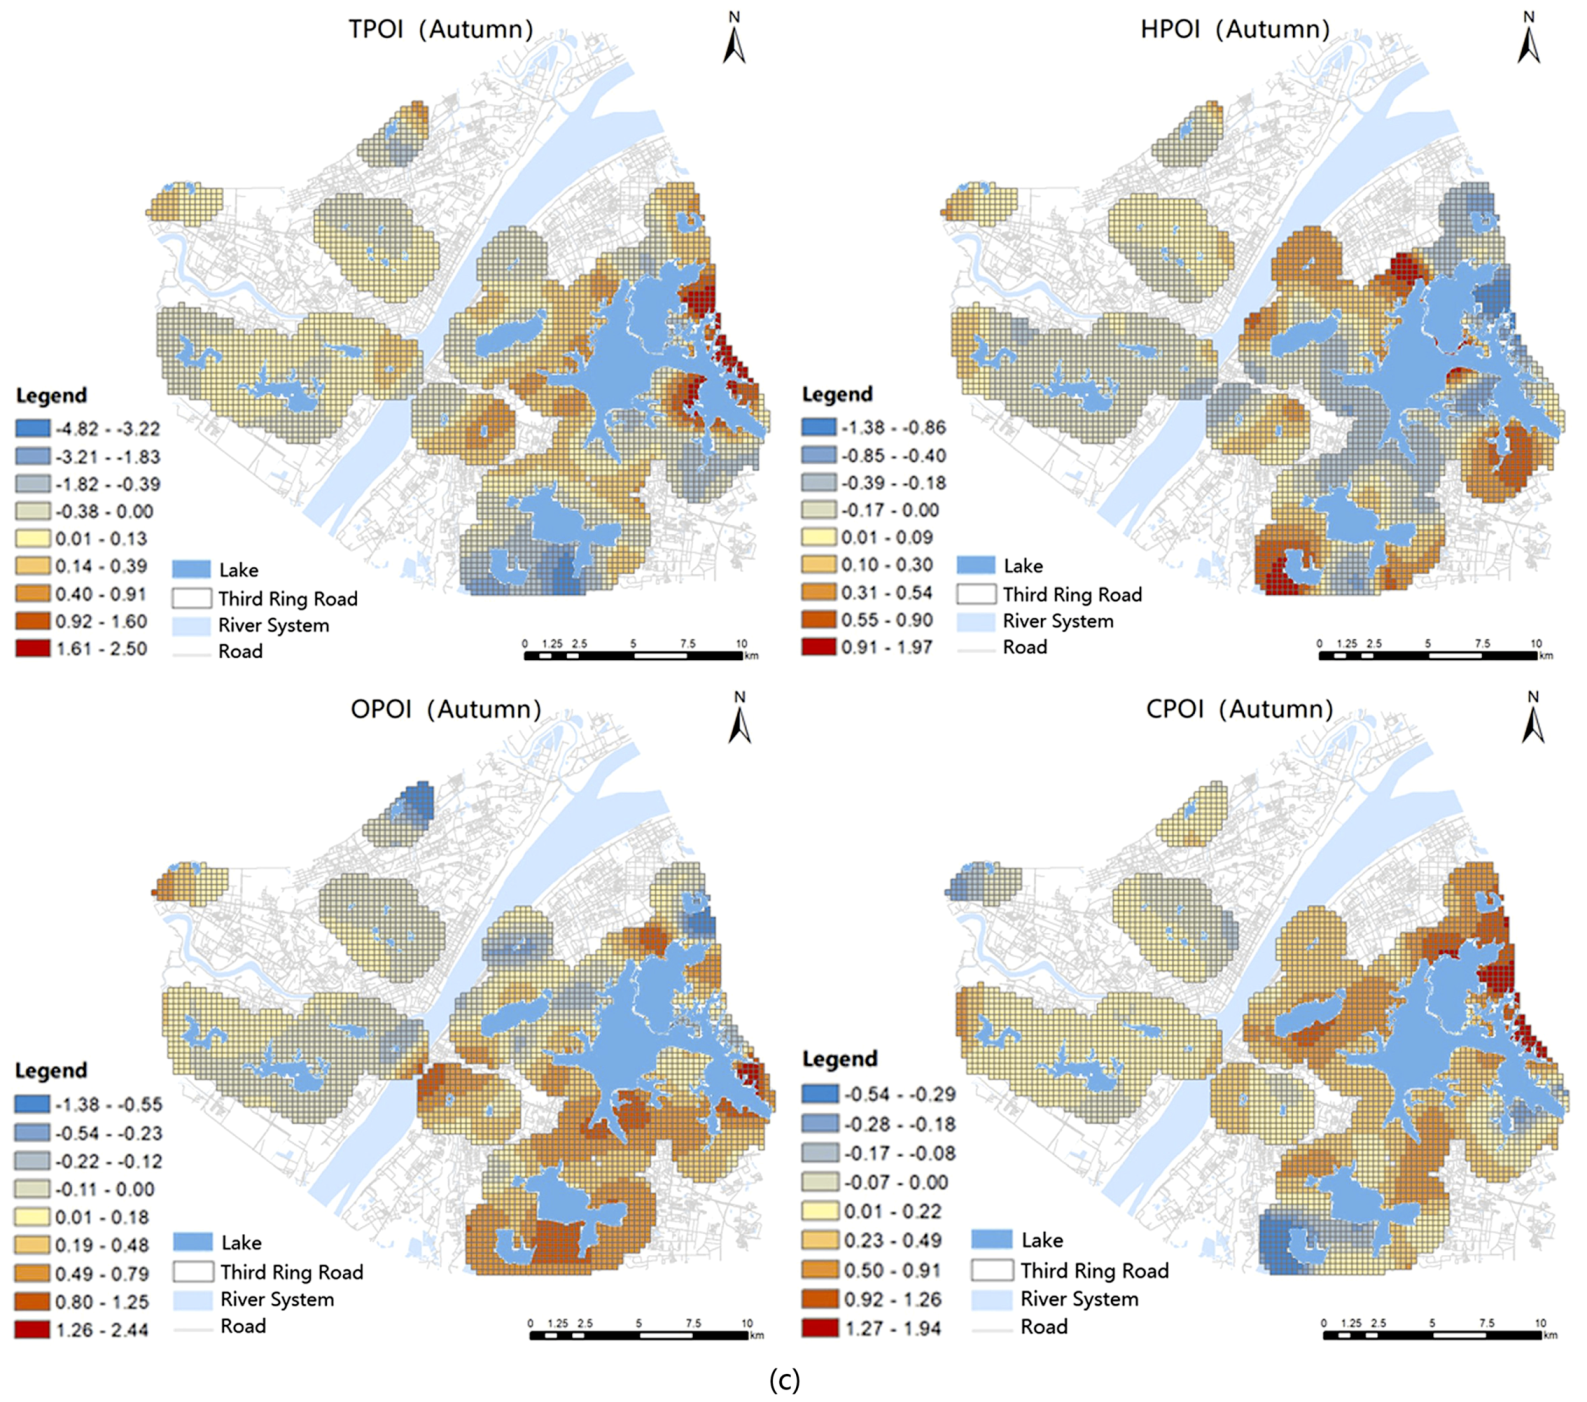
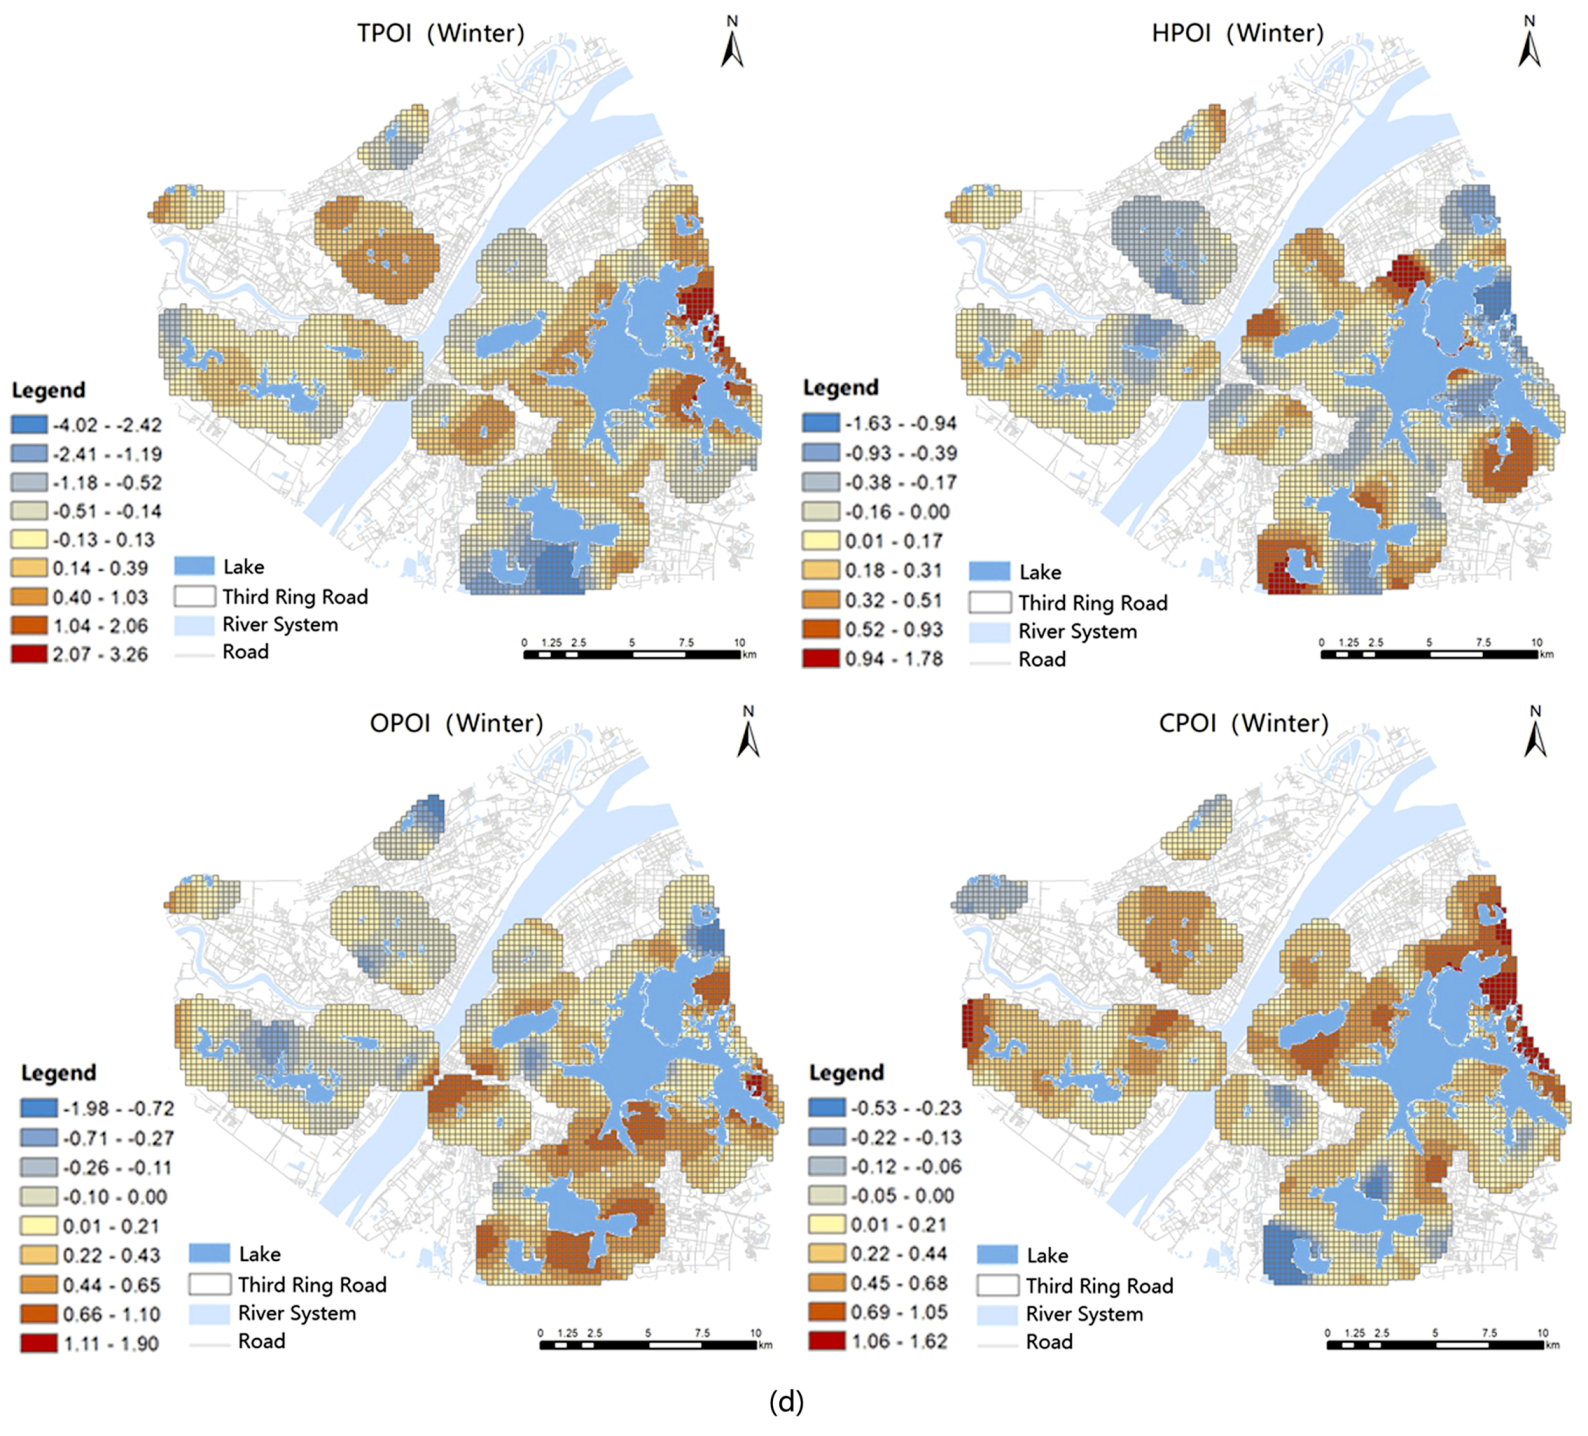
As shown in Figure 10, the characteristics of the effects of POIs on urban waterfronts indicated that CPOI had more impact on East Lake and Inside Sand Lake waterfronts, whereas the southwestern area of East Lake was remarkably affected by OPOI in autumn. In spring, the effect of CPOI on Machine Lake, West Lake, North Lake, and Moon Lake waterfronts was improved to reach the same level of Wuchang waterfronts, which had higher rates. CPOI had a great impact on the Houxiang River waterfront during summer.
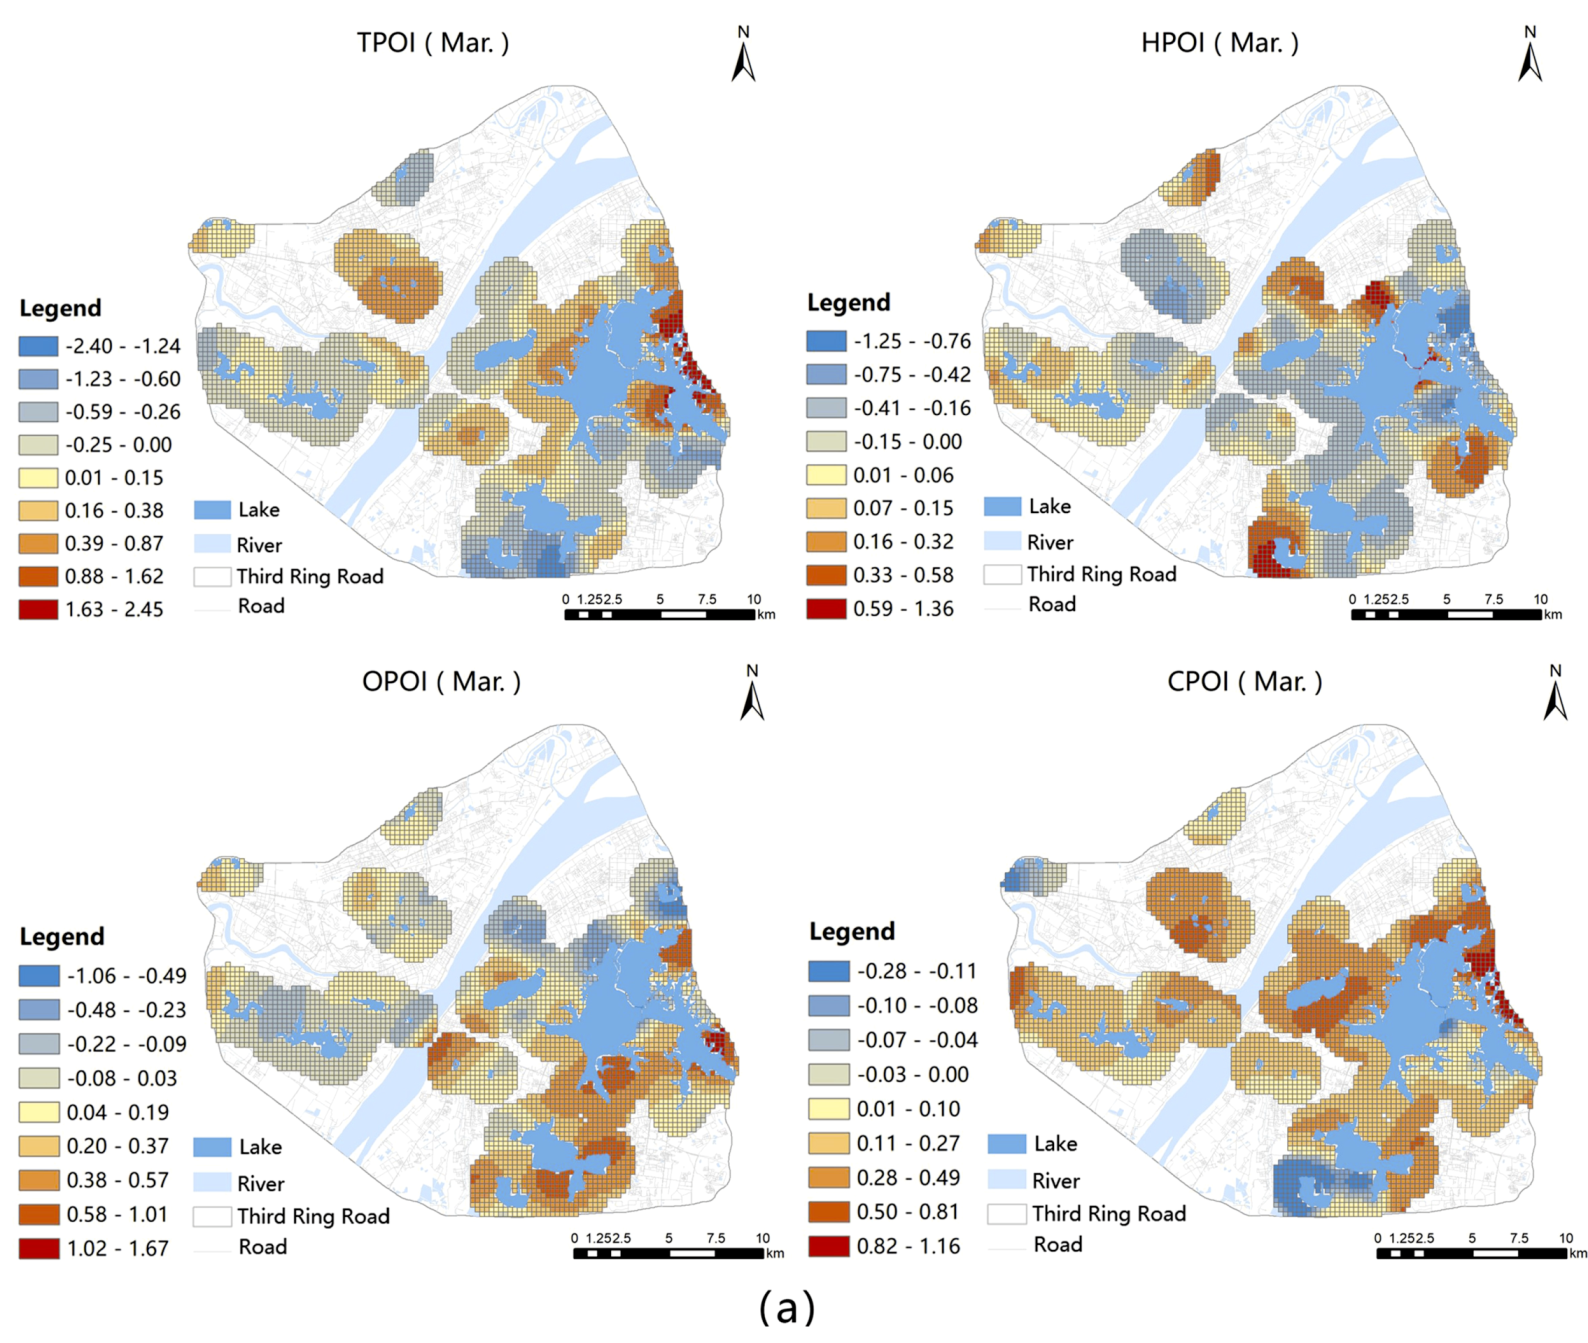
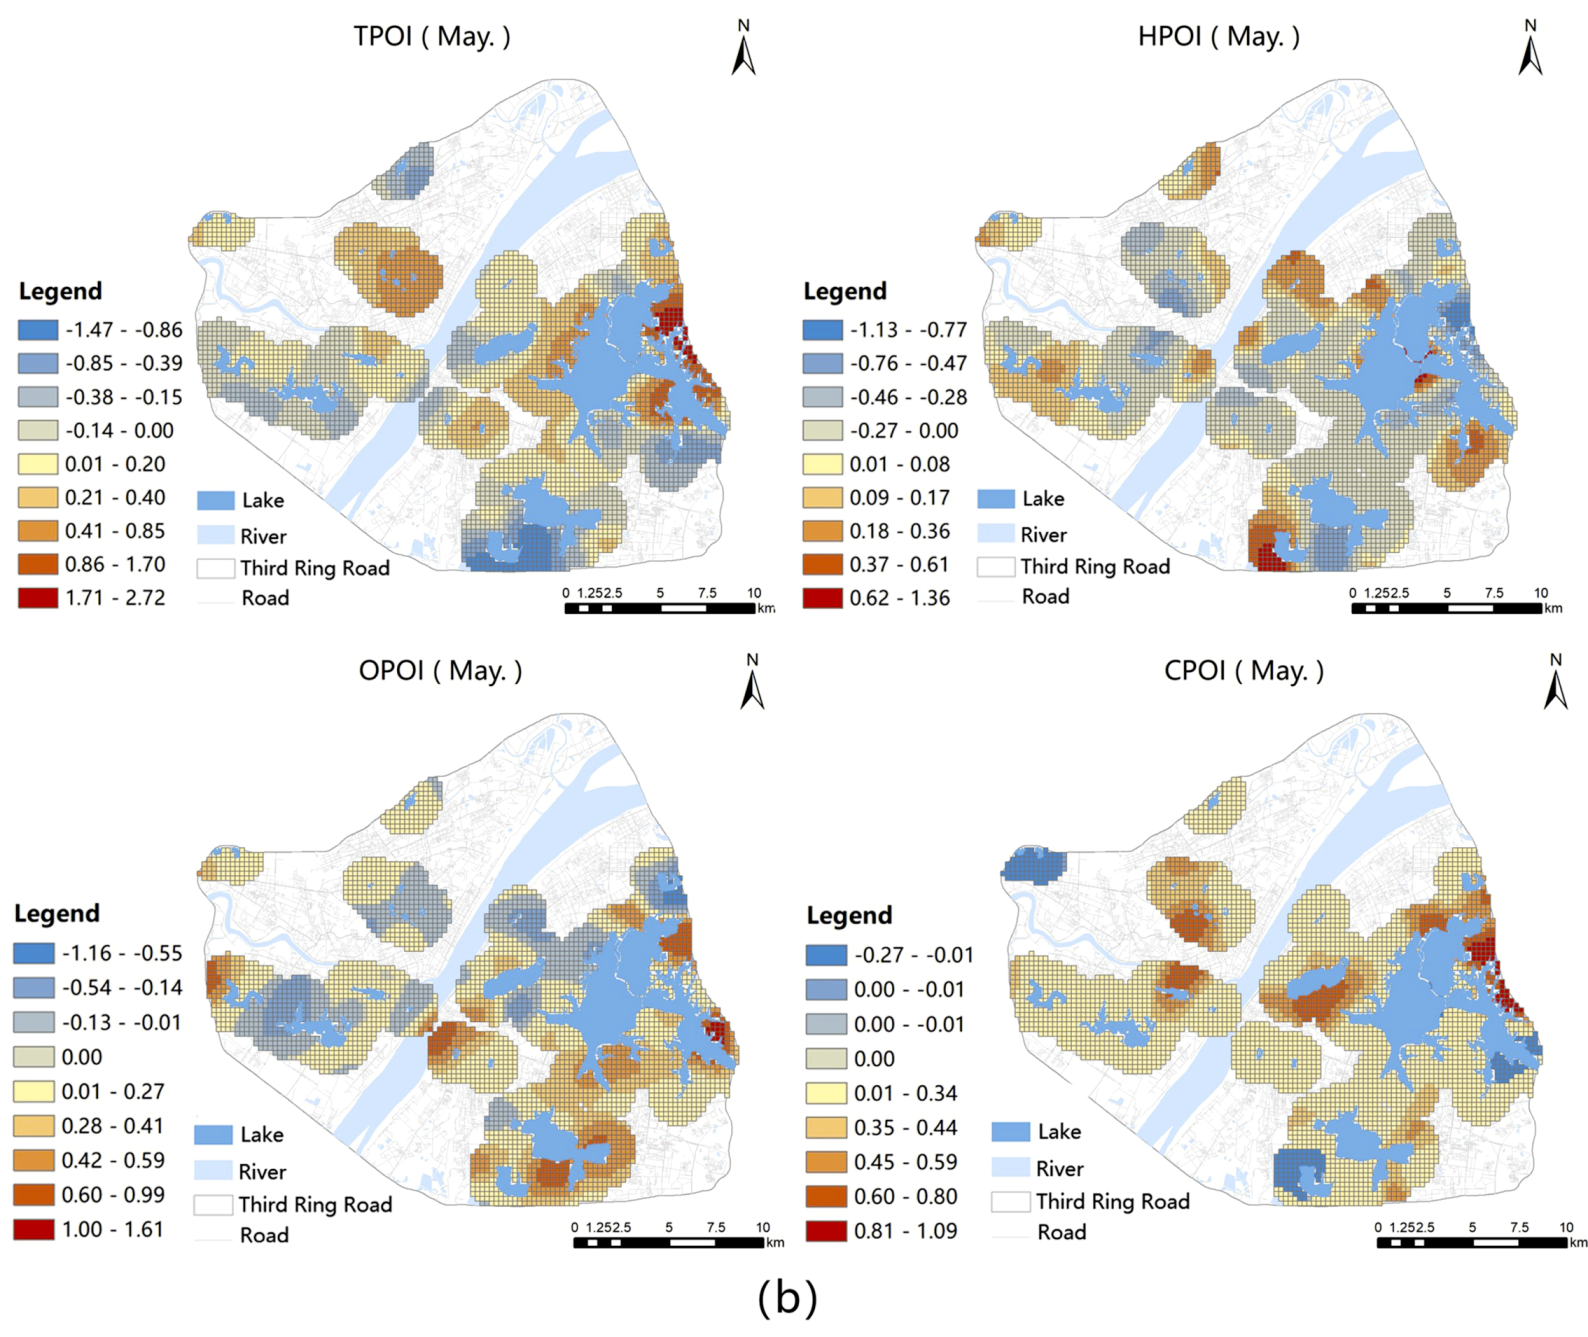
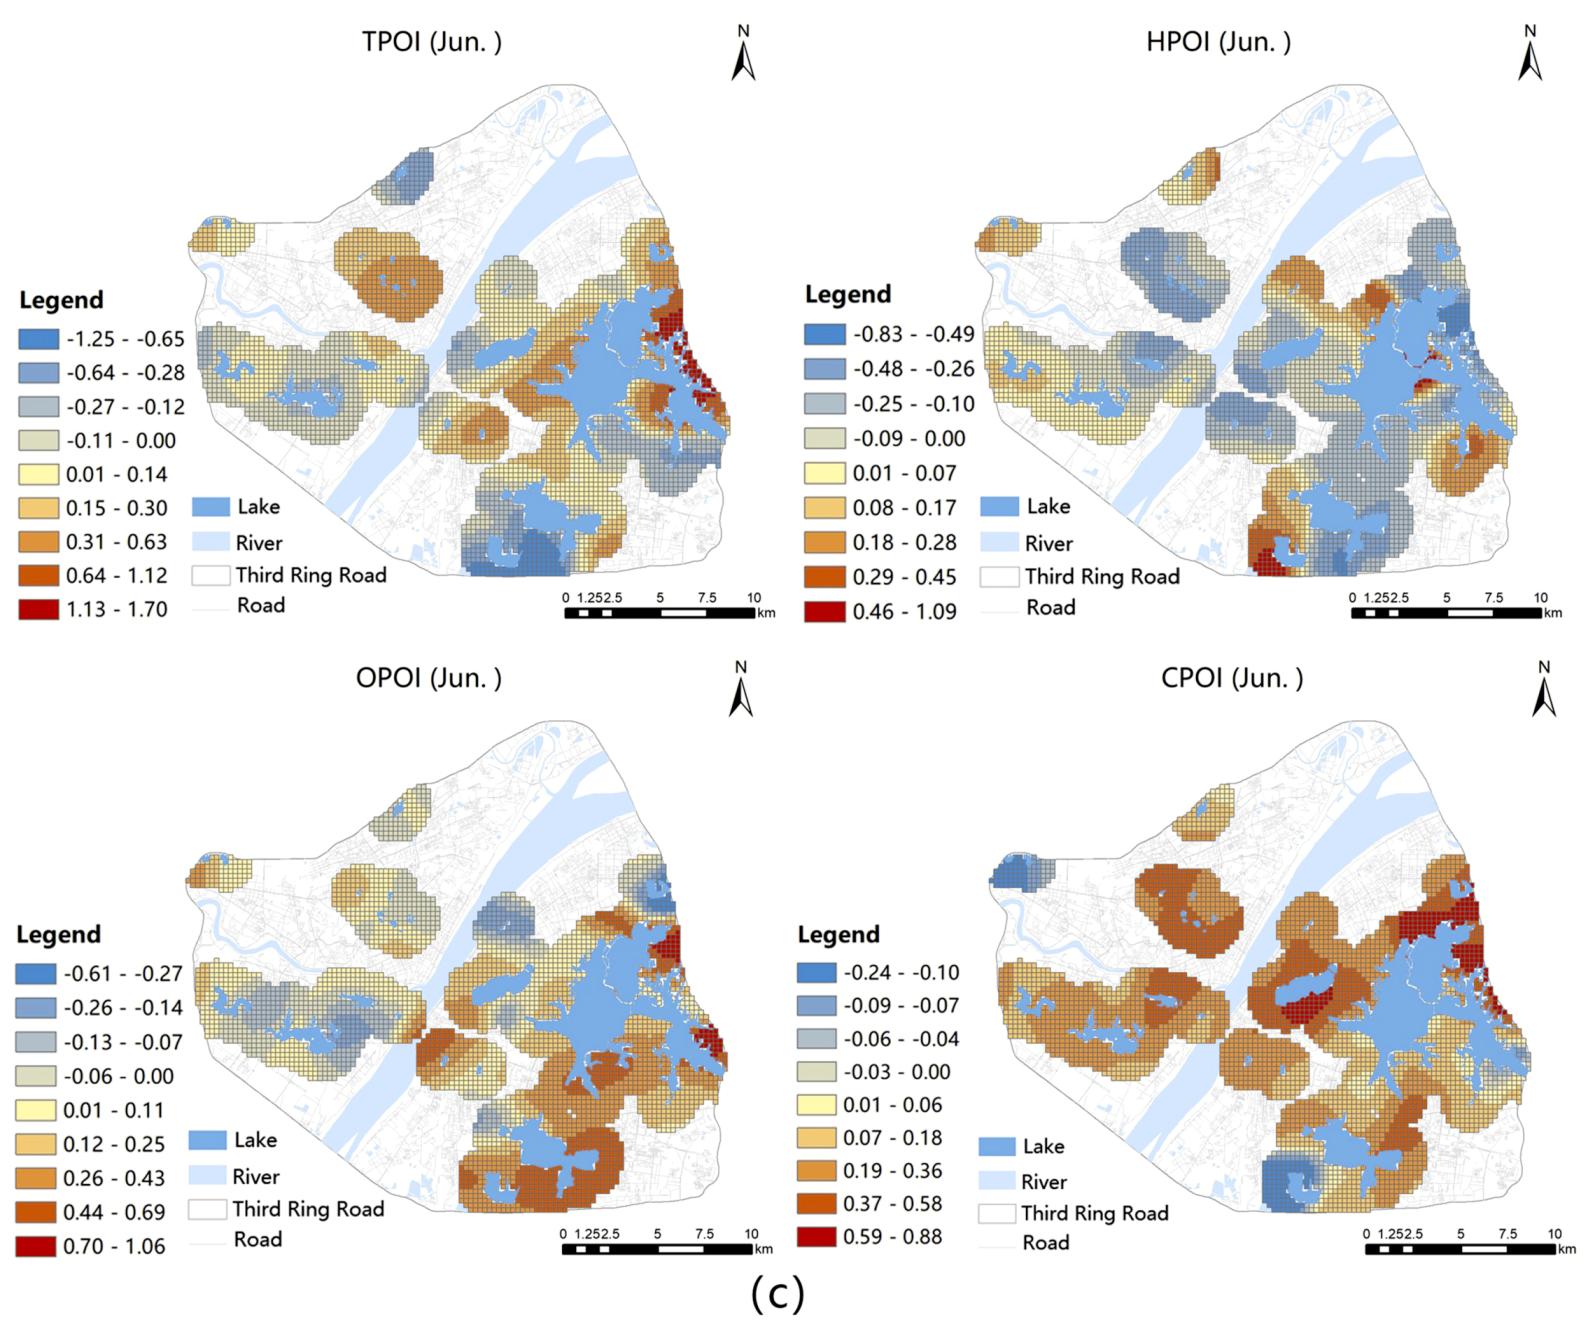
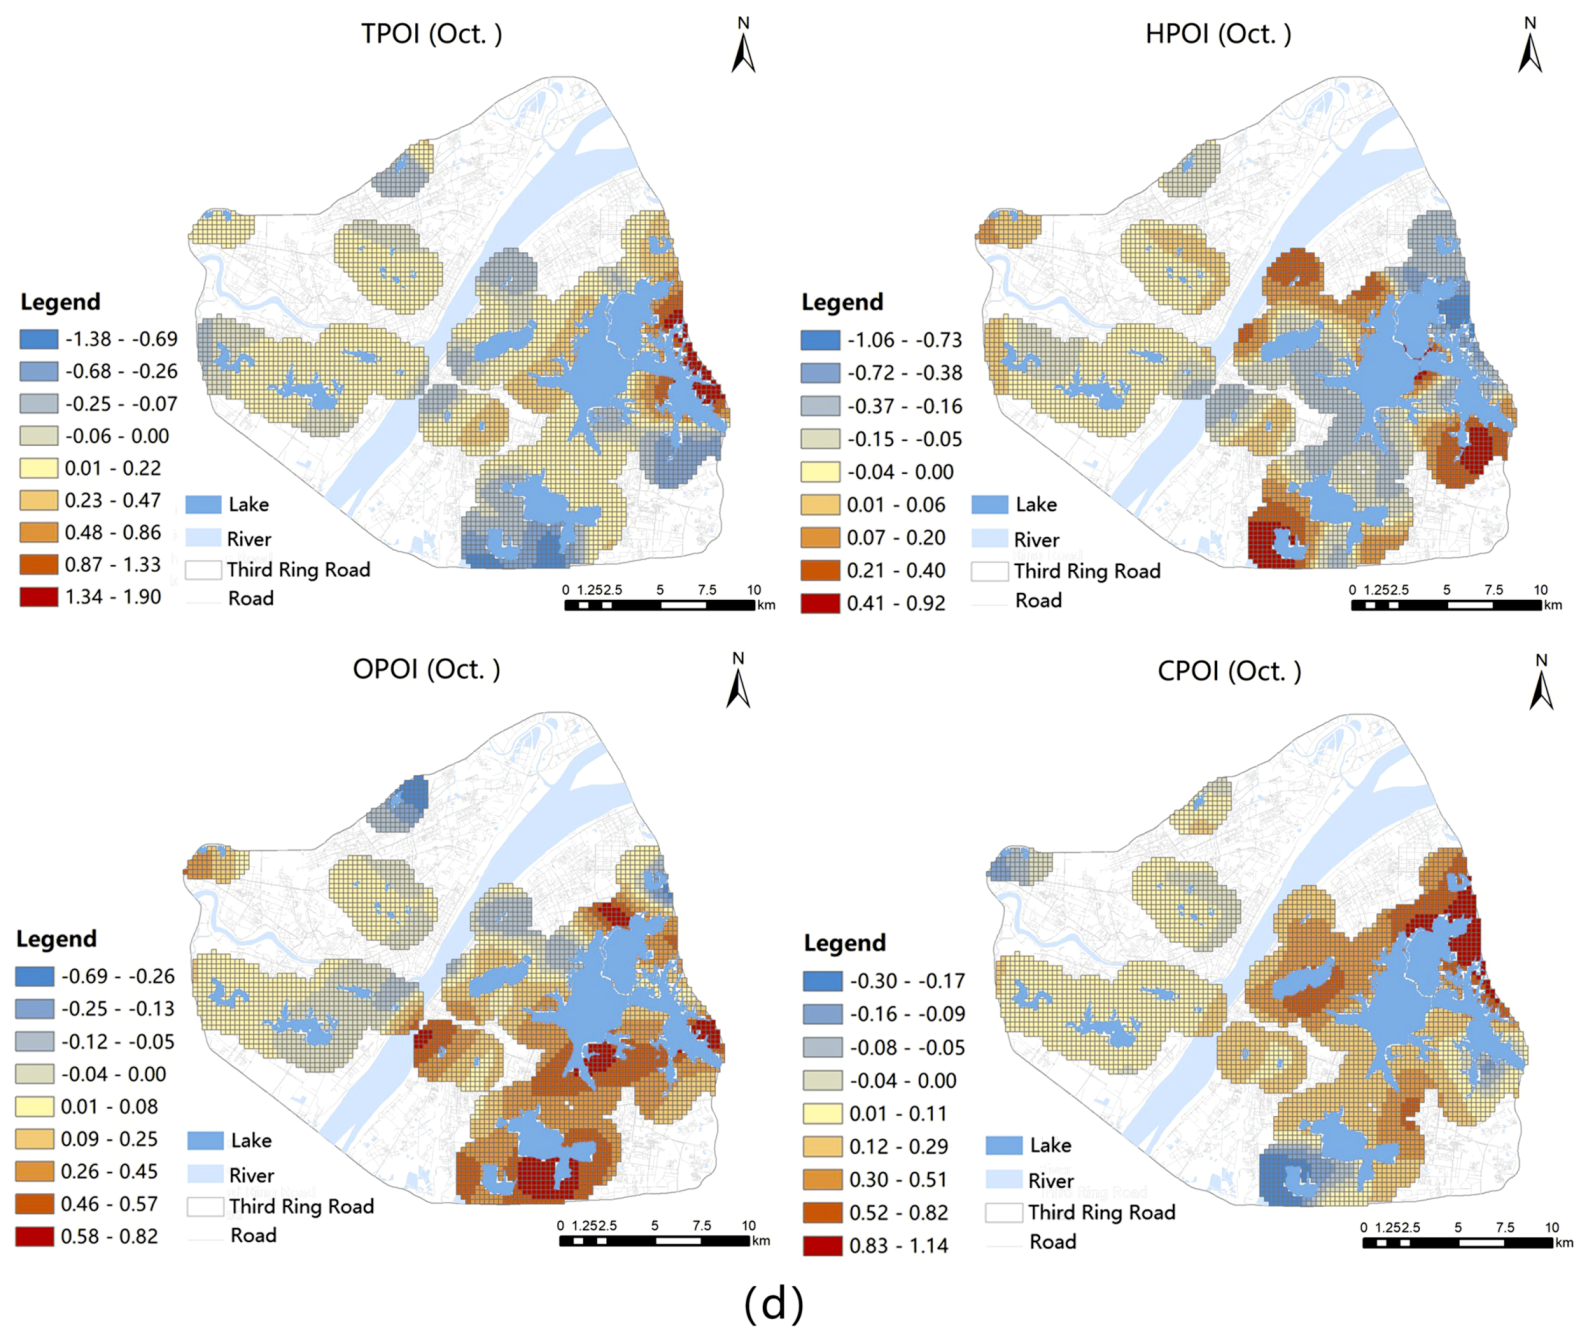
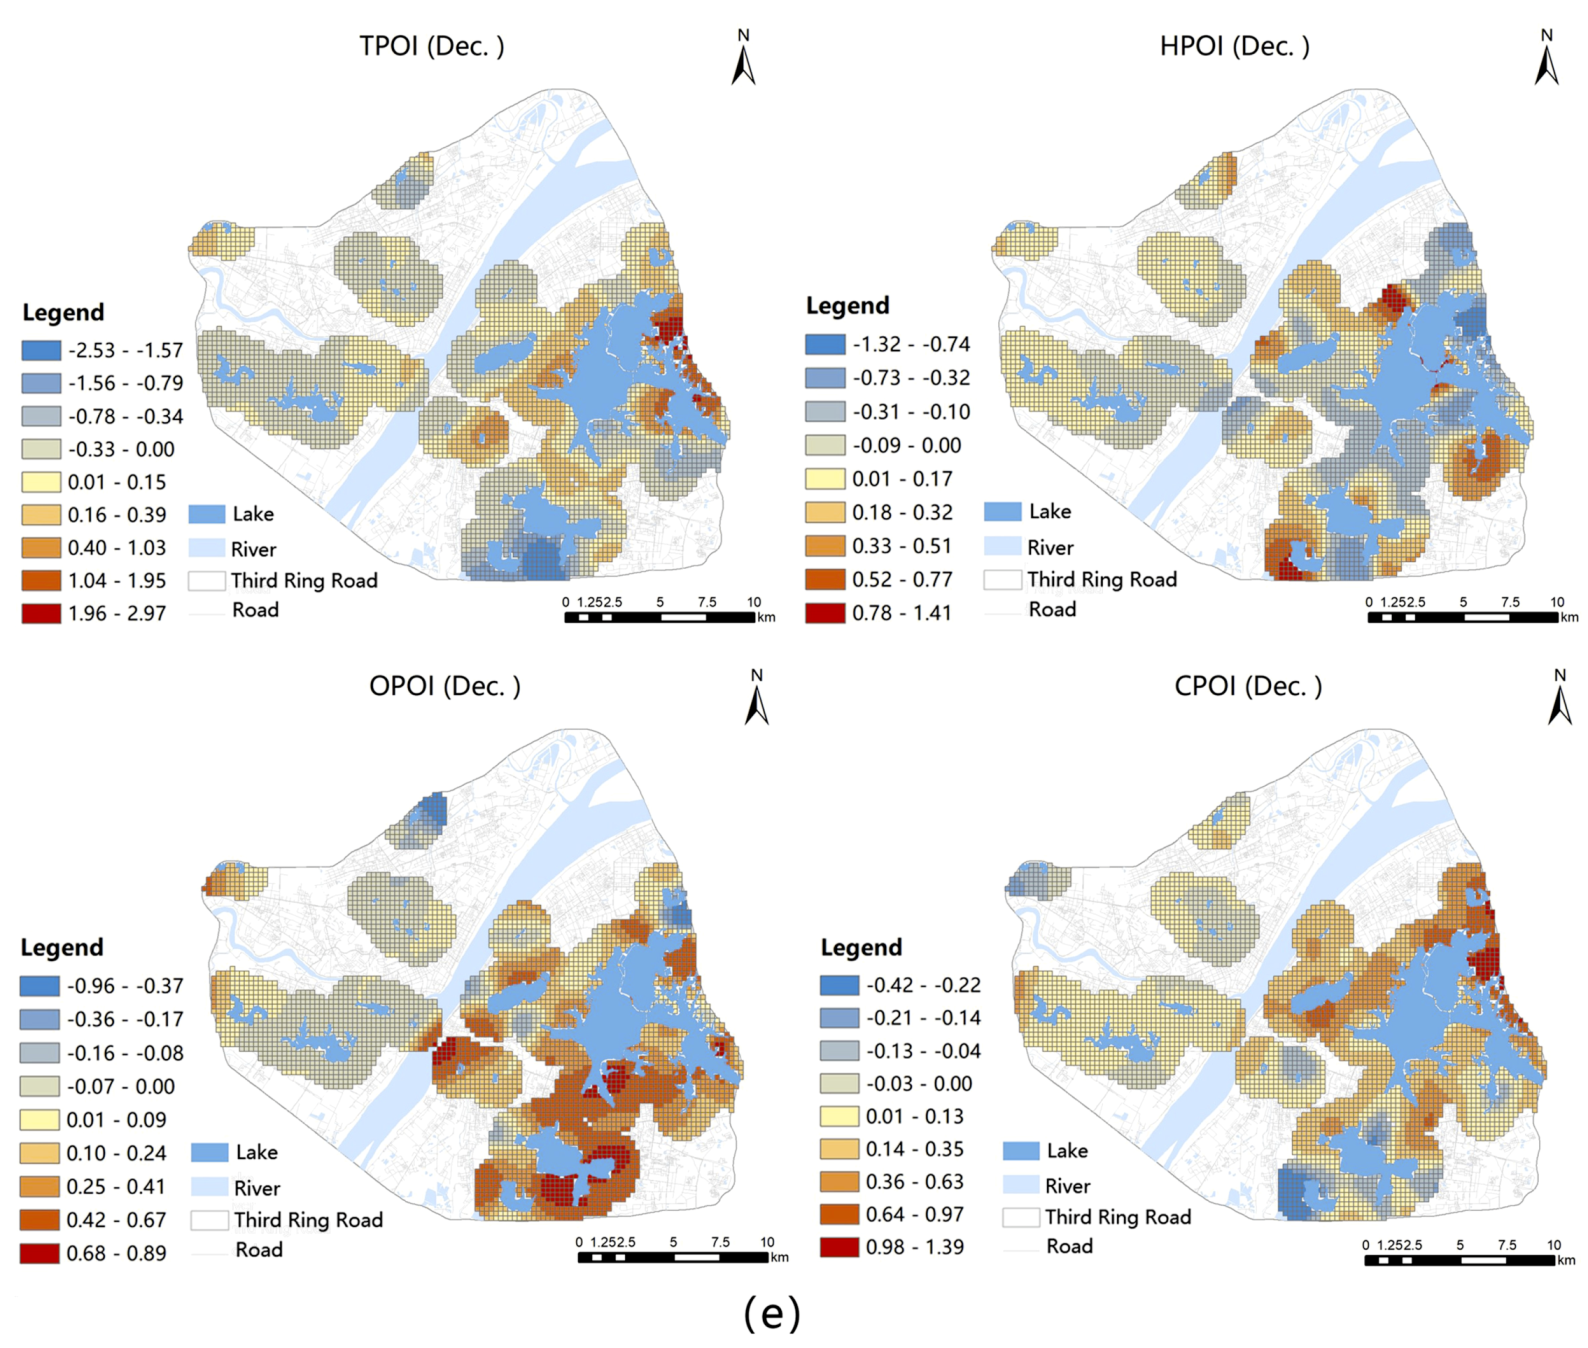
Figure 11 demonstrates that OPOI and TPOI had a significant impact on the social seasonal waterfronts in some months. For example, OPOI was a significant influence on the vibrancy of the East Lake waterfront in March, June, and September. The effect of TPOI on the Houxiang Lake waterfront was significant in May and became more than that of CPOI in June. The influence of TPOI on Lotus Lake and Shuiguo Lake waterfronts continued to rise. During particular months, the overall impacts of POI were smaller than that observed at usual times.
Although the influence of POI also had a lot to do with people’s routines, CPOI can produce the greatest premium for vibrancy at any time, whereas HPOI was almost negative. In some periods of time, such as high seasons or periods of events, TPOI and OPOI had evidently more extensive effects.
4.4. Temporal Characteristics of Human Behavioral Preferences in Urban Waterfronts
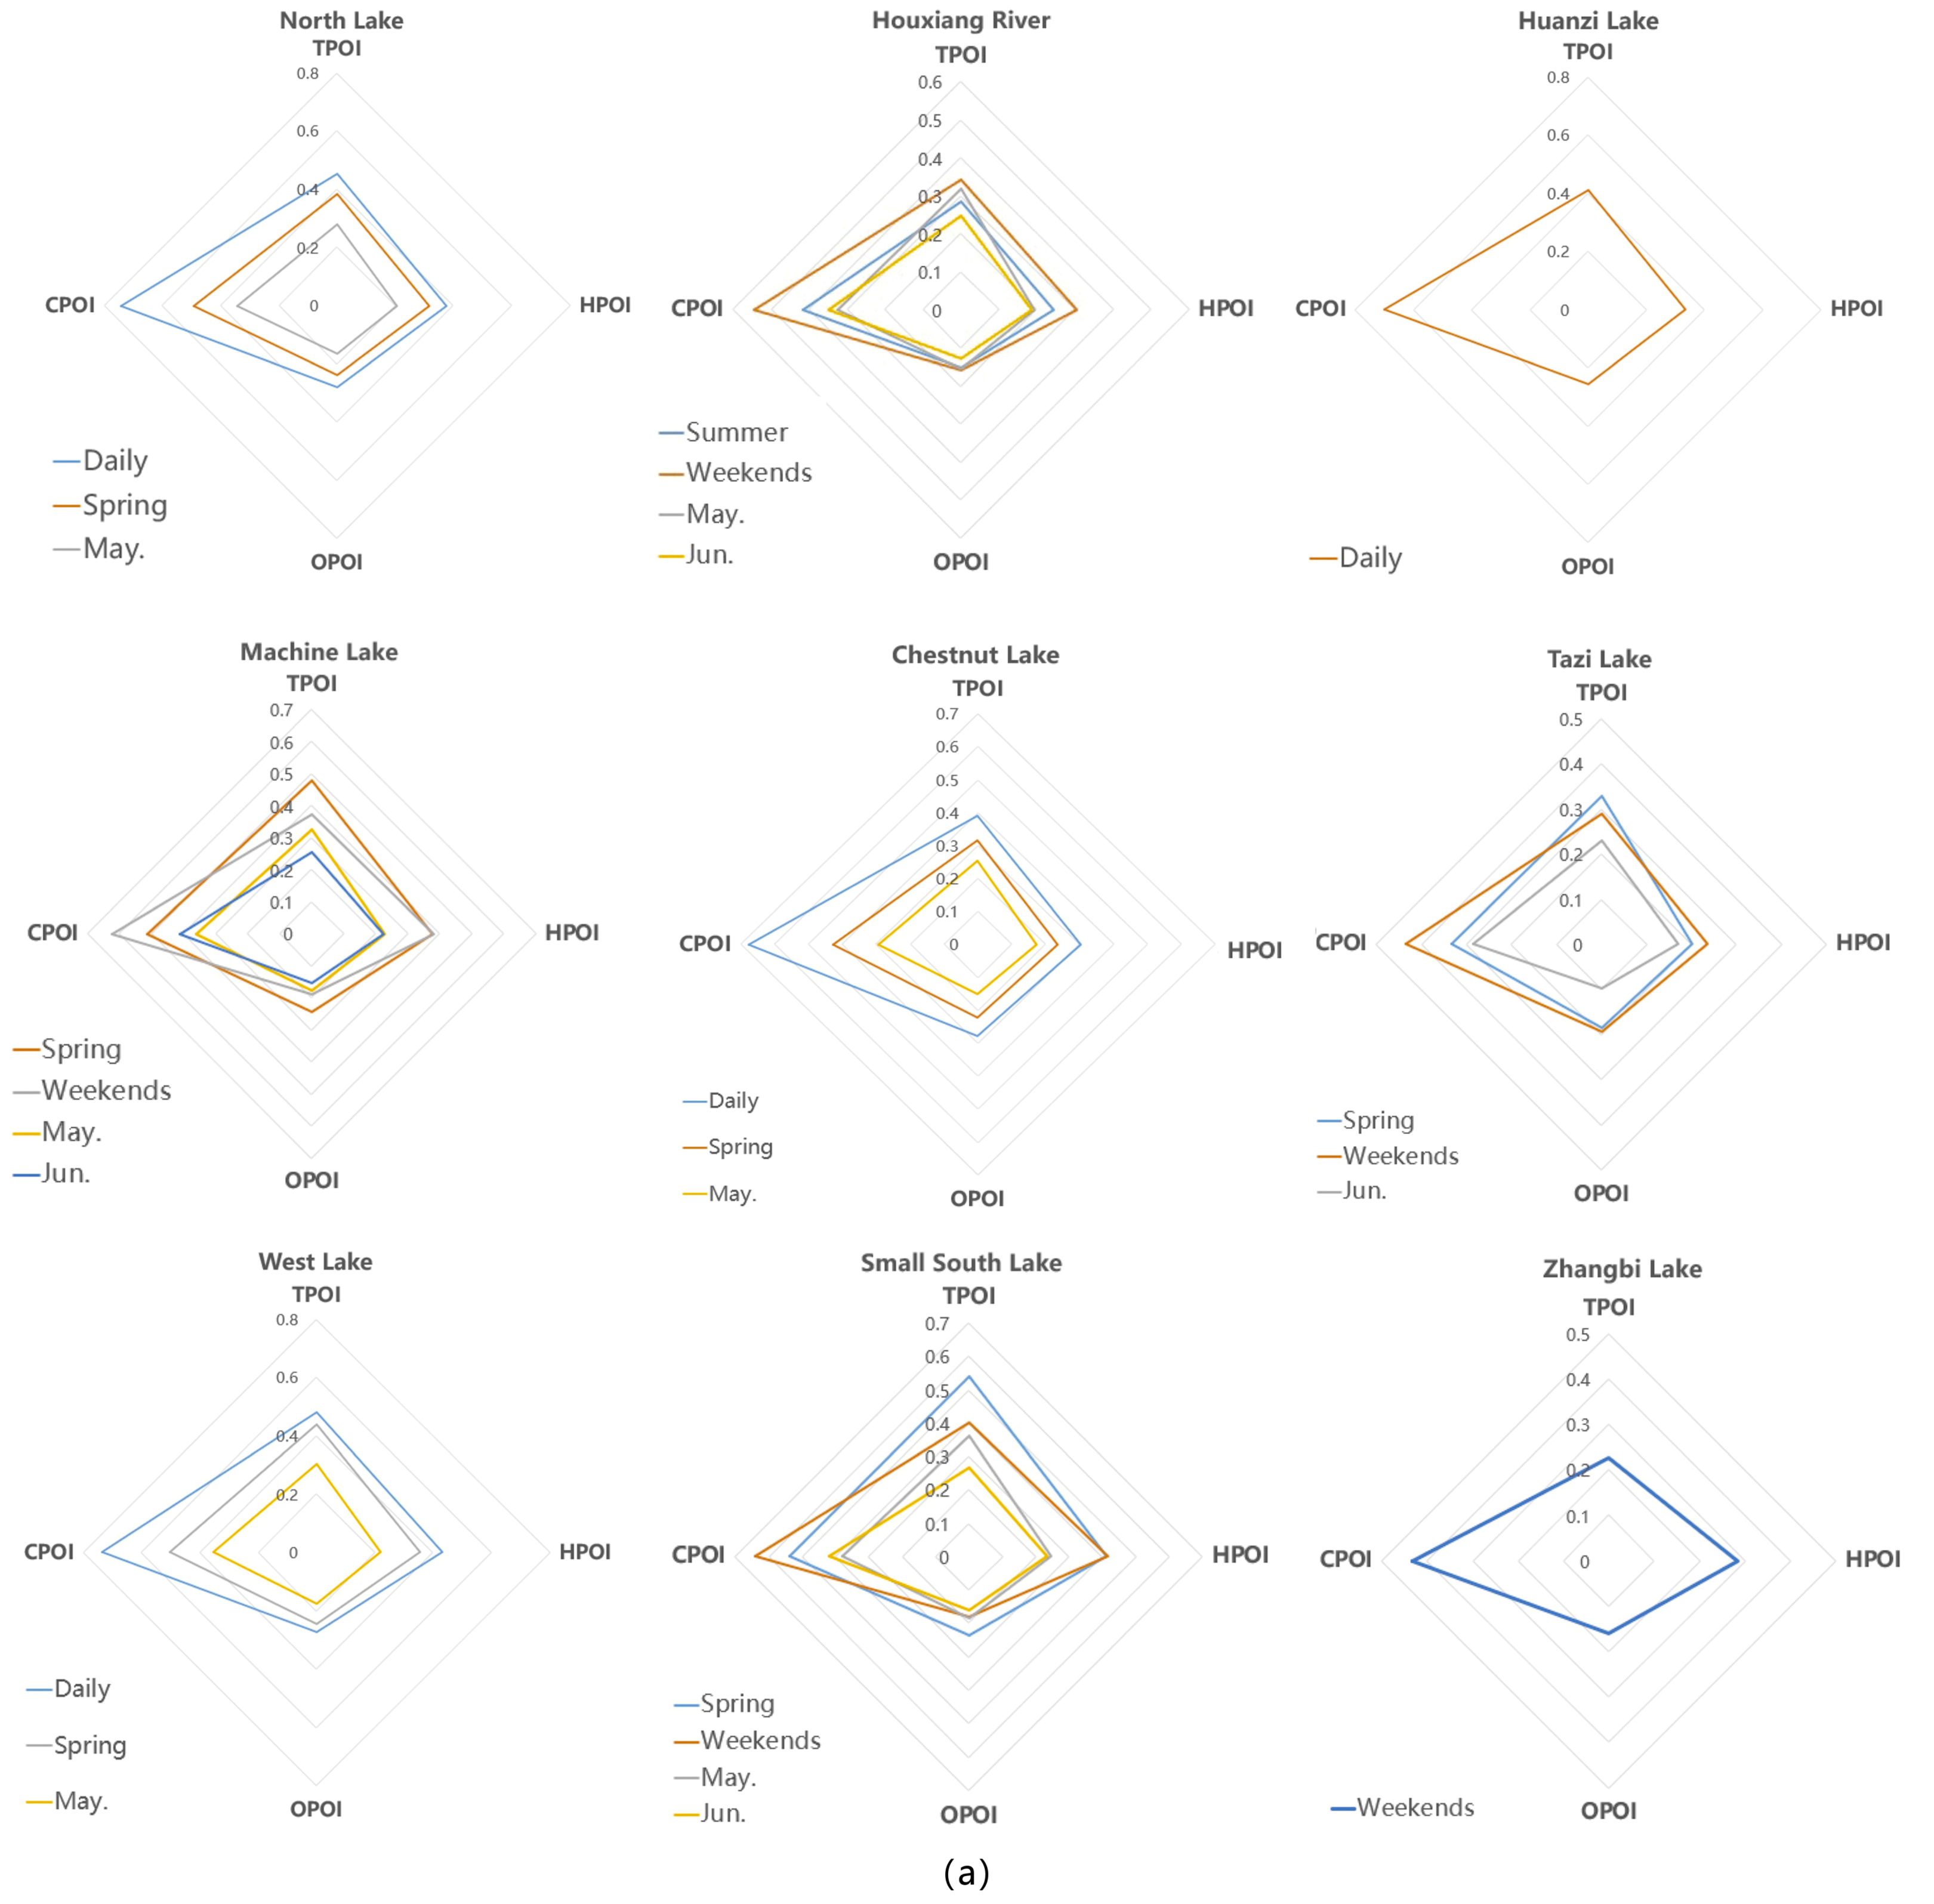
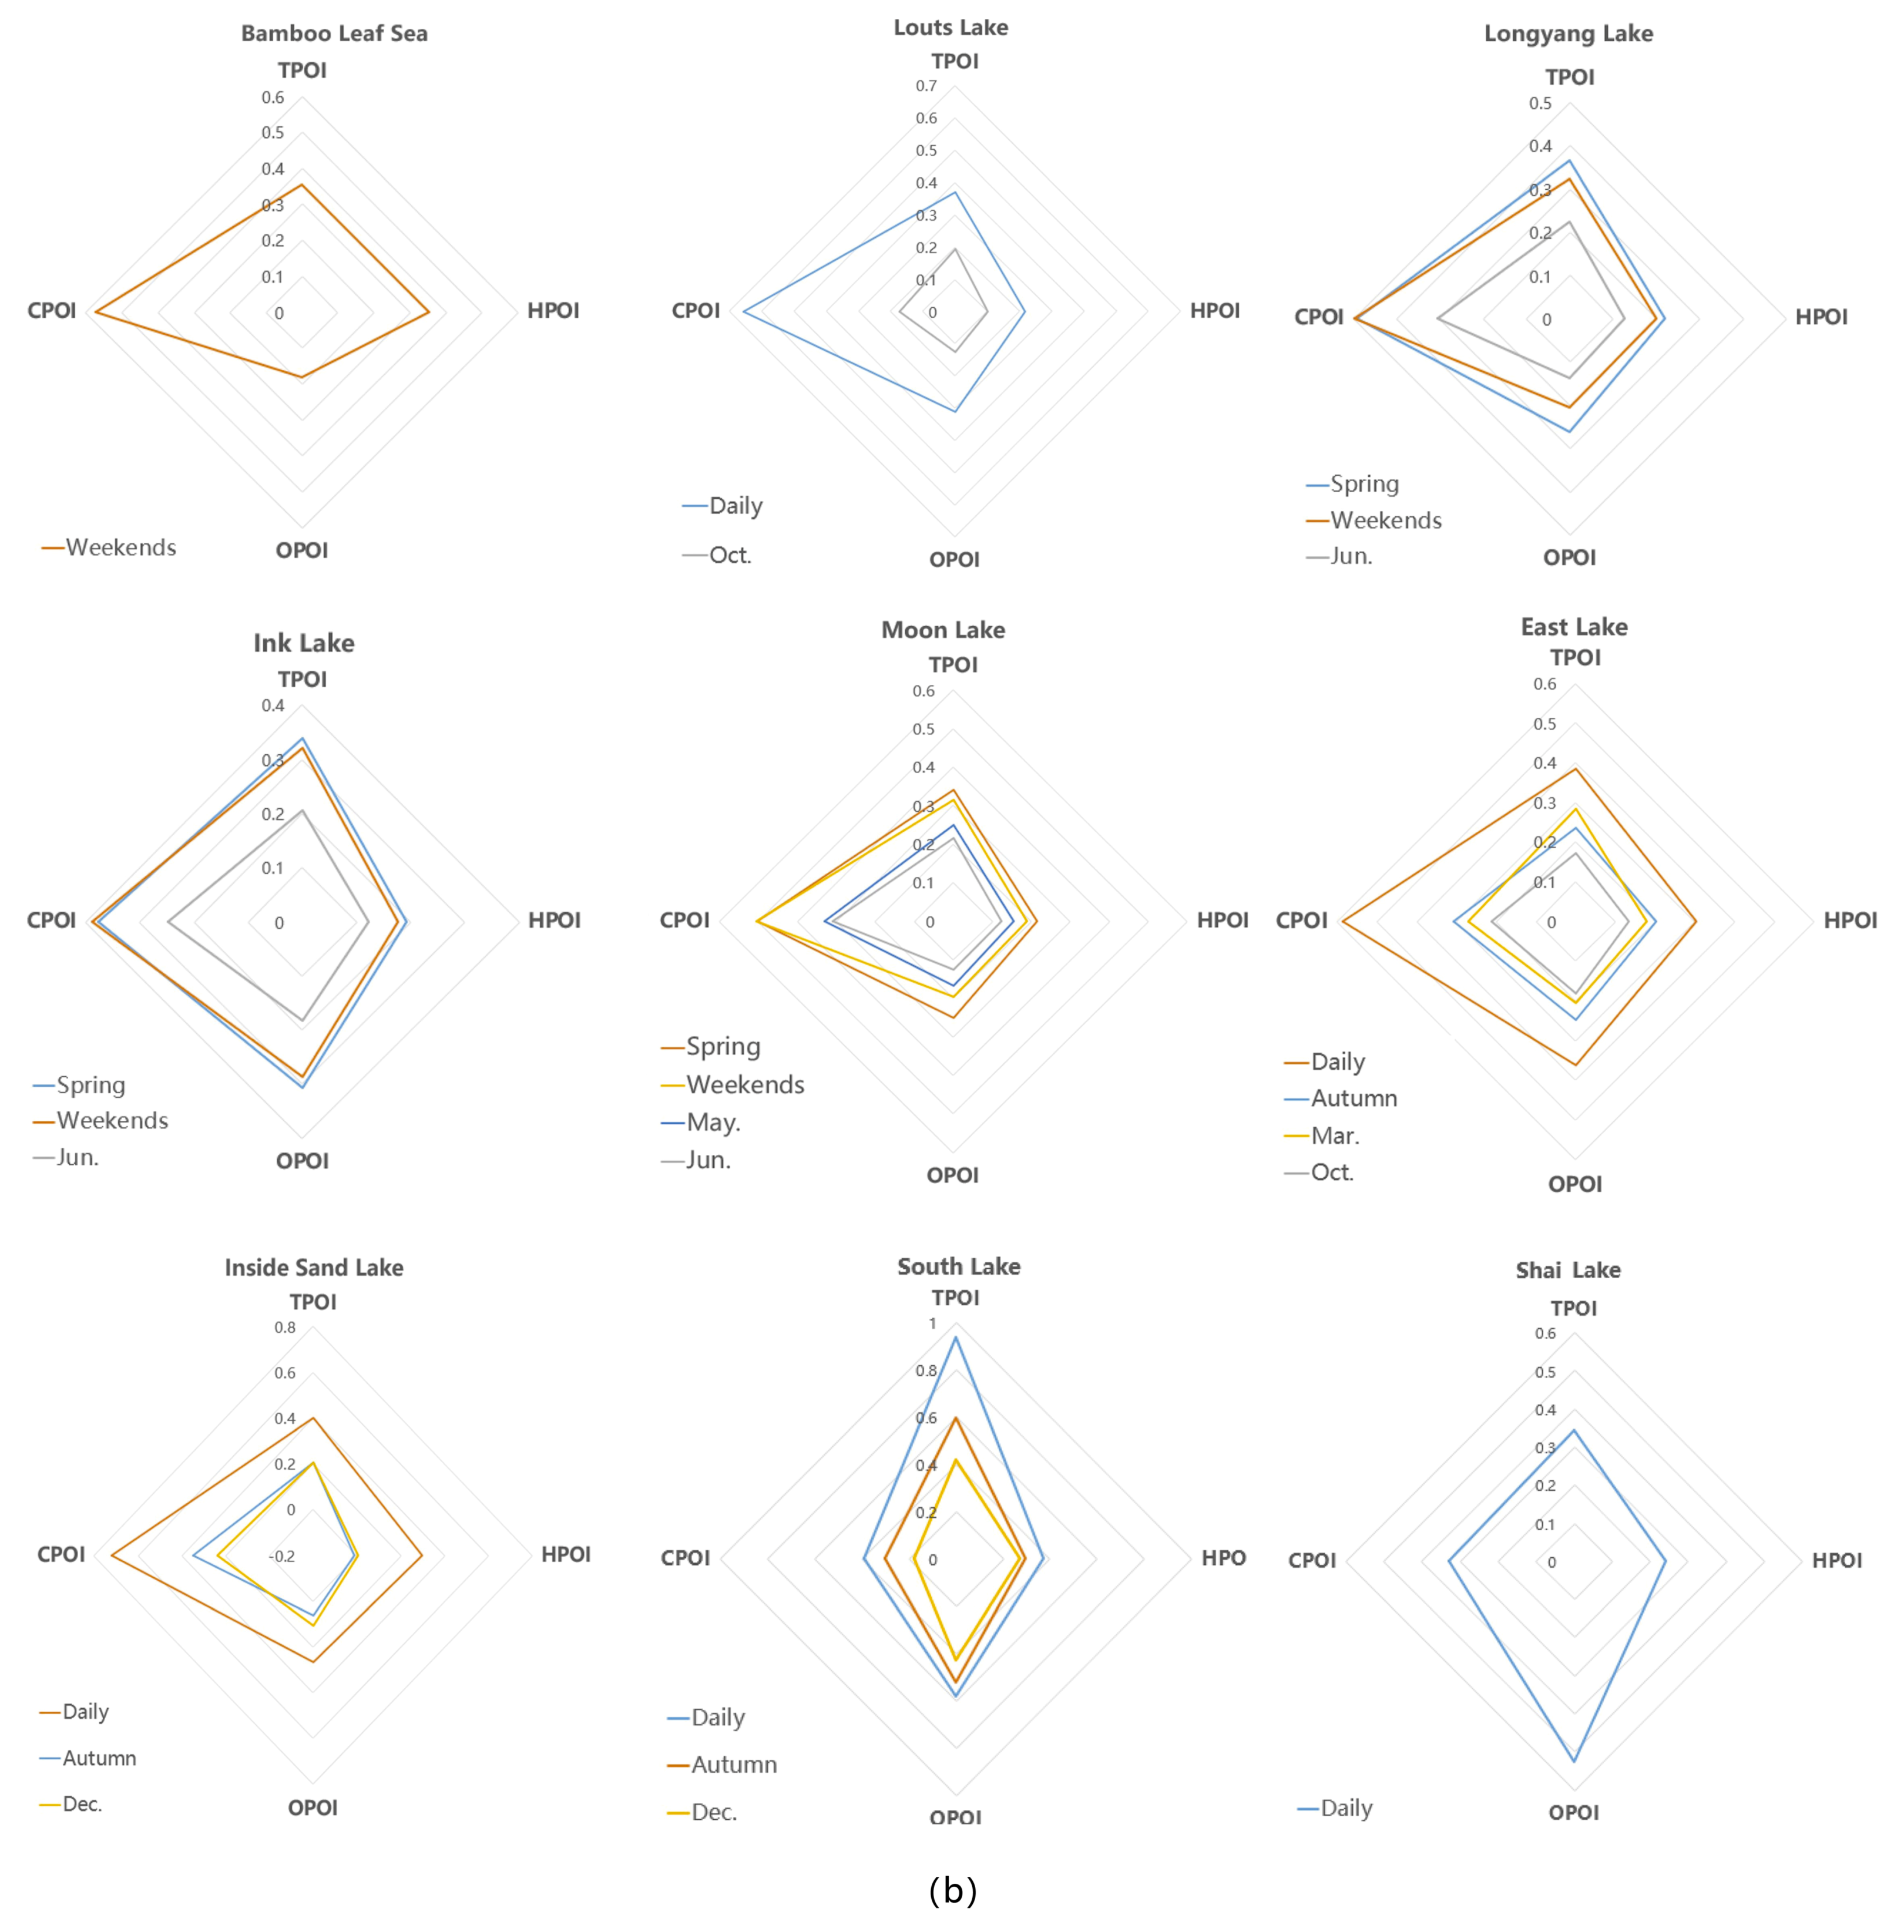
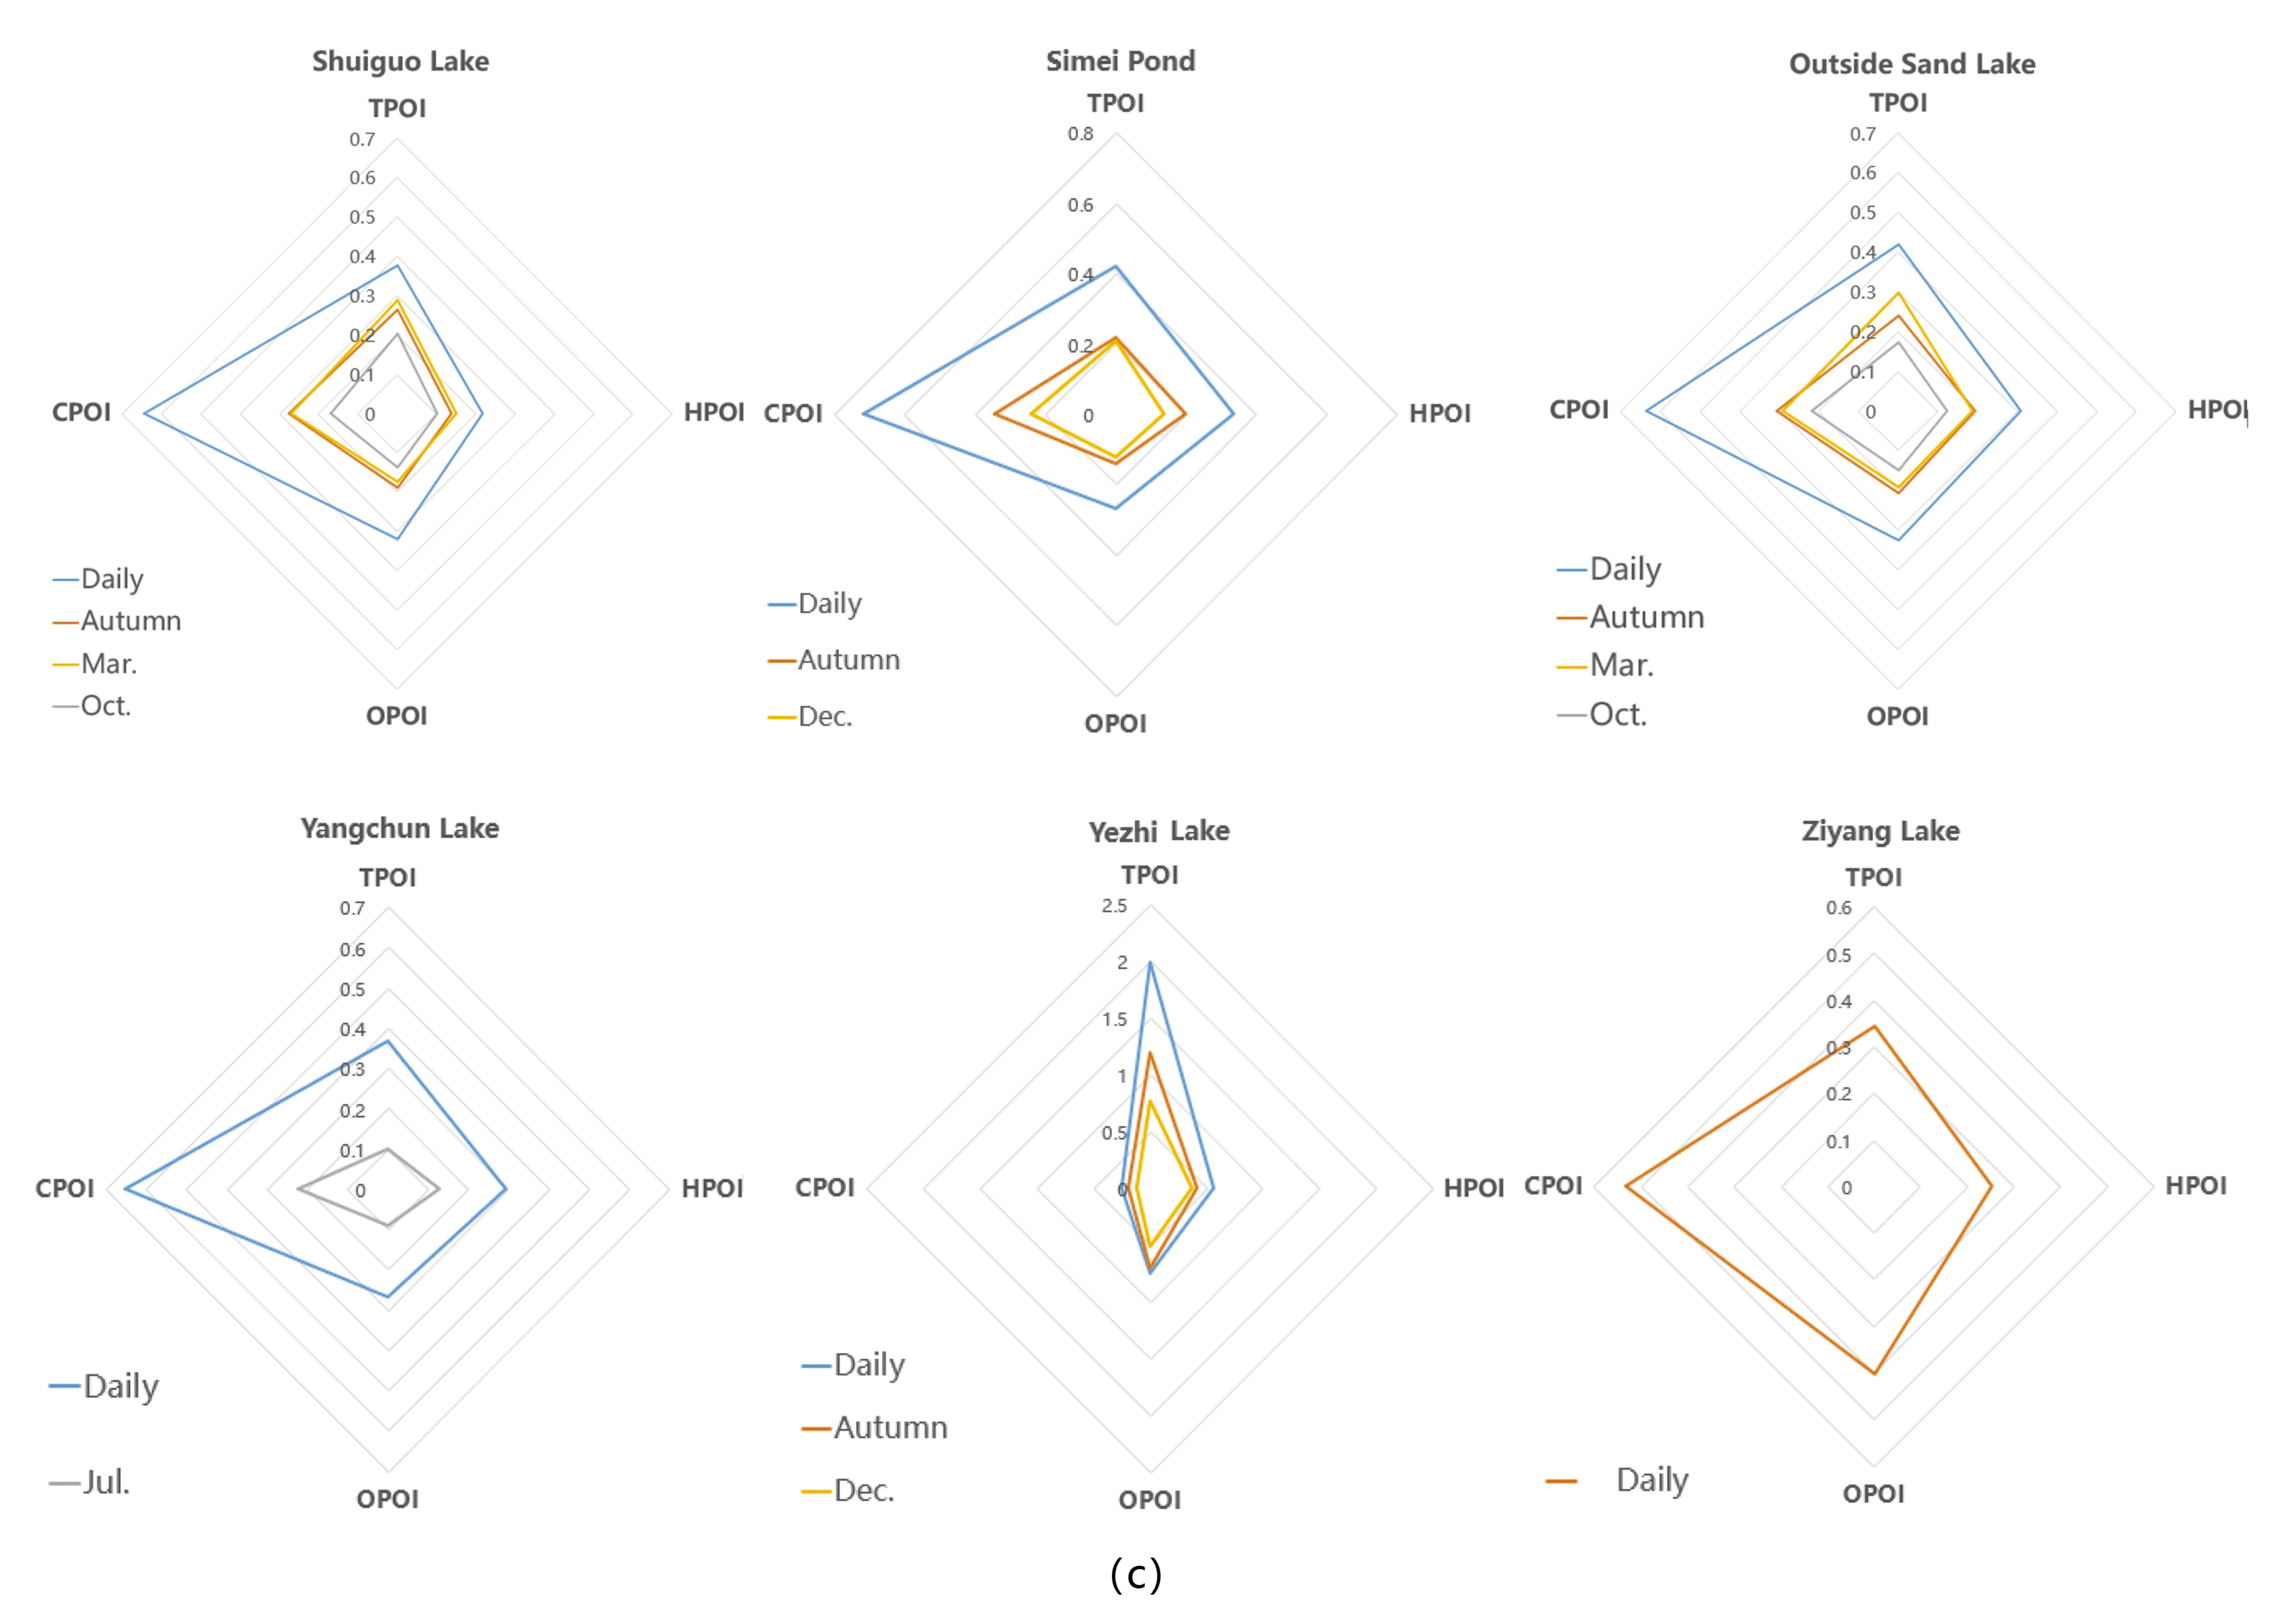
Figure 12 shows the impacts of the four types of POIs on various types of waterfronts at various times to analyze the temporal characteristics of human behavioral preferences.
Results showed that the vibrancy of the daily waterfronts (e.g., West Lake, North Lake, Yangchun Lake, and Shai Lake waterfronts) was mainly related to people’s daily routines. Most daily waterfronts had high coefficients of TPOI according to Figure 9 and Figure 12, which meant that TPOI had a greater impact on commuting time. Moreover, the CPOI coefficient of the daily waterfronts such as West Lake and North Lake, which are located in the heart of Hankou Town and are surrounded by habitations, as well as the famous leisure and cultural street called “Garden Road,” was high, making their waterfronts feature strong vitality after daily work. This result showed that people preferred to eat out in waterfronts during leisure time, with added recreational activities after work. The continuously growing impact of CPOI on the daily waterfronts between 22:00–24:00, which improved their attractiveness and vigor, was consistent with the fact that Wuhan is famous for its lively nightlife.
Figure 9 showed that the overall influence of POIs of the waterfronts was greater on weekdays than on weekends. However, the coefficients of CPOI and HPOI tended to be higher than other POIs in the weekend waterfronts. This indicated that people preferred to stay at home or visit the weekend waterfronts with cultural themes or beautiful natural landscapes to socialize rather than to focus on their facilities. For example, the local government in charge of the Moon Lake waterfront exerted a good amount of effort to build an arts and cultural region. However, their cultural consumption and activities failed due to a lack of related businesses and service facilities, such as restaurants, which will influence people to engage in monotonous activities. These factors make waterfronts less vibrant.
The natural seasonal waterfronts are closely geared toward natural seasons. The hot summer weather in Wuhan, known as one of China’s “four ovens,” contributed to a decline in the frequency of visits. However, the number of visitors to Wuhan increased in spring and autumn, when the seasons make the attractions suitable to visit. Thus, most natural seasonal waterfronts were vibrant during spring or autumn. For instance, the cherry blossoms in waterfronts, such as the East Lake waterfront, during spring attracts numerous people. At that time, people visit waterfronts to enjoy natural scenery. Thus, POIs had lower coefficients at these times than other times. However, compared with other waterfronts, waterfronts in Wuchang Town headed by the East Lake waterfront may show more vitality, owing to the variety of facilities, high degree of mixed functions, and a wide range of services.
The vibrancy of the social seasonal waterfront was mainly affected by social behaviors, such as traveling and events. For example, Figure 12 showed that OPOI had a significant impact during March on the East Waterfront, where many colleges and universities are situated around the southern coast of East Lake. Wuhan University, which is rated as the most beautiful campus in China, attracts a large number of visitors during the golden week and increases visitors in scenic spots around East Lake. Furthermore, events are held in waterfronts, such as the Wuhan University and Huazhong University of Science and Technology’s dragon boat race and the water marathon. Owing to the influence of some events on the vibrancy of the social seasonal waterfronts and relatively concentrated peak times, TPOI showed a strong impact. As a prominent representative, the Tazi Lake waterfront with a higher TPOI coefficient attracted people, because it is considered the seat of the Wuhan Sports Center and attracts major competitions in June. Moreover, events that were organized by colleges and universities around waterfronts may also improve vigor.
Since the 1990s, a large number of estates have emerged in the Wuhan waterfronts, surrounding the lakes with high-density buildings that destroy the waterfront landscape [59]. As a result, OPOI has a negative effect.
5. Discussion
In this era of big data, social media may impact people’s lives in every aspect. The check-in data from Sina Weibo were chosen to reflect the mobility and aggregation of human behavior tracks to study the dynamic change regularity of urban waterfronts with time. On the basis of social media data, a framework that incorporates the seasonal index analysis method of time series data, KDE, GFM, and GTWR was proposed to explore the temporal distribution characteristics of check-in points and people’s behavioral preferences for various types of waterfronts at various times.
Our study has shown that human behavioral preferences for waterfronts vary at various times.
First, on weekdays, vibrancy continuously rose, especially at 18:00, reaching a peak at 22:00–24:00. During this time, a greater impact of CPOI illustrated that people tended to go to waterfronts after work to engage in recreational activities, which were dominated by consumption and exercise. Therefore, daily waterfronts conveniently close to habitations and convenient to walk may be a top priority.
Second, on weekends, people preferred the weekend waterfronts with complete entertainment facilities and certain cultural backgrounds, such as the Moon Lake waterfront, whose POI coefficient improved on weekends.
Third, spring and autumn were booming seasons for the natural seasonal waterfront and the core agglomerations were concentrated in some Wuchang waterfronts. The OPOI coefficient was high this time, for some colleges like Wuhan University had a wonderful cherry landscape. In general, the natural seasonal waterfronts with seasonal landscapes attracted people in various seasons.
Finally, the social seasonal waterfront may be more attractive in March, May, October, and other high seasons, especially during big water events. At these times, the high coefficient of OPOI and TPOI means that some waterfronts, especially in Wuchang Town surrounded by colleges and universities, can improve the attractiveness and vigor of waterfronts through big events.
6. Conclusions
6.1. Values and Innovations
This study used quantitative calculations and visualizations to display the dynamic changes of the vibrancy of Wuhan waterfronts at different times with different characteristics, which was dismissed in the field of urban waterfront research.
The data samples in this study were acquired from Sina Weibo. The use of abundant data reduces the effect of false information on the overall sample, which can reflect the value of online data to an urban study and plan practice. Moreover, the method proposed in this study may also be applied to other types of urban spaces and problems.
More importantly, this article emphasized the importance of human behavioral preferences based on several time series and the implicit temporal behavioral message of social media data, and bridged the gap in the literature A regression model of waterfront vibrancy and people’s behavioral factors based on POIs was established, and the influence of each factor on urban vibrancy was expressed quantitatively, which can help understand the temporal variation characteristics of people’s preferences for urban waterfronts.
The results of our research are of great value to people who participate in urban planning and design. Our findings may help them identify differences in human behavior and preferences in waterfronts at various times. Thus, they can take action to satisfy citizens’ needs, stimulating the vitality of urban waterfront spaces, while providing useful information to improve the planning of urban waterfront spaces and promoting the value of such areas.
6.2. Implications for Researchers
Despite the extensive research on waterfronts that offers some suggestions to improve their sustainable development, it is important to continue exploring new perspectives to study waterfronts. This study suggests that researchers engaged in this field of study should pay more attention to people’s dynamic behaviors and their temporal variation of preferences for waterfronts in this age.
Researchers can apply the methodological procedure proposed in this study to their research on temporal characteristics of waterfronts and people’s behavioral preferences. Moreover, our method may also be applied to other types of urban spaces and problems.
It is also useful for researchers to apply our results about Wuhan urban waterfronts to explore some corresponding ways to design for the city.
6.3. Implications for Managers
This study about urban waterfronts in Wuhan reflects on some negative points such as single function and poor accessibility; the quantity and distribution of current facilities may fail to fulfill the various needs of citizens. Government should be aware of the fact that various types of unique waterfronts need to be explored in depth to recognize various characteristics of their location, function, and scale, which may be conducive to building a number of plural and vibrant waterfronts that can fulfill the diverse needs of citizens. According to the empirical results, this article provides managers with certain suggestions on urban waterfront vibrancy improvement; these suggestions mainly include the following points:
Firstly, for daily waterfronts that are often occupied by construction land, lake protection and ecological environment recovery must be emphasized to improve the living conditions of citizens living around the lake, thereby restoring the waterfront vigor of this area. Moreover, we suggest that these waterfronts should be built with added consumption-related POIs, which include retail and catering services, to meet the people’s living and entertainment needs.
Secondly, for waterfronts with a charming scenery or compelling themes, their orientation as weekend waterfronts should be focused on, and recreational consumption facilities must to be added based on their uniqueness.
Thirdly, considering that natural seasonal waterfronts rely mainly on characteristic vegetation to attract people, traffic dispersion should be strengthened during the peak season of tours. Moreover, waterfronts with distinctive characters and significant location advantages, such as the Moon Lake waterfront, should make the most out of their superior natural and historical resources in Hanyang Town. Their reliance on the Qintai Grand Theater and Hanyang Cultural and Creative Industry Park to build art and cultural regions can stimulate the vitality during peak seasons. Consumption-related POIs and traffic-related POIs can be added to promote recreational suitability.
Finally, the potential of some waterfronts, such as the East Lake waterfront, must be developed and utilized adequately, for example, as an ecologically integrated “urban green-heart”, which is vibrant at any time. Wuhan should continue to implement the concept of “Big Lake Plus” to explore the development pattern of the Big Lake Plus Environment Protection initiative, Big Lake Plus Industrial Innovation initiative, and Big Lake Plus Production, Living, and Ecological Integration initiative. Accordingly, the Wuhan government must make the best out of the East Lake waterfront’s role as a model, building a number of new tour destinations, which incorporate recreation, education, culture, and cultural creativity in one place to fulfill the daily and amusement needs of people, thereby becoming “the publicity card of Wuhan.”
Our suggestions for Wuhan city can also be applied to other places with similar problems.
6.4. Limitations
This study has limitations. The majority of Sina Weibo check-in data were close to POIs around waterfronts, leading to the distribution of these points becoming relatively centralized or fixed, in addition to data inaccuracy. Moreover, the selection of independent variables for the model should be fully accounted for. For example, the road network distance should be taken into account when analyzing accessibility [60] to make the final results more realistic. These problems need to be addressed in future research.
Author Contributions
Conceptualization, J.W.; methodology, J.W. and X.C.; software, S.C.; validation, J.W., X.C. and S.C.; formal analysis, S.C.; investigation, X.C.; resources, S.C.; data curation, S.C.; writing—original draft preparation, X.C.; writing—review and editing, J.W.; visualization, S.C.; supervision, J.W.; project administration, J.W.; funding acquisition, J.W.
Funding
This research was funded by the National Natural Science Foundation of China (NSFC) Youth Program, grant number 51808409, the Natural Science Foundation of Hubei Province, grant number 2019CFB477, and the Fundamental Research Funds for the Central Universities (Interdisciplinary Project), grant number 2042019kf0211.
Conflicts of Interest
The authors declare no conflict of interest.
References
- Wang, J.G.; Lv, Z.P. A Historical Review of World Urban Waterfront Development. City Plan. Rev. 2001, 25, 41–46. [Google Scholar]
- Zhang, Z.; Tan, S.K.; Zhou, M. Spatial Pattern, Openness and Spatial Distribution Characteristics of Lakes in Wuhan Central Urban Area. Sci. Sin. 2014, 44, 631–642. [Google Scholar] [CrossRef]
- Kostopoulou, S. On the Revitalized Waterfront: Creative Milieu for Creative Tourism. Sustainability 2013, 5, 4578–4593. [Google Scholar] [CrossRef] [Green Version]
- Girard, L.F.; Kourtit, K.; Nijkamp, P. Waterfront Areas as Hotspots of Sustainable and Creative Development of Cities. Sustainability 2014, 6, 4580–4586. [Google Scholar] [CrossRef] [Green Version]
- Wessells, A. Urban Blue Space and “The Project of the Century”, Doing Justice on the Seattle Waterfront and for Local Residents. Buildings 2014, 4, 764–784. [Google Scholar] [CrossRef]
- Chang, T.C.; Huang, S. Reclaiming the City: Waterfront Development in Singapore. Urban Stud. 2011, 48, 2085–2100. [Google Scholar] [CrossRef]
- Yang, C.X.; Shao, B. Influence of Waterfront Public Space Elements on Lingering Vitality and Strategies: Taking Two Typical Waterfronts Along Huangpu River, Shanghai as Examples. Urban. Archit. 2018, 4, 40–47. [Google Scholar]
- Brain, H. The New Waterfront: A Worldwide Urban Success Story. J. Transp. Geogr. 1997, 5, 304–306. [Google Scholar]
- Kang, Y. A Study on the Micro-Topography Landscape Characteristics and Waterfront Landscape Style of Waterfront in Korean Jingyeong Landscape Painting. J. Korean Inst. Landsc. Archit. 2019, 47, 26–38. [Google Scholar]
- Vall, N. A view from the wharf: Historical perspectives on the transformation of urban waterfront space in Stockholm during the twentieth century. Urban Hist. 2018, 45, 524–548. [Google Scholar] [CrossRef]
- Dai, T.; Zhuang, T.; Yan, J.; Zhang, T. From Landscape to Mindscape: Spatial Narration of Touristic Amsterdam. Sustainability 2018, 10, 2623. [Google Scholar] [CrossRef]
- Shi, S.; Kondolf, G.M.; Li, D. Urban River Transformation and the Landscape Garden City Movement in China. Sustainability 2018, 10, 4103. [Google Scholar] [CrossRef]
- Badach, J.; Raszeja, E. Developing a Framework for the Implementation of Landscape and Greenspace Indicators in Sustainable Urban Planning. Waterfront Landscape Management: Case Studies in Gdańsk, Poznań and Bristol. Sustainability 2019, 11, 2291. [Google Scholar] [CrossRef]
- Coscia, C.; Lazzari, G.; Rubino, I. Values, Memory, and the Role of Exploratory Methods for Policy-Design Processes and the Sustainable Redevelopment of Waterfront Contexts: The Case of Officine Piaggio (Italy). Sustainability 2018, 10, 2989. [Google Scholar] [CrossRef]
- Che, Y.; Yang, K.; Chen, T.; Xu, Q.X. Assessing a riverfront rehabilitation project using the comprehensive index of public accessibility. Ecol. Eng. 2012, 40, 80–87. [Google Scholar] [CrossRef]
- Cheung, D.; Tang, B. Social Order, Leisure, or Tourist Attraction? The Changing Planning Missions for Waterfront Space in Hong Kong. Habitat Int. 2015, 47, 231–240. [Google Scholar] [CrossRef]
- Lee, X.; Piao, R. A Study on the Tourism Development Strategies of Water Front—Focus on Gumi Area in the Nakdong River. Korean J. Tour. Res. 2011, 26, 303–327. [Google Scholar]
- Lee, K. Integrated Waterfront Cultural Planning through Regeneration of Former Industrial Harborfront. J. Korean Soc. Disaster Inf. 2019, 15, 175–185. [Google Scholar] [CrossRef]
- Keyvanfar, A.; Shafaghat, A.; Mohamad, S.; Abdullahi, M.A.; Ahmad, H.; Mohd Derus, N.; Khorami, M. A Sustainable Historic Waterfront Revitalization Decision Support Tool for Attracting Tourists. Sustainability 2018, 10, 215. [Google Scholar] [CrossRef]
- Wu, J.; Xie, H. Research on characteristics of changes of lakes in Wuhan’s main urban area. Procedia Eng. 2011, 21, 395–404. [Google Scholar] [CrossRef]
- Zhu, J.; Zhang, Q.; Tong, Z. Impact Analysis of Lakefront Land Use Changes on Lake Area in Wuhan, China. Water 2015, 7, 4869–4886. [Google Scholar] [CrossRef]
- Du, N.R.; Ottens, H.; Sliuzas, R. Spatial impact of urban expansion on surface water bodies-A case study of Wuhan, China. Landsc. Urban Plan. 2010, 94, 175–185. [Google Scholar] [CrossRef]
- Wu, J.; Luo, J.M.; Tang, L. Coupling Relationship between Urban Expansion and Lake Change—A Case Study of Wuhan. Water 2019, 11, 1215. [Google Scholar] [CrossRef]
- Wen, H.Z.; Bu, X.Q.; Qin, Z.F. Spatial Effect of Lake Landscape on Housing Price: A Case Study of the West Lake in Hangzhou, China. Habitat Int. 2014, 44, 31–40. [Google Scholar] [CrossRef]
- Reyes-Menendez, A.; Saura, J.R.; Martinez-Navalon, J.G. The impact of e-WOM on Hotels Management Reputation: Exploring TripAdvisor Review Credibility with the ELM model. IEEE Access 2019, 7, 68868–68877. [Google Scholar] [CrossRef]
- Reyes-Menendez, A.; Saura, J.R.; Filipe, F. The importance of behavioral data to identify online fake reviews for tourism businesses: A systematic review. PeerJ Comput. Sci. 2019, 5, e219. [Google Scholar] [CrossRef]
- Liu, S.; Zhang, L.; Long, Y. Urban Vitality Area Identification and Pattern Analysis from the Perspective of Time and Space Fusion. Sustainability 2019, 11, 4032. [Google Scholar] [CrossRef]
- Tang, L.; Lin, Y.; Li, S.; Li, S.; Li, J.; Ren, F.; Wu, C. Exploring the Influence of Urban Form on Urban Vibrancy in Shenzhen Based on Mobile Phone Data. Sustainability 2018, 10, 4565. [Google Scholar] [CrossRef]
- Juan, C.G.; Maria, H.S.; Borja, M.; Ana, C. City Dynamics through Twitter: Relationships between Land Use and Spatiotemporal Demographics. Cities 2018, 72, 310–319. [Google Scholar]
- Heikinheimo, V.; Minin, E.D.; Tenkanen, H.; Hausmann, A.; Erkkonen, J.; Toivonen, T. User-Generated Geographic Information for Visitor Monitoring in a National Park: A Comparison of Social Media Data and Visitor Survey. ISPRS Int. J. Geo-Inf. 2017, 6, 85. [Google Scholar] [CrossRef]
- Wood, S.A.; Guerry, A.D.; Silver, J.M.; Lacayo, M. Using social media to quantify nature-based tourism and recreation. Sci. Rep. 2013, 3, 2976. [Google Scholar] [CrossRef]
- Năstase, I.I.; Pătru-Stupariu, I.; Kienast, F. Landscape Preferences and Distance Decay Analysis for Mapping the Recreational Potential of an Urban Area. Sustainability 2019, 11, 3620. [Google Scholar] [CrossRef]
- Wu, J.; Li, J.; Ma, Y. Exploring the Relationship between Potential and Actual of Urban Waterfront Spaces in Wuhan Based on Social Networks. Sustainability 2019, 11, 3298. [Google Scholar] [CrossRef]
- Lei, C.; Zhang, A.; Qi, Q.; Su, H.; Wang, J. Spatial-Temporal Analysis of Human Dynamics on Urban Land Use Patterns Using Social Media Data by Gender. ISPRS Int. J. Geo-Inf. 2018, 7, 358. [Google Scholar] [CrossRef]
- Wu, J.; Li, J.; Ma, Y. A Comparative Study of Spatial and Temporal Preferences for Waterfronts in Wuhan based on Gender Differences in Check-In Behavior. ISPRS Int. J. Geo-Inf. 2019, 8, 413. [Google Scholar] [CrossRef]
- Yan, J.; Shi, W.; Li, F. Evaluation and Countermeasures of the Implementation of the Lake Protection and Governance System in Wuhan City, Middle China. Sustainability 2018, 10, 3379. [Google Scholar] [CrossRef]
- He, M.; Cheng, G.; Zhang, Q. Planning of Water Layout and Urban Development of Water—Rich Cities: A Case Study of Wuhan. City Plan. Rev. 2018, 42, 58–63. [Google Scholar]
- Xu, G.; Jiao, L.; Zhao, S.; Yuan, M.; Li, X.; Han, Y.; Zhang, B.; Dong, T. Examining the Impacts of Land Use on Air Quality from a Spatio-Temporal Perspective in Wuhan, China. Atmosphere 2016, 7, 62. [Google Scholar] [CrossRef]
- Wu, C.; Ye, X.Y.; Ren, F.; Du, Q.Y. Check-in Behaviour and Spatio-temporal Vibrancy: An Exploratory Analysis in Shenzhen, China. Cities 2018, 77, 104–116. [Google Scholar] [CrossRef]
- Huang, Y.; Li, J.; Hao, H.; Xu, L.; Nicholas, S.; Wang, J. Seasonal and Monthly Patterns, Weekly Variations, and the Holiday Effect of Outpatient Visits for Type 2 Diabetes Mellitus Patients in China. Int. J. Environ. Res. Public Health 2019, 16, 2653. [Google Scholar] [CrossRef]
- Silverman, B.W. Algorithm as 176: Kernel Density Estimation Using the Fast Fourier Transform. J. R. Stat. Soc. Ser. C 1982, 31, 93–99. [Google Scholar] [CrossRef]
- Bowman, A.W. An alternative Method of Cross-validation for the Smoothing of Density Estimates. Biometrika 1984, 71, 353–360. [Google Scholar] [CrossRef]
- Silverman, B.W. Density Estimation for Statistics and Data Analysis. J. R. Stat. Soc. Ser. A 2018, 150, 403–404. [Google Scholar]
- Xu, S. Temporal and Spatial Characteristics of the Change of Cultivated Land Resources in the Black Soil Region of Heilongjiang Province (China). Sustainability 2019, 11, 38. [Google Scholar] [CrossRef]
- Rosenblatt, M. Remarks on Some Nonparametric Estimates of a Density Function. Ann. Math. Stat. 1956, 27, 832–837. [Google Scholar] [CrossRef]
- Parzen, E. On Estimation of a Probability Density Function and Mode. Ann. Math. Stat. 1962, 33, 1065–1076. [Google Scholar] [CrossRef]
- Yu, H.; Liu, Y.; Liu, C.; Fan, F. Spatiotemporal Variation and Inequality in China’s Economic Resilience across Cities and Urban Agglomerations. Sustainability 2018, 10, 4754. [Google Scholar] [CrossRef]
- Pardoux, E.; Peng, S. Adapted Solution of a Backward Stochastic Differential Equation. Syst. Control Lett. 1990, 14, 55–61. [Google Scholar] [CrossRef]
- Muhammad, R.; Zhao, Y.; Liu, F. Spatiotemporal Analysis to Observe Gender Based Check-In Behavior by Using Social Media Big Data: A Case Study of Guangzhou, China. Sustainability 2019, 11, 2822. [Google Scholar] [CrossRef]
- Sun, J.; Wang, G.; Cheng, X.; Fu, Y. Mining Affective Text to Improve Social Media Item Recommendation. Inf. Process. Manag. 2015, 51, 444–457. [Google Scholar] [CrossRef]
- Liu, W.P.; Chen, W.J.; Dong, C.L. Spatial Decay of Recreational Services of Urban Parks: Characteristics and Influencing Factors. Urban For. Urban Green. 2017, 25, 130–138. [Google Scholar] [CrossRef]
- Liang, X.J.; Liu, Y.L.; Qiu, T.Q.; Jing, Y.; Fang, F.G. The Effects of Locational Factors on the Housing Prices of Residential Communities: The Case of Ningbo, China. Habitat Int. 2018, 81, 1–11. [Google Scholar] [CrossRef]
- Jiao, L.M.; Liu, Y.L. Geographic Field Model Based Hedonic Valuation of Urban Open Spaces in Wuhan, China. Landsc. Urban Plan. 2010, 98, 47–55. [Google Scholar] [CrossRef]
- Wei, W.; Hong, M.Y.; Xie, B. Demand-supply Matching Oriented 15-minute Community Life Circle Demarcation and Spatial Optimization, Wuhan. Planners 2019, 35, 11–17. [Google Scholar]
- Yu, Y.F. From Traditional Residential Area Planning to Neighborhood Life Circle Planning. City Plan. Rev. 2019, 43, 17–22. [Google Scholar]
- Wu, H.; Jiao, H.; Yu, Y.; Li, Z.; Peng, Z.; Liu, L.; Zeng, Z. Influence Factors and Regression Model of Urban Housing Prices Based on Internet Open Access Data. Sustainability 2018, 10, 1676. [Google Scholar] [CrossRef]
- Nilsson, P. Natural Amenities in Urban Space—A Geographically Weighted Regression Approach. Landsc. Urban Plan. 2014, 121, 45–54. [Google Scholar] [CrossRef]
- Zhang, X.; Huang, B.; Zhu, S. Spatiotemporal Influence of Urban Environment on Taxi Ridership Using Geographically and Temporally Weighted Regression. ISPRS Int. J. Geo-Inf. 2019, 8, 23. [Google Scholar] [CrossRef]
- Wu, J. Quantitative Analysis of the Evolution of Wuhan’s Lakeside Landscape and Land Use. Chin. Landsc. Archit. 2013, 29, 124–127. [Google Scholar]
- Apparicio, P.; Abdelmajid, M.; Riva, M.; Shearmur, R. Comparing alternative approaches to measuring the geographical accessibility of urban health services: Distance types and aggregation-error issues. Int. J. Health Geogr. 2008, 7, 622–624. [Google Scholar] [CrossRef]
Figure 1.
Location of the study area.

Figure 2.
All lakes studied.

Figure 3.
Statistics of various point of interest (POI). (a) POI classification and the number of various POIs, (b) proportion of four POI types of 24 waterfront areas.
Figure 3.
Statistics of various point of interest (POI). (a) POI classification and the number of various POIs, (b) proportion of four POI types of 24 waterfront areas.

Figure 4.
Location of check-in points and POIs. (a) Weibo users’ check-in points, (b) four kinds of POIs.
Figure 4.
Location of check-in points and POIs. (a) Weibo users’ check-in points, (b) four kinds of POIs.

Figure 5.
Seasonal index of different time series in 24 waterfront areas. (a) Seasonal index of weekdays in 24 waterfront areas; (b) seasonal index of weekends in 24 waterfront areas; (c) seasonal index of a week in 24 waterfront areas; (d) seasonal index of various months in 24 waterfront areas; (e) seasonal index of various seasons in 24 waterfront areas.


Figure 6.
Kernel estimation results of the check-in densities in 24 h.


Figure 7.
Kernel estimation results of the check-in densities in four seasons.

Figure 8.
Kernel estimation results of the check-in densities in 12 months.


Figure 9.
Distribution of POIs influencing coefficients within various hours. (a) Distribution of POIs influencing coefficients from 16:00–18:00 in weekdays; (b) distribution of POIs influencing coefficients from 16:00–18:00 in weekends; (c) distribution of POIs influencing coefficients from 18:00–20:00 in weekdays; (d) distribution of POIs influencing coefficients from 18:00–20:00 in weekends.


Figure 10.
Distribution of POIs influencing coefficients in four seasons. (a) Distribution of POIs influencing coefficients in spring; (b) distribution of POIs influencing coefficients in summer; (c) distribution of POIs influencing coefficients in autumn; (d) distribution of POIs influencing coefficients in winter.


Figure 11.
Distribution of POIs influencing coefficients in five months. (a) Distribution of POIs influencing coefficients in March; (b) distribution of POIs influencing coefficients in May; (c) distribution of POIs influencing coefficients in June; (d) distribution of POIs influencing coefficients in October; (e) distribution of POIs influencing coefficients in December.


Figure 12.
Influencing coefficients of POIs in 24 waterfront areas.


Table 1.
Basic information of all lakes studied.
| Number | Name | Town | District | Function |
|---|---|---|---|---|
| 1 | North Lake | Hankou | Jianghan | A, C |
| 2 | Houxiang River | Hankou | Jianghan | A, C |
| 3 | Huanzi Lake | Hankou | Jianghan | A, C |
| 4 | Machine Lake | Hankou | Jianghan | A, C |
| 5 | Chestnut Lake | Hankou | Jianghan | A, C |
| 6 | Tazi Lake | Hankou | Jiangan | A, C |
| 7 | West Lake | Hankou | Jianghan | A, C |
| 8 | Small South Lake | Hankou | Jianghan | A, C |
| 9 | Zhangbi Lake | Hankou | Qiaokou | A, B |
| 10 | Bamboo Leaf Sea | Hankou | Qiaokou | A, B |
| 11 | Lotus Lake | Hanyang | Hanyang | A, C |
| 12 | Longyang Lake | Hanyang | Hanyang | A, B, D |
| 13 | Ink Lake | Hanyang | Hanyang | A, D |
| 14 | Moon Lake | Hanyang | Hanyang | A, C |
| 15 | East Lake | Wuchang | Cross-regional | A, B, D |
| 16 | Inside Sand Lake | Wuchang | Wuchang | A |
| 17 | South Lake | Wuchang | Hongshan | A, B |
| 18 | Shai Lake | Wuchang | Wuchang | A |
| 19 | Shuiguo Lake | Wuchang | Wuchang | A, C |
| 20 | Simei Pond | Wuchang | Wuchang | A, C |
| 21 | Outside Sand Lake | Wuchang | Hongshan | A, C |
| 22 | Yangchun Lake | Wuchang | Hongshan | A, B, C |
| 23 | Yezhi Lake | Wuchang | Hongshan | A, B |
| 24 | Ziyang Lake | Wuchang | Wuchang | A, C |
Table 2.
Check-in points at various times.
| Variables | 00:00–02:00 | 02:00–04:00 | 04:00–06:00 | 06:00–08:00 | 08:00–10:00 | 10:00–12:00 | 12:00–14:00 | 14:00–16:00 | 16:00–18:00 | 18:00–20:00 | 20:00–22:00 | 22:00–00:00 | Total |
|---|---|---|---|---|---|---|---|---|---|---|---|---|---|
| Weekdays | 45,113 | 8525 | 3664 | 16,641 | 41,105 | 54,201 | 57,022 | 63,596 | 67,898 | 79,765 | 89,239 | 99,445 | 626,214 |
| Weekends | 23,806 | 5062 | 2025 | 6495 | 19,227 | 37,256 | 31,816 | 34,698 | 36,847 | 39,916 | 46,717 | 50,617 | 334,482 |
| Total | 68,919 | 13,587 | 5689 | 23,136 | 60,332 | 91,457 | 88,838 | 98,294 | 104,745 | 116,372 | 135,956 | 150,062 | 960,696 |
| Variables | January | February | March | April | May | June | July | August | September | October | November | December | Total |
| Number | 49,209 | 33,875 | 79,356 | 68,945 | 71,448 | 72,450 | 48,182 | 51,618 | 74,759 | 138,713 | 134,601 | 137,540 | 960,696 |
| Variables | Spring | Summer | Autumn | Winter | Total | Monday | Tuesday | Wednesday | Thursday | Friday | Saturday | Sunday | Total |
| Number | 49,209 | 33,875 | 79,356 | 68,945 | 960,696 | 130,561 | 120,448 | 117,518 | 125,536 | 132,151 | 169,742 | 164,740 | 960,696 |
Table 3.
Classification of all lakes in this study.
| Number | Name | Type | Number | Name | Type |
|---|---|---|---|---|---|
| 1 | North Lake | A, C, D | 13 | Ink Lake | B, C, D |
| 2 | Houxiang River | B, C, D | 14 | Moon Lake | B, C, D |
| 3 | Huanzi Lake | A | 15 | East Lake | A, C, D |
| 4 | Machine Lake | B, C, D | 16 | Inside Sand Lake | A, C, D |
| 5 | Chestnut Lake | A, C, D | 17 | South Lake | A, C, D |
| 6 | Tazi Lake | B, C, D | 18 | Shai Lake | A |
| 7 | West Lake | A, C, D | 19 | Shuiguo Lake | A, C, D |
| 8 | Small South Lake | B, C, D | 20 | Simei Pond | A, C, D |
| 9 | Zhangbi Lake | B | 21 | Outside Sand Lake | A, C, D |
| 10 | Bamboo Leaf Sea | B | 22 | Yangchun Lake | A, D |
| 11 | Lotus Lake | A, D | 23 | Yezhi Lake | A, C, D |
| 12 | Longyang Lake | B, D | 24 | Ziyang Lake | A |
A: Daily waterfront, B:Weekend waterfront, C:Natural seasonal waterfront, D:Social seasonal waterfront.
© 2019 by the authors. Licensee MDPI, Basel, Switzerland. This article is an open access article distributed under the terms and conditions of the Creative Commons Attribution (CC BY) license (http://creativecommons.org/licenses/by/4.0/).
Share and Cite
MDPI and ACS Style
Wu, J.; Chen, X.; Chen, S. Temporal Characteristics of Waterfronts in Wuhan City and People’s Behavioral Preferences Based on Social Media Data. Sustainability 2019, 11, 6308. https://0-doi-org.brum.beds.ac.uk/10.3390/su11226308
AMA Style
Wu J, Chen X, Chen S. Temporal Characteristics of Waterfronts in Wuhan City and People’s Behavioral Preferences Based on Social Media Data. Sustainability. 2019; 11(22):6308. https://0-doi-org.brum.beds.ac.uk/10.3390/su11226308
Chicago/Turabian StyleWu, Jing, Xirui Chen, and Shulin Chen. 2019. "Temporal Characteristics of Waterfronts in Wuhan City and People’s Behavioral Preferences Based on Social Media Data" Sustainability 11, no. 22: 6308. https://0-doi-org.brum.beds.ac.uk/10.3390/su11226308
Note that from the first issue of 2016, this journal uses article numbers instead of page numbers. See further details here.