


Suggestions and Solutions for Enhancing Active Commuting to the University of Maribor and Advancing CO2 Emission Reduction

Faculty of Civil Engineering, Transportation Engineering and Architecture, University of Maribor, 2000 Maribor, Slovenia
*
Author to whom correspondence should be addressed.
Sustainability 2024, 16(2), 520; https://0-doi-org.brum.beds.ac.uk/10.3390/su16020520
Submission received: 18 October 2023
/
Revised: 4 January 2024
/
Accepted: 5 January 2024
/
Published: 7 January 2024
(This article belongs to the Special Issue Active Transport among University Students: Patterns, Motivations and Challenges)
Abstract
:This study investigated commuting behavior at four technical faculties (BCTF) in Maribor. The main aim was to provide suggestions and solutions for challenges related to active commuting to the BCTF, while promoting advancements in CO2 emission reduction. The research methodology was based on analyses of a questionnaire survey and calculations of CO2 emissions. The results indicate that implementing measures to promote walking, bicycling and the use of city and regional public transport, in conjunction with supportive housing and parking policies, has the potential to eliminate car trips within 0–1 km of the BCTF and reduce car trips from other zones in favor of active commuting by 30% to 50%. These proposed transport scenarios could lead to an annual reduction in CO2 emissions ranging from 17% to 29%. The greatest potential for CO2 savings is observed within 0–5 km of the BCTF, where a shift to walking and bicycling could reduce emissions by up to 44%. The results also highlighted a notable disparity, indicating that students with term-time accommodations emitted 3.5 times and 4.1 times less annual CO2 within 0–5 km of the BCTF compared to students and staff commuting daily from their permanent residences in the city.
1. Introduction
The mitigation of climate change stands as one of the paramount environmental challenges confronting humanity and requires a reduction in greenhouse gases (GHGs), primarily carbon dioxide (CO2), generated via the combustion of fossil fuels. A quarter of total GHG emissions in Europe is estimated to originate from the transport sector [1]. Within this sector, road transport takes the lead, contributing approximately 72% to the overall GHG emissions, with passenger cars alone accounting for about 45%. To remedy this, effective strategies are required to reduce car use for daily trips and promote active modes of transport. In addition to walking and bicycling, public passenger transport (PPT) is also categorized as an active mode of transport, as it involves walking or bicycling at the end of the route [2].
Universities play an important role in promoting sustainable mobility as hubs for the creation and dissemination of new knowledge and practices [3,4,5]. Many universities are taking steps to discourage car trips and encourage the use of active modes of transport, recognizing the environmental, economic and social benefits. These initiatives are intricate and are based on studies aimed at overcoming numerous attitudinal and physical barriers. In this context, we present some case studies from different parts of the world. At the University of Isfahan (Iran) [6], the University of California, Los Angeles (USA) [7] and the University of Shahjalal (Bangladesh) [8], active modes of transport are advocated based on studies that examine both direct and indirect factors influencing their choice. At the University of North Carolina (USA) [9], the promotion of low-carbon transport modes relies on an understanding of the relative importance of demographic, psychological and logistic factors on students’ mode choice. The University of Western Australia [2], the Santa Catarina State University (Brazil) [10], the University of Minho (Portugal) [11] and the University of Burapha (Thailand) [12] are dedicated to sustainable mobility, focusing on factors that influence students’ decisions to switch transport modes, while the universities of Yogyakarta (Indonesia) [13] and the University of Kitami (Japan) [14] emphasize factors affecting bus choice. The promotion of active modes of transport at the Eastern Mediterranean University (Turkey) [15], the Qatar University [16], the University of Aveiro (Portugal) [17] and the University of Trieste (Italy) [18] is the result of analyses of effective strategies related to mobility plans and transportation demand management policies. Policy recommendations for the increased use of alternative transport by students at the University of Idaho (USA) [19] were formulated based on a study of spatio-temporal commuting patterns in a university environment. The University of Alabama (USA) [20] promotes non-motorized transport via analyses of connectivity and network perceptions. In the case of the University of California, San Diego (USA) [21], the mobility strategy was improved by examining correlates of active commuting modes, transport physical activity and the intention to use light rail transit, while the improvements at the Aristotle University of Thessaloniki (Greece) [22] resulted from an examination of satisfaction levels associated with individuals’ transportation choices. Stankov et al. [23] provide a comprehensive systematic review of empirical and simulation studies to assess the health impacts of transportation interventions, while Xiao et al. [24] contribute to the existing knowledge system of spatio-temporal crowd flow prediction by proposing a new, integrated and holistic knowledge map.
While the travel behavior of students and staff has been extensively investigated, there remains a gap in understanding the environmental impacts of commuting to universities [11,16,25,26]. Specifically, the environmental benefits of switching from private cars to active modes of transport have not been sufficiently addressed in the literature [27]. Studies by Mathez et al. [28], Davison et al. [29], Appleyard et al. [30], Hafezi et al. [31], Pérez-Neira et al. [26], Sobrino and Arce [32] and Ribeiro and Fonseca [11] have examined GHG emissions from mobility at various universities, including the University of Montreal (Canada), 17 universities in Ireland and the United Kingdom, San Diego State University (USA), Dalhousie University (Canada), University of León (Spain), Technical University of Madrid (Spain) and University of Minho (Portugal). Online surveys were used in these studies to assess the travel behavior of students and staff. However, the comparability of the results is hindered due to emission estimations relying on data from official statistics and survey questions. Hafezi et al. [31] estimated daily GHG emissions, Davison et al. [29] and Ribeiro and Fonseca [11] estimated annual GHG emissions, while Mathez et al. [28], Pérez-Neira et al. [26] and Sobrino and Arce [32] estimated GHG emissions per trip using emission factors. Despite variations in graphical representations, the synthesis of the results in these studies remained consistent. Notably, significant differences were observed between students and staff, with university staff generating the highest CO2 emissions per capita via their annual daily trips. For example, staff emit twice as much CO2e per trip to the University of León compared to students [26]. This discrepancy is related to the longer commuting distances of staff, combined with a higher prevalence of private car use. On the other hand, Davison et al. [29] report that annual emissions for regular trips to and from the university are highest when a student has a permanent address, as opposed to separate term-time and permanent addresses. Sobrino and Arce [32] confirm that only 16% of commuters using private modes (cars and motorcycles) emit more than half of the daily trip’s CO2 emissions to the campuses. Some studies also evaluated the impact of various policies on environmental benefits. Pérez-Neira et al. [26] found that implementing measures to improve mobility habits, such as increasing the use of buses, bicycles, and walking, could significantly reduce GHG emissions within a distance range of 0–6 km. At San Diego State University, the adoption of electric vehicles has the potential to reduce CO2 emissions by 60% [30], while a modal shift at the University of Minho could lead to a reduction in CO2 emissions ranging from 8% to 27% [11].
As the University of Maribor (UM) is one of the main traffic generators in the city, we have focused on enhancing studies aimed at developing a sustainable transport policy for both the UM and the city. The building complex of the four technical faculties (BCTF) served as our case study. It is located in the center of the city and largely affects the urban environment and urban transport systems. In our previous article [26], we delved into the factors influencing the students’ and staff’s choice of transport mode over a decade. Subsidies for bus transport, integration of PPT tickets, parking availability and parking fees were identified as key factors prompting a shift to alternative modes of transport. These findings are consistent with those of previous research highlighting the important role of parking management in car commuting [2,27,28,29,30], with distance from the trip origin identified as the main factor influencing the choice of transport mode [13,31]. This data forms the basis for our current research, which focuses on the potential shift from private cars to alternative modes of transport and the subsequent reduction in CO2 emissions. This study seeks to establish a foundation for planning measures that reduce the carbon footprint of commuter traffic, in line with the European Green Deal’s goal of achieving climate neutrality by 2050 [33]. The main aim of our research was to provide suggestions and solutions for challenges related to active commuting to the BCTF, while promoting advancements in CO2 emission reduction. In this context, understanding the mobility patterns within the BCTF and their impact on climate change was essential. Therefore, the first research sub-aim was to gain a comprehensive insight into the travel behavior of commuters to the BCTF. The modal split and factors influencing active commuting were analyzed using data from a questionnaire survey conducted in 2020. Recognizing potential variations in travel behavior among distinct user groups—students commuting daily from their permanent residences, those commuting from their term-time accommodations and staff—the data were processed separately for each user group. Given the influence of travel distance on the choice of travel mode and resulting CO2 emissions, the data were also segmented according to this parameter. The second research sub-aim was to provide suggestions and solutions for challenges related to active commuting in different zones around the BCTF within the framework of two transport scenarios. The final research sub-aim was to estimate the CO2 emissions generated by three user groups in relation to distance and to assess the potential reduction through a shift from private cars to active modes of transport as proposed in the two transport scenarios. To the best of our knowledge, this study represents the first detailed report on the environmental benefits of shifting from private cars to active modes of transport at the UM, offering valuable insights for national and international research. The research methodology involves calculations and analyses tailored to three user groups and distance, introducing a relative novelty in addressing the problem under study.
2. Materials and Methods
2.1. Study Site
Maribor, the regional center of NE Slovenia, ranks as the country’s second largest city with 100,000 inhabitants. The city enjoys a moderate continental climate with approximately 266 sunny days per year [32]. The flat terrain and favorable weather make bicycling possible almost year-round. Despite the compact layout where the distance from the city center to the outskirts does not exceed 5 km, bicycle traffic faces challenges compared to car traffic [33]. Maribor has an 86 km long bicycle network, but its quality lags behind the infrastructure for motorized traffic [34]. The PPT service in Maribor is modest, characterized by low frequencies, an outdated fleet, and short operating hours [33]. While pedestrian conditions in the city center have improved, similar progress is not evident in other areas.
The building complex of technical faculties (BCTF), comprising the Faculty of Civil Engineering, Transportation Engineering and Architecture, Faculty of Electrical Engineering and Computer Science, the Faculty of Chemistry and Chemical Engineering and the Faculty of Mechanical Engineering, is the focus of this study. The BCTF, selected as a case study due to its central location in the city (Figure 1), had 3840 enrolled students and 688 staff members in the academic year 2020/2021. These figures represent 42% and 40% of the total student and staff population at the faculties in Maribor.
There are seven city bus lines in the vicinity of the BCTF, with eight stops within a 250 m radius. The BCTF allocates 493 parking places in five nearby parking lots exclusively for staff, while students must use public parking as they are not permitted to park there. The two nearest car-sharing parking lots are 400 m away. The BCTF is integrated into the city’s bicycle network, which has introduced a bike-sharing system since 2022. However, the existing bicycle parking facilities are insufficient in terms of both size and coverage and are mostly left unattended.
2.2. Questionnaire
This study is based on a 2020 questionnaire survey (Supplementary Materials), detailed in Trček and Mesarec [26]. The questionnaire survey comprised six sections. The initial section gathered information on the respondents’ status and gender. The second section contained details about the origin and distance of the daily commutes. Subsequent sections encompassed stated preferences, including some in the form of multiple-choice questions. The third section, focused on private car use, covered aspects such as frequency of use, door-to-door travel time to the BCTF, type of use (alone or shared), parking location, time spent looking for parking, reasons for car use and barriers and interventions for shared car use. The final three sections were dedicated to active commuting. These sections examined the frequency of use, door-to-door travel time to the BCTF, and preferred interventions for more frequent use of PPT, bicycling and walking.
The characteristics of the user groups are described in Table 1. A total of 551 individuals participated in the study, with 531 responses considered valid. Of these, 52% were students and 48% were staff members. Among the students, 52.9% had term-time accommodation in Maribor, while 47.1% commuted daily from their permanent residence to the BCTF. The majority of students (83.6%) had term-time accommodation in zone 1, of which 85.6% intermittently commuted from their permanent residences in zone 4, and only 14.4% from zone 3. Of the students commuting daily to BCTF from their permanent residences, 68.5% originated from towns outside Maribor, specifically 26.1% from zone 2 and 33.8% from zone 3. Regarding staff, 54% had their permanent residence in Maribor, while 46% resided outside Maribor, predominantly in zone 2 (57%).
2.3. Data Processing
The detailed statistical analyses of the questionnaire data were presented in our previous article [26], using SPSS, Version 28.0 (IBM Corporation, Armonk, NY, USA). A value of p < 0.05 was considered significant. In this article, the questionnaire data were specifically used to analyze transport mode choices and factors influencing the use of PPT, bicycling and walking. In contrast to the previous article, the data were categorized into three user groups (students commuting daily from their term-time accommodation and intermittently from their permanent residence, students commuting daily from their permanent residence and staff) and further stratified by different distances from the BCTF. This approach allowed us to analyze the data to the extent required to formulate transport scenarios and assess CO2 emissions. Two motorized modes of transport were included in the study—cars and buses, as the use of motorcycles and trains is negligible.
The study site was divided into six zones based on different distance ranges from the BCTF: 0–1 km (zone 1a), 1–2 km (zone 1b), 2–5 km (zone 1c), 5–20 km (zone 2), 20–50 km (zone 3) and >50 km (zone 4) (Figure 1). The first three zones are located within the urban area of Maribor, while zones 2–4 extend beyond the city limits. The distribution of user groups across these zones is presented in Table 1.
The DEFRA method [34], widely recognized for its utility [11,35,36,37], was used to calculate the CO2 emissions generated by commuting to the BCTF. The study by Ribeiro and Fonseca [11] demonstrates that, although the DEFRA emission factor toolkit is calibrated for the UK, it remains applicable in other countries for calculating vehicle CO2 emission factors.
In the calculations of CO2 emissions, only the days designated as teaching or working days were considered. On average, students and staff were assumed to be engaged for 160 and 220 full-time days per year, respectively. The assessment of CO2 emissions was conducted for three transport scenarios. The baseline scenario reflects the current transport mode choices of students and staff. Additionally, the ambitious scenario and the new challenges scenario were examined, taking into account the challenges related to active commuting to the BCTF and the resulting changes in transport modes. To address the challenges of active commuting to the BCTF, numerous measures were developed based on responses from a questionnaire survey and directions from strategic documents at the university, municipal and state levels. These documents include UM’s plans for the reconstruction of the BCTF and its surroundings [38], the Integrated Transport Strategy of the City of Maribor [39], the Transport Development Strategy of the Republic of Slovenia until 2030 [40] and the Integrated National Energy and Climate Plan of the Republic of Slovenia [41].
For each transport scenario, the CO2 calculations were extrapolated to encompass the entire BCTF community. This approach enables the determination of potential reductions in CO2 emissions resulting from a shift to more sustainable modes of transport relative to distance.
The calculations of CO2 emissions generated by commuting to the BCTF are based on the following input data required for the application of the DEFRA emission factor toolkit:
- Source ID—User-defined name or reference for a road, with a set of roads defined based on survey outputs.
- Road type—Roads were categorized into three groups: urban roads, rural roads and motorways.
- Traffic flow—Total traffic flow along a given road for the period of interest (ranging from 1 to 24 h). Daily values for the year 2021 were collected from national traffic counters.
- Speed—Speed in kilometers per hour corresponding to the given traffic flow, either as an average or specific speed related to the considered driving scenario (ranging from 5 km/h to 140 km/h). Average speeds from national traffic counters were used.
- Number of hours—The number of hours corresponding to the duration of the flow defined by the traffic flow. In our case, we considered 24 h, as we used average annual daily values for the traffic flow.
- Link length (km)—For the length of road links for user trips from zones 2, 3 and 4, travel distances from the questionnaire were used. Respondents provided information on the municipality from which they commuted daily or intermittently. This data was spatially distributed using QGIS 3.24.1 (QGIS Development Team; “URL: https://qgis.org/en/site/”, accessed on 19 April 2022) and paired with the road network to calculate the total trip length of each user and its segmentation (length on urban roads, rural roads and motorways). A different approach was chosen for user trips from zones 1a, 1b and 1c. For this group, information was collected on the city district they travelled from. Trip lengths were calculated as the Euclidean distance between the centroids of the specified city districts and the BCTF, additionally corrected by a factor of 1.41 to account for lengthening due to the predominantly perpendicular road network [42].
The DEFRA emission factor toolkit also includes data input for the following parameters:
- % HDV (percentage of heavy-duty vehicles);
- Gradient of road links;
- Flow direction on link;
- Load of HDVs on road links.
However, these inputs were not used in our calculations as they were specifically intended for a more detailed assessment of HDV emissions, which was not within the scope of our study.
The finalized set of required data served as the conclusive input to the DEFRA emission factor toolkit. Once this data set was completed, the calculation was performed to obtain the final emission results.
3. Results
3.1. Transport Mode Choices and Travel Distances
Among students, 31.5% commuted daily from their permanent residence in the city of Maribor to the BCTF (Table 1). In zone 1a, the majority of students preferred sustainable modes of transport: 68.9% walked and 18.9% used bicycles. However, 10.5% of students used cars (their own and shared) for trips they could make on foot or by bicycle (Table 2). The percentage of pedestrians and bicyclists decreased to 20% and 12.1%, respectively, for trips from zone 1b and further to 0.1% for trips from zone 1c. Our results are consistent with the studies by Shannon et al. [2] and Zhan et al. [43] and show that the competitive distance for walking is less than 1 km. They also indicate that bicycling is not a popular transport mode for distances of either 1–2 km or 2–5 km. Consequently, commuting behavior shifted towards increased use of cars and the city PPT. In zones 1b and 1c, 46% of students opted for cars (their own and shared). The use of the city PPT notably increased in zone 1b (21.8%) and substantially in zone 1c (53.8%). The elevated reliance on the city PPT could be attributed to the limited options for car use, combined with factors such as accessibility of stops, suitable lines, affordable prices and sufficient frequency.
Up to 68.5% of the students commuted daily to the BCTF from their permanent residence in the neighboring towns of Maribor (Table 1). Most, 33.8%, came from zone 3 (20–50 km from the BCTF), while 8.5% traveled from zone 4 (over 50 km from the BTCF). Students’ decision to live at home, rather than in student housing, is primarily influenced by factors such as the accessibility and cost of dormitories and private accommodation. Furthermore, this decision is in line with the cultural norm in Slovenia, where a considerable number of young people prefer to live at home for a longer period of time. In zones 2 and 3, cars (own and shared) were the predominant transport mode, representing 67% and 58.5%, respectively (Table 2). Interest in using the regional PPT increased with distance and became the preferred transport mode for students commuting from zone 4 (54.9%). This trend can be attributed to the subsidization of PPT tickets and the (un)availability of the family car. Namely, the challenges of sharing a family car become more pronounced with increasing travel distances. The results also highlight the influence of students’ financial situations on their commuting preferences and residential choices.
Among students with term-time accommodation in the city of Maribor, a significant 83.6% commuted from zone 1a, 11.6% from zone 1b and only 4.8% from zone 1c (Table 1). This distribution indicates that students predominantly reside in dormitories and private accommodation strategically located in the proximity of the BCTF. Notably, the majority of students in all three zones (1a, 1b and 1c) preferred walking as their mode of transport, accounting for 79.1%, 75.6% and 49.9%, respectively (Table 2). Bicycling and using the city PPT were less favored, except for longer trips from zone 1c (22.4% and 22.2%, respectively). The commuting behavior of students with term-time accommodations differs significantly from that of students with permanent residences in the city and shows a more sustainable pattern. This difference can be attributed to the fact that they are less familiar with the city’s traffic and PPT system, leading them to opt for walking or bicycling. Additionally, their access to personal bicycles or cars in term-time accommodations is limited. Unlike students with permanent residences who can easily access a family car, students with term-time accommodations do not have this option unless they use the family car for an extended period of time or own one. Consequently, students with term-time accommodation are more likely to choose bicycling and the city PPT for longer trips from zone 1c, while students with permanent residences prefer cars and the city PPT. Our results are consistent with those from studies in Spain [44], which found that students residing close to the university are more inclined to engage in active commuting. The distance that best distinguishes pedestrians from passive commuters was found to be 2.6 km.
Students with term-time accommodations in the city of Maribor also engaged in intermittent commuting from their permanent residences in the neighboring towns of Maribor. Of these students, 72.4% commuted once a week, 7.6% three times a month, 10.3% twice a month, 9.7% once a month and the rest commuted even less frequently. Most of these intermittent trips originated from zone 4 (85.6%). In zones 3 and 4, the regional PPT was the most frequently chosen mode of transport, accounting for 68.4% and 54.7%, respectively (Table 2). This notable preference for using the regional PPT can be attributed to influencing factors such as the subsidization of PPT tickets, the (un)availability of personal cars and parking management.
Slightly more than half of staff commuted daily from their permanent residence in the city of Maribor to the BCTF (Table 1). For zone 1a commuters, walking was the predominant transport mode, with only 44.2% choosing it (Table 2). Additionally, 28.3% opted for bicycling, while 26.2% used a car (their own and shared) for these short trips. The car preference is influenced by the employer’s parking policy, providing affordable parking near the BCTF. However, interest in walking decreased rapidly with increasing distance, as only 18% of staff from zone 1b and merely 0.1% from zone 1c walked, indicating that they are unwilling to walk more than 1 km—similar to students commuting daily from their permanent residence in the city. Interest in bicycling remained consistent for trips from zone 1b and decreased to 8.7% for trips from zone 1c, suggesting that bicycling is not a popular transport mode among staff despite convenient distances. This situation is reflected in the increased car reliance, while the use of the city PPT was negligible. Only 14.4% of staff commuted by city PPT from 1c, while 49.2% and 75.4% of staff used cars for trips from zones 1b and 1c, respectively. A comparison with students commuting daily from their permanent residence reveals that students used cars less frequently and relied more on the city PPT, which is influenced by factors such as car ownership, associated costs, subsidization of PPT tickets and parking regulations.
Among staff commuting daily from neighboring towns of Maribor to the BCTF, 22.4% came from zone 2, 12.9% from zone 3 and 9.8% from zone 4 (Table 1). The predominant mode of transport chosen by commuters from all three zones was the car (their own and shared), accounting for 97.4%, 94.5% and 87.3%, respectively. This represents a clear difference compared to students. It is worth noting that staff had practically no interest in using the regional PPT, except for distances exceeding 50 km, where the proportion was 12.8%.
The analysis of transport mode choices provides an insight into the different commuting patterns of three user groups and enables a deeper understanding of the factors influencing their decisions. These findings are relevant for both transportation and environmental studies, particularly in the pursuit of sustainable mobility solutions. The results show a significant difference in commuting behavior and modal split, not only between students and staff but also between students with term-time accommodation and those commuting daily from their permanent residences. This highlights the importance of addressing these two groups of students and staff separately to identify their unique commuting dynamics and preferences. Students with term-time accommodations exhibit the most sustainable choices, with walking being the predominant mode of transport among active options. Bicycling, although suitable for city distances, is notably underutilized. Conversely, staff demonstrate less sustainable commuting behavior, favoring the car as their primary mode of transport, especially in the zones beyond 1a. It is noteworthy that the commuting patterns of staff are similar to those of students commuting daily from their permanent residences, although students also use the city and regional PPT.
3.2. Factors Influencing Active Commuting to the BCTF and Travel Distances
The data on barriers influencing the decision to commute to the BCTF on foot, by bicycle or by PPT were collected using a questionnaire survey (Table 3, Table 4 and Table 5). In designing the questionnaire, our goal was to identify the main barriers that students and staff perceive when using individual modes of transport. The analyses revealed the key factors that play a pivotal role in active commuting to the BCTF, considering three user groups and different travel distances.
The primary barrier hindering walking from zones 1a, 1b and 1c to the BCTF for all three user groups was an unattractive path (Table 3). Additionally, hygienic reasons (lack of showers and changing rooms) were prominently highlighted. A notable proportion of both student groups tended to use other transport modes, while 45.5% of students commuting daily from their permanent residence in zone 1c expressed the view that walking was not a feasible option for them. Similarly, 56.3% of staff believed that walking was not practical for their commutes from zone 1c.
The principal barrier preventing students and staff from bicycling to the BCTF from their permanent residences in zones 1a, 1b and 1c was identified as poor infrastructure (Table 4). This barrier was also cited for trips from zone 2, but for the most inappropriate distance. Both the risk of bicycle theft and hygiene reasons deterred respondents from zones 1b and 1c from choosing bicycling as a commuting mode. In all zones, a considerable proportion of the student group expressed a preference for other modes of transport. For students commuting from their term-time accommodation in zones 1a, 1b and 1c, barriers such as lack of bicycle ownership and the risk of bicycle theft further discouraged bicycling to the BCTF. These barriers highlight the lack of secure bicycle parking in student dormitories and private accommodations, elucidating the overall low levels of bicycle use.
All three user groups indicated that insufficient distance was the primary barrier to using the city PPT for commuting to the BCTF from zones 1a and 1b (Table 5). For students and staff commuting from their permanent residence in zone 1c, the low frequency of trips, lack of PPT connections and too-distant bus stations acted as deterrents to using the city PPT. Similarly, commuters from zones 2, 3 and 4 faced challenges with the regional PPT due to the lack of PPT connections, low frequency of trips and too-distant bus stations. Notably, the lack of PPT connections was consistently identified as a prominent barrier for trips from zones 3 and 4.
3.3. Scenarios for Shifting to More Sustainable Modes of Transport
The challenges of active commuting to the BCTF are addressed using measures developed based on analyses of transport mode choices, factors influencing active commuting and directions outlined in the university, municipal and state strategic documents (Section 2.3). It has been found that measures designed to address the stated preferences of a specific user group or zone are difficult to target exclusively. Consequently, most measures are devised to impact multiple user groups simultaneously and are frequently implemented across various zones.
There are certain general measures where collaboration between the UM and municipal authorities is crucial. In zone 1a, a complete ban on motorized traffic is envisaged, while in zone 1b, the aim is to change priorities at intersections in favor of pedestrians and bicycles. In all three city zones (1a–c), the measures encompass green corridors, reconstruction of infrastructure for pedestrians and bicycles, changing priorities at intersections and initiatives to boost the use of the city PPT. The latter involves increasing the PPT frequency, enhancing accessibility, synchronizing PPT (transfer points and timetable), improving ticketing (integrated tickets and subsidies) and implementing reserved yellow lanes. The measures in zones 2, 3 and 4 pertain to the regional PPT and require collaboration between the UM, state authorities and PPT authorities. The most important measures include improving the accessibility of bus stops, setting up new regional PPT lines, increasing the frequency of services and ensuring better connections with other modes of transport (intermodality).
The proposed measures need to be complemented by effective parking management policies and enhanced subsidies for PPT. Parking regulations should promote sustainable commuting practices at UM. To achieve this, users could be selected on the basis of a sustainability index, and parking fees should be gradually increased. While there is already student subsidization of the city and regional PPT, further enhancements require collaboration between the UM and state authorities. The subsidization of PPT for staff depends on UM’s policy. Currently, the employer reimburses commuting costs at the same rate as PPT fares, but funds can also be used for private car commutes. A revision of this policy would have a significant impact on the preference for active modes of transport.
Alongside the general measures, specific measures tailored to individual user groups should also be implemented. For students commuting daily from their permanent residence, crucial measures include awareness-raising campaigns, the enlargement of the city’s bike-sharing system, the installation of secure bicycle racks in the BCTF area and subsidies for the purchase of e-bikes. The latter two are particularly important for commuters from zone 1c. Similar considerations apply to students commuting daily from their term-time accommodations. Staff, on the other hand, would be encouraged to actively commute via awareness-raising activities, the installation of secure bicycle racks in the BCTF area, the provision of changing rooms and showers at the BCTF and subsidies for the purchase of e-bikes. The UM is responsible for the implementation of these measures, which requires collaboration with the municipal authorities for the further development of the bike-sharing system and with state authorities for subsidizing the purchase of e-bikes.
On the basis of the described measures, two scenarios were developed to increase active commuting to the BCTF and investigate the resulting reduction in CO2 emissions. The first scenario, named the new challenge scenario, envisions an ideal version with the aim of identifying optimal solutions that contribute to achieving climate policy goals.
This scenario is framed by two key challenges: firstly, the complete elimination of car trips for all user groups from zone 1a, and, secondly, a 50% reduction in car commuting trips from all other zones.
The elimination of car traffic would result in a modal shift. In zone 1a, where the influence extends to trips within a 1 km radius, no significant increase in the use of the city PPT was expected. Consequently, existing car trips would be fully and evenly distributed between pedestrians and bicyclists. In zone 1b, which covers distances of 1 to 2 km, the survey results indicate that all three modalities—walking, bicycling and using the city PPT—are viable options. Therefore, half of the existing car trips would be evenly distributed among these modes of transport. For zone 1c, spanning distances of 2 to 5 km, walking may not be the preferred option due to the longer distances involved. However, bicycling and the use of the city PPT are considered ideal alternatives [44,45,46,47]. Consequently, a modal shift in zone 1c would be evenly split between bicycling and the use of the city PPT. Zones 2, 3 and 4 cover distances from 5 km to over 50 km, so it is unrealistic to expect a modal shift in favor of walking and bicycling. Therefore, policies concerning the regional PPT, as well as the city PPT, should focus on providing sufficient and high-quality transport services for students and staff, with the aim of shifting half of existing car trips to the regional PPT.
The area within a 1 km radius of the BCTF is already designated as a partially non-motorized traffic area (city center). As part of upcoming reconstruction of the BCTF [38], both traffic and spatial changes are planned in this area. Road closures for motorized traffic and modifications to the parking lot access are planned in order to substantially improve the accessibility of the BCTF for active modes of transport. These changes will simultaneously pose challenges for car access and parking, promoting a shift towards more sustainable options. We assume that the new traffic regulation in zone 1a will also encourage active commuting from zone 1b and, to some extent, from zone 1c. Otherwise, it would be feasible to shift half of the existing car trips in these zones using measures to promote walking, cycling and city PPT, as outlined earlier in this subsection. In zones 2, 3 and 4, shifts in commuting modes will depend on the regulation governing the regional PPT system.
As the objectives of the new challenge scenario are long-term and depend on the successful implementation of transport and climate policy measures at both state and municipal levels, an intermediate scenario was developed. This scenario, known as the ambitious scenario, serves as an interim strategy on the way to achieving these long-term goals. In this scenario, it is assumed that all user groups abstain from driving in zone 1a, while car trips from all other zones are reduced by 30%. The modal shift is proportional to that described in the new challenge scenario.
3.4. CO2 Emissions
The calculations of annual CO2 emissions for the baseline scenario, the ambitious scenario and the new challenge scenario are shown in Table 6 with the values extrapolated to the entire BCTF community. The emission estimates for car and bus trips were conducted using the DEFRA methodology, as described in Section 2.3. Emissions from other motorized trips are considered negligible, and emissions from walking and bicycling are assumed to be zero.
In the baseline scenario, reflecting the current choice of transport mode (Table 6), commuting to the BCTF generates 2177 tons of CO2 per year. Students commuting daily from their permanent residence contribute significantly, accounting for 47% of total emissions. Commuters from zones 3 and 4 together account for a substantial proportion of CO2 emissions, 51% and 30%, respectively. Car trips contribute significantly to these emissions, with 82% coming from zone 3 and 72% from zone 4. The contribution of students commuting daily from their permanent residence in city zones 1a–c to total student emissions is relatively low, accounting for only 3%.
Students with both term-time and permanent residences (52.9% of students) generate 39% less CO2 emissions compared to their peers commuting daily from permanent residences (Table 6). This highlights the environmental benefits of such arrangements. A total of 98% of CO2 emissions are attributed to intermittent commuting from permanent residences, with car trips accounting for 72% of these emissions. Consequently, students commuting daily from their term-time accommodation in zones 1a–c produced by far the lowest annual CO2 emissions. A notable comparison is made with students commuting daily from their permanent residences in city zones, emphasizing 3.5 times higher annual CO2 emissions, with car trips being a predominant factor (78%).
Although staff make up 18% of the BCTF population, their commute accounts for 33% of students’ annual CO2 emissions (Table 6). A substantial 97% of these emissions emanate from car trips, highlighting the significant impact of this mode of transport. Commuting from city zones 1a–c contributes 7% of total staff CO2 emissions, which is 1.2 times higher than emissions from students commuting daily from their permanent residence in the city and 4.1 times higher than emissions from students commuting from their term-time accommodation. These findings emphasize the high contribution of staff to CO2 emissions, primarily attributed to a greater reliance on car use.
The assessment of annual CO2 emissions in the ambitious scenario (Section 3.3) indicates that commuting to the BCTF would result in a total of 1800 tons of CO2 per year (Table 6). A shift to more sustainable modes of transport could lead to an annual saving of 378 tons of CO2, representing a 17% reduction compared to the baseline scenario. Promoting the increased use of walking, bicycles and the city PPT in zones 1a–c has the potential to reduce CO2 emissions by 20–28%, depending on the user group. Specifically, in zones 1a, 1b and 1c, emissions would be reduced by 46–98%, 22–25% and 11–18%, respectively. Furthermore, a modal shift in favor of the regional PPT could lead to a 15–20% reduction in CO2 emissions for commuters from zones 2, 3 and 4. The results indicate that the greatest environmental benefits can be expected in zones 1a and 1b, where the planned mitigation measures aim to promote walking and bicycling.
When examining CO2 emissions of the new challenge scenario, it is found that the elimination of car trips results in an annual saving of 626 tons of CO2, which corresponds to a 29% reduction compared to the baseline scenario (Table 6). A modal shift in city zones 1a–c would lead to a 34–44% reduction in CO2 emissions, with variations based on the user group. Notably, this reduction is more substantial in specific zones, reaching percentages of 46–95%, 38–42% and 19–40% for zones 1a, 1b and 1c, respectively. Additionally, promoting the increased use of the regional PPT would result in a 25–34% reduction in CO2 emissions for commuting from zones 2, 3 and 4. Similar to the ambitious scenario, the new challenge scenario also achieves the greatest environmental benefits in zones 1a and 1b. This is due to the shift from cars to walking and bicycling.
The analysis of CO2 emission calculations shows that the majority of emissions are related to long commutes and the predominant use of cars. The choice of residence arrangements plays a significant role in the generation of these emissions. On the one hand, it influences travel distances and, on the other hand, the choice of travel mode, which varies depending on the user group. The transport modes chosen by staff and students commuting daily from their permanent residences in the city contribute significantly more to CO2 emissions than those of students commuting from their term-time accommodation.
This underscores the need for targeted initiatives to promote active commuting, particularly for these two user groups. The greatest potential for CO2 savings is in city zones, where a modal shift to walking and bicycling is particularly effective. Furthermore, the results show the importance of promoting student housing in close proximity to the BCTF, either in dormitories or in private accommodations. This strategy proves to be a more environmentally friendly alternative compared to the environmental impact of daily commuting from distant towns, which results in considerably higher CO2 emissions. However, this housing strategy is not equally suitable for staff. In their case, it is crucial to implement measures to promote the use of regional PPT for longer commutes. Similar considerations apply to students commuting intermittently from their permanent residence and to those commuting daily from locations in the vicinity of Maribor. The introduction of electric buses can serve as an additional measure to mitigate CO2 emissions [30].
4. Discussion
In the search for solutions to mitigate the environmental impact of traffic, it is crucial to understand the travel behavior of different user groups. Previous studies (Section 1) indicated significant differences in travel behavior between students and staff. The results of this study reveal further distinctions in the travel behavior of students commuting daily from their permanent residences to the BCTF, students commuting daily from their term-time accommodation in Maribor and staff. The main difference between students commuting daily from their permanent residence to the BCTF and staff is the predominant use of cars.
The results of previous studies underlined the important role of university parking management in influencing private car commuting (Section 1). A substantial 86% of staff can park in BCTF parking lots, resulting in a high percentage of car commuters [48]. Consequently, staff interest in using PPT was low. A shift from car use to city and regional PPT was observed among students. These findings confirm those of previous research indicating that a combination of policies that encourage PPT use and discourage parking are effective in facilitating a shift in transport mode [2,7,18,48,49,50,51]. However, it is noteworthy that 46% of students and as many as 49.2%–75.4% of staff continue to use cars (their own and shared) for commutes within the 1–5 km range, where walking and cycling would be more suitable. The majority of students (33.8%) came from a 20–50 km radius of the BCTF, with the car (own and shared) being the predominant mode of transport at 58.5%. Importantly, both user groups were unwilling to walk more than 1 km, which is consistent with data from Shannon et al. [2] and Zhan et al. [43].
Previous studies [44,49] indicated that students residing near their faculties were more likely to actively commute. In our case, this pattern applies to students with term-time accommodation in Maribor, constituting 52.9% of the student population. In contrast to permanent residents and staff, this group of students showed a preference for walking or bicycling. Their competitive distance for walking exceeded 2 km, which was one time greater than for the other two user groups. Our results are consistent with the studies by Delmelle and Delmelle [19], Hidalgo-Gonzalez et al. [52] and Chillon et al. [44], in which walking was reported as the primary mode of transport for students living 2.5 to 2.6 km from campus. The use of bicycles and the city PPT became popular for distances between 2 and 5 km (22.4% and 22.2%, respectively).
The different commuting behavior of user groups was reflected in CO2 emissions. Students commuting daily from their permanent residence contributed the highest annual CO2 emissions, constituting 47% of the total. At 80%, car trips were the largest source of these emissions. Commuters residing within a 20–50 km radius of the BCTF accounted for 51% of CO2 emissions. Notably, students with term-time accommodations generated 39% less annual CO2 emissions compared to those commuting daily from their permanent residences. This aligns with the findings of Davison et al. [29], who observe lower CO2 emissions when students reside in term-time accommodations and often choose locations close to university campuses, which facilitates the use of environmentally friendly modes of transport such as public transport, walking or bicycling. In Maribor, this group of students generated 3.5 times and 4.1 times less annual CO2 emissions within a 0–5 km radius of the BCTF than students and staff commuting daily from their permanent residence in the city, respectively. Despite constituting 18% of the BCTF population, staff contributed to 33% of total annual CO2 emissions, with car trips accounting for 97% of their total emissions. These results confirm those of previous research [26,32] indicating that staff, primarily commuting by car, generate the highest per capita CO2 emissions from their annual trips to the university.
Eliminating car trips within a 0–1 km radius of the BCTF for all user groups and reducing car trips from other commuting zones by 30% and 50% in favor of active commuting would result in a 17% and 29% reduction in CO2 emissions per year, respectively. These findings are consistent with those of Ribeiro and Fonseca [11], who, using a similar methodology to calculate CO2 emissions, have found that decreasing car trips from 14% to 42% in favor of sustainable modes of transport can lead to an 8% to 27% reduction in emissions. Additionally, Pérez-Neira et al. [26] reported that substituting cars with bicycles (50% in < 4 km distances) could result in a 17.5% reduction in CO2-eq emissions. Our results show that the greatest potential for CO2 savings lies within a 0–5 km radius of the BCTF, where a shift to walking and bicycling is prominent. Under the first scenario, emissions would decrease by 20–28%, depending on the user group, and by 34–44% under the second scenario. It is crucial to note that the majority of CO2 emissions are associated with motorized trips from zones more than 5 km from the BCTF. Therefore, the regional PPT and the city PPT should offer efficient and high-quality transportation services for students and staff to encourage a modal shift away from the car in this area.
The presented results have some limitations. In our study, the transport mode choices of user groups were determined solely on the basis of the travel distances. While this method is simplistic, the data are valuable for investigating commuting behavior and its impact on CO2 emissions [11,53]. Although travel distance significantly influences transport mode choices, other factors such as safety, comfort, weather and economic status also play a role [2,43,54,55]. These factors should be considered in further research.
The next limitation concerns the estimates of annual CO2 emissions attributed to student commuting to the BCTF, which were derived from home–BCTF commuting during 160 school days. This approach did not consider factors such as the possibility that students made several trips per day or did not travel to the BCTF every day.
Another important limitation concerns the scenarios used to study the reduction in CO2 emissions resulting from changes in transport modes. The proposed new challenge scenario is unlikely to happen, as it depends on the implementation of numerous transport and climate policy measures at both state and municipal levels which are difficult to realize. Additionally, the accuracy level of factors stimulating active commuting has not been validated. Nevertheless, the primary purpose of this scenario is to illustrate potential CO2 savings under ideal conditions.
To realize the two transport scenarios and encourage active commuting to the BCTF, a series of measures were outlined. The UM should engage in collaborative efforts with municipal authorities to implement measures to improve the efficiency and accessibility of pedestrian and bicycle pathways, increase the use of the city PPT and expand the bike-sharing system. Furthermore, collaboration with state authorities is essential for implementation measures to increase the use of regional PPT, provide subsidies for the purchase of e-bikes and provide subsidies for PTT. The UM must oversee the installation of secure bicycle racks and facilities such as changing rooms and showers at the BCTF. Additionally, engaging in awareness and promotion activities and subsidizing PTT are important components of fostering active commuting. The results indicate that tailored measures should be implemented based on individual user groups and travel distances. Awareness and promotion activities are important for all user groups [56,57,58,59,60], with a particular focus on staff and students commuting daily from their permanent residences. These two groups generate significantly more CO2 emissions compared to students commuting from their term-time accommodations. Previous studies have indicated that the provision of well-designed pedestrian and bicycle facilities is one of the most effective strategies for increasing the number of pedestrians and cyclists [16,20,61,62,63,64,65]. Furthermore, electric bicycles represent an alternative that could extend the range of active cycling, offering a less demanding solution for urban transportation [66,67,68,69]. Nematchoua et al. [67] suggested that the development and/or improvement of a comfortable and secure infrastructure for cyclists within a radius of 12 km from the main school and work places, especially in the main residential and commercial areas, should be prioritized to promote the use of both types of bicycles. A comprehensive review by Göransson and Andersson [70] provides insights into the factors influencing travel behavior and the demand for public transport. The findings show that reliability and frequency are important factors for creating an attractive public transport supply. Given that car users already experience these qualities in their current travel mode, a PPT system with high punctuality and frequency alone is insufficient to induce a mode shift. To attract car users to the PPT system, it must offer a cost-competitive alternative to the car with basic levels of accessibility and reliability, together with attributes viewed as important by the target group [71]. A Slovenian study showed that PPT tariffs had a significant impact on travel behavior [72]. The findings are consistent with those of previous studies indicating that the strategy most likely to encourage students to switch from cars to PPT is to make PPT cheaper via subsidized fares [2,10,49,73]. Previous studies [29,74,75] have also indicated that the establishment of a high-frequency national bus/coach service and investment in a motorway network to enhance the speed of bus/coach travel are effective measures to promote the use of PPT.
The results of this study suggest that the effectiveness of the proposed measures can be enhanced via a combination of UM and city parking policies, as this approach was found to be more impactful [2,7,49,50]. Moreover, the results underline the importance of parallel support via housing policies to promote student housing in dormitories and private accommodations in close proximity to the BCTF, as students are most likely to actively commute from there and contribute the lowest CO2 emissions. This is consistent with previous research showing that the choice of more sustainable modes of transport is strongly influenced by where a student lives [7,49,76,77]. The studies reveal that students are willing to use more sustainable, less energy-demanding modes of transport, but only if they can access accommodation close to universities. Our results indicate that 47.1% of students opt to live at their permanent residence, leading to many of them commuting daily from longer distances. This commuting pattern significantly influences transport mode choices and contributes to CO2 emissions.
5. Conclusions
Using the BCTF case study, we investigated the potential for the UM to mitigate the carbon footprint of commuting and thus contribute to a sustainable transport policy for both the UM and the city. The mobility patterns and their impact on CO2 emissions were analyzed to identify the key contributors and understand the reasons behind the emissions.
The results indicate significant differences in commuting behavior and modal split among students with term-time accommodation, students commuting daily from their permanent residences and staff, emphasizing the need for tailored strategies in sustainable mobility solutions. Students with term-time accommodations demonstrated the most sustainable choices and predominantly opted for walking in the city environment. Conversely, 46% of students commuting daily from their permanent residences and 49.2–75.4% of staff continued to use cars for trips within a 1–5 km radius. The car was the most important mode of transport especially for staff commuting from neighboring towns of Maribor, with a share ranging from 87.3% to 97.4%. In addition to the car, students commuting daily from neighboring towns of Maribor also used the PPT, with a share ranging from 33% to 54.9%.
The analysis of CO2 emissions reveals that the majority is related to long commutes and the predominant use of cars, with residence arrangements playing a decisive role. Students commuting daily from their permanent residence contributed the highest annual CO2 emissions, accounting for 47% of the total. In contrast, students with term-time accommodations generated 3.5 times and 4.1 times less annual CO2 emissions within a 0–5 km radius of the BCTF than students and staff commuting daily from their permanent residences in the city, respectively. These results highlight the importance of implementing targeted measures to address the most polluting user groups. The main priority is to reduce trips by private cars and their distances. The distance of trips could be reduced via housing policy initiatives encouraging student accommodations in dormitories and private residences located in close proximity to the BCTF. On the other hand, car trips could be reduced via the promotion of active commuting.
In our study, we provided suggestions and solutions for challenges related to active commuting in different zones around the BCTF. The analyses of factors influencing active commuting, aligned with directions from university, municipal and state strategic documents, led to a set of measures to promote walking, bicycling and the use of city and regional PPT at the BCTF. The results suggest that the proposed transport measures should be tailored to individual user groups and distances, complemented by parallel support via parking policies and subsidy initiatives. Based on these measures, two scenarios were developed to assess the potential reduction in CO2 emissions resulting from a shift from private cars to alternative modes of transport. If all user groups eliminate car trips within 0–1 km of the BCTF and reduce car trips from other commuting zones in favor of active commuting by 30% and 50%, annual CO2 emissions would decrease by 17% and 29%, respectively. The greatest potential for CO2 savings is evident within a 0–5 km radius of the BCTF, where a shift to walking and bicycling could reduce emissions by up to 44%.
An additional reduction in CO2 emissions could be achieved by implementing housing policy measures aimed at reducing the distance of trips. The results suggest that the provision of housing near the BCTF has a significant impact on student mobility, emphasizing the necessity for a more in-depth study. Future research could investigate, among other considerations, whether commuting students would be more likely to move closer to the university and thus reduce their commuting carbon footprint if the prices of dormitories were lower or the accessibility of places were higher.
The present work also has some weaknesses and limitations that open the door for future research directions. Since the method used to determine transport mode choices of user groups is simplistic, relying solely on travel distances, future research should also focus on analyzing how the travel behavior of different user groups is influenced by safety, comfort, weather and economic status. To improve the accuracy of identifying user groups and factors that promote active commuting, it is suggested to conduct a more comprehensive survey across the UM community.
Despite the mentioned limitations, the results of this study offer valuable insights for sustainability planning. They contribute to the improvement and design of policies aimed at encouraging a shift from car trips to active modes of transport and reducing the carbon footprint in cities where universities play a significant role as traffic generators.
Supplementary Materials
The following supporting information can be downloaded at: https://0-www-mdpi-com.brum.beds.ac.uk/article/10.3390/su16020520/s1, Survey of travel habits s1.
Author Contributions
Conceptualization, B.M. and B.T.; methodology, B.M. and B.T.; validation, B.M. and B.T.; formal analysis, B.M.; investigation, B.M. and B.T.; data curation, B.M.; writing—original draft preparation, B.M. and B.T.; writing—review and editing, B.M. and B.T.; visualization, B.T. and B.M.; supervision, B.M. and B.T. All authors have read and agreed to the published version of the manuscript.
Funding
The questionnaire was funded by the LIFE IP CARE4CLIMATE project (LIFE17 IPC/SI/000007).
Institutional Review Board Statement
The University of Maribor processes and protects personal data of individuals in accordance with Regulation (EU) 2016/679 of the European Parliament and of the Council of 27 April 2016 on the protection of individuals with regard to the processing of personal data, on the free movement of such data, and repealing Directive 95/46/EC (OJ L 119, 4 May 2016, pp. 1–88; hereinafter: General Data Protection Regulation (or GDPR), the Personal Data Protection Act (Official Gazette of the Republic of Slovenia, No. 94/2007–official consolidated version and 177/20)) and in accordance with other national and internal legal acts.
Informed Consent Statement
The questionnaire was a non-interventional study in which all participants were fully informed that anonymity was guaranteed, why the research was being conducted, how their data would be used and whether there were any risks involved. Participation was voluntary.
Data Availability Statement
The data are contained withing the manuscript.
Acknowledgments
The authors would like to thank the team of the LIFE IP CARE4CLIMATE project for their assistance with data collection.
Conflicts of Interest
The authors declare no conflicts of interest.
References
- Mekinda Majaron, T.; Plevnik, A. Izpusti Toplogrednih Plinov iz Prometa. Available online: https://kazalci.arso.gov.si/sl/content/izpusti-toplogrednih-plinov-iz-prometa-5 (accessed on 15 September 2023).
- Shannon, T.; Giles-Corti, B.; Pikora, T.; Bulsara, M.; Shilton, T.; Bull, F. Active commuting in a university setting: Assessing commuting habits and potential for modal change. Transp. Policy 2006, 13, 240–253. [Google Scholar] [CrossRef]
- Balsas, C.J.L. Sustainable transportation planning on college campuses. Transp. Policy 2003, 10, 35–49. [Google Scholar] [CrossRef]
- Assi, K.; Gazder, U.; Al-Sghan, I.; Reza, I.; Almubarak, A. A Nested Ensemble Approach with ANNs to Investigate the Effect of Socioeconomic Attributes on Active Commuting of University Students. Int. J. Environ. Res. Public Health 2020, 17, 3549. [Google Scholar] [CrossRef] [PubMed]
- Szmelter-Jarosz, A.; Suchanek, M. Mobility Patterns of Students: Evidence from Tricity Area, Poland. Appl. Sci. 2021, 11, 522. [Google Scholar] [CrossRef]
- Vahedi, J.; Shams, Z.; Mehdizadeh, M. Direct and indirect effects of background variables on active commuting: Mediating roles of satisfaction and attitudes. J. Transp. Health 2021, 21, 101054. [Google Scholar] [CrossRef]
- Zhou, J. Sustainable commute in a car-dominant city: Factors affecting alternative mode choices among university students. Transp. Res. Part A Policy Pract. 2012, 46, 1013–1029. [Google Scholar] [CrossRef]
- Urmi, U.F.; Rahman, K.; Uddin, M.J.; Hasan, M.N. The Prevalence of Active Commuting to School and the Factors Influencing Mode Choice: A Study of University Students in a Secondary City of Bangladesh. Sustainability 2022, 14, 16949. [Google Scholar] [CrossRef]
- Sultana, S.; Kim, H.; Pourebrahim, N.; Karimi, F. Geographical assessment of low-carbon transportation modes: A case study from a commuter university. Sustainability 2018, 10, 2696. [Google Scholar] [CrossRef]
- Schubert, T.F.; Henning, E.; Lopes, S.B. Analysis of the possibility of transport mode switch: A case study for Joinville students. Sustainability 2020, 12, 5232. [Google Scholar] [CrossRef]
- Ribeiro, P.J.G.; Fonseca, F. Students’ home-university commuting patterns: A shift towards more sustainable modes of transport. Case Stud. Transp. Policy 2022, 10, 954–964. [Google Scholar] [CrossRef]
- Meesit, R.; Puntoomjinda, S.; Chaturabong, P.; Sontikul, S.; Arunnapa, S. Factors Affecting Travel Behaviour Change towards Active Mobility: A Case Study in a Thai University. Sustainability 2023, 15, 11393. [Google Scholar] [CrossRef]
- Risdiyanto; Munawar, A.; Irawan, M.Z.; Fauziah, M.; Belgiawan, P.F. Why Do Students Choose Buses over Private Motorcycles and Motorcycle-Based Ride-Sourcing? A Hybrid Choice Approach. Sustainability 2022, 14, 4959. [Google Scholar] [CrossRef]
- Bakdur, A.; Masui, F.; Ptaszynski, M. Predicting Increase in Demand for Public Buses in University Students Daily Life Needs: Case Study Based on a City in Japan. Sustainability 2021, 13, 5137. [Google Scholar] [CrossRef]
- Dehghanmongabadi, A.; Hoşkara, S. Challenges of promoting sustainable mobility on university campuses: The case of Eastern Mediterranean University. Sustainability 2018, 10, 4842. [Google Scholar] [CrossRef]
- Azzali, S.; Sabour, E.A. A framework for improving sustainable mobility in higher education campuses: The case study of Qatar University. Case Stud. Transp. Policy 2018, 6, 603–612. [Google Scholar] [CrossRef]
- Fernandes, P.; Sousa, C.; Macedo, J.; Coelho, M.C. How to evaluate the extent of mobility strategies in a university campus: An integrated analysis of impacts. Int. J. Sustain. Transp. 2020, 14, 120–136. [Google Scholar] [CrossRef]
- Rotaris, L.; Danielis, R. The impact of transportation demand management policies on commuting to college facilities: A case study at the University of Trieste, Italy. Transp. Res. Part A Policy Pract. 2014, 67, 127–140. [Google Scholar] [CrossRef]
- Delmelle, E.M.; Delmelle, E.C. Exploring spatio-temporal commuting patterns in a university environment. Transp. Policy 2012, 21, 1–9. [Google Scholar] [CrossRef]
- Lundberg, B.; Weber, J. Non-motorized transport and university populations: An analysis of connectivity and network perceptions. J. Transp. Geogr. 2014, 39, 165–178. [Google Scholar] [CrossRef]
- Crist, K.; Brondeel, R.; Tuz-Zahra, F.; Reuter, C.; Sallis, J.F.; Pratt, M.; Schipperijn, J. Correlates of active commuting, transport physical activity, and light rail use in a university setting. J. Transp. Health 2021, 20, 100978. [Google Scholar] [CrossRef]
- Bouhouras, E.; Basbas, S.; Mintsis, G.; Taxiltaris, C.; Miltiadou, M.; Nikiforiadis, A.; Konstantinidou, M.N.; Mavropoulou, E. Level of Satisfaction among University Students Using Various Transport Modes. Sustainability 2022, 14, 4001. [Google Scholar] [CrossRef]
- Stankov, I.; Garcia, L.M.T.; Mascolli, M.A.; Montes, F.; Meisel, J.D.; Gouveia, N.; Sarmiento, O.L.; Rodriguez, D.A.; Hammond, R.A.; Caiaffa, W.T.; et al. A systematic review of empirical and simulation studies evaluating the health impact of transportation interventions. Environ. Res. 2020, 186, 109519. [Google Scholar] [CrossRef] [PubMed]
- Xiao, G.; Chen, L.; Chen, X.; Jiang, C.; Ni, A.; Zhang, C.; Zong, F. A Hybrid Visualization Model for Knowledge Mapping: Scientometrics, SAOM, and SAO. IEEE Trans. Intell. Transp. Syst. 2023, 1–14. [Google Scholar] [CrossRef]
- Barros, M.V.; da Silva, B.P.A.; Piekarski, C.M.; da Luz, L.M.; Yoshino, R.T.; Tesser, D.P. Carbon footprint of transportation habits in a Brazilian university. Environ. Qual. Manag. 2018, 28, 139–148. [Google Scholar] [CrossRef]
- Pérez-Neira, D.; Rodríguez-Fernández, M.P.; Hidalgo-González, C. The greenhouse gas mitigation potential of university commuting: A case study of the University of León (Spain). J. Transp. Geogr. 2020, 82, 102550. [Google Scholar] [CrossRef]
- Neves, A.; Brand, C. Assessing the potential for carbon emissions savings from replacing short car trips with walking and cycling using a mixed GPS-travel diary approach. Transp. Res. Part A Policy Pract. 2019, 123, 130–146. [Google Scholar] [CrossRef]
- Mathez, A.; Manaugh, K.; Chakour, V.; El-Geneidy, A.; Hatzopoulou, M. How can we alter our carbon footprint? Estimating GHG emissions based on travel survey information. Transportation 2013, 40, 131–149. [Google Scholar] [CrossRef]
- Davison, L.; Ahern, A.; Hine, J. Travel, transport and energy implications of university-related student travel: A case study approach. Transp. Res. Part D Transp. Environ. 2015, 38, 27–40. [Google Scholar] [CrossRef]
- Appleyard, B.; Frost, A.R.; Cordova, E.; McKinstry, J. Pathways toward zero-carbon campus commuting: Innovative approaches in measuring, understanding, and reducing greenhouse gas emissions. Transp. Res. Rec. 2018, 2672, 87–97. [Google Scholar] [CrossRef]
- Hafezi, M.H.; Daisy, N.S.; Liu, L.; Millward, H. Modelling transport-related pollution emissions for the synthetic baseline population of a large Canadian university. Int. J. Urban Sci. 2019, 23, 519–533. [Google Scholar] [CrossRef]
- Sobrino, N.; Arce, R. Understanding per-trip commuting CO2 emissions: A case study of the Technical University of Madrid. Transp. Res. Part D Transp. Environ. 2021, 96, 102895. [Google Scholar] [CrossRef]
- Commission, E.; Communication, D.-G. Kaj je Evropski Zeleni Dogovor? Publications Office of the European Union: Luxembourg, 2019. [Google Scholar]
- DEFRA (Department for Environment Food & Rural Affairs). Emissions Factors Toolkit v7.0 User Guide; DEFRA (Department for Environment Food & Rural Affairs): London, UK, 2016.
- Namdeo, A.; Goodman, P.; Mitchell, G.; Hargreaves, A.; Echenique, M. Land-use, transport and vehicle technology futures: An air pollution assessment of policy combinations for the Cambridge Sub-Region of the UK. Cities 2019, 89, 296–307. [Google Scholar] [CrossRef]
- Tiwari, A.; Kumar, P. Integrated dispersion-deposition modelling for air pollutant reduction via green infrastructure at an urban scale. Sci. Total Environ. 2020, 723, 138078. [Google Scholar] [CrossRef] [PubMed]
- Wyatt, D.W.; Li, H.; Tate, J.E. The impact of road grade on carbon dioxide (CO2) emission of a passenger vehicle in real-world driving. Transp. Res. Part D Transp. Environ. 2014, 32, 160–170. [Google Scholar] [CrossRef]
- Univerza v Mariboru Izobraževalno-Raziskovalna Infrastruktura. Available online: https://www.um.si/prenos-znanja/tehnoloski-inovacijski-center-univerze-v-mariboru-innovum/izobrazevalno-raziskovalna-infrastruktura-odprti-dostop-do-javne-infrastrukture/ (accessed on 21 November 2023).
- Lep, M.; Klemenčič, M.; Mesarec, B.; Balant, M.; Mladenovič, L.; Plevnik, A.; Kukovec, M.; Rotar, J. Pathways to an Attractive City and a Satisfied Community—Integrated Transport Strategy of the City of Maribor; Municipality of Maribor: Maribor, Slovenia, 2015. [Google Scholar]
- Ministrstvo za Infrastrukturo Republike Slovenije. Strategija Razvoja Prometa v Republiki Sloveniji do Leta 2030; Ministrstvo za Infrastrukturo Republike Slovenije: Ljubljana, Slovenia, 2017.
- Vlada Republike Slovenije. Celoviti Nacionalni Energetski in Podnebni Načrt Republike Slovenije; Vlada Republike Slovenije: Ljubljana, Slovenia, 2020.
- Palma-Leal, X.; Rodríguez-Rodríguez, F.; Campos-Garzón, P.; Castillo-Paredes, A.; Chillón, P. New Self-Report Measures of Commuting Behaviors to University and Their Association with Sociodemographic Characteristics. Int. J. Environ. Res. Public Health 2021, 18. [Google Scholar] [CrossRef]
- Zhan, G.; Yan, X.; Zhu, S.; Wang, Y. Using hierarchical tree-based regression model to examine university student travel frequency and mode choice patterns in China. Transp. Policy 2016, 45, 55–65. [Google Scholar] [CrossRef]
- Chillón, P.; Molina-García, J.; Castillo, I.; Queralt, A. What distance do university students walk and bike daily to class in Spain. J. Transp. Health 2016, 3, 315–320. [Google Scholar] [CrossRef]
- Pogačar, K.; Dežan, L.; Lamot, M.; Renčelj, M. Determinants of bicycle use among student population: Exploratory research of social and infrastructure factors. Appl. Syst. Innov. 2020, 3, 6. [Google Scholar] [CrossRef]
- Goel, R.; Goodman, A.; Aldred, R.; Nakamura, R.; Tatah, L.; Garcia, L.M.T.; Zapata-Diomedi, B.; de Sa, T.H.; Tiwari, G.; de Nazelle, A.; et al. Cycling behaviour in 17 countries across 6 continents: Levels of cycling, who cycles, for what purpose, and how far? Transp. Rev. 2022, 42, 58–81. [Google Scholar] [CrossRef]
- Sagaris, L.; Tiznado-Aitken, I.; Steiniger, S. Exploring the social and spatial potential of an intermodal approach to transport planning. Int. J. Sustain. Transp. 2017, 11, 721–736. [Google Scholar] [CrossRef]
- Trček, B.; Mesarec, B. Pathways to Alternative Transport Mode Choices among University Students and Staff—Commuting to the University of Maribor since 2010. Sustainability 2022, 14, 11336. [Google Scholar] [CrossRef]
- Zhou, J. From better understandings to proactive actions: Housing location and commuting mode choices among university students. Transp. Policy 2014, 33, 166–175. [Google Scholar] [CrossRef]
- Rotaris, L.; Danielis, R. Commuting to college: The effectiveness and social efficiency of transportation demand management policies. Transp. Policy 2015, 44, 158–168. [Google Scholar] [CrossRef]
- Proulx, F.R.; Cavagnolo, B.; Torres-Montoya, M. Impact of parking prices and transit fares on mode choice at the University of California, Berkeley. Transp. Res. Rec. 2014, 2469, 41–48. [Google Scholar] [CrossRef]
- Hidalgo-González, C.; Rodríguez-Fernández, M.P.; Pérez-Neira, D. Energy consumption in university commuting: Barriers, policies and reduction scenarios in León (Spain). Transp. Policy 2022, 116, 48–57. [Google Scholar] [CrossRef]
- Whalen, K.E.; Páez, A.; Carrasco, J.A. Mode choice of university students commuting to school and the role of active travel. J. Transp. Geogr. 2013, 31, 132–142. [Google Scholar] [CrossRef]
- Rybarczyk, G.; Gallagher, L. Measuring the potential for bicycling and walking at a metropolitan commuter university. J. Transp. Geogr. 2014, 39, 1–10. [Google Scholar] [CrossRef]
- Orozco-Fontalvo, M.; Arévalo-Támara, A.; Guerrero-Barbosa, T.; Gutiérrez-Torres, M. Bicycle choice modeling: A study of university trips in a small Colombian city. J. Transp. Health 2018, 9, 264–274. [Google Scholar] [CrossRef]
- Geng, J.; Long, R.; Chen, H. Impact of information intervention on travel mode choice of urban residents with different goal frames: A controlled trial in Xuzhou, China. Transp. Res. Part A Policy Pract. 2016, 91, 134–147. [Google Scholar] [CrossRef]
- Geng, J.; Long, R.; Yang, L.; Zhu, J.; Engeda Birhane, G. Experimental Evaluation of Information Interventions to Encourage Non-Motorized Travel: A Case Study in Hefei, China. Sustainability 2020, 12, 6201. [Google Scholar] [CrossRef]
- Wang, T.; Shen, B.; Han Springer, C.; Hou, J. What prevents us from taking low-carbon actions? A comprehensive review of influencing factors affecting low-carbon behaviors. Energy Res. Soc. Sci. 2021, 71, 101844. [Google Scholar] [CrossRef]
- Bopp, M.; Sims, D.; Matthews, S.A.; Rovniak, L.S.; Poole, E.; Colgan, J. Development, Implementation, and Evaluation of Active Lions: A Campaign to Promote Active Travel to a University Campus. Am. J. Health Promot. 2018, 32, 536–545. [Google Scholar] [CrossRef] [PubMed]
- Bopp, M.; Sims, D.; Matthews, S.A.; Rovniak, L.S.; Poole, E.; Colgan, J. There׳s an app for that: Development of a smartphone app to promote active travel to a college campus. J. Transp. Health 2016, 3, 305–314. [Google Scholar] [CrossRef]
- Motoaki, Y.; Daziano, R.A. A hybrid-choice latent-class model for the analysis of the effects of weather on cycling demand. Transp. Res. Part A Policy Pract. 2015, 75, 217–230. [Google Scholar] [CrossRef]
- Göçer, Ö.; Göçer, K. The effects of transportation modes on campus use: A case study of a suburban campus. Case Stud. Transp. Policy 2019, 7, 37–47. [Google Scholar] [CrossRef]
- Akar, G.; Clifton, K.J. Influence of individual perceptions and bicycle infrastructure on decision to bike. Transp. Res. Rec. 2009, 2140, 165–172. [Google Scholar] [CrossRef]
- Wang, J.Y.T.; Mirza, L.; Cheung, A.K.L.; Moradi, S. Understanding factors influencing choices of cyclists and potential cyclists: A case study at the University of Auckland. Road Transp. Res. 2014, 23, 37–51. [Google Scholar] [CrossRef]
- Kaplan, D.H. Transportation sustainability on a university campus. Int. J. Sustain. High. Educ. 2015, 16, 173–186. [Google Scholar] [CrossRef]
- Mellino, S.; Petrillo, A.; Cigolotti, V.; Autorino, C.; Jannelli, E.; Ulgiati, S. A Life Cycle Assessment of lithium battery and hydrogen-FC powered electric bicycles: Searching for cleaner solutions to urban mobility. Int. J. Hydrog. Energy 2017, 42, 1830–1840. [Google Scholar] [CrossRef]
- Nematchoua, M.; Deuse, C.; Cools, M.; Reiter, S. Evaluation of the potential of classic and electric bicycle commuting as an impetus for the transition towards environmentally sustainable cities: A case study of the university campuses in Liege, Belgium. Renew. Sustain. Energy Rev. 2020, 119, 109544. [Google Scholar] [CrossRef]
- McLoughlin, I.V.; Narendra, I.K.; Koh, L.H.; Nguyen, Q.H.; Seshadri, B.; Zeng, W.; Yao, C. Campus Mobility for the Future: The Electric Bicycle. J. Transp. Technol. 2012, 2, 1–12. [Google Scholar] [CrossRef]
- Stilo, L.; Segura-Velandia, D.; Lugo, H.; Conway, P.P.; West, A.A. Electric bicycles, next generation low carbon transport systems: A survey. Transp. Res. Interdiscip. Perspect. 2021, 10, 100347. [Google Scholar] [CrossRef]
- Göransson, J.; Andersson, H. Factors that make public transport systems attractive: A review of travel preferences and travel mode choices. Eur. Transp. Res. Rev. 2023, 15, 32. [Google Scholar] [CrossRef]
- Redman, L.; Friman, M.; Gärling, T.; Hartig, T. Quality attributes of public transport that attract car users: A research review. Transp. Policy 2013, 25, 119–127. [Google Scholar] [CrossRef]
- Hojski, D.; Hazemali, D.; Lep, M. The Analysis of the Effects of a Fare Free Public Transport Travel Demand Based on E-Ticketing. Sustainability 2022, 14, 5878. [Google Scholar] [CrossRef]
- Silveira, T.C.d.R.; Romano, C.A.; Gadda, T.M.C. Public transport usage among university students: What to expect based on customer satisfaction survey (CSS) analysis. Transportes 2020, 28, 32–45. [Google Scholar] [CrossRef]
- Anwar, A.H.M.M.; Yang, J. Examining the Effects of Transport Policy on Modal Shift from Private Car to Public Bus. Procedia Eng. 2017, 180, 1413–1422. [Google Scholar] [CrossRef]
- Nguyen-Phuoc, D.Q.; Amoh-Gyimah, R.; Tran, A.T.P.; Phan, C.T. Mode choice among university students to school in Danang, Vietnam. Travel Behav. Soc. 2018, 13, 1–10. [Google Scholar] [CrossRef]
- Voss, A. Collective public-transport tickets and anticipated majority choice: A model of student tickets. Transp. Res. Part A Policy Pract. 2015, 80, 263–276. [Google Scholar] [CrossRef]
- Sultana, D.N.; Hesam, H.M.; Lei, L.; Hugh, M. Housing Location and Commuting Mode Choices of University Students and Employees: An Application of Bivariate Probit Models. Int. Conf. Transp. Dev. 2018, 2018, 168–179. [Google Scholar]
Figure 1.
Study site divided into 6 zones around the BCTF: 1a (0–1 km), 1b (1–2 km), 1c (2–5 km), 2 (5–20 km), 3 (20–50 km) and 4 (>50 km). Zones 2–4 are located outside the urban area of Maribor.
Figure 1.
Study site divided into 6 zones around the BCTF: 1a (0–1 km), 1b (1–2 km), 1c (2–5 km), 2 (5–20 km), 3 (20–50 km) and 4 (>50 km). Zones 2–4 are located outside the urban area of Maribor.


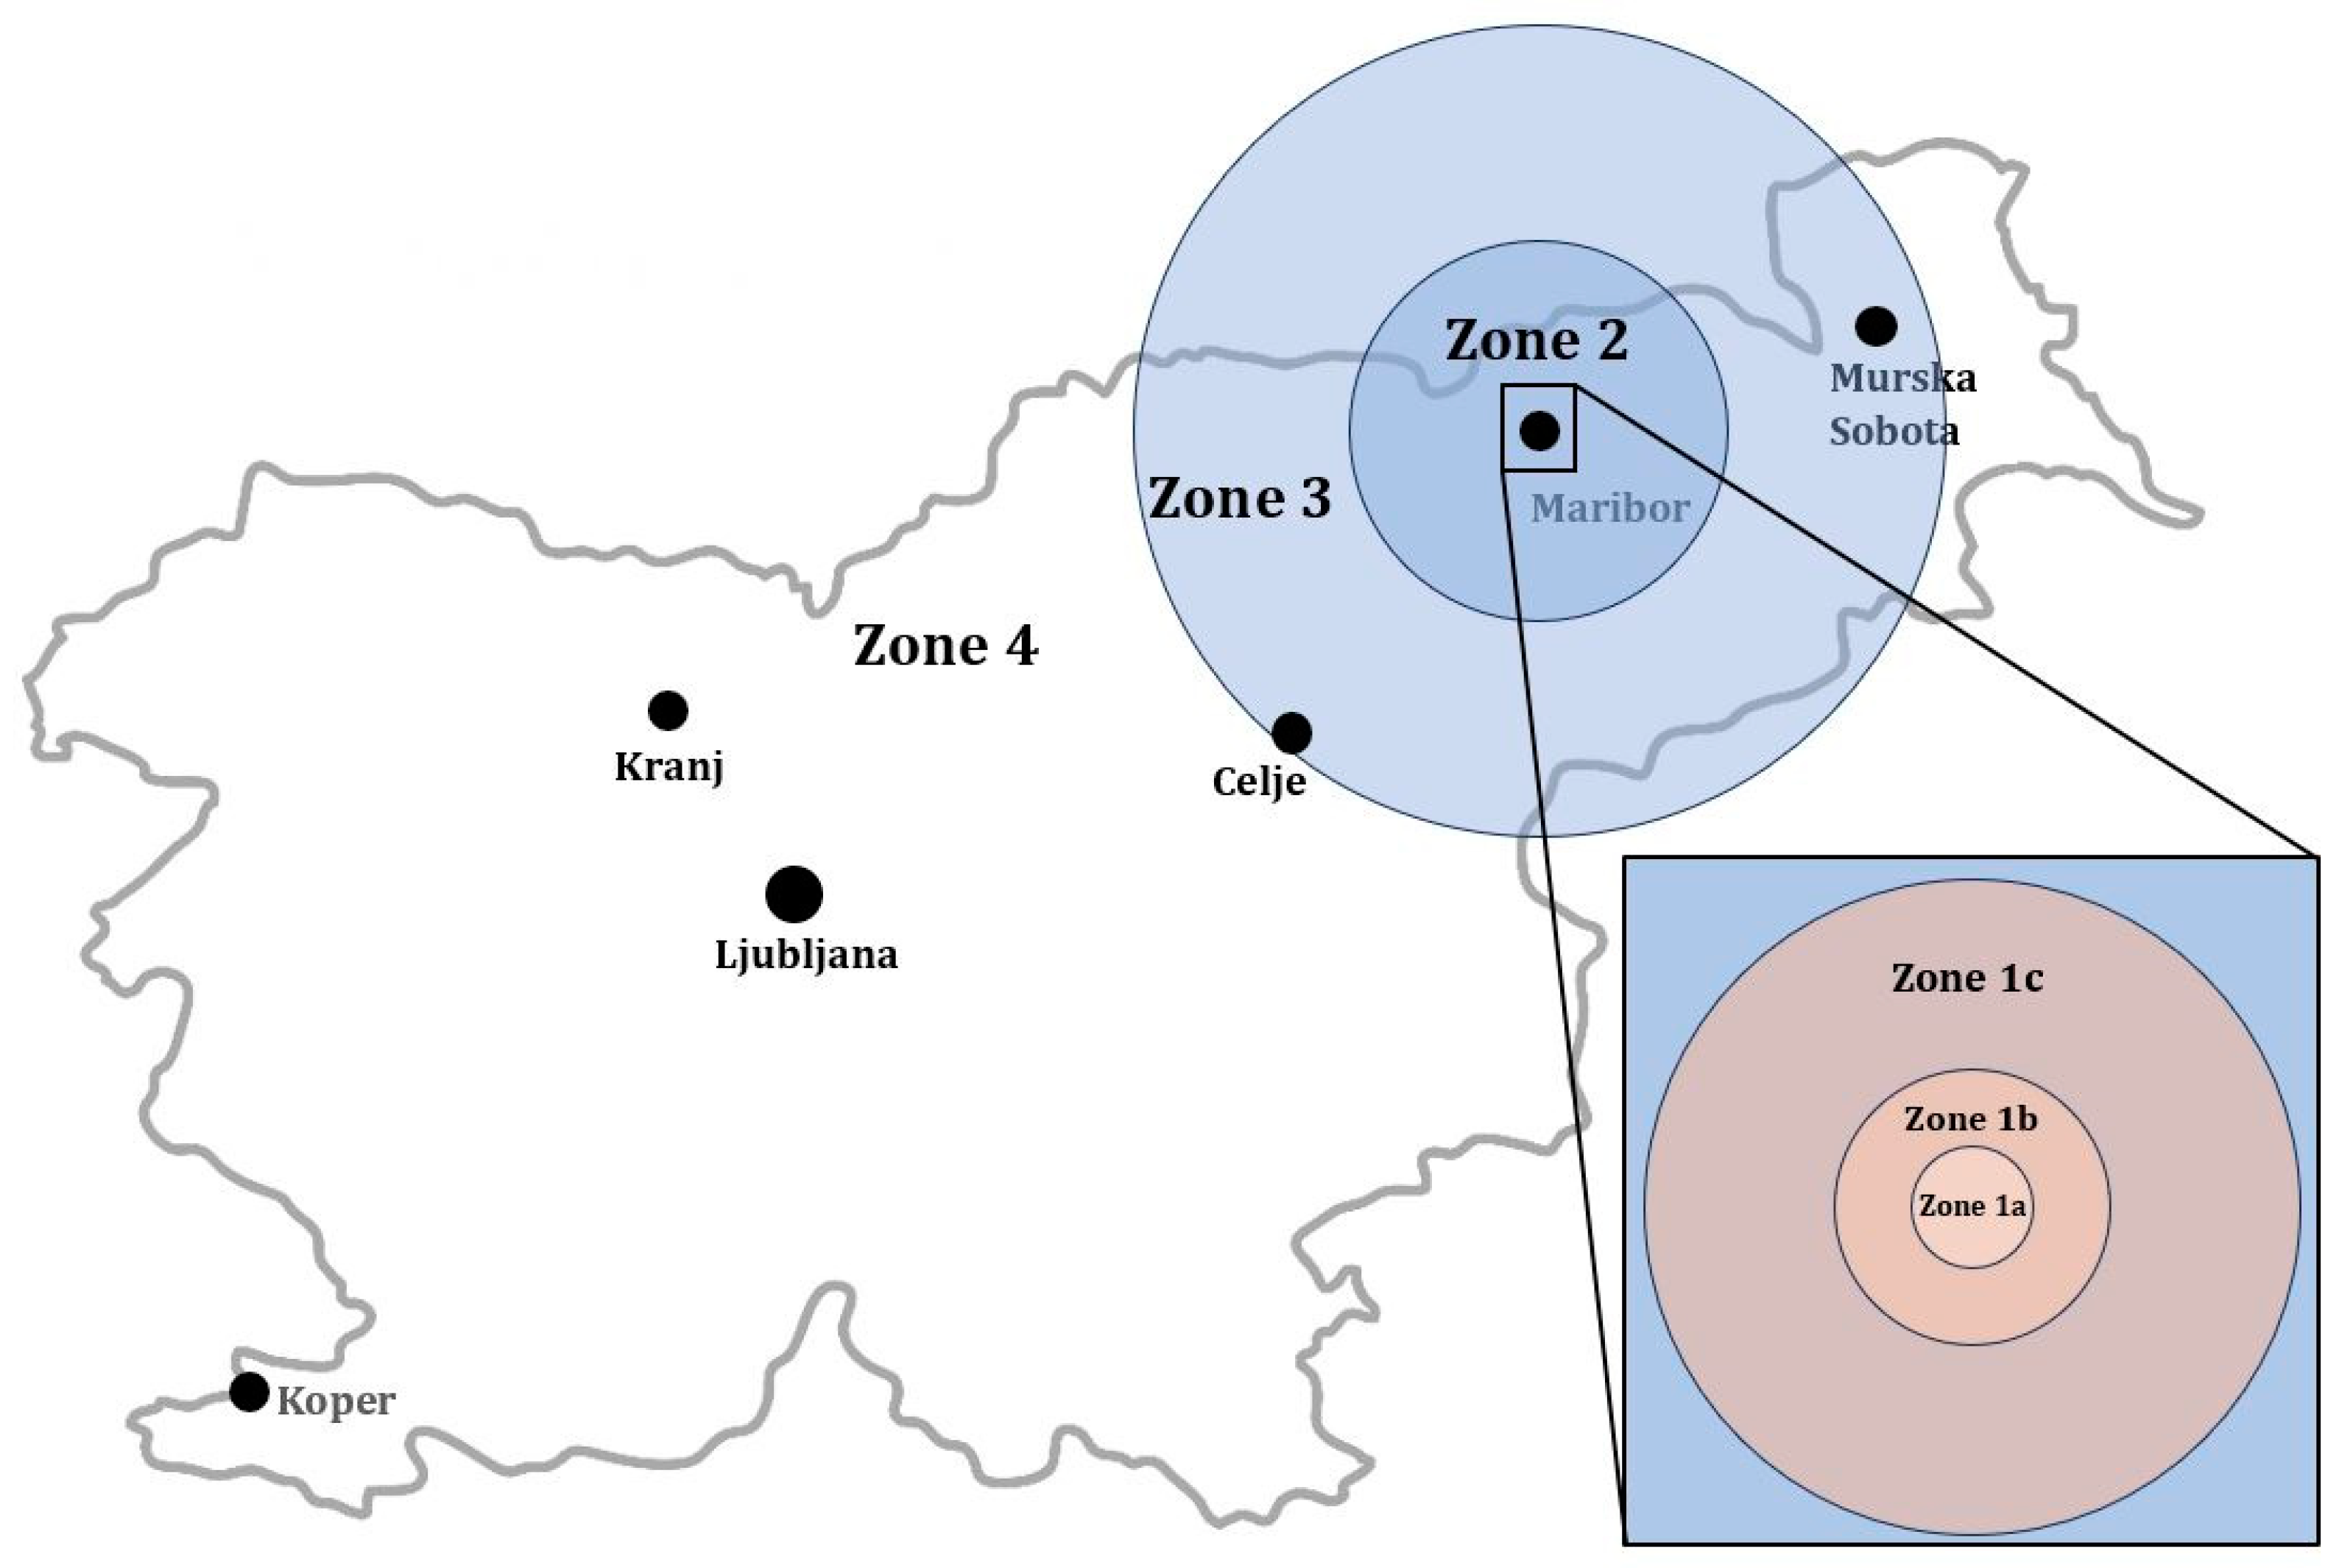
Table 1.
Characteristics of the user groups in the academic year 2020/2021 (sample size 531).
| Characteristic | Staff | Students | ||
|---|---|---|---|---|
| N | Sample (%) | N | Sample (%) | |
| All | 255 | 48.0 | 276 | 52.0 |
| Location of living: Permanent residence (daily commuting) | ||||
| Zone 1a (0–1 km from the BCTF) | 53 | 20.8 | 14 | 10.8 |
| Zone 1b (1–2 km from the BCTF) | 46 | 18.0 | 17 | 13.1 |
| Zone 1c (2–5 km from the BCTF) | 41 | 16.1 | 10 | 7.7 |
| Zone 2 (5–20 km from the BCTF) | 57 | 22.4 | 34 | 26.1 |
| Zone 3 (20–50 km from the BCTF) | 33 | 12.9 | 44 | 33.8 |
| Zone 4 (>50 km from the BCTF) | 25 | 9.8 | 11 | 8.5 |
| Location of living: Permanent residence (intermittently commuting) | ||||
| Zone 2 (5–20 km from the BCTF) | 0 | 0 | ||
| Zone 3 (20–50 km from the BCTF) | 21 | 14.4 | ||
| Zone 4 (>50 km from the BCTF) | 125 | 85.6 | ||
| Location of living: Term-time accommodation (daily commuting) | ||||
| Zone 1a (0–1 km from the BCTF) | 122 | 83.6 | ||
| Zone 1b (1–2 km from the BCTF) | 17 | 11.6 | ||
| Zone 1c (2–5 km from the BCTF) | 7 | 4.8 | ||
Table 2.
Modal split of user groups according to distance.
| Walk | Bicycle | Car | Shared Car | PPT | ||
|---|---|---|---|---|---|---|
| Students commuting daily from a permanent residence | 0–1 km | 68.9 | 18.9 | 8.9 | 1.7 | 1.7 |
| 1–2 km | 20.0 | 12.1 | 23.0 | 23.0 | 21.8 | |
| 2–5 km | 0.1 | 0.1 | 30.7 | 15.4 | 53.8 | |
| 5–20 km | 0.0 | 0.0 | 44.8 | 22.2 | 33.0 | |
| 20–50 km | 0.0 | 0.0 | 36.9 | 21.6 | 41.5 | |
| >50 km | 0.0 | 0.0 | 27.8 | 17.3 | 54.9 | |
| Students commuting daily from a term-time accommodation | 0–1 km | 79.1 | 11.4 | 1.6 | 0.9 | 6.9 |
| 1–2 km | 75.6 | 6.5 | 6.5 | 5.0 | 6.3 | |
| 2–5 km | 49.9 | 22.4 | 2.8 | 2.8 | 22.2 | |
| Students commuting intermittently from a permanent residence | 20–50 km | 0.0 | 0.0 | 29.3 | 2.3 | 68.4 |
| >50 km | 0.0 | 0.0 | 44.6 | 0.7 | 54.7 | |
| Staff | 0–1 km | 44.2 13.3. | 28.3 | 19.3 | 6.9 | 1.3 |
| 1–2 km | 18.0 | 24.5 | 43.9 | 5.3 | 8.3 | |
| 2–5 km | 1.5 | 8.7 | 54.3 | 21.1 | 14.4 | |
| 5–20 km | 0.0 | 0.0 | 74.0 | 23.4 | 2.6 | |
| 20–50 km | 0.0 | 0.0 | 67.8 | 26.7 | 5.5 | |
| >50 km | 0.0 | 0.0 | 68.7 | 18.6 | 12.8 |
Table 3.
Barriers for walking to the BCTF (in %) grouped by subzones of the study site; additional information can be found in Figure 1 and Table 1.
| Hygienic Reasons | Accident Risks | Inappropriate/ Too Long Distance | Unattractive Path | Preferring Other Transport Modes | ||
|---|---|---|---|---|---|---|
| Students commuting daily from permanent residence | 0–1 km | 0.0 | 0.0 | 40.0 | 20.0 | 40.0 |
| 1–2 km | 11.1 | 5.6 | 22.2 | 22.2 | 38.9 | |
| 2–5 km | 9.1 | 0.0 | 45.5 | 0.0 | 45.5 | |
| Students commuting daily from term-time accommodation | 0–1 km | 12.5 | 12.5 | 12.5 | 25.0 | 37.5 |
| 1–2 km | 33.3 | 0.0 | 33.3 | 0.0 | 33.3 | |
| 2–5 km | 20.0 | 0.0 | 40.0 | 0.0 | 40.0 | |
| Staff | 0–1 km | 21.7 | 0.0 | 34.8 | 13.0 | 30.4 |
| 1–2 km | 14.0 | 2.3 | 27.9 | 18.6 | 37.2 | |
| 2–5 km | 20.8 | 0.0 | 56.3 | 12.5 | 10.4 |
Table 4.
Barriers for bicycling to the BCTF (in %) grouped by subzones of the study site; additional information can be found in Figure 1 and Table 1.
| Risk of Bicycle Theft | Poor Infrastructure | Accident Risks | Hygienic Reasons | Inappropriate or Too Long Distances | Lack of Bicycle Ownership | Preferring Other Transport Modes | ||
|---|---|---|---|---|---|---|---|---|
| Students commuting daily from permanent residence | 0–1 km | 7.1 | 21.4 | 7.1 | 7.1 | 0.0 | 21.4 | 35.7 |
| 1–2 km | 21.7 | 17.4 | 13.0 | 4.3 | 0.0 | 8.7 | 34.8 | |
| 2–5 km | 18.8 | 25.0 | 12.5 | 12.5 | 12.5 | 6.3 | 12.5 | |
| 5–20 km | 9.3 | 22.2 | 1.9 | 7.4 | 40.7 | 3.7 | 14.8 | |
| Students commuting daily from term-time accommodation | 0–1 km | 18.9 | 8.8 | 9.4 | 1.3 | 8.2 | 34.6 | 18.9 |
| 1–2 km | 31.8 | 13.6 | 9.1 | 9.1 | 0.0 | 31.8 | 4.5 | |
| 2–5 km | 22.2 | 11.1 | 11.1 | 11.1 | 0.0 | 22.2 | 22.2 | |
| Staff | 0–1 km | 12.5 | 12.5 | 10.0 | 15.0 | 12.5 | 7.5 | 30.0 |
| 1–2 km | 12.2 | 26.5 | 14.3 | 18.4 | 6.1 | 6.1 | 16.3 | |
| 2–5 km | 15.2 | 27.3 | 15.2 | 21.2 | 7.6 | 6.1 | 7.6 | |
| 5–20 km | 3.1 | 22.7 | 15.5 | 15.5 | 39.2 | 3.1 | 1.0 |
Table 5.
Barriers for PPT use for commuting to the BCTF (in %) grouped by subzones of the study site; additional information can be found in Figure 1 and Table 1.
| Too-Distant Bus Stations | Lack of PPT Connections | Low Frequency of Trips | Too Short Distances | Preferring Other Transport Modes | ||
|---|---|---|---|---|---|---|
| Students commuting daily from permanent residence | 0–1 km | 5.9 | 5.9 | 11.8 | 52.9 | 23.5 |
| 1–2 km | 16.7 | 5.6 | 27.8 | 27.8 | 22.2 | |
| 2–5 km | 20.0 | 20.0 | 40.0 | 0.0 | 20.0 | |
| 5–20 km | 10.0 | 33.3 | 30.0 | 0.0 | 26.7 | |
| 20–50 km | 22.6 | 25.8 | 35.5 | 6.5 | 9.7 | |
| >50 km | 37.5 | 37.5 | 12.5 | 0.0 | 12.5 | |
| Students commuting daily from term-time accommodation | 0–1 km | 10.3 | 9.6 | 8.2 | 55.5 | 16.4 |
| 1–2 km | 5.3 | 10.5 | 15.8 | 47.4 | 21.1 | |
| 2–5 km | 0.0 | 0.0 | 0.0 | 66.7 | 33.3 | |
| Staff | 0–1 km | 10.2 | 11.9 | 15.3 | 49.2 | 13.6 |
| 1–2 km | 11.5 | 18.0 | 18.0 | 26.2 | 26.2 | |
| 2–5 km | 19.6 | 23.9 | 32.6 | 4.3 | 19.6 | |
| 5–20 km | 29.1 | 30.0 | 30.9 | 0.9 | 9.1 | |
| 20–50 km | 21.2 | 36.5 | 25.0 | 1.9 | 15.4 | |
| >50 km | 22.9 | 45.7 | 22.9 | 2.9 | 5.7 |
Table 6.
Extrapolated CO2 emissions (tons/year) of motorized commuting to the BCTF under the baseline scenario, the ambitious scenario and the new challenge scenario.
Table 6.
Extrapolated CO2 emissions (tons/year) of motorized commuting to the BCTF under the baseline scenario, the ambitious scenario and the new challenge scenario.
| The baseline scenario | Car | PPT | Sum | |
| Students commuting daily from a permanent residence | 0–1 km | 0.81 | 0.04 | 0.85 |
| 1–2 km | 11.32 | 1.75 | 13.07 | |
| 2–5 km | 14.04 | 5.24 | 19.28 | |
| 5–20 km | 142.61 | 21.14 | 163.75 | |
| 20–50 km | 423.63 | 91.18 | 514.82 | |
| >50 km | 221.52 | 83.67 | 305.19 | |
| Sum | 813.92 | 203.02 | 1016.95 | |
| Students commuting daily from a term-time accommodation | 0–1 km | 1.67 | 1.74 | 3.21 |
| 1–2 km | 2.82 | 0.51 | 3.33 | |
| 2–5 km | 1.19 | 1.51 | 2.70 | |
| Sum | 5.68 | 3.76 | 9.23 | |
| Students commuting intermittently from a permanent residence | 5–20 km | 16.16 | 10.59 | 26.75 |
| 20–50 km | 424.89 | 159.20 | 584.09 | |
| Sum | 441.05 | 169.79 | 610.84 | |
| Staff | 0–1 km | 2.03 13.3. | 0.03 | 2.06 |
| 1–2 km | 8.69 | 0.48 | 9.17 | |
| 2–5 km | 25.21 | 1.54 | 26.75 | |
| 5–20 km | 92.81 | 0.75 | 93.55 | |
| 20–50 km | 136.84 | 2.42 | 139.25 | |
| >50 km | 257.89 | 11.75 | 269.64 | |
| Sum | 523.47 | 16.96 | 540.43 | |
| Total 2177.45 | ||||
| The ambitious scenario | Car | PPT | Sum | |
| Students commuting daily from a permanent residence | 0–1 km | 0.00 | 0.04 | 0.04 |
| 1–2 km | 7.91 | 2.12 | 10.03 | |
| 2–5 km | 9.83 | 5.91 | 15.74 | |
| 5–20 km | 99.82 | 34.02 | 133.84 | |
| 20–50 km | 296.54 | 129.63 | 426.17 | |
| >50 km | 155.06 | 104.25 | 259.31 | |
| Sum | 569.17 | 275.98 | 845.14 | |
| Students commuting daily from a term-time accommodation | 0–1 km | 0.00 | 1.74 | 1.74 |
| 1–2 km | 1.98 | 0.60 | 2.58 | |
| 2–5 km | 0.83 | 1.57 | 2.40 | |
| Sum | 2.81 | 3.91 | 6.72 | |
| Students commuting intermittently from a permanent residence | 5–20 km | 11.31 | 12.06 | 23.37 |
| 20–50 km | 297.42 | 198.78 | 496.20 | |
| Sum | 308.73 | 210.84 | 519.57 | |
| Staff | 0–1 km | 0.00 | 0.03 | 0.03 |
| 1–2 km | 6.08 | 0.77 | 6.85 | |
| 2–5 km | 17.65 | 2.75 | 20.40 | |
| 5–20 km | 64.97 | 9.12 | 74.09 | |
| 20–50 km | 95.79 | 14.85 | 110.64 | |
| >50 km | 180.73 | 35.70 | 216.43 | |
| Sum | 365.22 | 63.22 | 428.43 | |
| Total 1799.87 | ||||
| The new challenge scenario | Car | PPT | Sum | |
| Students commuting daily from a permanent residence | 0–1 km | 0.00 | 0.04 | 0.04 |
| 1–2 km | 5.65 | 2.36 | 8.01 | |
| 2–5 km | 7.00 | 6.36 | 13.36 | |
| 5–20 km | 71.30 | 42.60 | 113.91 | |
| 20–50 km | 212.18 | 155.34 | 367.52 | |
| >50 km | 111.00 | 117.96 | 228.97 | |
| Sum | 407.14 | 324.672 | 731.81 | |
| Students commuting daily from a term-time accommodation | 0–1 km | 0.00 | 1.74 | 1.74 |
| 1–2 km | 1.42 | 0.66 | 2.08 | |
| 2–5 km | 0.60 | 1.60 | 2.19 | |
| Sum | 2.02 | 3.99 | 6.01 | |
| Students commuting intermittently from a permanent residence | 5–20 km | 8.08 | 13.04 | 21.12 |
| 20–50 km | 212.42 | 225.26 | 437.69 | |
| Sum | 220.50 | 238.30 | 458.81 | |
| Staff | 0–1 km | 0.00 | 0.03 | 0.03 |
| 1–2 km | 4.35 | 0.95 | 5.30 | |
| 2–5 km | 12.47 | 3.56 | 16.03 | |
| 5–20 km | 46.40 | 14.71 | 61.12 | |
| 20–50 km | 68.35 | 23.20 | 91.54 | |
| >50 km | 128.94 | 51.76 | 180.70 | |
| Sum | 260.51 | 94.21 | 354.73 | |
| Total 1551.36 | ||||
Disclaimer/Publisher’s Note: The statements, opinions and data contained in all publications are solely those of the individual author(s) and contributor(s) and not of MDPI and/or the editor(s). MDPI and/or the editor(s) disclaim responsibility for any injury to people or property resulting from any ideas, methods, instructions or products referred to in the content. |
© 2024 by the authors. Licensee MDPI, Basel, Switzerland. This article is an open access article distributed under the terms and conditions of the Creative Commons Attribution (CC BY) license (https://creativecommons.org/licenses/by/4.0/).
Share and Cite
MDPI and ACS Style
Mesarec, B.; Trček, B. Suggestions and Solutions for Enhancing Active Commuting to the University of Maribor and Advancing CO2 Emission Reduction. Sustainability 2024, 16, 520. https://0-doi-org.brum.beds.ac.uk/10.3390/su16020520
AMA Style
Mesarec B, Trček B. Suggestions and Solutions for Enhancing Active Commuting to the University of Maribor and Advancing CO2 Emission Reduction. Sustainability. 2024; 16(2):520. https://0-doi-org.brum.beds.ac.uk/10.3390/su16020520
Chicago/Turabian StyleMesarec, Beno, and Branka Trček. 2024. "Suggestions and Solutions for Enhancing Active Commuting to the University of Maribor and Advancing CO2 Emission Reduction" Sustainability 16, no. 2: 520. https://0-doi-org.brum.beds.ac.uk/10.3390/su16020520
Note that from the first issue of 2016, this journal uses article numbers instead of page numbers. See further details here.