Article

Effects of Differences in Structure from Motion Software on Image Processing of Unmanned Aerial Vehicle Photography and Estimation of Crown Area and Tree Height in Forests

by
Shohei Kameyama
1,* and
Katsuaki Sugiura
2
1
Graduate School of Bioresource Sciences, Nihon University, 1866 Kameino, Fujisawa, Kanagawa 252-0880, Japan
2
College of Bioresource Sciences, Nihon University, 1866 Kameino, Fujisawa, Kanagawa 252-0880, Japan
*
Author to whom correspondence should be addressed.
Submission received: 29 December 2020 / Revised: 3 February 2021 / Accepted: 5 February 2021 / Published: 9 February 2021
(This article belongs to the Special Issue Individual Tree Detection and Characterisation from UAV Data)

Abstract

:
This study examines the effects of differences in structure from motion (SfM) software on image processing of aerial images by unmanned aerial vehicles (UAV) and the resulting estimations of tree height and tree crown area. There were 20 flight conditions for the UAV aerial images, which were a combination of five conditions for flight altitude, two conditions for overlap, and two conditions for side overlap. Images were then processed using three SfM programs (Terra Mapper, PhotoScan, and Pix4Dmapper). The tree height and tree crown area were determined, and the SfM programs were compared based on the estimations. The number of densified point clouds for PhotoScan (160 × 105 to 50 × 105) was large compared to the two other two SfM programs. The estimated values of crown area and tree height by each SfM were compared via Bonferroni multiple comparisons (statistical significance level set at p < 0.05). The estimated values of canopy area showed statistically significant differences (p < 0.05) in 14 flight conditions for Terra Mapper and PhotoScan, 16 flight conditions for Terra Mapper and Pix4Dmapper, and 11 flight conditions for PhotoScan and Pix4Dmappers. In addition, the estimated values of tree height showed statistically significant differences (p < 0.05) in 15 flight conditions for Terra Mapper and PhotoScan, 19 flight conditions for Terra Mapper and Pix4Dmapper, and 20 flight conditions for PhotoScan and Pix4Dmapper. The statistically significant difference (p < 0.05) between the estimated value and measured value of each SfM was confirmed under 18 conditions for Terra Mapper, 20 conditions for PhotoScan, and 13 conditions for Pix4D. Moreover, the RMSE and rRMSE values of the estimated tree height were 5–6 m and 20–28%, respectively. Although the estimation accuracy of any SfM was low, the estimated tree height by Pix4D in many flight conditions had smaller RMSE values than the other software. As statistically significant differences were found between the SfMs in many flight conditions, we conclude that there were differences in the estimates of crown area and tree height depending on the SfM used. In addition, Pix4Dmapper is suitable for estimating forest information, such as tree height, and PhotoScan is suitable for detailed monitoring of disaster areas.

Graphical Abstract

1. Introduction

In recent years, unmanned aerial vehicles (also known as UAVs and drones) and related technologies have been developed rapidly and are expected to play an active role in many fields. UAV aircraft can have rotary wings [1,2] or fixed wings [3,4]. Moreover, depending on the UAV model, they can have not only one RGB camera but also laser scanners [1,5] and multispectral cameras [6,7,8]. Thus, the user can select from various models based on their objectives. The advantages of UAV are (1) high-resolution and high-density data, (2) flexible operation performance, (3) high frequency observation, (4) low cost, and (5) safety [9,10,11,12,13,14,15].
Torresan et al. [11] summarized the use cases for UAVs in forests as follows: (1) estimation of dendrometric information, (2) classification of tree species, (3) determination of forest spaces, (4) post-fire observation and measurements, (5) forest protection and health cartography, and (6) post-harvest stand damage. In particular, there are active discussions on UAV applications in (1) the estimation of dendrometric information [2,16,17,18,19,20] and (2) classification of tree species [21,22]. Most use cases for UAVs in forestry, as classified by Torresan et al. [11], use structure from motion (SfM) technology. As a technology to recover the 3D shape of an object from multiple images, SfM is a concept that has been cultivated in computer vision and robot vision. In other words, SfM technology is the same concept as classical photogrammetry. SfM can be automatically processed using SfM software, but it requires skills associated with capturing UAV aerial images and SfM processing. Based on 3D data, forest information, such as tree height and volume, can be acquired.
To utilize the UAV and SfM technologies, setting various parameters related to image capture is important. Previous studies have pointed out that setting these parameters (e.g., UAV, camera, flight conditions, environmental conditions, analysis tools, and ground point controls (GCP)) has a significant impact on the final accuracy of the terrain model [9,23,24]. Moreover, there are infinite parameter combinations for data collection settings when used for forest monitoring, rendering the existence of an optimal method ambiguous [25]. A uniform approach has not been proposed that can serve as a framework for future research and ensure meaningful output compatibility; most previous studies vary in terms of the equipment used, size of the surveyed area, flying altitude, number and overlap of images, capturing strategy, spatial and temporal resolution, and processing specifics. Moreover, in some publications, such details were not fully specified [23,26]. In addition, for example, in Japan, flights at altitudes above 150 m are generally not permitted [27]. Hence, UAV flights may be limited by local laws and regulations.
Some previous studies have actively discussed accuracy verifications of forest information using UAV aerial images taken under different flight conditions [25,28,29,30]. Furthermore, not only the flight parameters but also the SfM processing are often implemented using different software packages (e.g., Pix4Dmapper [17,24,31], PhotoScan [2,16,18,19], Bentley ContextCapture [32], and MicMac [33,34]). SfM software can be divided into commercial and open packages [12,25,35,36], where commercial packages offer a standardized workflow and “black box” type operation (with correspondingly negligible insight for researchers on its internal workings) while open packages contain complex workflows that allow for internal inspection [23]. Previous studies have pointed out that the details of SfM software are akin to black boxes [26,37,38]. In Ueno [39], as the analysis process of the SfM software is a black box, an understanding of the characteristics of the software based on repeated usage is necessary. The black-box nature of SfM software packages, including PhotoScan Pro, highlights the challenge of isolating exact sources of error [40]. From a user’s perspective, evaluating the optimal software settings is difficult because there is a lack of comparative studies that evaluate the products against a consistent baseline [41].
Previous studies have used multiple SfM software programs. Chikatsu et al. [37] evaluated the performance of each software. Smart3DCapture is recommended when there is a large vertical movement at the shooting altitude and the overlap is small while Pix4Dmapper is recommended when there is little vertical movement at the shooting altitude and a large overlap rate can be set [37]. Sugai et al. [38] verified the accuracy of photogrammetry using Pix4Dmapper, PhotoScan, and Smart3Dcapture, stating that the effects of the number of control points and the distribution of points on the analysis results differed depending on the software. Kitagawa [42] extracted features from two experiments, and compared their differences. PhotoScan produced a clearer image, but had weak displacement extraction, while Pix4Dmapper had a z-value fluctuation, but strong displacement extraction [42]. Sona et al. [43] processed images with Erdas-LPS, EyeDEA, PhotoScan, Pix4UAV, and PhotoModeler Scanner to evaluate their characteristics, capabilities, and weaknesses. The results obtained in terms of a Digital Surface Model (DSM) and orthomosaic with PhotoScan were the most reliable [43]. Villanueva et al. [44] found that the DSM obtained with Pix4Dmapper was slightly more accurate than that obtained with PhotoScan. Jaud et al. [45] compared the DSM computed from the same sets of images using PhotoScan and MicMac. Both software packages provided satisfactory results: PhotoScan was more straightforward to use, but its source code is not open; MicMac was recommended for experimental users owing to its flexibility [45]. Benassi et al. [46] conducted an empirical study on the accuracy and repeatability of a UAV block orientation by GNSS-AT using three software packages. They showed that the treatment of the observation weights between the three packages is different [46]. Turner et al. [31] compared PhotoScan, Pix4D web service, and an in-house Bundler method and evaluated each software. PhotoScan exhibited the best performance, as it was the fastest and easiest to use and had the best spatial accuracy [31]. In Casella et al. [47], five software packages were compared: PhotoScan, UAS Master, Pix4Dmapper, ContextCapture, and MicMac. The results obtained with PhotoScan, Pix4Dmapper, UAS Master, and MicMac were always good and comparable to each other [47]. Fraser et al. [48] compared the PhotoScan and Pix4Dmapper software packages across 235.2 ha of forested land. They found that PhotoScan generated more exhaustive UAS-SfM outputs.
To summarize the current literature, the details of the software used are akin to black boxes; in many cases, the processing tendency differs depending on the software [26,37,38]. In addition, if we check the manuals of some software packages, the recommended setting values for the flight parameters tend to be different. The process for SfM differs in many respects, such as the parameter items and input methods, depending on the software. In addition, when observing a forest, the number of images should be greater and different flight parameters should be set compared to when observing other landscapes. Therefore, we can infer that the specific software used has a significant impact on the SfM. Furthermore, to verify the influence of software in estimating forest information using UAV and SfM technology, we must provide abundant information for users on the introduction of UAVs in future forest areas. However, although there are many studies on flight parameters in forests, to the best of our knowledge, there are few findings regarding the differences due to software packages, despite the importance of the topic.
Therefore, the objective of this study is to examine the effects that the differences in SfM software have on the processing of aerial images, as well as the estimation results of crown area and tree height at a small survey site. Aerial images were taken under various flight conditions (flight altitude and degree of overlap in photography). These aerial images were processed using three SfM software packages; the tree height and tree crown area were estimated, and the SfM software packages were compared based on the estimation results. In addition, the SfM software used in this study (especially Pix4Dmapper and PhotoScan) has been used in many previous studies; thus, the results from this study are versatile. Therefore, showing the differences in the estimated values based on different software packages is important as it expands knowledge on the use of UAV and SfM technologies.
In this study, image processing was performed using the same aerial images used in a previous study by Kameyama et al. [49]. Kameyama et al. [49] investigated the effect of different flight conditions on the estimation accuracy. In this paper, we verify the effect of different SfM software using aerial images taken under various flight conditions. However, as this paper uses the same image dataset as that used in Kameyama et al. [49], similar descriptions regarding the materials and methods can be found (e.g., survey site, UAV, and flight conditions).

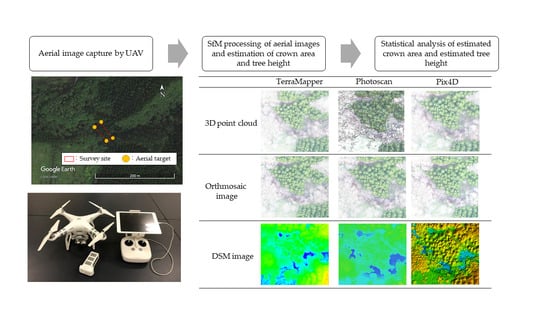
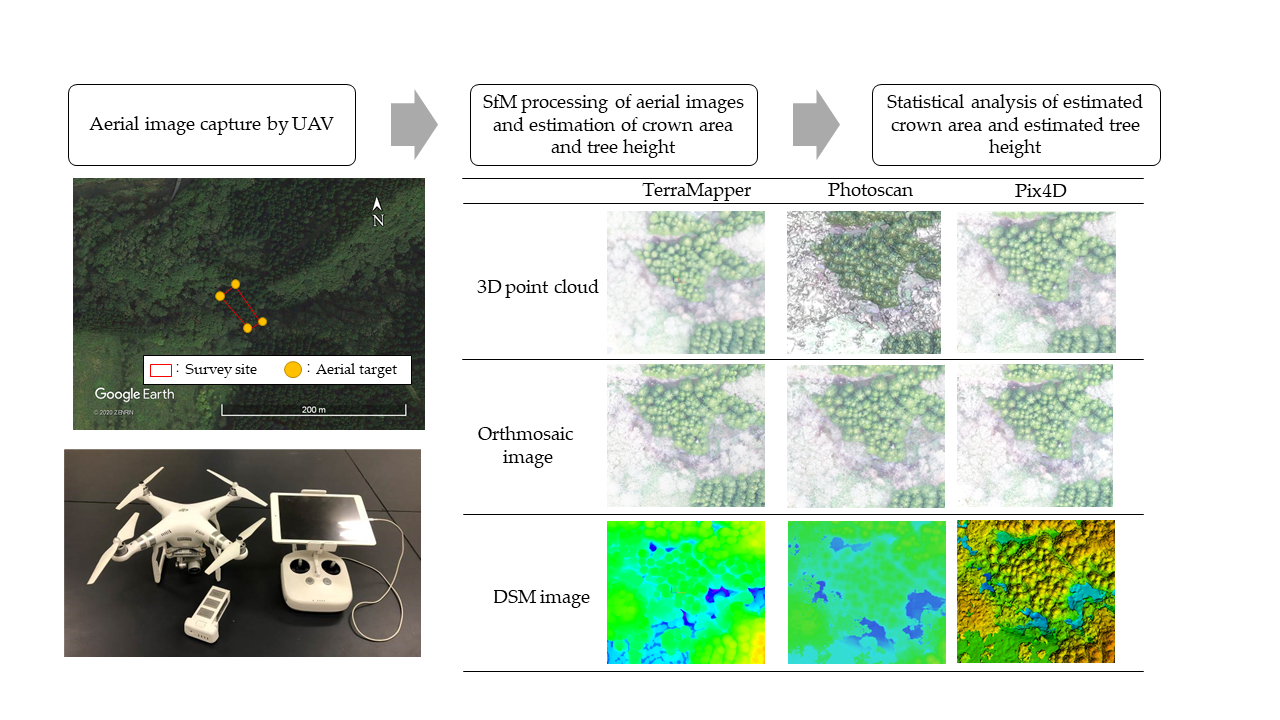
2. Materials and Methods
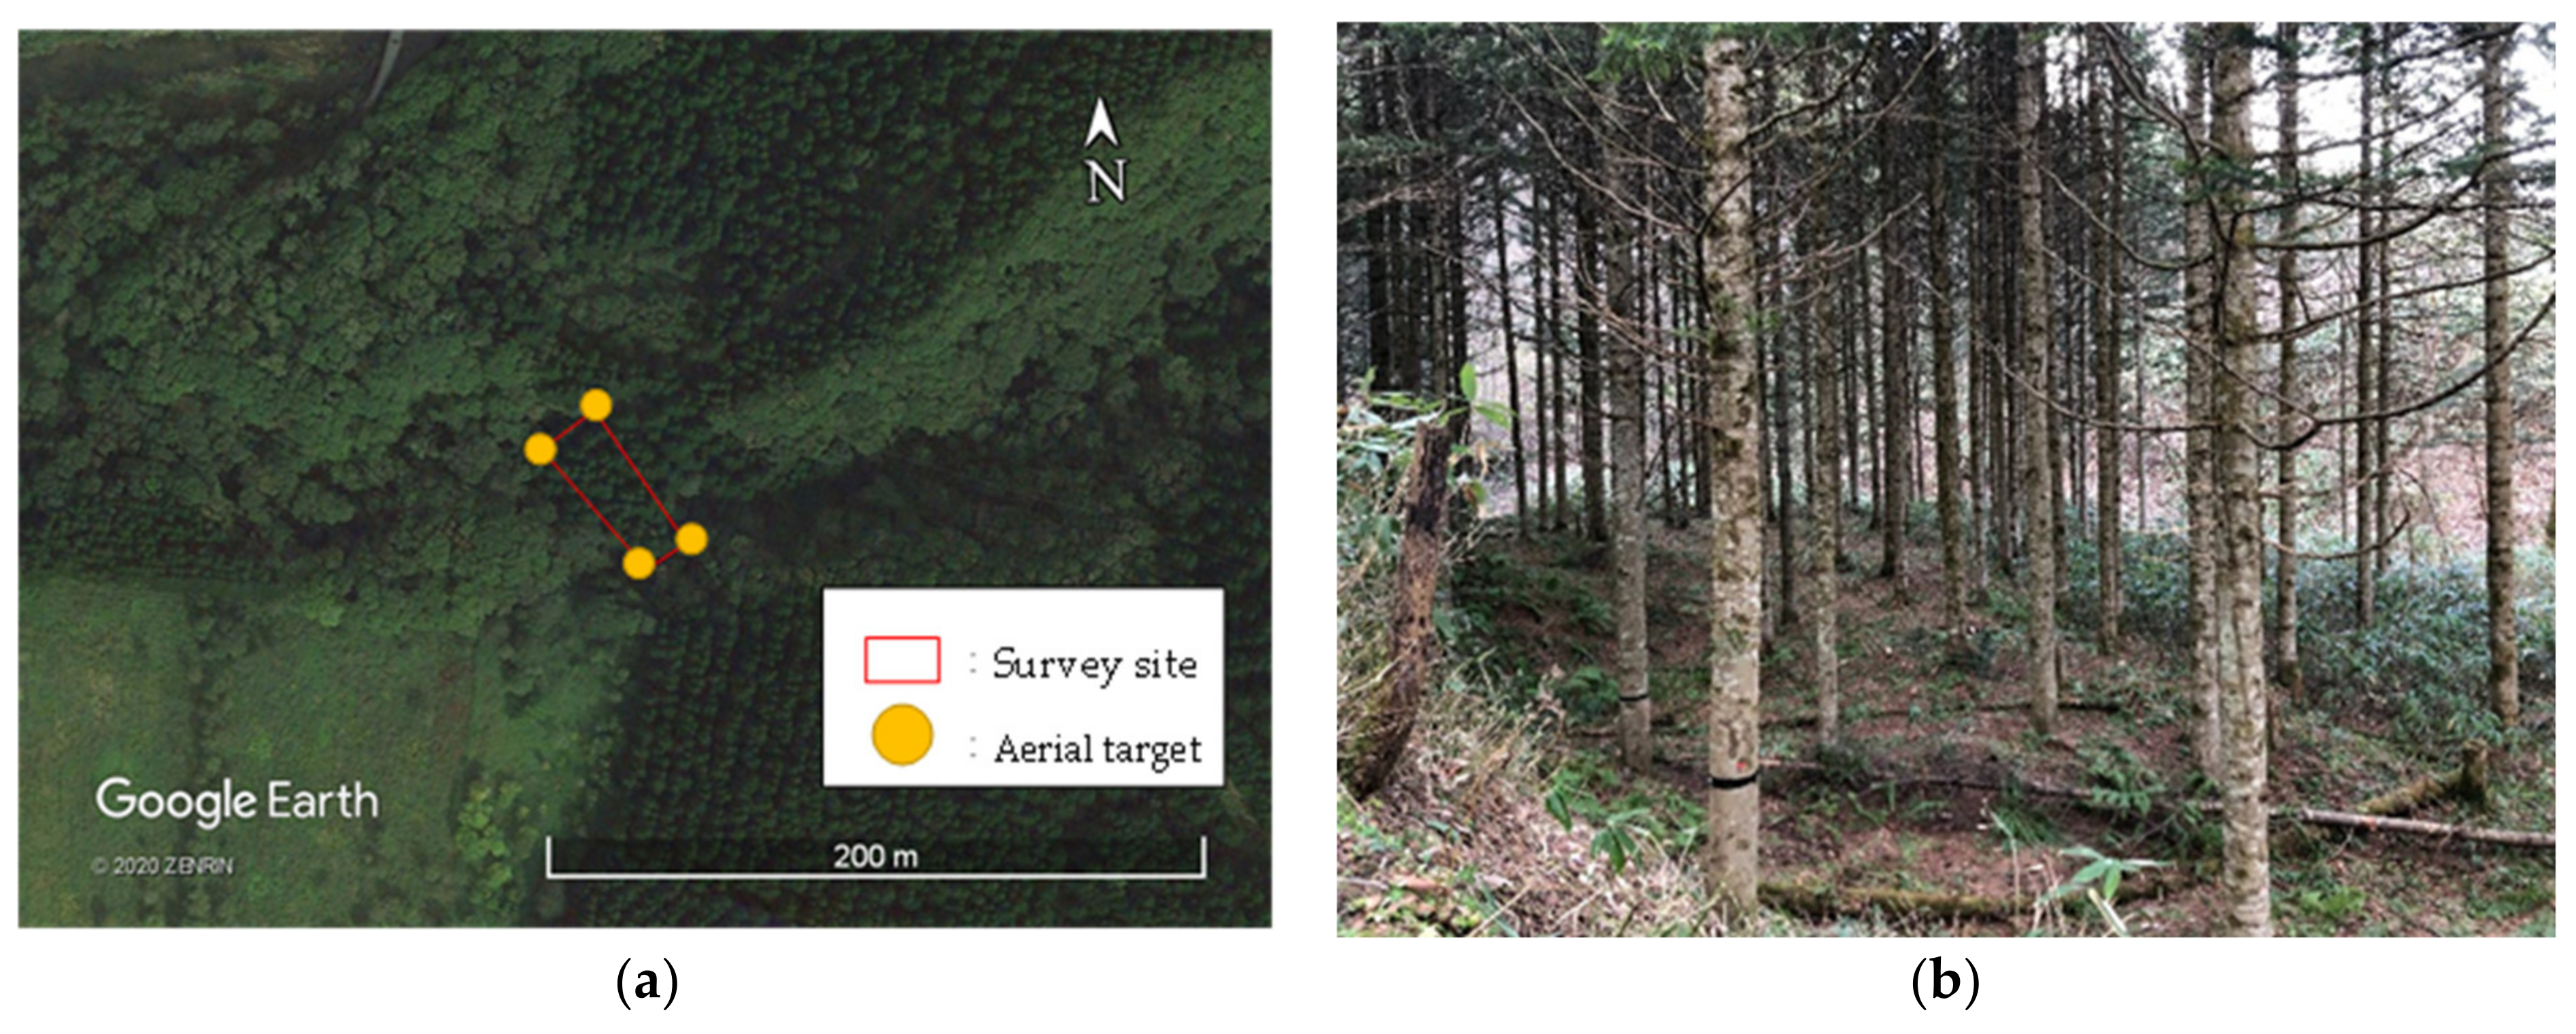
This study was conducted in the following sequence: (1) aerial image capture by UAV, (2) SfM processing of aerial images and estimation of crown area and tree height, and (3) statistical analysis of estimated crown area and estimated tree height.
(1) The aerial images captured by UAV were the same aerial images used in Kameyama et al. [49]. Therefore, in this study, the method is briefly described. In addition, Kameyama et al. [49] used Terra Mapper for aerial image processing and estimation. In this study, (2) SfM processing of the aerial images and the estimation of the crown area and tree height were performed using PhotoScan and Pix4Dmapper, in addition to Terra Mapper, and a software comparison was performed. The image processing method with Terra Mapper differed slightly from that adopted in Kameyama et al. [49]. For (3), a one-way analysis of variance (ANOVA) and multiple comparisons were used as statistical methods to verify the estimated value due to differences in the SfM software packages. Details of the conditions and analytical methods used are provided below.

2.1. Survey Site

The selection criteria for survey site were (1) a large open space in the sky for safe flight, (2) survey site and target tree that can be easily read from the SfM processed image, and (3) flat land with little change in flight altitude and degree of overlap in the photography (overlap and side overlap). Therefore, the study was set up in a 0.16-ha test site (located at approximately 42.3014°N, 140.1587°E) within 144 compartments and 23 sub-compartments of the Yakumo Practice Forests of Nihon University, located in Yakumo-cho, Futami-gun, Hokkaido (Figure 1). Finding a large open space around the survey site was difficult. Therefore, the study was performed based only on the position information attached to the captured image without setting the GCP. However, at the four corners of the survey site, we installed aerial targets to render the confirmation of the survey area easier in the aerial images captured by the UAV (Figure 1).
The terrain of the survey site was generally flat, and the stand was a 46-year-old Sakhalin fir plantation. Aerial imaging of the site was performed during November and December 2018. We ensured that aerial imaging was carried out during sunny weather, with wind speeds of 0 to 3 m/s, between 9:00 and 11:00 a.m. We also conducted a tree survey at the survey site during the same period. The tree survey parameters included tree height and the position of the trees within the survey site. Tree height measurements were taken to verify the accuracy of the UAV estimates. Tree positions were logged to match trees in the SfM-processed image with the measured trees. Tree height was measured using Vertex III (Haglof). Tree height was measured three times for each tree, and the mean was used as the value of the tree height. The position of the trees within the survey site was collected by compass surveying. The tree survey showed that there were 72 target trees with a mean height of 25.2 m (Min: 16.9 m, Max: 38.9 m, SD: 4.73 m).

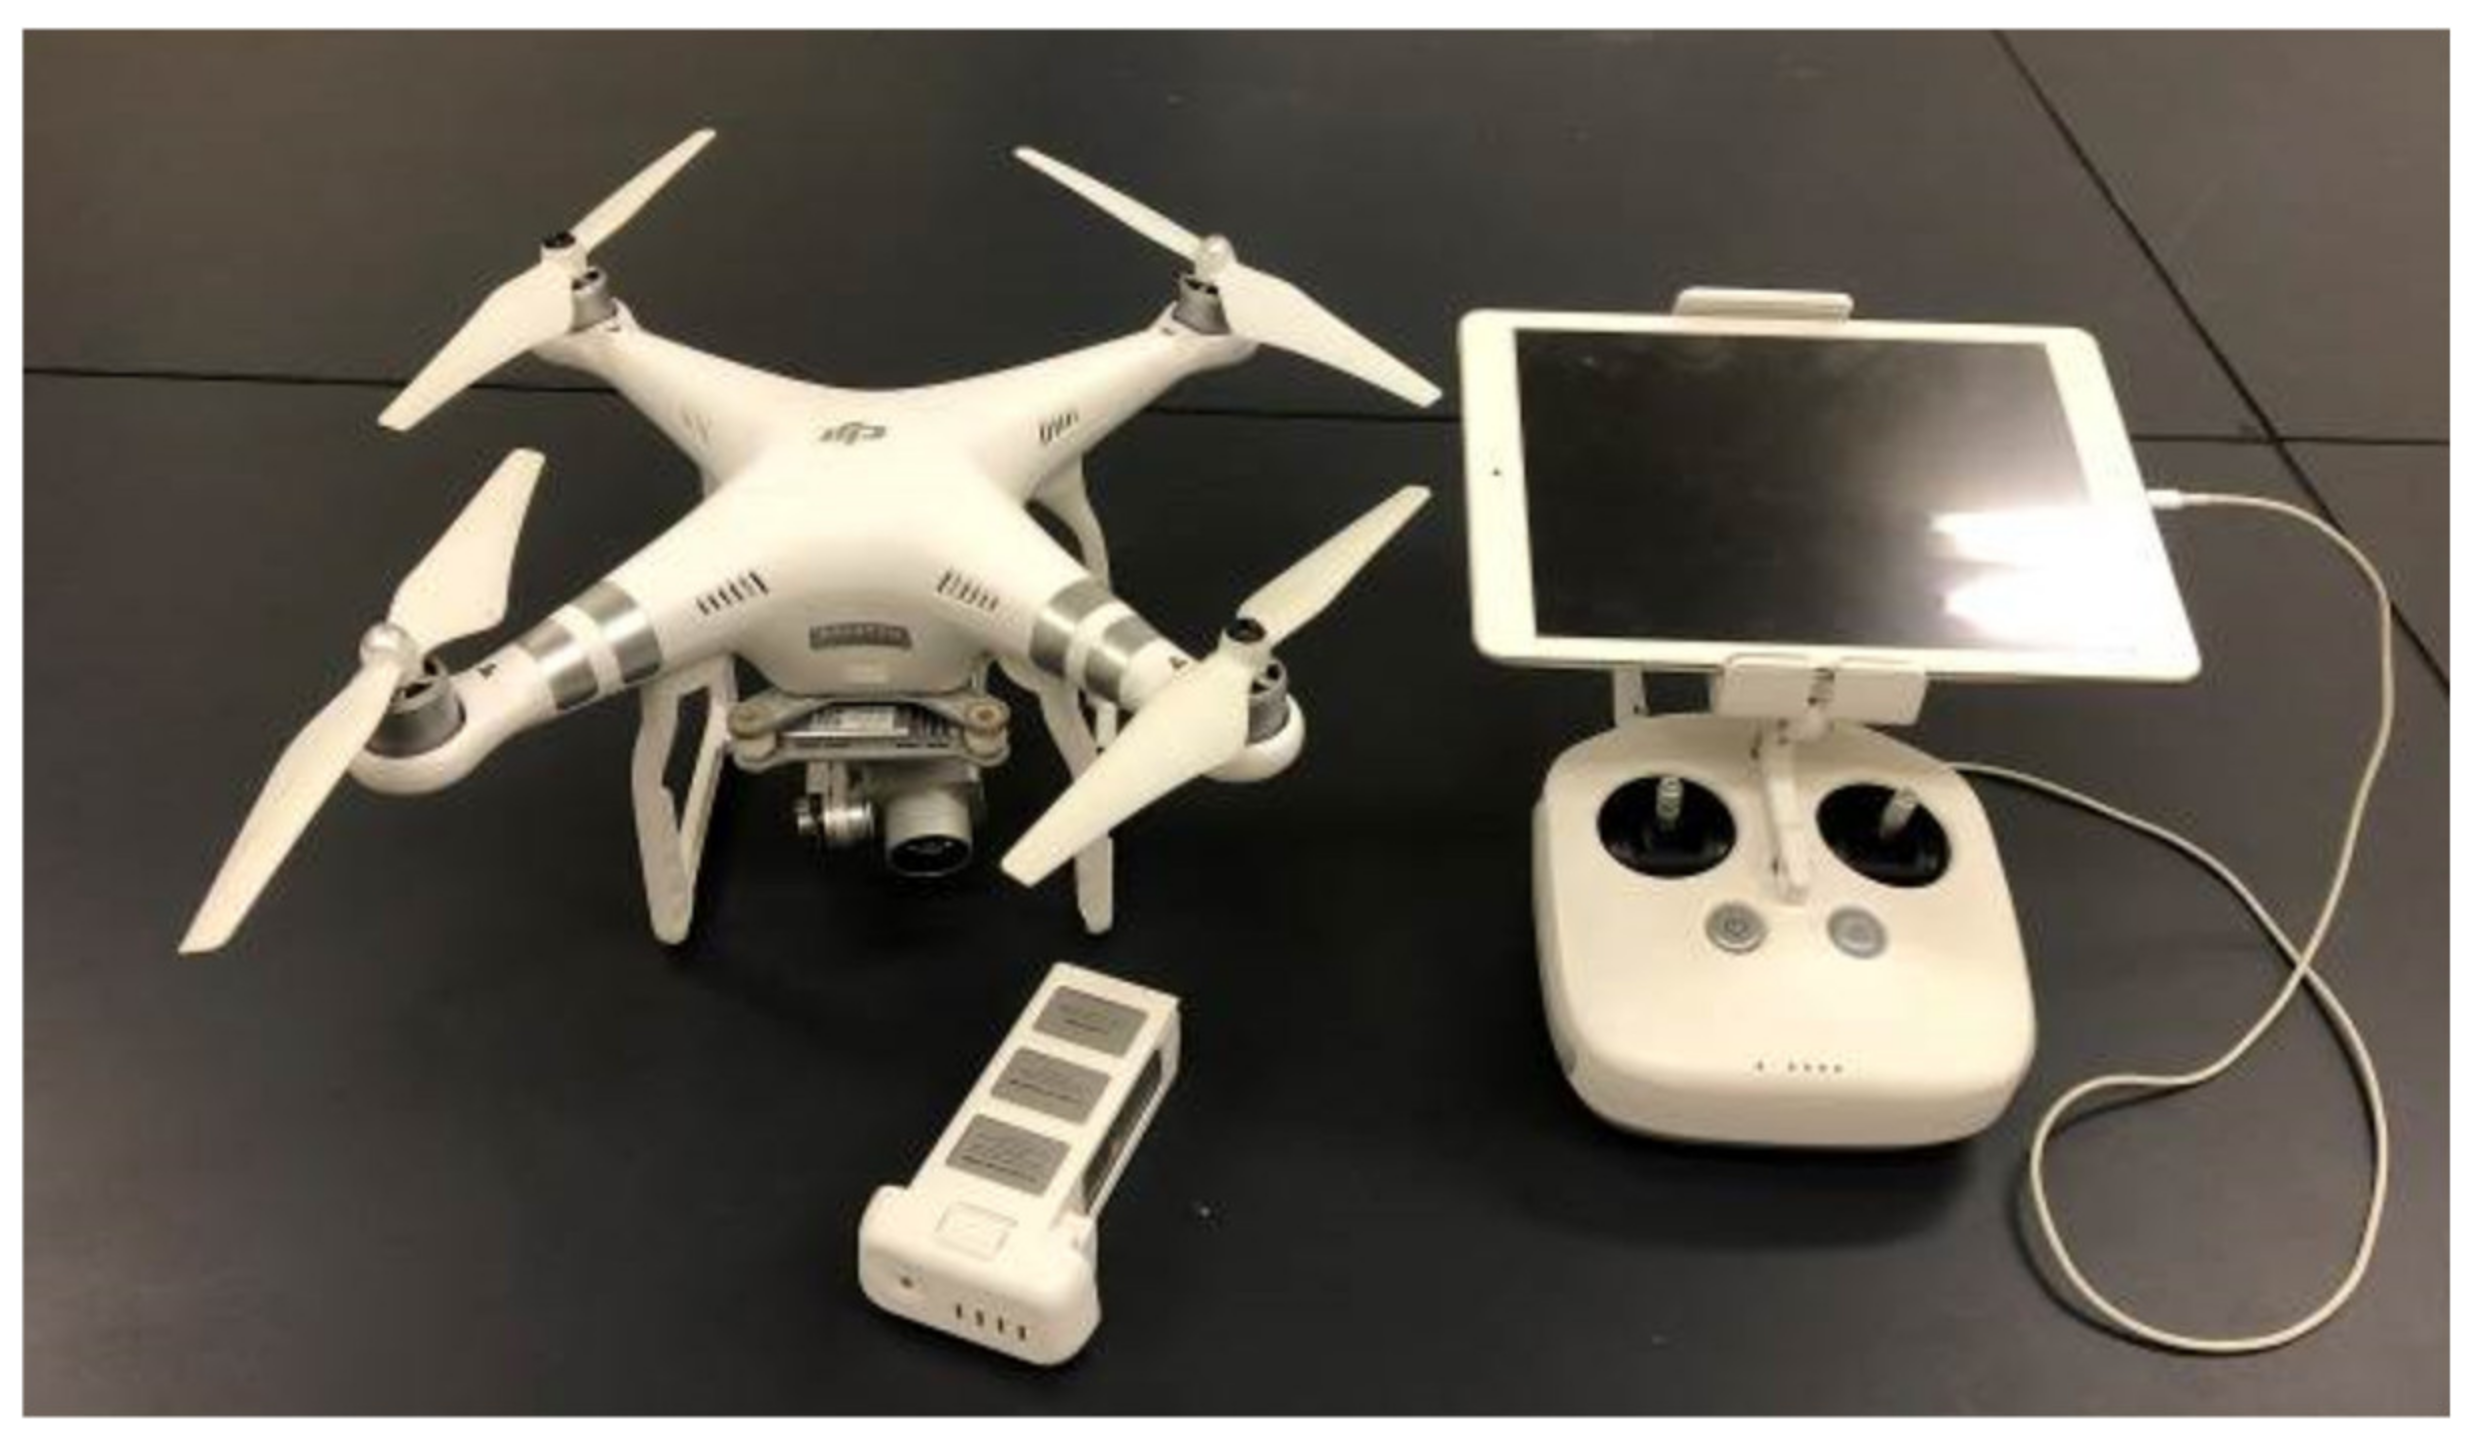
2.2. UAV Flight Conditions

The UAV used was a Phantom3 Advanced (Figure 2) produced by DJI in China. The standard camera of the Phantom3 Advanced was used for aerial image. The Phantom3 advanced has a weight of 1280 g (including the battery and propeller), dimensions of 350 mm (excluding the propellers), maximum flight speed of 16 m/s, maximum flight time of approximately 23 min, and a GNSS of GPS/GLONASS. The camera has a SONY EXMOR 1/23″ sensor, FOV of 94°, a 20 mm (35 mm conversion) lens, and maximum still image size of 4000 × 3000 [50].
Table 1 lists the flight conditions and aerial imaging conditions for the UAV. The flight conditions were set to 80 conditions, which is a combination of five conditions for the flight altitude, four conditions for the overlap, and four conditions for the side overlap. We used the DJI GS PRO [51] to set these flight conditions and operate the UAV. Each condition is described below.
The Ministry of Land, Infrastructure, Transport, and Tourism [27] has published safety guidelines for UAVs (drones and radio-controlled aircraft, among others) in Japan. In general, the flight altitude must be maintained at 150 m or less above the ground level.
The recommended values for degree of overlap in the photography based on the user manual were Terra Mapper at 80–90% overlap and 60% side overlap; and PhotoScan at 80% or more overlap and 60% side overlap. The recommended values for the degree of overlap in the photography in the Pix4D user manual were at least 75% overlap and at least 60% side overlap for general case, but at least 85% overlap and at least 70% side overlap for a forest case. In addition, the recommended values for the Manual for Public Survey Using UAV were 80% or more overlap and 60% or more side overlap. Therefore, the overlap was set to the same value or higher, and the side overlap was set higher than the recommended values in the user manuals of the SfM software used in this study [52,53,54] and the Manual for Public Survey Using UAV [55]. Moreover, when comparing the flight conditions of this study with those of previous studies [19,38] in Japan, the same differences were found as in the various manuals [52,53,54,55].
The flight speed was the maximum speed for the DJI GS PRO flight application [51] to shorten the flight time. For the DJI GS PRO, setting the camera to shoot by hovering stabilizes image capture [51]. Therefore, the photography method selected was hovering to minimize distortion and blur in the captured aerial images.

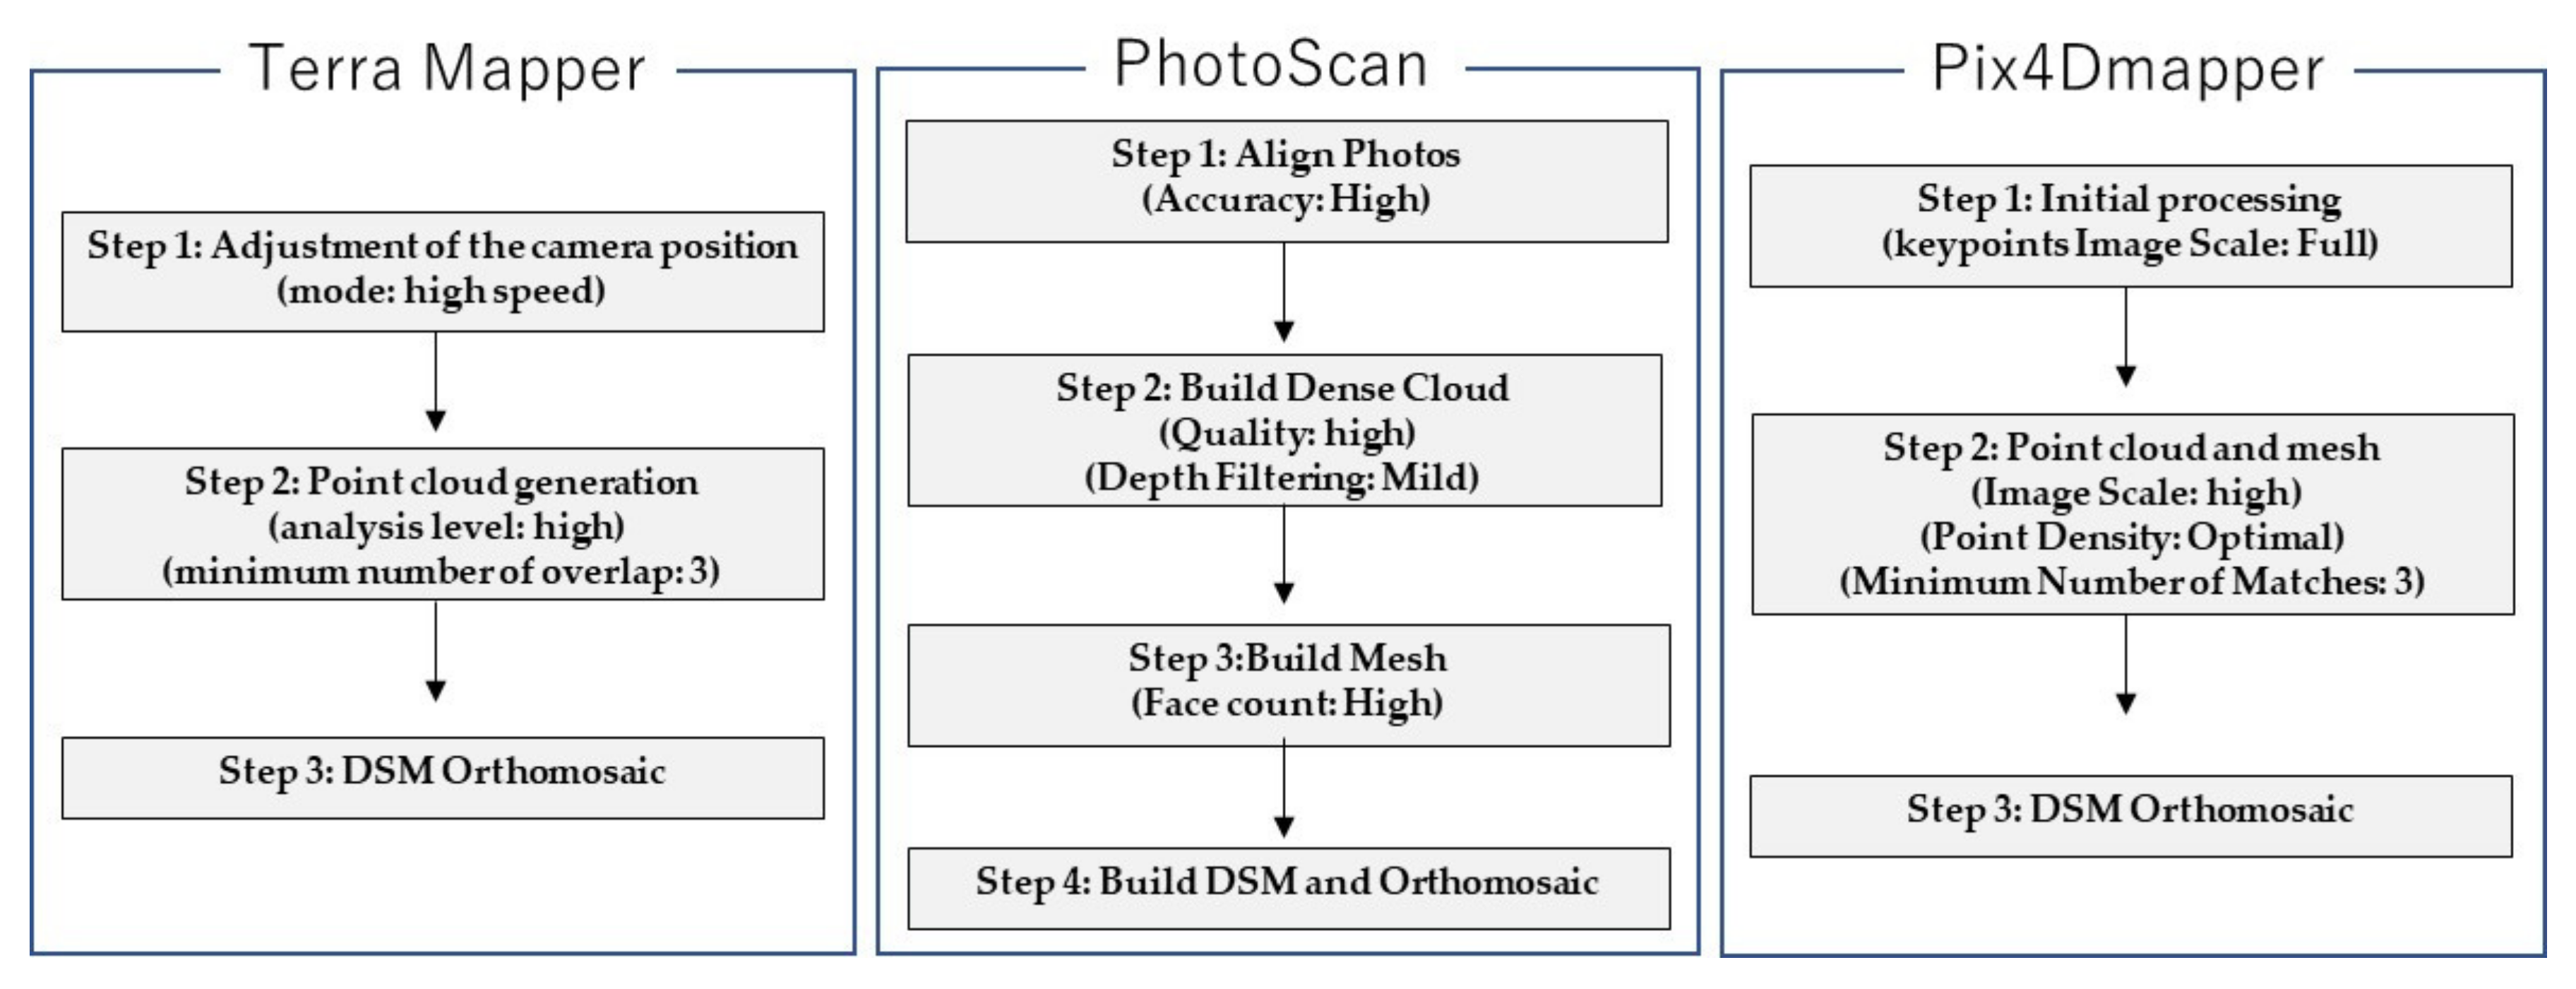
2.3. Processing of Aerial Images and Estimation Methods

The SfM software packages used were Terra Mapper Desktop version (version 2.5.1) from TerraDrone, PhotoScan (version 1.3.2.4205) from Agisoft, and Pix4Dmapper (version 4.5.6) from Pix4D. The specifications of the computer used for Terra Mapper and Pix4Dmapper were as follows: Windows 10 Home OS, 64 bytes with 32 GB memory, and an Intel core i7-7700HQ processor. The specifications of the computer used for PhotoScan were as follows: Windows 10 pro OS, 64 bytes with 16 GB memory, and an Intel core i7-6700 processor.
Kameyama et al. [49] performed image processing using Terra Mapper; when the image processing was NG (incomplete) at each step, they changed the processing parameters and re-executed the image processing. By comparing the medium- and high-resolution workflows in Photoscan, the high-resolution processing workflow experienced a 371% increase in point cloud density and the final planimetric models (planimetric ground sampling distance) were only marginally impacted at 3.33 and 3.32 cm for the high- and medium-resolution processing, respectively [48]. The parameter changes in the SfM processing step differ in the results for the SfM processing of the aerial and generated images. Therefore, using the same image processing method to compare the three software packages is desirable. However, SfM software has different parameter setting methods and processes depending on the software. Therefore, we were unable to set them to consistent workflows and parameters to compare the different SfM software. Ordinary users (in this case, field workers with no specialized knowledge) may have trouble focusing on the details of the parameters and establishing the settings. Therefore, the parameters in the treatment process were set with reference to the user manual [52,53,54] because we speculated that the results would be more versatile if the manual was used as a reference. Terra Mapper was also set to the recommended value or default value in the user manual, and image processing was performed again. In the previous study [49], when a processing error was displayed at each step, “high speed” was changed to “low speed”, and the minimum number of overlaps was changed from 3 to 2, resulting in a loose process (less likely to fail at processing the image). However, in this study, the processing was more severe than in the previous studies because the parameters were not changed when a processing error was displayed at each step. Therefore, in this study, we used exact parameters at each step of the process, which may have made it more robust than previous studies [49]. Figure 3 shows the detailed procedure for all three software packages.
Based on the prepared 3D point clouds, DSM images, and orthomosaic images, the UAV estimations were performed. The tree height was estimated using the position of the trees and the point cloud data. The estimation procedure was as follows: (1) Treetops were detected from the standing position of the trees and point cloud data; (2) the Z-axis value of the treetops was calculated in the software as the DSM; (3) as the study area is flat, the height of the aerial target set in the survey site was calculated as the Digital Elevation Model (DEM) value; and (4) the tree height was estimated by subtracting the DEM from the DSM.
For the crown area, we used the position of the trees, orthomosaic images, and the polygon creation function in the software. The estimation procedure was as follows: (1) The crown area of each target tree was marked with the polygon function by referring to the position of the trees and tree top detection, and (2) the crown area was estimated by calculating the area of the polygon using the area calculation function of the software.
For the flight conditions where the process could not be completed successfully at each step or where the 3D point clouds, orthomosaic images, and DSM images estimations for the majority or part of the survey site were insufficient, we did not take any further estimations or verify the accuracy. In Kameyama et al. [49], the overlap and side overlap values were required to be 90% or more. Similar to Terra Mapper, even with PhotoScan and Pix4Dmapper, there is a possibility that image processing cannot be performed unless the overlap and side overlap are 90% or more. In this study, we verified the accuracy of the estimated forest information (tree height and crown area) results from SfM processing based on different SfM software. Therefore, the accuracy of the estimated value cannot be verified under flight conditions where image generation and estimation were not possible. Furthermore, if most of the flight conditions, with overlaps and side overlaps of 80 and 85%, respectively, were not SfM-processed by the three software packages, the estimations and verifications were performed only for the flight conditions that combining 90 and 95% overlap and side overlap, respectively.
Kameyama et al. [49] used the method devised by the Ministry of Agriculture, Forestry, and Fisheries [56] to estimate Diameter at breast height (DBH) and then calculated the volume. However, the calculation for volume proposed by the Ministry of Agriculture, Forestry, and Fisheries [56] is significantly affected by the accuracy of the tree height and crown area estimations. At present, there are no methods other than estimation using an estimation formula because the DBH cannot be measured directly from UAV aerial images. Moreover, as our study used the same aerial image dataset as Kameyama et al. [49], the volume accuracy is expected to be low similar to previous studies. Therefore, we estimated and verified the crown area and tree height, which can be directly estimated from the SfM processed image.

2.4. Statistical Analyses

To compare the estimated crown areas from the three SfM software, the analysis of paired one-way variance (ANOVA) was used. If the ANOVA was significant at p < 0.05, post hoc analyses were performed with the Bonferroni multiple comparisons. The statistical significance level of multiple comparisons was set at p < 0.05. The estimated tree heights were subjected to ANOVA and Bonferroni multiple comparisons to compare the estimated values produced by the three SfM software and the measured values. The ANOVA and Bonferroni multiple comparisons were performed using R (version 4.0.0). In addition, to verify the estimated and measured values, we performed a normality test and a T-test to calculate the root mean square error (RMSE). A Kolmogorov–Smirnov goodness of fit test was performed to determine whether the data were normally distributed. The statistical difference was determined by a two-sided paired t-test. Differences with p < 0.05 were considered significant. The Kolmogorov–Smirnov goodness of fit test and a two-sided paired t-test were performed using Reviewer, produced by the Data Science Institute, Japan. In this case, the true values (actual values) were obtained from the tree survey, where the difference, i.e., the RMSE and relative root mean square error (rRMSE), between the values measured with the UAV and the actual values were used. The RMSE and rRMSE calculations were performed using Excel (version 2019) as follows:
RMSE = i = 1 n y i y ´ i 2 n
rRMSE = R M S E y ¯ 100
where n is the total number of trees, y i is the predicted value, y ´ i is the observed value, and y ¯ is the mean of n observed values.

3. Results

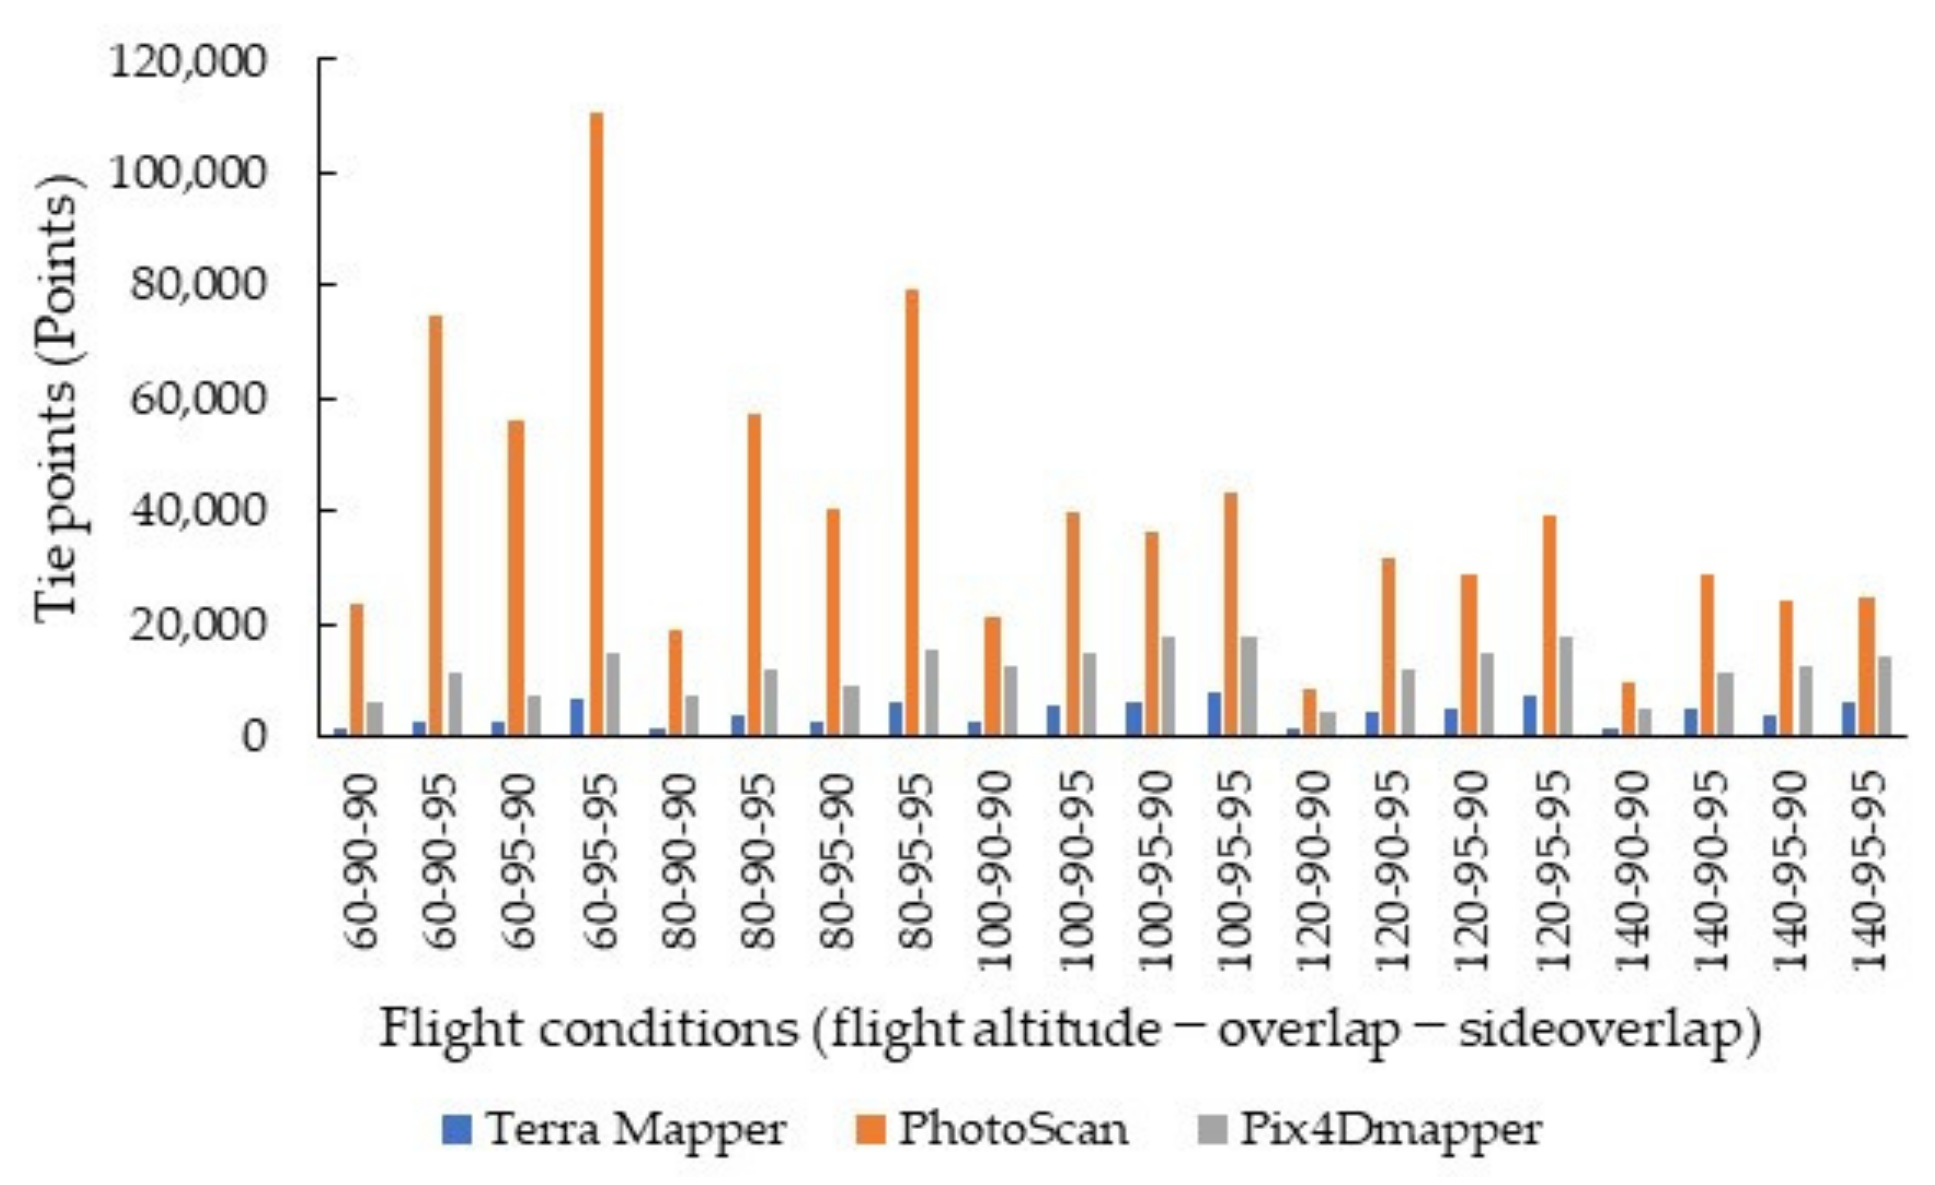
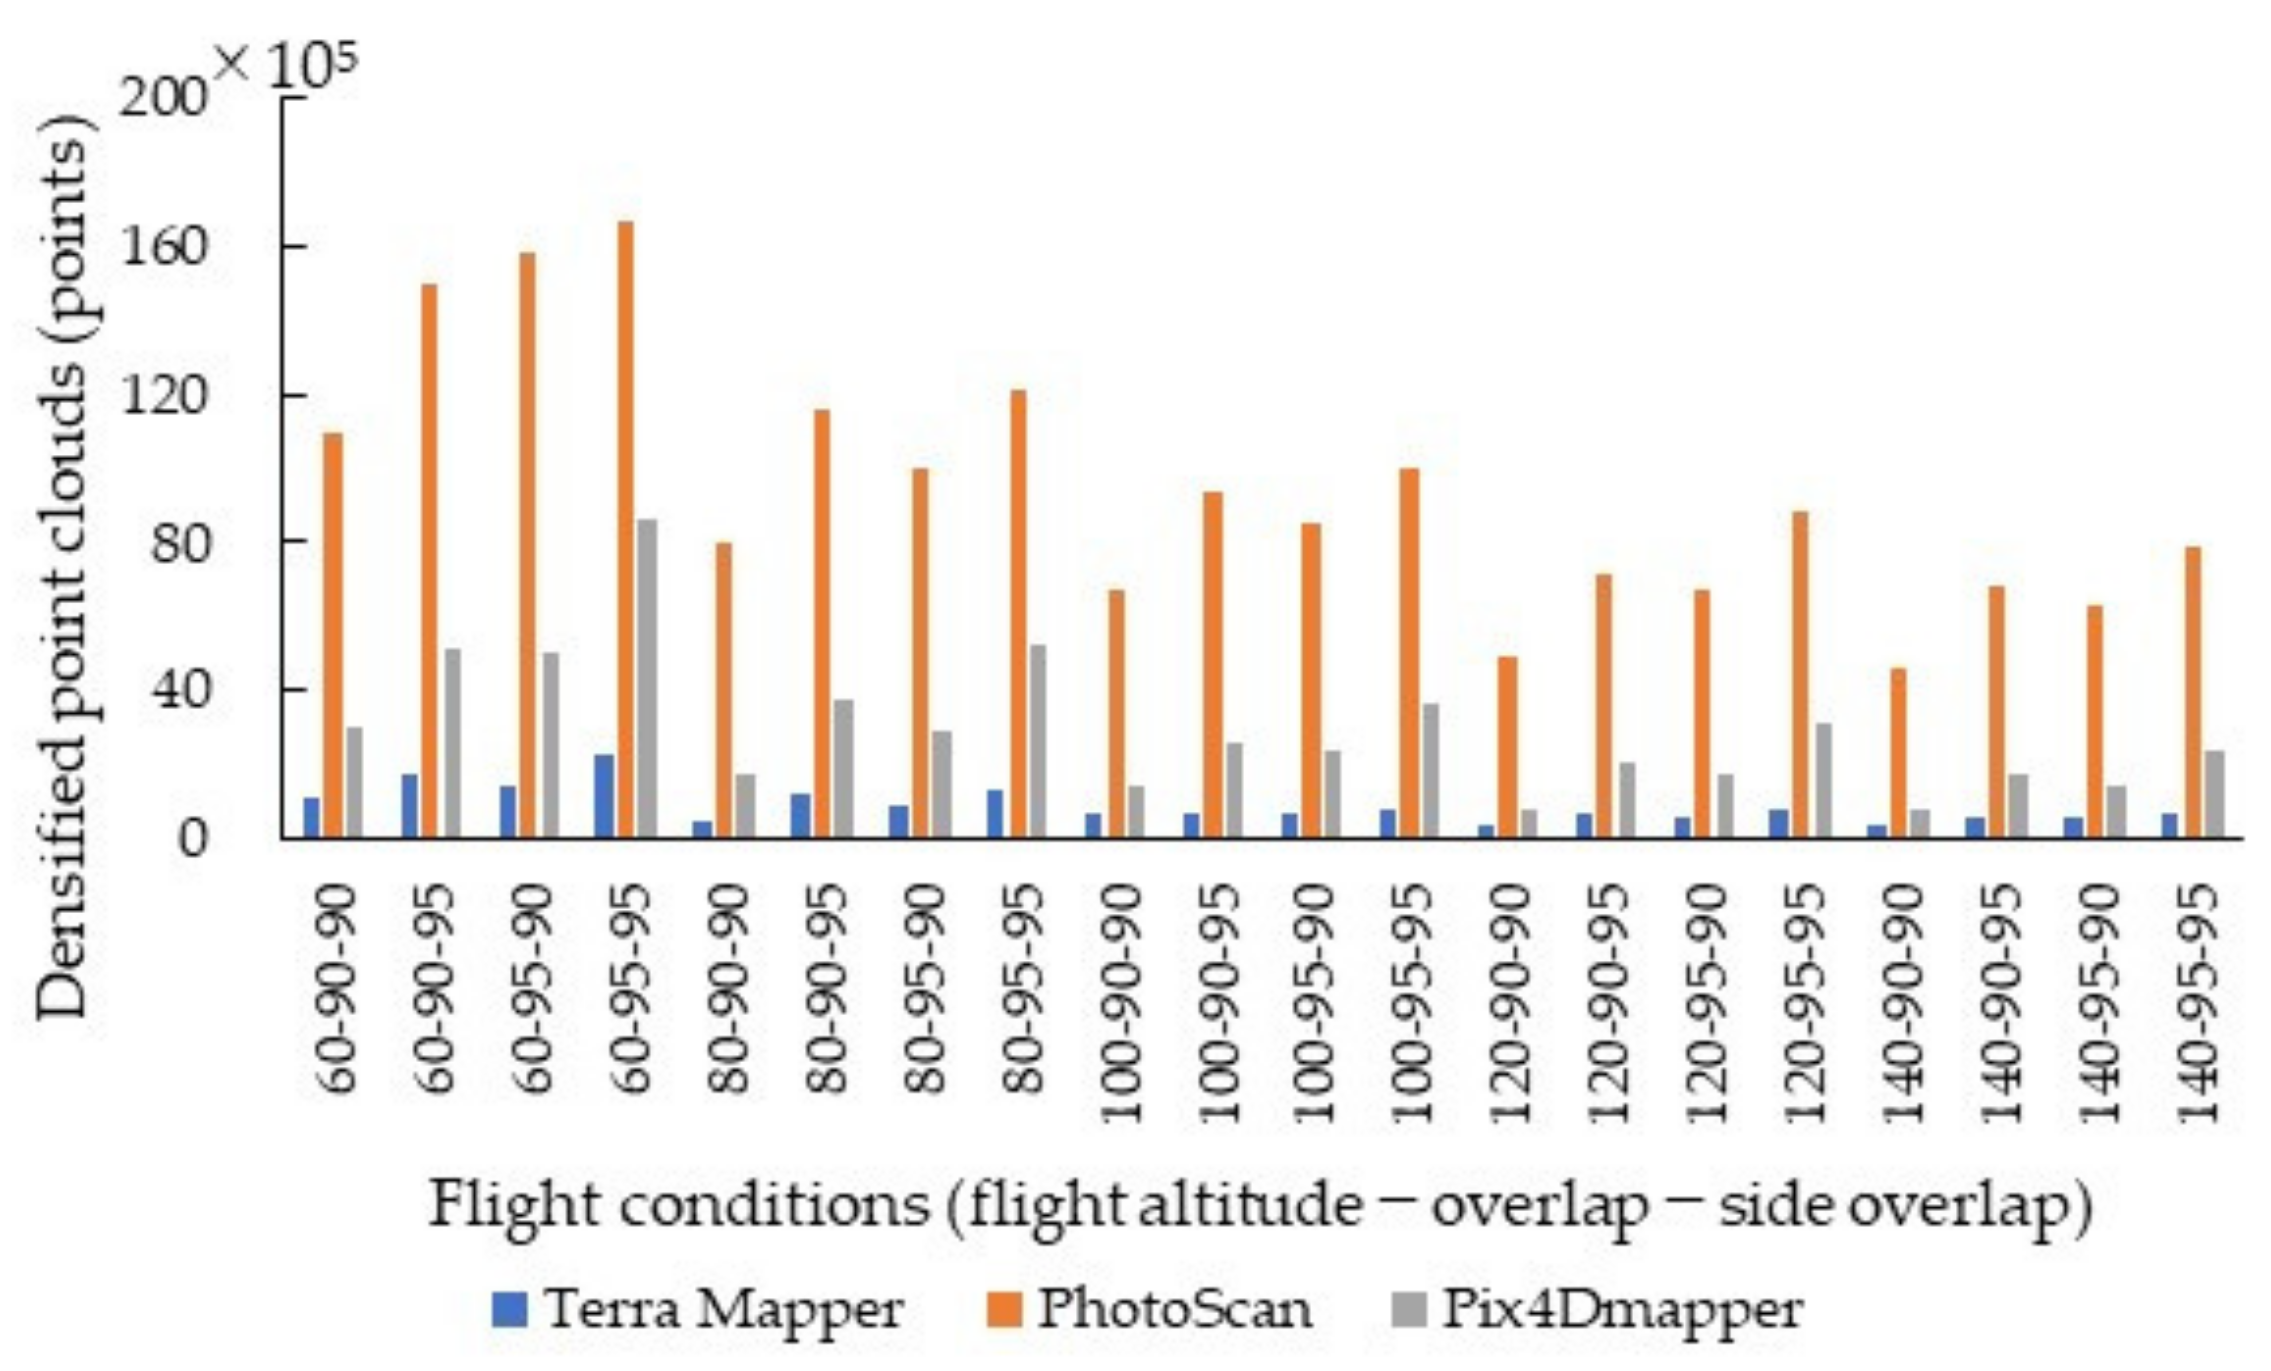
3.1. Image Processing by Each SfM Software

Table 2 shows the results of image processing using the SfM software. From Table 2, 27 flight conditions in Terra Mapper and 1 flight condition in PhotoScan were marked as C. There were no flight conditions marked as C in Pix4Dmapper. Thirteen flight conditions in Terra Mapper, 29 flight conditions in PhotoScan, and 29 flight conditions in Pix4Dmapper were marked as B. Forty flight conditions in Terra Mapper, 51 flight condition in PhotoScan, and 51 flight conditions in Pix4Dmapper were marked as B. The flight conditions marked as C or B in any SfM software often included 80 or 85% of the degree of overlap in the photography.
The combined flight conditions of 90 and 95% overlap and side overlap, respectively, completed SfM processing and image generation (A in Table 2) with each SfM software. In addition, most flight conditions with a combination of 80 and 85% overlap and side overlap, respectively, did not complete SfM processing or image generation (B or C in Table 2). In some cases, as the flight altitude increased, SfM processing and image generation became insufficient for each SfM software depending on the combination of overlap and side overlap (80–85% PhotoScan, 80–90% all software, 90–80% Pix4Dmapper, 90–85% PhotoScan and Pix4Dmapper, 95–80% all software, 90–85% PhotoScan). SfM processing and image generation in flight conditions with 95% side overlap were completed successfully with all software.
Thus far, this study used aerial images captured by 80 conditions combining the flight altitude, overlap, and side overlap, comparing the SfM processing and image generation in each SfM software. However, from Table 2, there were many flight conditions (C and B in Table 2) in which SfM processing failed or did not generate perfect images in flight conditions that included 80 or 85% overlap and side overlap, respectively. The flight conditions marked C and B in Table 2 do not allow a comparison of the generated images (tie points and number of dense point clouds) in the software because some software does not generate reports of SfM processing. Furthermore, for the incomplete image (B and C in Table 2), we cannot find 72 target trees and cannot estimate the crown area and tree height; therefore, we cannot perform a comparison of the estimates in the SfM software.
The subsequent comparison of the SfM processing results, estimates of the tree height and crown area, and verification of the estimates were not performed for 80 conditions, but only for 20 flight conditions (five flight conditions at 60, 80, 100, 120, and 140 m for the flight altitude, and two conditions of 90 and 95% for overlap and side overlap, respectively) for which the SfM processing and image generation (A in Table 2) were completed by all SfM software in any flight condition from Table 2.

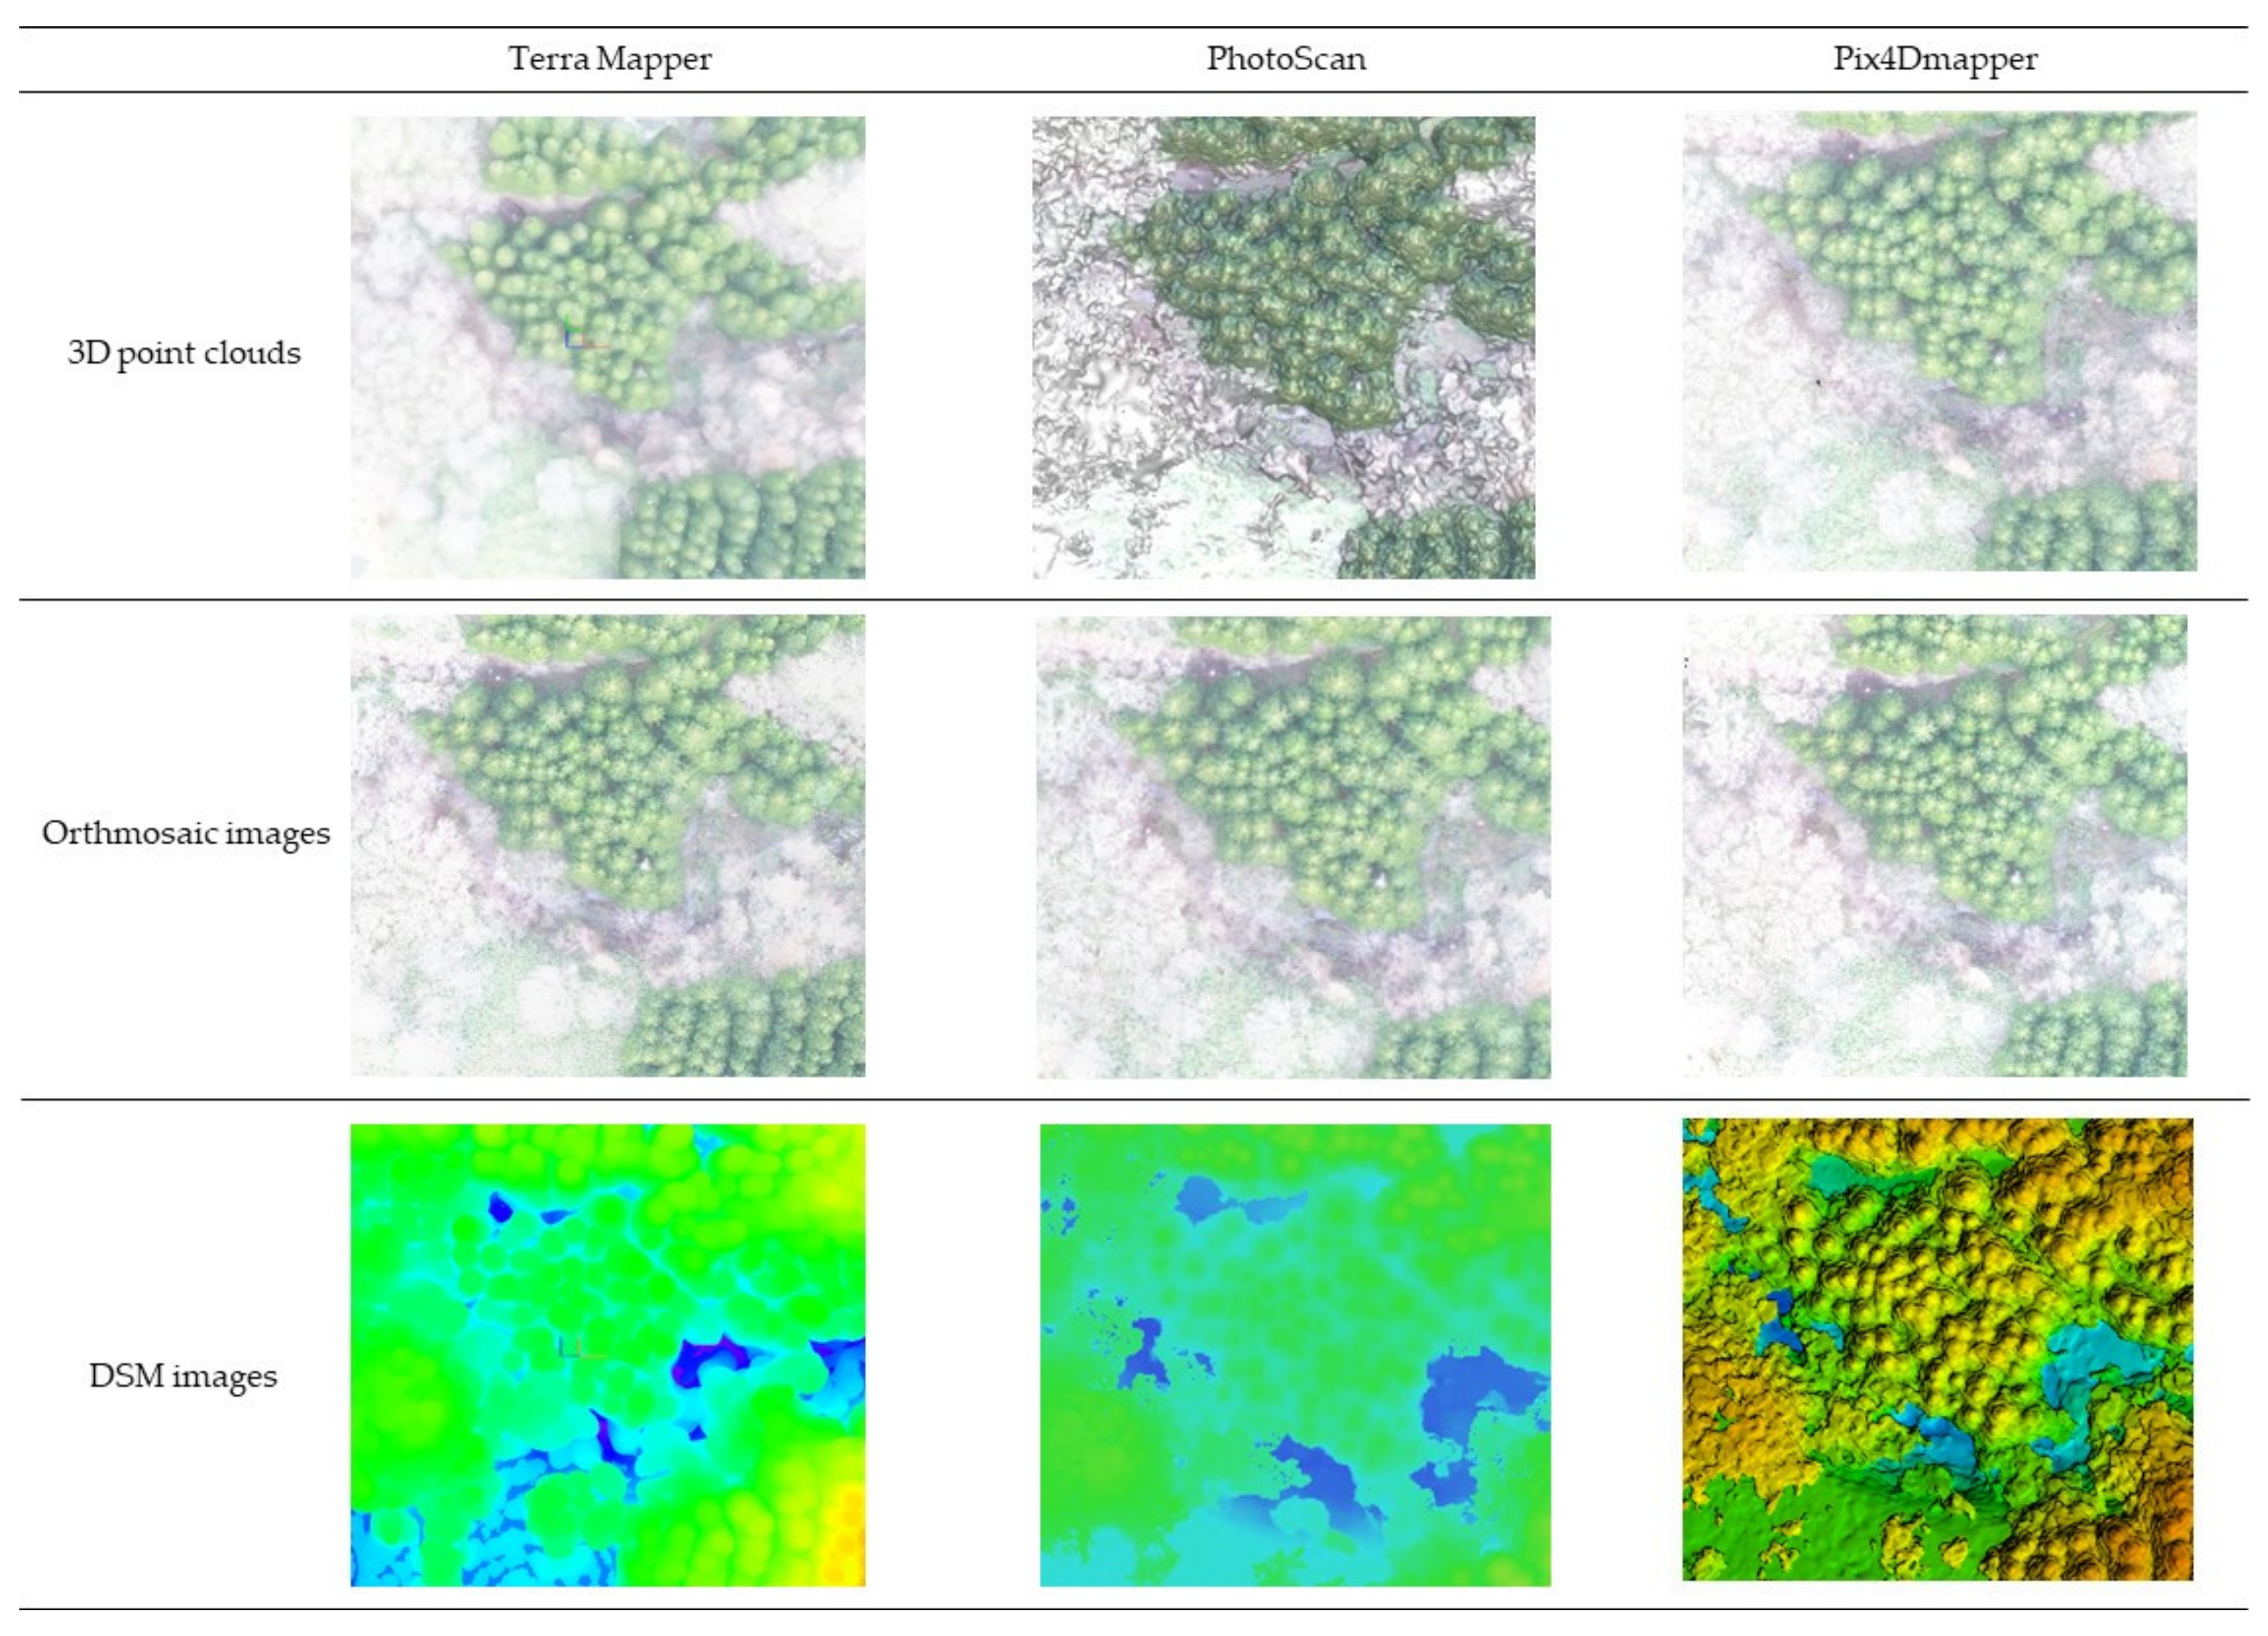
3.2. Comparison of Images Generated by Each SfM Software

Table 3 lists the results of the image matching, camera location error, and reprojection error by SfM processing in each SfM software. The success rate of camera calibration for the number of taken images by any software was 100% (camera calibrated is successful in all images). For the camera locations error, the Z error is often larger than the X and Y errors in each SfM software. In addition, there is no significant difference in each SfM software between the X and Y errors. However, the Z error often differs depending on the software. Therefore, the camera location error was more dependent on Z than X and Y. The error recorded on Z depends on the barometric measurement of the UAV. Therefore, the value of Z added to the Exchangeable image File Format (EXIF) information added to the UAV was prone to deviation, resulting in an error. The reprojection error had the highest value in Terra mapper, followed by PhotoScan and Pix4Dmapper. Therefore, there was a large difference between the feature points extracted from the terra and projected points.
Figure 4 shows the number of tie points for each software. The number of tie points was in the range of 1000 to 8000 for Terra Mapper, 8000 to 110,000 for PhotoScan, and 4200 to 17,000 for Pix4Dmapper. Therefore, PhotoScan generated more tie points than the other software. In addition, if the flight altitude is the same, the number of tie points will increase as the number of aerial images increases in each SfM software. For the same degree of overlap in the photography, the tie points tend to decrease as the flight altitude increases in each SfM software.
Figure 5 shows the number of densified point clouds in the images generated by each SfM software. The number of densified point clouds of Terra Mapper ranged from 4 × 10⁵ to 22 × 105, i.e., extremely small compared with those of the other SfM software. The number of densified point clouds for PhotoScan ranged from 46 × 105 to 166 × 105, i.e., significantly more than those of the other SfM software. The number of densified point clouds for Pix4Dmapper ranged from approximately 8 × 10⁵ to 86 × 105. The number of densified point clouds decreased with an increasing flight altitude for all SfM software packages and increased with the photo overlap rate (an increase in the number of photographs taken).
Figure 6 shows example images after successful processing by each SfM software. The image shown was taken under the flight condition of 140-95-95 (altitude-overlap-side overlap). There was no difference in the orthomosaic images among the images generated by the three SfM software. However, PhotoScan’s 3D point clouds and Pix4Dmapper’s DSM images produced images that were different from the other two software. In addition, over-exposure of the generated images derives from the effect that sunlight has on the aerial images. the resolution of the images generated by each SfM software. The ground resolution of the generated images (DSM images and orthomosaic images) for each flight condition ranged approximately from 2 cm/pix to 5 cm/Pix for all SfM software.

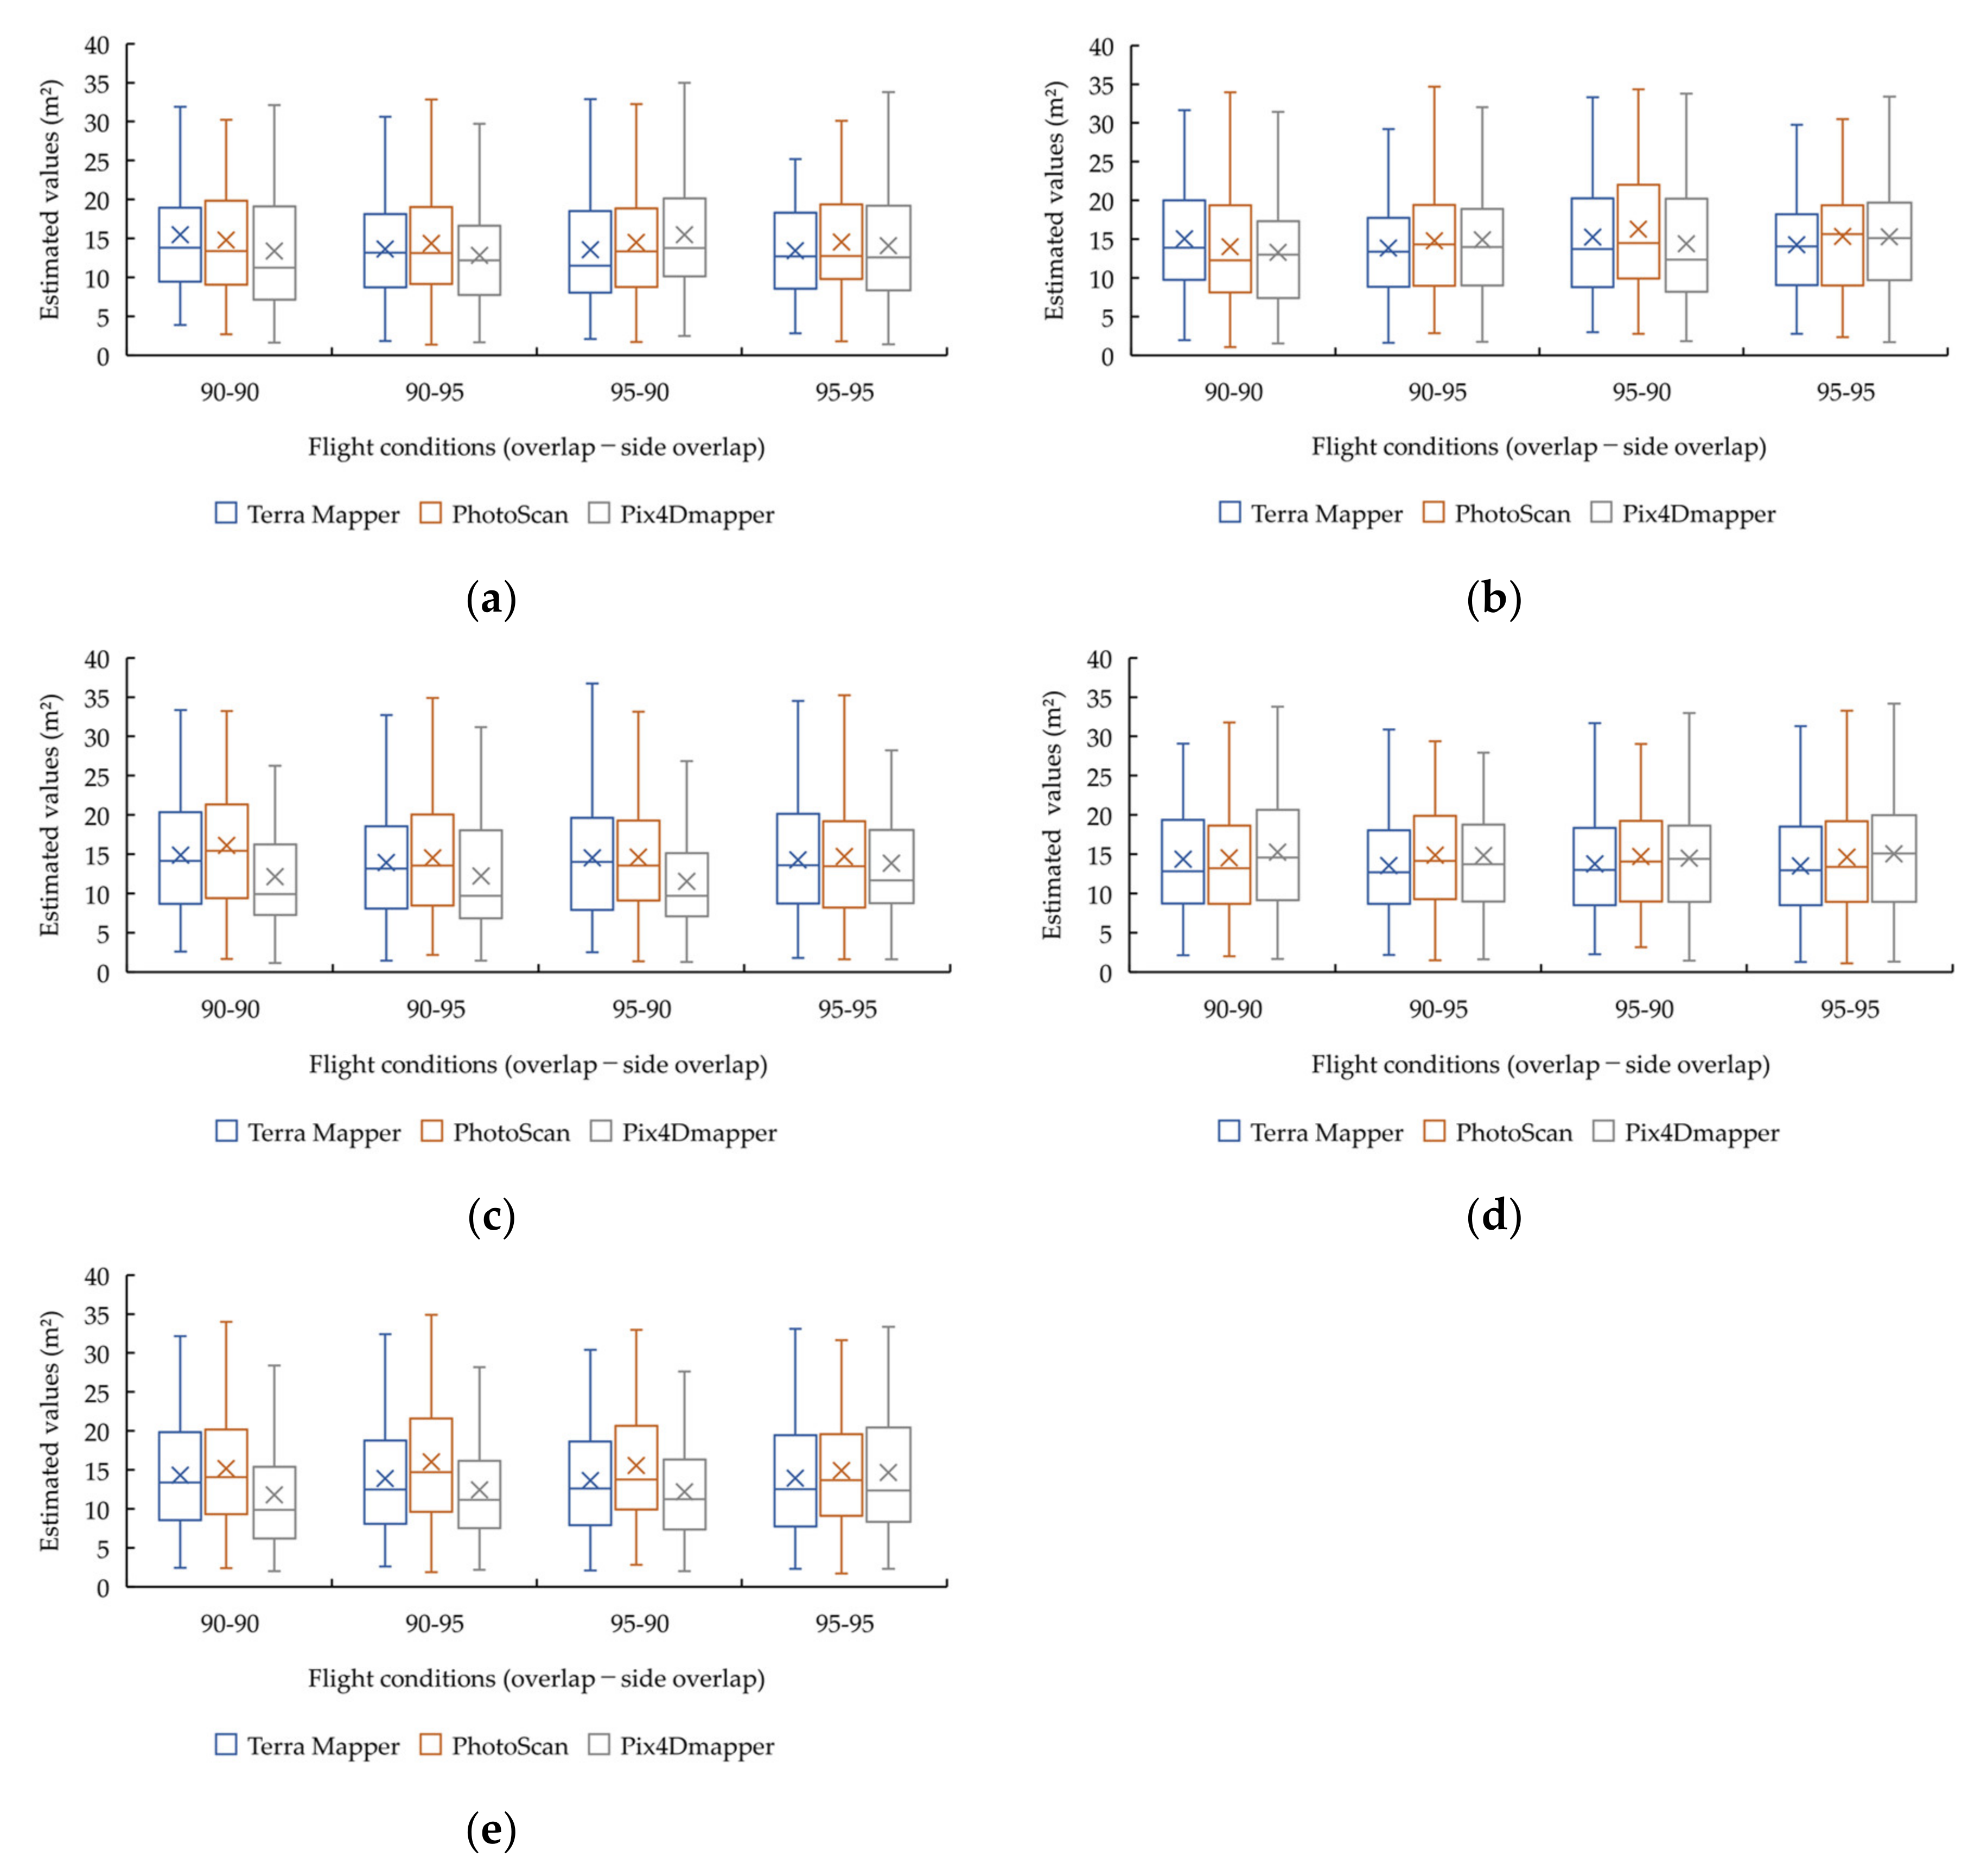
3.3. Estimation of Crown Area

Figure 7 shows the estimated value of the crown area from each SfM software. Pix4Dmapper exhibited a tendency to underestimate the crown areas (nine flight conditions) compared with the other two SfM software packages, whereas PhotoScan exhibited a tendency to overestimate the crown area (seven flight conditions) compared with the other SfM software packages. Terra Mapper did not exhibit a clear tendency toward overestimation or underestimation when compared with the other SfM software packages, but we can infer that the crown area values obtained with Terra Mapper tended toward underestimation when compared with PhotoScan.
ANOVA and Bonferroni multiple comparisons were performed on the 20 flight conditions. As a result, a statistically significant difference (p < 0.05) was confirmed under 19 flight conditions. No statistically significant difference was confirmed for one flight condition (100-95-95). Therefore, the Bonferroni multiple comparisons between groups were examined only under 19 flight conditions, in which statistically significant differences (p < 0.05) were confirmed by the ANOVA. The Bonferroni multiple comparisons for the 100-95-95 flight condition were not conducted because the ANOVA did not confirm a statistically significant difference. As a result, a statistically significant difference (p < 0.05) was confirmed under 14 flight conditions for Terra Mapper and PhotoScan, 16 flight conditions for Terra Mapper and Pix4Dmapper, and 11 flight conditions for PhotoScan and Pix4Dmapper (Table 4). Therefore, we can infer that the estimated values of the crown area derived from different SfM software are statistically different.

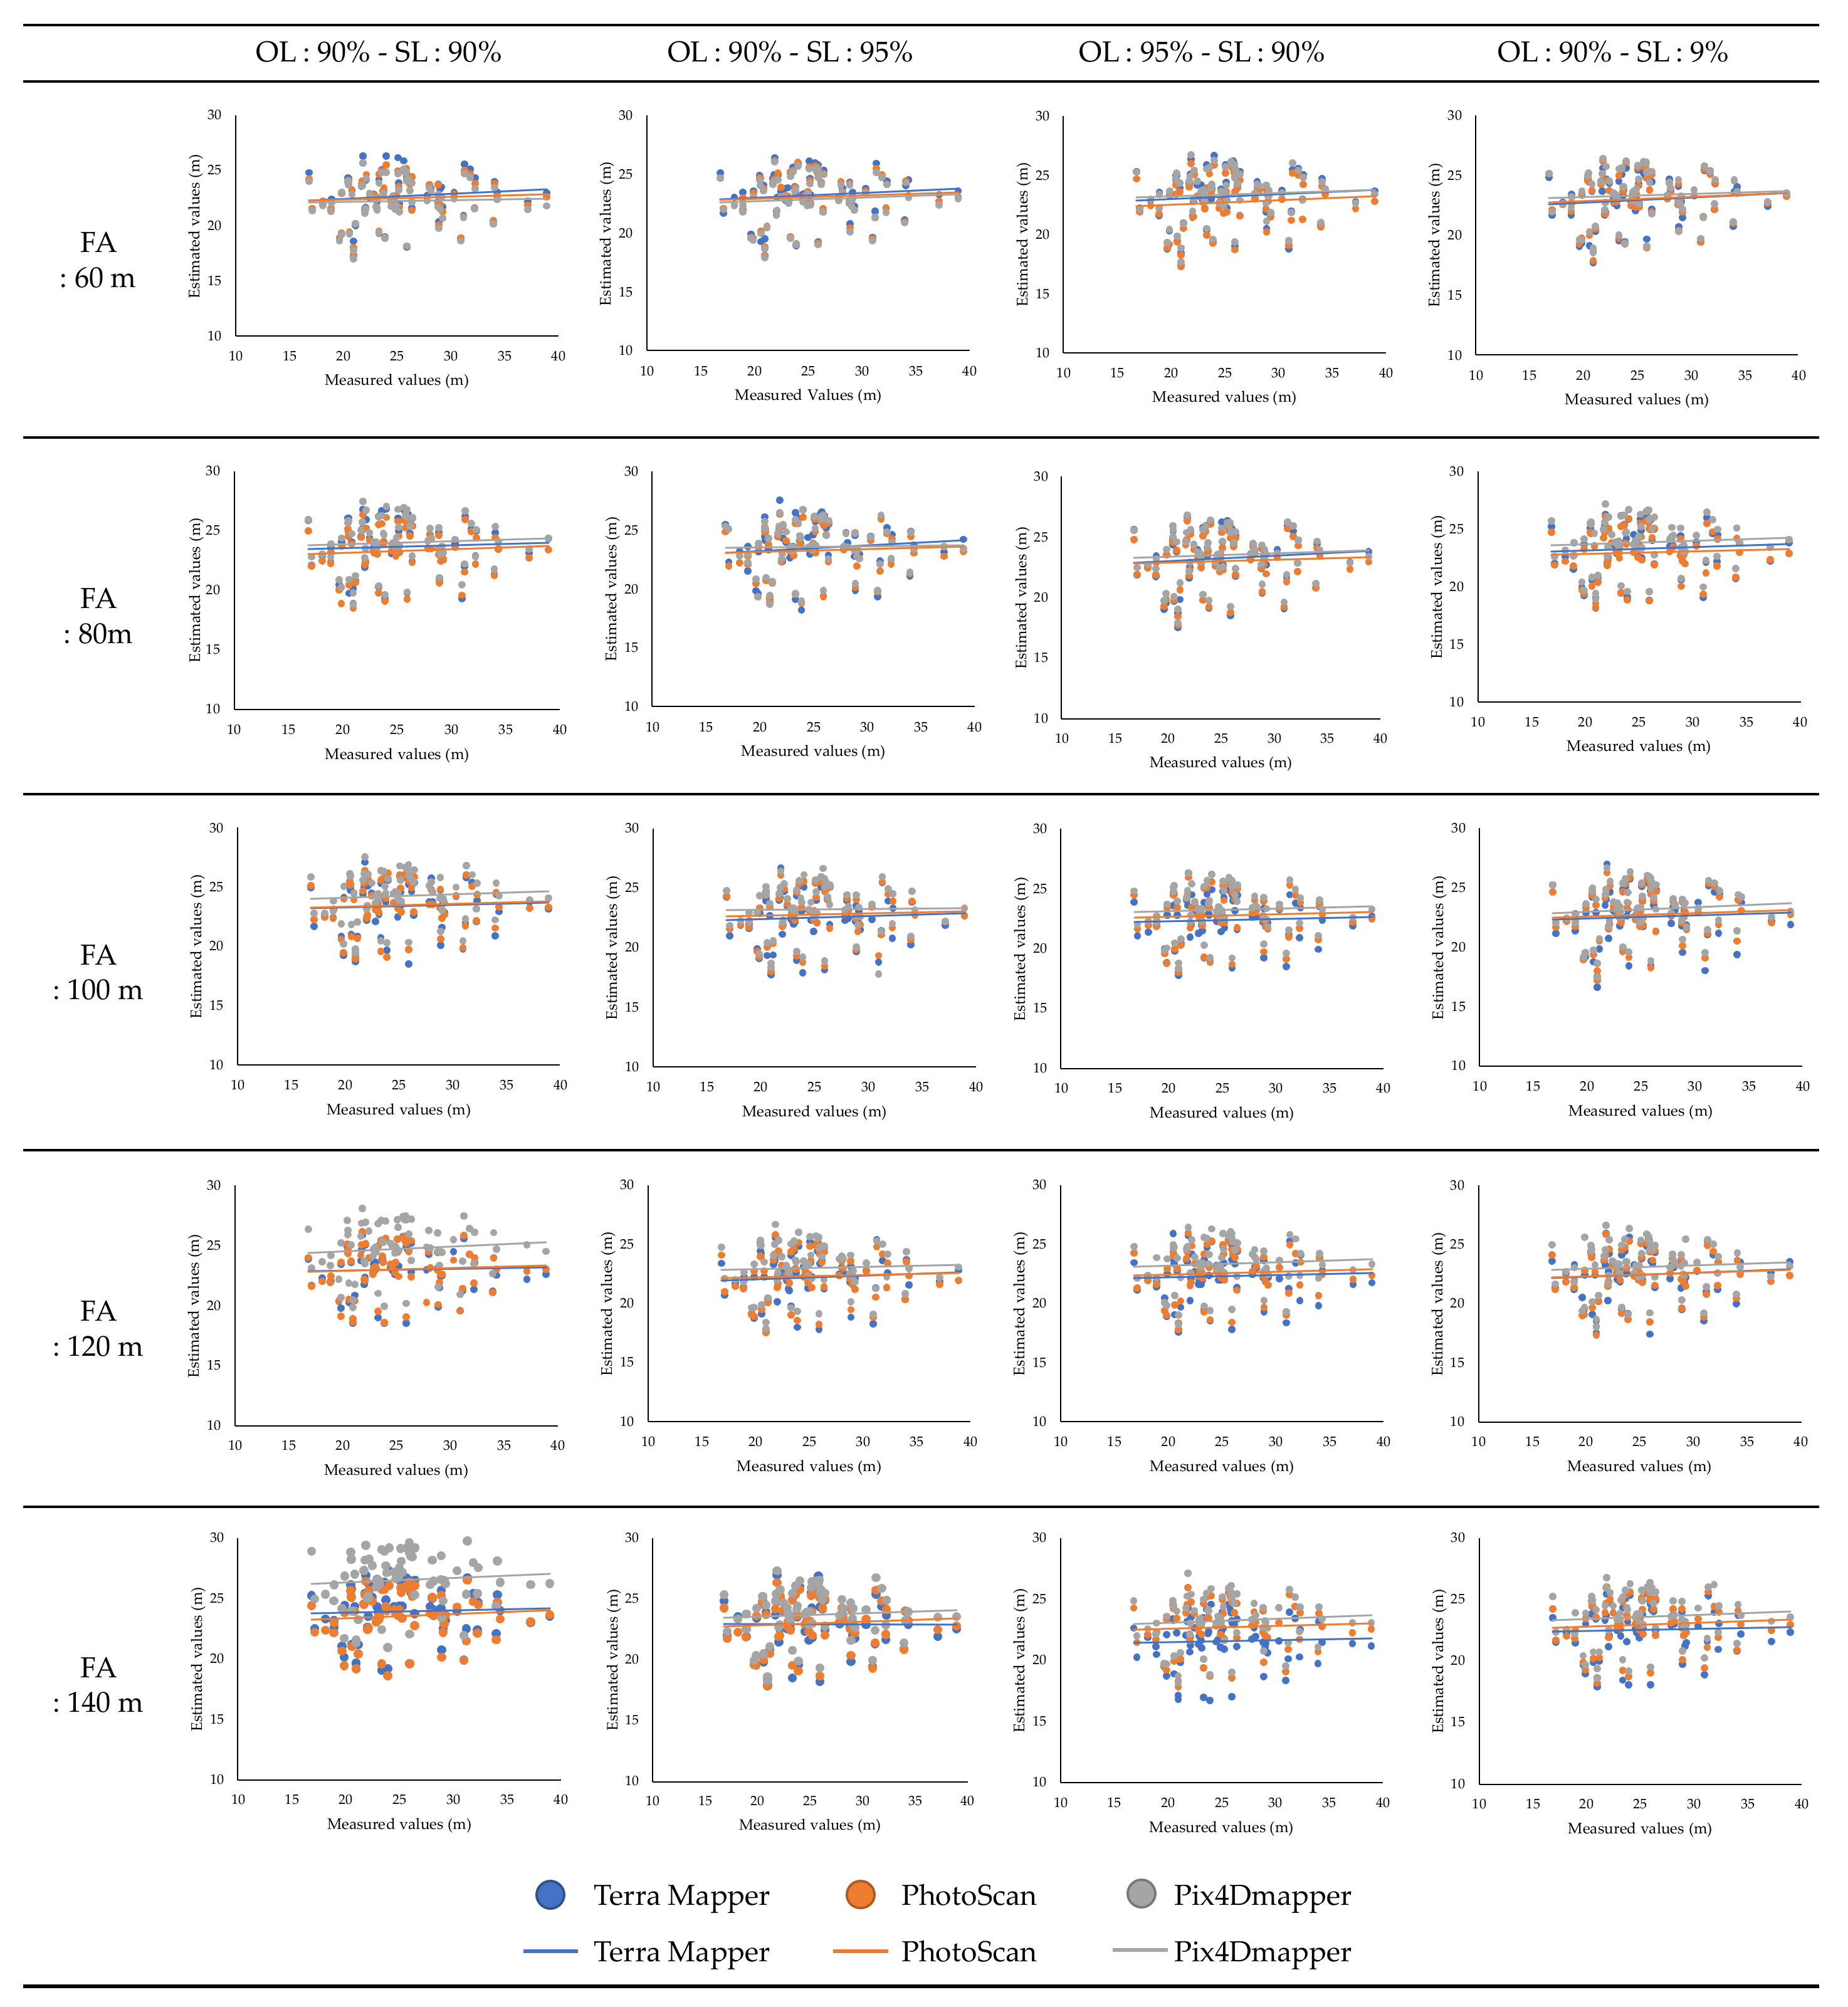
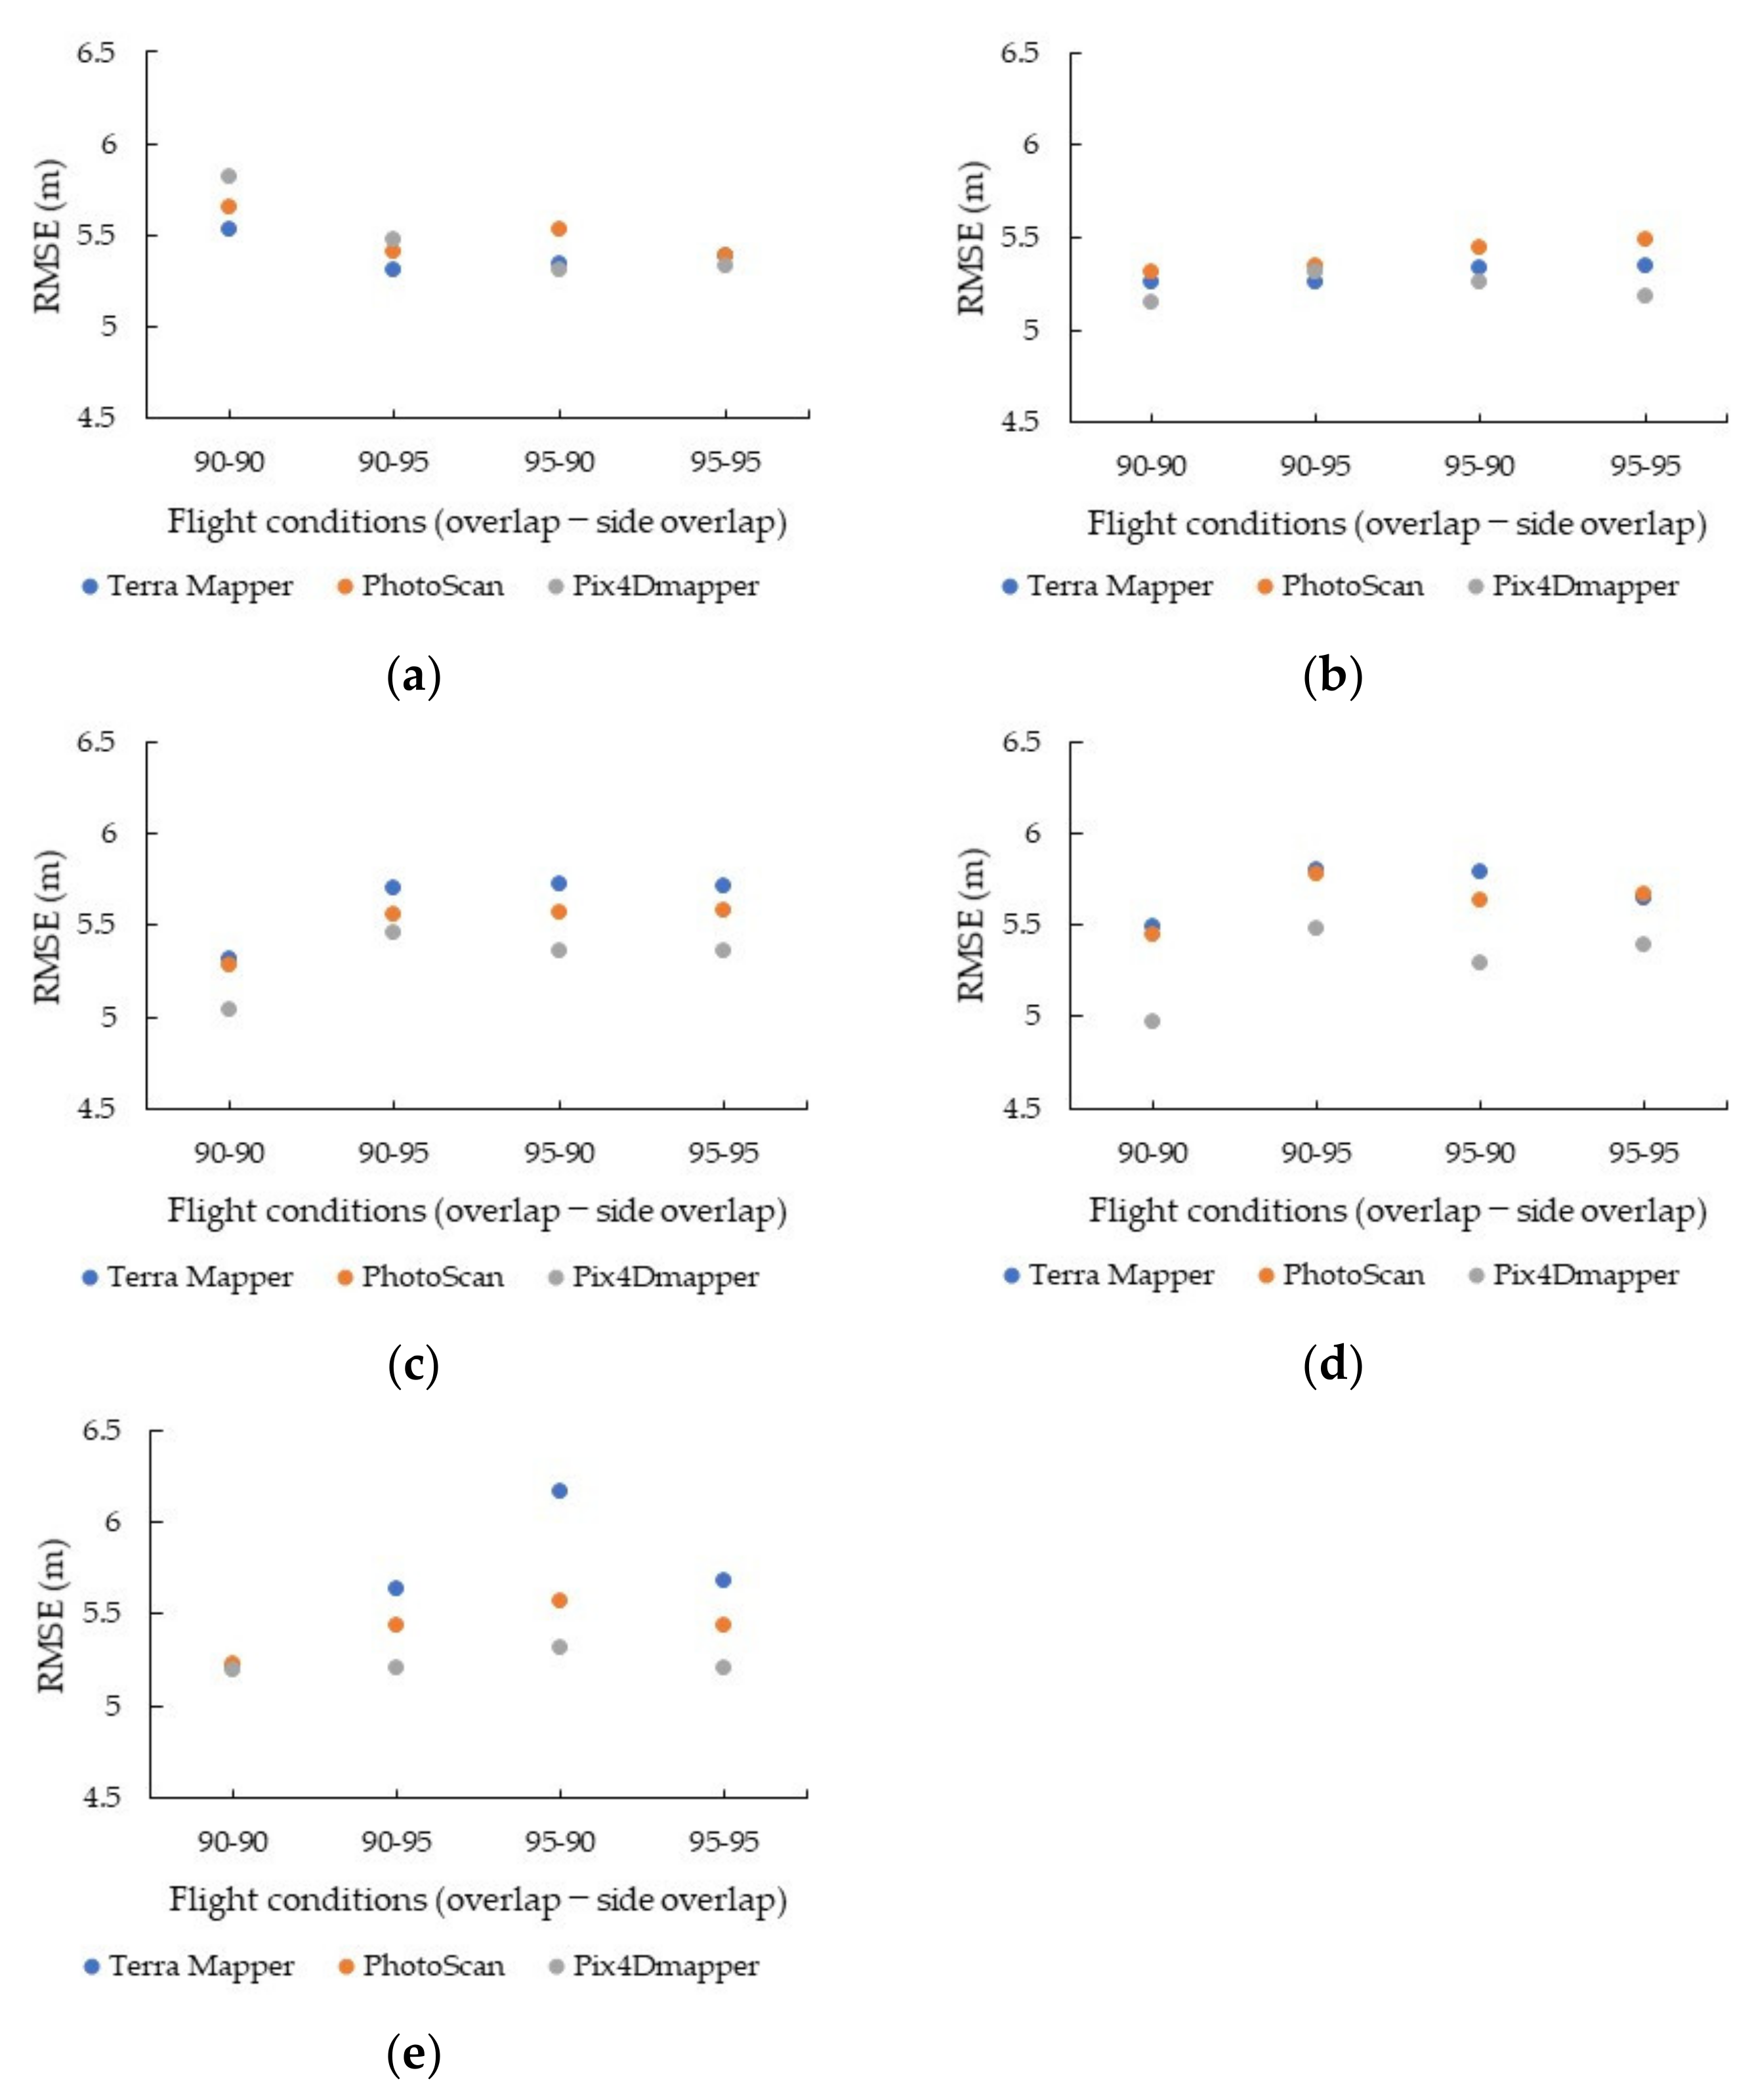
3.4. Estimation of Tree Height

Figure 8 shows the Comparison of estimated and measured tree heights and regression line for each SfM software. The tree height estimates from each SfM software were underestimated compared with the measured values. Pix4Dmapper exhibited a tendency toward overestimation of the tree height compared with the other SfM software packages. This tendency is often observed at higher flight altitudes. In addition, there was no significant trend in the estimated tree height between PhotoScan and Terra Mapper.
As a result of executing the ANOV and on the estimated tree height and measured values for each flight condition in each SfM software, a statistically significant difference (p < 0.05) was confirmed under all flight conditions. Therefore, as a result of executing the Bonferroni multiple comparisons under all conditions, the statistically significant difference (p < 0.05) in the estimation of the SfM software for each flight condition was confirmed under 15 flight conditions for Terra Mapper and PhotoScan, 19 flight conditions for Terra Mapper and Pix4Dmapper, and all flight conditions for PhotoScan and Pix4Dmapper (Table 5). In addition, the statistically significant difference (p < 0.05) between the estimated and measured values from each SfM software was confirmed under 18 conditions for Terra Mapper, 20 conditions for PhotoScan, and 13 conditions for Pix4Dmapper (Table 6).
We observed that the estimated tree height differs from the measured value under many flight conditions. However, Pix4Dmapper had a large number of flight conditions that did not show a statistically significant difference compared with the other software. Moreover, as with the crown area, we can infer that the values of the estimated tree height from different SfM software were also statistically different.
The normality of the estimated values of the tree height was performed to calculate the RMSE using a Kolmogorov–Smirnov goodness of fit test; the normality was confirmed under all flight conditions. Statistical differences were confirmed by two-sided paired t-tests, and a significant difference was observed in all cases (p < 0.05). The RMSE was calculated to clarify the error between the estimated tree height and measured value at the survey site. Figure 9 shows the RMSE of the estimated tree height results by each SfM software. The RMSE was 5–6 m, and the rRMSE was 20–28% for all SfM software packages. Therefore, the tree height estimations were not accurately obtained from any of the SfM software packages. The RMSE of Pix4Dmapper under 12 flight conditions with flight altitudes of 100, 120, and 140 m exhibited low values (high accuracy), followed by PhotoScan and Terra Mapper. In addition, the RMSEs of Pix4Dmapper were low, even at flight altitudes of 80 and 60 m. While the results for the RMSE index were good, the RMSE of Pix4Dmapper was relatively better.

4. Discussion

At low flight altitudes, the image processing results tended to differ depending on the SfM software. If the degree of overlap in the photography was low (the number of images was small), incomplete images were generated in each SfM software. For the degree of overlap in the photography, the user manuals [52,53,54] and previous studies [25] recommend setting a high overlap and side overlap and to increase the number of aerial images taken. Therefore, the degree of overlap in the photography showed the same tendency in each SfM software as in previous surveys and manuals. Therefore, we speculate that all of the software is based on fundamental photogrammetry principles. Under similar flight conditions, the number of densified point clouds and tie points in the generated images differed significantly depending on the SfM software. When the number of tie points is large, the number of densified point clouds is also large. However, no significant difference in the resolution of the generated images was observed. The resolution of the generated images is a function of the sensor size, focal length, and flight height, not depending on the software solution. Therefore, low altitude is recommended for the image resolution in all SfM software. Based on the results from all of the SfM software packages, the resolution of the generated images was high compared to the resolution of the aerial photographs taken by aircraft. High-resolution data [9,10,11,12,13,14] was acquired from all SfM software packages, which is one of the advantages of UAVs. In addition, this study was not able to utilize the same PC to run the three SfM software processes due to capacity issues. SfM processing depends on the CPU and GPU of the PC, which may affect the reproducibility and repeatability of the results. However, the estimated values of all SfM software tended to be underestimated compared to the measured values. In addition, the generated images were similar to the results of previous studies [31,42,43,44,48], which used different SfM software. Therefore, although the SfM process was performed using different PCs, the results of this study show little influence.
The estimated values of the tree crown area and tree height varied depending on the SfM software used. However, the task of estimation was easy because a high-resolution image had already been generated by all SfM software packages. In addition, for the surrounding road network or relatively “sparse” forests, such as the survey site in this study, the target trees can be easily identified. However, in contrast to the survey site in this study, we predict that identifying trees in “dense” stands or stands where there are no landmarks near the site will be difficult. Therefore, as “dense” forests are complex structures, we speculate that there will be variations in the estimated values and difficulties with the identification of individual trees.
In addition, verification of the estimated values of the canopy area and tree height revealed that there are differences in the estimated values depending on the SfM software. The estimated value of the tree height tends to be underestimated when compared with the measured value; the verification of the estimated value and the measured value showed a difference in many flight conditions. The RMSE of the estimated tree height in Kobayashi [57] without using GCP was 1.6–7.1 m, which may be higher than that of this study. Therefore, the results of the analysis without GCP were not significantly different from the RMSE values reported in previous studies [57]. However, for the evaluation of the estimated values of the tree height based on the RMSE and rRMSE, we could not obtain an estimate close to the measured value with any of the SfM software packages. Moreover, it is also possible that the estimated tree height at the site is inaccurate. Estimation using Vertex may result in estimation error, i.e., depending on the experience and skill of the measurer [16,58]. However, as this study represents only a single case, we did not investigate the cause of the estimation error in each SfM software. Although the estimations had low accuracy, a statistically significant difference was confirmed among the values obtained from different SfM software packages.
Based on the results of this study, the results of the SfM processing of the aerial images and image generation were not entirely different when using Pix4Dmapper and PhotoScan. By setting the image duplication rate to 90% or more in any SfM software, there was no difference in the results of image SfM processing and image generation. In addition, PhotoScan was superior in terms of image processing while Pix4Dmapper was superior in terms of forest information estimation. The analysis of different SfM software packages in previous studies has shown that PhotoScan is superior for image generation [31,42,43,48]. In addition, Villanueva et al. [44] found that the DSM obtained with Pix4Dmapper was slightly more accurate than that obtained with PhotoScan. Therefore, we consider that the results of the analysis by the SfM software showed the same tendency as some previous studies. However, it is difficult to recommend one SfM software over another as this selection depends on a number of other factors. The three SfM software packages have different characteristics (e.g., the functions and operation performances built into the SfM software), and commercial SfM software incurs an initial cost. There are also other issues, such as the availability of experienced staff members and the large capacity of computational resources required, that affect the complete utilization of an SfM technology [59]. Furthermore, many UAV and camera models are available, and it is impossible to set the exact flight parameters under the same conditions. Many factors can also impact SfM processing as has been pointed out in many studies [9,23,24], such that this is considered an immutable matter. At present, owing to the development of UAV and SfM technology, more SfM software packages are available that can utilize the SfM technology. Therefore, as each SfM software has different advantages and disadvantages, we must identify and introduce suitable SfM software for different applications [16,41]. Although the estimation accuracy of any SfM was low, the estimated tree height by Pix4D in many flight conditions had smaller RMSE values than the other software. As statistically significant differences were found between the SfMs in many flight conditions, we conclude that there were differences in the estimates of crown area and tree height depending on the SfM used. Based on the results of this study, we consider that Pix4Dmapper is suitable for estimating forest information, such as tree height, while PhotoScan is suitable for the detailed monitoring of disaster areas.
Identifying the cause of the difference in the results from the three SfM software packages was difficult because each SfM software algorithm was similar to a black box; the processing steps and methods for setting the processing parameters were all different [26,37,38,40,41]. We summarize the image processing results and important observations and issues when using UAV and SfM technology in forests.
Image processing may be affected by the image processing parameters. Previous studies have reported that the result of image processing changes when the parameters of image processing are changed [48,49]. In this study, we conducted a survey using the recommended and default values of the parameters; however, we cannot judge whether they lead to the same image processing. The type of image processing being performed becomes clear at each step of the software’s SfM processing. However, as the processing parameters are marked as “high” and “low,” it is challenging to assess their impact. We speculate that users will, in many cases, adopt the default values. In particular, it may be difficult for SfM software users, whose native language is different from the language of the user manual, to understand the details and set parameters. In addition, we speculate that few users will understand the details of SfM software in the case of forestry enterprises. For this reason, we suggest that it is necessary to verify the impact of various parameters and accumulate a database of knowledge for SfM software that can be used in the future. The reasons for the estimates not being similar to the measured value (when the RMSE value is high) and the differences between the estimated values can be attributed to image distortion due to wind, light, and the GCP. These factors likely contributed to insufficient SfM processing, which resulted in inaccurate estimations. In this study, we did not analyze these as parameters, but we considered their effects.
GCP is often used in field surveys that utilize UAVs and SfM. However, in this study, simple image processing was performed based on the GPS information of the image without GCP. Previous studies have confirmed that the horizontal and vertical accuracy increases with the number of GCPs [3]; in terms of the accuracy, increasing the number of GCPs and their regular spatial distribution has a positive effect [60]. Therefore, image processing can be considered insufficient without GCPs. However, there are many restrictions in forest areas, and the places where GCPs can be installed tend to be limited. Installing GCPs in open areas facing the sky at two or more locations is standard practice [61]. However, from a practical perspective, a simple increase in the number of GCPs renders the survey more labor-intensive and less effective, particularly in forests where the application of GNSS for GCP estimations is complicated [60]. Due to the dense canopy and surrounding terrain, it was difficult to receive accurate GPS information for the site [19]. Therefore, the user must consider the estimation accuracy and final product to be obtained, as well as the manner in which to appropriately determine whether a GCP needs to be installed. We must also examine the arrangement and the optimal number of GCPs in forests for accurate results.
The weather at the time of the survey was mild; however, in some cases, the wind disturbed the trees. In addition, over-exposure of the generated images may have been a consequence of sunlight on the aerial images. Previous studies have pointed out that meteorological conditions (especially wind and light intensities) can cause image artifacts and errors in processing, which can affect the quality of the generated images [18,23,62,63]. Therefore, experiments in strong light should be avoided and, if possible, images should be acquired on a cloudy day when the wind speed is low, or when the influence of wind is at a minimum [23,59,64]. In this study, we targeted complex forests, which are significantly affected by meteorological conditions. Therefore, we can assume that the image processing results were also significantly affected. In addition, weather conditions, especially bad weather, such as strong winds and rain, may cause the aircraft to malfunction or crash. Hence, vigilance of the weather conditions during the survey is necessary.

5. Conclusions

The purpose of this study was to examine the results of image processing and estimations of the tree height and tree crown area using three different SfM software on aerial images from a small survey site. Although this study is a single example, we can infer from our results that the processing of aerial images and estimation of the tree height and crown area tend to differ depending on the SfM software used. A previous study [49] analyzed the effects of different flight conditions (flight altitude, side overlap, and overlap); in this study, we examined the effect of different SfM software on the estimated values. A previous study pointed out that the optimal flight conditions are not known when utilizing UAV and SfM in a forest survey [25]. In addition, unifying the flight parameters when capturing UAV images is difficult. There is a substantial scope for future research as studies can explore various types of equipment and factors, such as diagonal images [32,65], tree species, and camera models. Therefore, in the future, carrying out verifications using various flight parameters at multiple test sites and accumulating a database of knowledge will be necessary.

Author Contributions

Conceptualization, S.K.; formal analysis, S.K.; investigation, S.K.; methodology, S.K.; writing—original draft, S.K. and K.S.; writing—review and editing, S.K. and K.S. All authors have read and agreed to the published version of the manuscript.

Funding

Part of this study was supported by a large research grant from the College of Bioresource Sciences, Nihon University, from fiscal year 2016 to fiscal year 2018.

Institutional Review Board Statement

Not applicable.

Informed Consent Statement

Not applicable.

Data Availability Statement

The data presented in this study are available on request from the corresponding author.

Conflicts of Interest

The authors declare no conflict of interest.

References

  1. Wallace, L.; Lucieer, A.; Malenovský, Z.; Turner, D.; Vopěnka, P. Assessment of forest structure using two UAV techniques: A comparison of airborne laser scanning and structure from motion (SfM) point clouds. Forests 2016, 7, 62. [Google Scholar] [CrossRef] [Green Version]
  2. Mohan, M.; Silva, C.A.; Klauberg, C.; Jat, P.; Catts, G.; Cardil, A.; Hudak, A.T.; Dia, M. Individual Tree Detection from Unmanned Aerial Vehicle (UAV) Derived Canopy Height Model in an Open Canopy Mixed Conifer Forest. Forests 2017, 8, 340. [Google Scholar] [CrossRef] [Green Version]
  3. Guerra-Hernández, J.; González-Ferreiro, E.; Monleón, V.J.; Faias, S.; Tomé, M.; Díaz-Varela, R. Use of Multi-Temporal UAV-Derived Imagery for Estimating Individual Tree Growth in Pinus pinea Stands. Forests 2017, 8, 300. [Google Scholar] [CrossRef]
  4. Bagaram, M.B.; Giuliarelli, D.; Chirici, G.; Giannetti, F.; Barbati, A. UAV Remote Sensing for Biodiversity Monitoring: Are Forest Canopy Gaps Good Covariates? Remote Sens. 2018, 10, 1397. [Google Scholar]
  5. Li, J.; Yang, B.; Cong, Y.; Cao, L.; Fu, X.; Dong, Z. 3D forest mapping using a low-cost UAV laser scanning system: Investigation and comparison. Remote Sens. 2019, 11, 717. [Google Scholar] [CrossRef] [Green Version]
  6. Durfee, N.; Ochoa, C.; Mata-Gonzalez, R. The Use of Low-Altitude UAV Imagery to Assess Western Juniper Density and Canopy Cover in Treated and Untreated Stands. Forests 2019, 10, 296. [Google Scholar] [CrossRef] [Green Version]
  7. González-Jaramillo, V.; Fries, A.; Bendix, J. AGB Estimation in a Tropical Mountain Forest (TMF) by Means of RGB and Multispectral Images Using an Unmanned Aerial Vehicle (UAV). Remote Sens. 2019, 11, 1413. [Google Scholar] [CrossRef] [Green Version]
  8. Nuijten, R.; Coops, N.; Goodbody, T.; Pelletier, G. Examining the Multi-Seasonal Consistency of Individual Tree Segmentation on Deciduous Stands Using Digital Aerial Photogrammetry (DAP) and Unmanned Aerial Systems (UAS). Remote Sens. 2019, 11, 739. [Google Scholar] [CrossRef] [Green Version]
  9. Jayathunga, S.; Owari, T.; Tsuyuki, S. Evaluating the Performance of Photogrammetric Products Using Fixed-Wing UAV Imagery over a Mixed Conifer-Broadleaf Forest: Comparison with Airborne Laser Scanning. Remote Sens. 2018, 10, 187. [Google Scholar] [CrossRef] [Green Version]
  10. Tang, L.; Shao, G. Drone remote sensing for forestry research and practices. Int. J. For. Res. 2015, 26, 791–797. [Google Scholar] [CrossRef]
  11. Torresan, C.; Berton, A.; Carotenuto, F.; Di Gennaro, S.F.; Gioli, B.; Matese, A.; Miglietta, F.; Vagnoli, C.; Zaldei, A.; Wallace, L. Forestry applications of UAVs in Europe: A review. Int. J. Remote Sens. 2017, 38, 2427–2447. [Google Scholar] [CrossRef]
  12. Guimarães, N.; Pádua, L.; Marques, P.; Silva, N.; Peres, E.; Sousa, J.J. Forestry Remote Sensing from Unmanned Aerial Vehicles: A Review Focusing on the Data, Processing and Potentialities. Remote Sens. 2020, 12, 1046. [Google Scholar] [CrossRef] [Green Version]
  13. Obanawa, H.; Hayakawa, Y.; Gomez, Y. 3D Modelling of inaccessible areas using UAV-based aerial photography and structure from motion. Transact. Jpn. Geomorphol. Union 2014, 35, 283–294. [Google Scholar]
  14. Murakami, T. Forest Remote Sensing Using UAVs. J. Remote Sens. Soc. Jpn. 2018, 38, 258–265. [Google Scholar]
  15. He, H.; Yan, Y.; Chen, T.; Cheng, P. Tree height estimation of forest plantation in mountainous terrain from bare-earth points using a DoG-coupled radial basis function neural network. Remote Sens. 2019, 11, 1271. [Google Scholar] [CrossRef] [Green Version]
  16. Ganz, S.; Käber, Y.; Adler, P. Measuring Tree Height with Remote Sensing—A Comparison of Photogrammetric and LiDAR Data with Different Field Measurements. Forests 2019, 10, 694. [Google Scholar] [CrossRef] [Green Version]
  17. Krause, S.; Sanders, T.G.; Mund, J.P.; Greve, K. UAV-Based Photogrammetric Tree Height Measurement for Intensive Forest Monitoring. Remote Sens. 2019, 11, 758. [Google Scholar] [CrossRef] [Green Version]
  18. Panagiotidis, D.; Abdollahnejad, A.; Surový, P.; Chiteculo, V. Determining tree height and crown diameter from high-resolution UAV imagery. Int. J. Remote Sens. 2017, 38, 2392–2410. [Google Scholar] [CrossRef]
  19. Iizuka, K.; Yonehara, T.; Itoh, M.; Kosugi, Y. Estimating Tree Height and Diameter at Breast Height (DBH) from Digital Surface Models and Orthophotos Obtained with an Unmanned Aerial System for a Japanese Cypress (Chamaecyparis obtusa) Forest. Remote Sens. 2018, 10, 13. [Google Scholar] [CrossRef] [Green Version]
  20. Birdal, A.C.; Avdan, U.; Turk, T. Estimating tree heights with images from an unmanned aerial vehicle. Geomat. Nat. Hazards Risk 2017, 8, 1144–1156. [Google Scholar] [CrossRef] [Green Version]
  21. Sothe, C.; Dalponte, M.; de Almeida, C.M.; Schimalski, M.B.; Lima, C.L.; Liesenberg, V.; Miyoshi, G.T.; Tommaselli, A.M.G. Tree Species Classification in a Highly Diverse Subtropical Forest Integrating UAV-Based Photogrammetric Point Cloud and Hyperspectral Data. Remote Sens. 2019, 11, 1338. [Google Scholar] [CrossRef] [Green Version]
  22. Fujimoto, A.; Haga, C.; Matsui, T.; Machimura, T.; Hayashi, K.; Sugita, S.; Takagi, H. An End to End Process Development for UAV-SfM Based Forest Monitoring: Individual Tree Detection, Species Classification and Carbon Dynamics Simulation. Forests 2019, 10, 680. [Google Scholar] [CrossRef] [Green Version]
  23. Tmušić, G.; Manfreda, S.; Aasen, H.; James, M.R.; Gonçalves, G.; Ben Dor, E.; Brook, A.; Polinova, M.; Arranz, J.J.; Mészáros, J.; et al. Current Practices in UAS-based Environmental Monitoring. Remote Sens. 2020, 12, 1001. [Google Scholar] [CrossRef] [Green Version]
  24. Huang, H.; He, S.; Chen, C. Leaf Abundance Affects Tree Height Estimation Derived from UAV Images. Forests 2019, 10, 931. [Google Scholar] [CrossRef] [Green Version]
  25. Dandois, J.P.; Olano, M.; Ellis, E. Optimal Altitude, Overlap, and Weather Conditions for Computer Vision UAV Estimates of Forest Structure. Remote Sens. 2015, 7, 13895–13920. [Google Scholar] [CrossRef] [Green Version]
  26. Ewertowski, M.W.; Tomczyk, A.M.; Evans, D.J.A.; Roberts, D.H.; Ewertowski, W. Operational Framework for Rapid, Very-high Resolution Mapping of Glacial Geomorphology Using Low-cost Unmanned Aerial Vehicles and Structure-from-Motion Approach. Remote Sens. 2019, 11, 65. [Google Scholar] [CrossRef] [Green Version]
  27. Ministry of Land, Infrastructure, Transport and Tourism. Guidelines for Safe Flight of Unmanned Aerial Vehicles (Drones, Radio-Controlled Vehicles, etc.). Available online: https://www.mlit.go.jp/common/001303818.pdf (accessed on 17 September 2019).
  28. Domingo, D.; Ørka, H.O.; Næsset, E.; Kachamba, D.; Gobakken, T. Effects of UAV Image Resolution, Camera Type, and Image Overlap on Accuracy of Biomass Predictions in a Tropical Woodland. Remote Sens. 2019, 11, 948. [Google Scholar] [CrossRef] [Green Version]
  29. Seifert, E.; Seifert, S.; Vogt, H.; Drew, D.; Aardt, J.V.; Kunneke, A.; Seifert, T. Influence of Drone Altitude, Image Overlap, and Optical Sensor Resolution on Multi-View Reconstruction of Forest Images. Remote Sens. 2019, 11, 1252. [Google Scholar] [CrossRef] [Green Version]
  30. Ni, W.; Sun, G.; Pang, Y.; Zhang, Z.; Liu, J.; Yang, A.; Wang, Y.; Zhang, D. Mapping Three-Dimensional Structures of Forest Canopy Using UAV Stereo Imagery: Evaluating Impacts of Forward Overlaps and Image Resolutions with LiDAR Data as Reference. IEEE J. Sel. Top. Appl. Earth Observ. Remote Sens. 2018, 11, 3578–3589. [Google Scholar] [CrossRef]
  31. Turner, D.; Lucieer, A.; Wallace, L. Direct georeferencing of ultrahigh-resolution UAV imagery. IEEE Trans. Geosci. Remote Sens. 2014, 52, 2738–2745. [Google Scholar] [CrossRef]
  32. Lin, J.; Wang, M.; Ma, M.; Lin, Y. Aboveground Tree Biomass Estimation of Sparse Subalpine Coniferous Forest with UAV Oblique Photography. Remote Sens. 2018, 10, 1849. [Google Scholar] [CrossRef] [Green Version]
  33. Lisein, J.; Pierrot-Deseilligny, M.; Bonnet, S.; Lejeune, P. A Photogrammetric Workflow for the Creation of a Forest Canopy Height Model from Small Unmanned Aerial System Imagery. Forests 2013, 4, 922–994. [Google Scholar] [CrossRef] [Green Version]
  34. Bonnet, S.; Lisein, J.; Lejeune, P. Comparison of UAS photogrammetric products for tree detection and characterization of coniferous stands. Int. J. Remote Sens. 2017, 38, 5310–5337. [Google Scholar] [CrossRef]
  35. Brieger, F.; Herzschuh, U.; Pestryakova, L.A.; Bookhagen, B.; Zakharov, E.S.; Kruse, S. Advances in the Derivation of Northeast Siberian Forest Metrics Using High-Resolution UAV-Based Photogrammetric Point Clouds. Remote Sens. 2019, 11, 1447. [Google Scholar] [CrossRef] [Green Version]
  36. Mlambo, R.; Woodhouse, I.H.; Gerard, F.; Anderson, K. Structure from Motion (SfM) Photogrammetry with Drone Data: A Low Cost Method for Monitoring Greenhouse Gas Emissions from Forests in Developing Countries. Forests 2017, 8, 68. [Google Scholar] [CrossRef] [Green Version]
  37. Chikatsu, H.; Odaka, A.; Yanagi, H.; Yokoyama, H. Performance Evaluation of 3D Modeling Software for UAV Photogrammetry. J. Jpn. Soc. Photogram. Remote Sens. 2016, 55, 117–127. [Google Scholar]
  38. Sugai, S.; Miyaji, K.; Nakamura, T.; Minami, H.; Tachibana, K. Accuracy verification of photogrammetry using UAV. J. Geospat. Inf. Auth. Jpn. 2017, 129, 147–157. [Google Scholar]
  39. Ueno, Y. Feasibility study and application of three-dimensional aerial photogrammetry technology using unmanned aerial vehicle (UAV) to natural environmental measurements. Ecol. Civ. Eng. 2016, 19, 91–100. [Google Scholar] [CrossRef] [Green Version]
  40. Woodget, A.S.; Austrums, R.; Maddock, I.P.; Habit, E. Drones and digital photogrammetry: From classifications to continuums for monitoring river habitat and hydromorphology. Wiley Interdiscip. Rev. Water 2017, 4, e1222. [Google Scholar] [CrossRef] [Green Version]
  41. Forsmoo, J.; Anderson, K.; Macleod, C.J.A.; Wilkinson, M.E.; DeBell, L.; Brazier, R.E. Structure from motion photogrammetry in ecology: Does the choice of software matter? Ecol. Evol. 2019, 9, 12964–12979. [Google Scholar] [CrossRef]
  42. Kitagawa, E.; Muraki, H.; Yoshinaga, K.; Yamagishi, J.; Tsumura, Y. Research on Shape Characteristic of 3D Modeling Software (SfM/MVS) in UAV Aerial Images. J. Jpn. Soc. Civ. Eng. 2018, 74, 143–148. [Google Scholar] [CrossRef]
  43. Sona, G.; Pinto, L.; Pagliari, D.; Passoni, D.; Gini, R. Experimental analysis of different software packages for orientation and digital surface modelling from UAV images. Earth Sci. Inform. 2014, 7, 97–107. [Google Scholar] [CrossRef]
  44. Escobar Villanueva, J.R.; Iglesias Martínez, L.; Pérez Montiel, J.I. DEM Generation from Fixed-Wing UAV Imaging and LiDAR-Derived Ground Control Points for Flood Estimations. Sensors 2019, 19, 3205. [Google Scholar] [CrossRef] [PubMed] [Green Version]
  45. Jaud, M.; Passot, S.; Le Bivic, R.; Delacourt, C.; Grandjean, P.; Le Dantec, N. Assessing the accuracy of high resolution digital surface models computed by PhotoScan® and MicMac® in sub-optimal survey conditions. Remote Sens. 2016, 8, 465. [Google Scholar] [CrossRef] [Green Version]
  46. Benassi, F.; Dall’Asta, E.; Diotri, F.; Forlani, G.; Morra di Cella, U.; Roncella, R.; Santise, M. Testing accuracy and repeatability of UAV blocks oriented with gnss-supported aerial triangulation. Remote Sens. 2017, 9, 172. [Google Scholar] [CrossRef] [Green Version]
  47. Casella, V.; Chiabrando, F.; Franzini, M.; Manzino, A.M. Accuracy Assessment of A UAV Block by Different Software Packages, Processing Schemes and Validation Strategies. ISPRS Int. J. Geo Inf. 2020, 9, 164. [Google Scholar] [CrossRef] [Green Version]
  48. Fraser, B.T.; Congalton, R.G. Issues in Unmanned Aerial Systems (UAS) data collection of complex forest environments. Remote Sens. 2018, 10, 908. [Google Scholar] [CrossRef] [Green Version]
  49. Kameyama, S.; Sugiura, K. Estimating Tree Height and Volume Using Unmanned Aerial Vehicle Photography and SfM Technology, with Verification of Result Accuracy. Drones 2020, 4, 19. [Google Scholar] [CrossRef]
  50. DJI. Phantom3 Advanced User Manual (Japanese Version) V1.2. Available online: https://dl.djicdn.com/downloads/phantom_3/jp/Phantom_3_Advanced_User_Manual_v1.2_jp_160406.pdf (accessed on 17 November 2018).
  51. DJI GS PRO User Manual (Japanese Version) V2.0. Available online: https://dl.djicdn.com/downloads/groundstation_pro/JP/GS_Pro_User_Manual_v2.0_JP_201811.pdf (accessed on 17 November 2018).
  52. Terra Mapper User Manual. Available online: https://drive.google.com/drive/folders/1s5oVb7JpCEomynYx6vLoYrI4CC15CLEx (accessed on 2 April 2020).
  53. Agisoft Metashape User Manual. Professional Edition, Version 1.6. Available online: https://www.agisoft.com/pdf/metashape-pro_1_6_en.pdf (accessed on 2 April 2020).
  54. Pix4Dmapper 4.1 User Manual. Available online: https://support.pix4d.com/hc/en-us/articles/204272989-Offline-Getting-Started-and-Manual-pdf (accessed on 2 April 2020).
  55. Geospatial Information Authority of Japan. The Manual for Public Survey Using UAV (Proposed) March 2017 Version. Available online: https://www.gsi.go.jp/common/000186712.pdf (accessed on 7 October 2018).
  56. Ministry of Agriculture, Forestry and Fisheries. The 2014 Survey on Disaster Countermeasures in Watersheds and Mountainous Areas (A Study on Driftwood Countermeasures) Commissioned Project Report 3. Examination of Methods to Assess Landslide Prevention Function of Forests and Risk of Driftwood. Available online: http://www.maff.go.jp/j/budget/yosan_kansi/sikkou/tokutei_keihi/seika_h26/ippan/pdf/ippan263_03.pdf (accessed on 7 October 2018).
  57. Kobayashi, H. Automated aerial shooting, counting tree numbers and measuring tree heights for Sugi stands with a UAV. Chubu For. Res. 2019, 67, 57–60. [Google Scholar]
  58. Wada, Y. Case Study of Forest Inventory using Drone for Deforestation and Forest Degradation Monitoring. J. Jpn. Soc. Photogram. Remote Sens. 2017, 56, 191–195. [Google Scholar] [CrossRef]
  59. Gülci, S. The determination of some stand parameters using SfM-based spatial 3D point cloud in forestry studies: An analysis of data production in pure coniferous young forest stands. Environ. Monit. Assess. 2019, 191, 495. [Google Scholar] [CrossRef]
  60. Tomaštík, J.; Mokroš, M.; Surový, P.; Grznárová, A.; Merganič, J. UAV RTK/PPK method-An optimal solution for mapping inaccessible forested areas? Remote Sens. 2019, 11, 721. [Google Scholar] [CrossRef] [Green Version]
  61. Ministry of Agriculture, Forestry and Fisheries. The 2018 “Commissioned Project to Build a System to Improve Efficiency of Methods Such as Harvest Survey in National Forests” UAV Stand Inventory Manual. Available online: http://www.rinya.maff.go.jp/j/gyoumu/gijutu/attach/pdf/syuukaku_kourituka-2.pdf (accessed on 17 September 2019).
  62. Zhang, Y.; Wu, H.; Yang, W. Forests Growth Monitoring Based on Tree Canopy 3D Reconstruction Using UAV Aerial Photogrammetry. Forests 2019, 10, 1052. [Google Scholar] [CrossRef] [Green Version]
  63. Jensen, J.L.R.; Mathews, A.J. Assessment of Image-Based Point Cloud Products to Generate a Bare Earth Surface and Estimate Canopy Heights in a Woodland Ecosystem. Remote Sens. 2016, 8, 50. [Google Scholar] [CrossRef] [Green Version]
  64. Kachamba, D.J.; Ørka, H.O.; Gobakken, T.; Eid, T.; Mwase, W. Biomass Estimation Using 3D Data from Unmanned Aerial Vehicle Imagery in a Tropical Woodland. Remote Sens. 2016, 8, 968. [Google Scholar] [CrossRef] [Green Version]
  65. Vacca, G.; Dessì, A.; Sacco, A. The Use of Nadir and Oblique UAV Images for Building Knowledge. ISPRS Int. J. Geo Inf. 2017, 6, 393. [Google Scholar] [CrossRef] [Green Version]
Figure 1. (a) Location of the survey site. Source Google earth; (b) the general landscape of the survey site. Source [49].
Remotesensing 13 00626 g001
Figure 2. Phantom3 Advanced unmanned aerial vehicle (UAV, or drone). Source [49].
Remotesensing 13 00626 g002
Figure 3. Image processing steps for each SfM software. Note: Terra Mapper is on the left, PhotoScan is in the middle, and Pix4Dmapper is on the right.
Remotesensing 13 00626 g003
Figure 4. The number of tie points for each SfM software.
Remotesensing 13 00626 g004
Figure 5. Number of densified point clouds in the image generated by each SfM software.
Remotesensing 13 00626 g005
Figure 6. Example of the 3D point clouds, orthomosaic images, and DSM images generated by each SfM software.
Remotesensing 13 00626 g006
Figure 7. Estimated value of the crown area from each SfM software package: (a) flight altitude = 60 m; (b) flight altitude = 80 m; (c) flight altitude = 100 m; (d) flight altitude = 120 m; and (e) flight altitude = 140 m.
Remotesensing 13 00626 g007
Figure 8. Comparison of estimated and measured tree heights and regression line for each SfM software.
Remotesensing 13 00626 g008
Figure 9. RMSE (root mean square error) of the estimated tree height results by each SfM software: (a) flight altitude = 60 m; (b) flight altitude = 80 m; (c) flight altitude = 100 m; (d) flight altitude = 120 m; and (e) flight altitude = 140 m.
Remotesensing 13 00626 g009
Table 1. Flight conditions and aerial imaging conditions for the UAV.
ItemValue(s)Condition
Flight altitude (m)60 (GSD: 2.6 cm), 80 (GSD: 3.5 cm), 100 (GSD: 4.3 cm),
120 (GSD: 5.2 cm), 140 (GSD: 6.1 cm)
5
Overlap (%)80, 85, 90, 954
Side overlap (%)80, 85, 90, 954
Flight speed15.0 m/s1
Photography methodHovering1
Total flight conditions80
Note: Source [49]. Added additional information. GSD = ground sample distances of aerial image (i.e., image resolution).
Table 2. Results of image processing by each SfM software.
Overlap–Side OverlapFlight Altitude (m)
(%)6080100120140
TPhPiTPhPiTPhPiTPhPiTPhPi
80–80CBBCBBCBBCBBCBB
80–85CCBCBBCABCABCBB
80–90CAACABBAAAAABAA
80–95AAAAAAAAAAAAAAA
85–80CBBCBBCBBCBBCBB
85–85CBBCBBCBBCBBCBB
85–90BAABAABAAAAAAAA
85–95AAAAAAAAAAAAAAA
90–80CBACBBCBBCBBCBB
90–85BAABAABAABBABBB
90–90AAAAAAAAAAAAAAA
90–95AAAAAAAAAAAAAAA
95–80BAAAABBBAABBABB
95–85BAAAAAAAAAAAABA
95–90AAAAAAAAAAAAAAA
95–95AAAAAAAAAAAAAAA
Note: “A” indicates SfM processing (steps 1 and 2 for Terra Mapper, steps 1 to 3 for PhotoScan, and steps 1 and 2 for Pix4Dmapper (Figure 3)) and image generation (step 3 for Terra Mapper, step 4 for PhotoScan, and step 3 for Pix4Dmapper (Figure 3)), which were completed perfectly in the SfM software, such that the generated images were also perfect. “B” indicates SfM processing (steps 1 and 2 for Terra Mapper, steps 1 to 3 for PhotoScan, and steps 1 and 2 for Pix4Dmapper (Figure 3)) and image generation (step 3 for Terra Mapper, step 4 for PhotoScan, and step 3 for Pix4Dmapper (Figure 3)), which were completed perfectly in the SfM software, but the generated images were not perfect images because some or most of them were missing. “C” indicates that SfM processing (steps 1 and 2 for Terra Mapper, steps 1 to 3 for PhotoScan, and steps 1 and 2 for Pix4Dmapper (Figure 3)) failed in the SfM software. T = Terra Mapper; Ph = PhotoScan; and Pi = Pix4Dmapper.
Table 3. Results of image matching, camera locations error, and reprojection error.
Flight
Conditions
(FA–OL–SL)
Terra MapperPhotoScanPix4Dmapper
NC/NTCLE (m)RE
(pix)
NC/NTCLE (m)RE (pix)NC/NTCLE (m)RE
(pix)
XYZXYZXYZ
60-90-9051 / 530.1350.0970.1090.94853/530.2090.1490.1370.39253/530.1980.1770.3050.155
60-90-9585/850.1140.1220.1280.98285/850.1420.1480.1830.55285/850.1250.1120.1930.163
60-95-9092/930.1330.2520.3240.94293/930.1640.3130.3830.42493/930.1290.1160.1190.155
60-95-95191/1910.1780.5280.4391.066191/1910.2160.5590.5110.822191/1910.1050.0920.1610.191
80-90-9030/320.1140.1090.1470.93732/320.6370.1490.1720.33930/320.2720.2470.4220.126
80-90-9563/630.2060.2040.3891.05763/630.2890.2560.4890.69563/630.1560.1410.2410.175
80-95-9050/500.1570.1640.2000.96450/500.1940.1940.2370.50950/500.1640.1460.2520.141
80-95-9593/930.1420.1540.2401.06793/930.1780.2090.2810.74693/930.1010.0890.1550.18
100-90-9021/210.1760.1380.1220.89821/210.1970.1210.1230.51421/210.2590.230.3980.133
100-90-9541/410.2150.2050.2251.03741/410.2690.2400.2860.72341/410.1720.1560.2670.167
100-95-9036/360.1220.0740.1580.97936/360.1720.1010.2010.59436/360.1590.140.2430.143
100-95-9564/640.1400.1090.2241.05264/640.1750.1410.3080.75164/640.1230.110.1890.174
120-90-9014/140.1070.0900.3461.19714/140.1940.1150.4051.47014/140.5190.4620.7990.172
120-90-9530/300.1310.0710.0951.02230/300.1750.0890.1270.70430/300.1960.1770.3030.163
120-95-9025/250.0970.0830.0980.99325/250.1220.1070.1370.59125/250.2030.1810.3130.14
120-95-9551/510.1160.0740.2171.04751/510.1380.0960.2620.74051/510.1280.1160.1980.164
140-90-9012/120.1060.0860.2831.12812/120.1520.1220.3210.68312/120.4760.440.7450.155
140-90-9526/260.1640.1220.3451.26426/260.1960.1320.4481.28026/260.2630.2390.4070.181
140-95-9021/210.1200.0660.3061.31921/210.1790.0910.3701.25021/210.3330.30.5150.187
140-95-9540/400.1670.0930.4181.22940/400.2100.1210.5121.36040/400.1720.1540.2650.183
Note: FA = flight altitude; OL = overlap; SL = side overlap; NC = number of camera calibrated aerial images; NT = number of taken aerial images; CLE = camera location error; and RE = reprojection error.
Table 4. Statistical results of multiple comparisons of the estimated crown area.
Flight altitude (m)-Overlap (%)-side overlap (%)
60-90-9060-90-9560-95-9060-95-95
TPh0.530.080.03 *0.02 *
TPi0.001 **0.05<0.001 ***0.32
PhPi0.001 **<0.001 ***0.04 *0.99
Flight altitude (m)-Overlap (%)-side overlap (%)
80-90-9080-90-9580-95-9080-95-95
TPh0.009 **0.02 *0.002**<0.001 ***
TPi<0.001 ***0.008 **0.02*<0.001 ***
PhPi0.02 *1<0.001***1
Flight altitude (m)-Overlap (%)-side overlap (%)
100-90-90100-90-95100-95-90100-95-95
TPh0.001 **0.421
TPi<0.001 ***<0.001 ***<0.001 ***
PhPi<0.001 ***<0.001 ***<0.001 ***
Flight altitude (m)-Overlap (%)-side overlap (%)
120-90-90120-90-95120-95-90120-95-95
TPh1<0.001 ***0.003 **<0.001 ***
TPi0.02 *<0.001 ***0.02 *<0.001 ***
PhPi0.07110.22
Flight altitude (m)-Overlap (%)-side overlap (%)
140-90-90140-90-95140-95-90140-95-95
TPh0.005 **<0.001 ***<0.001 ***<0.001 ***
TPi<0.001 ***<0.001 ***<0.001 ***0.28
PhPi<0.001 ***<0.001 ***<0.001 ***1
Note: * = p < 0.05; ** = p < 0.01; *** = p < 0.001; T = Terra Mapper; Ph = PhotoScan; and Pi = Pix4Dmapper.
Table 5. Results of multiple comparisons of estimated tree height between different software.
Flight altitude (m)-Overlap (%)-side overlap (%)
60-90-9060-90-9560-95-9060-95-95
TPh<0.001 ***<0.001 ***<0.001 ***0.02 *
TPi<0.001 ***<0.001 ***0.002 **<0.001 ***
PhPi<0.001 ***<0.001 ***<0.001 ***<0.001 ***
Flight altitude (m)-Overlap (%)-side overlap (%)
80-90-9080-90-9580-95-9080-95-95
TPh<0.001 ***0.006 **<0.001 ***<0.001 ***
TPi<0.001 ***0.3<0.001 ***<0.001 ***
PhPi<0.001 ***<0.001 ***<0.001 ***<0.001 ***
Flight altitude (m)-Overlap (%)-side overlap (%)
100-90-90100-90-95100-95-90100-95-95
TPh0.4<0.001 ***<0.001 ***<0.001 ***
TPi<0.001 ***<0.001 ***<0.001 ***<0.001 ***
PhPi<0.001 ***<0.001 ***<0.001 ***<0.001 ***
Flight altitude (m)-Overlap (%)-side overlap (%)
120-90-90120-90-95120-95-90120-95-95
TPh10.24<0.001 ***1
TPi<0.001 ***<0.001 ***<0.001 ***<0.001 ***
PhPi<0.001 ***<0.001 ***<0.001 ***<0.001 ***
Flight altitude (m)-Overlap (%)-side overlap (%)
140-90-90140-90-95140-95-90140-95-95
TPh<0.001 ***0.34<0.001 ***<0.001 ***
TPi<0.001 ***<0.001 ***<0.001 ***<0.001 ***
PhPi<0.001 ***<0.001 ***<0.001 ***<0.001 ***
Note: * = p < 0.05; ** = p < 0.01; *** = p < 0.001; T = Terra Mapper; Ph = PhotoScan; and Pi = Pix4Dmapper. Table 5 and Table 6 are results from the same analysis, but Table 5 focuses on between software.
Table 6. Results of multiple comparisons using estimated tree height and measured values for each SfM software.
Flight altitude (m)-Overlap (%)-side overlap (%)
60-90-9060-90-9560-95-9060-95-95
MVT<0.001 ***0.005 **0.006 **0.001 **
MVPh<0.001 ***0.002 **<0.001 ***0.002 **
MVPi<0.001 ***<0.001 ***0.01 *0.01 *
Flight altitude (m)-Overlap (%)-side overlap (%)
80-90-9080-90-9580-95-9080-95-95
MVT0.070.02 **0.01 **0.01 *
MVPh0.01 **0.001 **0.003 **0.001 **
MVPi0.290.050.04 **0.13
Flight altitude (m)-Overlap (%)-side overlap (%)
100-90-90100-90-95100-95-90100-95-95
MVT0.02 *<0.001 ***<0.001 ***<0.001 ***
MVPh0.02 *<0.001 ***0.001 **0.001 **
MVPi0.630.01 *0.008 **0.005 **
Flight altitude (m)-Overlap (%)-side overlap (%)
120-90-90120-90-95120-95-90120-95-95
MVT0.002 **<0.001 ***<0.001 ***<0.001 ***
MVPh0.002 **<0.001 ***<0.001 ***<0.001 ***
MVPi10.003 **0.01 *0.004 **
Flight altitude (m)-Overlap (%)-side overlap (%)
140-90-90140-90-95140-95-90140-95-95
MVT0.220.002 **<0.001 ***<0.001 ***
MVPh0.04 *0.002 **<0.001 ***0.001 **
MVPi0.190.080.008 **0.04 *
Note: * = p < 0.05; ** = p < 0.01; and *** = p < 0.001. T = Terra Mapper; Ph = PhotoScan; Pi = Pix4Dmapper; and MV = Measured values. Table 5 and Table 6 show the results from the same analysis, but Table 6 focuses on the software and the measured values.
Publisher’s Note: MDPI stays neutral with regard to jurisdictional claims in published maps and institutional affiliations.

