Water Quality Pollution Control and Watershed Management Based on Community Participation in Maros City, South Sulawesi, Indonesia

 ,
,  and
and
Abstract
:1. Introduction
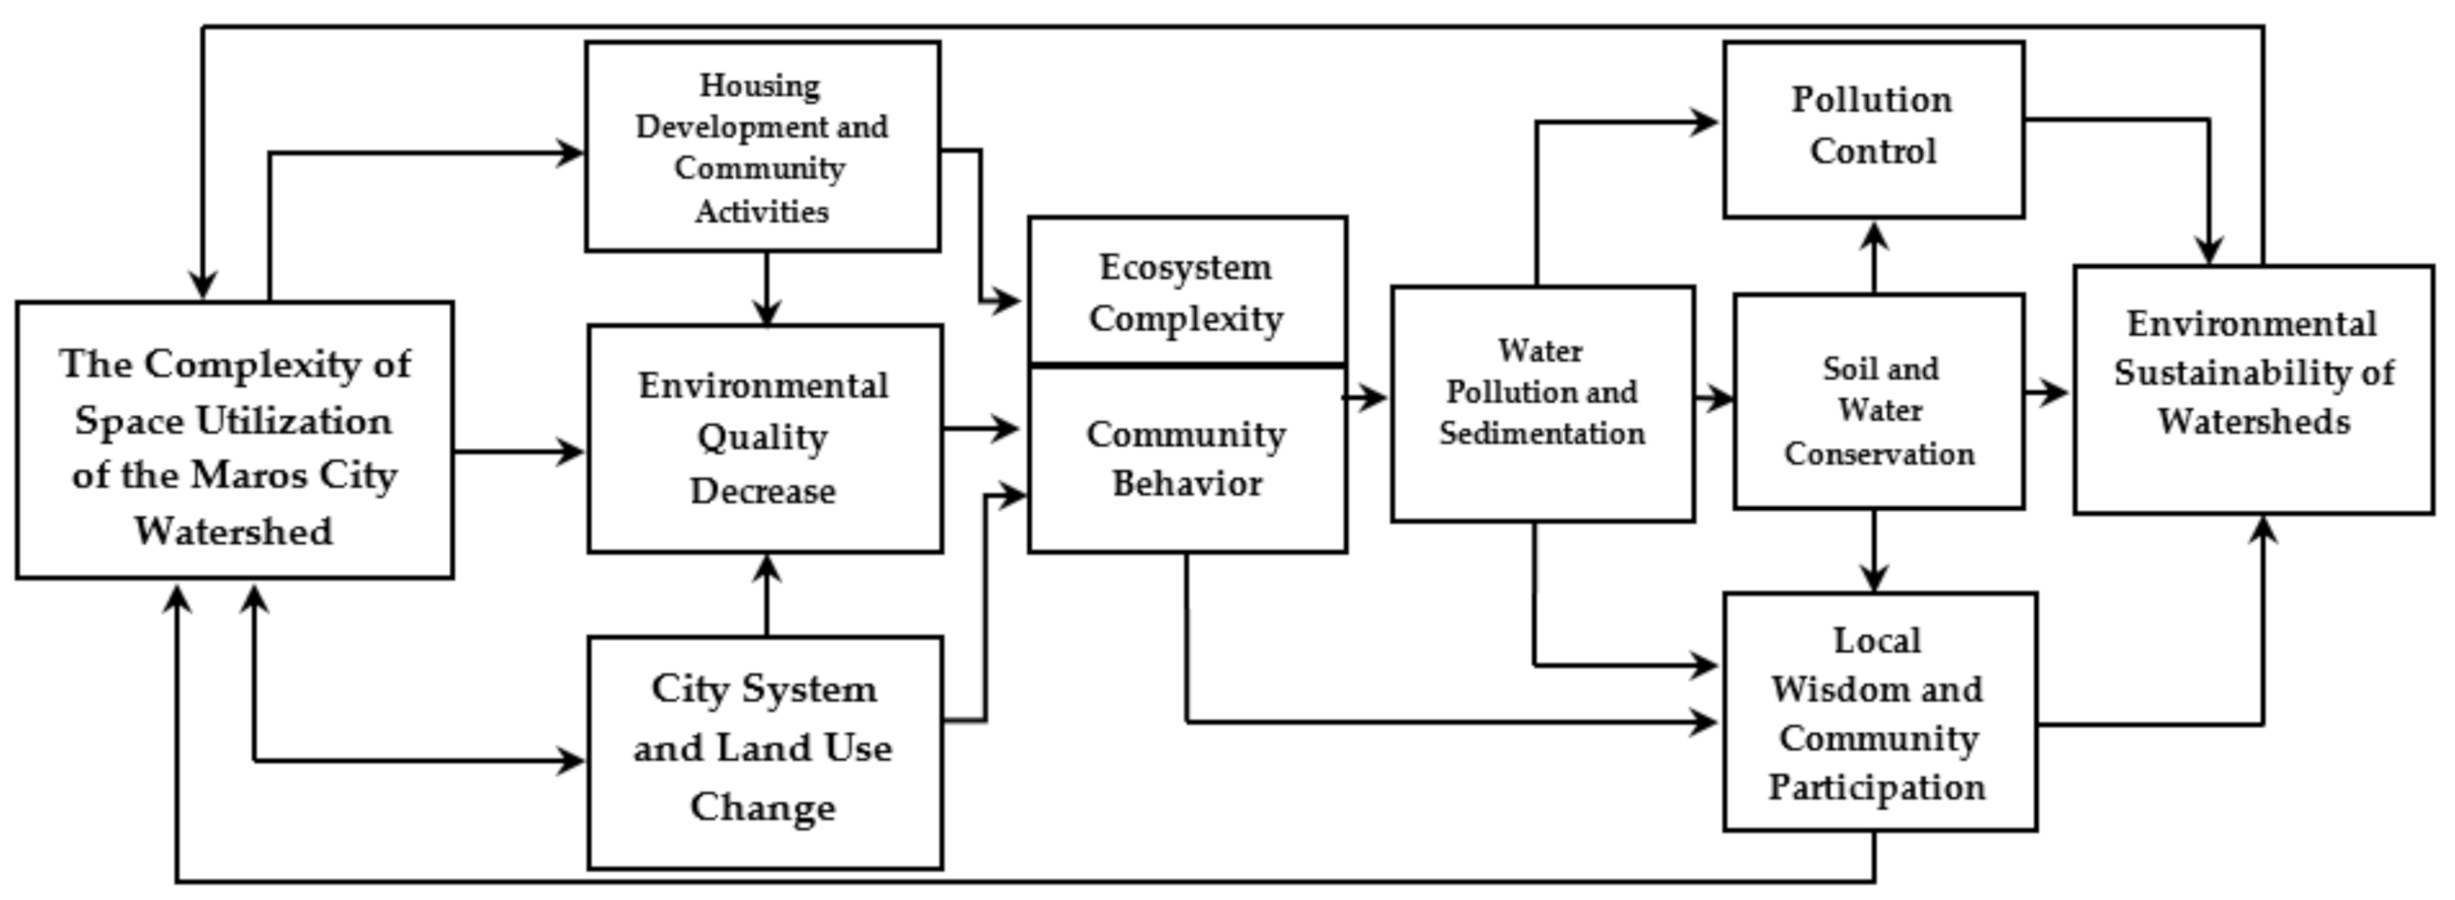
2. Conceptual Framework
2.1. Watershed Conservation Based on Local Wisdom
2.2. Land Use Change and Community Behavior towards the Environment
2.3. Community-Based Watershed Sustainability
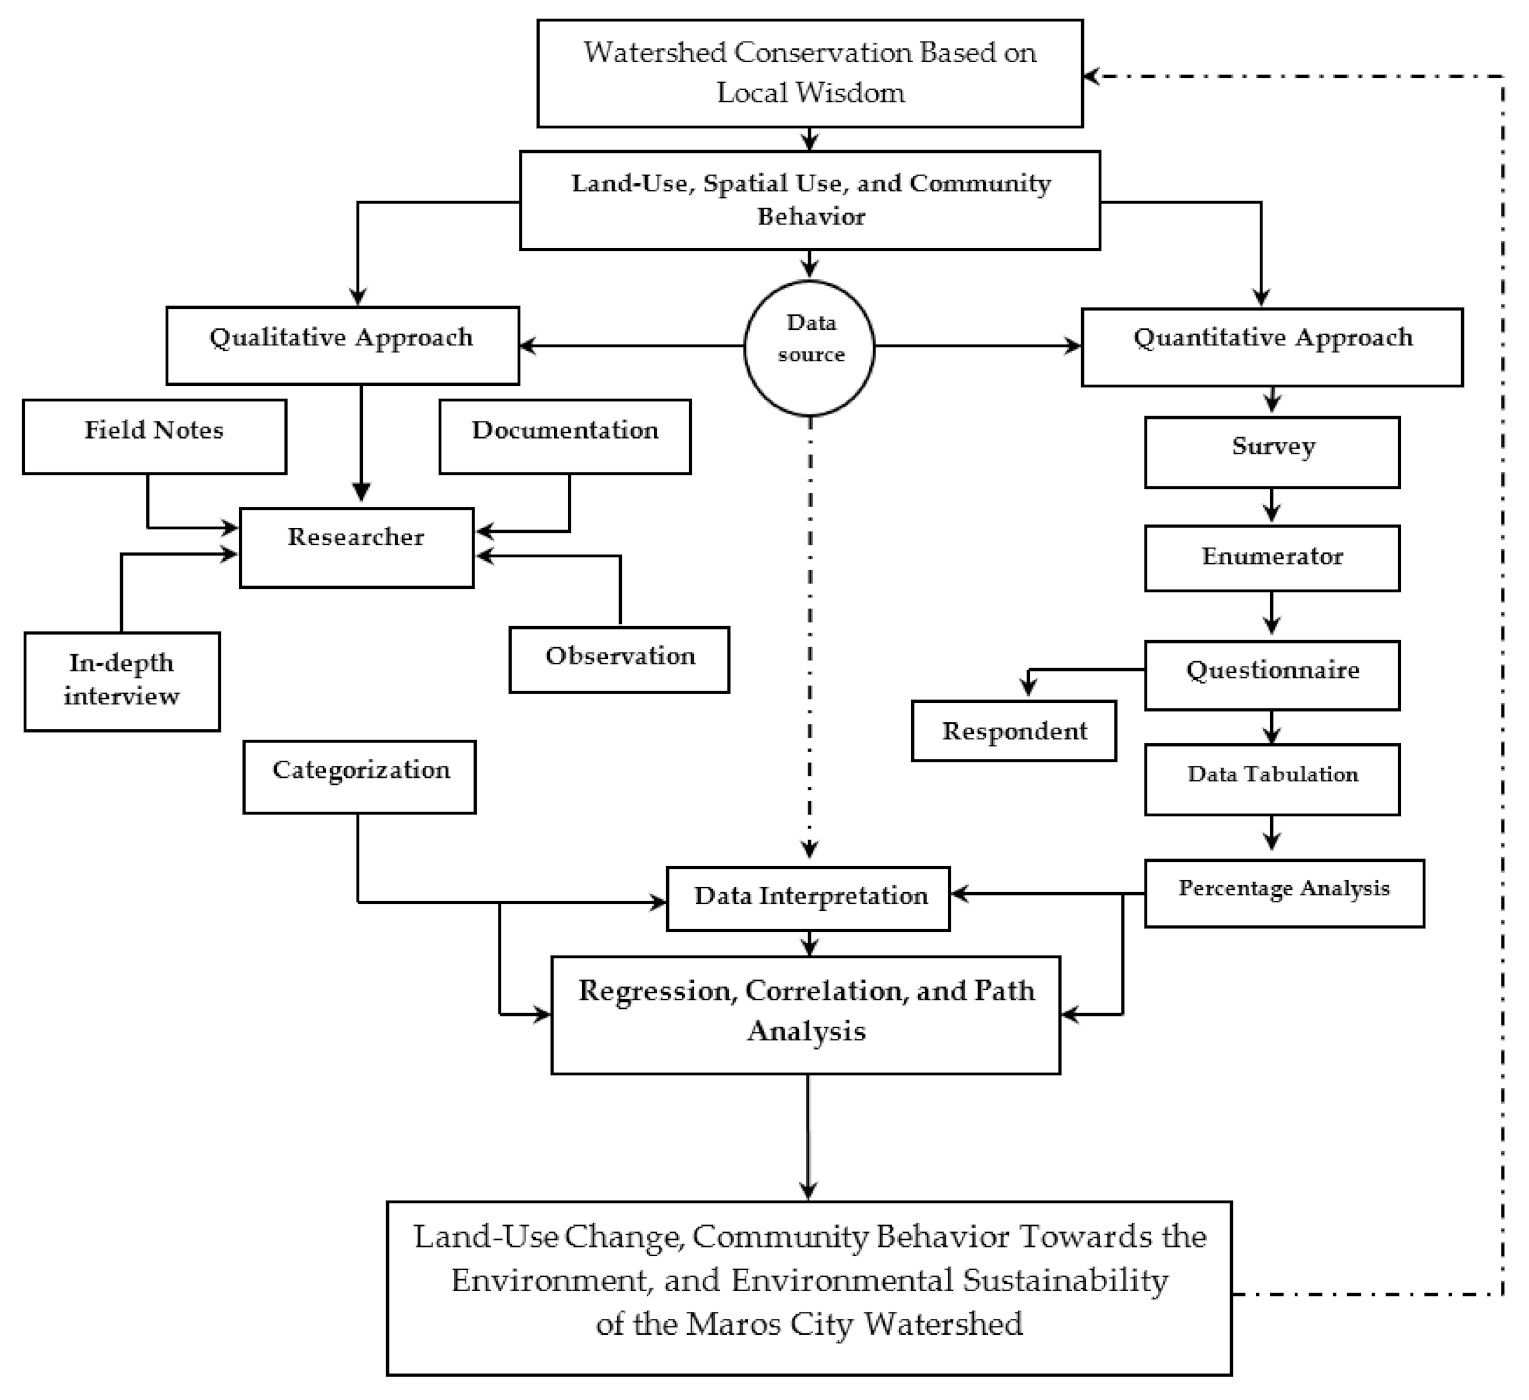
3. Material and Method
3.1. Research Design
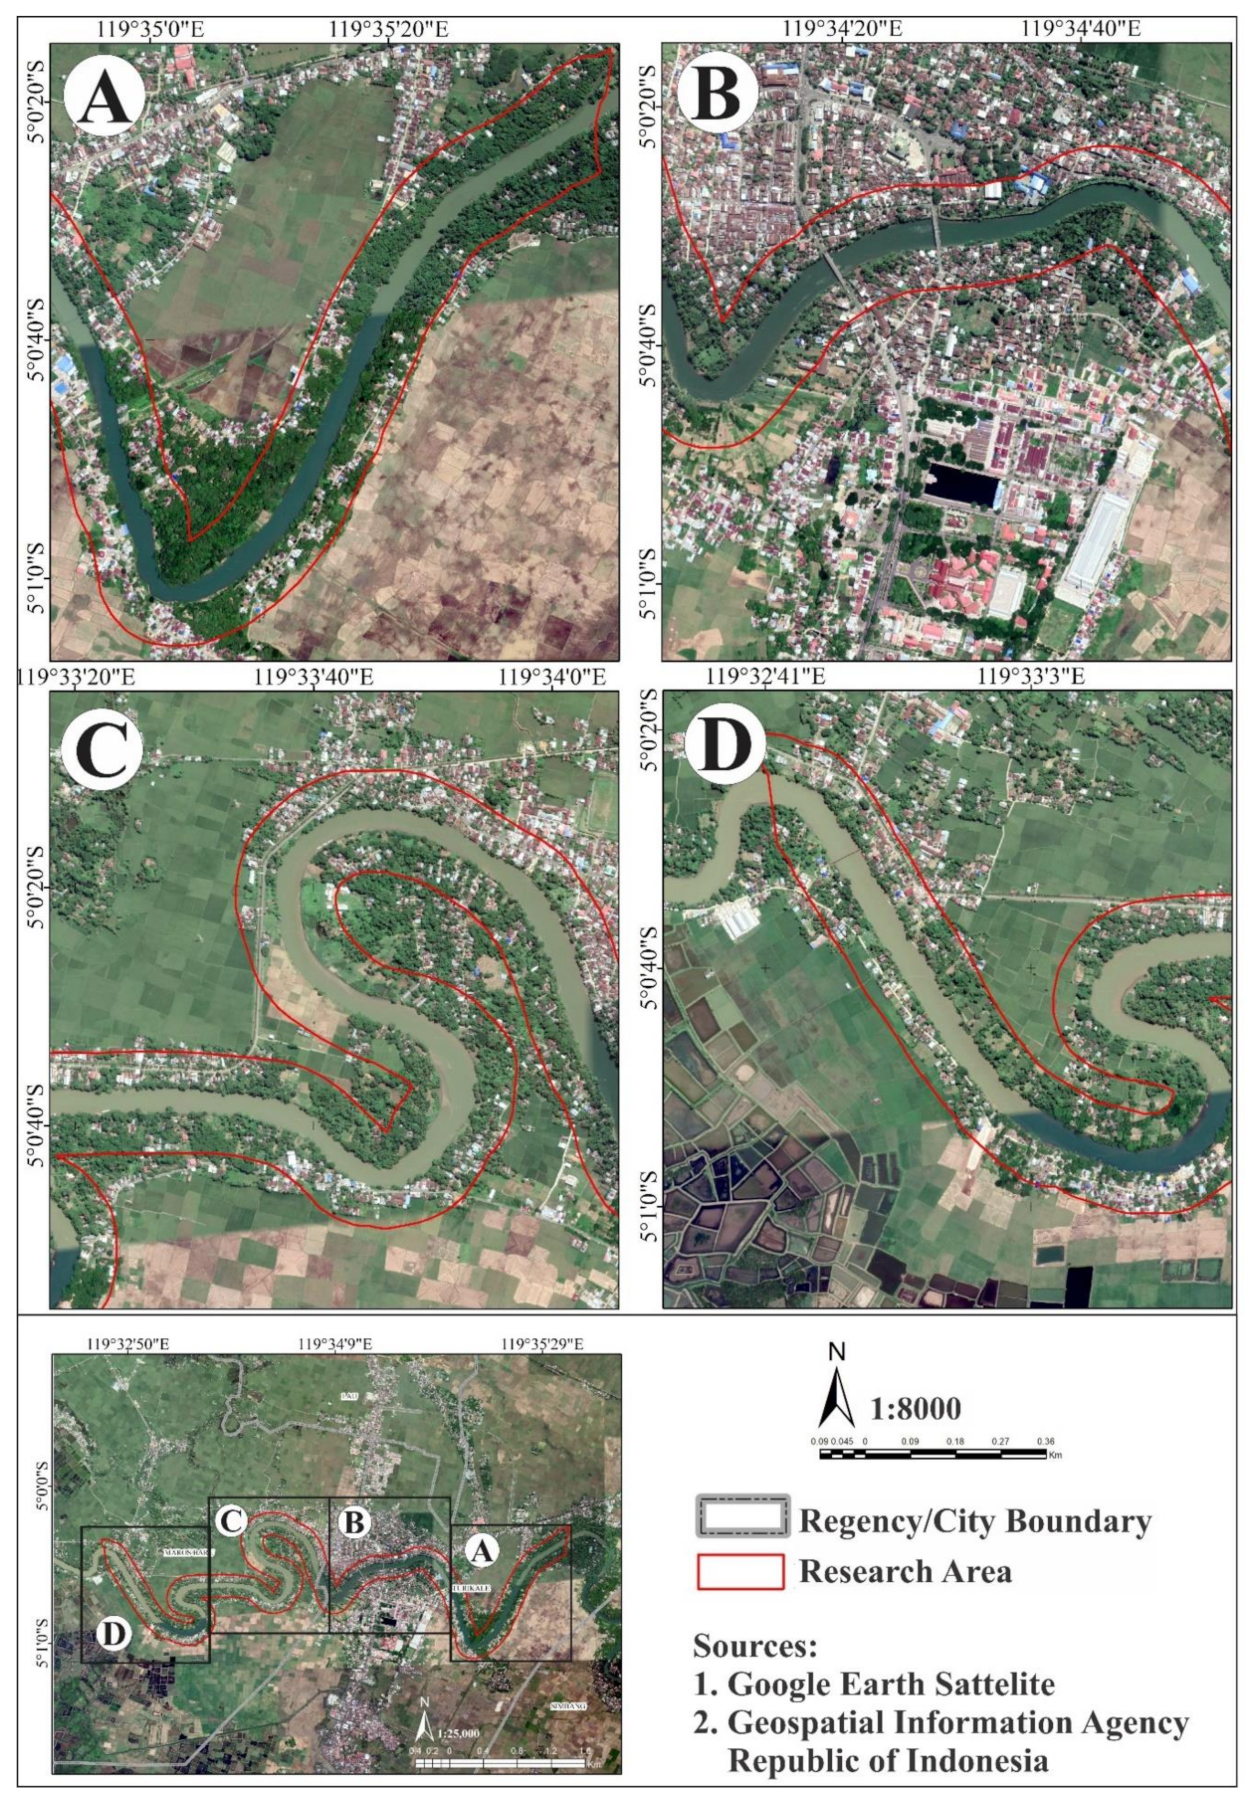
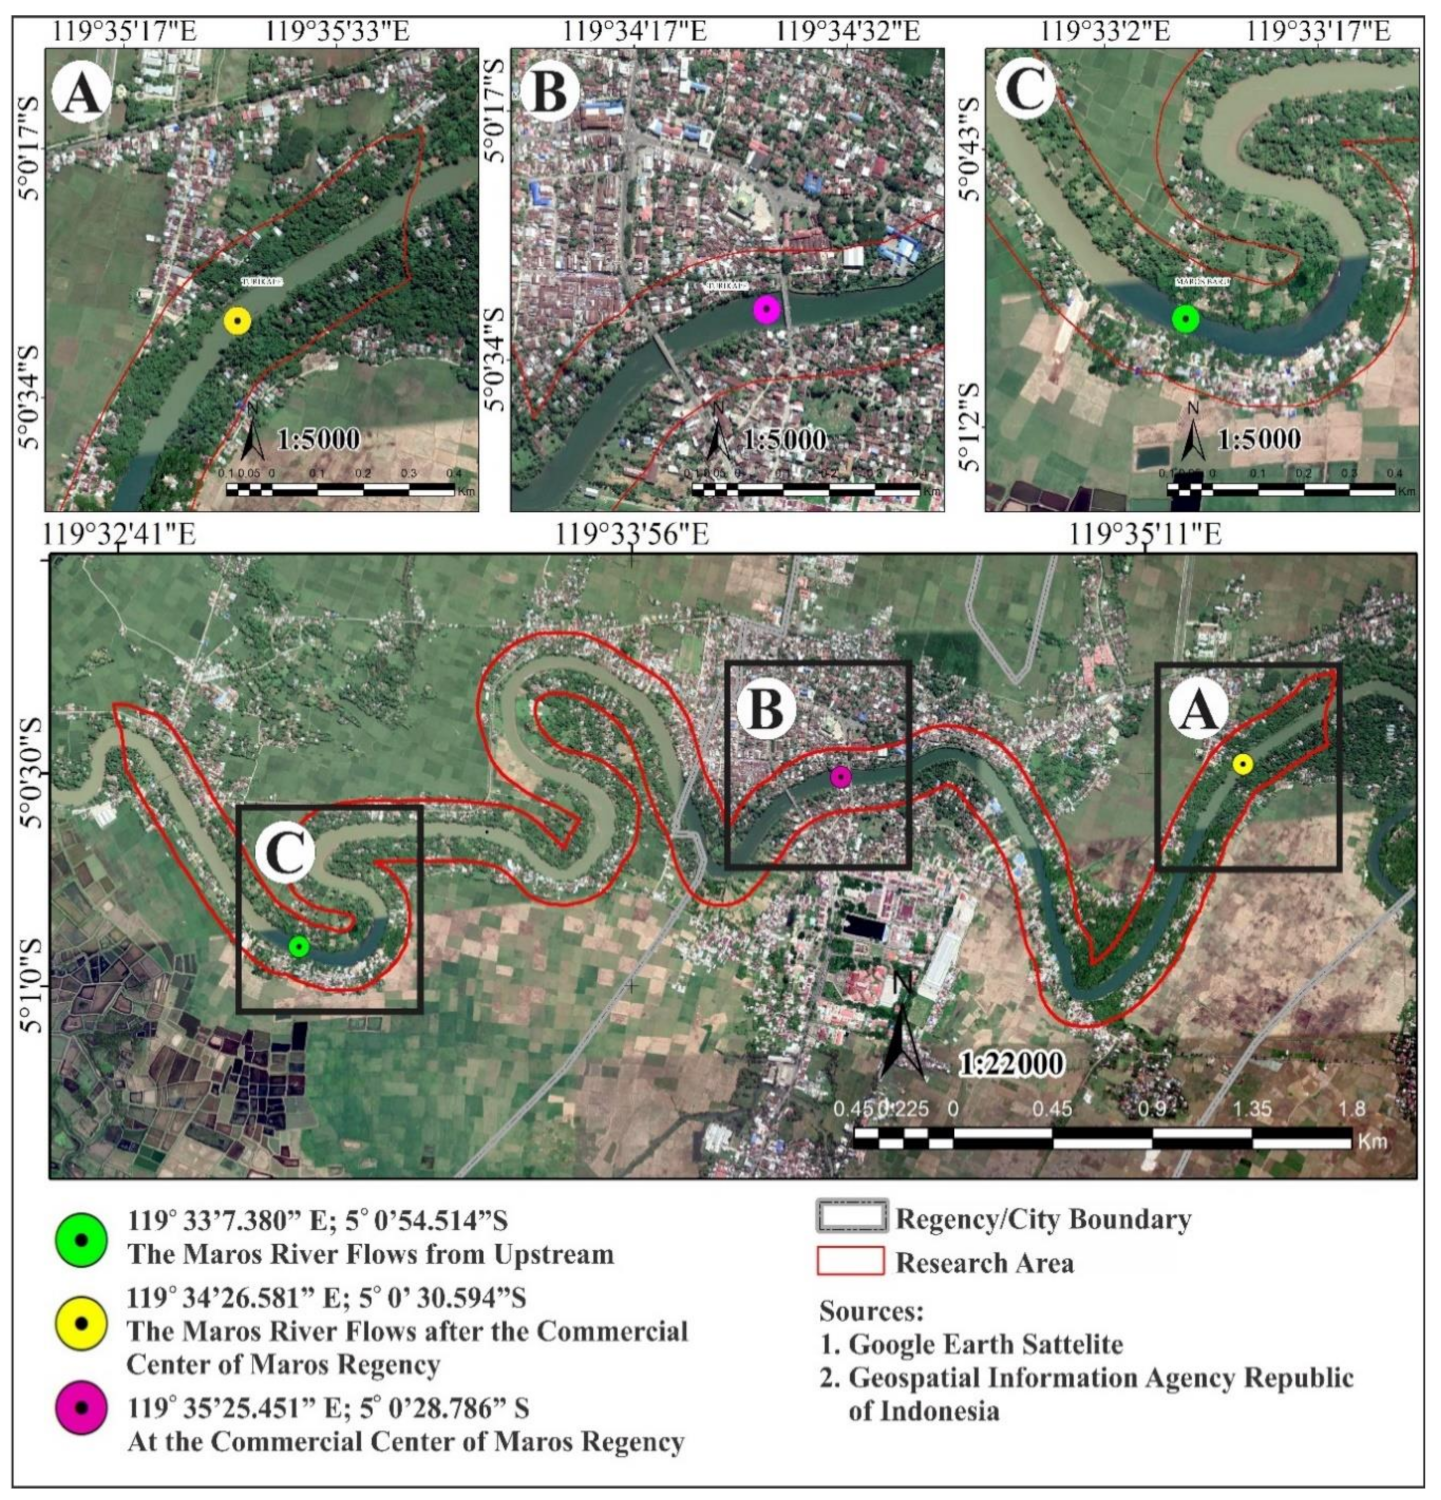
3.2. Study Area
3.3. Method of Collecting Data
3.3.1. Observation
3.3.2. In-Depth Interviews
3.3.3. Questionnaire
3.3.4. Documentation
3.3.5. Research Instruments
3.3.6. Triangulation
3.3.7. Research Informants and Respondents
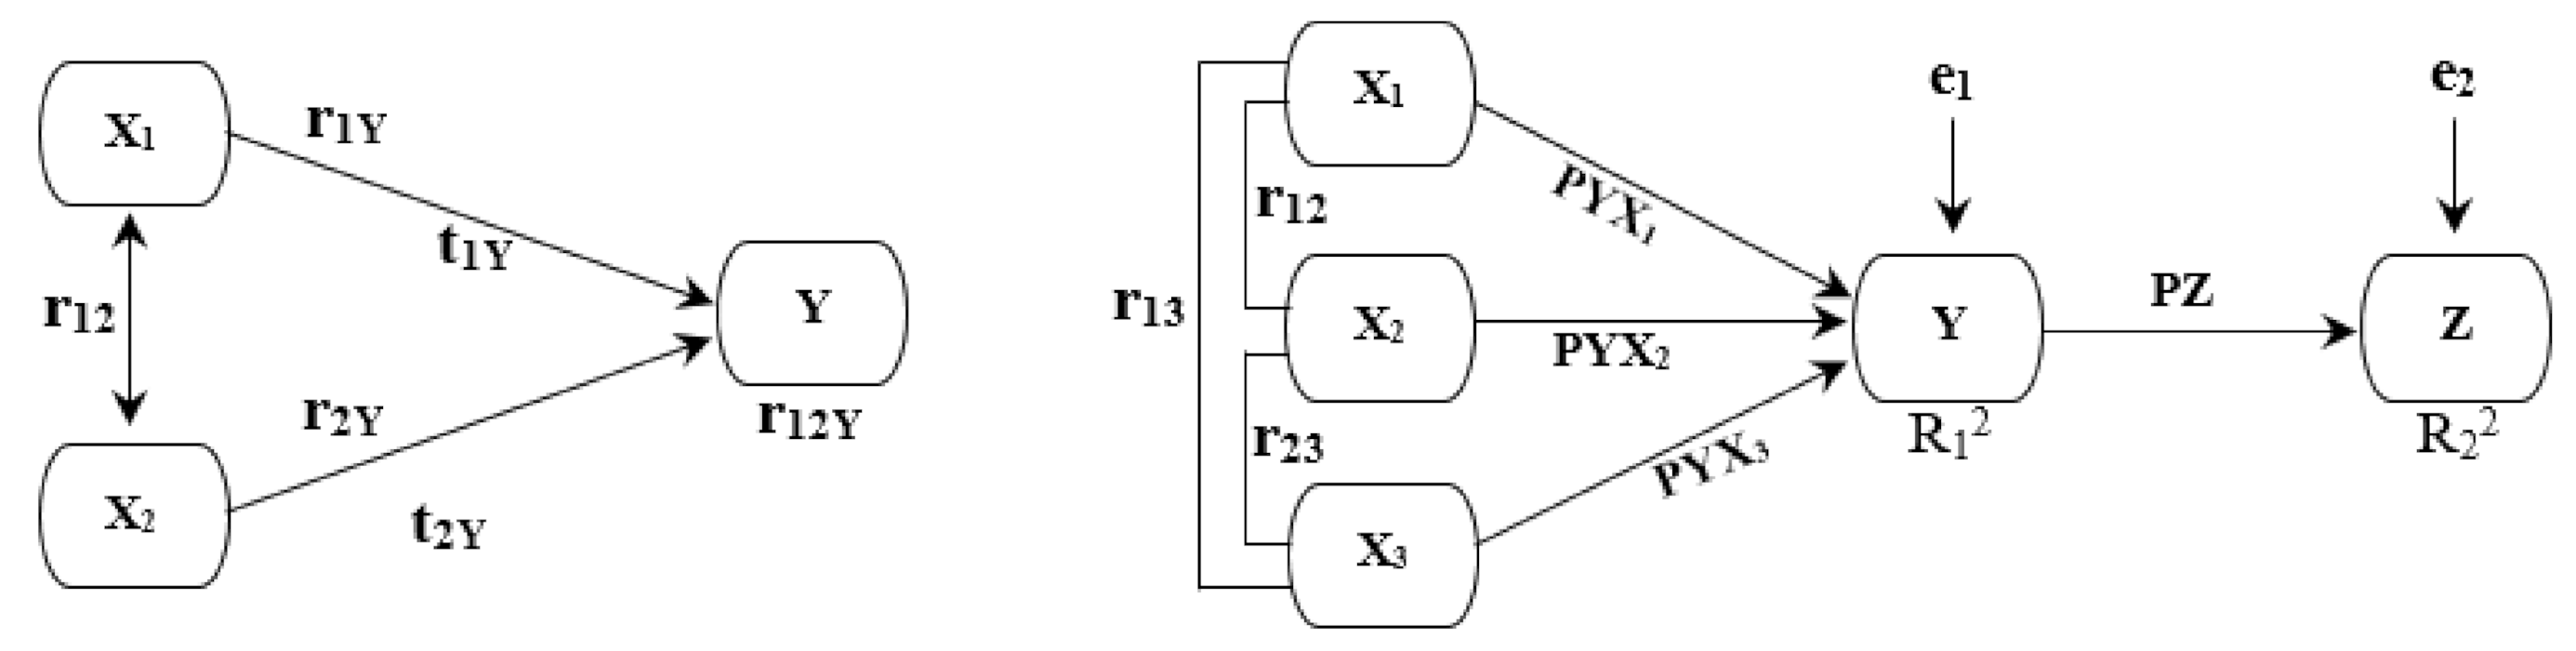
3.4. Data Analysis Method
4. Results
4.1. Determinants of the Complexity of the Maros City Watershed Ecosystem
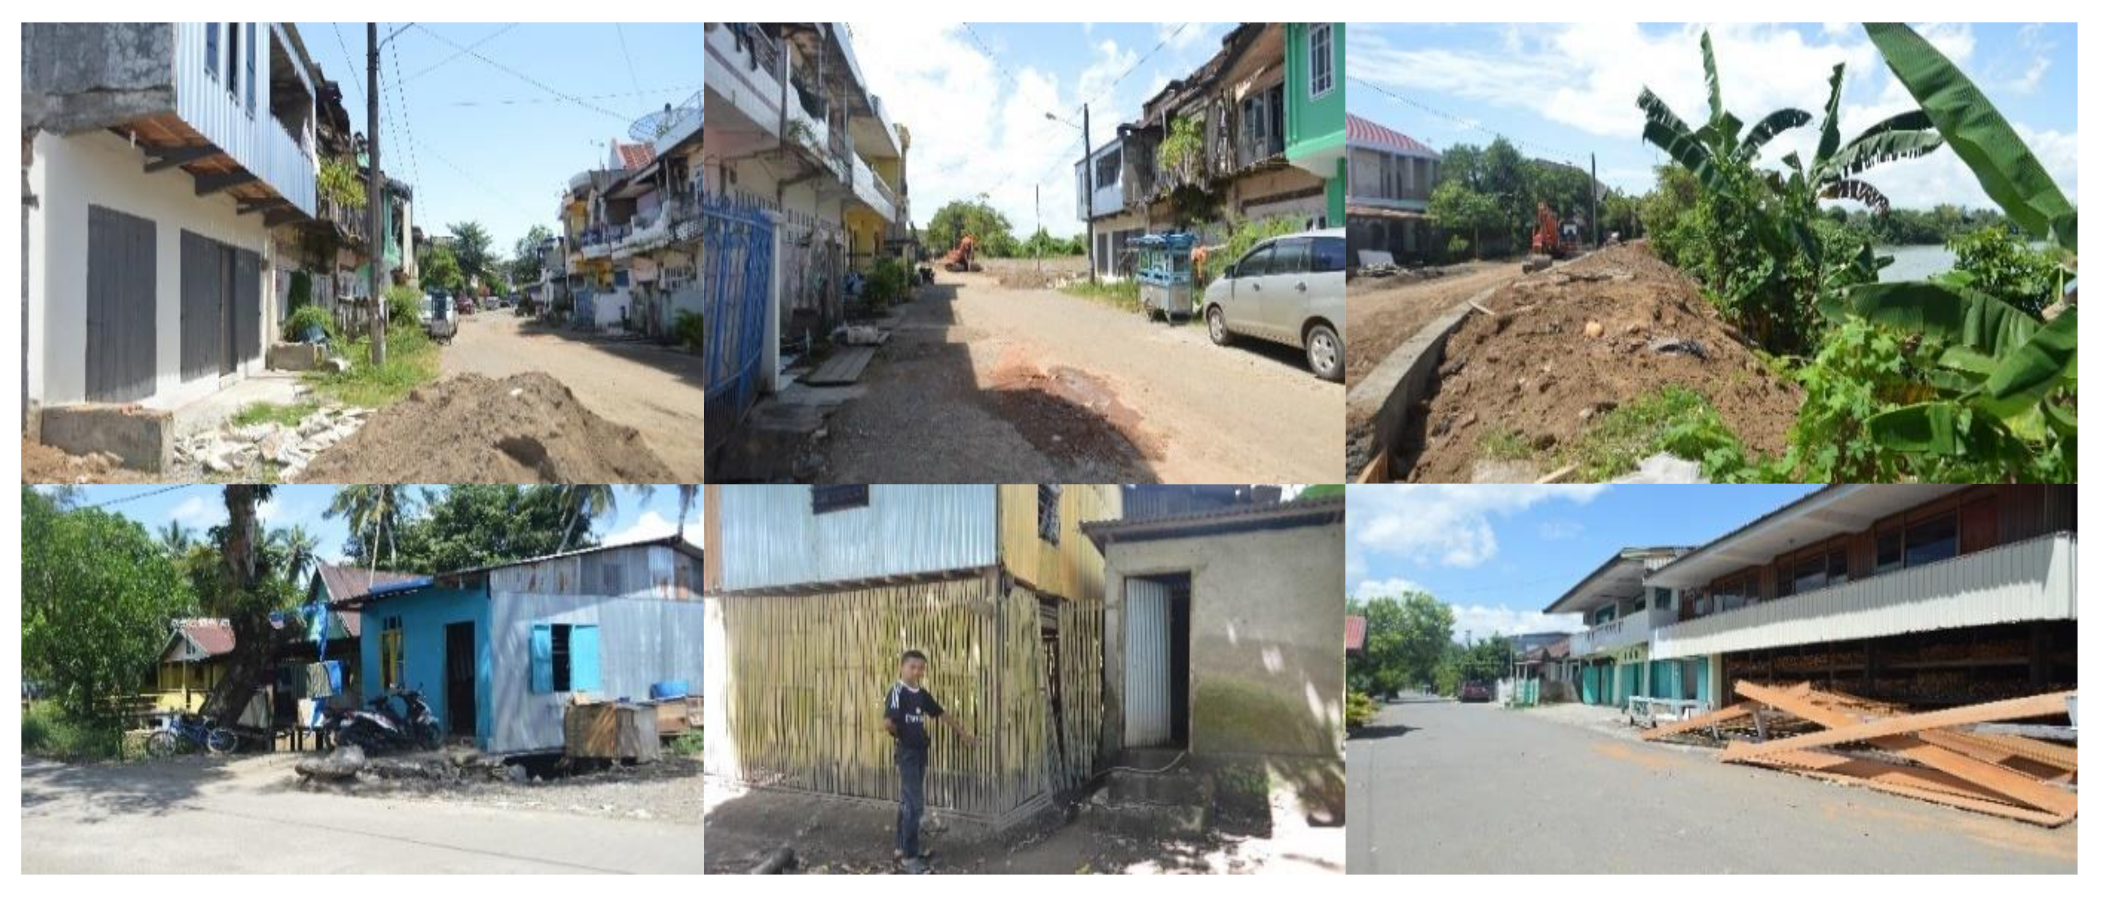
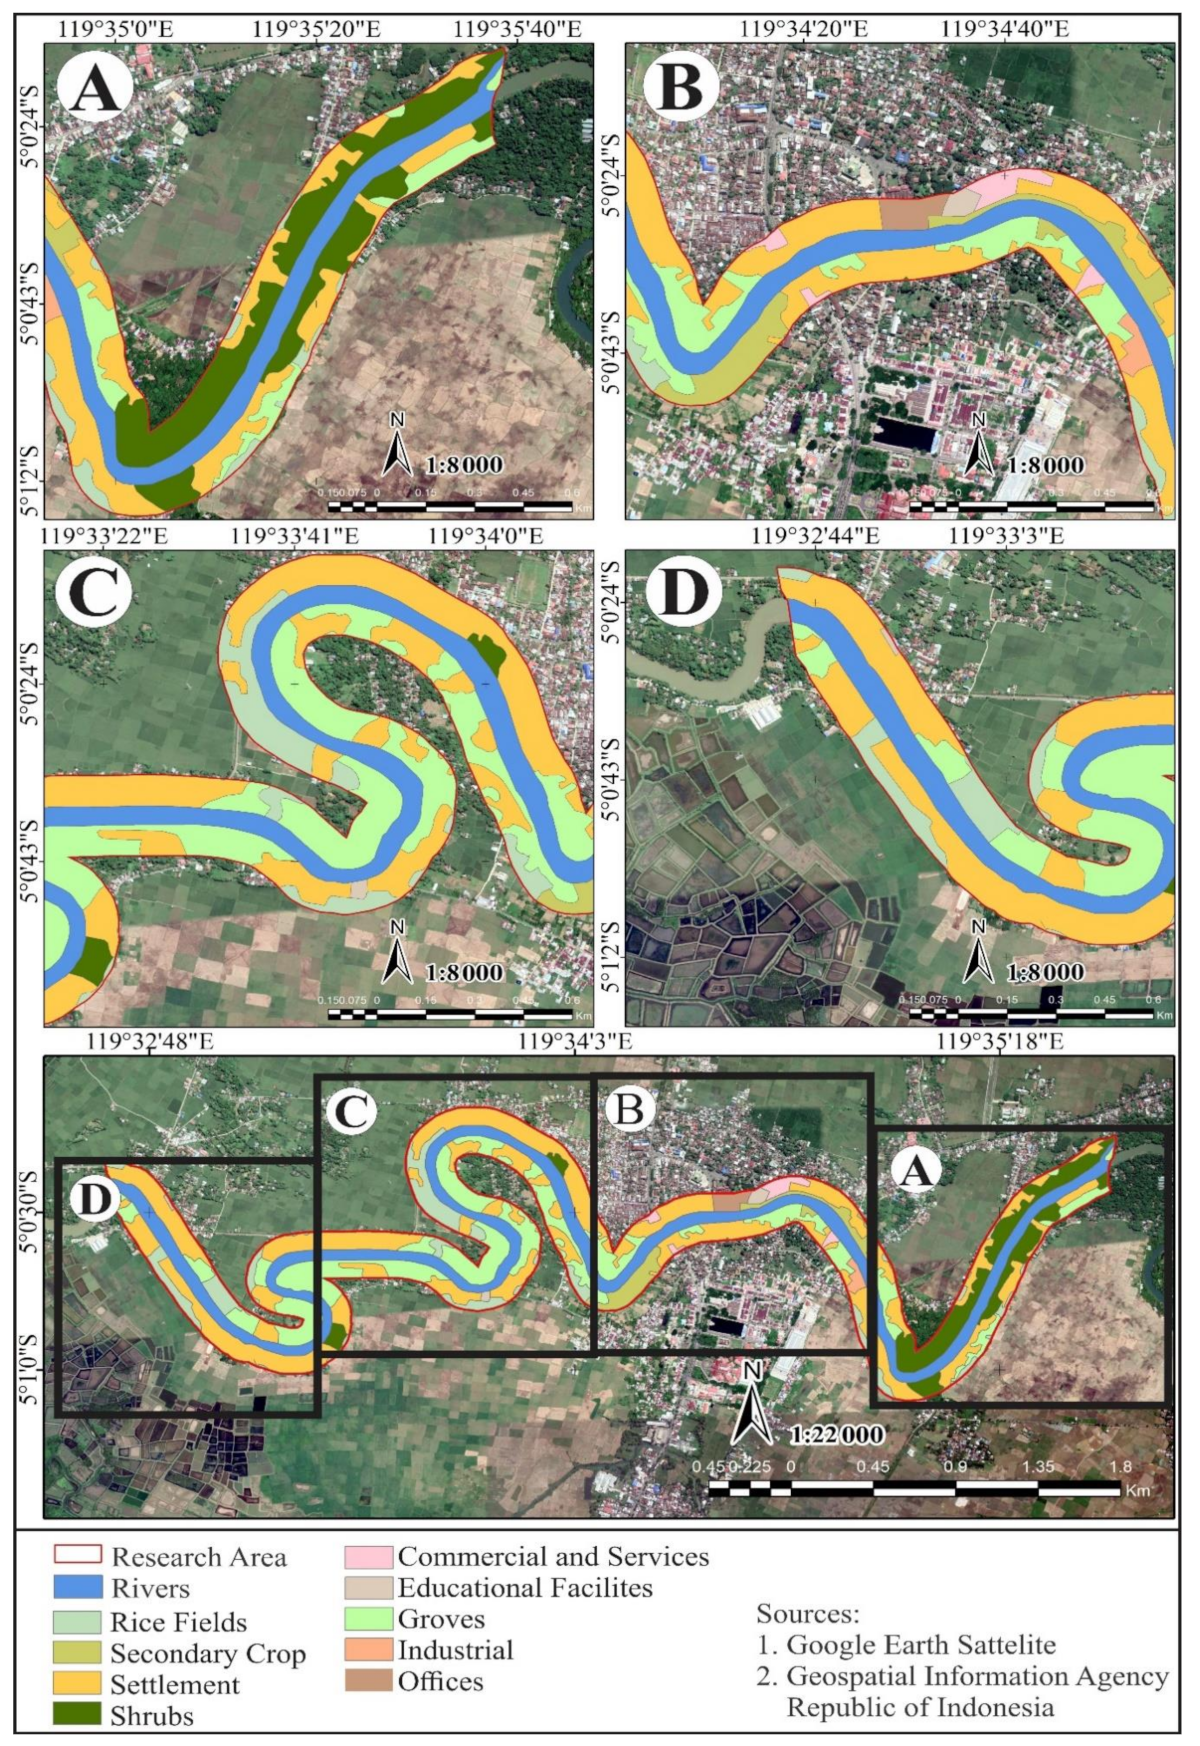
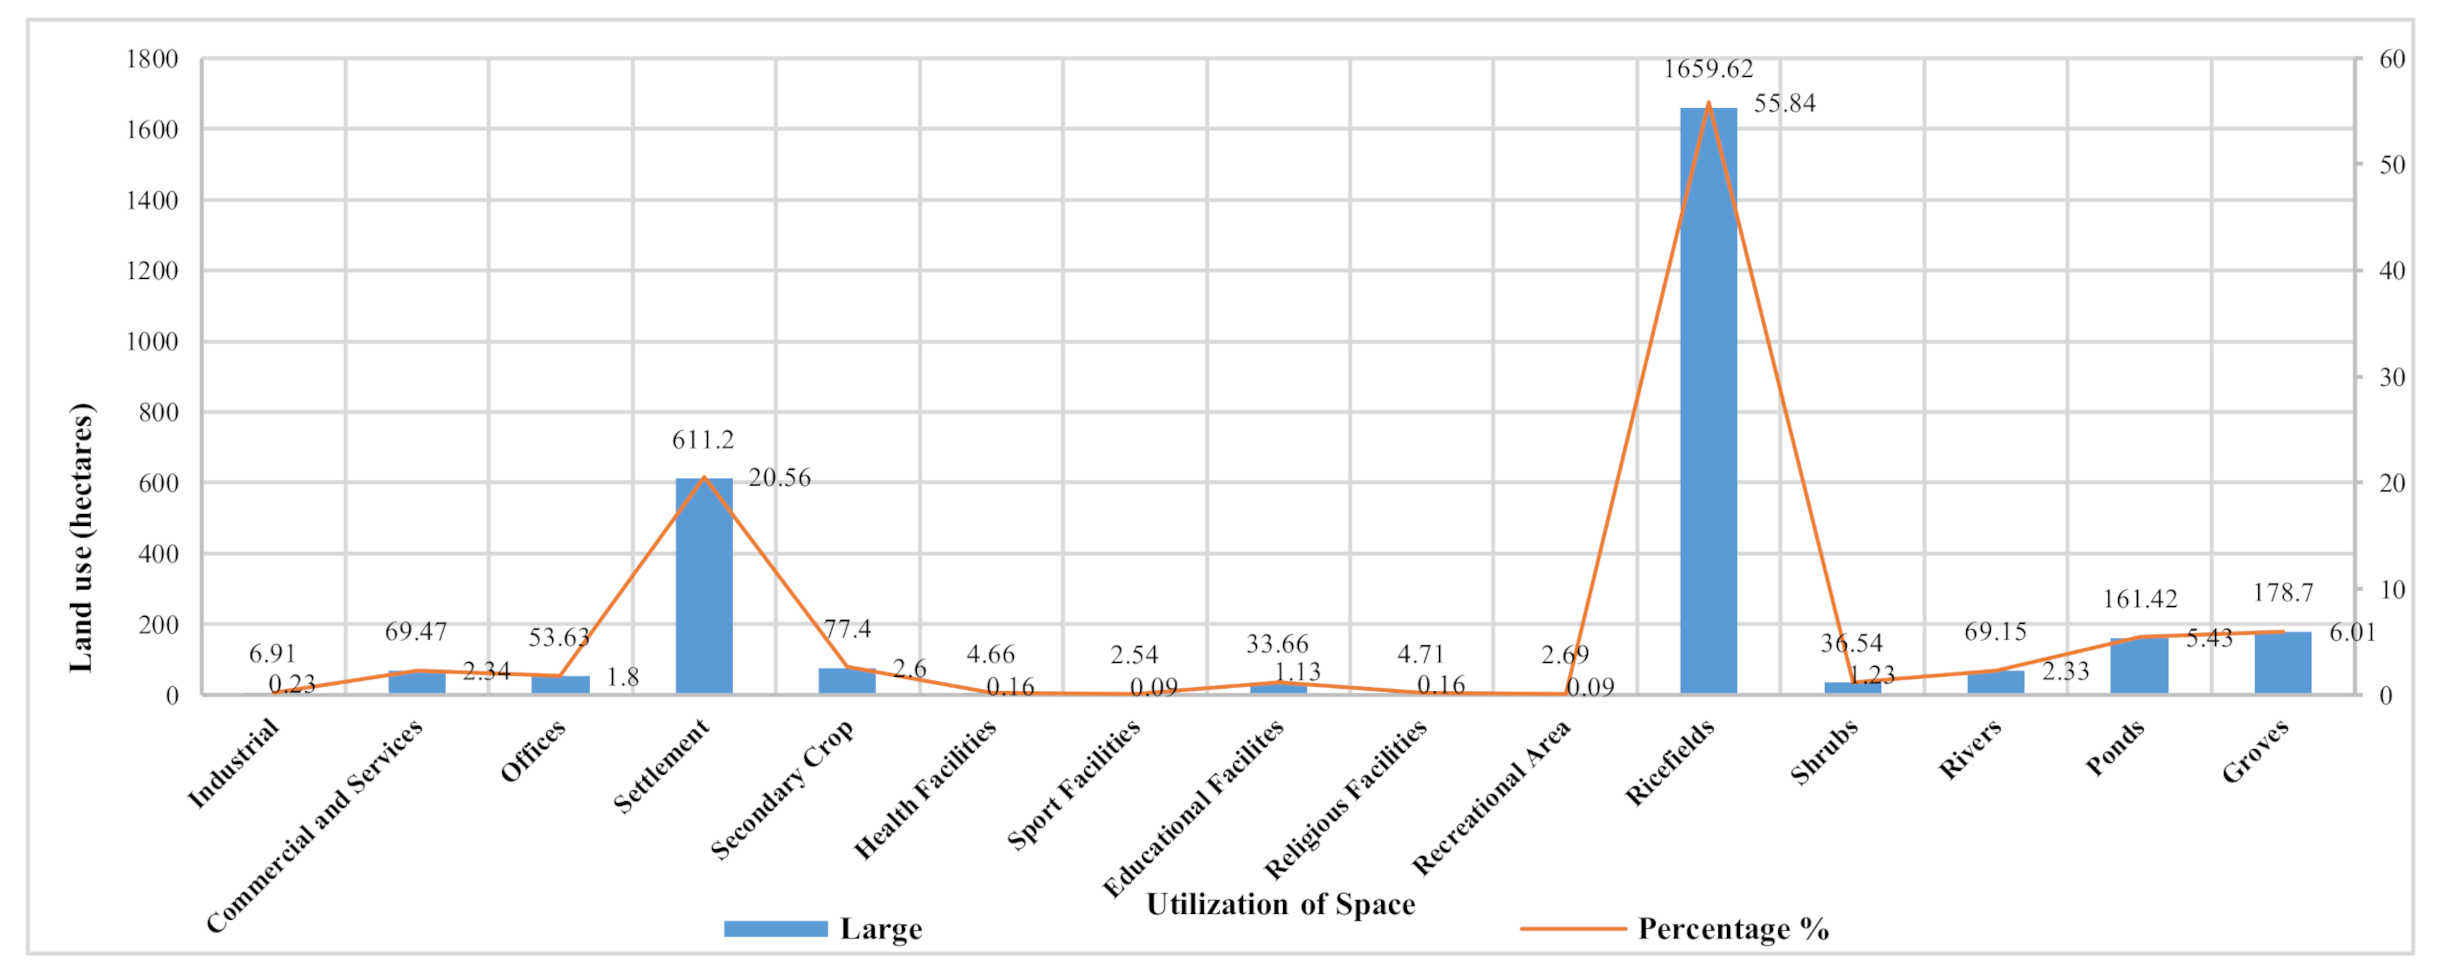
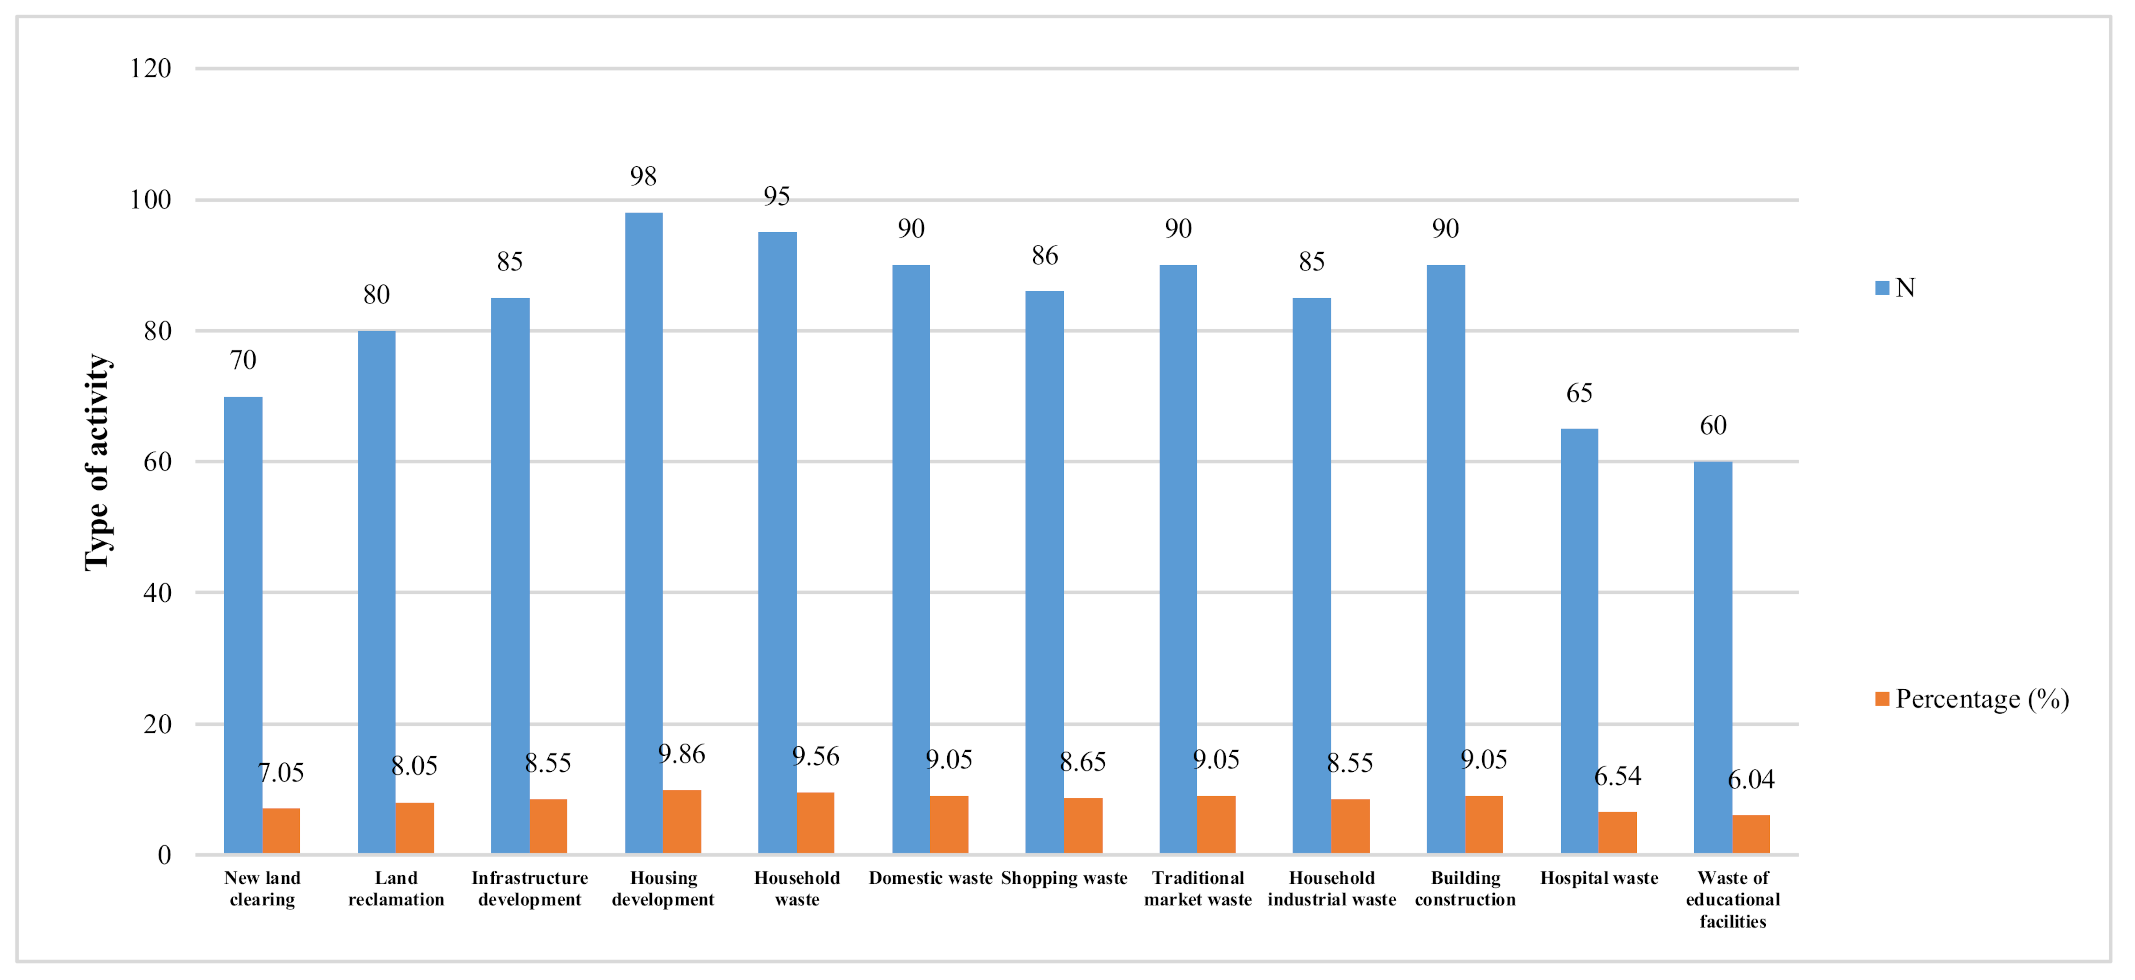
4.2. Changes in Land Use and Deterioration of Watershed Environmental Quality
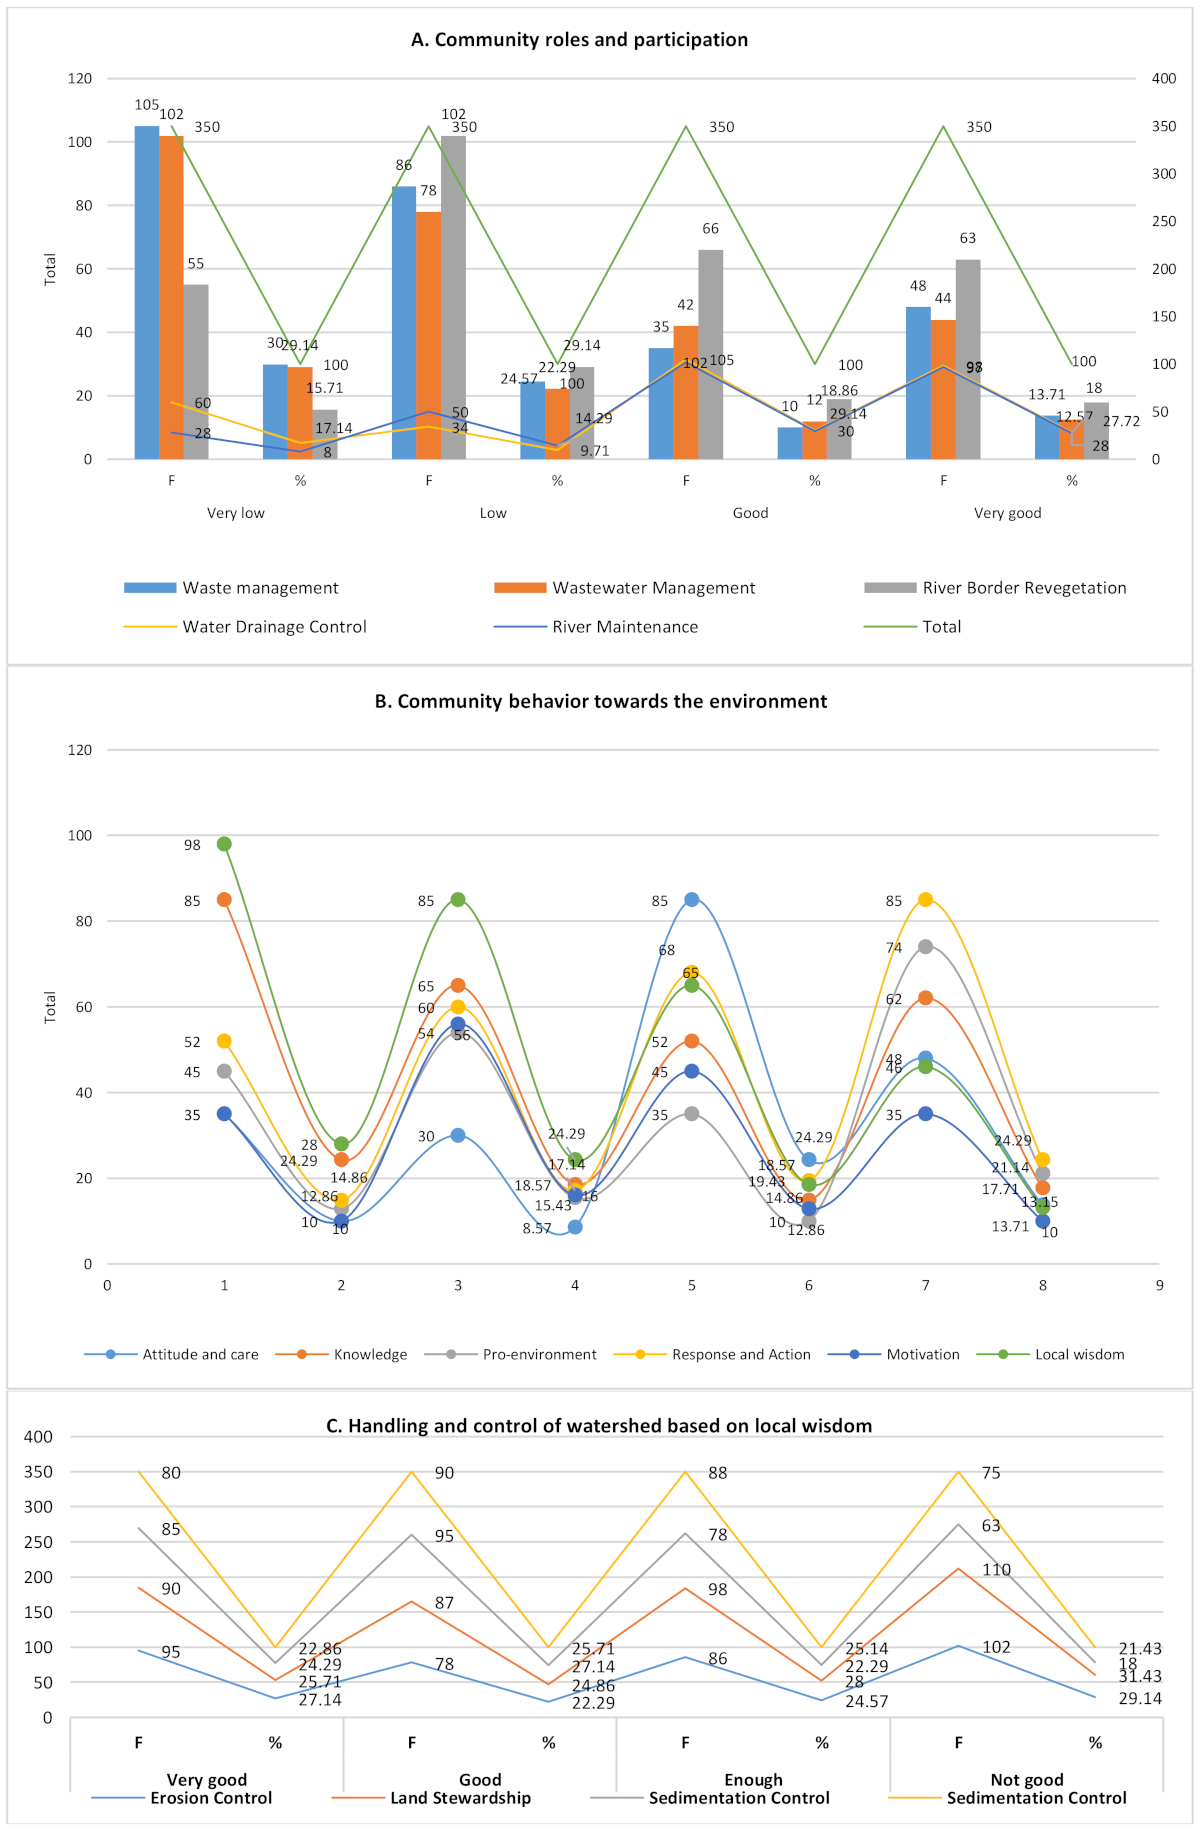
4.3. Watershed Conservation Based on Local Wisdom
5. Discussion
5.1. Community Participation-Based Watershed Conservation
5.2. Change in Community Behavior and Environmental Sustainability
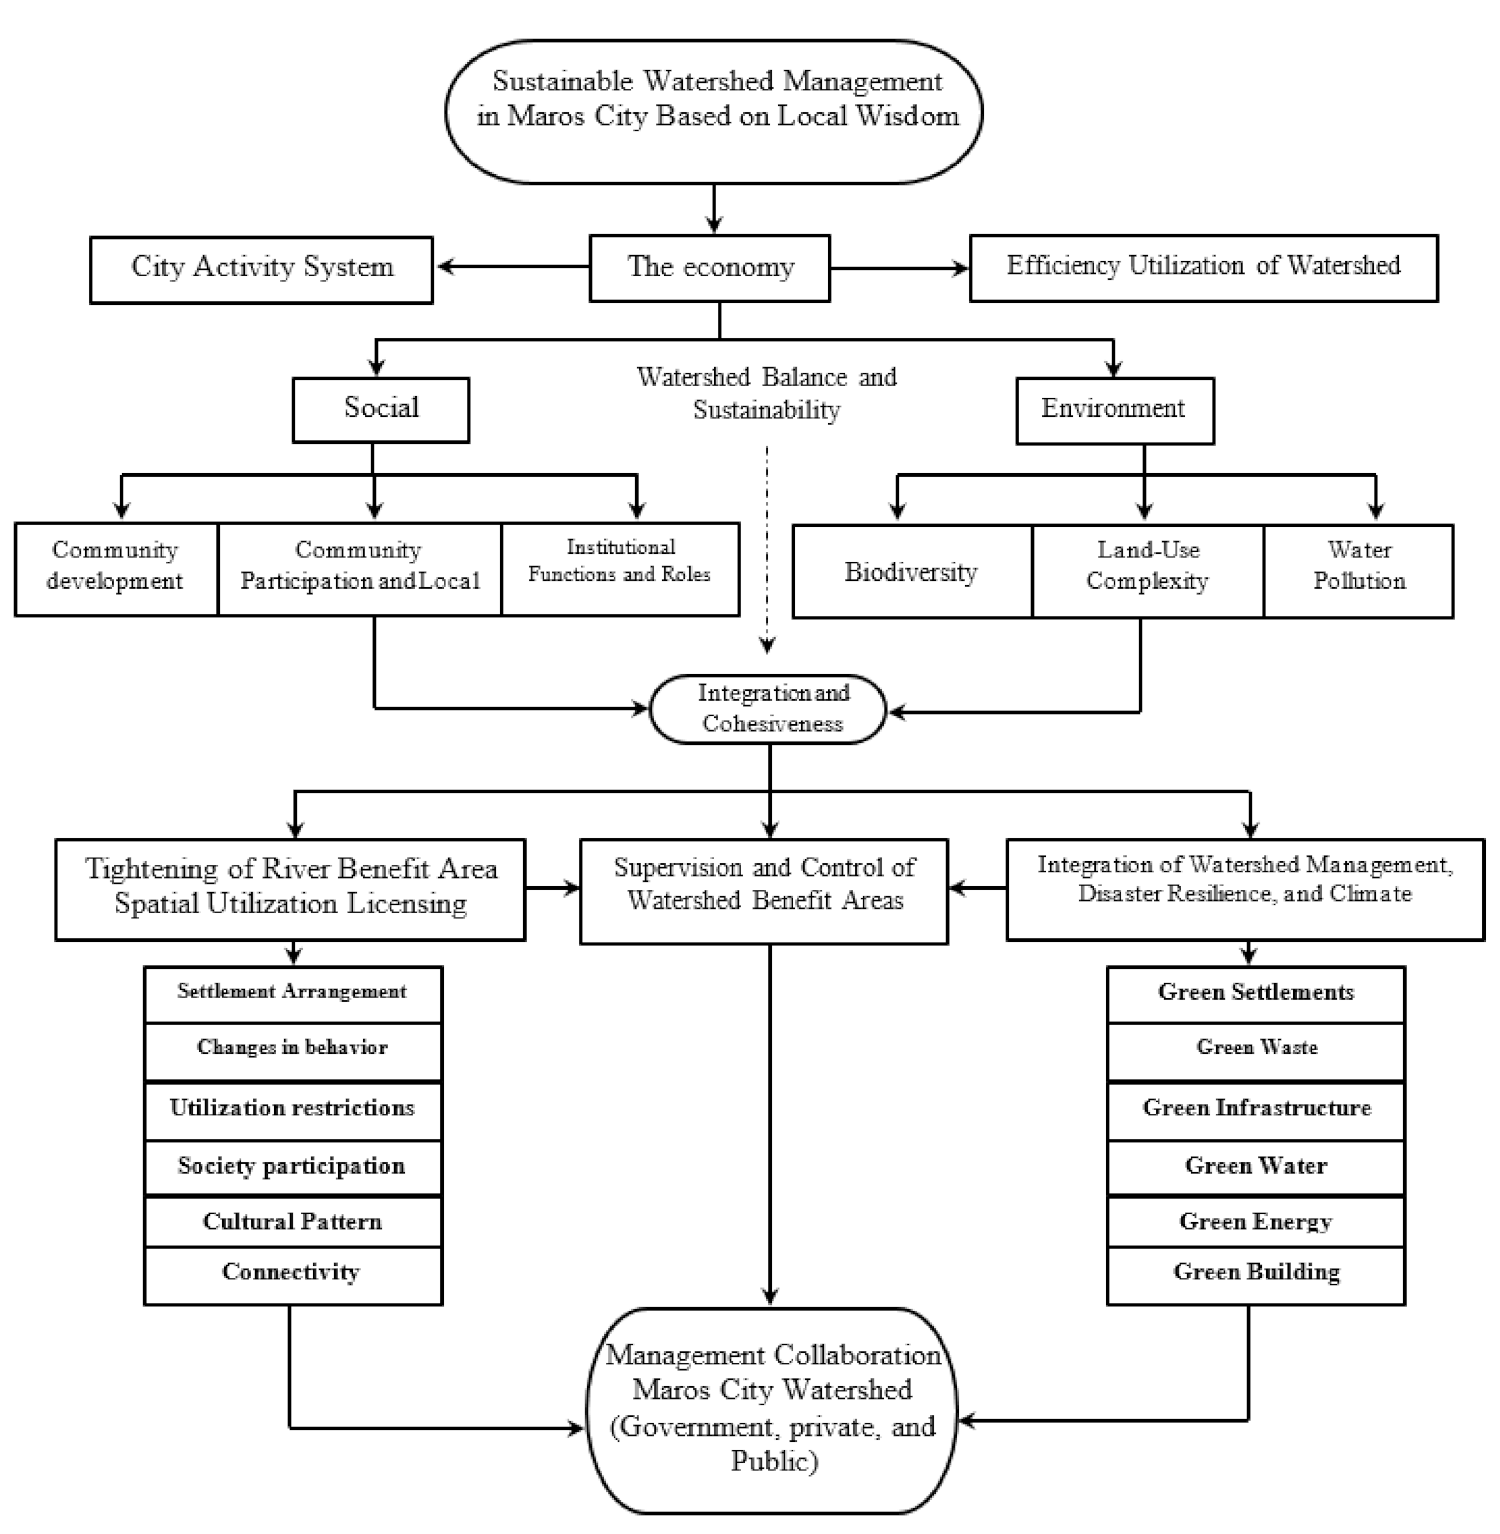
6. Conclusions
Author Contributions
Funding
Acknowledgments
Conflicts of Interest
References
- Berkel, D.V.; Shashidharan, A.; Mordecai, R.S.; Vatsavai, R.; Petrasova, A.; Petras, V.; Mitasova, H.V.; Meentemeyer, R.K. Projecting Urbanization and Landscape Change at Large Scale Using the FUTURES Model. Land 2019, 8, 144. [Google Scholar] [CrossRef] [Green Version]
- Liu, Z.; Zhang, J.; Golubchikov, O. Edge-Urbanization: Land Policy, Development Zones, and Urban Expansion in Tianjin. Sustainability 2019, 11, 2538. [Google Scholar] [CrossRef] [Green Version]
- Surya, B.; Ahmad, D.N.A.; Sakti, H.H.; Sahban, H. Land Use Change, Spatial Interaction, and Sustainable Development in the Metropolitan Urban Areas, South Sulawesi Province, Indonesia. Land 2020, 9, 95. [Google Scholar] [CrossRef] [Green Version]
- Lateef, Z.Q.; Sahib, T.A.; Madhhachi, A.; Sachit, D.E. Evaluation of Water Quality Parameters in Shatt AL-Arab, Southern Iraq, Using Spatial Analysis. Hydrology 2020, 7, 79. [Google Scholar] [CrossRef]
- Al-Madhhachi, A.S.T.; Rahi, K.; Leabi, W.K. Hydrological Impact of Ilisu Dam on Mosul Dam; the River Tigris. Geosciences 2020, 10, 120. [Google Scholar] [CrossRef] [Green Version]
- Bettencourt, L.M.; Lobo, J.; Helbing, D.; Kühnert, C.; West, G.B. Growth, innovation, scaling, and the pace of life in cities. Proc. Natl. Acad. Sci. USA 2007, 104, 7301–7306. [Google Scholar] [CrossRef] [Green Version]
- Angel, S.; Parent, J.; Civco, D.L.; Blei, A.; Potere, D. The dimensions of global urban expansion: Estimates and projections for all countries, 2000–2050. Prog. Plan. 2011, 75, 53–107. [Google Scholar] [CrossRef]
- Alkema, L.; Jones, G.W.; Lai, C.U. Levels of urbanization in the world’s countries: Testing consistency of estimates based on national definitions. J. Popul. Res. 2013, 30, 291–304. [Google Scholar] [CrossRef]
- Buhaug, H.; Urdal, H. An Urbanization Bomb? Population growth and social disorder in cities. Glob. Environ. Chang. 2013, 23, 1–10. [Google Scholar] [CrossRef]
- Word Bank. East Asia’s Changing Urban Landscape Measuring a Decade of Spatial Growth 2015 International Bank for Reconstruction and Development; The World Bank: Washington, DC, USA, 2015; Available online: https://www.worldbank.org/content/dam/Worldbank/Publications/Urban%20Development/EAP_Urban_Expansion_full_report_web.pdf (accessed on 10 March 2020).
- Wang, F.; Fan, W.; Lin, X.; Liu, J.; Ye, X. Does Population Mobility Contribute to Urbanization Convergence? Empirical Evidence from Three Major Urban Agglomerations in China. Sustainability 2020, 12, 458. [Google Scholar] [CrossRef] [Green Version]
- Saleh, H.; Surya, B.; Ahmad, D.N.A.; Manda, D. The Role of Natural and Human Resources on Economic Growth and Regional Development: With Discussion of Open Innovation Dynamics. J. Open Innov. Technol. Mark. Complex. 2020, 6, 103. [Google Scholar] [CrossRef]
- Surya, B.; Syafri, S.; Abubakar, H.; Sahban, H.; Sakti, H.H. Spatial Transformation of New City Area: Economic, Social, and Environmental Sustainability Perspective of Makassar City, Indonesia. J. Southwest Jiaotong Univ. 2020, 55, 1–29. [Google Scholar] [CrossRef]
- Maryono, A.; Sungai, R.; Gadjah, Y. Mada University Press 2007. Available online: https://ugmpress.ugm.ac.id/id/product/lingkungan/restorasi-sungai (accessed on 2 May 2020).
- Liu, Y.; Liu, Y.; Chen, Y.; Long, H. The process and driving forces of rural hollowing in China under rapid urbanization. J. Geogr. Sci. 2010, 20, 876–888. [Google Scholar] [CrossRef]
- Kattel, G.R.; Shang, W.; Wang, Z.; Langford, J. China’s South-to-North Water Diversion Project Empowers Sustainable Water Resources System in the North. Sustainability 2019, 11, 3735. [Google Scholar] [CrossRef] [Green Version]
- Surya, B.; Syafri, S.; Sahban, H.; Sakti, H.H. Natural Resource Conservation Based on Community Economic Empowerment: Perspectives on Watershed Management and Slum Settlements in Makassar City, South Sulawesi, Indonesia. Land 2020, 9, 104. [Google Scholar] [CrossRef] [Green Version]
- Yihdego, Y.; Webb, J. An Empirical Water Budget Model as a Tool to Identify the Impact of Land-use Change in Stream Flow in Southeastern Australia. Water Resour. Manag. 2013, 27, 4941–4958. [Google Scholar] [CrossRef]
- Twisa, S.; Mwabumba, M.; Kurian, M.; Buchroithner, M.F. Impact of Land-Use/Land-Cover Change on Drinking Water Ecosystem Services in Wami River Basin, Tanzania. Resources 2020, 9, 37. [Google Scholar] [CrossRef] [Green Version]
- Rodríguez-Romero, A.J.; Rico-Sánchez, A.E.; Mendoza-Martínez, E.; Gómez-Ruiz, A.; Sedeño-Díaz, J.E.; López-López, E. Impact of Changes of Land Use on Water Quality, from Tropical Forest to Anthropogenic Occupation: A Multivariate Approach. Water 2018, 10, 1518. [Google Scholar] [CrossRef] [Green Version]
- Ding, J.; Jiang, Y.; Fu, L.; Liu, Q.; Peng, Q.; Kang, M. Impacts of Land Use on Surface Water Quality in a Subtropical River Basin: A Case Study of the Dongjiang River Basin, Southeastern China. Water 2015, 7, 4427–4445. [Google Scholar] [CrossRef] [Green Version]
- Talbot, C.A.; Bennett, E.M.; Cassell, K.; Hanes, D.M.; Minor, E.C.; Paerl, H.; Raymond, P.A.; Vargas, R.; Vidon, P.G.; Wollheim, W.; et al. The impact of flooding on aquatic ecosystem services. Biogeochemistry 2018, 141, 439–461. [Google Scholar] [CrossRef] [Green Version]
- Surya, B.; Saleh, H.; Hamsina, H.; Idris, M.; Ahmad, D.N.A. Rural Agribusiness-based Agropolitan Area Development and Environmental Management Sustainability: Regional Economic Growth Perspectives. Int. J. Energy Econ. Policy 2021, 11, 142–157. [Google Scholar] [CrossRef]
- Bohman, A.; Glaas, E.; Karlson, M. Integrating Sustainable Stormwater Management in Urban Planning: Ways Forward towards Institutional Change and Collaborative Action. Water 2020, 12, 203. [Google Scholar] [CrossRef] [Green Version]
- Guo, Y.; Chen, G.; Mo, R.; Wang, M.; Bao, Y. Benefit Evaluation of Water and Soil Conservation Measures in Shendong Based on Particle Swarm Optimization and the Analytic Hierarchy Process. Water 2020, 12, 1955. [Google Scholar] [CrossRef]
- Yihdego, Y.; Webb, J.A. Assessment of wetland hydrological dynamics in a modified catchment basin: The Lake Buninjon case, Victoria, Australia. Water Environ. Res. 2017, 89, 144–154. [Google Scholar] [CrossRef]
- Nabi, G.; Hussain, F.; Shyan Wu, R.; Nangia, V.; Bibi, R. Micro-Watershed Management for Erosion Control Using Soil and Water Conservation Structures and SWAT Modeling. Water 2020, 12, 1439. [Google Scholar] [CrossRef]
- Yihdego, Y.; Khalil, A.; Salem, S.H. The Nile Valley Dispute: Perspectives on the Great Ethiopian Renaissance Dam (GERD). Lump. J. Hum. Soc. Sci. 2017, 17, 1–21. Available online: https://www.researchgate.net/publication/317372179 (accessed on 5 July 2020).
- Hilman, I.; Sunaedi, N. Revitalization of Local Wisdom for the Environmental Education. Geosfera Indonesia 2018, 2, 19–28. [Google Scholar] [CrossRef] [Green Version]
- Perez, C.; Tschinkel, H. Improving Watershed Management in Developing Countries: A Framework for Prioritising Sites and Practices. Agricultural Research & Extension Network 2003. Network Paper No. 129. Available online: https://www.odi.org/sites/odi.org.uk/files/odi-assets/publications-opinion-files/5196.pdf (accessed on 25 March 2020).
- Wahyunto dan Subiksa, I.G.M.; Genesis Lahan Gambut Indonesia. Balai Penelitian Tanah. Bogor 2011.3-14. Available online: http://balittanah.litbang.pertanian.go.id/ind/dokumentasi/lainnya/subiksagambut.pdf (accessed on 8 April 2020).
- Yalew, S.G.; Mul, M.L.; van Griensven, A.; Teferi, E.; Priess, J.; Schweitzer, C.; van der Zaag, P. Land-Use Change Modelling in the Upper Blue Nile Basin. Environments 2016, 3, 21. [Google Scholar] [CrossRef] [Green Version]
- Yihdego, Y.; Reta, G.; Becht, R. Human impact assessment through temporary numerical modeling at UNESCO World Heritage Site, Lake Navaisha, Kenya. Environ. Earth Sci. 2017, 76, 9. [Google Scholar] [CrossRef]
- Osman, T.; Divigalpitiya, P.; Arima, T. Quantifying the Driving Forces of Informal Urbanization in the Western Part of the Greater Cairo Metropolitan Region. Environments 2016, 3, 13. [Google Scholar] [CrossRef] [Green Version]
- Yamin, P.; Fei, M.; Lahlou, S.; Levy, S. Using Social Norms to Change Behavior and Increase Sustainability in the Real World: A Systematic Review of the Literature. Sustainability 2019, 11, 5847. [Google Scholar] [CrossRef] [Green Version]
- Riberu, P.; Pembelajaran Ekologi. Jurnal Pendidikan Penabur 2002.1: 125 127. Available online: https://www.yumpu.com/id/document/view/24331873/hal125-132-pembelajaran-ekologipdf-bpk-penabur (accessed on 20 May 2020).
- May, R. “Connectivity” in Urban Rivers: Conflicts and Convergence Between Ecology and Design. J. Technol. Soc. 2006, 28, 477–488. [Google Scholar] [CrossRef]
- Marans, R.W. Quality of Urban Life Studies: An Overview and Implications for Environment Behaviour Research. Proc. Soc. Behav. Sci. 2012, 35, 9–22. [Google Scholar] [CrossRef] [Green Version]
- Carella, V.; Monachesi, P. Greener through Grey? Boosting Sustainable Development through a Philosophical and Social Media Analysis of Ageing. Sustainability 2018, 10, 499. [Google Scholar] [CrossRef] [Green Version]
- Sugiyono. Metode Penelitian Kuantitatif, Kualitatif dan R&D. Bandung: PT Alfabet 2016. Available online: http://cvalfabeta.com/product/metode-penelitian-kuantitatif-kualitatif-dan-rd-mpkk/ (accessed on 2 April 2020).
- Creswell, J.W. Research Design: Qualitative, Quantitative, and Mixed Methods Approaches, 3rd ed.; SAGE Publications: Thousand Oaks, CA, USA, 2017; Available online: https://www.amazon.com/Research-Design-Qualitative-Quantitative-Approaches/dp/1412965578 (accessed on 14 April 2020).
- Biro Pusat Statistik. Kabupaten Maros Dalam Angka. 2019. Available online: https://maroskab.bps.go.id/publication/2019/08/16/29239258c554034ae6c0fc79/kabupaten-maros-dalam-angka-2019.html. (accessed on 26 June 2020).
- Arikunto, S. Dasar—Dasar Evaluasi Pendidikan; Bumi Aksara: Jakarta, Indonesia, 2013; Available online: https://adoc.tips/arikunto-s-2013-dasar-dasar-evaluasi-pendidikan-jakarta-bumi.html (accessed on 4 April 2020).
- Isaac, S.; Michael, W.B. Handbook in Research and Evaluation; Edits Publishers: San Diego, CA, USA, 1981; p. 234. [Google Scholar]
- Keputusan Menteri Negara Lingkungan Hidup Nomor: 115 Tahun 2003. Tentang Pedoman Penentuan Status Mutu Air. Available online: https://luk.staff.ugm.ac.id/atur/sda/KepmenLH115-2003StatusMutuAir.pdf (accessed on 24 April 2020).
- Izakovičová, Z.; Mederly, P.; Petrovič, F. Long-Term Land Use Changes Driven by Urbanisation and Their Environmental Effects (Example of Trnava City, Slovakia). Sustainability 2017, 9, 1553. [Google Scholar] [CrossRef] [Green Version]
- Surya, B.; Hadijah, H.; Suriani, S.; Baharuddin, B.; Fitriyah, A.T.; Menne, F.; Rasyidi, E.S. Spatial Transformation of a New City in 2006–2020: Perspectives on the Spatial Dynamics, Environmental Quality Degradation, and Socio—Economic Sustainability of Local Communities in Makassar City, Indonesia. Land 2020, 9, 324. [Google Scholar] [CrossRef]
- Dunea, D.; Bretcan, P.; Tanislav, D.; Serban, G.; Teodorescu, R.; Iordache, S.; Petrescu, N.; Tuchiu, E. Evaluation of Water Quality in Ialomita River Basin in Relationship with Land Cover Patterns. Water 2020, 12, 735. [Google Scholar] [CrossRef] [Green Version]
- Costache, A.; Sencovici, M. Influence of the socio-demographic variables on environmental perception. Case study: Targoviste (Dambovita county, Romania). In Proceedings of the 15th International Multidisciplinary Scientific Geoconference (SGEM) Ecology, Economics, Education and Legislation, Albena, Bulgaria, 18–24 June 2015. [Google Scholar]
- Sencovici, M.; Costache, A. Methods and means of evaluating the perception concerning the environmental condition. Case study: The urban ecosystem of Targoviste (Romania). In International Multidisciplinary Scientific GeoConference; SGEM: Sofia, Bulgaria, 2012; Volume 5, p. 571. [Google Scholar]
- Pitt, M. The Pitt Review: Learning Lessons from the 2007 Floods; Cabinet Office: London, UK, 2008. Available online: https://webarchive.nationalarchives.gov.uk/20100702215619/http://archive.cabinetoffice.gov.uk/pittreview/thepittreview/final_report.html (accessed on 5 June 2020).
- Ochoa-Rodríguez, S. Urban Pluvial Flood Modelling: Current Theory and Practive. 2015. Available online: https://www.raingain.eu/sites/default/files/wp3_review_document_0.pdf (accessed on 5 June 2020).
- Shao, Y.; Yuan, X.; Ma, C.; Ma, R.; Ren, Z. Quantifying the Spatial Association between Land Use Change and Ecosystem Services Value: A Case Study in Xi’an, China. Sustainability 2020, 12, 4449. [Google Scholar] [CrossRef]
- Grzywna, A.; Bronowicka-Mielniczuk, U. Spatial and Temporal Variability of Water Quality in the Bystrzyca River Basin, Poland. Water 2020, 12, 190. [Google Scholar] [CrossRef] [Green Version]
- Metcalf, E.; Eddy, H. Wastewater Engineering: Treatment and Resource Recovery, 5th ed.; McGraw-Hill Book Company, Inc.: New York, NY, USA, 2020; Available online: https://www.amazon.com/Wastewater-Engineering-Treatment-Resource-Recovery/dp/0073401188/ref=pd_lpo_14_img_2/142-1427550-9996445?_encoding=UTF8&pd_rd_i=0073401188&pd_rd_r=c2f332c8-c52a-4640-932c-abaaf50a4b7d&pd_rd_w=308Uc&pd_rd_wg=bs31S&pf_rd_p=7b36d496-f366-4631-94d3-61b87b52511b&pf_rd_r=0YPPXV92TZF4JZ4N1P98&psc=1&refRID=0YPPXV92TZF4JZ4N1P98 (accessed on 4 May 2020).
- Rahmawati. Pengaruh Kegiatan Industri Terhadap Kualitas Air Sungai Diwak Di Bergas Kabupaten Semarang dan Upaya Pengendalian Pencemaran Air Sungai. Tesis Program Megister, Teknik Lingkungan Universitas Diponegoro, Tembalang, Central Java, Indonesia, 2011. Available online: http://eprints.undip.ac.id/33567/1/Copy_of_DEAZY_TESIS_PASS.pdf (accessed on 2 May 2020).
- United Nations. Sustainable Development. In Proceedings of the United Nations Conference on Environment & Development, Rio de Janerio, Brazil, 3–14 June 1992. Available online: https://sustainabledevelopment.un.org/content/documents/Agenda21.pdf (accessed on 12 May 2020).
- Yuliastuti, E. Kajian Kualitas Air Sungai Ngringo Karanganyar Dalam Upaya Pengendalian Pencemaran Air. Program Megister Teknik Lingkungan Universitas Diponegoro 2011. Available online: http://eprints.undip.ac.id/31570/1/ETIK_YULIASTUTI_TESIS.pdf (accessed on 5 May 2020).
- Surya, B.; Despri, D.N.A.; Bahrun, R.S.; Saleh, H. Urban Farming as a Slum Settlement Solution (Study on Slum Settlements in Tanjung Merdeka Village, Makassar City). IOP Conf. Ser. Earth Environ. Sci. 2020, 562. [Google Scholar] [CrossRef]
- Surya, B.; Hamsina, H.; Ridwan, R.; Baharuddin, B.; Menne, F.; Fitriyah, A.T.; Rasyidi, E.S. The Complexity of Space Utilization and Environmental Pollution Control in the Main Corridor of Makassar City, South Sulawesi, Indonesia. Sustainability 2020, 12, 9244. [Google Scholar] [CrossRef]
- Fulazzaky, M.A. Challenges of Integrated Water Resources Management in Indonesia. Water 2014, 6, 2000–2020. [Google Scholar] [CrossRef] [Green Version]
- Bilan, Y.; Mishchuk, H.; Samoliuk, N.; Yurchyk, H. Impact of Income Distribution on Social and Economic Well-Being of the State. Sustainability 2020, 12, 429. [Google Scholar] [CrossRef] [Green Version]
- Du, Y.; Wang, X.; Brombal, D.; Moriggi, A.; Sharpley, A.; Pang, S. Changes in Environmental Awareness and Its Connection to Local Environmental Management in Water Conservation Zones: The Case of Beijing, China. Sustainability 2018, 10, 2087. [Google Scholar] [CrossRef] [Green Version]
- Surya, B. The Dynamics of Spatial Structure and Spatial Pattern Changes at the Fringe Area of Makassar City. Indones. J. Geogr. 2015, 47, 11–19. [Google Scholar] [CrossRef]
- Carrion-Flores, C.; Irwin, E.G. Determinants of residential land-use conversion and sprawl at the rural-urban fringe. Am. J. Agric. Econ. 2004, 86, 889–904. [Google Scholar] [CrossRef]
- Seto, K.C.; Fragkias, M.; Güneralp, B.; Reilly, M.K. A meta-analysis of global urban land expansion. PLoS ONE 2011, 6, e23777. [Google Scholar] [CrossRef]
- Surya, B. Change Phenomena of Spatial Physical in the Dynamics of Development in Urban Fringe Area. Indones. J. Geogr. 2016, 48, 118–134. [Google Scholar] [CrossRef] [Green Version]
- Coiacetto, E. Real estate development industry structure: Consequences for urban planning and development. Plan. Pract. Res. 2006, 21, 423–441. [Google Scholar] [CrossRef]
- Cecchini, M.; Zambon, I.; Salvati, L. Housing and the City: A Spatial Analysis of Residential Building Activity and the Socio-Demographic Background in a Mediterranean City, 1990–2017. Sustainability 2019, 11, 375. [Google Scholar] [CrossRef] [Green Version]
- Surya, B.; Saleh, H.; Suriani, S.; Sakti, H.H.; Hadijah, H.; Idris, M. Environmental Pollution Control and Sustainability Management of Slum Settlements in Makassar City, South Sulawesi, Indonesia. Land 2020, 9, 279. [Google Scholar] [CrossRef]
- Alipbeki, O.; Alipbekova, C.; Sterenharz, A.; Toleubekova, Z.; Makenova, S.; Aliyev, M.; Mineyev, N. Analysis of Land-Use Change in Shortandy District in Terms of Sustainable Development. Land 2020, 9, 147. [Google Scholar] [CrossRef]
- Alam, A. Soil Degradation: A Challenge to Sustainable Agriculture. Int. J. Sci. Res. Agric. Sci. 2014, 1, 50–55. [Google Scholar] [CrossRef]
- Surya, B.; Ruslan, M.; Abubakar, H. Inequility of Space Reproduction Control and Urban Slum Area Management Sustainability (Case Study: Slum Area of Buloa Urban Village in Makassar City). J. Eng. Appl. Sci. 2018, 13, 6033–6042. [Google Scholar] [CrossRef]
- Surya, B.; Saleh, H.; Remmang, H. Economic Gentrification and Sociocultural Transformation Metropolitan Suburban of Mamminasata. J. Eng. Appl. Sci. 2018, 13, 6072–6084. [Google Scholar] [CrossRef]
- Surya, B. Spatial Articulation and Co-Existence of Mode of Production in the Dynamics of Development at the Urban Fringe of Makassar City. J. Eng. Appl. Sci. 2015, 10, 214–222. [Google Scholar] [CrossRef]
- Surya, B. Optimization of Function and Role of Traditional Markets in Urban Development System of Ketapang City (A Case Study: Range Sentap Market, Delta Pawan Subdistrict, Ketapang City). World Appl. Sci. J. 2015, 33, 1457–1471. [Google Scholar] [CrossRef]
- Hlaváček, P.; Kopáček, M.; Horáčková, L. Impact of Suburbanisation on Sustainable Development of Settlements in Suburban Spaces: Smart and New Solutions. Sustainability 2019, 11, 7182. [Google Scholar] [CrossRef] [Green Version]
- Surya, B. Globalization, Modernization, Mastery of Reproduction of Space, Spatial Articulation and Social Change in Developmental Dynamics in Suburb Area of Makassar City (A Study Concerning on Urban Spatial Sociology). Asian Soc. Sci. 2014, 10, 261–268. [Google Scholar] [CrossRef] [Green Version]
- Chen, D.; Acharya, K.; Stone, M. Sensitivity analysis of nonequilibrium adaptation parameters for modeling mining-pit migration. J. Hydraul. Eng. 2010, 136, 806–811. [Google Scholar] [CrossRef] [Green Version]
- Thi Kim, T.; Mai Huong, N.T.; Quoc Huy, N.D.; Anh Tai, P.; Hong, S.; Minh Quan, T.; Thi Bay, N.; Ki Jeong, W.; Ky Phung, N. Assessment of the Impact of Sand Mining on Bottom Morphology in the Mekong River in An Giang Province, Vietnam, Using a Hydro-Morphological Model with GPU Computing. Water 2020, 12, 2912. [Google Scholar] [CrossRef]
- Jiang, Y.; Gui, H.; Yu, H.; Wang, M.; Fang, H.; Wang, C.; Chen, C.; Zhang, Y.; Huang, Y. Hydrochemical Characteristics and Water Quality Evaluation of Rivers in Different Regions of Cities: A Case Study of Suzhou City in Northern Anhui Province, China. Water 2020, 12, 950. [Google Scholar] [CrossRef] [Green Version]
- Duan, X.; Yang, R.; Duan, Z.; Tang, Y. Environmental Collaborative Governance Degree of Government, Corporation, and Public. Sustainability 2020, 12, 1138. [Google Scholar] [CrossRef] [Green Version]
- Surya, B.; Saleh, H.; Ariyanto. Transformation of metropolitan suburban area (a study on new town development in Moncongloe-Pattalassang Metropolitan Maminasata). IOP Conf. Ser. Earth Environ. Sci. 2018, 202, 012027. [Google Scholar] [CrossRef] [Green Version]
- Hua, R.; Zhang, Y. Assessment of Water Quality Improvements Using the Hydrodynamic Simulation Approach in Regulated Cascade Reservoirs: A Case Study of Drinking Water Sources of Shenzhen, China. Water 2017, 9, 825. [Google Scholar] [CrossRef] [Green Version]
- Surya, B. Social Change, Spatial Articulation in the Dynamics of Boomtown Construction and Development (Case Satudy of Metro Tanjung Bunga Boomtown, Makassar). Mod. Appl. Sci. 2014, 8, 238–245. [Google Scholar] [CrossRef] [Green Version]
- Niesenbaum, R.A. The Integration of Conservation, Biodiversity, and Sustainability. Sustainability 2019, 11, 4676. [Google Scholar] [CrossRef] [Green Version]
- Arunyawat, S.; Shrestha, R.P. Assessing Land Use Change, and Its Impact on Ecosystem Services in Northern Thailand. Sustainability 2016, 8, 768. [Google Scholar] [CrossRef] [Green Version]
- Vannevel, R.; Goethals, P.L.M. Identifying Ecosystem Key Factors to Support Sustainable Water Management. Sustainability 2020, 12, 1148. [Google Scholar] [CrossRef] [Green Version]
- Veról, A.P.; Lourenço, I.B.; Fraga, J.P.R.; Battemarco, B.P.; Merlo, M.L.; de Magalhães, P.C.; Miguez, M.G. River Restoration Integrated with Sustainable Urban Water Management for Resilient Cities. Sustainability 2020, 12, 4677. [Google Scholar] [CrossRef]
- Manalu, D.; Soesilo, T.E.B.; Ery Seda, F.S.S. Socio-ecological Aspects Informing Community Resilience in a Disaster-Prone Area: A Case Study of the Traditional Koa Community in East Nusa Tenggara Province of Indonesia. In Sustainable Future for Human Security; Springer: Singapore, 2017; pp. 351–367. [Google Scholar] [CrossRef]
- Cepeliauskaite, G.; and Stasiskiene, Z. The Framework of the Principles of Sustainable Urban Ecosystems Development and Functioning. Sustainability 2020, 12, 720. [Google Scholar] [CrossRef] [Green Version]
- Charalambous, K.; Bruggeman, A.; Giannakis, E.; Zoumides, C. Improving Public Participation Processes for the Floods Directive and Flood Awareness: Evidence from Cyprus. Water 2018, 10, 958. [Google Scholar] [CrossRef] [Green Version]
- Saleh, H.; Surya, B.; Hamsina, H. Implementation of Sustainable Development Goals to Makassar Zero Waste and Energy Source. Int. J. Energy Econ. Policy 2020, 10, 530–538. [Google Scholar] [CrossRef]
- Liyanage, C.P.; Yamada, K. Impact of Population Growth on the Water Quality of Natural Water Bodies. Sustainability 2017, 9, 1405. [Google Scholar] [CrossRef] [Green Version]
- Dunham, J.B.; Angermeier, P.L.; Crausbay, S.D.; Cravens, A.E.; Gosnell, H.; McEvoy, J.; Moritz, M.A.; Raheem, N.; Sanford, T. Rivers are social–ecological systems: Time to integrate human dimensions into riverscape ecology and management. Wires Water 2018, 5, e1291. [Google Scholar] [CrossRef]
- Deng, G.; Yao, X.; Jiang, H.; Cao, Y.; Wen, Y.; Wang, W.; Zhao, S.; He, C. Study on the Ecological Operation and Watershed Management of Urban Rivers in Northern China. Water 2020, 12, 914. [Google Scholar] [CrossRef] [Green Version]
- Surya, B.; Syafri, S.; Hadijah, H.; Baharuddin, B.; Fitriyah, A.T.; Sakti, H.H. Management of Slum-Based Urban Farming and Economic Empowerment of the Community of Makassar City, South Sulawesi, Indonesia. Sustainability 2020, 12, 7324. [Google Scholar] [CrossRef]
- Katusiime, J.; Schütt, B. Linking Land Tenure and Integrated Watershed Management—A Review. Sustainability 2020, 12, 1667. [Google Scholar] [CrossRef] [Green Version]
- Surya, B. Spatial Interaction Pattern, and the Process of City Activity Formation System (Case study, Ternate City, Tidore Archipelago City and Sofifi City of North Maluku, Indonesia). Res. J. Appl. Sci. 2015, 10, 880–892. [Google Scholar] [CrossRef]
- Van Noordwijk, M.; Speelman, E.; Hofstede, G.J.; Farida, A.; Abdurrahim, A.Y.; Miccolis, A.; Hakim, A.L.; Wamucii, C.N.; Lagneaux, E.; Andreotti, F.; et al. Sustainable Agroforestry Landscape Management: Changing the Game. Land 2020, 9, 243. [Google Scholar] [CrossRef]
- Kitamura, K.; Nakagawa, C.; Sato, T. Formation of a Community of Practice in the Watershed Scale, with Integrated Local Environmental Knowledge. Sustainability 2018, 10, 404. [Google Scholar] [CrossRef] [Green Version]
- Bronfman, N.C.; Cisternas, P.C.; Vázquez, E.L.; de la Maza, C.; Oyanedel, J.C. Understanding Attitudes and Pro-Environmental Behaviors in a Chilean Community. Sustainability 2015, 7, 14133–14152. [Google Scholar] [CrossRef] [Green Version]
- Hua Yang, T.; Cheng Liu, W. A General Overview of the Risk-Reduction Strategies for Floods and Droughts. Sustainability 2020, 12, 2687. [Google Scholar] [CrossRef] [Green Version]
- Morley, M.; Savić, D. Water Resource Systems Analysis for Water Scarcity Management: The Thames Water Case Study. Water 2020, 12, 1761. [Google Scholar] [CrossRef]
- Lasi, H.; Fettke, P.; Kemper, H.; Feld, T.; Hoffmann, M. Industry 4.0. Bus. Inf. Syst. Eng. 2014, 6, 239–242. [Google Scholar] [CrossRef]
- Ben-Daya, M.; Hassini, E.; Bahroun, Z. Internet of things and supply chain management: A literature review. Int. J. Prod. Res. 2017, 546, 1–24. [Google Scholar] [CrossRef] [Green Version]
- Mostert, E. Values in water management. Hydrol. Earth Syst. Sci. 2019, 1, 1–20. [Google Scholar] [CrossRef]
- Mebrahtu, G.; Zerabruk, S. Concentration and health implication of heavy metals in drinking water from urban areas of Tigray region, Northern Ethiopia. Momona Ethiop. J. Sci. 2011, 3, 105–121. [Google Scholar] [CrossRef] [Green Version]
- Zia, H.; Harris, N.R.; Merrett, G.V.; Rivers, M.; Coles, N. The impact of agricultural activities on water quality: A case for collaborative catchment-scale management using integrated wireless sensor networks. Comput. Electron. Agric. 2013, 96, 126–138. [Google Scholar] [CrossRef] [Green Version]
- Mateo-Sagasta, J.; Zadeh, S.M.; Turral, H.; Burke, J. Water Pollution from Agriculture: A Global Review. Executive Summary; FAO Colombo: Rome, Italy; International Water Management Institute on Behalf of the Water Land and Ecosystems Research Program: Colombo, Sri Lanka, 2017; Available online: http://www.fao.org/3/a-i7754e.pdf (accessed on 5 May 2020).
- Bangash, R.F.; Passuello, A.; Sanchez-Canales, M.; Terrado, M.; López, A.; Elorza, F.J.; Ziv, G.; Acuña, V.; Schuhmacher, M. Ecosystem services in Mediterranean river basin: Climate change impact on water provisioning and erosion control. Sci. Total Environ. 2013, 458, 246–255. [Google Scholar] [CrossRef]
- Cann, K.F.; Thomas, D.R.; Salmon, R.L.; Wyn-Jones, A.P.; Kay, D. Extreme water-related weather events and waterborne disease. Epidemiol. Infect. 2013, 141, 671–686. [Google Scholar] [CrossRef]
- Khan, S.J.; Deere, D.; Leusch, F.D.; Humpage, A.; Jenkins, M.; Cunliffe, D. Extreme weather events: Should drinking water quality management systems adapt to changing risk profiles? Water Res. 2015, 85, 124–136. [Google Scholar] [CrossRef]


| Year | District | ||||
|---|---|---|---|---|---|
| Maros Baru | Turikale | Lau | Mandai | Simbang | |
| Total Population (Soul) | Total Population (Soul) | Total Population (Soul) | Total Population (Soul) | Total Population (Soul) | |
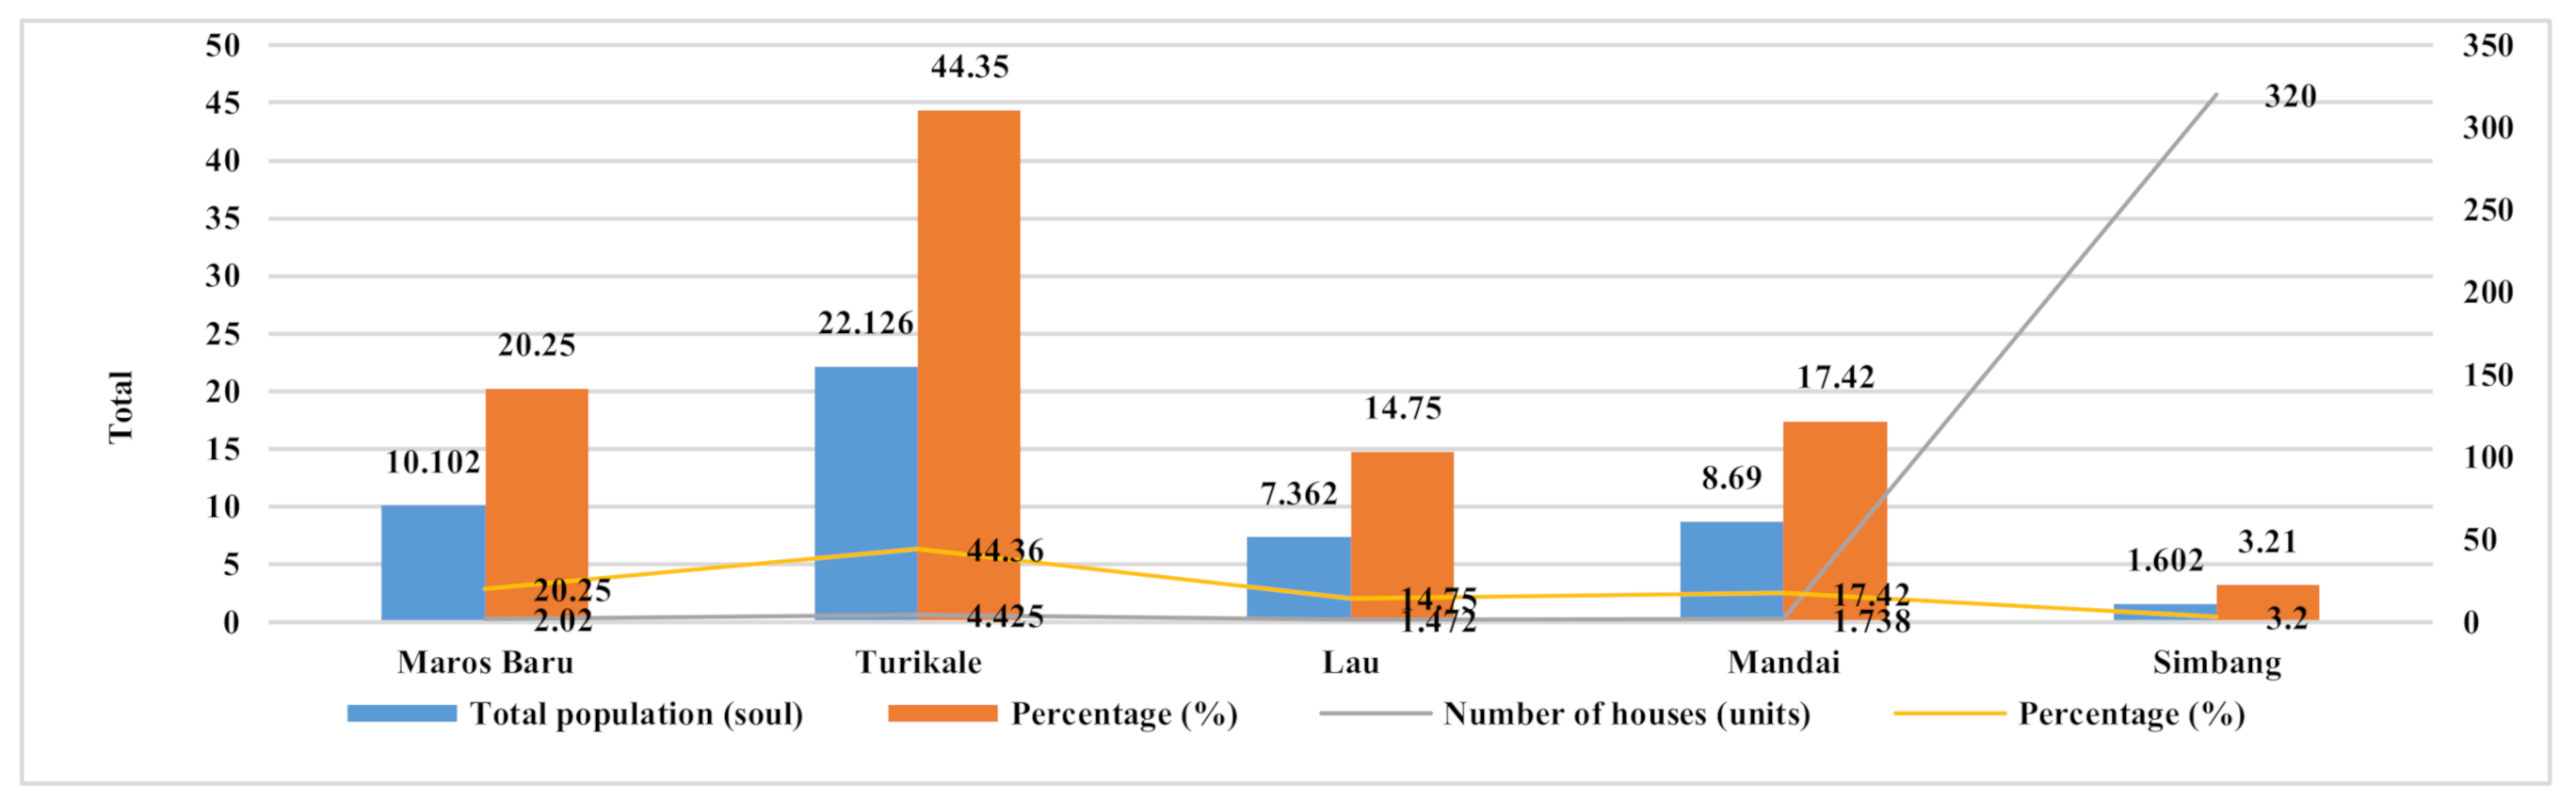
| 2015 | 12,628 | 35,596 | 9896 | 15,298 | 3203 |
| 2016 | 12,628 | 35,877 | 10,030 | 15,508 | 3245 |
| 2017 | 12,628 | 36,084 | 10,034 | 15,510 | 3245 |
| 2018 | 12,772 | 41,038 | 10,918 | 15,819 | 3645 |
| 2019 | 14,138 | 41,319 | 10,971 | 18,690 | 3793 |
| District | Altitude (Meters from Sea Level) | Slope (Degree) | Geographical Location |
|---|---|---|---|
| Maros Baru | −4.56–20.72 | 0–0.32 | 119°31′42.383″ E; 4°59′47.002″ S |
| Turikale | −7.34–22.35 | 0–0.28 | 119°34′33.587″ E; 5°0′51.562″ S |
| Lau | −7.35–12.05 | 0–4.09 | 119°33′39.878″ E; 4°57′43.978″ S |
| Mandai | −0.49–164.17 | 0–27.36 | 119°33′41.038″ E; 5°4′40.523″ S |
| Simbang | −18.31–666.23 | 0–69.27 | 119°40′45.572″ E; 5°2′57.899″ S |
| Number | Research Question | Research Variable | Indicator | Method of Collecting Data | Instruments and Tools Used |
|---|---|---|---|---|---|
| 1 | The increase in population and changes in the use of space as determinants of the complexity of the Maros City watershed ecosystem. | Total population | The population was measured by the following indicators: birth, death, and migration. | Observation, survey, and documentation | Field notes, base map of location, questionnaire, and data notes at District office |
| Space utilization | Spatial use was measured by indicators: spatial function, socio-economic activity patterns, and permits issued by the local government. | Observation, survey, and documentation | Field notes, location base map, and permit records issued by the Maros City Spatial Planning Office | ||
| Ecosystem complexity | Ecosystem complexity was measured by the following indicators: ecological conditions, spatial pressure, population activity, community response, and spatial activity patterns. | Observation, survey, and in-depth interviews | Field notes, questionnaires, location base maps, cameras, and voice recording devices | ||
| 2 | The effects of housing development, urban activity systems, and land use changes on the degradation of the environmental quality of the Maros City watershed. | Housing development | Housing development was measured by the following indicators: land-use, space allocation, land used, and building ownership. | Observation, surveys, and in-depth interviews | Field notes, questionnaires, location base maps, cameras, and voice recording devices |
| City activity system | City activity system was measured by the following indicators: spatial function, built area, movement system, and facilities and infrastructure. | Observation and survey | Field notes, base maps of location, questionnaires, and cameras | ||
| Land use change | Land use change was measured by the following indicators: land use change, land use, and land use patterns. | Observation and survey | Field notes, base maps of location, questionnaires, and cameras | ||
| Environmental quality decrease | Environmental quality degradation was measured by the following indicators: pollution load, pollution level, and environmental carrying capacity. | Observation, survey, and measurement of river water quality | Field notes, location base maps, questionnaires, cameras, TSS AMTAST TB200, Digital Water TDS EC, DO Meter HI98193, and Chemical Oxygen Demand COD571 | ||
| 3 | Direct and indirect effects of changes in spatial use, land reclamation, and community behavior on water pollution and the sustainability of watershed management of Maros City. | Change in space use | Spatial use change was measured by the following indicators: population growth, land availability, land ownership status, space allocation, space capacity, spatial function, and spatial use control. | Observation, survey, and documentation | Field notes, base maps of the location, permit records issued by the Maros City Spatial Planning Agency and Maros City Spatial Plan |
| Land reclamation | Land reclamation was measured by the following indicators: differences in land elevation, reclamation treatment, and land use. | Observation, survey, and in-depth interviews | Field notes, questionnaires, location base maps, cameras, and voice recording devices | ||
| Community behavior | Community behavior was measured by the following indicators: knowledge, educational background, care, awareness, and community participation. | Observation, survey, and in-depth interviews | Field notes, questionnaires, location base maps, cameras, and voice recording devices | ||
| Water pollution | Water pollution was measured by the following indicators: pollution management and water pollution index. | Observation, survey, and measurement of river water quality | Field notes, location base maps, questionnaires, cameras, TSS AMTAST TB200, Digital Water TDS EC, DO Meter HI98193, and Chemical Oxygen Demand COD571 | ||
| Sustainability of watershed management | The sustainability of watershed management was measured by the following indicators: water pollution index, watershed management, community participation, and protection of river benefit areas. | Observation, survey, and water quality status | Field notes, location base maps, questionnaires, cameras, TSS AMTAST TB200, Digital Water TDS EC, DO Meter HI98193, and Chemical Oxygen Demand COD571 |
| Number | IP Value | Water Quality |
|---|---|---|
| 1 | 0–1.0 | Good condition |
| 2 | 1.1–5.0 | Lightly polluted |
| 3 | 5.0–10.0 | Moderately polluted |
| 4 | >10.0 | Heavy Polluted |
| Parameter | Unit | Water Sampling Location | Water Quality Standards | |||||
|---|---|---|---|---|---|---|---|---|
| Point 1 | Point 2 | Point 3 | Class I | Class II | Class III | Class IV | ||
| TSS | mg/L | 28 | 80 | 34 | 50 | 50 | 400 | 400 |
| pH | mg/L | 7.6 | 8.5 | 7.8 | 6–9 | 6–9 | 6–9 | 6–9 |
| BOD | mg/L | 7.82 | 25 | 6.75 | 2 | 3 | 6 | 12 |
| COD | mg/L | 12.42 | 60.25 | 15.80 | 10 | 25 | 50 | 100 |
| DO | mg/L | 4.53 | 0.65 | 5.50 | 6 | 4 | 3 | 0 |
| Total phosphate | mg/L | <0.0001 | <0.001 | <0.001 | 0.2 | 0.2 | 1 | 5 |
| Chromium | mg/L | <0.010 | <0.010 | <0.010 | - | - | - | - |
| Information | Total Suspended Solid (TSS) | Degree of Acidity (pH) | Biochemical Oxygen Demand (BOD) | |||||
| Chemical Oxygen Demand (COD) | Dissolved Oxygen (DO) | |||||||
| Point Location | Pollution Load (kg/day) | ||
|---|---|---|---|
| TSS | BOD | COD | |
| 1 | 2787.65 | 807.06 | 1389.69 |
| 2 | 5474.50 | 2312.90 | 4793.54 |
| 3 | 989.00 | 168.00 | 454.00 |
| Correlated Variables | Coefficient | T-Table | t Count | Sig. | ||
|---|---|---|---|---|---|---|
| Housing development to environmental quality degradation (ryx1) | 0.126 | 1.67 | 4.907 | 0.000 | ||
| City activity system to environmental quality degradation (ryx2) | 0.136 | 1.67 | 2.987 | 0.004 | ||
| Land use change to environmental quality degradation (ryx3) | 0.406 | 1.67 | 4.870 | 0.000 | ||
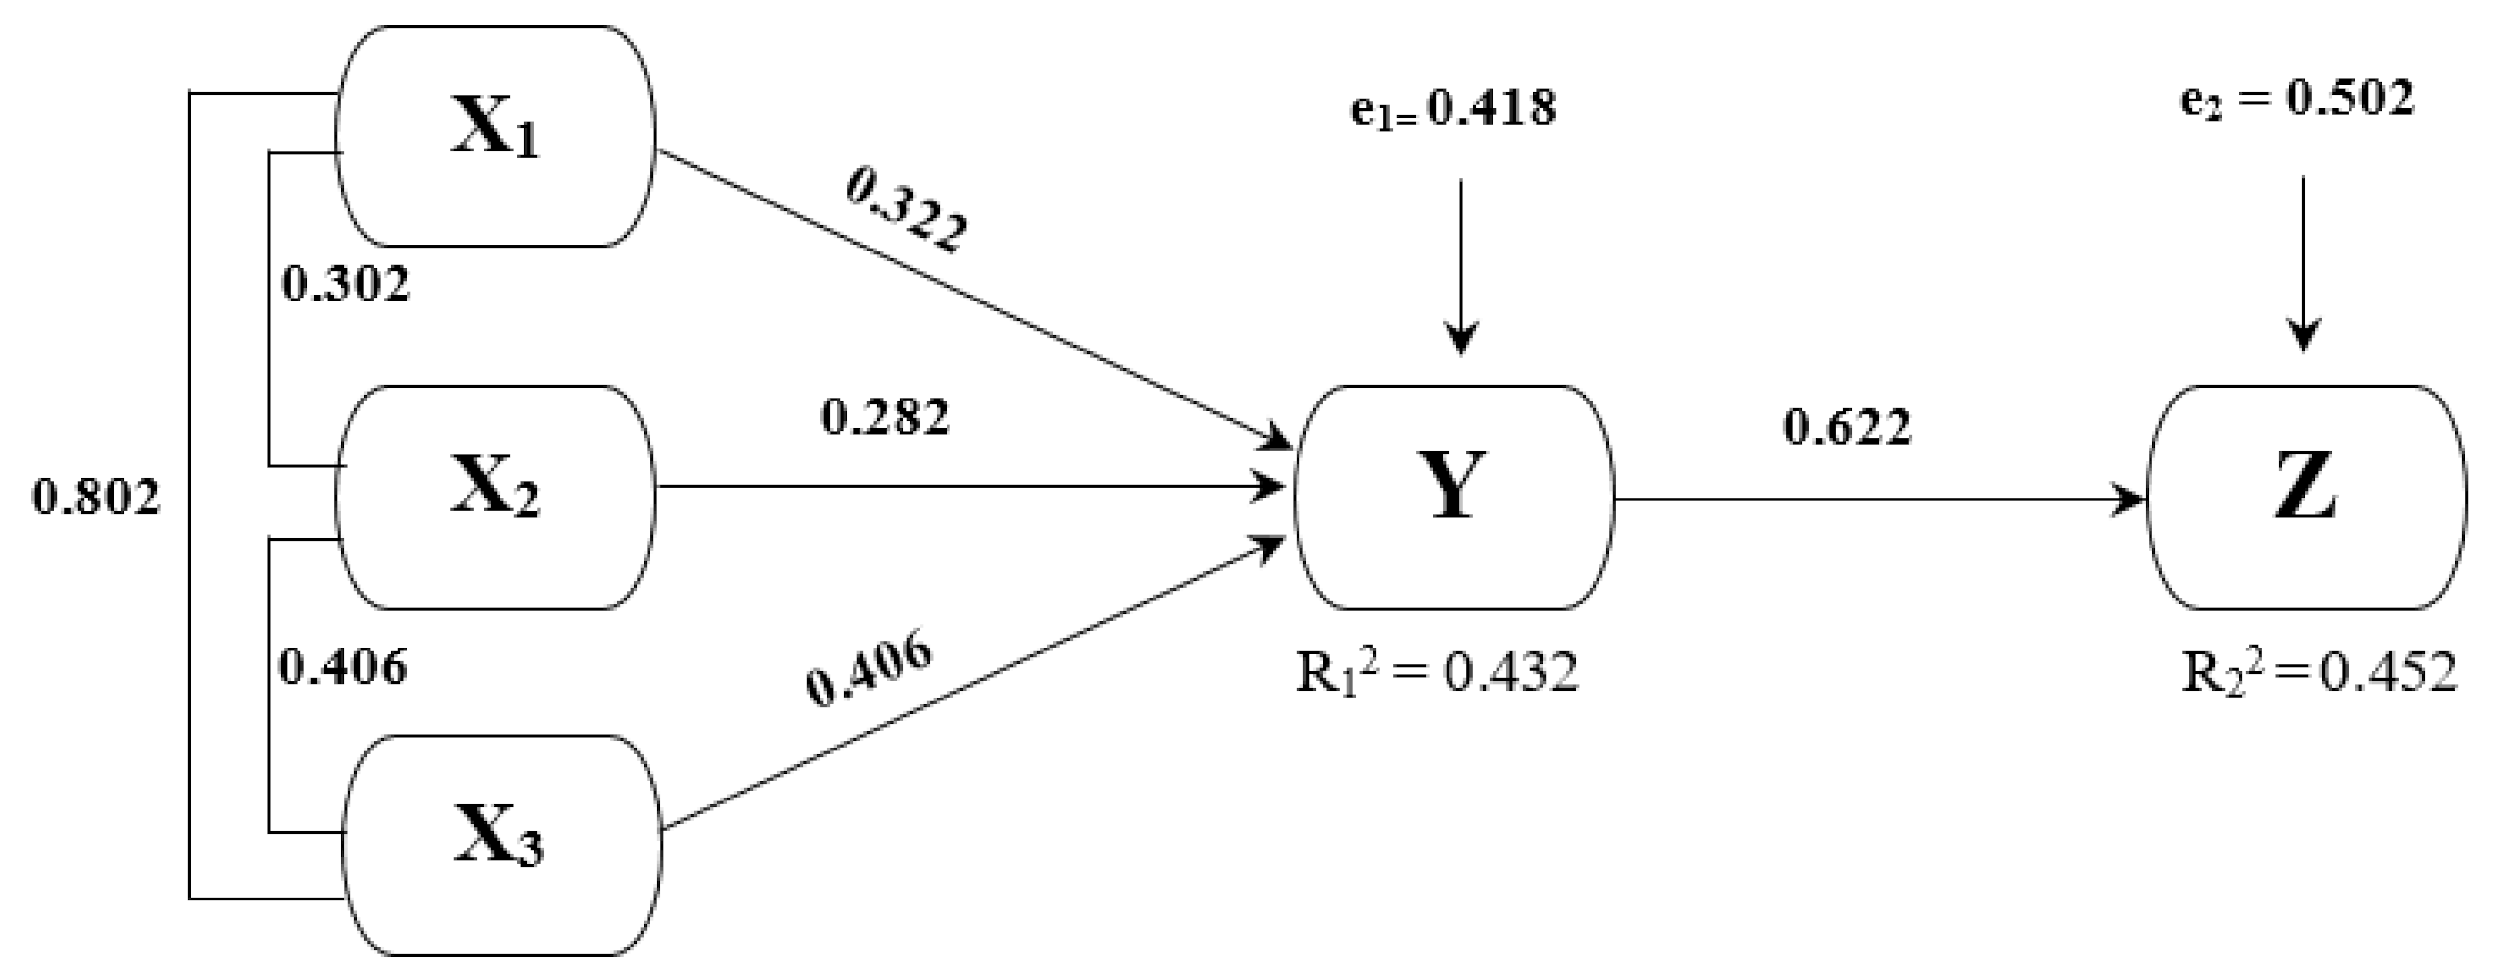
| Housing development, urban activity systems, and land use change together have a positive effect on environmental quality degradation (R) | F count = 74.436 > F table = 2.250 | |||||
| R | R2 | db1 | db2 | F-count | F-table | |
| 0.860 | 0.739 | 3 | 6 | 74.436 | 2.250 | |
Publisher’s Note: MDPI stays neutral with regard to jurisdictional claims in published maps and institutional affiliations. |
© 2020 by the authors. Licensee MDPI, Basel, Switzerland. This article is an open access article distributed under the terms and conditions of the Creative Commons Attribution (CC BY) license (http://creativecommons.org/licenses/by/4.0/).
Share and Cite
Syafri, S.; Surya, B.; Ridwan, R.; Bahri, S.; Rasyidi, E.S.; Sudarman, S. Water Quality Pollution Control and Watershed Management Based on Community Participation in Maros City, South Sulawesi, Indonesia. Sustainability 2020, 12, 10260. https://0-doi-org.brum.beds.ac.uk/10.3390/su122410260
Syafri S, Surya B, Ridwan R, Bahri S, Rasyidi ES, Sudarman S. Water Quality Pollution Control and Watershed Management Based on Community Participation in Maros City, South Sulawesi, Indonesia. Sustainability. 2020; 12(24):10260. https://0-doi-org.brum.beds.ac.uk/10.3390/su122410260
Chicago/Turabian StyleSyafri, Syafri, Batara Surya, Ridwan Ridwan, Syamsul Bahri, Emil Salim Rasyidi, and Sudarman Sudarman. 2020. "Water Quality Pollution Control and Watershed Management Based on Community Participation in Maros City, South Sulawesi, Indonesia" Sustainability 12, no. 24: 10260. https://0-doi-org.brum.beds.ac.uk/10.3390/su122410260